3 011111111#1111JIL
59
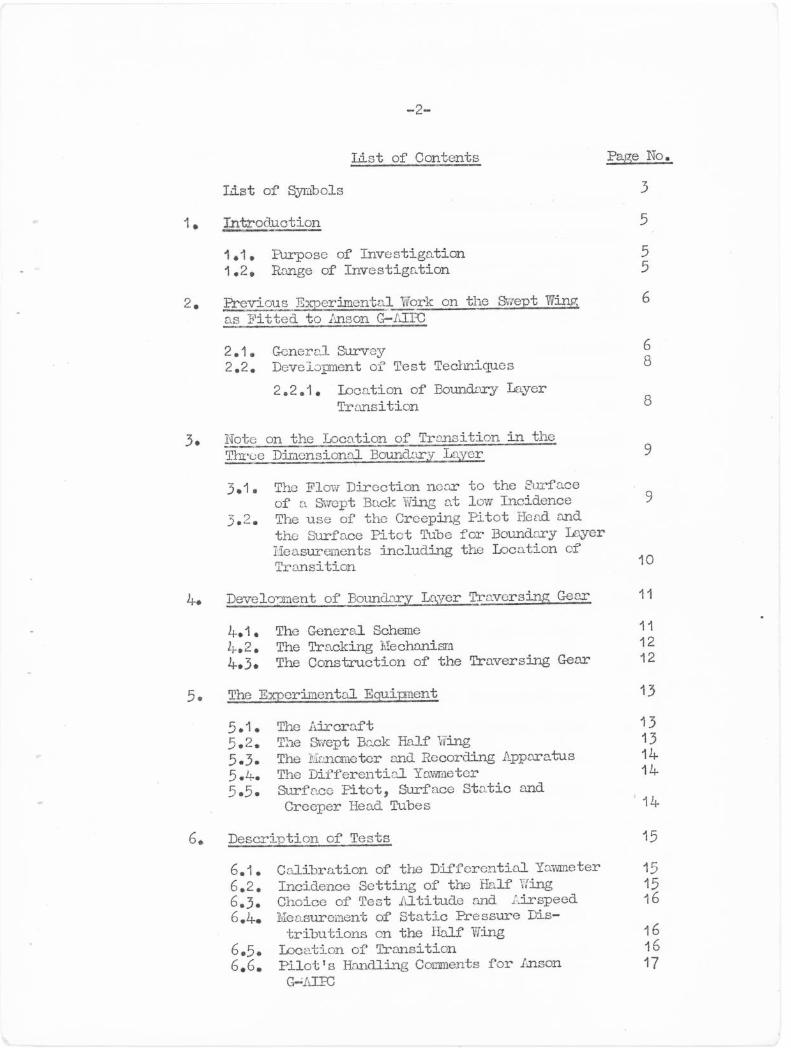
3 1' 1 0 1 1 1 11 111 11#1 11 1 JIL REPORT NO. 104 JULY, 1956. THE COLLEGE OF AERONAUTICS CRANFIELD Flight Experiments on the Boundary Layer Characteristics of a Swept Back 'Wing -by- L.D. Allen, B.Sc., D.C.Ae., and F.N. Burrows, D.C.Ae. SUWARY This work considers the measurement in flight of the boundary layer characteristics of an untapered, untwisted, 45° swept back half wing of thin symmetrical section, mounted vertically on top of the fuselage of an Anson ',ark I aircraft. The primary aim was to study the transition mechan- ism on swept back wings, and an account is presented of the experiments so far performed with this object in view. Attention is also given to the design, development and con- struction of a suitable boundary layer traversing gear. For an incidence range of 0 ° to 10 ° , and Reynolds numbers of 4, 14, 5, 6, 7, and 8 million the static pressure distributions were determined and also the locations of trans- ition for both surfaces using the creeping surface pitot technique. For both upper and lower wing surfaces transition was found to move towards the leading edge with increase of either incidence or Reynolds number. This is in agreement with the results obtained by Butler (ref.4).
Transcript of 3 011111111#1111JIL
31' 101111111111#1111JIL
REPORT NO. 104
JULY, 1956.
THE COLLEGE OF AERONAUTICS
CRANFIELD
Flight Experiments on the Boundary Layer
Characteristics of a Swept Back 'Wing
-by-
L.D. Allen, B.Sc., D.C.Ae.,
and
F.N. Burrows, D.C.Ae.
SUWARY
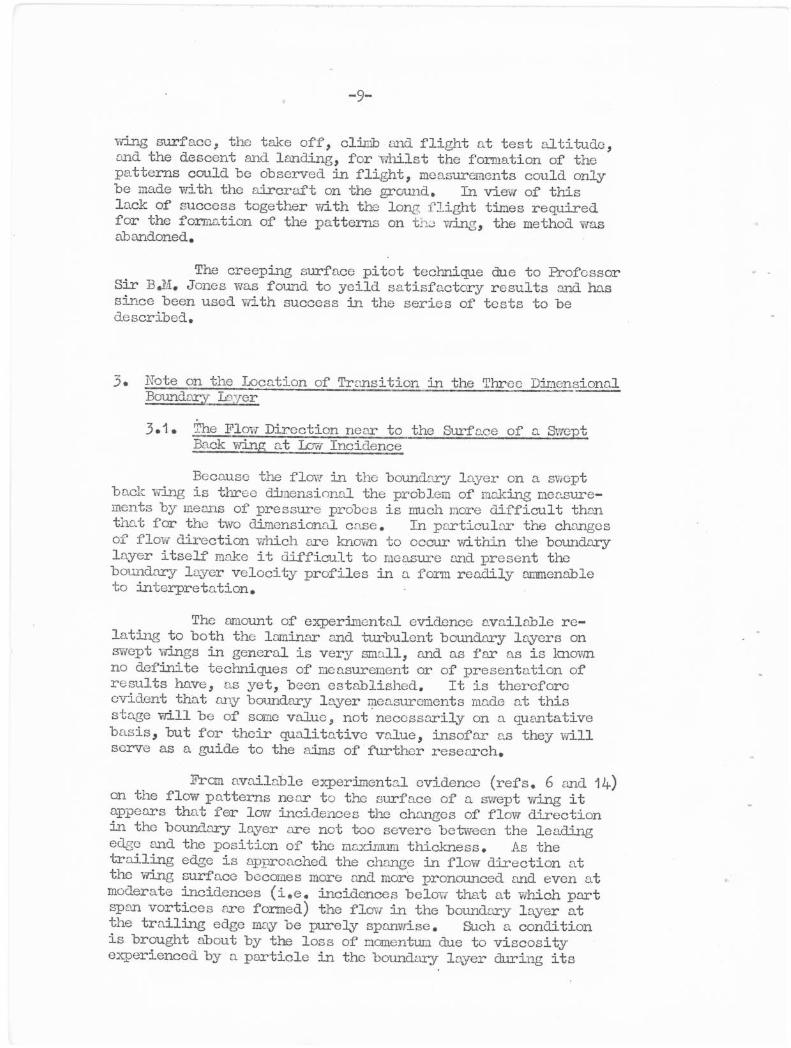
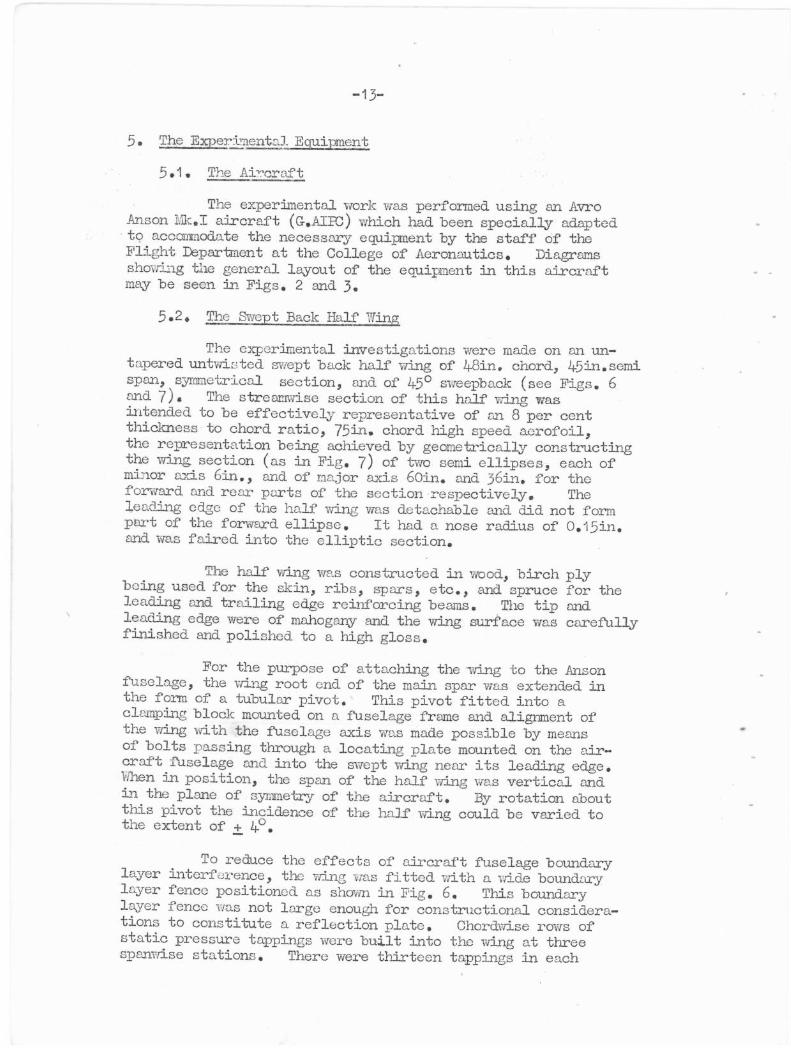
This work considers the measurement in flight of the boundary layer characteristics of an untapered, untwisted, 45° swept back half wing of thin symmetrical section, mounted vertically on top of the fuselage of an Anson ',ark I aircraft.
The primary aim was to study the transition mechan-ism on swept back wings, and an account is presented of the experiments so far performed with this object in view. Attention is also given to the design, development and con-struction of a suitable boundary layer traversing gear.
For an incidence range of 0° to 10°, and Reynolds numbers of 4, 14, 5, 6, 7, and 8 million the static pressure distributions were determined and also the locations of trans-ition for both surfaces using the creeping surface pitot technique.
For both upper and lower wing surfaces transition was found to move towards the leading edge with increase of either incidence or Reynolds number. This is in agreement with the results obtained by Butler (ref.4).
-2-
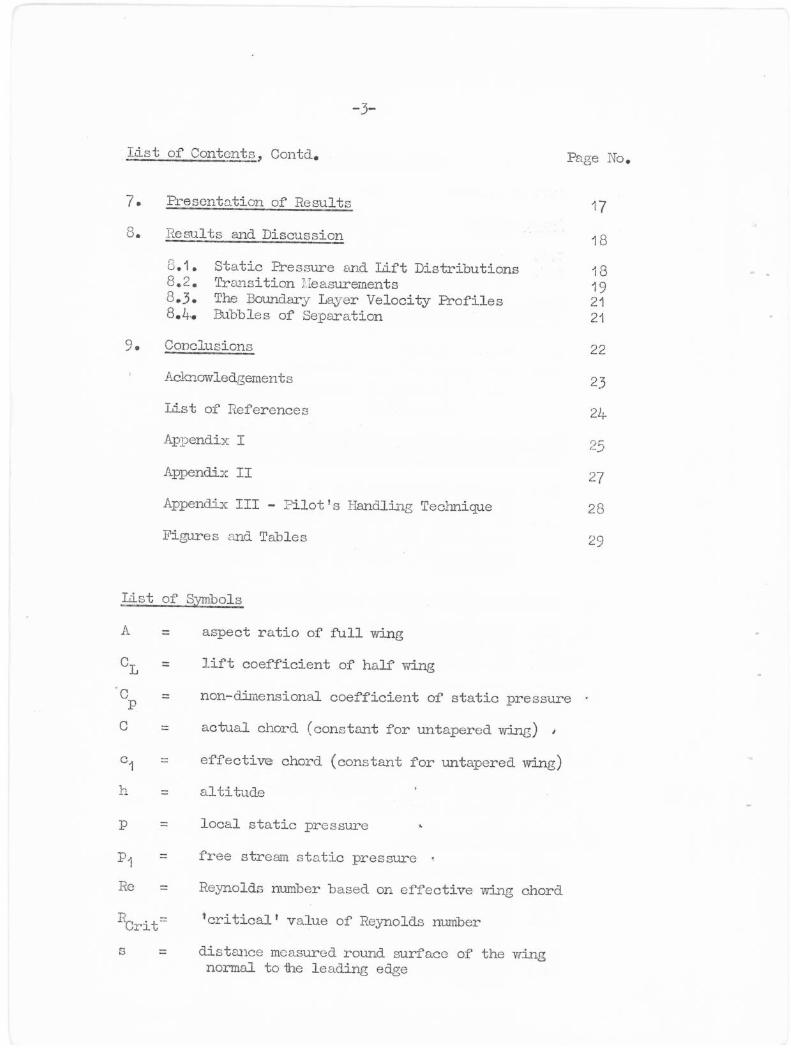
List of Contents
Page No.
List of Symbols
3
1. Introduction
5
1.1. Purpose of Investigation 1.2. Range of Investigation
2. Previous Experimental Work on the Swept Wing as Fitted to Anson G-LIEC
2.1. General Survey 2.2. Development of Test Techniques
2.2.1. Location of Boundary payer Transition
3. Note on the Location of Transition in the Three Dimensional BoundlcryLama 9
3.1. The Flow Direction near to the Surface of a Swept Back Wing at low Incidence 9
3.2. The use of the Creeping Fitot Herd and the Surface Pitot Tube for Boundary Layer lieusurements including the Location cf Transition 10
4. Develonment of Boundary Layer Traversing Gear 11
4.1. The General Scheme 11
4.2. The Tracking Mechanium 12
4.3. The Construction of the Traversing Gear 12
5. The Experimental Equipment 13
5.1. The Aircraft 13 5.2. The Swept Back Half Wing 13 5.3. The hhnameter and Recording Apparatus 14 5.4. The Differential Yawmeter 5.5. Surface Fitots Surface Static and
Creeper Head Tubes 1J
6. Description of Tests 15
6■1. Calibration of the Differential Yawmeter 15 6.2. Incidence Setting of the Half Wing 15 6.3. Choice of Test Altitude and Airspeed 16 6.4. Measurement of Static Pressure Dis-
tributions on the Half Wing 16 6.5. Location of Transition 16 6.6, Pilot's handling Comments for Anson 17
G-AIEC
5 5
6
6 8
8
-3-
List of Contents, Contd. Page NO.
7. Presentation of Results 17
8. Results and Discussion 18
6.1. Static Pressure and Lift Distributions 13 8.2. Transition :bauurements 19 8.3. The Boundary Layer Velocity Profiles 21 8.4.. Bubbles of Separation 21
9. Conclusions 22
Acknowledgements 23
List of References 24
Appendix I
Appendix II 27
Appendix III - Pilot's Handling Technique 28
Figures and Tables 29
List of Symbols
A = aspect ratio of full wing
CL = lift coefficient of half wdng
non-dimensional coefficient of static pressure
actual chord (constant for untapered wing)
cl
effective chord (constant for untapored wing)
altitude
local static pressure
p1 = free stream static pressure
Re = Reynolds number based on effective wing chord
RCrit=
'critical' value of Reynolds number
distance measured round surface of the wing normal to -the leading edge

local stream velocity
free stream velocity
rectified airspeed corrected to free stream conditions
equivalent airspeed
geometric angle of attack of half wing
density
relative air density
p = kinematic viscosity
H = stream total head
= change in total head near to the wing surface with change in boundary layer characteristics
= angle of sweep back
= CPL
")( =
=
boundary layer Reynolds number for secondary (transverse) flow based on transverse flow velocity and boundary layer thickness.
maximum value of )1.
Suffices
upper surface
lower surface
Uo =
U1 =
Vr =
V.I
a =
p =
a =
-5-
1. Introduction
1.1. Purpose of Investigations
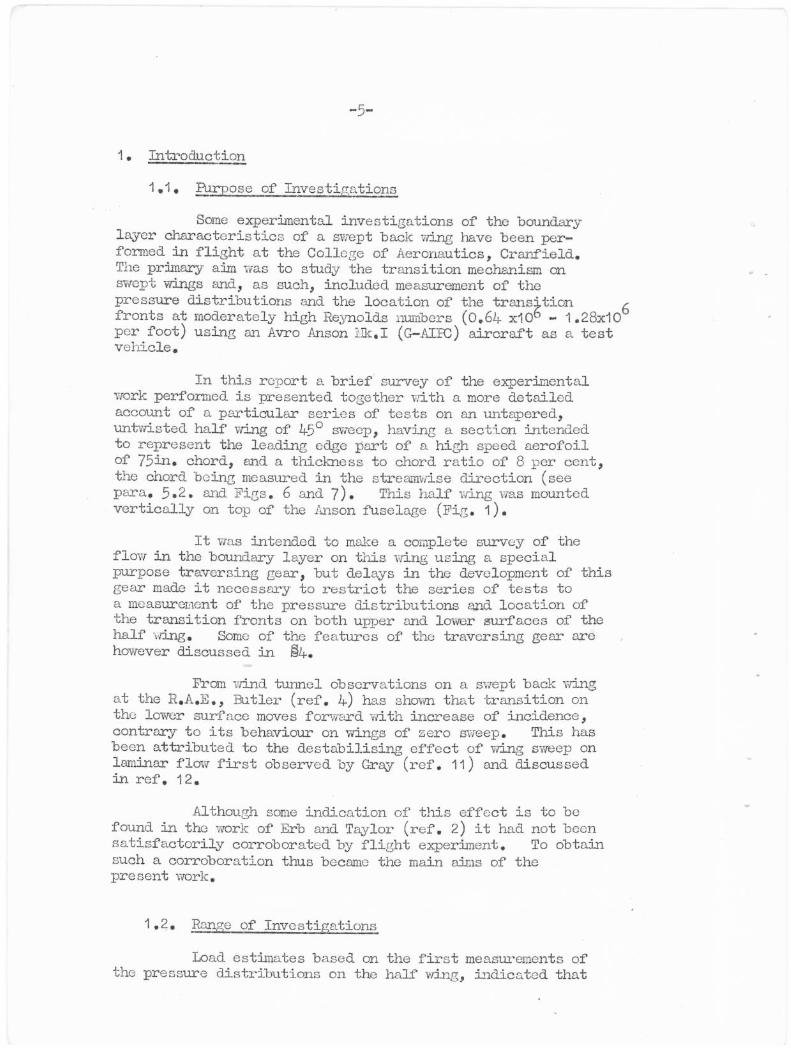
Some experimental investigations of the boundary layer characteristics of a swept back wing have been per-formed in flight at the College of Aeronautics, Cranfield. The primary aim was to study the transition mechanism on swept wings and, as such, included measurement of the pressure distributions and the location of the transition fronts at moderately high Reynolds numbers (0.64- x10 1.28x10⁶
per foot) using an Avro Anson Hk.I (G—AIR) aircraft as a test vehicle.
In this report a brief survey of the experimental work performed is presented together with a more detailed account of a particular series of tests on an untapered, untwisted half wing of 45° sweep, having a section intended to represent the leading edge part of a high speed aerofoil of 75in. chord, and a thickness to chord ratio of 8 per cent, the chord being measured in the streamwise direction (see para. 5.2. and Figs. 6 and 7). This half wing was mounted vertically on top of the Anson fuselage (Fig. 1).
It was intended to make a complete survey of the flow in the boundary layer on this wing using a special purpose traversing gear, but delays in the development of this gear made it necessary to restrict the series of tests to a measurement of the pressure distributions and location of the transition fronts on both upper and lower surfaces of the hrilf wing. Some of the features of the traversing gear are however discussed in §4.
From wind tunnel observations on a swept back wing at the R.A.E., Butler (ref. 4.) has shown that transition on the lower surface moves forward. with increase of incidence, contrary to its behaviour on wings of zero sweep. This has been attributed to the destabilising effect of wing sweep on laminar flow first observed by Gray (ref. 11) and discussed in ref. 12.
Although sane indication of this effect is to be found in the work of Erb and Taylor (ref. 2) it had not been satisfactorily corroborated by flight experiment. To obtain such a corroboration thus became the main aims of the present work.
1.2. Range of Investigations
Load estimates based on the first measurements of the pressure distributions on the half wing, indicated that
-6-
the aircraft could be flown at maxinim forward speed (145m.p.h. I.A.S. at 7000ft) with the half wing at 100 incidence.* Accordingly, the measurements of the pressure distributions and behaviour of boundary layer transition were made for an incidence range of 0 - 10° (upper and lower surfaces) andror a Reynolds number range from 4 x 10⁶ to 8 x 10⁶ (0.64 x 10°
x 106 per foot) based on the 'effective chord of 75in. of the half wing,
2. Previous E erimental Wox k an th .e See t lain as Fitted to Anson G-AIEC
2.1. General Survey
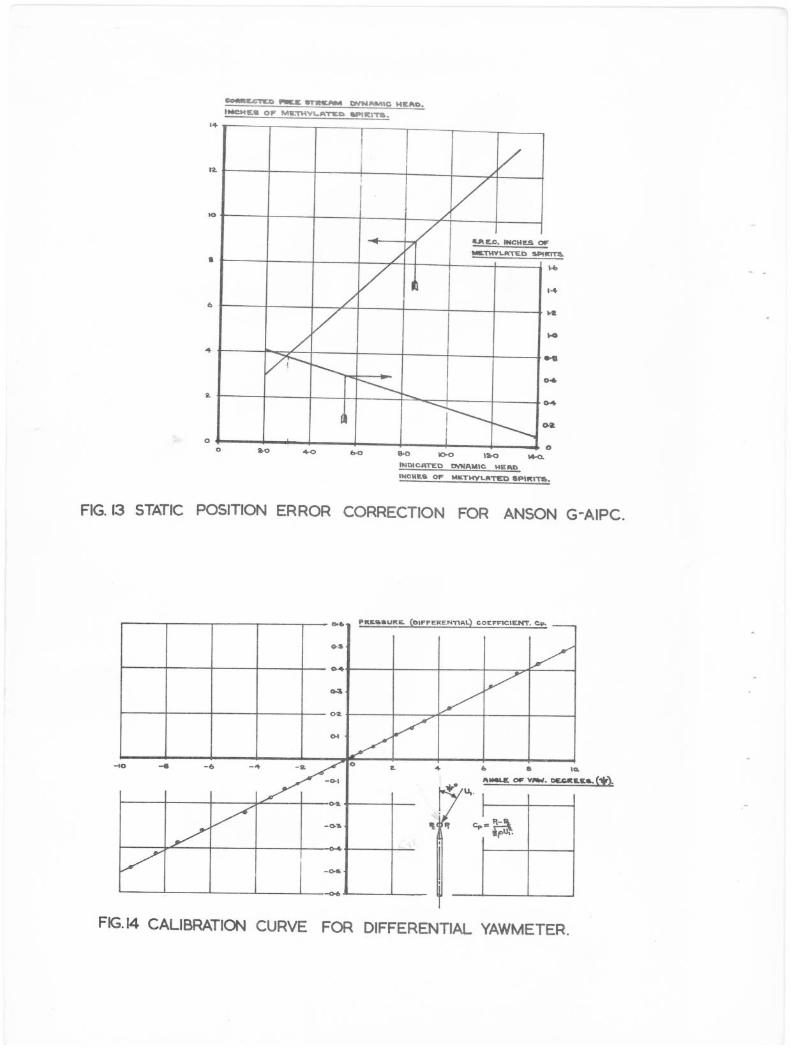
The current programme of measurements in flight on swept back wings was initiated. by Henney and Talbot (ref. 1) and was continued by Erb and Taylor (ref. 2). Preliminary work involved the establishment of a S.P.E.C. curve for the Anson_ using the trailing static technique and an exploration of the static pressure field over the aircraft fuselage in that region to be occupied by the swept back wings.
The S.P.E.C. curve established for the Anson (G-ATE') is shown in Fig. 13. anal' angles of sideslip (± 4°) were found to have no significant effect upon this curve.
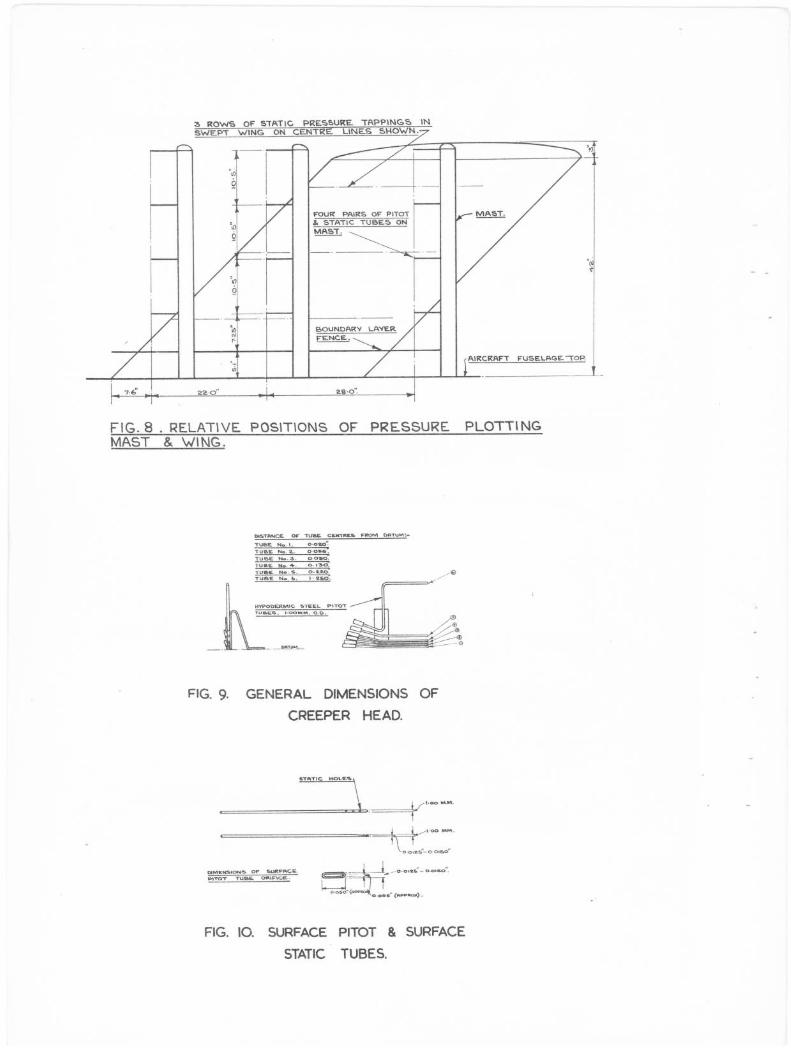
Measurements by Erb and Taylor (ref. 2) of the pressure field above the aircraft fuselage in that region occupied by the swept bank wing were made using a tubular steel pressure plotting mast of stre-imlined section, on which were mounted four pitot and four static tubes in pairs as shown in Fig. 8. It was found that the distribution of total head was constant over the height range covered by the mast (i.e. from approximately 12in. to 44in. above the air-craft fuselage). This uniformity of the flow field with respect to the total head distribution indicates that no energy looses are being incurred in this region and hence the region of investigation is outside the boundary layer on the aircraft and also free from any wakes or separated flows.
lieasuraments of the static pressure distribution over the aircraft fuselage however, showed that the test wing would occupy a region in which a mall adverse pressure gradient, dependent upon the aircraft forward speed, existed.
* Since the wing could only be rotated through 4° relative to the fuselage axis, this required flight in steady sideslip at 6° to obtain the 10° of incidence.
-7-
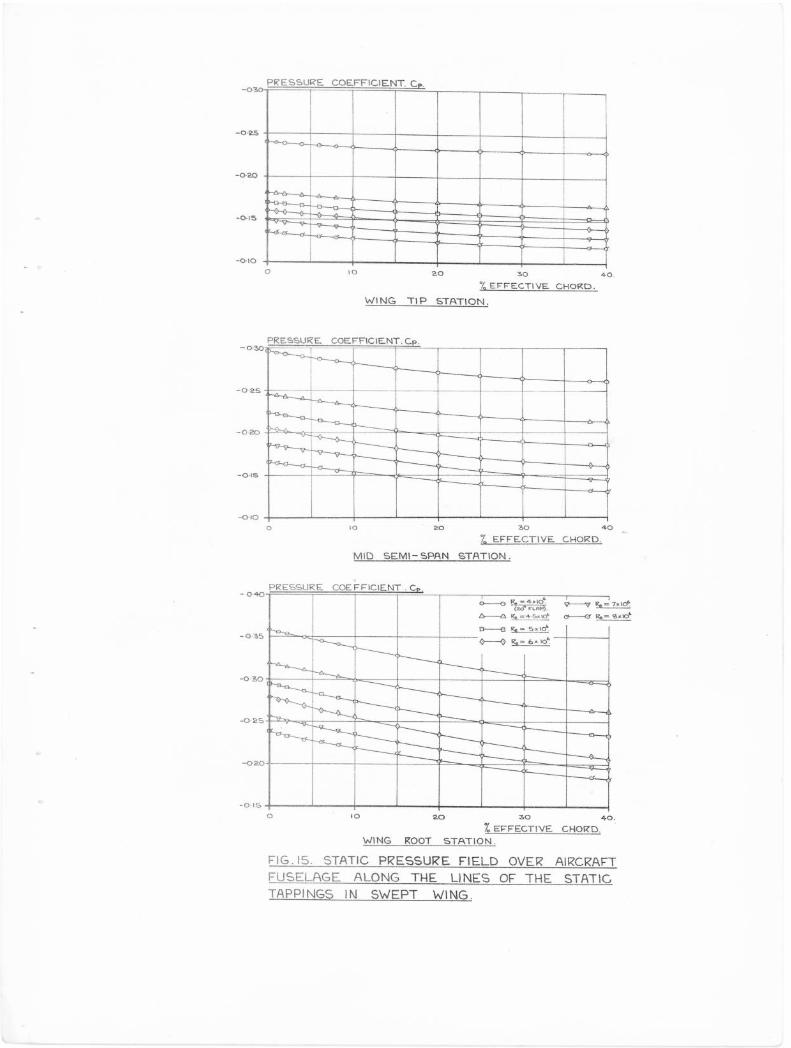
The curves obtained by Erb and Taylor are not shown, but curves are presented in Fig. 15 which show the distribution of static pressure in terms of the positions of the static tappings in the swept wing as fitted to the aircraft at present. Since this field is reasonably uniform and quite small in general, it is in order to assume that it may be linearly separated (i.e. by the principle of superposition) from that due to the presence of a swept back wing model when fitted to the aircraft. This need for separation of flows really only manifests itself in the measurement of the dis-tribution of pressure over the model wing under test, and the field due to the aircraft may be regarded merely as a series of correction factors to apply to the model test results. As regards the boundary layer investigation the situation is different, for in this case the nature of the whole flow field (due to both wing and aircraft) nust be taken into account, Fortunately the pressure gradients due to the aircraft are small enough to be neglected and so the boundary layer on the model ming may be investigated, paying no attention to the flow field over the aircraft.
When the flow field above the aircraft fuselage was explored, no measurements were made to ascertain mhether the directional characteristics of ithe flow were being affected to any significant extent by changing flight configurations of the aircraft (e.g. variations in forward peed). It was assumed that any departures of flow direction from the fuselage axis would be small irrespective of changes occurring in aircraft incidence so that the angle of sweep of the model wing remained sensibly constant at 450.
We may however note that the measurement of the flow directional characteristics over the fuselage of an aircraft does not present any serious difficulty when a pressure plotting mast of the type used here is available since yaw-meters may be fitted to the mast in place of, or together with the pitot and static tubes. These yavaneters may be arranged to determine the flow directions in the pitching end yawing planes as required. For an account of the tech nieues involved the reader is referred to ref. 9 which considers in some detail the characteristics of the flow field over the mid upper fuselage of an Avro Lancaster (P.A.474) on which aircraft a large scale model swept back half wing is being mounted for the purpose of extending the present series of investigations of the three dimensional boupdary layer to high Reynolds numbers (i.e. up to Re = 22 x 10° or 2.03 x 10⁶ per foot).
Further work by Bonney and Talbot and by Erb and Taylor included measurements of the pressure distributions and location of the transition fronts for small ranges of e incidence and for Reynolds numbers of from 5 x 10⁶ to 8 x 10°.
-8-
Transition measurements showed the usual forward movement of transition with incidence on the wing upper surface, and also gave an indication of a forward movement of transition with increase of incidence on the lower surface. This latter was contrary to that which was expected at the time and was attributed to an apparent deterioration of the wing surface. Some profile drag measurements were also attempted using the wake traverse method, a 'rake' of pitot and static tubes being positioned downstream of the mid semi span of the half wing. No results were quoted but the method is to be tried more extensively in future experiments.
2.2. Development of Test Techniques
During these experiments, attention was given to the development of suitable techniques for making the required measurements, in particular with regard to b-undary layer transition. With regard to the location of transition, several methods were tried and these are briefly discussed as follows.
2.2.1. Location of Boundary Layer Transition
Three methods of locating transition fronts have been considered=
(i) Boundary layer noise.
(ii) Chemical sublimation.
(iii) Surface pitot technique.
(i) The noise technique for determining the region of transition to turbulence in the boundary layer has been used with success (for example ref. 4) in wind tunnel experiments where the external noise level is in general small compared with that which exists in flight. It appeared, however, to be essential that some form of meter presentation would be necessary to offset the effects of a fairly high noise level in the aircraft cabin if satisfactory measurements were to be made in flight. Attempts to present the boundary layer noise via an amplifying unit on to either a Cathode Ray tube or a galvanometer failed, and whilst this was without doubt due to the lack of suitable equipment, the method was not tried in flight.
(ii) The second method was initially tried using a mixture of 5 per cent acenapthene in petroleum ether. Other chemicals were also tried but the method was found to be rather uncertain and an accurate interpretation of the patterns formed, difficult. Lack of success with this sub-limation technique may be attributed to the time delay occurring between the application of the chemicals to the
-9-
wing surface, the take off, climb and flight at test altitude, and the descent and landing, for 'whilstthe formation of the patterns could be observed in flight, measurements could only be made with the aircraft on the ground. In view of this lack of success together with the long flight times required for the formation of the patterns on th...1 wing, the method was abandoned.
The creeping surface pitot technique due to Professor Sir B.M. Jones was found to yeild satisfactory results and has since bemused with success in the series of tests to be described.
3, Note on the Location of Transition in the Three Dimensional Boundary Lover
3.1. The Flaw Direction near to the Surface of a Swept Back wing at Law Incidence
Because the flaw in the boundary layer on a swept back wing is three dimensional the problem of making measure-ments by means of pressure probes is much more difficult than that for the two dimensional case. In particular the changes of flow direction which are known to occur within the boundary layer itself make it difficult to measure and present the boundary layer velocity profiles in a form readily amenable to interpretation.
The amount of experimental evidence available re-lating to both the laminar and turbulent boundary layers on swept wings in general is very small, and as far as is known no definite techniques of measurement or of presentation of results have, as yet, been established. It is therefore evident that any boundary layer measurements made at this stage will be of some value, not necessarily on a quantative basis, but for their qualitative value, insofar as they will serve as a guide to the aims of further research.
From available experimental evidence (refs. 6 and 14) on the flow patterns near to the surface of a swept wing it appears that fer low incidences the changes of flow direction in the boundary layer are not too severe between the leading edge and the position of the maximum thickness. As the trailing edge is approached the change in flow direction at the wing surface becomes more and more pronounced and even at moderate incidences (i.e. incidences below that at which part span vortices are formed) the flow in the boundary layer at the trailing edge may be purely spanwise. Such a condition is brought about by the loss of momentum due to viscosity experienced by a particle in the boundary layer during its
-10-
passage over the wing surface and its associated tendency to flow along a path offering a less adverse pressure gradient.
0 It does therefore appear that at small incidences (a = 0 - 10° say) boundary layer measurements may be performed in the usual way on a swept wing provided that they are restricted to a region which is not too close to the leading edge (where the initial curvature of the streamlines just out-side the boundary layer is large) and which does not extend downstream of the position of maximum thickness.
3.2. The Use of the Creeping Pitot Head and the Surface Fitot TOe for Boundary Layer 1Lasurements including the Location of Transition
Provided that measurements are to be restricted to a region as defined above, the creeping pitot head and the surface pitot tube may be used in a study of the boundary layer on a swept wing, traverses along the chord in a direction parallel to the free stream being made in a similar manner to those for an unswept ming (ref. 15).
Although the information obtained from such traverses will be of a qualitative rather than quantativc nature, much can however be learned in this way of the behaviour of the boundary layer. For example the growth of the boundary layer thickness can be measured very simply, and transition to turbulence indicated by the changing characteristics of the stroamwise velocity profile.
The use of the surface pitot tube for the location of the transition fronts is also permissible, the transition front being indicated by a reduction in total head as the tribe enters the laminar boundary layer in its traverse along the wing chord towards the leading edge.
The destabilising effect of wing sweep on laminar flow causing as it does a fairly rapid movement of the trans-ition front with increase of Reynolds number from initial values below the critical (R. crit) to values above, together with similar movements of the front with increase of incidence over a fairly small range (a = 0° - 10° say) permits an investigation of the behaviour of the transition fronts to be made using the surface pitot technique without encountering unfavourable effects duo to changes of flow direction in the boundary layer. Although the reading given by a very small pitot tube on the surface of a swept wing may experience a variation, due to changes in flow direction at the wing surface, with its movement along the wing chord, this variation will be reasonably continuous and by no means as well defined
as that due to changes in the characteristics of the flow as is found in the laminar and turbulent boundary layers. It is however obvious that the most reliable measurements can be made when the flow characteristics approximate to the two dimensional case, that is as the incidence tends to zero (a-400), and the measurements are restricted to regions in which the flow directional changes are not severe.
We are therefore in a position to make useful qualitative observations on the behaviour of the three dimensional boundary layer on a swept wing by means of tech-niques which are well established in their application to the two dimensional boundary layer and which may be readily applied in flight.
4.. Development of Boundary Layer Traversing Gear
4.1. The General Scheme
For an accurate and complete boundary layer investi-gation it is desirable to measure the flow velocity and direction through the boundary layer at all positions on the wing surface. For this a device is required that will permit an exploring pressure head to be traversed in a direction normal to the wing surface, to be yawed to line up with the flow direction, and which in addition has freedom of travel in the chordwise and spa wise sense. As no boundary layer traversing gear satisfying these requirements was available for use in flight it was decided to attempt the development of a suitable test rig. The scheme evolved was briefly as follows:
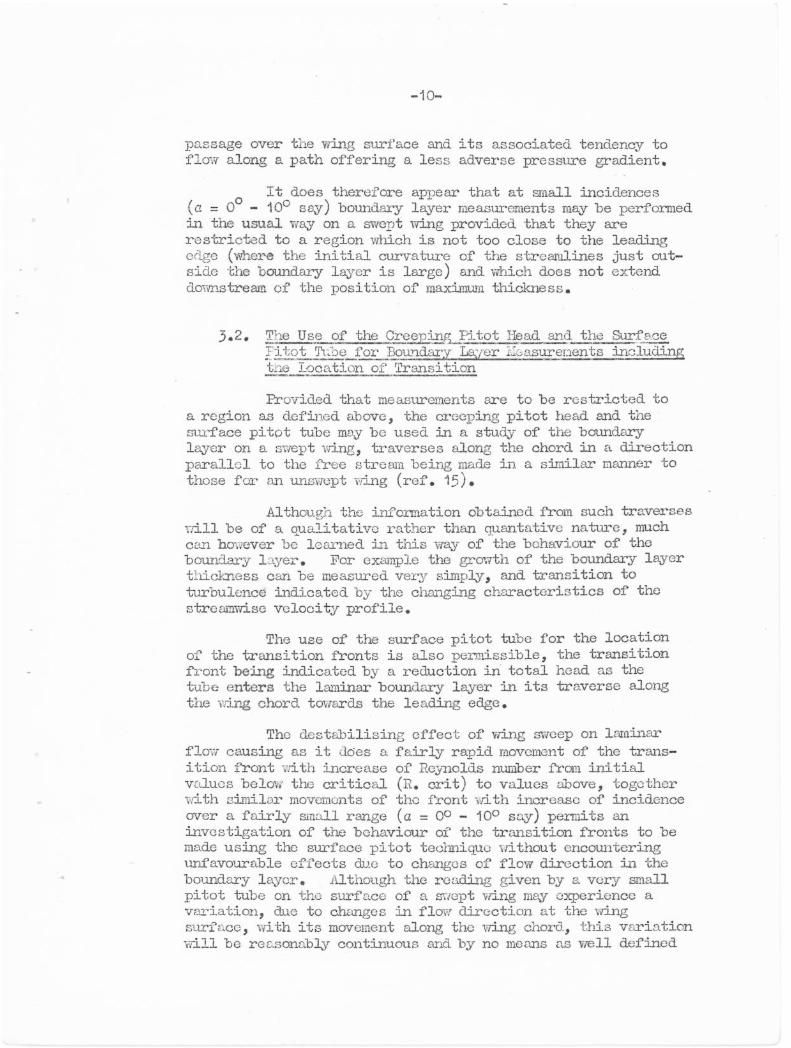
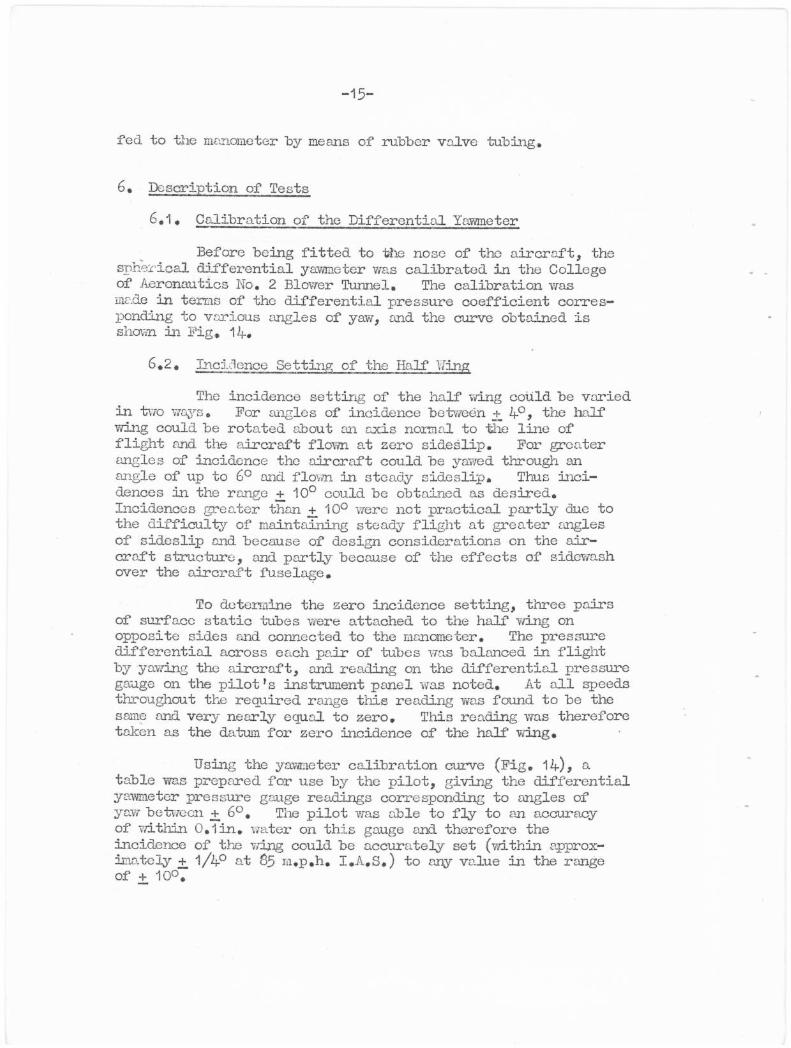
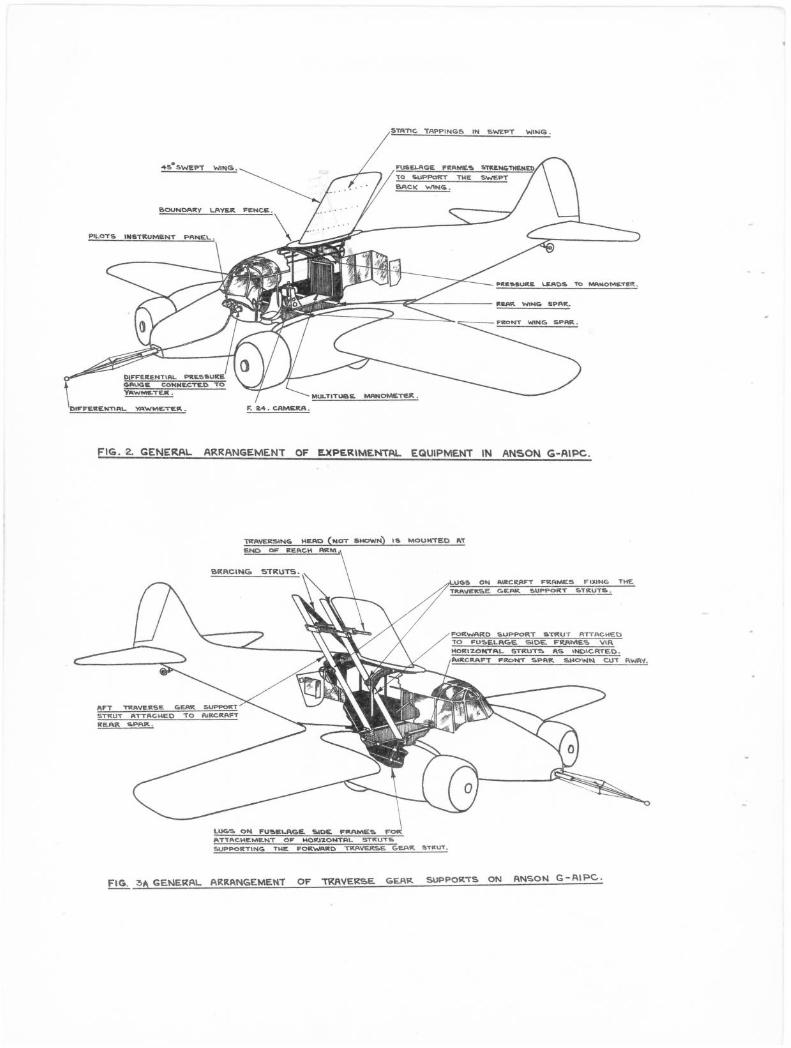
A supporting structure was designed to be built into the fuselage of the aircraft in the manner indicated in Fig. 3a. This consisted basically of two steel tubes of streamlined section attached to the aircraft fuselage on the starboard side to form a carriageway for the traversing gear. These tubes were parallel to each other and inclined at 450 to the fuselage axis, passing upwards through the roof of the aircraft and extending as far as the tip of the half wing. The forward tube was positioned almost in line with the trailing edge and approximately 15in. from the centre line of the swept wing, whilst the rear tube was at a distance of approximately 43in. aft of this. Bracing members were attached to the tips of the above two struts and to the aircraft fuselage as indicated in Fig. 3a.
A suitable carriage, mounting the traversing gear, was designed so that it could be moved up and down the
-12-
supporting structure and fixed at any desired spanuise position of the swept wing, by means of clamping bolts. The actual traversing head is not shown in Fig. 3a but its mechanism was designed along similar lines to one which has been in use for some time at the N.P.L. (ref. 13). Provision was made for this head to possess all the required degrees of freedom over the region of interest an the swept wing, control being accomplished through flexible drives leading into the aircraft fuselage.
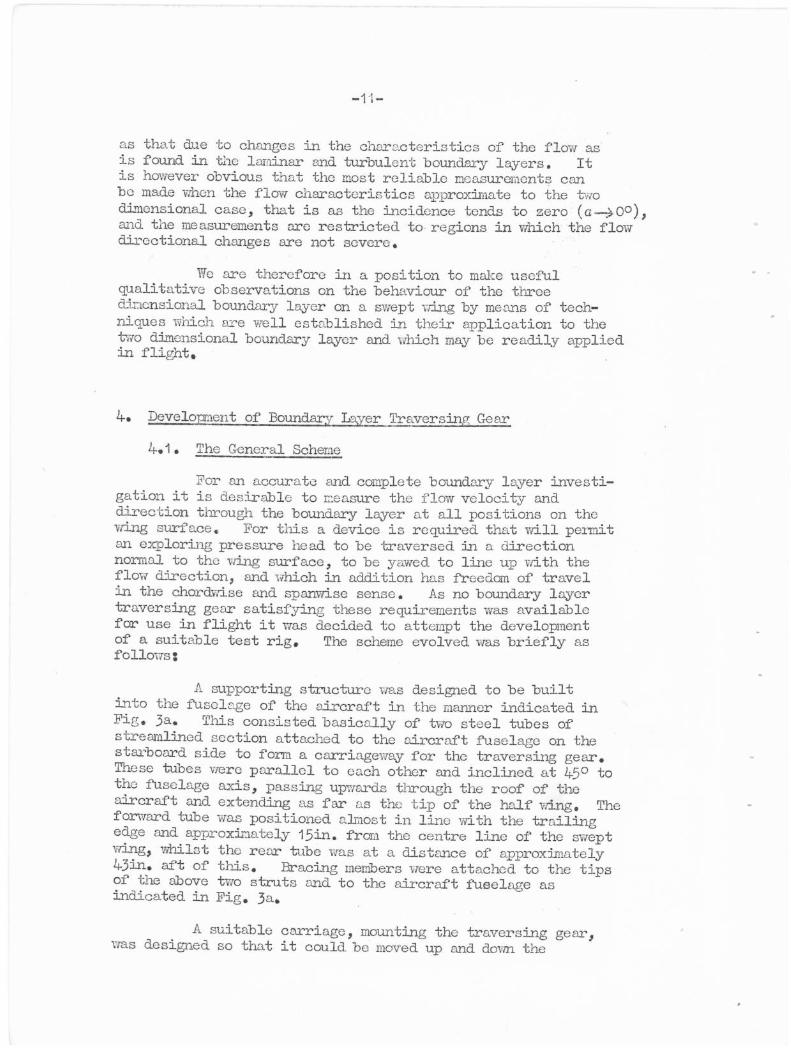
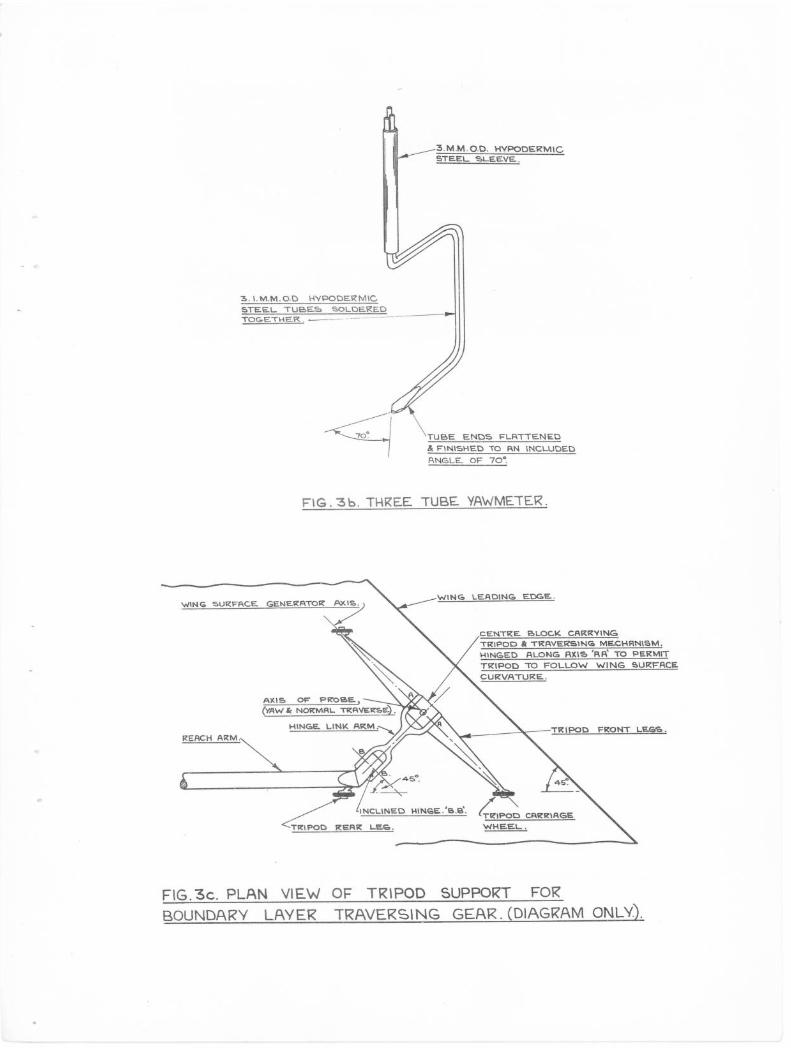
The traversing head was fitted with a three tube yawnieter of the Conrad type as shown in Fig. 3b.
482. . The Tracking Eechaniem
As stated above, the traversing head was designed so that it could be moved to any position on the wing surface. This was so, to the exclusion of regions close to the leading edge (i.e. x/ci --' 5 per cent) and regions aft of the maximum thickness of the swept zing. The mechanism devised for permitting the head to track over the wing surface and to retain the characteristics required for traversing the boundary layer is described briefly as follows.
The actual traversing head was mounted on a slender tripod support and connected to the reach arm (fig. 3a) through an inclined hinge as indicated in Fig. 3c. Since the swept wing =tinted on the aircraft was untapered and untwisted then the front two legs of the tripod will be on the same wing surface generator for any chosen position, and moreover, provided the wing surface curvature is small, traverse through the boundary layer can be made with a probe whose axes of yaw and vertical movement coincide with this generating line, satisfying the conditions specified in 4.1.
4.3. The Construction of the Traversing Gear
The construction of the traversing gear has been performed in the Flight Laboratory Workshops at the College of Aeronautics under the Mrection of -dr. Martin. Unfortunately due to the many design complications, this constructional work was not completed in time for the present series of tests. A current series of experiments using the traversing gear in a slightly modified form have however yielded most promising results to date.
-13-
5. The Experimental Equipment
5.1. The Ai-craft
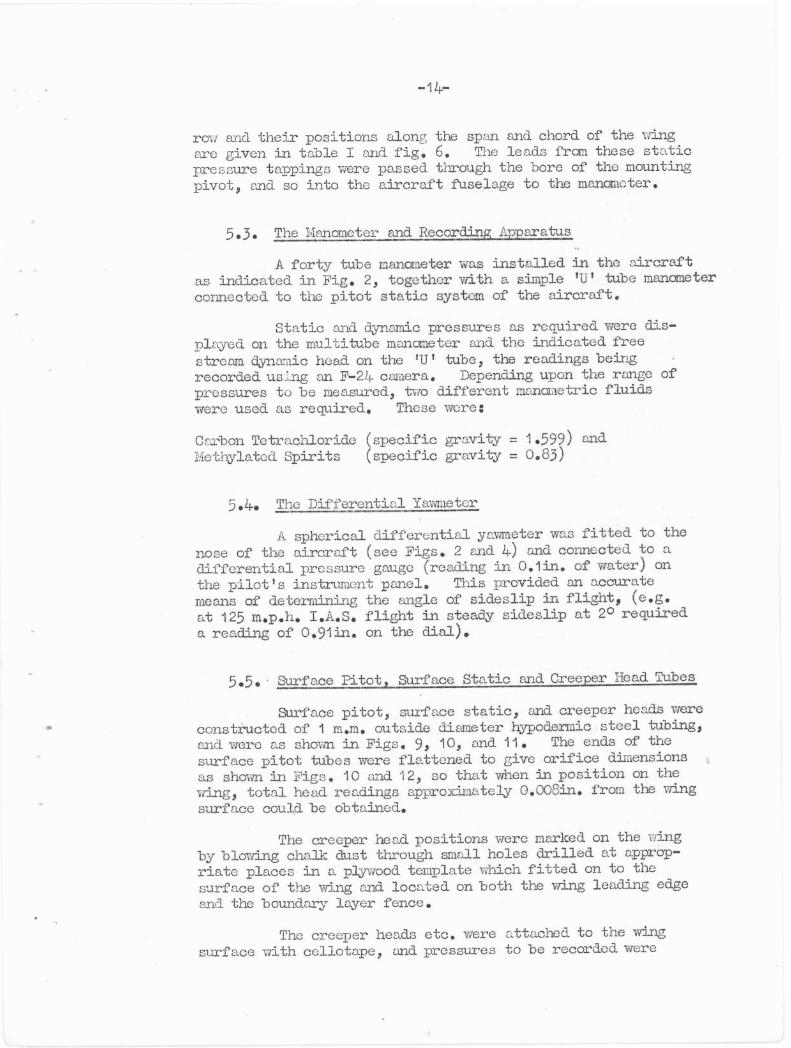
The experimental work was performed. using an Avro Anson hk.I aircraft (G.AIIC) which had been specially adapted to accannodate the necessary equipment by the staff of the Flight Department at the College of Aeronautics. Diagrams showing the general layout of the equipment in this aircraft may be seen in Figs. 2 and 3.
5.2. The Swept Back Half' Wing
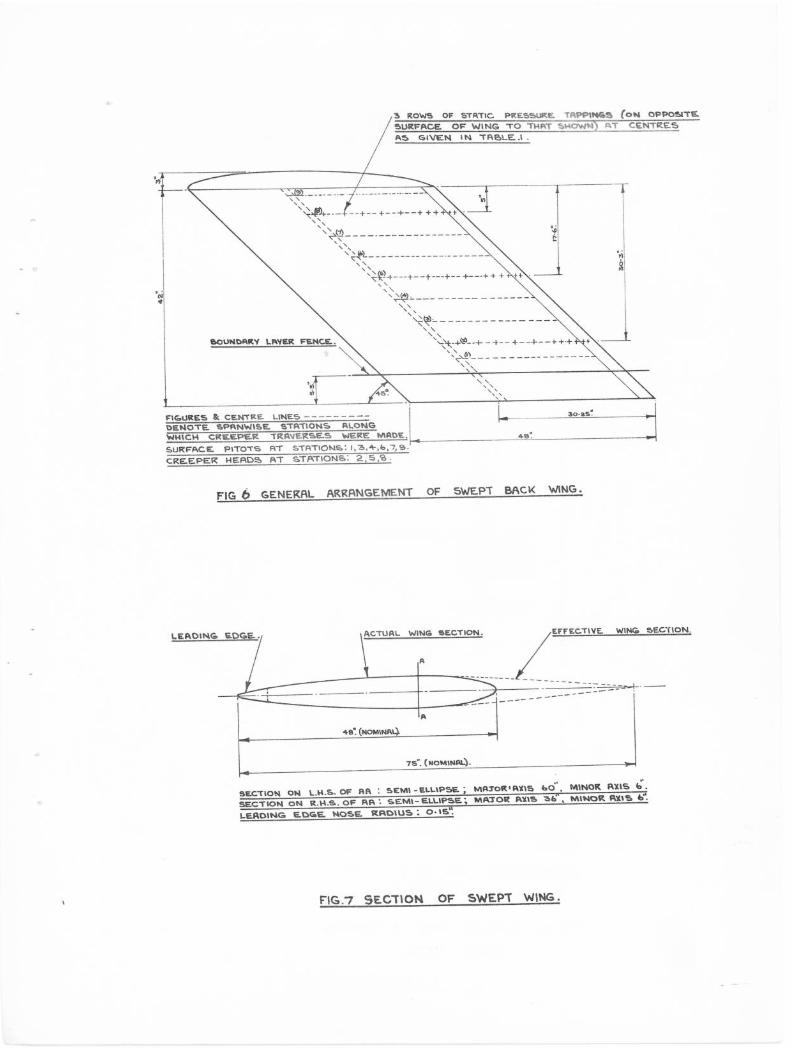
The experimental investigations were made on an un-tapered untwisted swept back half wing of 48in. chord, 45in.semi span, symmetrical section, and of 45° sweepback (see Figs. 6 and 7). The streamwise section of this half wing was intended to be effectively representative of an 8 per cent thickness to chord ratio, 75in. chord high speed aerofoil, the representation being achieved by geometrically constructing the wing section (as in Fig. 7) of two semi ellipses, each of minor axis 6in., and of major axis 60in. and 36in. for the forward and rear parts of the section respectively. The leading edge of the half wing was detachable and did not form part of the forward ellipse. It had a nose rnaius of 0.15in. and was faired into the elliptic section.
The half wing was constructed in wood, birch ply being used for the skin, ribs, spars, etc., and spruce for the leading and trailing edge reinforcing beams. The tip and leading edge were of mahogany and the wing surface was carefully finished and polished to a high gloss.
For the purpose of attaching the -wing to the Anson fuselage, the wing root end of the main spar was extended in the form of a tubular pivot. This pivot fitted into a clamping block mounted on a fuselage frame and alignment of the wing with the fuselage axis was made possible by means of bolts passing through a locating plate mounted on the air-craft fuselage and into the swept wing near its leaning edge. laien in position, the span of the half wing was vertical and in the plane of symmetry of the aircraft. By rotation about this pivot the incidence of the half wing could be varied to the extent of + 4°.
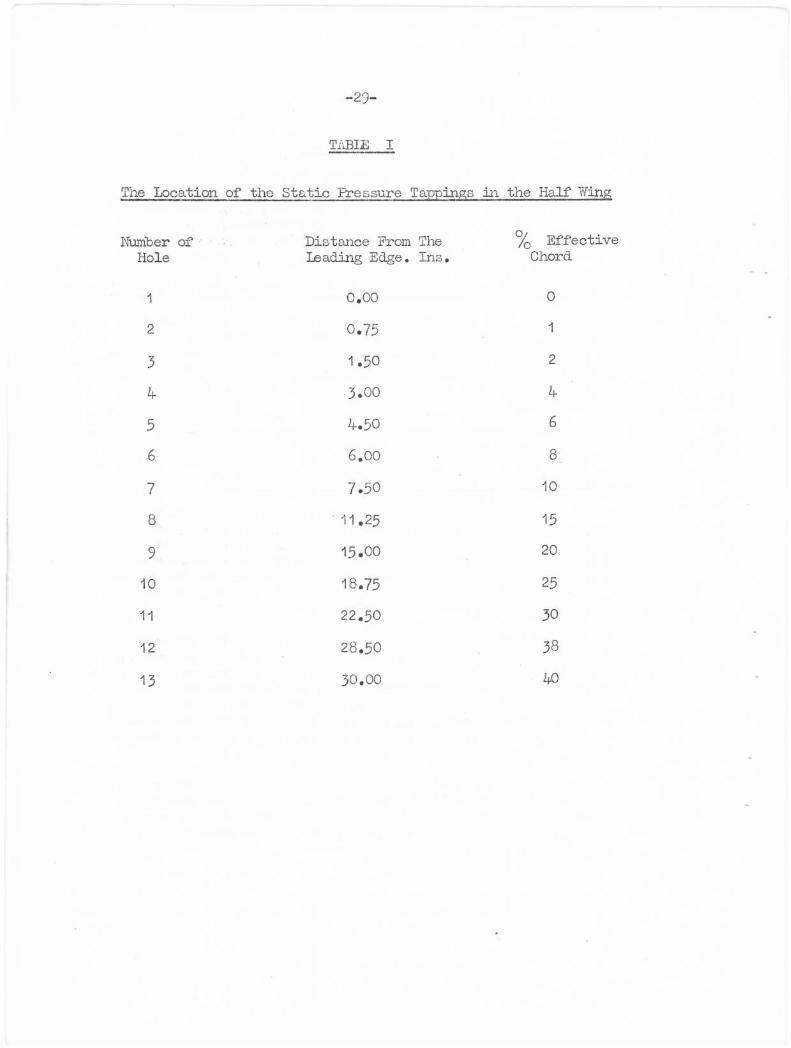
To reduce the effects of aircraft fuselage boundary layer interference, the wing was fitted with a wide boundary layer fence positioned as shown in Pig. 6. This boundary layer fence was not large enough for constructional considera-tions to constitute a reflection plate. Chorcbvise rows of static pressure tappings were built into the wing at three spenwise stations. There were thirteen tappings in each
-14-
row and their positions along the span and chord of the wing are given in table I and fig. 6. The leads fran these static pressure tappings were passed through the bore of the mounting pivot, and so into the aircraft fuselage to the manometer.
5.3. The Manometer and Recording Apparatus
A forty tube manometer was installed in the aircraft as indicated in Fig. 2, together with a simple 'U' tube manometer connected to the pitot static system of the aircraft.
Static and dynamic pressures as required were dis-played on the multitube manometer and the indicated free stream dynamic head on the 'UT tube, the readings being recorded using an F-24. camera. Depending upon the range of pressures to be measured, two different manometric fluids were used as required. These were:
Carbon Tetrachloride (specific gravity = 1.599) and Methylated Spirits (specific gravity = 0.83)
5.4. The Differential Yawmeter
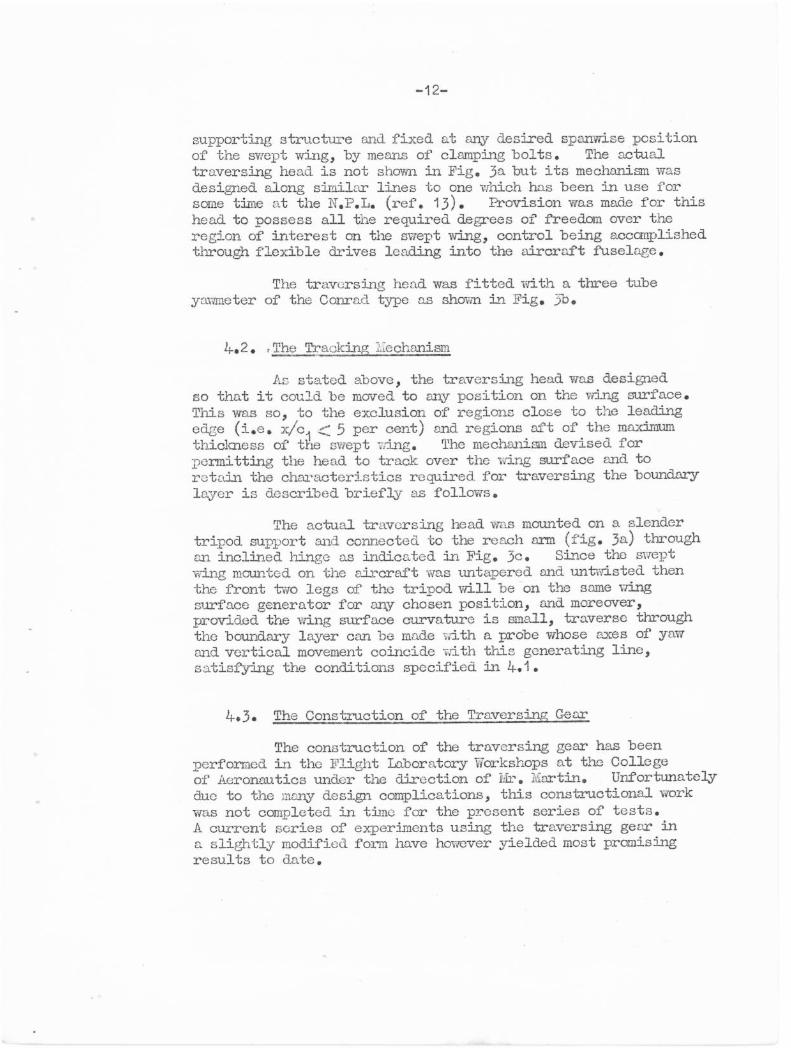
A spherical differential yawmeter was fitted to the nose of the aircraft (see Figs. 2 and 4) and connected to a differential pressure gauge (reading in 0.1in. of water) on the pilot's instrument panel. This provided an accurate means of determining the angle of sideslip in flight, (e.g. at 125 m.p.h. I.A.S. flight in steady sideslip at 20 required a reading of 0.91in. on the dial).
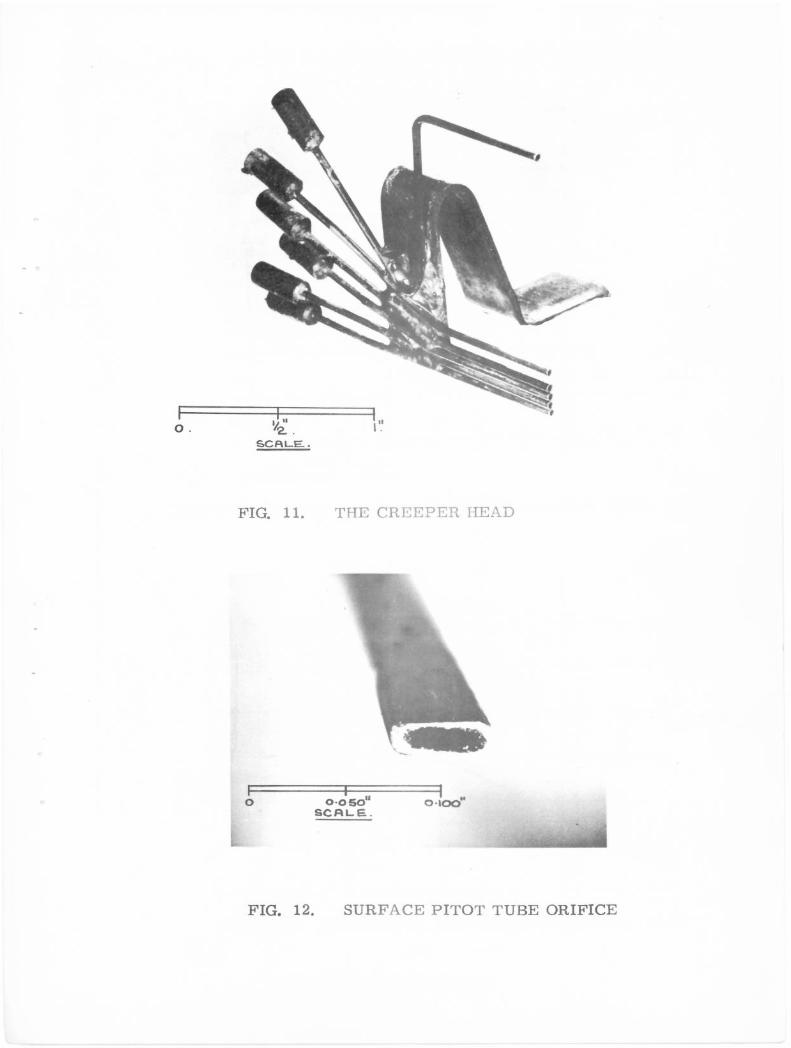
5.5. Surface Pitot, Surface Static and Creeper Head Tubes
Surface pitot, surface static, and creeper heads were constructed of 1 m.m. outside diameter hypodermic steel tubing, and were as shown in Figs. 9, 10, and 11. The ends of the surface pitot tubes were flattened to give orifice dimensions as shown in Figs. 10 and 12, so that when in position on the wing, total head readings approximately 0.008in. from the wing surface could be obtained.
The creeper head positions were marked on the wing by blowing chalk dust through small holes drilled at approp-riate places in a plywood template which fitted on to the surface of the wing and located on both the wing leading edge and the boundary layer fence.
The creeper heads etc. were attached to the wing surface with cellotape, and pressures to be recorded were
-15-
fed to the manometer by means of rubber valve tubing.
6. Description of Tests
6.1. Calibration of the Differential Yammeter
Before being fitted to the nose of the aircraft, the anheical differential yawmeter was calibrated in the College of Aeronautics No. 2 Blower Tunnel. The calibration was made in terms of the differential pressure coefficient corres-ponding to various angles of yaw, and the curve obtained is shown in Fig. 11+.
6.2. Incidence Setting of the Half Wing
The incidence setting of the half wing could be varied in two ways. For angles of incidence betwedn + 4°, the half wing could be rotated about an axis normal to the line of flight and the aircraft flown at zero sideSlip. For greater angles of incidence the aircraft could be yawed through an angle of up to 6° and flown in steady sideslip. Thus inci-dences in the range + 100 could be obtained as desired. Incidences greater than + 10° were not practical partly due to the difficulty of maintaining steady flight at greater angles of sideslip and because of design considerations on the craft structure, and partly because of the effects of sidewash over the aircraft fuselage.
To determine the zero incidence setting, three pairs of surface static tubes were attached to the half wing on opposite sides and connected to the manometer. The pressure differential across each pair of tubes was balanced in flight by yawing the aircraft, and reading on the differential pressure gauge on the pilot's instrument panel was noted. At all speeds throughout the required range this reading was found to be the same and very nearly equal to zero. This reading was therefore taken as the datum for zero incidence of the half wing.
Using the yawmeter calibration curve (Fig. 14), a table was prepared for use by the pilot, giving the differential yawmeter pressure gauge readings corresponding to angles of yaw between + 6°. The pilot was able to fly to an accuracy of within 0.1in. water on this gauge and therefore the incidence of the wing could be accurately set (within approx-imately 4. 1AP at 85 m.p.h. I.A.S.) to any value in the range of 100.
-16-
6.3. Choice of Test Altitude and Airspeeds
Since smooth atmospheric conditions can generally be expected at heights greater than approximately 5000ft. it was decided that a suitable test pressure altitude (I.C.A.N.) was 7000ft. Provision was also made for testing at either 5000ft. or 9000ft. if weather conditions were unsuitable at 7000ft. It was however found possible to perform all tests at the same height (i.e. 7000ft.)
It was decided to make the investigations at Reynolds numbers (based on the 'effective wing chord') of 4, 4.5, 5, 6, 7 and 8 x 10⁶ and for the Anson G-AIPC aircraft, at a pressure height of 7000ft, these Reynolds numbers require indicated airspeeds of 65, 75, 85, 105, 125, and 145 m.p.h. respectively. At the low end of the speed. range (at 65 m■p.h.) the aircraft was flown with a flap setting of 200 in order to keep the angle of incidence (aircraft) as low as possible. The effect of flaps on the pressure field over the aircraft fuselage is quite small as ;Any- be seen in Fig. 15.
6.4. Yeasurement of Static Pressure Distributions on the Half Wing
With the static pressure tappings in the half wing connected to the multitube manometer, a series of flights were made to determine the static pressure distributions over the half wing. Pressure distributions were recorded photographically for each of the test Reynolds numbers and for incidences of 0°, 20, 4°, 60, 80, and 100„ upper and lower surfaces.
The F-24 observer camera films were read and the readings reduced to yield the non dimensional pressure dis-tribution coefficients.
6.5. Location of Transition
A thorough exploration of the boundary layer on the half wing was made using the creeping surface pitot, and creeper head techniques, to locate transition at the various test incidences and Reynolds numbers.
The creepers were positioned at spanwise stations as indicated in Fig. 6, and traversed in the streamwise airection, commencing at the position of the maximum thickness (40 per cent of 'effective chord') and moving forward in intervals of 5 per cent of the 'effective chord'. Since the surface pitot tubes used had thin flattened ends it was possible to explore the thin boundary layer regions near the leading
-17-
edge, thus permitting the traverse to be made up to the 5 per cent 'effective chord' position.
Flights were made and film records obtained of the creeper head readings during the traverses for each of the test Reynolds numbers and for both upper and lover surfaces of the wing at incidences of 0°, 2o„ 4o0 60, Eio„ and 10°,
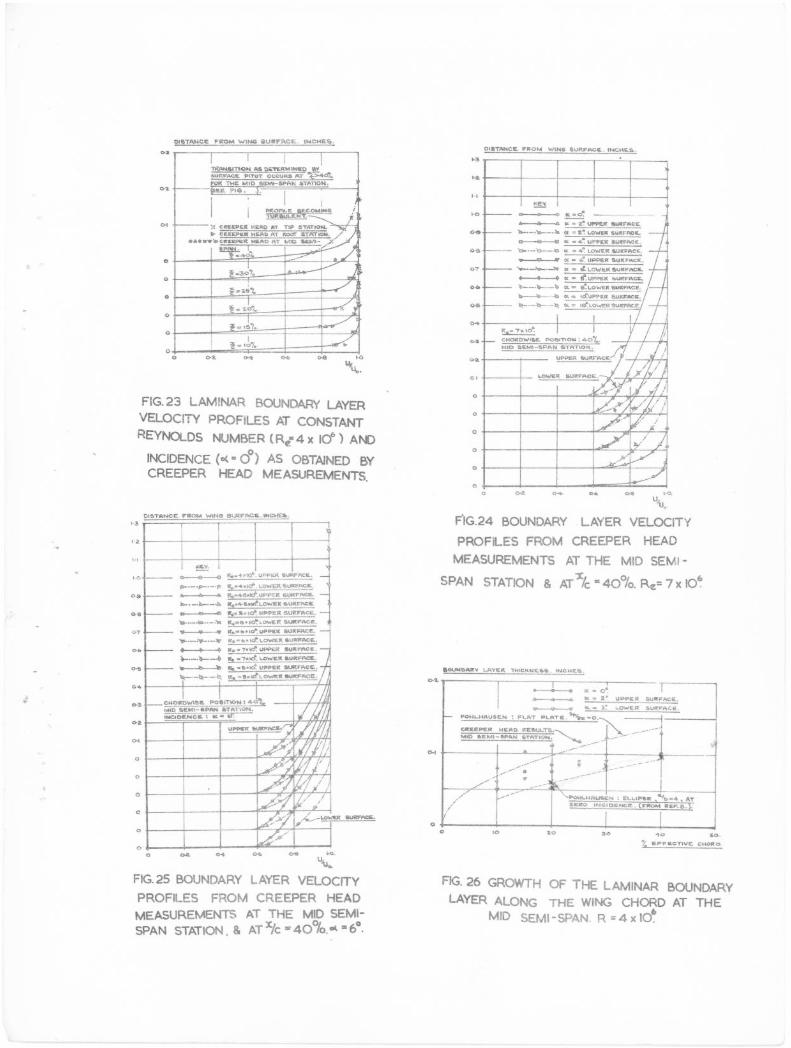
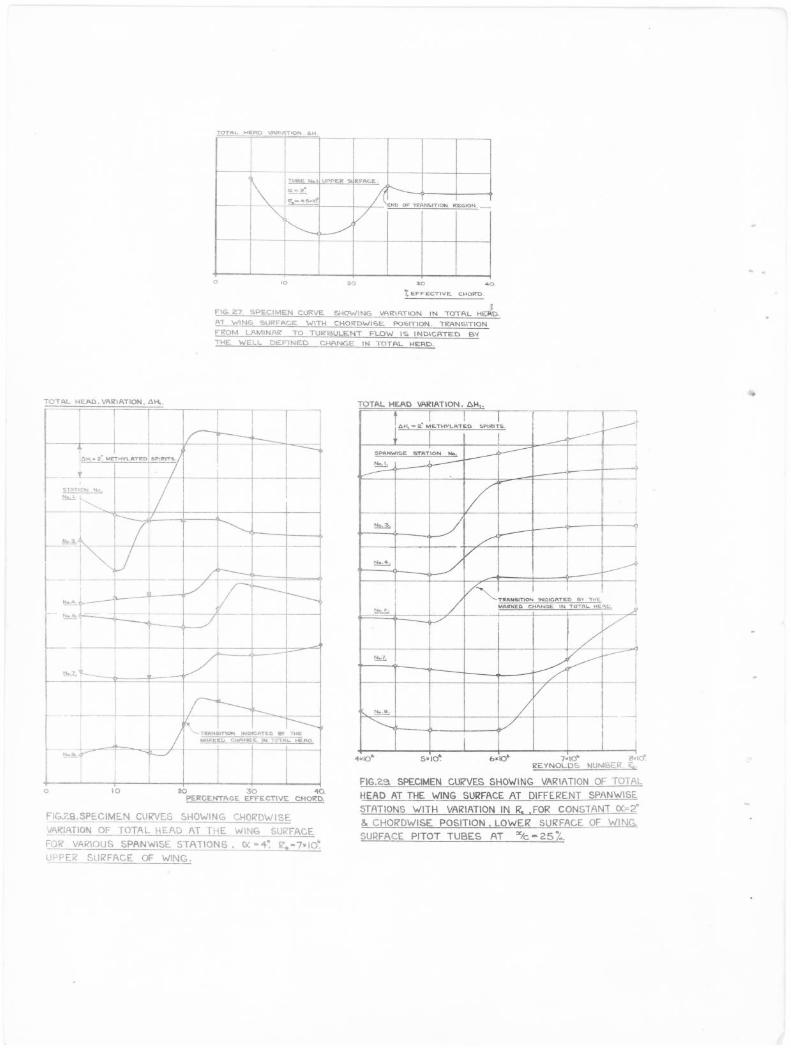
From the film records, plots were made of the variation of total head in the boundary layer near to the wing surface (assuming the changes in flow direction to be small) both along the chord for constant Reynolds number and incidence, and fcr different Reynolds numbers at constant chordwise position and in-idence. Representative curves may be seen in Figs. 27, 28 and 29.
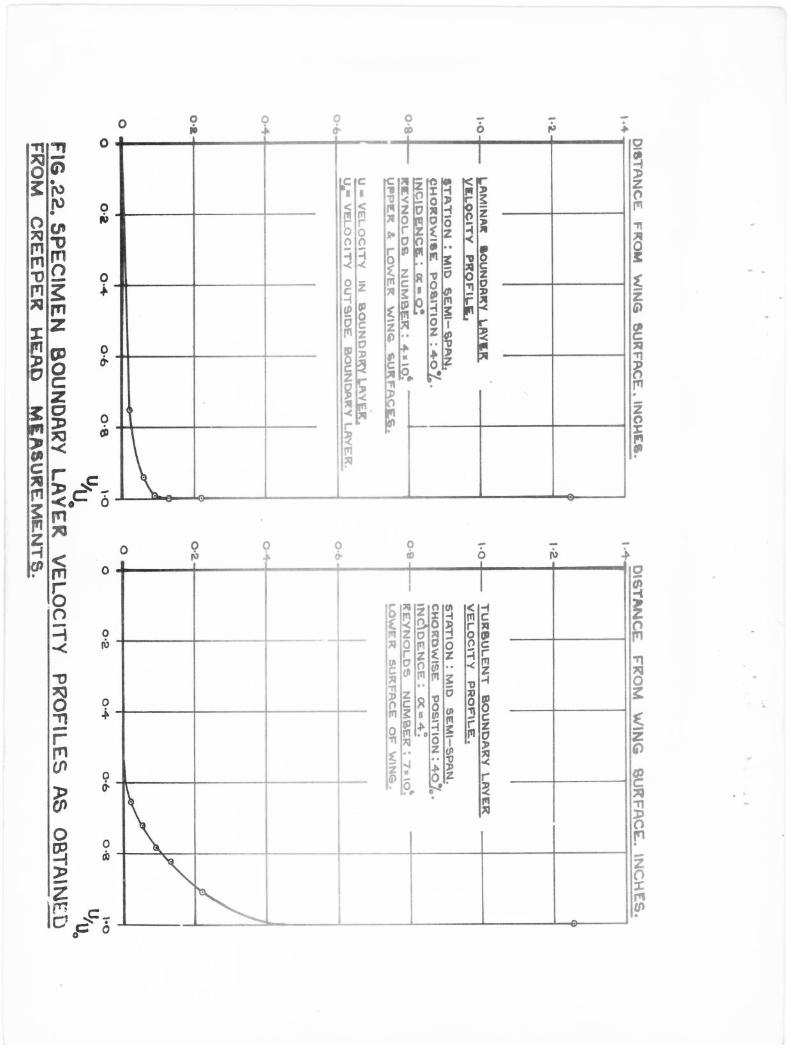
Creeper head readings were reduced to yield the boundary layer velocity profiles and here also representative curves maybe seen in Figs. 22, 23, 24 and 25.
6.6. Filet's Handling Comments for Anson C-AIR)
No difficulty in the handling of the aircraft was experienced by the pilots for all test conditions of speed and sideslip, and a note on the techniques involved is given in Appendix
7. Presentation of Results
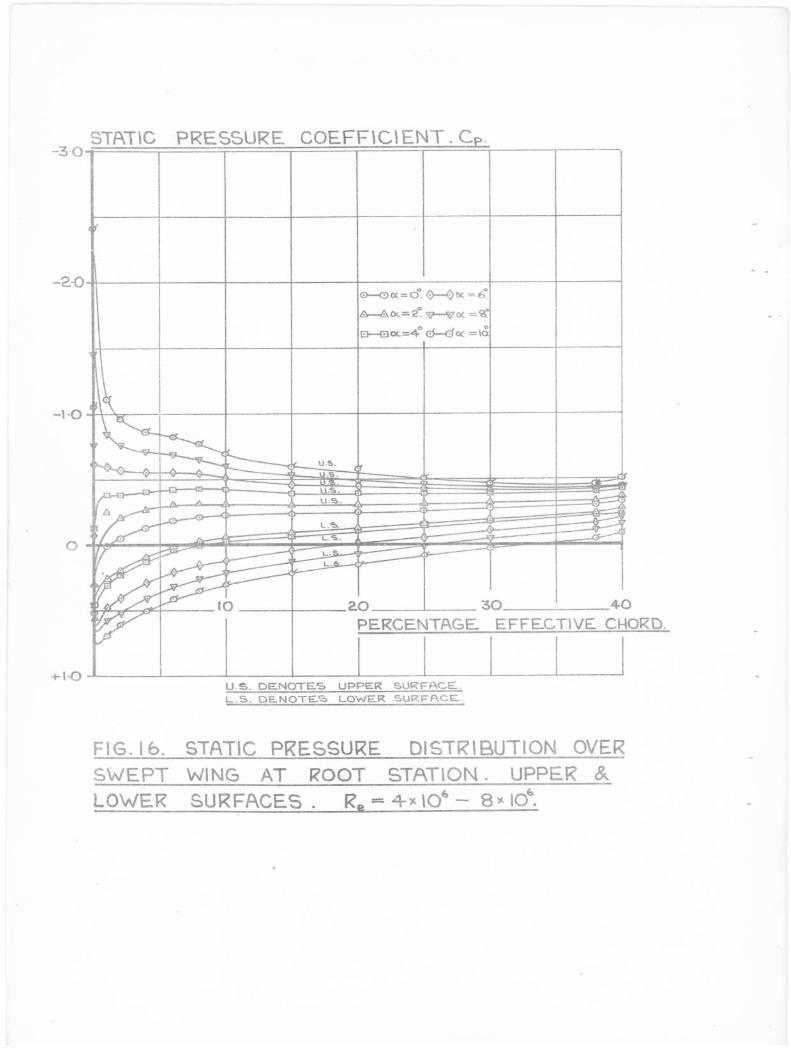
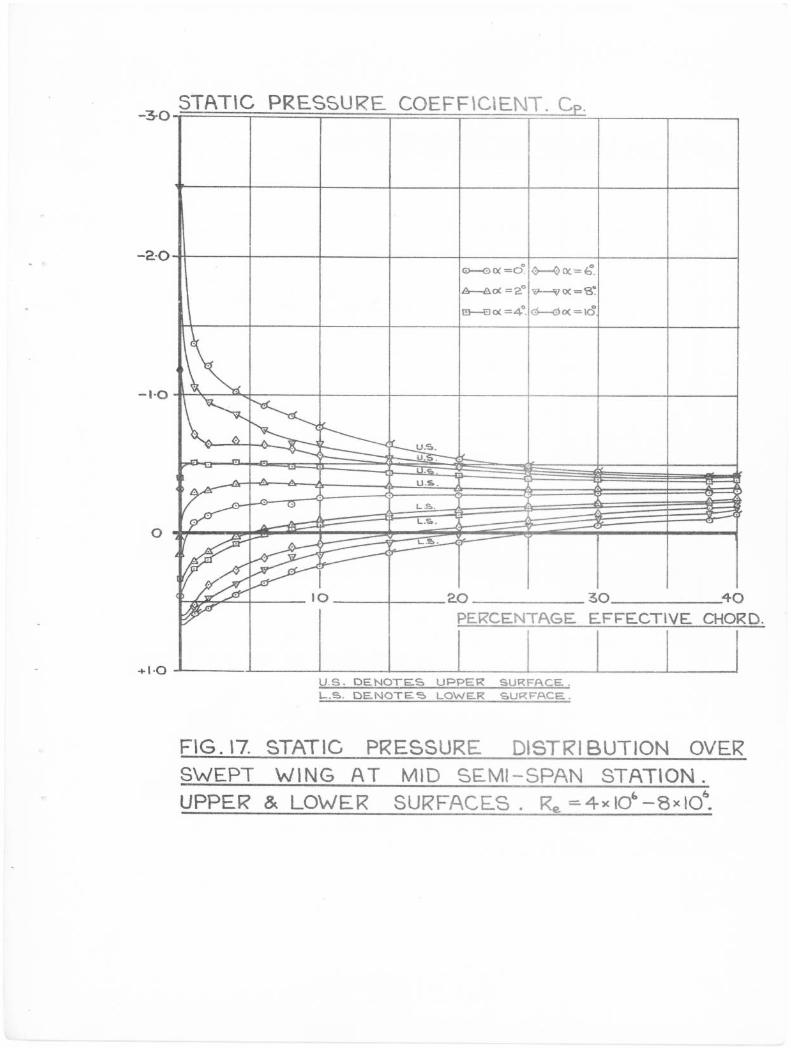
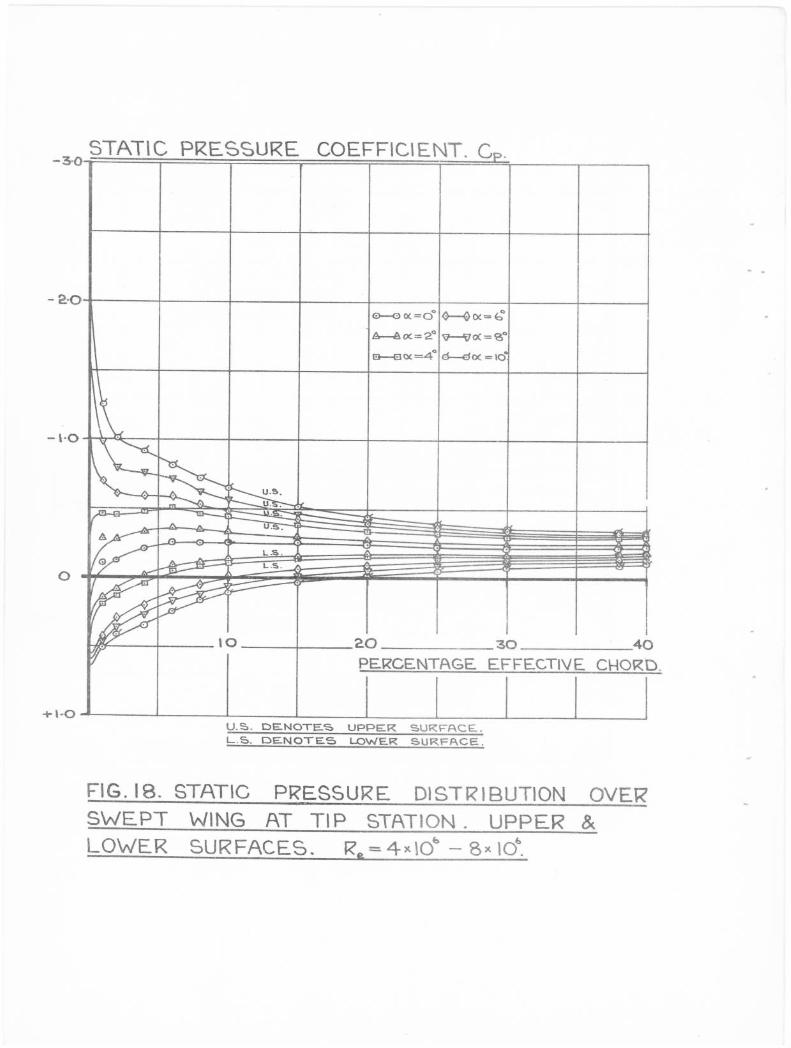
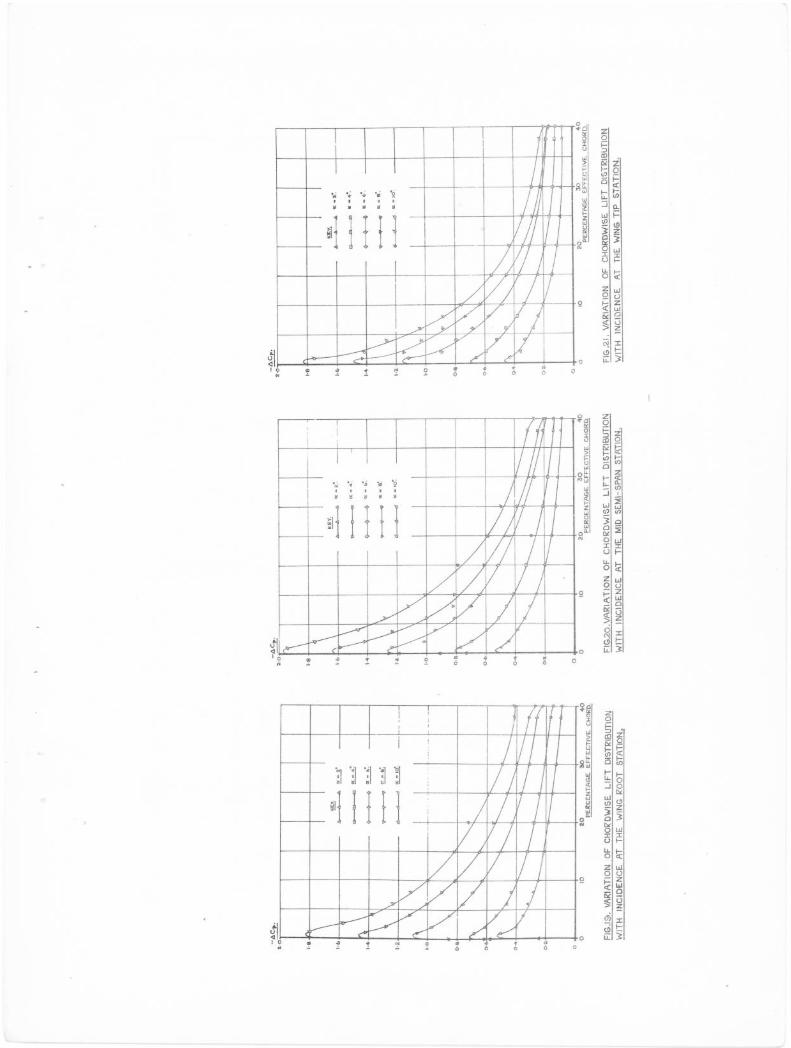
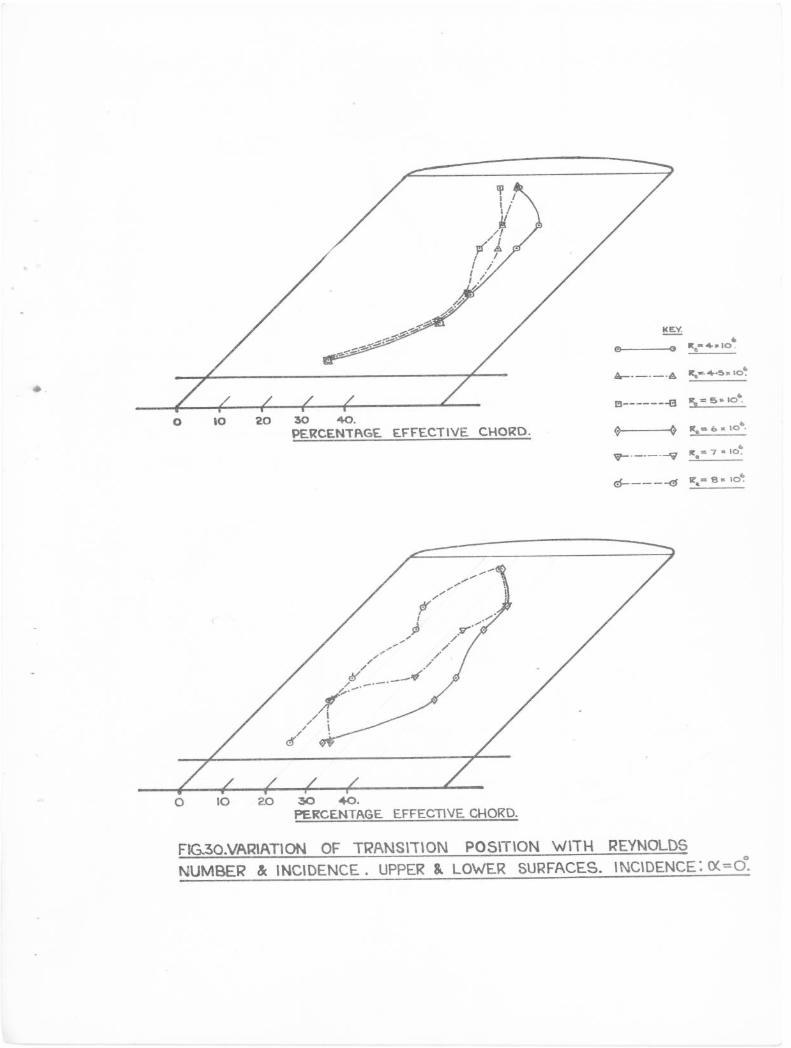
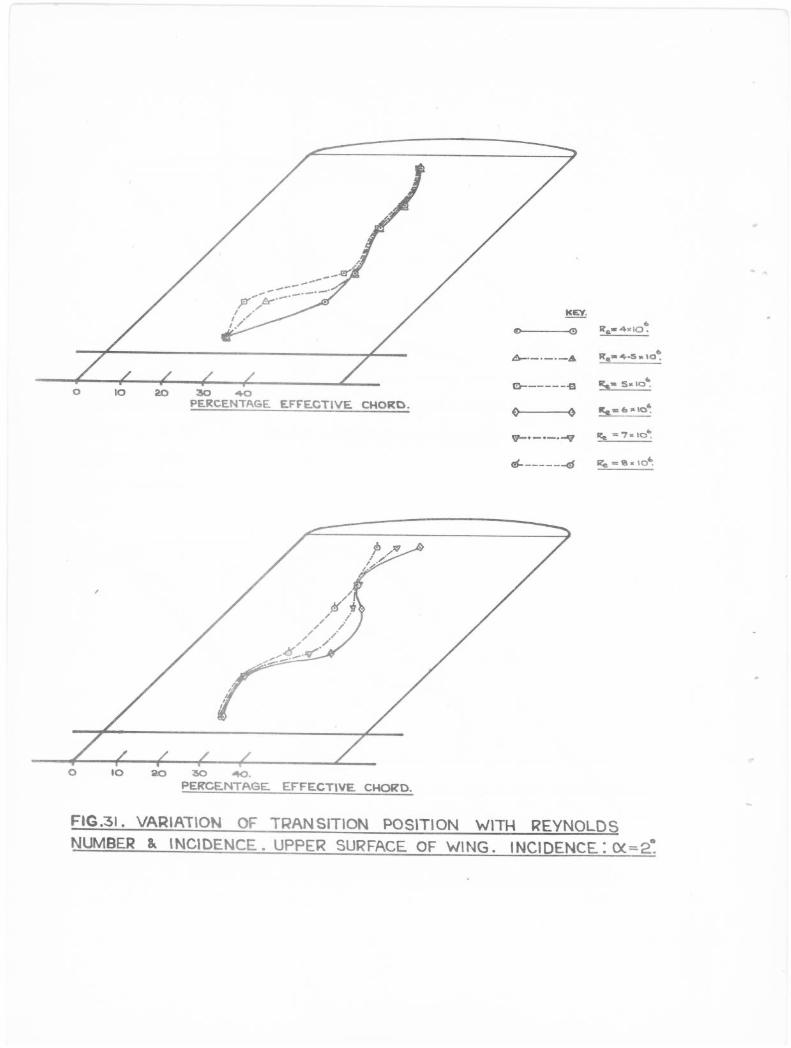
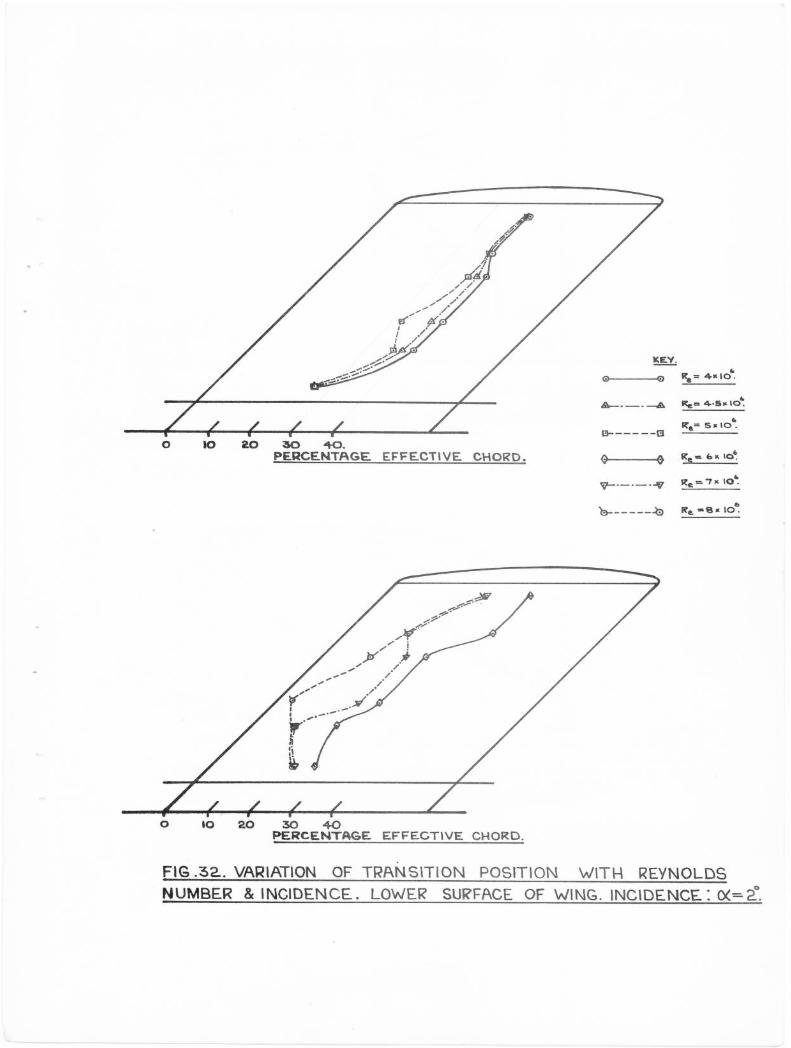
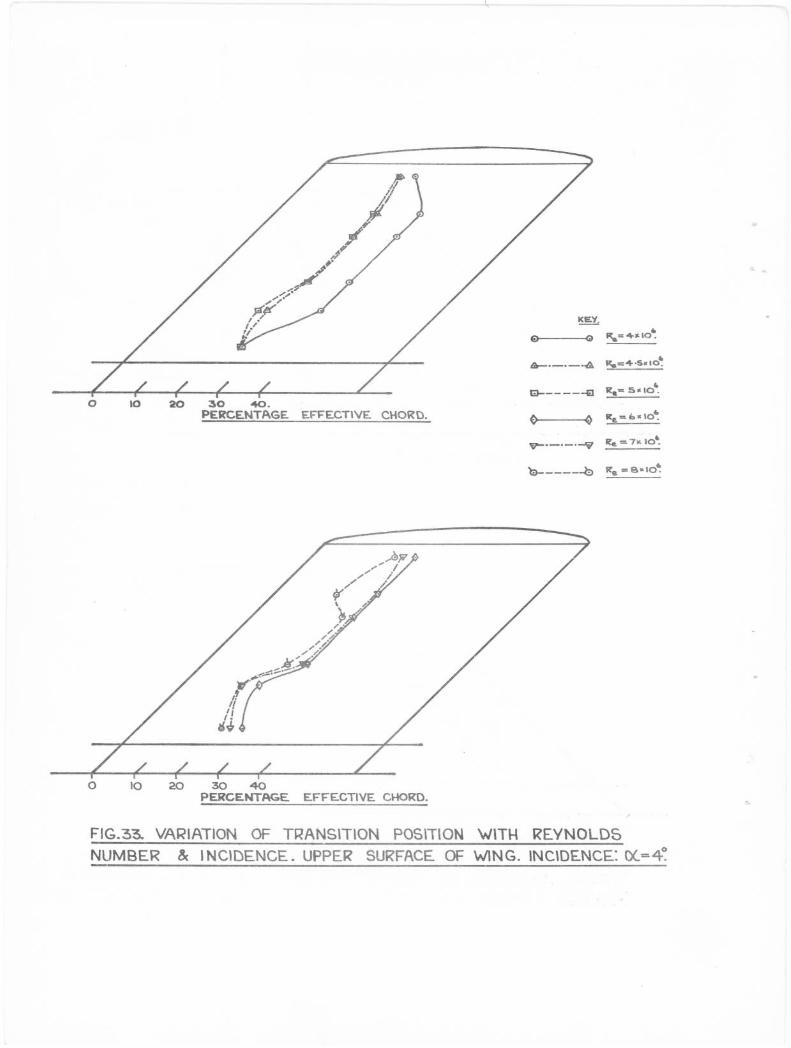
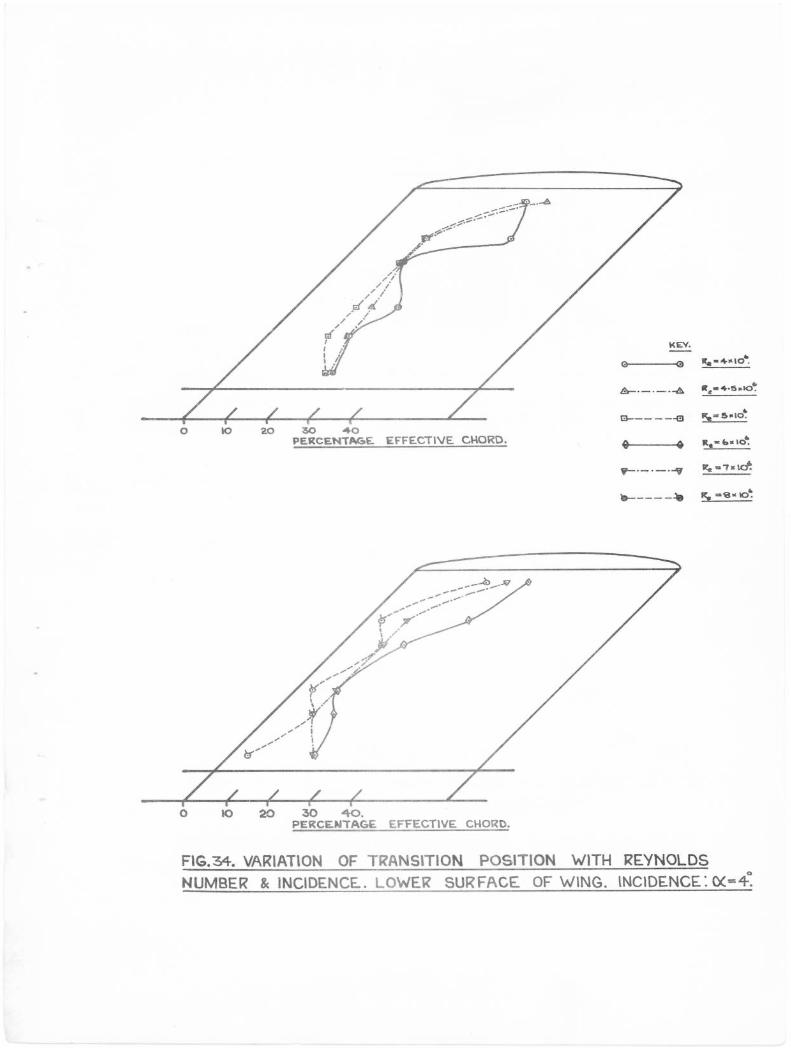
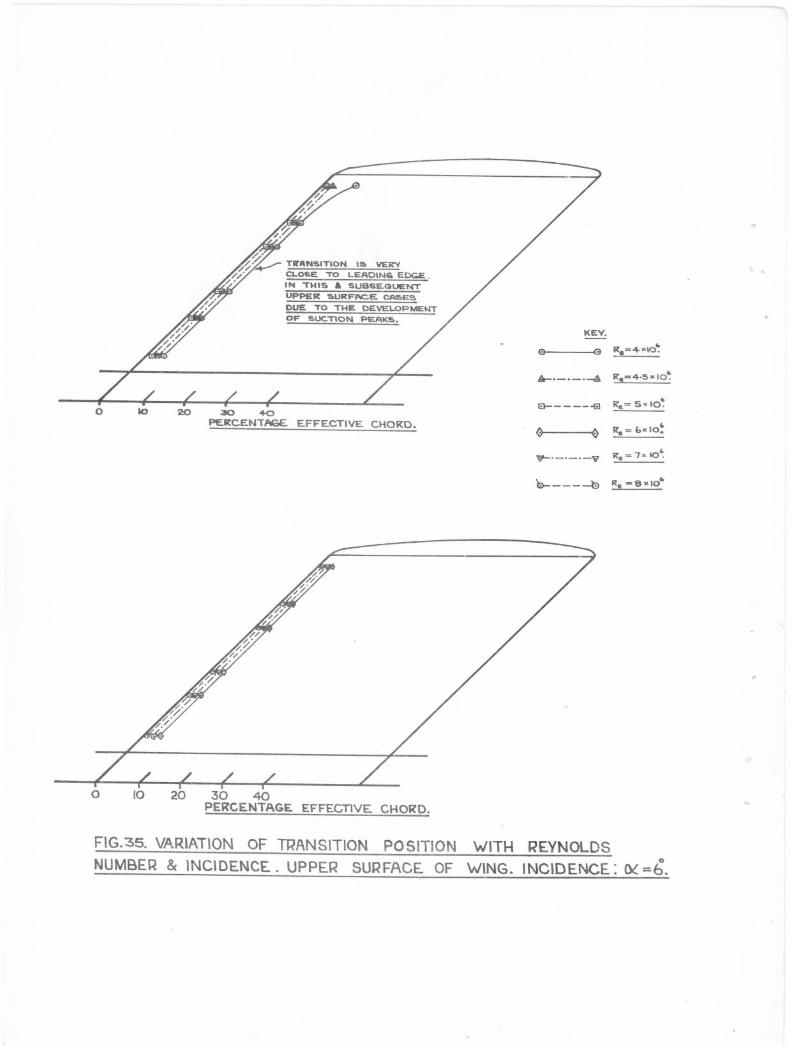
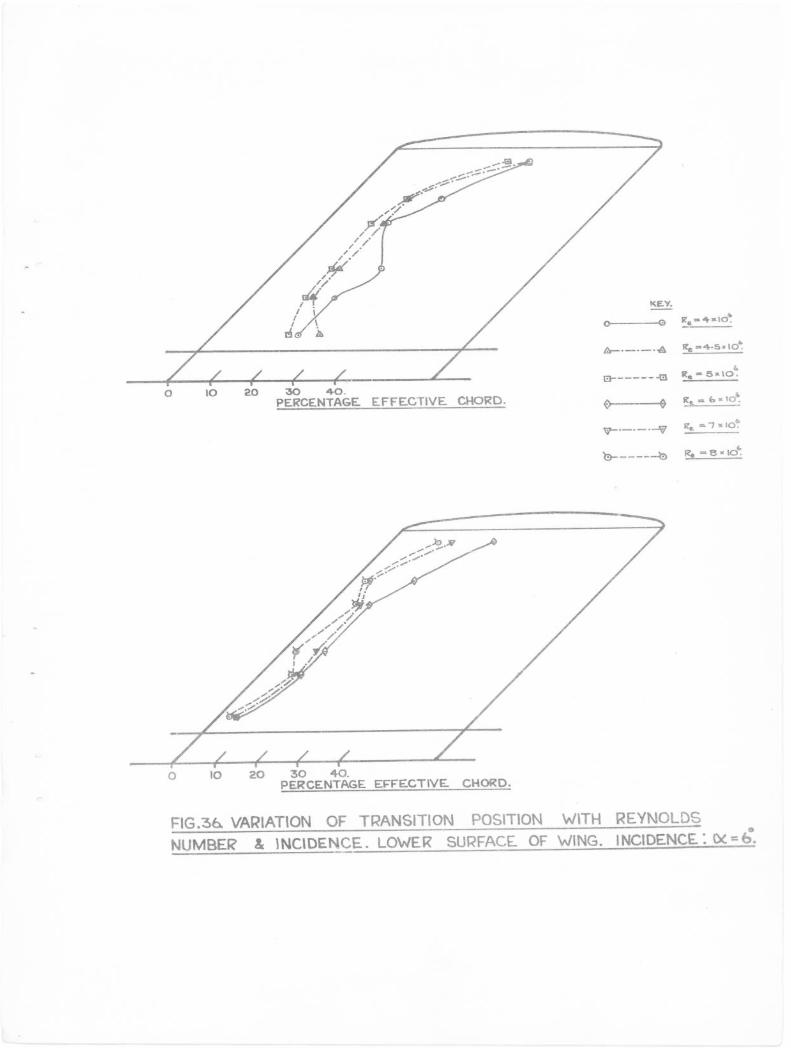
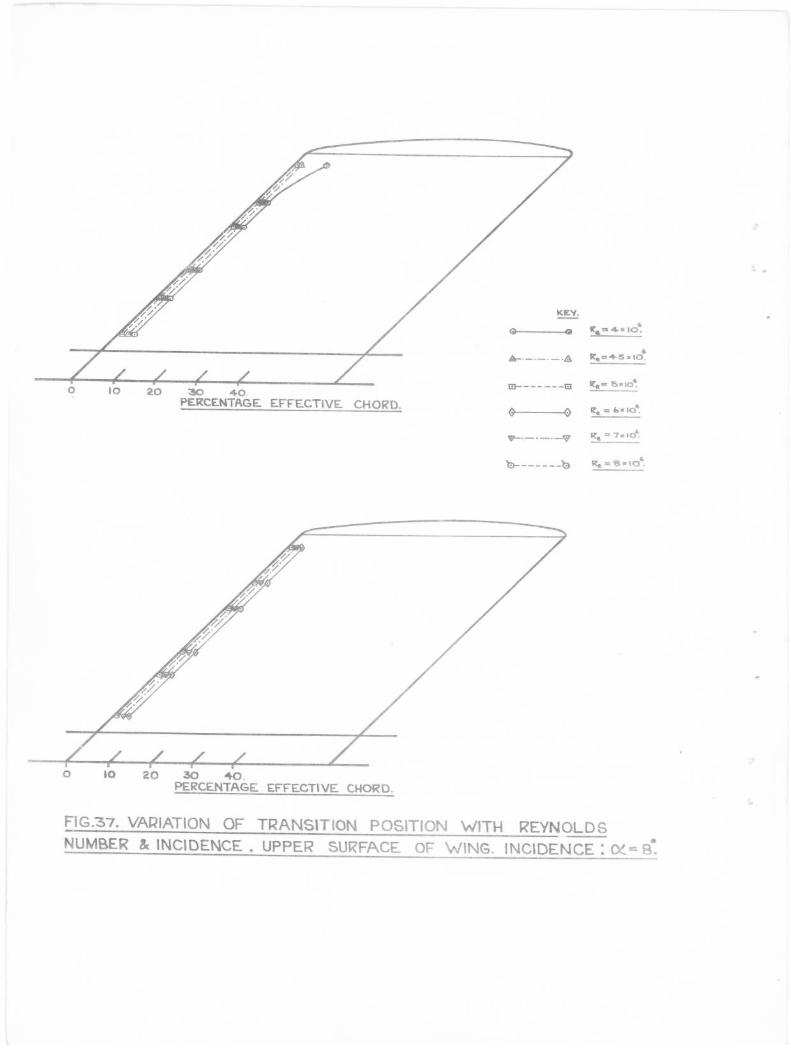
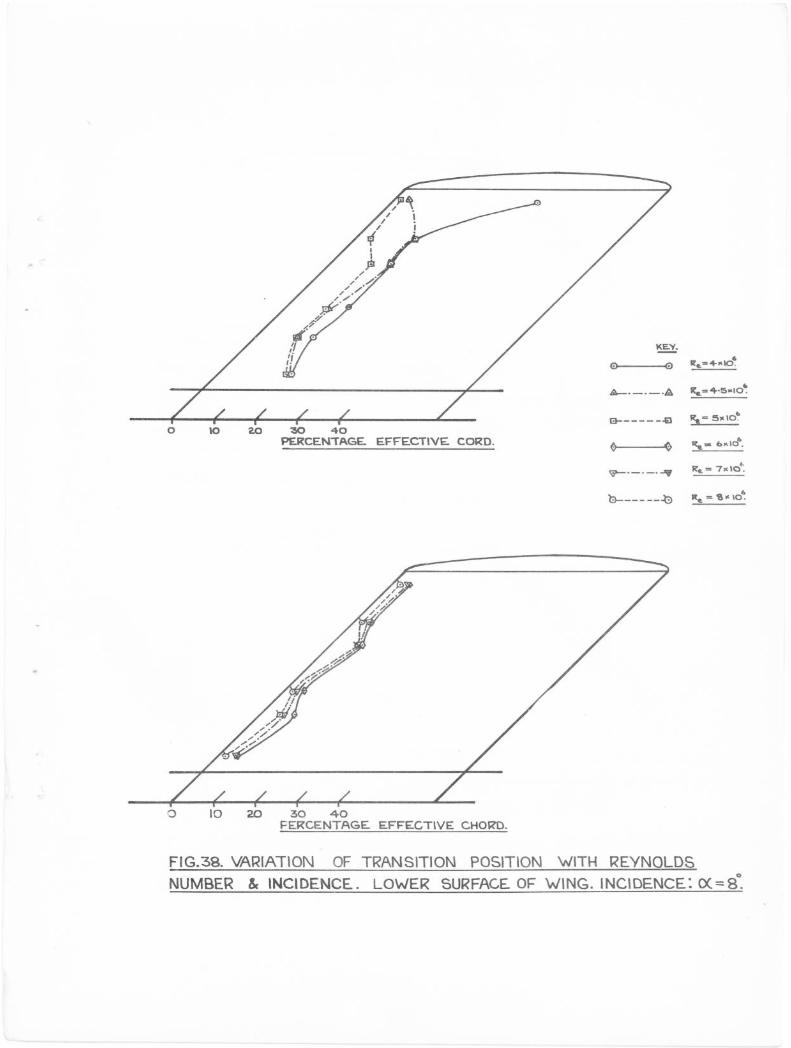
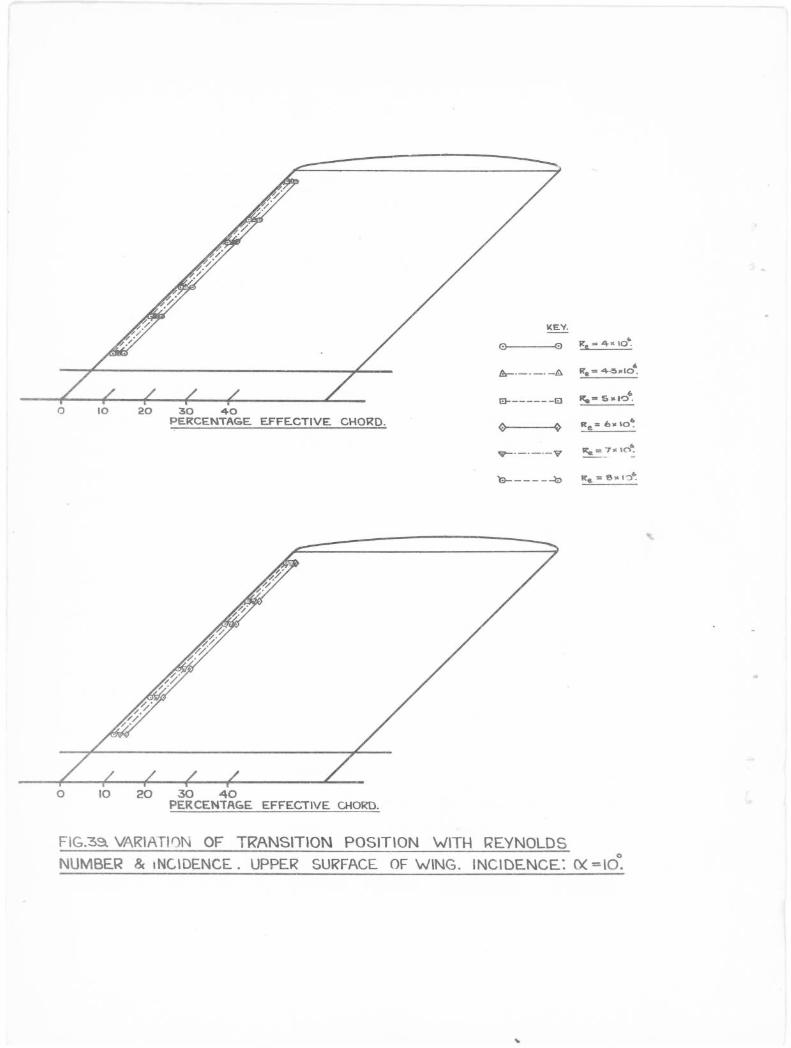
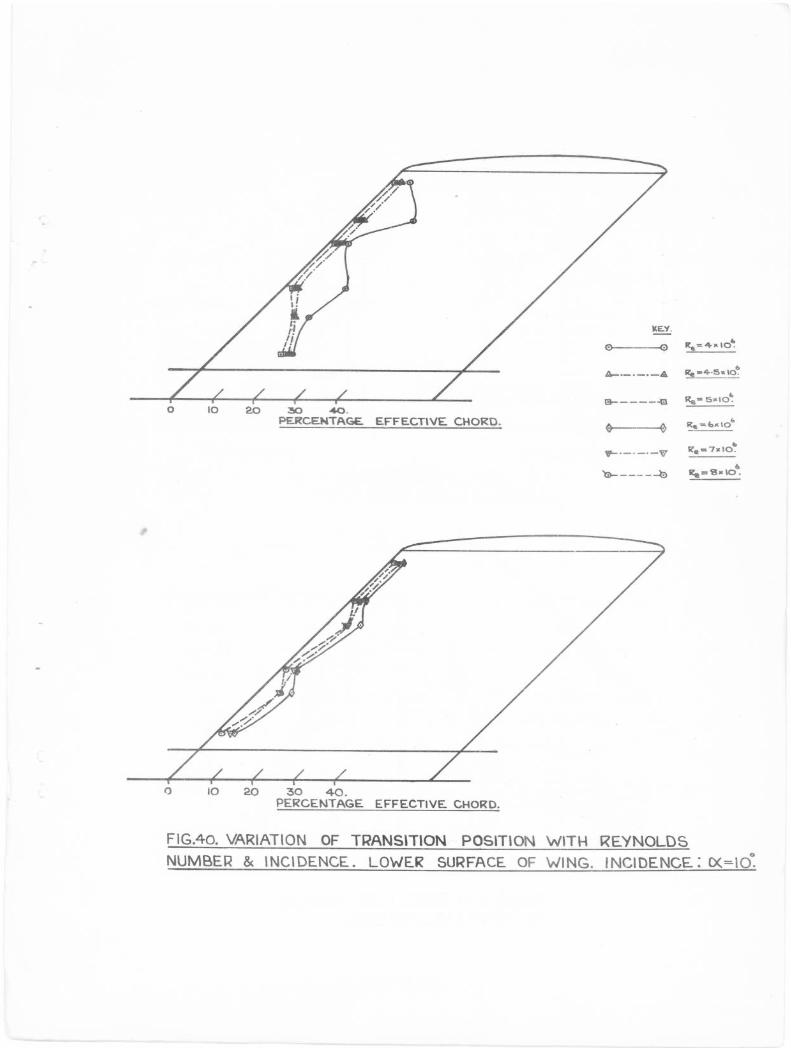
The measured pressure and lift distributions over the swept back ',PIP wing corrected for fuselage interference effects arc presented in Figs. 16 - 21, and the positions of transition for each test Reynolds number and incidence as determined from the creeper traverses are shown in Figs. 30 - 40.
Same typical plots of total head near to the wing surface are shown in Figs. 27 - 29 and show clearly the rise in total head which is associated -with, boundary layer transition from laminar to turbulent flow.
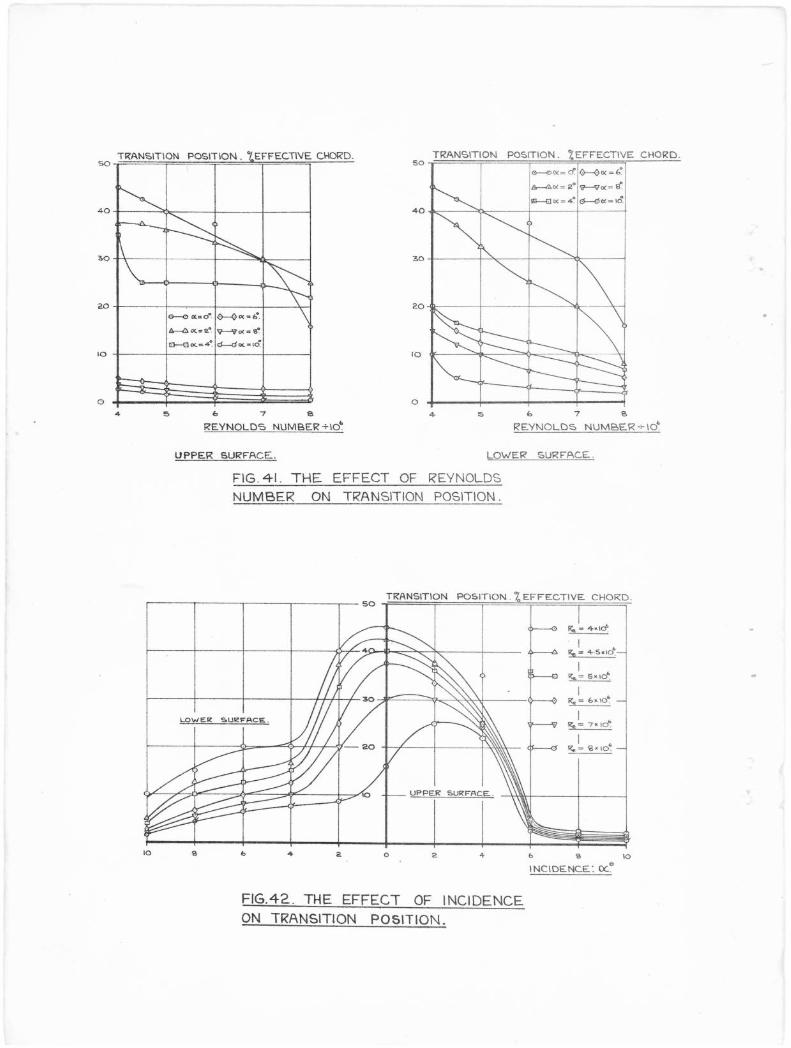
The variation of transition position with Reynolds number and incidence is plotted in Figs. 44 and 42. As the chordwise position of transition was found to vary along the span, the mid semi span positions of transition have been used in constructing the latter figs. The mid semi span position was chosen in order to present results approximately independent of tip and root effects.
A selection of the boundary layer velocity profiles as measured with the creeper heads is presented in Figs. 22 -- 25.
-18-
8. Results and Discussion
8.1. Static Pressure and Lift Distributions
The static pressure distributions over the half wing wIen -clotted in coefficient forma uncorrected for the pressure f_. over the fuselage showed a marked variation with Reynolds
r. It was assumed however, that the principle of super-pke - ',7eln could be applied and that the true static pressure dis:cibutions over the wing alone could be Obtained merely by subtracting tIle static pressure field due to the fuselage from the static ,lressure field as measured on the wing in flight. When this was done the distributions for the various Reynolds nue:bers collapsed virtually on to each other. The experimental points shown in Figs. 16 - 18 are mean values for the Reynolds number range considered.
The pressure fields actually affecting the flay in the boundery layer on the hnlf wing as mounted on the Anson fuselage will arise fram both the pressure fields over the wing itself and that due to the aircraft fuselage. In this respect it may be noted that due to the field over the fuselage, a small adverse pressure gradient exists in the region occupied by the half wing (fig. 15).
The measured values of pressure coefficient at the maximum thickness positions are much larger (in the negative sense) than would be expected on the full chord wing, indicating that an 'effective section' with a faired trailing edge as is considered here by no means simulates the flow conditions which would prevail on the full chord wing. Furthermore, pressure recovery occurs over a small distance due to the short trailing edge length and hence the boundary layer flow over the rear part of the wing as used here will be subject to a much greater adverse pressure gradient on the upper surface than it would be on the full chord wing, with a conventional trailing edge and we can thus expect to obtain smaller regions of laminar flaw.*
With a trailing edge of elliptic section the wing at low incidence (i.e. a-500) may tend to shed an unstable wnke similar to a Karmen vortex street. Such a motion would be expected to influence the stability of the stagnation point at the leading edge of the wing and hence result in a modifica-tion of the distribution of pressure and growth of the boundary layer over the section. No evidence of such an effect was however noticed in either the measurements of the pressure
* Considered in the absence of sweep instability at low incidence.
-19-
distributions or in the exploration of the boundary layer.
lkpre recent measurements of the static pressure distributions over the wing, using the traversing gear discussed in para. 41 are in good agreement with those shown in Figs. 16 - 18 with the exception of the upper surface distribution at the wing tip for an incidence a = 10°. The reasons for this particular discrepancy are not at present understood.
For these measurements the pressure coefficients were calculated from the measured values of velocity and static pressure just outside and through the boundary layer respectively.
The measured distributions of lift (Figs. 19 - 21) exhibit the usual properties characteristic of a swept back wing (such as discussed in ref. 10). For example, the forward movement of the centre of pressure near the tip and rearward movement near the root with increase of incidence maybe noted.
3.2. Transition Measurements
a) Upper Surface:
It is seen from Fig. 41 that transition on the upper surface moves forward with increase of either incidence or Reynolds number, as is genernlly the case for zero sweepback.
When the incidence on a swept back wing is increased the position of transition is affected by two factors: (ref. 4)
(i) the static pressure gradient (ii) sweep instability
The latter is instability of the laminar boundary layer, due to the effects of the curvature of the streamline in producing an unstable transverse velocity profile and occurs at a 'critical Reynolds number' as defined by Owen and Randall (ref. 12). For small angles of incidence this effect is small and of little significance, but for awing swept back at 45° there is a strong possibility of sweep instability occurring and this factor probably accounts for the rapid forward movements of the transition fronts at certain values of Reynolds number and incidence (e.g. Fig. 41, a = 0, Re = 7 x 10b and a = 4° Re = x 10G)
The movement of the transition front at a = 00 is of interest. It can be seen that as the Reynolds number reaches Re = 7 x 10⁶ the transition front commences to move forward quite rapidly becoming positioned at 15 per cent chord for Re = 8 x 100, and in this configuration there is less laminar
-20-
flow than for incidences of 2° and 4o at the same Reynolds
number. Such a movement of the front shows good qualitative agrecoent with the calculations of Owen and Randall (ref. 12), tho effect being due to the decrease in % caused by the raex increased velocity gradient on the wing and reduction in boundary layer thickness which initially occurs as the incidence is raised from a = 0°.
b) Lower Surface.
For the lower surface Fig. 41, the curves also show D. very definite forward movement of transition with increase of Reynolds number and incidence. Evidently in this case the influence of the favourable pressure graAient is more than counterbalanced by the effect of sweep instability. Results exhibiting similar properties have been obtained in a somewhat more orderly manner by Butler (ref. 4).
Owen and Randall (ref. 12) have shown that for the lover surface of a swept back wing, increase of incidence has a serious destabilising effect on the laminar boundary layer, and at certain critical Reynolds numbers transition may be expected to move rapidly towards the leading edge. This effect is illustrated in Fig. 42 where on increasing the incidence from 0° to 4° at a Reynolds number of 4 x 1060 the extent of laminar flow is reduced by some 20 per cent in terms of the 'effective wing chord'. A comparison of Figs. 30 - 42 (upper and lower surfaces) shows that in general much less laminar flow was obtained on to lower surface of the wing and at a Reynolds number of 8 x 10°, and incidence a = 10°, trans-ition is virtually at the leading edge.
The effective section of the wing considered in these experiments was of 8 per cent thickness to chord ratio, the chord being measured parallel to the line of flight. Measuring the chord normal to the leading edge the ratio becomes t/c1 = 11.3 per cent, and estimating the critical Reynolds
number for zero incidence yields a value R crit-1-9.3 x 10⁶, which is higher than that observed in the experiments.
Considering the actual wing section used (i.e. taking the dimensions of the chord as 48in.) we have:
t z 1t-L7 0.177 C cost\
for which the corresponding value of the critical Reynolds number is
Rcrit -r- 7.1 x 10⁶
--
-21-
This value for R y is in good agreement with the
results observed by experiment. No estimation of Rcrit have
been main for the wing at incidence due to the approximations involved in determining the values of CI, associated with the
incidences considered. However the fact that a forward move-ment of transition does occur on the lower surface of a swept back wing with increase of incidence and Reynolds number over a critical range is quite conclusive.
8.3. The Boundary Layer Velocity Profiles
Although the number of experimental points used to define the boundary layer velocity profiles is quite small, the curves obtained show quite well the distinction between the distributions for laminar and turbulent flow. For the laminar boundary layer an interesting comparison is made of the observed growth of the boundary layer from the leading edge of the wing at the mid semi span station as given by the creeper head measurements, with the calculated growths for both the flat plate and an ellipse of a/b = 4 using the Fohlhausen solution. (The values shown for the boundary layer thickness were those measured at U/to = 0,99). This comparison shows the
measured boundary layer thicknesses to be in fqtrly good agree-ment with two dimensional theory at the incidences considered (i.e. a = 0°, 2°).
Figs. 24 and 25 which show the growth of the boundary layer thickness with incidence and Reynolds nuMber at constant chorawise position, clearly indicate that the effect of incidence on the growth of the boundary layer is of greater significance than that of Reynolds number for the ranges considered. This is in accordance with the observed behaviour of the transition fronts on the half wing.
8.4. Bubbles of Separation
As explained by Kuchomann (ref. 3) the pronounced suction peaks near to the leading edge on aerofoils of moderate thickness to chord ratio (e.g. t/c = 0.09) may cause the laminar bounaary layer to separate and reattach in the turbulent state downstream forming bubbles of separation. The static pressure over that part of the aerofoil covered. by such a bubble (i.e. the region inside the bubble) will be nearly constant and hence the presence of the bubble is indicated by regions of constant C in the static pressure distribution curves.
Surface pitot traverses of the boundary layer should also indicate the presence of such bubbles by the detection of
-22-
regions of greatly reduced total head.
If the bubble is of the 'short' type its length in the characteristic direction is extremely small (i.e. of the order of 0■006 of the wing chord) and its presence therefore cannot be detected from pressure distributions determined using relatively widely spaced static tappings as were used in the case of the half wing under consideration. A 'long' bubble may herever extend over as much as 30 per cent of the wing chord and is therefore more easily detected.
For the ranges of incidence and Reynolds numbers considered there eras no evidence to show the Presence of either a long or short bubble of separation on the half wing.
•
9. Conclusions
1) The method of performing tests on a swept back half ring in flight as discussed have so far proved to be entirely satisfactory, and no difficulty in the handling of the aircraft was experienced_ by the pilots for all test conditions of speed and sideslip.
Pressure: distribution and boundary layer measurements have been made in flight on a slept back half wing for a Reynolds nuMber range of 4 x 100 - 8 x 10°, and an incidence range of a = 00 - 100.
2) The static pressure distributions over the half wing at each of the three spanwise stations when corrected for fuselage interference effects were found to be independent of Reynolds nunber for values of incidence in the range 0° to 100.
3) An 'effective' section with a faired trailing edge as used during the tests does not simulate the flow conditions which would prevail over the full chord wing. Larger (negative) values of the pressure coefficient are obtained in the region of the maximum thickness position and pressure recovery occurs over a small distance due to the short trailing edge length. Considered in the absence of sweep instability this effect can be expected to result in smaller regions of 1m i= flow being obtained at low incidence.
4) The use of the creeper technique has been found adequate for boundary layer exploration in flight. In particular the use of surface pitot tubes with flattened ends (giving orifice dimensions of approximately 0.040in x 0.005in. for locating the position of transition has been found most satisfactory, and the tubes were small enough to be traversed forward to the 5 per cent off chord position.
-23-
5) On the upper surface of the half wing, transition was observed to move forward with increase of both incidence and Reynolds number. This is due to a combination of adverse static pressure gradient and sweep instability. It has been found that the critical Reynolds number is reached earlier at zero incidence than for a = 2°, transition for the zero incidence case moving rapidly forward from the 30 per cent chord position as the Reynolds number reaches a value of 7 x 10⁶ becoming positioned at th9 15 per cent chord position at a Reynolds number of 8 x 100. Such a movement is in good qualitative agreement with the calculations due to Owen and Randall (ref. 12).
6) For the lower surface there is also a very definite movement of transition with increase of both incidence and Reynolds number. Here it appears that the influence of the favourable pressure gradient is more than counterbalanced by the effects of sweep instability. In general, much less laminar flow was obtained on tie lower surface of the wing and at a Reynolds number of 8 x 10 and incidence a = 10°, transition was virtually at the leading edge.
7) The growth of the boundary layer thickness (measured at U/Uo = 0.99) on the wing at low incidence as determined
from the velocity profiles for the mid semi span station showed fairly good agreement with two dimensional theory (Pohlhausen). It appears however than the effect of incidence on the growth of the boundary layer is of greater significance than that of Reynolds number for the ranges considered. This is in accordance with the observed behaviour of the transition fronts on the half wing.
Acknowledgements
The authors wish to express their appreciation and thanks to both Wing Cdr. C.G.B. hcClure, A.F.C., B.A., A.R.Ae.S., and Sqn.Ldr. I.A. Robertson, D.F.C., A.R.Ae.S. for their exacting skill in the piloting of the aircraft and also to Hr. Ulson„
B.Sc., D.C.Ae., A,F.R.Ae.S., Senior Lecturer in the Department of Flight at the College of Aeronautics for his kindness in supervising and encouraging the research programme',
-24-
List of References
1.
2.
BenneyM.L., and Talbot, J.E.
Erb, R.B., and Taylor, M.J.
Preliminary Investigations of the Measure-ment in Flight of the Boundary Layer Flaw Characteristics on Swept Back Wings. College of Aeronautics Thesis, (Unpublished), June, 1953.
The Investigation in Flight of the Boundary Layer Characteristics of Swept Back Wings. College of Aeronautics Thesis. (Unpublished), June, 1954.
3. Kuchemann,'D. Types of Flaw on Swept Back Wings with Special Reference to Free Boundaries and Vortex Sheets. Trans. J.R.Aero.Soc. November, 1953.
4. Butler, S.F.J. Transition on a Swept Back Wing. R.A.E. T.N. Aero. 2324■ October, 1954..
5. AnscaMbe, A. and The Effect of Sweepback on the Laminar Bmtler„ S.F.J. Boundary Layer.
Aero 2335.
6. Emslie, K., Hosking, L., and
Some Experiments on the Flow in the Boundary Layer of a 45° Swept Back
Marshall, W.S.D. Untaperei Wing of Aspect Ratio 4. College of Aeronautics Report No. 62,
February, 1953.
7. Goldstein, S. Modern Developments in Fluid Dynamics. Vols. I and Oxford University Press, 1952.
G. Schlichting, H. Boundary Layer Theory.
9. Burrows, P.M.
Pergamon Press, London, 1955,
The Characteristics of the Flow Field over the Mid Upper Fuselage of Lancaster P.A.474. College of Aeronautics Note No. 36,
January, 1956.
10. Weber, J., and Low Speed Tests on 45° Sweptback Wings Brebner, G.G. Part I. Pressure Measurements on Wings of
Aspect Ratio 5. R.A.E. Report Aero 2374. 1.1370 1950.
11. Gray, W.E. The Effect of Wing Sweep on laminar Flow. R.A.E. Tech. Llama Aero 255# February, 1952.
-25-
12. Owen, and- Boundary Layer Transition on a Swept Back Randral,
R.A.E. Tech. Homo. Aero 277. Hay, 1952.
13. Bryer,
14. Black, J.
.L Reuotely Controlled Traversing Yawmeter for Boundary Layer Exploration. A.R.C. 16,218. October, 1953.
Pressure Distributions and Boundary Layer Measurements on a 44° Swept-Back Tapered Wing. A.R.C. Report 15,i37. December, 1952.
15. Stevens, A.V., and Flight Experiments on Boundary Layer Haslam, J.A.G. Transition in Relation to Profile Drag.
R. and H. 1800. August, 1933.
APEENDIX I
Determination of and Speeds
It is required to determine a series of test speeds at a chosen pressure height, to give Reynolds numbers (based on tY3e effective wing chord of 75in.) of 4, 4i, 5, 6, 7, and 8 x 10⁶.
:_test pressure height of 7,000ft. is chosen for convenience.
altimeter pressure error correction
The altimeter error correction due to the static pressure error is given by:
SPEC x Vr h _ " ft. 15 x a-
where S.P.E.C. and Vr arc in m.p.h. In the v'orst case this
is less than 50ft. and hence the altimeter error correction was neglected.
Test Speeds (indicated)
It an MAN pressure height of 7,000ft. we have:
v = 1.855 x 10 4 ft2/sec.
= 0.900.
Reynolds numbers of 4, /4, 5, 6, 7 and 8 x 10⁶ correspond
-26-
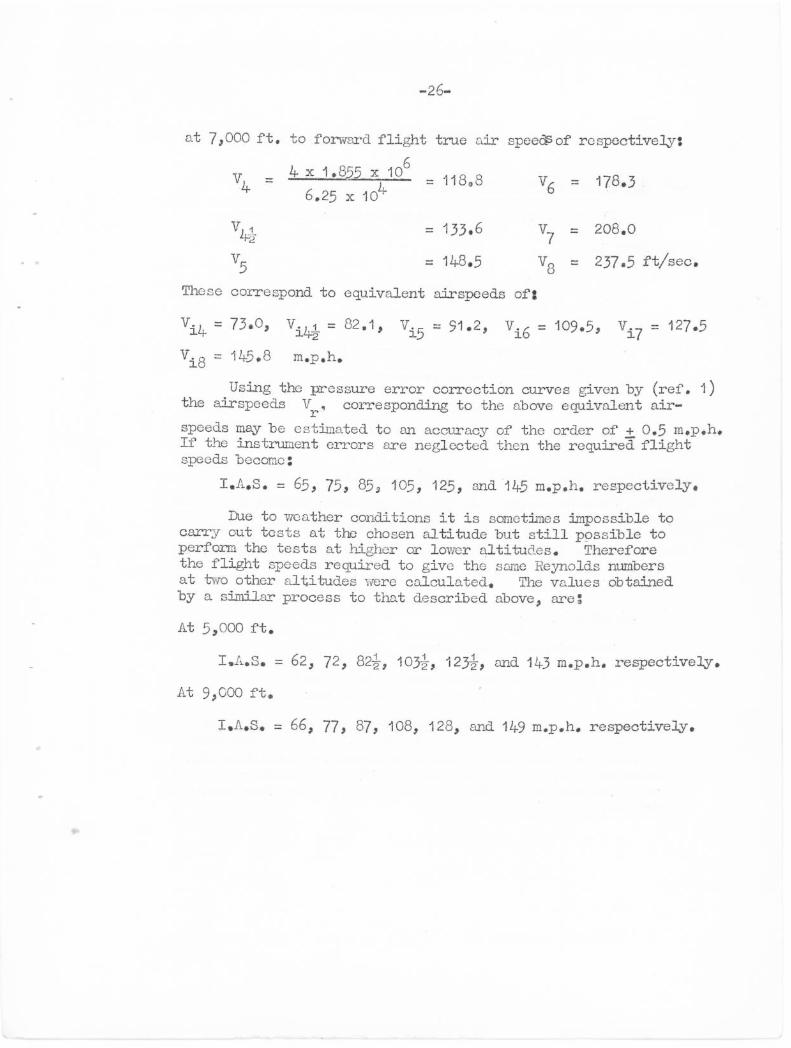
at 7,000 ft. to forward flight true air speedsof respectively:
V4 _ x 1°6 - 118.8 4 - V6 = 178.3 6.25 x 104
= 133.6 V7
208.0
V5 = 148.5 V8 = 237.5 ft/sec.
Those correspond to equivalent airspeeds of:
Vi4 = 73.0, Vi42 = 82.1, V. = 91.2, vi6 = 109.5, vi7 = 127.5
Via = 145.8 m.p.h.
Using the pressure error correction curves given by (ref. 1) the airspeeds V
r, corresponding to the above equivalent air-
speeds may be estimated to an accuracy of the order off 0.5 m.p.h. If the instrument errors are neglected then the required flight speeds become:
I.A.S. = 65, 75, 853 105, 125, and 145 m.p.h. respectively.
Due to weather conditions it is sometimes impossible to carry out tests at the chosen altitude but still possible to perform the tests at higher or lower altitudes. Therefore the flight speeds required to give the same Reynolds numbers at two other altitudes were calculated. The values obtained by a similar process to that described above, are
At 5,000 ft.
= 62, 72, 821, 10310 12310 and 143 m.p.h. respectively.
At 9,000 ft.
I.A.S. = 66, 77, 87, 108, 128, and 149 m.p.h. respectively.
- 27 -
APPENDIX II
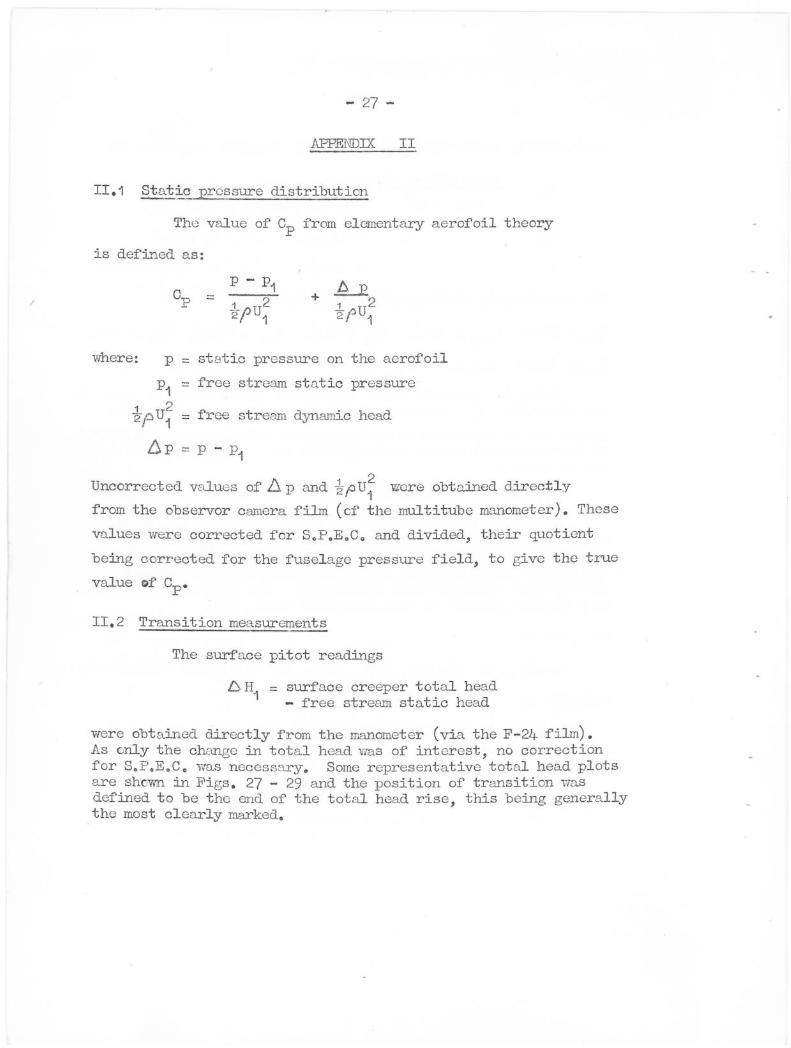
11.1 Static pressure distribution
The value of Cl, from elementary aerofoil theory
is defined as:
P 131 C J7)112 / 2 2 ui
where: p ststic pressure on the aerofoil
p1 = free stream static pressure
1 2 = free stream dynamic head
P - 131
Uncorrected values of IA p and 2pUi2 were obtained directly from the observer camera film (cf the multitube manometer). These
values were corrected for S.P.E.C. and divided, their quotient
being corrected for the fuselage pressure field, to give the true
value of C
11.2 Transition measurements
The surface pitot readings
AH1 = surface creeper total head
- free stream static head
were obtained directly from the manometer (via the F-21 film). As only the change in total head was of interest, no correction for S.P.E.C. was necessary. Some representative total head plots are shown in Figs. 27 - 29 and the position of transition was defined to be the end of the total head rise, this being generally the most clearly marked.
-28-
APPENDIX III
PILOTS; FIANDLTNG TECHNIQUE
by Sqd.l.dr. Robertson, Senior Pilot, Department of Flight, College of Aeronautics.
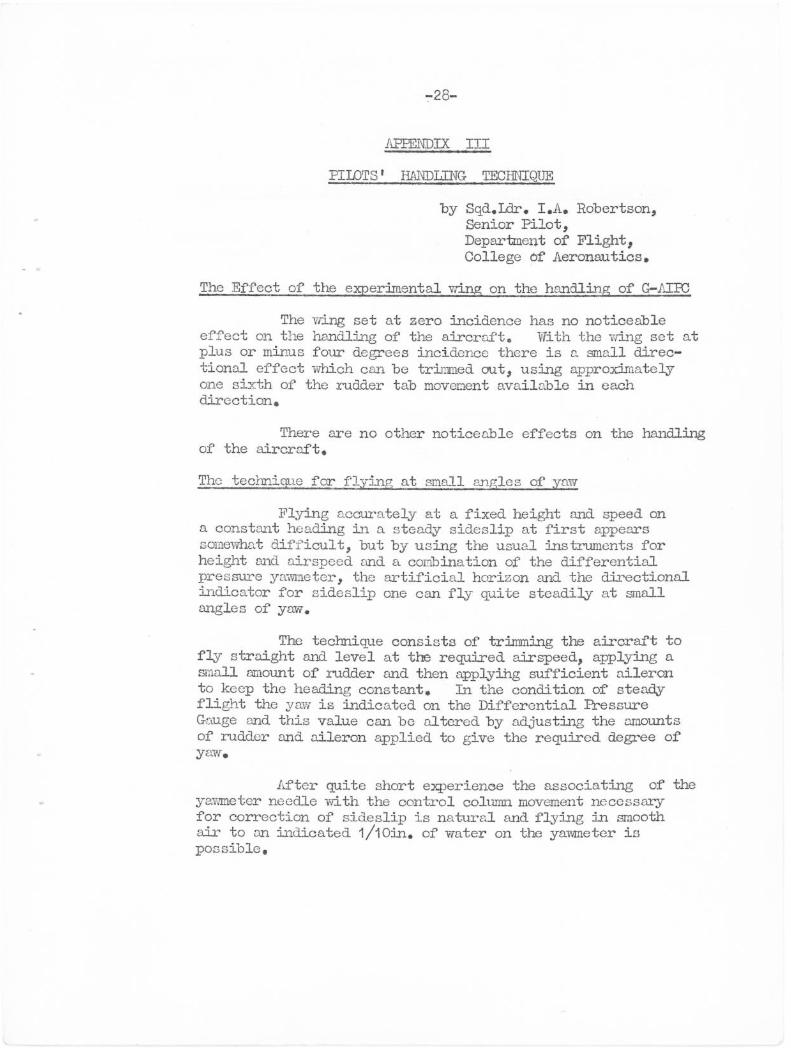
The Effect of the experimental wing on the handlinp, of G-Alke
The wing set at zero incidence has no noticeable effect on the handling of the aircraft. With the wing set at plus or minus four degrees incidence there is a small drec-tional effect which can be trimmed out, using approximately one sixth of the rudder tab movement available in each direction.
There are no other noticeable effects on the handling of the aircraft.
The technique for flying at small angles of yaw
Flying accurately at a fixed height and speed an a constant heading in a steady sideslip at first appears somewhat difficult, but by using the usual instruments for height and airspeed and a combination of the differential pressure yawmeter, the artificial horizon and the directional indicator for sideslip one can fly quite steadily at small angles of yaw.
The technique consists of trimming the aircraft to fly straight and level at the required airspeed, applying a small amount of rudder and then applyihg sufficient aileron to keep the heading constant. In the condition of steady flight the yaw is indicated on the Differential Pressure Gauge and this value can be altered by adjusting the amounts of rudder and aileron applied to give the required degree of yaw.
After quite short experience the associating of the yameter needle with the control column movement necessary for correction of sideslip is natural and flying in smooth air to an indicated 00in. of water on the yawmeter is possible■
-29-
TABLE I
The Location of the Static Pressure Tappings in the Half Wing,
Number of Hole
Distance From The Leading Edge. Ins.
% Effective Chord
1 0.00 0
2 0.75 1
3 1.50 2
3.00 4
5 4.50 6
6 6.00 8
7 7.50 10
11.25 15
9 15.00 20
10 18.75 25
11 22.50 30
12 28.50 38
13 30.00 40
-30-
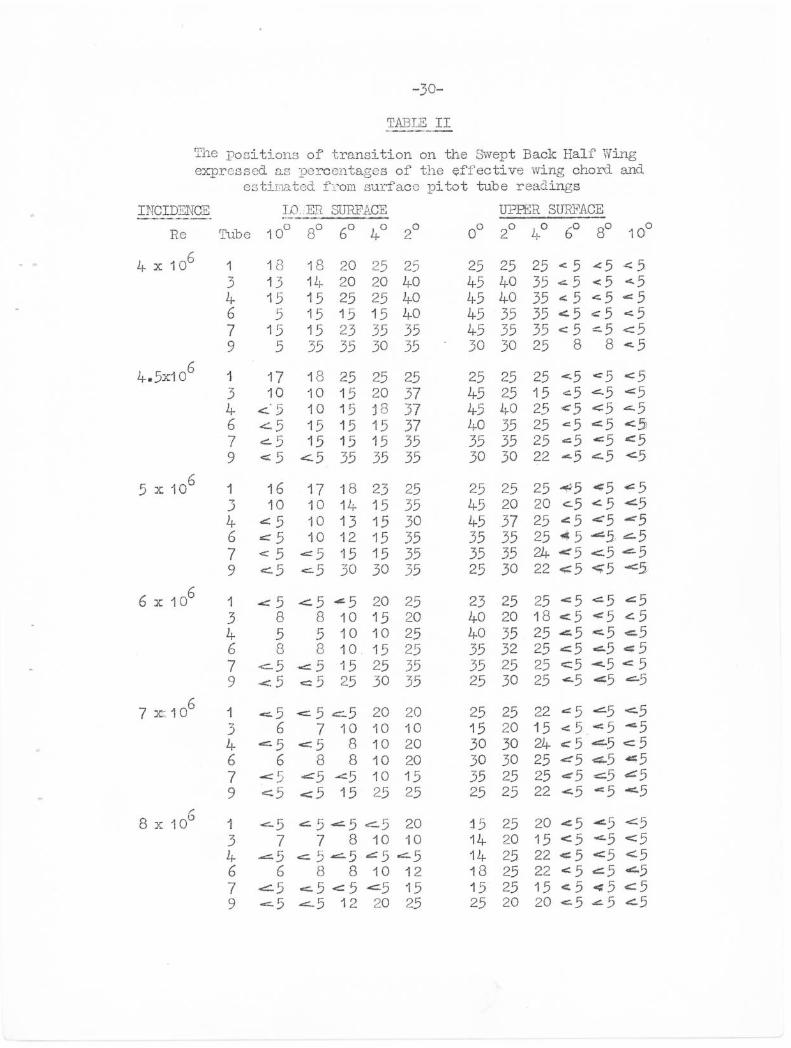
TABLE II
The positions of transition on the Swept Back Half Wing expressed. as percentages of the effective wing chord and
estimated fa'om surface pitot tube readings
INCIDENCE LO. ER SURFACE UPPER SURFACE
Re Tube 10° 8° 6° 4o
2° 0° 2° 4° 6° 8° 10
o
4 x 10⁶ 1 18 18 20 25 25 25 25 25 < 5 <5 <5 3 13 14 20 20 40 45 2+0 35 <5 <5 <-5 4 15 15 25 25 40 45 40 35 <5 <5 <5 6 5 15 15 15 40 45 35 35 <5 <5 <5 7 15 15 23 35 35 45 35 35 <5 = 5 <5 9 5 35 35 30 35 30 30 25 8 8 <5
4.5x10⁶ 1 17 18 25 25 25 25 25 25 <5 <5 <5 3 10 10 15 20 37 45 25 15 <5 <-5 <5
<-. 5 10 15 18 37 45 40 25 6 15 15 15 37 40 35 25 <5 <5 <5 7 <-5 15 15 15 35 35 35 25 £5<5 <5
9 <5 <.5 35 35 35 30 30 22
5 x 10⁶ 1 16 17 18 23 25 25 25 25 .4;5 <5 <5 3 10 10 14 15 35 45 20 20 <.5 -c 5 4- <5 10 13 15 30 45 37 25 <5 <5 <5 6 <5 10 12 15 35 35 35 25 <5 <-5 7 < 5 <5 15 15 35 35 35 24- <5 9 <5 <5 30 30 35 25 30 22 <5 45 -<5
6 x 10⁶ 1 .‹ 5 -c 5 4, 5 20 25 23 25 25 <5 <5 <5 3 8 8 10 15 20 40 20 18 <5 '5 <5 4 5 5 10 10 25 40 35 25 -.45 <5 <5 6 8 8 10. 15 25 35 32 25 <5 <5 4:5 7 15 25 35 35 25 25 e5 <5 < 5 9 25 30 35 25 30 25
7 x=106 1 < 5 c 5 20 20 25 25 22 <5 -<-5 <5 3 6 7 10 10 10 15 20 15 < 5 <5 4. <5 <5 8 10 20 30 30 24 < 5 •<-5 <5 6 6 8 8 10 20 30 30 25 <5 -<5 7 5 <5 <5 10 15 .35 25 25 <5 <5 <5 9 < 5 < 5 15 25 25 25 25 22 <5 <5 -<.5
8 x 10° 1 <5 < 5 20 15 25 20 <5 3 7 7 8 10 10 14- 20 15 <5 L5 <5
-=.5 < 5 <-5 <5 <-5 14 25 22 <5 <5 <5 6 6 8 8 10 12 18 25 22 <5 7 <5 <5 <5 15 15 25 15 <5 -4 5 .c 5 9 12 20 25 25 20 20 <5 5 <5

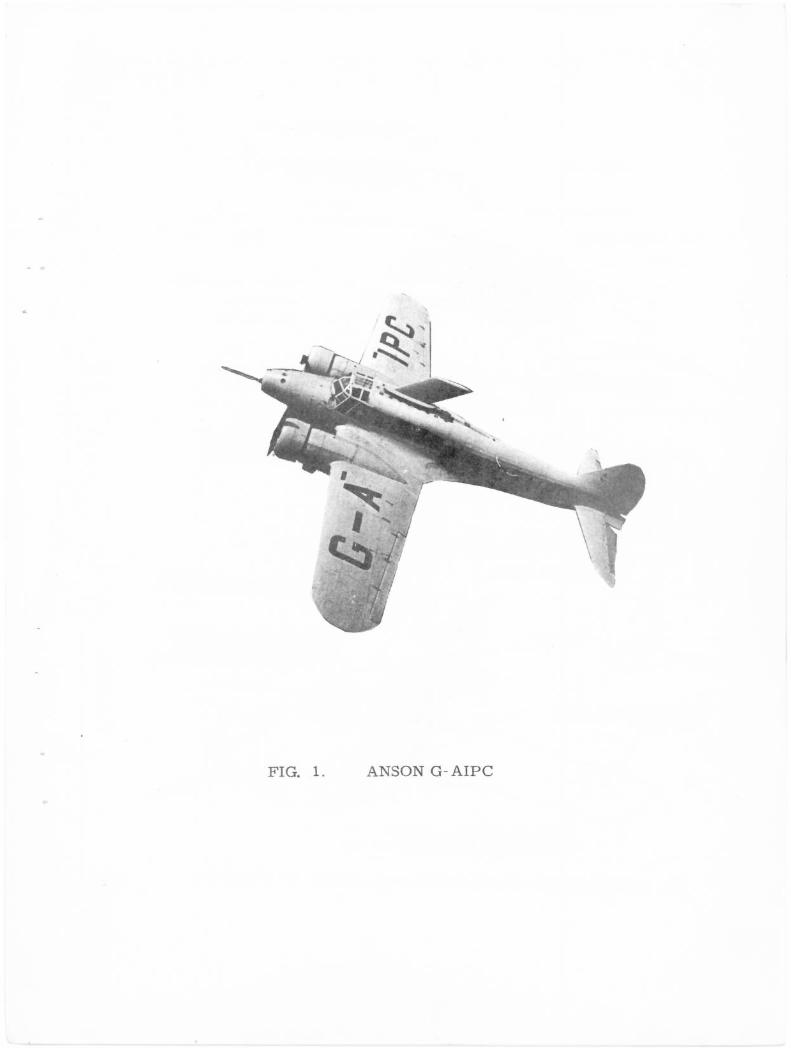
FIG. 1. ANSON G- AIPC
4S SWEPT VANE,
B-ounitEtity LAYER FENCE.
LLADS TO WAN.OUS.IER.
SP AN-
P =NM WING SPAR .
DIFFERENT 1.AL PRE-sSuRE GROGE copolaGTE-17 70
VftwealL-FER MuLTM.NIE MAN oMETeR .
■uir.LAcs FRAMES STIENGINEN
70 CU PORT 'M EE SWEPT
E.AcK WING •
PRC7T S I warmumercr PeNe4EL .
TRAVERsING MEAD CLiErr SmowN) IS MOUNTED RT
END Of RE RCN RROPIA.
SRPiCiNG STRUTS. UGS ON Rik Elk AF T FRAMES F 04HE TIRE
TRAVERSE G GAR SUPPORT STRUTS.
zFORWARD SUPPORT STRU 7 ATT AGNES:.
70 FUSELAGE SIVE. FRAMES VIA
NoRVZoNTAL STRUTS AS INDIC RTED .
PARCRAFT FRONT SPA". SHOWN 'CUT AWRY.
AFT TRAVERSE GEAR SLIPPoisT
STRUT ATTACHED To AIRCRAFT
kiL AR SPAR. \ -. ----- 41111111111%1 :::,..!:J....
'4011m.
FIG. 2. GENERAL ARRANGEMENT OF EXPERIMENTAL EQUIPMENT iN ANSON G-AIPC,
ti/C.% ON Fu.s.suNGE_ SIDE FwAmEs. rolc A V7 AC14E7.1E741" of licoOLoNTAL STRUT".
SUPPORTING 7ME FORWARD TRAVERSE GRAM SI-Rus,
FIG. 3A GENERAL ARRANGEMENT OF TRAVERSE. GEAR. SUPPORTS oN ANSON
-3 M M O D. HYPODERMIC STEEL. SLEEVE
M.M . 0 0 HYPODERMIC
STEEL TUBES SOLDERED TOGETHER -- •
`TUBE ENDS FLATTENED
A FINISHED TO RN INCLUDED
ANGLE OF 70°.
WING SURFACE GENERATOR AXIS. .WING LEADING EDGE.
CENTRE BLOCK CARRYING
TRIP00 & TRAVERSING MECHANISM.
HINGED ALONG AXIS 'AA' TO PERMIT
TRIPOD TO FOLLOW WING SURFACE
CURVATURE.
AXIS OF PROBE ,
(YAW & NORMAL TRAVERs
HINGE. LINK ARM --TRIPOD FRONT LEGS.
4 5°.
INCLINED HI NGE ( rT POD CARRIAGE
[TRIPOD REAR LE% . WHEEL .
REACH ARM .
36. THREE TUBE YAWMETER.
FIG.3c. PLAN VIEW OF TRIPOD SUPPORT FOR
BOUNDARY LAYER TRAVERSING GEAR. (DIAGRAM ONLY).
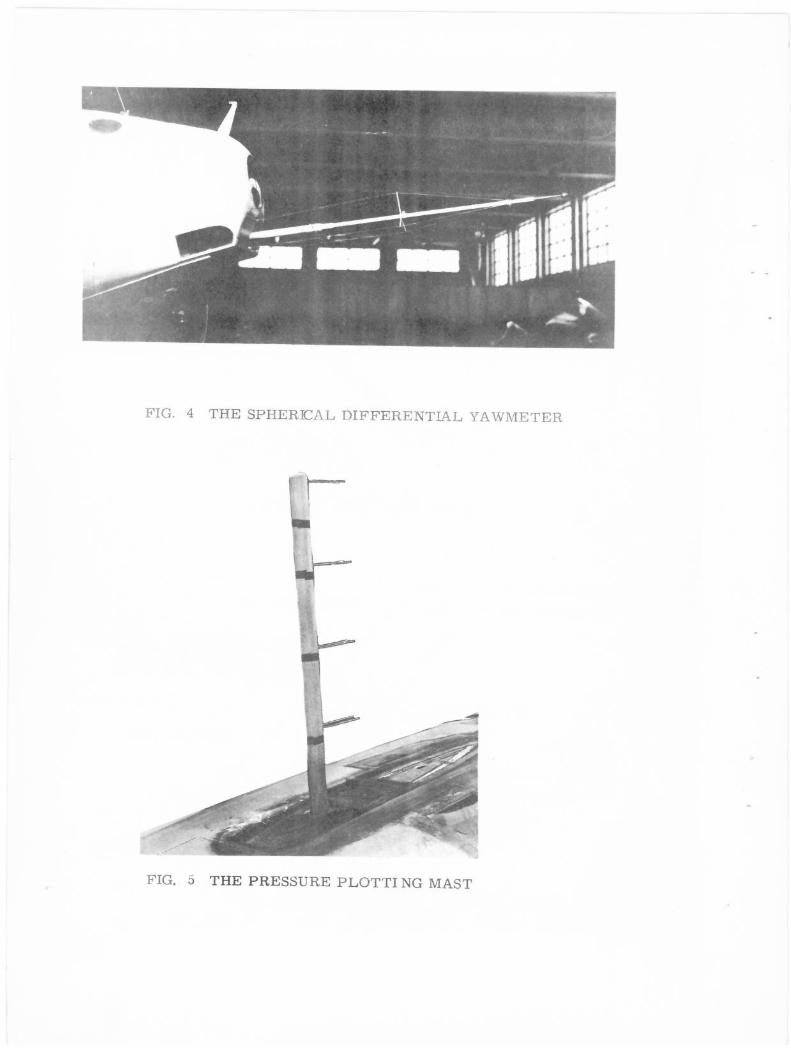
FIG. 4 THE SPHERICAL DIFFERENTIAL YAWMETER
FIG, 5 THE PRESSURE PLOTTI NG MAST
FIGURES & CENTRE LINES - - - - - - -- DENOTE. SPANWISE. STATIONS ALONG WHICH CREEPER TRAVERSES WERE MADE.
SURFACE. PITOTS Al- STATIONS: S.
CREEPER HERDS AT STATIONS: 2,5,53
3 ROWS OF STATIC PRESSURE TAPPINGS (ON OPPOSITE_ SURFACE OF WING TO THAT SHOWN) AT CENTRES AS GIVEN IN T AESLE .1 .
FIG to GENERAL ARRANGEMENT OF SWEPT BACK WING.
LEADING E GE.1 y ACTUAL WING SECTION.
A
/EFFECTIVE WING SEC:i SON.
A
4 (NomINAL).
751 (NOMINAL. • SECTION ON L.H.S. OF AA : SEMI - ELLIPSE ; NIFIS0R , AVIS 60, MINOR AXIS
SECTION ON R.H.S. OF AR: SEMI-ELLIPSE, MA7OR Axis , MINOR AVIS kr
LEADING EDGE. NOSE RADIUS;
PIG .7 SECTION OF SWEPT WING.
Z ROWS OF STATIC PRESSURE. TAPPINGS IN SWEPT WING ON CENTRE LINES SHOWN
eTh
0
FOUR PAIRS OF PITOT & STATIC TUBES ON MAST.
I 7.
BOUNOAR V LAVER FENCE.
RCRAFT FUSE LAGS TOP
74:
FIG. 8 . RELATIVE POSITIONS OF PRESSURE PLOTTING MAST & WING.
DIST.K. or -Wag ceweler_s TIMM
FIG. 9. GENERAL DIMENSIONS OF
CREEPER HEAD.
71,11•3 1.41■11.
01. ..loons Or SoRIMGc pr,o 011aftVI,
FIG. 10. SURFACE PITOT & SURFACE
STATIC TUBES.
0.
FIG. 11. THE CREEPER HEAD
0 0 50" roo" SCALE.
FIG. 12. SURFACE PITOT TUBE ORIFICE
4
6
A Naga OF WNW. ocrati.e..04).
FIG.14 CALIBRATION CURVE FOR DIFFERENTIAL YAWMETER.
0.6 SSSSS Fr ra ENTI AL) COEFFICIENT. Op.
S
4
001111011-Tr.0 MCC 1W1114L1/011 CNN P4A1G 14tIk0.
1110e.14 ES Or MEMAYLATIL0 ■1.11C1TILL
1 1
to EL. *ICH ES Of
101.710.1.0.-rE0 SPIRIT.
I
1-6
1-4
I.
FO
04 ►
--4
04
0,2
0 0 2-0 4-0 fro e-o 10.0 12.0 14-O.
UN CATZ 0 ImiNAMIC HE Pm
04014E0 OF MET-Hy sarrEiD 1S PI Iti-rit .
FIG. 13 STATIC POSITION ERROR CORRECTION FOR ANSON G-AIPC.
14
12_
10
4
0
PRESSURE. COEFFICIENT. C - a30
-0
020
015
010 10 20 30 40
EFFECTIVE CHORD.
MID SEMI SPAN STATION .
PRESSURE COEFFICIENT. Cp.
0
10 20 30 40
% EFFECTIVE CHORD.
WING TIP STATION.
PRESSURE COE FFICIENT. C.
7s10..
A-8
,c, a.. 4x10 (ad ,.P).
K, .4 sx± et-
v___v r.
1i... s.to° 0..._n r.. 5“0°.
111111iirl_ NM
11=11111.1
-0-0 lz. 6•'04
, mum •111011111101/11111111111/AMINI
_..... --"••••IIIIIIIIIIIIIIIIN –.--..,
. ' ° 111111110.11111ft Iliiirra.—
inimium
r•MILIMIIIMI -„,,IPUIMENIMI
0
10
20 30 40-
EFFECTIVE CHORD. WING ROOT STATION.
FIG. 15. STATIC PRESSURE FIELD OVER AIRCRAFT FUSELAGE ALONG THE LINES OF THE STATIC TAPP/ NGS IN SWEPT WING.
- 0
-035
-030
-02
-0
- 0.1S
i E )--c) a = d
Anrint CC = 2!
0--PO cc =4°
0-0 oc ---- e 1,7■V• O( — 2,
4:5-41oc, = Z.
11.111Nrir.- u s
s. 0....im•Illiwywas 11.1=17 ---
e .4
s IS . S . prIP
.;mill• WOO
A
0
30
ra•=MONOINN~II '--
• •••••• ra . fi L s I_ S .
oI
0
p.a..- •
• - 0
I 0
l_A__—.Cf--.--.------".'CC------
20 4-
PERCENTAGE EFFECTIVE CI-
1
3o STATIC PRESSURE COEFFICIENT. Cp.
-
-1.0
0
+1.0
D
40R D.
U.S. DENOTES UPPER SURFACE. L. S. DENOTES LOWER SURFACE .
FIG.16. STATIC PRESSURE DISTRIBUTION OVER SWEPT WING AT ROOT STATION . UPPER & LOWER SURFACES R 4-x106 — 8 x
+1-0
_0 STATIC PRESSURE COEFFICIENT. C
2-0
20 30. 40
PEWCENTRGE EFFECTIVE CHORD-
FIG. 17. STATIC PRESSURE DISTRI BUTTON OVER SWEPT WING AT MiD SEMI—SPAN STATION. UPPER & LOWER SURFACES . Re — .41-x 106 —Bx 106.
—
STATIC PRESSURE COEFFICIENT. C.
c)--o or. = 6
b---A = VI cc
‘a 0— a =
v—v oC = S:r
ci—ef rx. =10 0-0 oc --=-4
o
A
..----awatninsmomm arz
u.s. illro...._
u. . ME 'di ■■■—
. —
0
6 '
4 A w L S
11....."—
to ao 30 4C
PERCENTAGE EFFECTIVE CHOR1
DENOTES UPPER SURFACE.. L S. DENOTES LOWER SUR.FRCE,
FIG. 18. STATIC PRESSURE DISTRIBUTION OVER SWEPT WING AT TIP STATION . UPPER & LOWER SURFACES. R, = 4x1e - Sx 106.
0
+1-0
MIII slid 4 IMM
11NH Wm "IN
MarroOdrAr F A ElhErjedi
0
14111 gH WAN
NW 41
MEOW MINSEIWAN •
..31Linallimill
WAN FM
'iNii MN= EMEM
MEM • • immommi EautommEra.
MID
SEM
I-S
PA
N ST
A7
ION
,
•Lt
WIT
H I
NC
IDE
NC
E
FIG
.20.V
AIZ
IAT
ION
OF
CH
OR
DW
ISE
LIF
T DIS
TR
IBUT
ION
pW
MI 0
VA
RIA
TIO
N OF
CH
OR
DW
ISE
LIF
T D
IST
RIB
UT
ION
W
ING
RO
OT
❑
WIT
H IN
CID
EN
CE
0
LI
nnn
9
WIT
H IN
CID
EN
CE
11
0
r
a rn
1 z —•1 CP
A.1
10013
A
0
9
0
9 CP
St/
S
31
13
02i
d
0 0 0 0
z
74 a
z
z
-n I
ST
AT
ION
: MID
toEM
I— Si
■ PA
a
LI 6.)
ST
AT
ION
: MID
SE
MI—
SP
AN
' 53
1-17
N 1
'30
1113
sns
oB
07
s
00
0-•
• Cc
C. 1
O
0
0
TRANIETION SS ORIIIRMEORD RV
POMP= 5,707 occults Kr %PSC&
,OR TIE M10 KIM-SPAK STATION. -ORE =a3
Bwrn cm aI.
. CREEPER HERO ST TR. • CREEPER HERS AT ROOT ETAT tan. lo eRammeR WA° AT MID ELM,
EIMEL
0
0
O z 0-4 ID
/if" `ND.
01
FIG.24 BOUNDARY LAYER VELOCITY
PROFILES FROM CREEPER HEAD
MEASUREMENTS AT THE MID SEMI -
SPAN STATION & AT •Xic 5 40%. Re 7 x 10⁶
SOU.SARY LANES :01.101414CSS
0041./AUREM
.__.__. .. 0• 1
UPPER SURFACE. .—_,_ A = V ... .„.. , . r ,3.ER SURFACE
h
s
: FLAT O_Ptg V s■O --I
....
i
CREEPER 64E50 RESLII_TE.-........,... 74,0 assa - si/AN ETAT.... J-
_
; .
.-
- -
-I- P.SAA-IAL11110.4 - laAJPER 1.#13 .. 4 , AT EEOC p.0200pec (FROM RR,.
10
RO So AO SO- % 05550710 0-1.1050
FIG. 26 GROWTH OF THE LAMINAR BOUNDARY
LAYER ALONG THE WING CHORD AT THE MID SEMI SPAN R = 4 x IO4
U4
0.1
0 •
13
Of
114
0-3
0
O
01STAPICR FROM VANS SURFACE. IMC-14ES•
FIG. 23 LAMINAR BOUNDARY LAYER
VELOCITY PROFILES AT CONSTANT
REYNOLDS NUMBER ( Re 4 x 10⁶ ) AND
INCIDENCE (0( - 00) AS OBTAINED BY CREEPER HEAD MEASUREMENTS.
CeSTARCE PROM WINE SURFACE. tSICASS
• • •7 •—•---• • e UPPER 110■WF001. A- A-..-•5
0--e•—•
a =t LOWER SURFACE
0- mS' UP•RIE SURFACE
— na...-b--S1 A = 4" LOWER SURFACE.
5--01-0 % • € ••••• SURFACE.
,.....-7.---.1.. U .. ‘LOWERSURFACs.
4
*--4--5 le ..L11,11.Elt SUR-PACS.
S-. S K. fe U3 wall fORPACP_
0-1.-0 OL . KrUPPER Sup3-pc0_
— • - - 4.--P,- -A x= ,e,awaaaucFPLE
R -7,10.. I 1
CUOROWSE aCIATIat. ; .07. MID fliam:EPAS 6Tort0 A . A UPPER SURFACE -
1.01,11R SuRFAOS 1116 .4pArilf MAMA
Pr ,
L
Mir
0 a
1.D
31370.7.0S FROM 6005 SURFACE .1110.1E%
T --T
._..._„.._„, v.
...-4,1CP ‘04:•RA SuRPACE.
..........—
- ...---0-0 • • - E-• -43
- 4.-- ..a
• --.4.--•
S--i---•
-Er- - 4
P-
- ..--..."--0
lip
1.---,•-•-••
..___..p.___1.
A--
r., • 4.4•6. LaweR SURFACE.
P...4-6.CkU•PSE 60E0W-f.
Pte.-504.00SE 5uE006E
p...E. Lot UPPER SURFACE_
,---- 0—*-5
11--
E...g, • 03P,..1 F SURFACE
14.4..e. uPolsc *WHAM.
R. - a • 0 Lo....* suRFACE.
R. = 7=I,1 UPPER SUSFACII
14 .1.0. Le.. ER SURFACE
,.. ...oat UPPER NJErACEL.
R. -Es es.0...E.R SURFACE.
_ .4 offea.,SE PoSiT.074
MID : 4 0 r
STATLON. Pi i 0.CaMLNCIL t c • 41'
.._ WeilA
Wrilig
maw krLOw
• at W 06 at••
FIG. 25 BOUNDARY LAYER VELOCITY
PROFILES FROM CREEPER HEAD MEASUREMENTS AT THE MID SEMI-
SPAN STATION . & AT xic 0% 14 6c.
SURIPCIN-
TOTE0- HOMO EHTHECT,074 AN
Po
20 b 40
t ErracTive
FIG. 27 SPECIMEN CURVE SHOWING VARIATION IN TOTAL HEAD .
AT WING SURFACE WITH CHORDWME. Poz,rTION, TRANSITION
FROM LAMINAR TO TURBULENT FLOW IS INDICATED BY
THE WELL DEFINED CHANGE IN TOTAL HERD.
TOT AL HEAD. VARIATION. AN, _ , r
I
L mr!IIVI.1,47C15
T
Pl.s _.-------4. --
1---------4--
/ ----`
1
1
TsamsTrieft tiolicETE C SE THE liARJCVS■ AND TOTAL HEAD
0 10 20 30 40. PERCENTAGE EFFECTIVE CHORD.
FIGZELSPECIMEN CURVES SHOWING CHOROWISE
JAKIATION OF TOTAL HEAD AT THE WING SURFACE
FOR VARIOUS SPANWISE STATIONS . O -.4*. 14-7ve. 1./ ,-PER SURFACE OF WING.
TOTAL HEAD VARIATION. 0.K.
I 1 I AN, tk. INETIV,I,Ct,t3 EPHETTS.
51.2~18E TTETIDEI NV
/4. li
gli
I 0 yr.
In H..2, ■T=MMI.11
1 r . '-714.021710.• EID.CRTED oi, 1.2 4L. IHAIrESO CA-HOHGE 1N 7 or A , HC
--11
1 5•10 6.10 7•1 e•
REYNOLDS NUMBER .
FIG 29. SPECIMEN CURVES SHOWING VARIATION OF TOTAL
HEAD AT THE WING SURFACE AT DIFFERENT SPANWISE
STATIONS WITH VARIATION IN R. .FOR CONSTANT 0C-i
& CHORDWISE POSITION . LOWER SURFACE OF WING. SURFACE PITOT TUBES AT 25t.- 257..
4.10
KEY.
O 0 Pc= 4s 10.
. It.w- 4-3 lOt
_ -43 5
K.. 46 • 104.
pe. 7 a IOO
— — — ga = $ a 106
10 20 30 40.
PERCENTAGE EFFECTIVE CHORD.
10 20 30 40.
PERCENTAGE EFFECTIVE CHORD.
FIG.30.VARIATION OF TRANSITION POSITION WITH REYNOLDS
NUMBER & INCIDENCE . UPPER & LOWER SURFACES. INCIDENCE: (X=0°.
0 10
KEY.
o 0 Rex .41e !Qt.
ty — — - R.= 4-5 1.10!
30 40 PERCENTAGE. EFFECTIVE CHORD.
Irit. to`.
0 ce. said':
-9 Re =7 It i0`
ef- -ef w, -
10 20 30
PERCENTAGE EFFECTIVE CHORD.
FIG.3I . VARIATION OF TRANSITION POSITION WITH REYNOLDS NUMBER & INCIDENCE . UPPER SURFACE OF WING. INCIDENCE : DC =2'
20 30 40. PERCENTAGE EFFECTIVE CHORD.
10 20 30 40 PERCENTAGE EFFECTIVE CHORD.
FIG .32. VARIATION OF TRANSITION POSITION WITH REYNOLDS NUMBER & INCIDENCE. LOWER SURFACE OF WING. INCIDENCE: V=-2*.
KEY.
0 41- X 104.
,s_•_•_ ..,s .5.106.
a- - - - - -la Rya 5`
= 6.104.
= 7 x 10⁴.
B.106
10 20 30 40. PERCENTAGE EFFECTIVE. CHORD.
Io 20 30 40 PERCENTAGE EFFECTIVE CHORD.
FIG.33. VARIATION OF TRANSITION POSITION WITH REYNOLDS
NUMBER & INCIDENCE. UPPER SURFACE OF WING. INCIDENCE: 0C- 4°.
• 4
4.5..10
CI!
o... o‘.
to— — =s9. lot
10 20 30 40. PERCENTAGE EFFECTIVE CHORD.
FIG.34. VARIATION OF TRANSITION POSITION WITH REYNOLDS NUMBER & INCIDENCE. LOWER SURFACE OF WING. INCIDENCE: OC-4.
tk_. . Re= 4.5. le
Re'5 le.
R,_ 6.10;
KEY.
= 7. 104.
R1 8 .104
30 40 PERCENTAGE EFFECTIVE CHORD.
0
10 20 30 40 PERCENTAGE EFFECTIVE CHORD.
FIG.35. VARIATION OF TRANSITION POSITION WITH REYNOLDS
NUMBER & INCIDENCE . UPPER SURFACE OF WING. INCIDENCE: 04=4.
10 20 30 40. PERCENTAGE EFFECTIVE CHORD.
10 20 30 40 .
PERCENTAGE EFFECTIVE CHORD.
- • -
R. m. 8 .1 ICJ!
FIG.36. VARIATION OF TRANSITION POSITION WITH REYNOLDS
a NUMBER & INCIDENCE. LOWER SURFACE OF WING. INCIDENCE: et= b.
KEY.
04:
Ire = .10
S..34
0 0 E. = 4.104.
— 7.1o4
b- b R.=9.104.
I0 20 30 40 PERCENTAGE EFFECTIVE CHORD.
10 20 30 40. PERCENTAGE EFFECTIVE CHORD.
FIG.37. VARIATION OF TRANSITION POSITION WITH REYNOLDS
NUMBER & INCIDENCE . UPPER SURFACE OF WING. INCIDENCE : 104
10 2.0 ZO 40 PERCENTAGE. EFFECTIVE CORD.
1 ❑ 20 30 40 PERCENTAGE EFFECTIVE CI-IORD.
FIG.3S. VARIATION OF TRANSITION POSITION WITH REYNOLDS
° NUMBER & INCIDENCE. LOWER SURFACE. OF WING. INCIDENCE: (X=S.
RC = kob. 0-
7 x c-14.
KEY.
10 20 30 40 PERCENTAGE EFFECTIVE CHORD.
10 20 30 40 PERCENTAGE EFFECTIVE CHORD.
Re =ex 'P.
FiG.39. VARIATION OF TRANSITION POSITION WITH REYNOLDS
NUMBER & INCIDENCE . UPPER SURFACE OF WING. INCIDENCE: 0( =10.
KEY,
0 0 Re =4x10
;0!
Re= 5A106.
R... 6.106
= 7x 10! V- • —
10 20 ao 40 PERCENTAGE EFFECTIVE CHORD.
20 30 40. PERCENTAGE EFFECTIVE CHORD.
FIG.40. VARIATION OF TRANSITION POSITION WITH REYNOLDS ° NUMBER & INCIDENCE. LOWER SURFACE OF WING. INCIDENCE: CX=I0.
50
40
30
30
10
0
TRANSITION POSITION EFFECTIVE CHORD.
hiii.... .
Ile° '4"1114
0-0 a= o
0-0 9L 4°
0-0 - e I:Cl St ..e
ili
;sump ,..__ --omm—mr■.....,:_. .
MIN•muro■111=1110.
4 5 6 7
REYNOLDS NUMBER +e
UPPER SURFACE.
TRANSITION POSITION. EFFECTIVE CHORD. il ::::::::::::. Rum olk z_ENN
,„........, 4 5 6 7
REYNOLDS NUMBER -le
LOWER SURFACE.
FIG. 4-1. THE EFFECT OF REYNOLDS
NUMBER ON TRANSITION POSITION .
TRANSITION POSITION Z EFFECTIVE CHORD. L,
lle v 5- 4 d5
ir. - L SKIe•—■ dA Err
Al
alk\\I: ;
° Re = 5.10 .
1_01.4 ER SURFACE . I
20 Millht ma
7 ,_ 7 . ic16
—'. . R. - ca..).
.■- ....0.0).■, ...____.a..
p•Pro 1011111111. =•-•—•--......_
. UPPER SURFACF.
\\,
N 10
4 a O
2
8 10
I NCIDENC.E :
FIG.42. THE EFFECT OF INCIDENCE ON TRANSITION POSITION.