2Q17 UNITED STATES MULTIHOUSING MARKET OVERVIEW...
25
MULTIHOUSING MARKET OVERVIEW 2Q17 UNITED STATES
Transcript of 2Q17 UNITED STATES MULTIHOUSING MARKET OVERVIEW...

MULTIHOUSING MARKET OVERVIEW
2Q17 UNITED STATES

2
3 Key Takeaways
4 Historical Sales Volume
5 Sales Volume Analysis
6 Top Markets by Sales Volume
7 Historical Pricing Trends
8 Cap Rates by Market
9 Capital Flow Allocation
10 Top Buyers and Sellers
11 Top Buyers by Region
12 Yield Spread
13 International Capital Overview
14 International Capital Distribution
15 Historical Rent Growth
16 Employment Growth
17 Technology Hubs
18 Historical Supply and Demand
19 New Supply Matrix
20 Rental Pricing And Momentum
21 Historical Occupancy Rate
22 Mortgage Maturities
23 Debt Outstanding
24 Lender Composition
TABLE OF CONTENTS
3
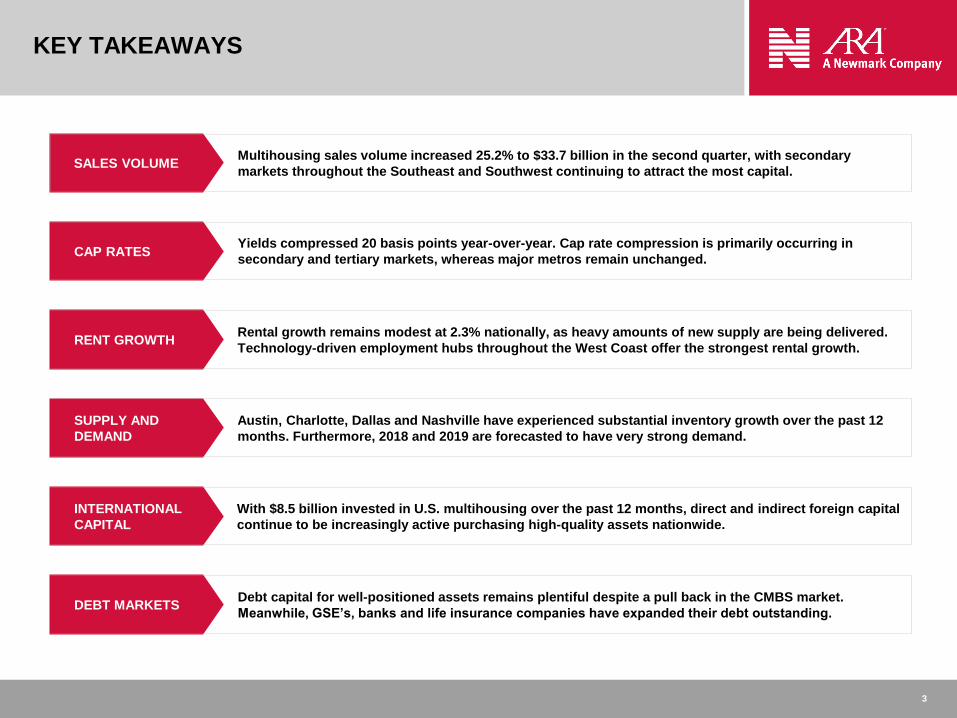
KEY TAKEAWAYS
SALES VOLUME
CAP RATES
RENT GROWTH
SUPPLY AND
DEMAND
INTERNATIONAL
CAPITAL
DEBT MARKETS
Multihousing sales volume increased 25.2% to $33.7 billion in the second quarter, with secondary
markets throughout the Southeast and Southwest continuing to attract the most capital.
Yields compressed 20 basis points year-over-year. Cap rate compression is primarily occurring in
secondary and tertiary markets, whereas major metros remain unchanged.
Rental growth remains modest at 2.3% nationally, as heavy amounts of new supply are being delivered.
Technology-driven employment hubs throughout the West Coast offer the strongest rental growth.
Austin, Charlotte, Dallas and Nashville have experienced substantial inventory growth over the past 12
months. Furthermore, 2018 and 2019 are forecasted to have very strong demand.
With $8.5 billion invested in U.S. multihousing over the past 12 months, direct and indirect foreign capital
continue to be increasingly active purchasing high-quality assets nationwide.
Debt capital for well-positioned assets remains plentiful despite a pull back in the CMBS market.
Meanwhile, GSE’s, banks and life insurance companies have expanded their debt outstanding.

4
$0
$40
$80
$120
$160
$200
2002 2003 2004 2005 2006 2007 2008 2009 2010 2011 2012 2013 2014 2015 2016 2017YTD
Billi
on
s
12-Month Totals Quarterly Totals
HISTORICAL SALES VOLUMEUnited States
After a slow start to the year, sales volume accelerated 25.2% quarter-over-quarter with 12-month volume reaching $144.6 billion.
Source: Newmark Knight Frank Research, Real Capital Analytics
2Q17
$33.7B
5
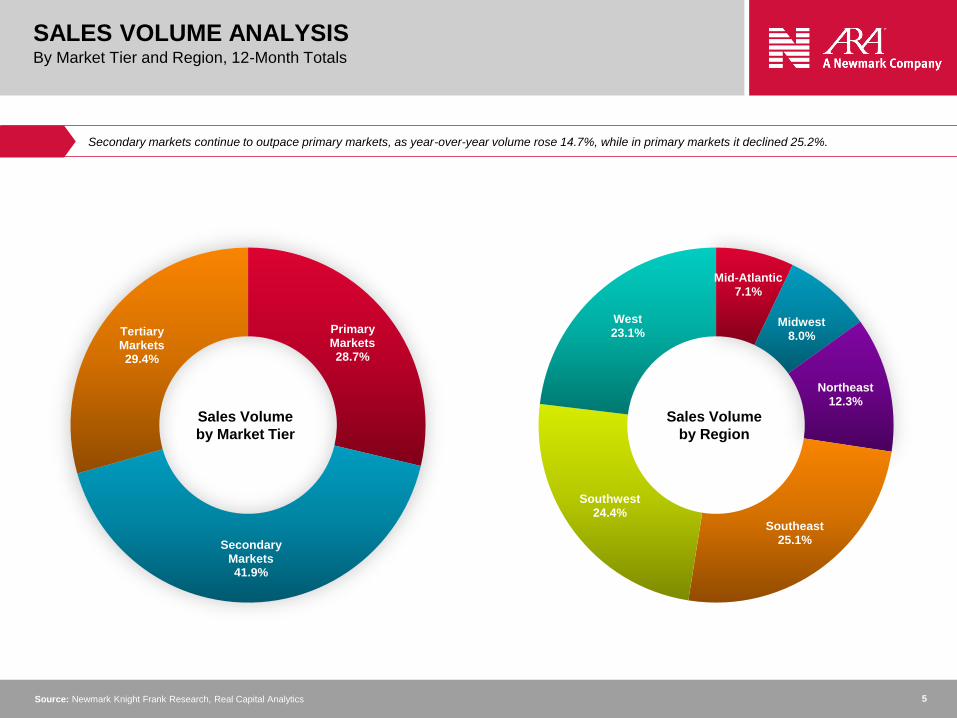
Primary Markets28.7%
Secondary Markets41.9%
Tertiary Markets29.4%
Mid-Atlantic7.1%
Midwest8.0%
Northeast12.3%
Southeast25.1%
Southwest24.4%
West23.1%
Sales Volume
by Market Tier
Sales Volume
by Region
SALES VOLUME ANALYSISBy Market Tier and Region, 12-Month Totals
Secondary markets continue to outpace primary markets, as year-over-year volume rose 14.7%, while in primary markets it declined 25.2%.
Source: Newmark Knight Frank Research, Real Capital Analytics

6
$14.4
$11.3
$8.9
$8.2
$5.4
$5.4
$5.3
$5.1
$4.6
$4.6
$4.1
$3.7
$3.6
$3.2
$2.7
$2.7
$2.6
$2.4
$2.3
$2.3
$2.0
$1.9
$1.7
$1.4
$1.3
$0 $3 $6 $9 $12 $15Billions
Minneapolis
Nashville
Raleigh-Durham
Baltimore
San Antonio
Las Vegas
Charlotte
San Diego
Boston
Tampa
Portland
Orlando
South Florida Metro
Austin
Chicago
Phoenix
Houston
Washington, D.C. Metro
San Francisco Metro
Seattle
Denver
Dallas-Forth Worth
Atlanta
Los Angeles Metro
New York City Metro
South Florida Metro
Miami $1.6 B
Broward $1.2 B
Palm Beach $841.5 M
Washington, D.C. Metro
Suburban MD $2.3 B
Northern VA $2.2 B
District of Columbia $624.8 M
San Francisco Metro
Oakland $1.8 B
San Francisco $1.6 B
San Jose $1.3 B
Other $720.5 M
Los Angeles Metro
Los Angeles $6.9 B
Orange County $1.9 B
Inland Empire $1.8 B
Other $712.0 M
New York City Metro
Manhattan $6.0 B
Outer Boroughs $4.4 B
Northern NJ $2.3 B
Other $1.7 B
TOP MARKETS BY SALES VOLUME12-Month Totals
Despite a national slowdown, top-tier secondary markets such as Austin, Dallas and Orlando had record first half sales volume.
Source: Newmark Knight Frank Research, Real Capital Analytics

7
$0
$30,000
$60,000
$90,000
$120,000
$150,000
0%
2%
4%
6%
8%
10%
2002 2003 2004 2005 2006 2007 2008 2009 2010 2011 2012 2013 2014 2015 2016 2017YTD
Pri
ce
Pe
r U
nit
Cap
Ra
tes
Price Per Unit Cap Rates
HISTORICAL PRICING TRENDSUnited States
Cap rates compressed 20 basis points year-over-year, while price per unit increased 6.0% to an all-time high of $140,217.
Source: Newmark Knight Frank Research, Real Capital Analytics ($25M+ Transactions)
8
San Francisco
Manhattan
Boston
Washington DC
Philadelphia
Raleigh-Durham
Charlotte
Jacksonville
Orlando
South Florida
Tampa
AtlantaCharleston
Chicago
Indianapolis
Houston
Seattle
Austin
Dallas
Portland
Sacramento
Los Angeles
San Diego
San Jose
Las Vegas
Phoenix
San Antonio
Denver Kansas City
St. Louis
Oklahoma City
Wichita
Minneapolis
Nashville
MemphisTulsa
Columbus
Louisville
Detroit
BirminghamLittle Rock
Salt Lake City
5.0%
3.8%
5.5%
5.4%
5.3%
5.4%
5.5%
5.5%
5.6%
5.1%
5.5%
5.7%
6.1%
5.4%
5.9%
5.5%
5.7%6.0%
5.0%
3.0-3.9%
5.8%
5.5%
5.7%5.9%
5.7%
6.1%
5.1%
5.6%
5.4%
5.3%
5.4%
5.2%
5.5%
5.4%
5.5%
4.8%
4.9%
5.2%
4.0%
4.9%
4.7%
4.8%
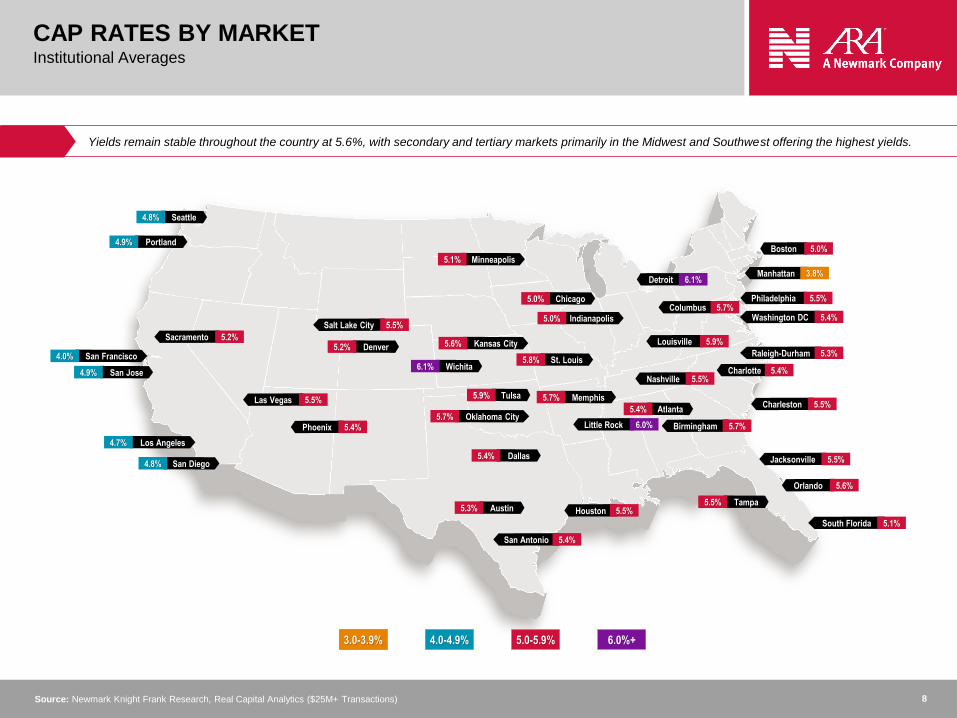
CAP RATES BY MARKETInstitutional Averages
5.0%
4.0-4.9% 5.0-5.9% 6.0%+
Yields remain stable throughout the country at 5.6%, with secondary and tertiary markets primarily in the Midwest and Southwest offering the highest yields.
Source: Newmark Knight Frank Research, Real Capital Analytics ($25M+ Transactions)

9
50%
60%
70%
80%
90%
100%
10%
15%
20%
25%
30%
35%
2001 2002 2003 2004 2005 2006 2007 2008 2009 2010 2011 2012 2013 2014 2015 2016 2017-YTD
All
Pro
pe
rty T
yp
es
(e
x-M
ult
iho
us
ing
)
Mu
ltih
ou
sin
g
All Property Types (ex-Multihousing) Multihousing
CAPITAL FLOW ALLOCATIONVolume As A Percentage of Investment Sales
Since 2001, investors have increased their allocations to multihousing from 23.2% to 29.4%, growing at a quicker pace than all other property types.
Source: Newmark Knight Frank Research, Real Capital Analytics

10
$713.1
$731.1
$739.9
$739.9
$768.3
$789.6
$807.7
$822.5
$856.5
$917.3
$955.0
$955.0
$955.0
$1,035.9
$1,043.9
$1,142.7
$1,229.0
$3,242.5
$3,825.2
$4,165.3
Invesco
Strata Equity Group
TruAmerica Multifamily
Guardian Life Insurance
Investcorp
Carroll Organization
FPA Multifamily
Kennedy Wilson
BH Management
Harbor Group Int'l
GIC
Scion Group
CPP Investment Board
Cortland Partners
Mapletree Investments
Greystar
Rockpoint Group
Blackstone
Starwood Capital
MAA REIT
$831.7
$836.0
$858.7
$882.6
$890.3
$894.9
$968.0
$987.8
$1,018.9
$1,031.8
$1,061.1
$1,133.5
$1,323.0
$1,338.1
$1,415.1
$1,422.0
$1,498.9
$1,521.3
$3,028.5
$3,751.8
Trammell Crow
Lennar Corporation
AvalonBay
FPA Multifamily
Holland Partners
Alliance Residential
DRA Advisors
Ares Management
Kayne Anderson
Bascom Group
Harbor Group Int'l
Greystar
Investors Management
Starwood Capital
Blackstone
Waterton Associates
Bridge Investment
Fairfield Residential
Milestone APTS REIT
Post Properties
Top 20 Buyers$ in Millions
Top 20 Sellers$ in Millions
TOP BUYERS AND SELLERSUnited States; 12-Month Totals
Starwood Capital became the second-largest buyer of the past 12 months with its acquisition of Milestone for $3.0 billion during the second quarter.
Source: Newmark Knight Frank Research, Real Capital Analytics
11
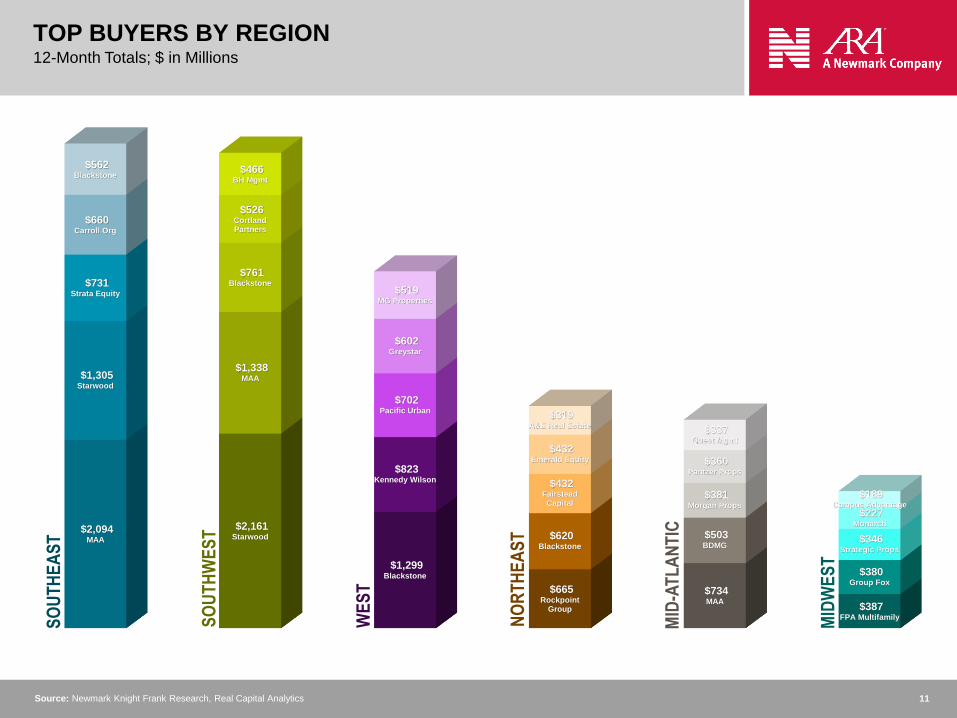
$2,094 MAA
$2,161 Starwood
$1,299 Blackstone
$665 Rockpoint
Group
$734 MAA
$387 FPA Multifamily
$1,305 Starwood
$1,338 MAA
$823 Kennedy Wilson
$620 Blackstone
$503 BDMG
$380 Group Fox
$731 Strata Equity
$761 Blackstone
$702 Pacific Urban
$432 Fairstead
Capital$381
Morgan Props
$346 Strategic Props
$660 Carroll Org
$526 CortlandPartners
$602 Greystar
$432 Emerald Equity $360
Pantzer Props
$227 Monarch
$562 Blackstone
$466 BH Mgmt
$519 MG Properties
$319 A&E Real Estate $337
Quest Mgmt
$189 Campus Advantage
SO
UT
HE
AS
T
SO
UT
HW
ES
T
WE
ST
NO
RT
HE
AS
T
MID
-AT
LA
NT
IC
MID
WE
ST
TOP BUYERS BY REGION12-Month Totals; $ in Millions
Source: Newmark Knight Frank Research, Real Capital Analytics

12
0
100
200
300
400
500
0%
2%
4%
6%
8%
10%
2002 2003 2004 2005 2006 2007 2008 2009 2010 2011 2012 2013 2014 2015 2016 2017YTD
Sp
rea
d (
BP
S)
Cap
Ra
tes
& T
rea
su
ry N
ote
Yield Spread Multihousing Cap Rates 10-Year Treasury Rate
YIELD SPREADMultihousing Cap Rates vs. the 10-Year Treasury Note
The 10-year Treasury note has stabilized since the election results. However, the yield spread is now at its lowest level since 2011 at 329 basis points.
Source: Newmark Knight Frank Research, Federal Reserve Bank of St. Louis, Real Capital Analytics ($25M+ Transactions)

13
Canada42.7%
Singapore23.6%
Israel10.4%
France6.8%
Kuwait4.9%
Germany4.0%
Sweden2.4%
UK2.3%
Other2.9%
Land & Houses PLC
THAILAND
Stoneweg SA
Varia US Properties
SWITZERLAND
GIC
Mapletree Investments
SINGAPORE
Amitim
Electra Ltd
Menora Mivtachim
Psagot
Sage Equities
ISRAEL
AXA Group
CAPSSA
FRANCE
Jamestown
GERMANY
Wafra
KUWAIT
Akelius Residential AB
SWEDEN
Top Buyers ($100M+)Top Countries of Origin
Balfour Beatty
UK
Bentall Kennedy
Brookfield Asset Management
CPP Investment Board
Emma Capital
H&R REIT
Manulife Financial
Milestone Apartment REIT
Morguard NA Residential REIT
Pure Multi-Family REIT
Starlight Investments
Venterra Properties
Western Wealth Capital
CANADA
INTERNATIONAL CAPITAL OVERVIEWTop Buyers and Countries of Origin; 12-Month Totals
Recent portfolio transactions in the student housing market pushed Singapore to the second-largest buyer behind Canada for the past 12 months.
Source: Newmark Knight Frank Research, Real Capital Analytics

14
MAJOR MARKETS 38.3%
BY MARKET TIERAs a % of Cross-Border Capital
BY REGIONAs a % of Cross-Border Capital
SECONDARY & TERTIARY 61.7%
MID-ATLATNIC 11.1%
MIDWEST 5.8%
NORTHEAST 14.8%
SOUTHEAST 33.9%
SOUTHWEST 25.2%
WEST 9.2%
NYC$910M
ATL$630M
AUS$445M
DEN$391M
S. FL$267M
ORL$245M
TB$157M
BOS$227M
LA$195M
CHA$189M
PHX$153M
POR$127M
CHI$108M
DC$100M
SEA$82M
LV$54M
NASH$47M
DFW$350M
INTERNATIONAL CAPITAL DISTRIBUTIONTop Destinations; 12-Month Totals
With nearly $8.5 billion invested over the past 12 months, overseas investors are mainly acquiring assets in secondary markets of the Southeast and Southwest.
Source: Newmark Knight Frank Research, Real Capital Analytics

15
-10%
-6%
-2%
2%
6%
10%
$0
$300
$600
$900
$1,200
$1,500
2006 2007 2008 2009 2010 2011 2012 2013 2014 2015 2016 2017
Eff
ec
tive
Ren
t G
row
th
Eff
ec
tive
Ren
t
Effective Rent Effective Rent Growth
HISTORICAL RENT GROWTHAnnual Effective Rent
Rent growth for 2Q17 was 2.3%. While more modest than in previous years, growth remains near long-term averages and is still trending in a positive direction.
Source: Newmark Knight Frank Research, Axiometrics

16Source: Newmark Knight Frank Research, U.S. Bureau of Labor Statistics (June release)
ORL
+4.0%
LV
+3.7%
JAX
+3.6%
NASH
+3.6%
TB
+3.6%
ATL
+3.5%
DFW
+3.3%
MINN
+3.3%
MIA
+3.3%
SLC
+3.2%
IND
+3.1%
PHX
+3.0%
R-D
+3.0%
CHA
+2.9%
AUS
+2.8%
DEN
+2.6%
POR
+2.5%
SEA
+2.5%
CHI
+1.3%
STL
+1.2%
BIRM
+1.3%LA
+1.7%
SAC
+1.9%
OKC
+1.9%
HOU
+1.9%
SD
+2.0%
KC
+2.2%
DET
+2.2%
DC
+1.8%
NYC
+1.8%
BOS
+2.4%
PHI
+2.1%SF
+2.4%
SJ
+1.6% MEM
+2.1%
SA
+2.4%
COL
+2.0%
CLE
+2.0%
EMPLOYMENT GROWTHYear-over-Year Change
Employment growth remains positive nationwide with robust growth Atlanta, Florida, Las Vegas and Nashville strengthening demand for multihousing.

17
18.1%
14.5%
23.0%
29.8%
21.5%
32.2%
16.5%
38.3%
25.3%
33.3%
18.1%
20.5%
25.4% 25.5%
28.6%
32.4%
0%
10%
20%
30%
40%
50%
2013 2014 2015 2016 2017
TECHNOLOGY HUBSRental Growth; Past 5 Years
The majority of technology-centric employment hubs have significantly outpaced the national average for rental growth of 17.5% over the past five years.
Source: Newmark Knight Frank Research, Axiometrics

18
0.0%
0.5%
1.0%
1.5%
2.0%
2.5%
0
150,000
300,000
450,000
600,000
750,000
2005 2006 2007 2008 2009 2010 2011 2012 2013 2014 2015 2016 2017* 2018* 2019*
Inve
nto
ry G
row
th
New
Su
pp
ly &
Ab
so
rpti
on
(U
nit
s)
New Supply Absorption Inventory Growth
HISTORICAL SUPPLY AND DEMANDUnited States
Although supply has outpaced demand for the past two years, strong absorption is anticipated with less new product coming to market in 2018 and 2019.
Source: Newmark Knight Frank Research, Axiometrics

19
SAC
SLC
SEA
ORL
SD
LV
PHX
LA
MINN
ATL
JAX
R-D
DEN CHA
DFW
MEM
IND
TBPOR
MIABOS
KC
SA
DC
SJ
NASH
SF
CHI
PHI
STL
AUS
NYC
OKC
HOU
0
5,000
10,000
15,000
20,000
25,000
30,000
0% 1% 2% 3% 4% 5%
New
Su
pp
ly (
Un
its
)
Inventory Growth
Inventory in Dallas, Austin, Nashville and Charlotte is growing at twice the pace over the trailing 12 months as the national average of 1.5%.
Source: Newmark Knight Frank Research, Axiometrics
NEW SUPPLY MATRIX12-Month Totals

20
$1.1
0
$1.3
8
$2.5
6
$1.1
0
$1.9
2
$1.3
0
$1.6
2
$1.1
8
$1.0
1
$2.6
1
$1.7
3
$1.2
2
$3.5
0
$1.2
4
$1.7
2
$1.1
3
$1.6
0
$1.0
8
$1.6
3
$2.1
8
$4.1
8
$3.1
9
$2.2
2
$1.2
0
$1.9
9
3.8%
1.0%
2.0%
2.8%
1.1%
2.4% 2.5%
-2.5%
4.1%3.6%
1.8% 1.7%
-0.8%
5.1%
1.2%
4.6%
1.9%
2.9%
9.4%
4.8%
0.5%
1.9%
5.7%
2.6%
1.5%
-4%
-1%
3%
7%
10%
14%
$0
$1
$2
$3
$4
$5
Ye
ar-
ove
r-Y
ea
r R
en
tal C
ha
ng
e
Re
nt
Pe
r S
qu
are
Fo
ot
Rent Per Square Foot Year-over-Year Change
RENTAL PRICING AND MOMENTUM Top 25 Markets
Rental rates are highest in supply-constrained coastal markets with the strongest year-over-year growth in Orlando, Sacramento and Seattle.
Source: Newmark Knight Frank Research, Axiometrics

21
95.0%
91%
92%
93%
94%
95%
96%
2006 2007 2008 2009 2010 2011 2012 2013 2014 2015 2016 2017
Occupancy Rate Long-Term Average
Long-Term Average = 94.1%
HISTORICAL OCCUPANCY RATEUnited States
Strong demand nationwide has pushed the occupancy rate to 95.0%, a 40-basis-point increase over the first quarter.
Source: Newmark Knight Frank Research, Axiometrics

22
17.2 19.8 21.7 24.728.9 32.5 33.1 33.0 31.9 29.0 26.6 23.9 27.3
34.141.6
49.0
3.04.3
5.2
10.49.3
8.1 8.6 10.2 10.4 12.8 14.915.7
21.2 5.9
5.4
3.5
2.72.7
2.9
3.13.3
3.4 3.7 4.0 4.0 3.8 3.9 4.4
4.5
4.4
4.2
4.6
24.3
27.331.2
35.038.3
40.144.4
49.5 53.2 54.7 54.8 57.9
61.7
65.9
66.0
68.0
$0
$30
$60
$90
$120
$150
2005 2006 2007 2008 2009 2010 2011 2012 2013 2014 2015 2016 2017 2018 2019 2020
Billi
on
s
Banks CMBS Life Insurance Other
MORTGAGE MATURITIESBy Lender Type
Mortgage maturities are set to rise to $114.7 billion in 2017, up 12.6% from 2016, when mortgage maturities totaled $101.9 billion.
Source: Newmark Knight Frank Research, Federal Reserve Bank, Trepp

23
$0
$250
$500
$750
$1,000
$1,250
$1,500
2000 2001 2002 2003 2004 2005 2006 2007 2008 2009 2010 2011 2012 2013 2014 2015 2016 2017YTD
Mil
lio
ns
$1,213.7
Banks 35.7%
CMBS4.1%
Life Co5.6%
Others1.5%
Agency & GSE42.9%
Gov't8.6%
DEBT OUTSTANDINGUnited States
Year-over-year CMBS declined 19.7%, while agency and GSEs increased their debt outstanding 14.3%, banks by 11.4% and life insurance companies by 9.7%.
Source: Newmark Knight Frank Research, Federal Reserve Bank of St. Louis, Mortgage Bankers Associates

24
1.2% 2.1% 3.0% 1.0% 2.5% 1.0% 2.0% 3.6% 1.4%
7.2% 6.1% 3.3% 8.5% 5.1% 7.9% 5.7%6.0%
4.9%
37.3%
66.0% 71.9% 64.6%
60.9%
28.4%
72.3% 67.8%
50.0%
8.4%
7.8%3.3%
7.2%
9.0%
8.5%
6.6%7.4%
6.6%
3.5%
1.5% 0.6% 1.4%
1.3%
4.7%
1.4%1.1%
2.2%16.8%
7.9%5.3%
7.4%
7.1%
12.9%
5.5%5.8%
19.1%
24.1%
7.1%11.2%
9.1%13.4%
35.2%
4.7% 6.7%
14.2%
1.5% 1.5% 1.4% 0.8% 0.7% 1.4% 1.8% 1.6% 1.7%
0%
20%
40%
60%
80%
100%
Major Metros Secondary Markets Tertiary Markets Mid-Atlantic Midwest Northeast Southeast Southwest West
CMBS Financial Gov't Agency Insurance Int'l Bank Na'l Bank Regl/Local Bank Private/Other
LENDER COMPOSITIONUnited States; 12-Month Totals
Lending in major metros has benefitted from regional banks expanding their real estate balance sheets, while larger national banks remain more risk averse.
Source: Newmark Knight Frank Research, Real Capital Analytics

www.aranewmark.com
New York City
HEADQUARTERS
125 Park Avenue
New York, NY 10017
212.372.2000
Blake Okland
Vice Chairman, Head of US Multifamily
704.379.1987
Jonathan Mazur
Managing Director, Research
212.372.2154
Michael Wolfson
Senior Capital Markets Research Analyst
212.372.2453
Newmark Knight Frank Research Reports are also available at www.ngkf.com/research
All information contained in this publication is derived from sources that are deemed to be reliable. However, Newmark Knight Frank (NKF) has not verified any such information, and the same constitutes the statements and representations only of the source thereof, and not of NKF. Any recipient of this publication should independently verify such information and all other information that may be material to any decision that recipient may make in response to this publication, and should consult with professionals of the recipient’s choice with regard to all
aspects of that decision, including its legal, financial, and tax aspects and implications.
Any recipient of this publication may not, without the prior written approval of NKF, distribute, disseminate, publish, transmit, copy, broadcast, upload, download, or in any other way reproduce
this publication or any of the information it contains.