2Q FY 2020-21 FINANCIAL RESULTS ANALYST PRESENTATION
60
2Q FY 2020-21 FINANCIAL RESULTS – ANALYST PRESENTATION
Transcript of 2Q FY 2020-21 FINANCIAL RESULTS ANALYST PRESENTATION

2Q FY 2020-21FINANCIAL RESULTS – ANALYST PRESENTATION

Forward Looking Statement
2
This presentation contains forward-looking statements which may be identified by their use of words like
“plans,” “expects,” “will,” “anticipates,” “believes,” “intends,” “projects,” “estimates” or other words of similar
meaning. All statements that address expectations or projections about the future, including, but not limited
to, statements about the strategy for growth, product development, market position, expenditures, and
financial results, are forward-looking statements.
Forward-looking statements are based on certain assumptions and expectations of future events. The
companies referred to in this presentation cannot guarantee that these assumptions and expectations are
accurate or will be realized. The actual results, performance or achievements, could thus differ materially
from those projected in any such forward-looking statements. These companies assume no responsibility to
publicly amend, modify or revise any forward looking statements, on the basis of any subsequent
developments, information or events, or otherwise.

Consolidated Financial Results : 2Q FY21
Sharp rebound in quarterly performance; Annualized earnings at FY20 levels
➢ Strong QoQ increase in Revenues led by higher
oil prices and retail growth
➢ 85% of incremental EBITDA from Retail and Jio
➢ Net Profit up 28% QoQ
▪ Strong operational performance across all
businesses
▪ Lower interest with paydown of debt
▪ Lower tax due to reduction in the effective tax
rate for the year
3
(₹ crore) 2Q FY21 1Q FY21 2Q FY20
Change
QoQ
Change
YoY
Revenue 128,385 100,929 165,228 27.2% -22.3%
EBITDA 23,299 21,585 25,820 7.9% -9.8%
Finance Cost 6,084 6,735 5,450 -9.7% 11.6%
Depreciation 6,626 6,308 5,315 5.0% 24.7%
Tax -13 260 3,703 - -
Net Profit (Pre Exceptional) 10,602 8,282 11,352 28.0% -6.6%

Consolidated EBITDA : 2Q FY21
Strong rebound on QoQ with early signs of economic recovery
➢ Strong revival in O2C earnings with rebound in
petchem and oil product demand
▪ Strong petchem performance (volume and margin)
offset weak refining (lower middle distillate cracks
and throughput)
➢ Consumer business EBITDA up 16.5%
▪ Strong recovery in Retail with increased footfalls
and store openings
▪ Record quarterly EBITDA for Digital Services
➢ Consumer businesses now contribute 49.6% of
consolidated business segment EBITDA
4
(₹ crore) 2Q FY21 1Q FY21
Change
QoQ
R & M 3,002 3,818 -21.4%
Petrochemicals 5,964 4,430 34.6%
O2C 8,966 8,248 8.7%
Retail 2,009 1,083 85.5%
Digital Services 8,345 7,803 6.9%
Consumer 10,354 8,886 16.5%
Oil & Gas -194 -32 -
Others 4,173 4,483 -6.9%
Total 23,299 21,585 7.9%

2Q FY21 : O2C – Sharp Improvement in Key Indicators
8.7% QoQ growth in O2C EBITDA led by strong petrochemicals5
O2C - Petrochemicals
➢ QoQ polymer demand up 34%, polyester up 209% with easing of lockdowns
➢ EBITDA margin expansion by 250 bps – led by strong domestic sales and favourable light feed cracking
➢ Inventory below pre-Covid levels
O2C – R & M
➢ Domestic oil products demand up 11% QoQ with strong growth in MS, HSD and ATF
➢ Global refining margins continue to remain weak, particularly middle distillates
➢ Maintained high premium over Singapore complex margins at $ 5.7/bbl

2Q FY21 : Retail - Continuing Uptrend in Key Metrics
Sharp QoQ rebound in Retail business Revenue (+30%) and EBITDA (+85.5%)6
➢ Significant retracement of economic activity supporting growth
➢ 85% stores operational vs. 50% in 1Q FY21, with higher footfalls
➢ Added 232 new stores across formats
➢ Activity level in Retail business expected to be at pre-Covid levels in 3Q
➢ Large fund raise to strengthen capabilities for new initiatives

2Q FY21 : Digital Services - Leading Growth and Profitability
Record quarterly EBITDA (+7% QoQ) with higher ARPU and industry leading margins7
➢ India’s largest mobile subscriber base (>400 Mn)
▪ First operator outside China to have 400 Mn subscribers in a single country market
➢ Sequential improvement in ARPU at ₹ 145 vs. ₹ 140 in 1Q FY21
➢ Strong customer engagement across Mobility and FTTH services
▪ Total wireless data traffic up 20% YoY
➢ Quarterly EBITDA run rate crossed $ 1 billion

Equity Raise : Strengthened Capital Structure and Earnings
Funds received and balance capital commitments exceeds net debt level8
(₹ crore) Fund RaiseReceived till
30/09/20
Received post
30/09/20
Balance
Committments
JPL 152,056 118,319 - 33,737
RRVL 37,710 7,500 30,210 -
Rights Issue 53,124 13,275 - 39,849
RBML 7,629 7,629 - -
TOTAL 250,519 146,723 30,210 73,586
➢ Largest ever capital raise in India through rights issue and asset monetization
▪ Funds inflow of ₹ 146,723 crore reflecting in balance sheet as on 30 Sept.
▪ Inflows used entirely to retire debt and other liabilities
▪ Full benefit of lower interest cost to reflect in subsequent quarters

Robust Balance Sheet
Robust balance sheet and sustained cash flows to support future growth plans9
(in ₹ Crore) Sep-20 Mar-20
Gross Debt 279,251 336,294
Cash & cash equivalent 185,711 175,259
Fund received 3QTD 30,210
Balance Commitments 73,586
Net Debt (10,256) 161,035
➢ Market cap up >$ 100 billion (>2x) since March’20
▪ Articulation of growth plans
▪ Equity raise through rights issue, investments by strategic / financial investors
➢ RIL became the first Indian company to cross $ 200 billion market cap milestone
▪ RIL now among the Top 50 globally and Top 10 in Asia by market cap
93
20021
-
50.0
100.0
150.0
200.0
Mar'20 Sep'20
USD
bn
Market Cap Net Debt
EV:
$ 114 bn
EV:
$ 200 bn

10
Digital Services

Jio Platforms: Building Horizontal Capabilities at Scale
Deep Tech to Build Digital Platforms for a Billion Indians11
Blockchain
Artificial Intelligence
Edge Computing
Speech and Natural
Language Recognition
Deep Data Analytics
Secure Identity
Internet of Things
High end computer,
analytical tools and
simulation solutions
AI-based education
platform
AR/VR capabilities
AI/ML for speech and
language recognition
Digital initiatives in
communication and
network
AI for speech and
language recognition
Robotics and AI based
drone solutions
AI Based Fleet
Management

First Indigenous 5G RAN Product to Reach Gigabit Throughput
The Combination of Jio, Qualcomm & Intel enables technology
from Silicon - to Compute - to Storage - to RAN 12
Leading 5G in India – at Jio Scale
Leveraging the Long-standing Strategic Relationship with Qualcomm• 4G & 5G Devices • IoT • AR/MR • and now Open RAN Portfolio
RRH
BBU
Core
O-RU
Hybrid Core
Virtualized Cloud
Native CU
Virtualized Cloud
Native DU
RAN as Software
➢ Indigenously developed 5GNR Products
➢ First Gigabit RAN Product that Supports a
Disaggregated and Open Framework
➢ Performance & Quality Validated by Industry Leaders
▪ Global Technology Leader (Qualcomm)
▪ Tier1 US 5G Operator

JioMeet As A Platform
JioMeet (B2C) High Quality Video Meeting for
Everyone. Free and no limits.
JioMeet MarketplaceForum for online events, webinars, meet-
ups and talks
JioMeet ClassroomsPowering virtual classrooms for students,
teachers and educational institutions
JioMeet PaaSEasy to integrate video collaboration
capabilities into business and consumer
apps
JioMeet Pro (B2B)
Most secure and feature-rich collaboration
platform
JioMeet
JioMeet evolving as a complete platform with solutions for different segments 13

JioUPI – Pan India Rollout of BHIM UPI in MyJio
For Secure Financial Transactions and Bill Payments14
Send money
Hassle-free payments to merchants (P2M), both online and in stores, as well as peer-to-peer(P2P) to friends, family & contacts via UPI ID, QR & mobile number
Jio Recharges and Bill Payments
One click Jio Recharges and bill payments using customer's @jio UPI ID
BBPS based bill payments
One-stop shop for all bill payments powered by Bharat BillPay and NPCI
Universal QR
QR code scanner for making payments, adding contacts, opening URL and linking JioFiber accounts
Personalised experience
Personalised dashboard for every customer based on spending pattern and behaviour

JioSTB - Revolutionizing Indian Living Rooms
Health & Wellness
EducationGaming
Media
Easy Content Discovery with Multilingual Voice Enabled remote
User Specific Recommendations
Differentiated Live TV Experience
Indian Customer Focused Curated App Ecosystem
Platform Support for Multiple Languages
Targeted Promotion (App | Content | Brand)
Real Time Video communication Services
User Profiles on Platform
Real Time Analytics
Driven Services
Platform Embedded
Features
JioSTB has become the one-stop destination15

JioFiber – Broadening The Offering
Improving the value proposition; lifeline during Covid
Combined for smartphone and JioPhone users
➢Best in class bundling experience
across all major OTTs in India
➢ Further simplification of plans with
truly unlimited data experience
➢ Provides options to customers seeking
data-only services
➢ Commercial plans starting as low as
Rs399 per month
➢ Visible improvement in uptake of
homes connected
16

JioPostPaid Plus – Integrated Premium Product Offering
Targeting the lucrative and sticky postpaid base
Combined for smartphone and JioPhone users
17
➢ Industry-first bundling of Netflix,
Amazon Prime & Disney+ Hotstar
➢ In-flight services on international routes
➢Superior international service
experience (unlimited roaming in USA &
UAE)
➢Single plan for the entire family; Data
rollover
➢Premium customer service

Quarter Highlights
2. First operator outside China to cross 400 million subscribers in a single country market
▪ Total customer base of 405.6 million as of September 2020; net addition of 7.3 million in
Q2FY21
1. Robust financial performance despite Covid related challenges
▪ Quarterly EBITDA run-rate for Jio Platforms Limited crosses US$1.0 billion
3. Strong customer engagement across Mobility and FTTH services
▪ Total wireless data traffic up 20% YoY to 14.4 Exabytes
3. ARPU increases to ₹ 145 on the back of further impact of last tariff hike
4. Completion of Tower and Fibre Infrastructure Trust transactions
1
2
3
4
18
Healthy performance with continued market share gains
5

RJIL - Robust Financial Performance
Industry leading growth and profitability
➢ 33.1% YoY Revenue and 49.0% YoY EBITDA growth driven by industry leading customer traction across
segments and ARPU uplift
➢ Sustained margin improvement reinforce robustness of business fundamentals and inherent operating leverage
Operating Revenue (in Rs crore) EBITDA (in Rs crore)
19
13,130 13,968
14,835 16,557
17,481
Sep-19 Dec-19 Mar-20 Jun-20 Sep-20
5,167 5,601
6,201
7,281 7,701
Sep-19 Dec-19 Mar-20 Jun-20 Sep-20

Key Operating Metrics
➢ Net customer addition at 7.3 million
➢ Improvement in wireless gross additions, offset
partially by follow through impact of Covid on SIM
consolidation and recharge cycle of migrant
population
➢ Blended ARPU at Rs 145 was up 13.8% YoY with
continued migration to higher tariff plans
➢ Per capita wireless usage remained healthy at 12.0
GB and 776 mins per month
Strong customer engagement with ARPU uplift20

Jio Platform Limited - Key Financials
Quarterly EBITDA run-rate crosses US$1.0 billion21
➢ Revenue growth led by subscriber
addition across segments and ARPU
uplift
➢ EBITDA margin continues to improve
driving strong growth
➢ 20% Q-o-Q increase in net profit
*Gross Revenue is value of Servicesfigures in Rs crore, unless otherwise stated
Particular JPL Consolidated
2Q’ 20-21 1Q’ 20-21
Gross Revenue* 21,708 20,277
Operating Revenue 18,496 17,254
EBITDA 7,971 7,332
EBITDA Margin 43.1% 42.5%
D&A 2,910 2,776
EBIT 5,061 4,556
Finance Costs 1,024 1,170
Profit before Tax 4,037 3,386
Net Profit 3,020 2,520

Completion of InvIT Transactions
Assets to be managed by independent Investment Managers
Combined for smartphone and JioPhone users
22
➢ Brookfield Infrastructure & its institutional partners completed
investment of ₹ 25,215 crores for subscribing to units of Tower
Infrastructure Trust
➢ Investment provides strong sponsorship for the Trust
Tower InvIT
Fibre InvIT ➢ RIIHL, a subsidiary of RIL, completed the recapitalisation of the
Digital Fibre Infrastructure Trust
➢ Abu Dhabi Investment Authority and The Public Investment Fund
have purchased units of Fibre Trust worth ₹ 3,779 crore each
➢ Induction of strong partners for managing critical asset base

23
Reliance Retail

24
Quarter Highlights – 5 Key Messages
1. Operating environment in quarter improved progressively, though still lower than normative levels
2. Strong recovery in revenues with EBITDA almost doubling sequentially
3. Largest fund raise in India in consumer/retail sector from marquee global investors
4. Investing in acquisitions to strengthen capabilities for New Commerce
5. Steady progress on expansion, new store openings back on track
Resilient performance in a challenging operating context

25
Challenging Operating Context, Though Improving
• Store functioning continued to be impacted, but progressively eased during quarter
• 85% stores operational (1Q: 50%), of which half could operate fully
• Footfalls steadily recovering, though still lower particularly in fashion & lifestyle and malls
• At 75% for the quarter (1Q: 43%), with September at 85% of pre-COVID levels
• Seamless operations across stores and supply chain network disrupted by sporadic changes
• Customer buying preference more sharply focused, impulse buying yet to revive fully
Gradual recovery of revenues from stores

26
Business Recovering, Performance Ahead of Market
• Overall revenue for quarter at last year’s level; sequentially +30%
• Grocery and Connectivity sustain strong growth momentum
• Consumer Electronics and Fashion & Lifestyle business
recovering
• Robust EBITDA performance despite operating limitations
• Nearly doubling sequentially
• Driven by build-back of revenue streams and continued
emphasis on cost management
Business stages V-Shaped recovery
EBITDA (Rs Cr)Gross Revenue (Rs Cr)
FY20 FY21
38,196
41,202
45,327
38,211
31,620
41,100
2,049 2,322
2,727 2,556
1,074
1,986
1Q 2Q 3Q 4Q 1Q 2Q

27
Steady Progress on Expansion
• 232 new stores launched in quarter as operating curbs are lifted
• Digital commerce continues to grow customers and scale
• Led by JioMart, AJIO and RelianceDigital
• New Commerce proposition well received – partnerships with
merchants further expanded to new geographies
• Entry into Pharma category during quarter
Making headway across key priorities
28
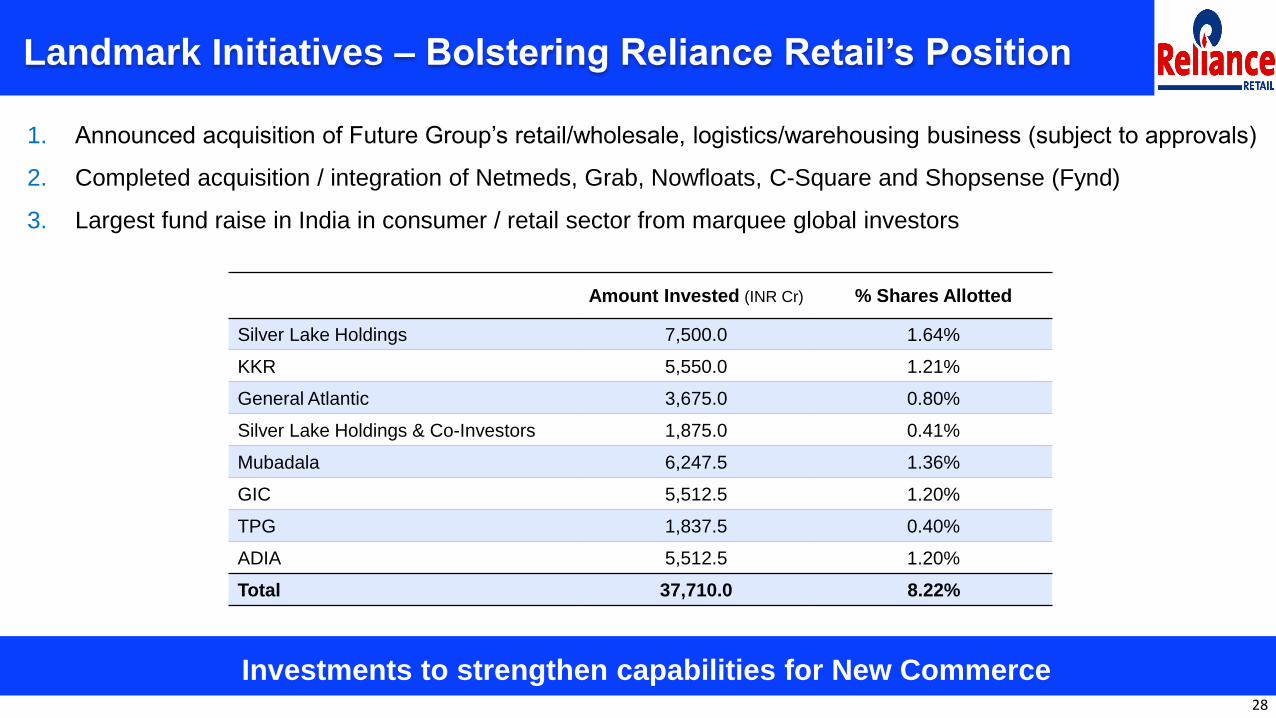
Landmark Initiatives – Bolstering Reliance Retail’s Position
1. Announced acquisition of Future Group’s retail/wholesale, logistics/warehousing business (subject to approvals)
2. Completed acquisition / integration of Netmeds, Grab, Nowfloats, C-Square and Shopsense (Fynd)
3. Largest fund raise in India in consumer / retail sector from marquee global investors
Investments to strengthen capabilities for New Commerce
Amount Invested (INR Cr) % Shares Allotted
Silver Lake Holdings 7,500.0 1.64%
KKR 5,550.0 1.21%
General Atlantic 3,675.0 0.80%
Silver Lake Holdings & Co-Investors 1,875.0 0.41%
Mubadala 6,247.5 1.36%
GIC 5,512.5 1.20%
TPG 1,837.5 0.40%
ADIA 5,512.5 1.20%
Total 37,710.0 8.22%

29
Financial Summary: Resilient Performance, Recovery Well Underway
Recovery well underway; robust revenue and profit growth sequentially
In Rs crore
2QFY20% Change
Y-o-YMetric 2QFY21 1QFY21
% Change
Q-o-Q
41,202 0% Segment Gross Revenue 41,100 31,620 30%
36,972 -1% Segment Net Revenue 36,566 28,197 30%
2,322 -14% Segment EBITDA 1,986 1,074 85%
6.3% -90 bps Segment EBITDA Margin (%) 5.4% 3.8% +160 bps
• Broad based recovery particularly in Fashion & Lifestyle enables strong EBITDA rebound
• Continued focus on cost management initiatives helps make up impact on profit
• Overall margins impacted by change in sales mix

30
More Stores Across Consumption Baskets and Regions
Looking to accelerate expansion as restrictions ease
2Q FY21
Total Addition
Region Store CountArea
(SqFt mn)Store Count
Area (SqFt mn)
North 2,732 5.7 54 0.27
South 3,418 11.5 84 0.34
East 3,164 7.9 40 0.24
West 2,617 4.6 54 0.32
Total 11,931 29.7 232 1.2

31
Performance Highlights – Consumer Electronics
• Double-digit Y-o-Y growth in Consumer Electronics (excluding devices)
• Broad based growth across categories; Laptops & Tablets, HETVs, Air Care
and Appliances
• Event activations drive performance – exclusive launches, financing offers
and Golden Event
• Full network of Digital stores now omni-enabled with unmatched delivery service
• RelianceDigital activation drives significantly higher orders; 88% delivered
from stores in <6 hours
• Drag from Jio devices unavailability in quarter being addressed - supplies being
restored
Consumer Electronics revenue at 2X over previous quarter

32
Performance Highlights – Fashion & Lifestyle (1/2)
Fashion & Lifestyle revenue at 3X over previous quarter
• Strong sequential recovery in apparel and footwear categories
• Focused activation drives conversion and bill values to record highs
• Trends Small Town business doing well; >2X growth over previous
year
• Digital commerce and omni-channel capabilities scaled
• 100% Trends & Footwear stores omni enabled (vs. 30% pre-COVID)
• AJIO scales up – orders up 4X from pre-COVID; quarterly run rate =
last full year
• Partnership with merchants now across 1,700 cities; orders up 4X over
1Q FY21

33
Performance Highlights – Fashion & Lifestyle (2/2)
Impactful activation and compelling value proposition drives growth
• Robust growth in Jewelry, with diamond share increasing
• Occasion based ‘Aabhar’ and ‘Alora’ collections do well
• Expanded product portfolio on AJIO; activated mono-brand site
• In Luxury and Premium Brands, digital commerce revenues up 3X over last
year
• Significant contribution from continued distance selling initiative
• Impactful customer engagement through the Luxury Shopping Festival

34
Performance Highlights - Grocery
• Momentum continues with performance well ahead of the market
• Staples and processed food categories drive growth; robust growth in HPC
• Continued trend of lower footfalls more than offset with high bill values
• JioMart continues to grow scale rapidly while serving many more customer orders
• Strengthened own brand portfolio with launches across categories
• Kirana partnerships extended to 20 cities; orders up 4X while providing uninterrupted supplies
As Grocer to the Nation, leading the way on meeting customer needs

35
Looking Ahead – Business Geared to Restore Momentum to Pre-COVID Levels
1. Accelerate new store opening particularly in Grocery and Fashion & Lifestyle
2. Impactful festive activation with competitive offers and compelling value proposition
3. Scale up digital commerce even further; launch Electronics, Fashion & Lifestyle and Pharma on JioMart
4. Expand New Commerce partnerships with merchants across more geographies
5. Augment supply chain infrastructure to support business expansion
Sustain investing for growth

36
O2C – Refining & Marketing

R & M : Business Environment and Macro Trends
37
OPEC+ production discipline and modest demand recovery supported crude prices
➢ Brent averaged $43.0/bbl in
2QFY21 up $13.8/bbl QoQ
Crude Supply
Refining
Dynamics
Macro and
geopolitics
➢ High compliance to OPEC+ cuts reduced excess supply
➢ Chinese demand supporting the market
➢ Global demand, economic activity impacted by Covid-19
➢ China leading global growth and economic rebound
➢ Overhang in distillate inventories impacted margins
➢ QoQ global runs up to 73.7 mbd from 69.9 mbd
Crude
Differentials
➢ AL-AH differential narrowed to $0.30/bbl
➢ Tight medium/heavy sour crude supply
10
20
30
40
50
60
70
80
Jan
-19
Mar
-19
May
-19
Jul-
19
Sep
-19
No
v-1
9
Jan
-20
Mar
-20
May
-20
Jul-
20
Sep
-20
Dated Brent WTI DubaiSource : Platts
$/bblOil Prices
Mbd: million barrels/day

Global Oil Demand Bottomed Out
38
Demand revival to absorb excess inventory and support recovery in margins
Global oil demand growth ➢ Peak demand decline was near 30 mbd in April’20
➢ QoQ oil demand improved by 10.6 mbd in 2Q FY21
▪ Demand expected to further improve by 2.7 mbd in 3Q FY21
➢ Mobility at pre-covid level in China; USA and India expected to
normalize by early CY21
▪ Per IEA, demand growth in CY 2021 expected at 5.5 mb/d
➢ Expected winter demand likely to reduce Middle distillates
inventory overhang
(Mn b/d or mbd: million barrels/day)

Singapore Refinery Products Margin
39
Demand headwinds and high middle-distillate inventories weighed on product cracks
➢ Gasoline cracks recovered on QoQ basis due to
easing of lockdown & preference for personal travel.
➢ Middle distillate cracks lower on QoQ basis:
▪ Diesel weighed down due to collapse in jet fuel
demand causing overhang in diesel pool
▪ Improvement in Jet demand to support diesel cracks
➢ Naphtha cracks improved QoQ with strong petchem
demand and tighter supply
➢ FO cracks fell QoQ due to impact of IMO2020 and
reduced global trade
Source: Platts
7.9
16.2 15.8
-7.8
-0.5
0.5
7.5
-0.1
-3.0 -2.3
2.9
5.0
-0.7
0.2
-3.5
-10
-5
0
5
10
15
20
Gasoline Gasoil Jet Kero Naphtha Fuel Oil
$/b
bl
2Q FY20 1Q FY21 2Q FY21

India Fuel Demand and RIL Retail Marketing JV
40
India demand recovery – Jio BP well placed to capture higher market share
➢ 11% QoQ rebound in demand with lifting of lockdown despite seasonal slow down due to strong monsoon
▪ Significant increase in vehicular traffic movement; Some traction in domestic air travel
▪ MS demand up 41%, HSD up 5%, ATF up 107%
➢ Further indications of improving demand trends: Gasoline demand up 3.3% YoY in Sept’20
Fuel Retail Marketing JV:
➢ MS and HSD sales volumes restored to last year’s level with all Retail Outlets fully operational
➢ Increased presence of Mobile Dispensing Units to 940 locations in 21 states; India’s largest e-com delivery network
Source: PPAC
7.5
18.8
2.0
5.0
15.0
0.4
7.1
15.8
0.8
-
5
10
15
20
MS HSD ATF
MM
T
2Q FY20 1Q FY21 2Q FY21
0
2
4
6
8
Jan-20 Feb-20 Mar-20 Apr-20 May-20 Jun-20 Jul-20 Aug-20 Sep-20
Monthly MS & HSD Demand
MS HSD
MM
T

R & M Segment Performance
Weak margins, lower throughput partially offset by operations excellence41
➢ Performance impacted by demand shock leading to weak margins
▪ Jet-fuel overhang impacted middle-distillate cracks
▪ Lower crude throughput at 15.3 MMT due to opportunistic
turnaround
➢ Performance supported by
▪ Competitive crude sourcing and product yield optimization
▪ Maximized domestic sales to capture improved domestic demand
➢ RIL-DTA Refinery won the "Safety Award-2020" in Oil & Gas
category from World Safety Forum-Global Safety Summit
5,896
3,818
3,002
9.4
6.3
5.7
0
5
10
-
2,000
4,000
6,000
8,000
2Q FY20 1Q FY21 2Q FY21
EBITDA (` crore) GRM ($/bbl)

Global Refining Margins
➢ Singapore complex margins stayed in negative territory
for most of the quarter
▪ Recovery in gasoline cracks with re-opening of
economies helped margins
➢ Europe margins weakened QoQ due to decline in middle
distillate cracks with product stock overhang
➢ US margins dropped QoQ slightly
▪ Support from gasoline cracks due to refinery outages
caused by hurricanes
Source: Reuters, RIL
42
Strong relative performance by RIL vis-à-vis global benchmarks
(0.9)
0.05
2.8
(0.3)
6.5 6.0
6.3 5.7
-2
-1
0
1
2
3
4
5
6
7
1Q FY21 2Q FY21
Singapore Europe US RIL
$/b
bl

O2C - R&M Quarter Highlights
43
O2C R&M well poised to outperform peers in a volatile environment
➢ Outperformed Asia Pacific and European refining margins in a challenging business environment
➢ Delivered top decile performance through operations excellence, reliability and energy efficiency
➢ Sourced differentiated and value-added crude oil & feedstocks leveraging superior configuration
➢ Flexibility to switch product mix & locational advantage enabled higher capacity utilization and better margins
➢ High level of integration with petrochemicals enhanced performance
➢ Domestic market poised for recovery; provides opportunity for higher domestic sales and enhanced margins
through Jio-BP

44
O2C – Petrochemicals
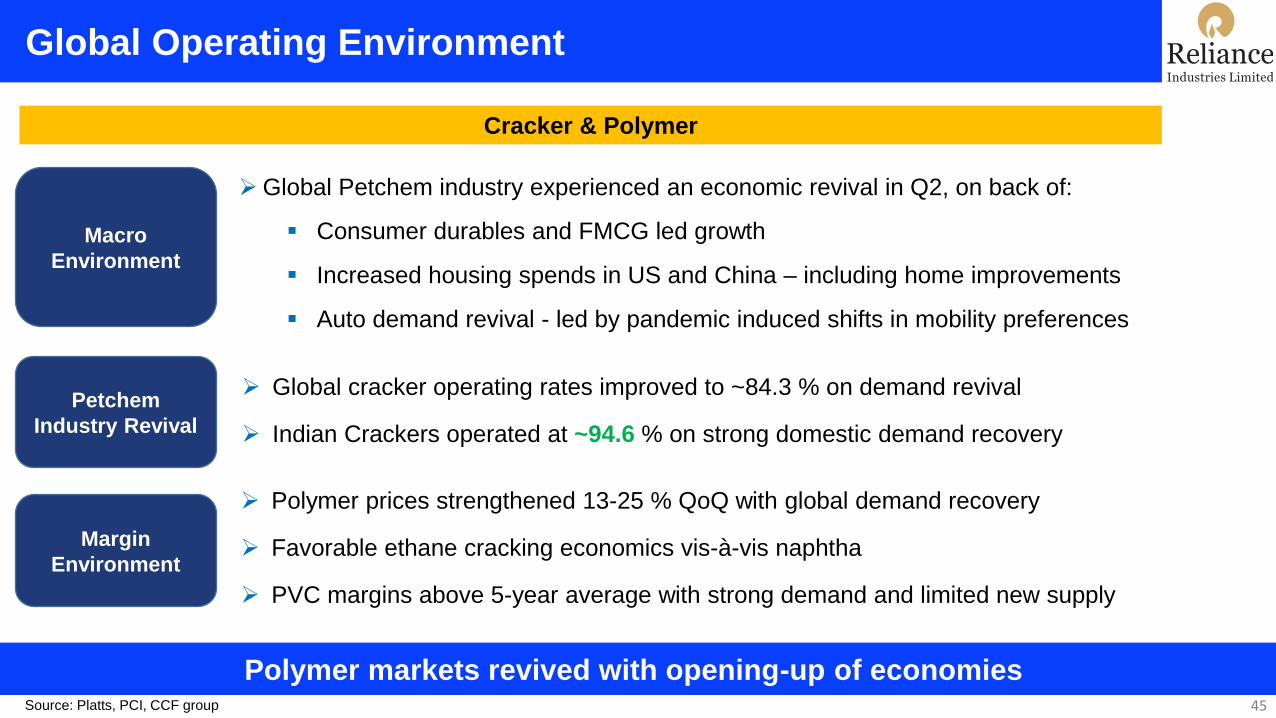
Global Operating Environment
45
Polymer markets revived with opening-up of economies
Petchem
Industry Revival
Margin
Environment
Macro
Environment
➢ Global cracker operating rates improved to ~84.3 % on demand revival
➢ Indian Crackers operated at ~94.6 % on strong domestic demand recovery
➢Global Petchem industry experienced an economic revival in Q2, on back of:
▪ Consumer durables and FMCG led growth
▪ Increased housing spends in US and China – including home improvements
▪ Auto demand revival - led by pandemic induced shifts in mobility preferences
➢ Polymer prices strengthened 13-25 % QoQ with global demand recovery
➢ Favorable ethane cracking economics vis-à-vis naphtha
➢ PVC margins above 5-year average with strong demand and limited new supply
Cracker & Polymer
Source: Platts, PCI, CCF group

Global Cracker Operating Rate – Overall Revival
46
North America
South America
Middle East & Africa
EuropeNE Asia
South & SE Asia (excl. India)
India
Q1 FY21 Q2 FY21
83.3% 78%
Q1 FY21 Q2 FY21
73.4% 94.6%
Q1 FY21 Q2 FY21
81% 83.4%
Q1 FY21 Q2 FY21
85.5% 87%
Q1 FY21 Q2 FY21
69.3% 69.3%
Q1 FY21 Q2 FY21
84.8% 88.3%
Q1 FY21 Q2 FY21
89.5% 88.6%
Source: RIL internal estimates using cracker turnaround data from ICIS and annual production data estimates from IHS
Indian crackers outperformed global peers in operating rates

Global Operating Environment
47
Polyester chain demand recovering with opening-up of economies
➢Global polyester demand revived with the easing of lockdown particularly in Asia
and Middle East
➢ PX and PTA continued to remain challenged due to capacity additions led by China
Polyester & Intermediates
Macro
Environment
Margin
Environment
Polyester
Industry Revival
➢ Indian textile demand revived steadily with availability of labour post ease of
lockdown
➢ Improved capacity utilization on channel restocking ahead of festive season
➢Continuous improvement in Polyester Delta through out the quarter
➢High Chinese PTA and PX inventories, influenced Price and Deltas
➢ Signs of revival now visible across the chain
Source: Platts, PCI, CCF group

Petrochemicals Segment Performance
Source: RIL internal estimates 48
➢ Strong QoQ recovery in EBITDA
➢ Strategic switch from export to domestic markets
➢Downstream converters preferred domestic producers vs imports given
uncertainty of global supply-chain
➢Our Nation-wide reach, multimodal logistics and unparalleled last mile
connectivity supported higher domestic sales
➢ Inventory at lower than pre-Covid levels across the portfolio
Journey of strong revival in domestic demand and agile operations
8,946
4,430
5,964
23.2
17.6
20.1
0
6
12
18
24
-
3,000
6,000
9,000
2Q FY20 1Q FY21 2Q FY21
EBITDA (` crore) EBITDA Margin (%)

49
India Demand Growth Across End Markets
Demand revival with increased downstream activity and upcoming festive season
36% 38%
51%
39%
PE PP PVC Polymer
202%
446%
39%
209%
PSF PFY PET Polyester
Polyester Demand Growth in Q2 FY21 QoQPolymer Demand Growth in Q2 FY21 QoQ
➢ QoQ sharp recovery on low base with reopening of
downstream
▪ Spinning operations up from 39% to 81% (exit rate)
▪ Weaving Sector operating rate improved due to Winter and
home textiles
➢ PET demand continued to be healthy from beverage, pharma
and hygiene sectors
➢ Strong QoQ recovery led by
▪ Continued demand from essential sectors of
health & hygiene and FMCG
▪ Agricultural demand supported by good monsoon
▪ Revival of Auto Demand for need of social
distancing
Source: RIL internal estimates and PCI

Petrochemicals Business Outlook
50
Cracker
&
Polymer
➢ China capacity additions expected to continue for fiber intermediates
➢ Downstream demand revival with onset of festival season to support margins
▪ Further removal of lockdown restrictions to improve labour availability for downstream sector
➢ Textiles markets to remain firm with demand from medical, hygiene and technical textiles
Intermediates
&
Polyester
➢ Demand growth to continue over next two quarters
▪ Limited new supply to further support favorable margin environment
➢ Favorable outlook for PVC
➢ Non-woven growth to benefit from sustained spends in health & hygiene sector
➢ Domestic demand for polymers supported by consumer spend and automobiles
With continuing demand recovery, margins expected to steadily improve going forward

O2C – Petrochemicals Quarter Highlights
51
Improved sequential performance with rebound in demand and operational agility
➢Delivered superior performance compared to global peers across the portfolio catalyzed by:
▪ Revival of domestic demand by ease of lockdown particularly in Agriculture, Auto and FMCG Sectors
▪ Ability to maximize chain margins taking advantage of flexibility in Cracker Feedstocks
▪ Agility to swing between export and domestic markets demonstrated successfully
▪ Robust and flexible domestic supply chain for superior customer reach
▪ Operations excellence and continuous optimizing of product mix in a volatile environment

52
Oil & Gas

Oil & Gas Segment Performance
➢ QoQ performance reflects weak US Shale profitability in Apr-Jun
quarter due to sharp (-34%) fall in realisations
➢ CBM Gas production at 3.05 BCF
▪ Steady Production averaging ~0.94 MMSCMD
▪ Gas Price Realization at $ 3.6/MMBTU (GCV)
➢ US Shale operations (Jul-Sep’20)
▪ Production 24.5 BCFe, down 3% QoQ
▪ Unit Price Realization $ 1.82/Mcfe, up 15% QoQ
128
-32
-194
-300
-200
-100
-
100
200
1Q FY20 1Q FY21 2Q FY21
EBITDA (` crore)
53

KG D6 - Project Progress : R-Cluster Development
➢ R-Cluster development:
▪ All wells drilled, completed, tested and connected; Sub-sea installation and testing works completed
▪ Balance works on Control & Riser Platform are currently underway
▪ Pre-commissioning and Commissioning expected in 3Q FY21
54
R-DWPLEM installation Asia Pride & NO 102

KG D6 - Project Progress : Satellite Cluster Development
➢ Satellite Cluster development:
▪ 3 out of 5 wells completed; Drilling and Completion campaign underway
▪ On-track for second Offshore Installation campaign in Dec’20
▪ Pre-commissioning and Commissioning expected in 3Q CY21
55
D&C Campaign underway with Rig DDKG1 Manifold FAT

KG D6 - Project Progress : MJ Development
➢ MJ development
▪ Drilling & Completion campaign underway
▪ On-track for first Offshore Installation campaign in Q4 FY21
▪ Pre-commissioning and Commissioning expected in 3Q CY22
56

57
Summary and Way Forward
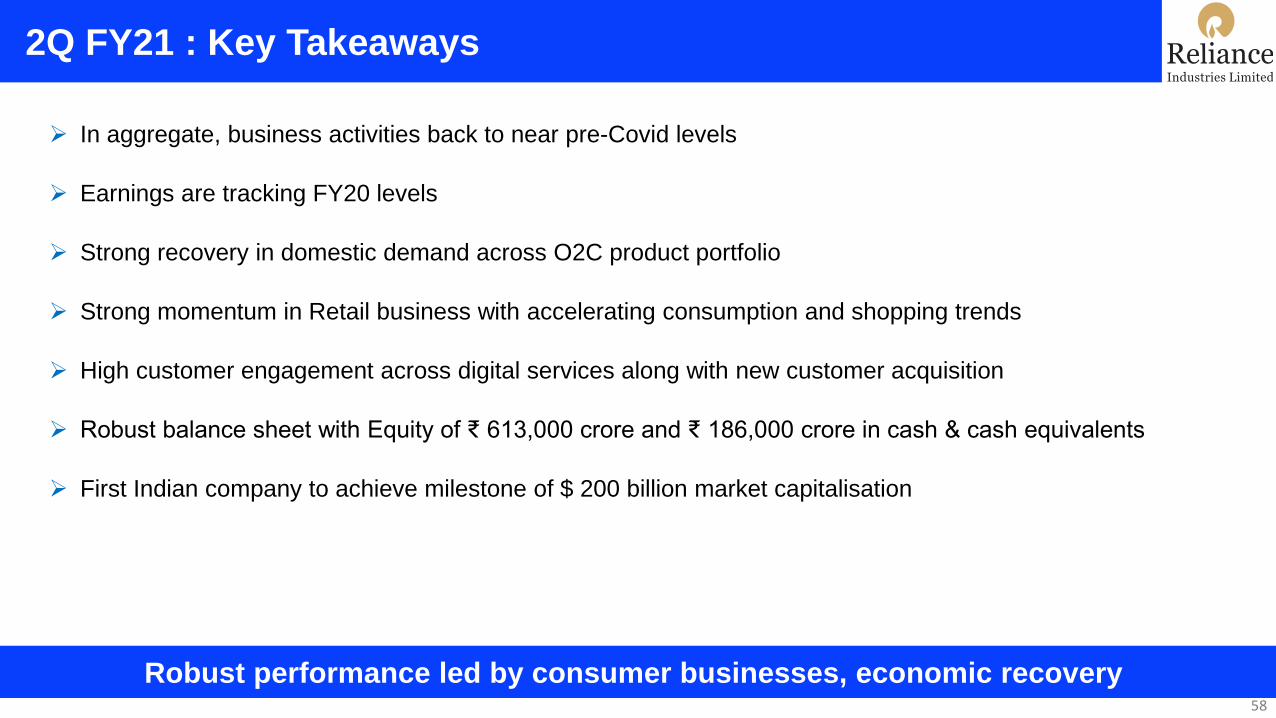
2Q FY21 : Key Takeaways
Robust performance led by consumer businesses, economic recovery 58
➢ In aggregate, business activities back to near pre-Covid levels
➢ Earnings are tracking FY20 levels
➢ Strong recovery in domestic demand across O2C product portfolio
➢ Strong momentum in Retail business with accelerating consumption and shopping trends
➢ High customer engagement across digital services along with new customer acquisition
➢ Robust balance sheet with Equity of ₹ 613,000 crore and ₹ 186,000 crore in cash & cash equivalents
➢ First Indian company to achieve milestone of $ 200 billion market capitalisation

Way Forward
59
Pioneering digital transformation and a new materials and energy paradigm
➢ Lead indicators signal strong recovery in domestic economic activity – to support growth in volumes and margin
➢ Rapid adoption of digital services and commerce to provide multi-year growth for consumer businesses
➢ Among the best O2C portfolio globally - Demand-Supply balance expected to normalize over the next 2-3 quarters
▪ Margins to recover with improving demand and inventory drawdown
▪ Significant progress made in laying the framework for new energy and new materials business
➢ Consumer businesses on strong growth trajectory
▪ Accelerated retail expansion with new store opening, JioMart scale-up and merchant partnerships
▪ Strengthening customer engagement through connectivity and digital services across mobility and FTTX

Growth is Life . . .
60