2Q & 1H2021 17 Aug 2021
49
2Q & 1H2021 17 Aug 2021
Transcript of 2Q & 1H2021 17 Aug 2021

2Q & 1H2021
17 Aug 2021

Activities Highlight
Key Drivers
2Q & 1H2021 Performance
OutlookCo
nte
nts
01
02
03
04
PTT Group’s New Vision & Strategic Direction
05
1

4
Key Activities in 2Q2021
Take a big step into Future energy and Beyond
Restructured of Power Business (+12.73% stake increased)
5
Contract extension of business collaboration to operate 7-Eleven
Investment 15.38% in petrochemical producer (Olefins)in Indonesia (PT Chandra Asri,)
FID in Refinery Efficiency and Diesel Quality Improvement Project for EURO V Standards (Ultra Clean Fuel )
Award for the JV with BAFS to provide aviation fuel services at U-Tapao International Airport
1
2
3
5 7
8
6
4
2
3
1Acquired 6.66% stake in Lotus Pharmaceutical Company Limited in Taiwan
JV with Nove Foods to operate the entire supply chain of Plant-based protein business
Signed MOU with Foxconn to collaborate in setting up an open platform to support EV growth in Thailand
Establishment of EVME as digital platform to promote EV
Establishment of "AeroSky (Thailand) to provide drone-based enterprise solutions
Investment 41.6% in power project in India (Avaada: 4,560MW )
Investment 25% in offshore wind power projects in Taiwan (CI Changfang and CI Xidao : 595 MW)
Investment in High Value Business (coating resins) (the Acquisition of 100% Shares of Allnex)
2
9FID in Bioplastic project plant 2(Name plate capacity: 75,000 tons per year)

The Screening Unit and Field Hospitals (End-to-End) under PTT Group’s “Giving Breath Project”
4
➢ We aim for the fast process of screening, sorting, and treating patients. This project could potentially turn into an operation model where business sector collaborates with the public sector.
➢ The process starts with the patients’ screening section that sequentially leads into three assign-colored groups; green, yellow, and red field hospitals.
➢ This is to ensure that all COVID-19 patients get their proper treatments and not being left behind.
✓The collaboration of PTT Group , Department of Disease Control, Ministry of Public Health, The National Health Security Office, The Foundation of Bangpakok Hospital Group, and Piyavate Hospital.
✓PTT Group puts all the effort to tackle the outbreak, including manpower, innovation, technology, medical supplies and equipment as well as budget to urgently assist medical sectors to fight the COVID-19 pandemic.
The 1st section of COVID-19Screening UnitThe 2nd, 3rd and 4th section are the sections of
End-to-End Field Hospitals
3
PTT Group’s Key Activities on ESG

Activities Highlight
Key Drivers
2Q & 1H2021 Performance
OutlookCo
nte
nts
01
02
03
04
4
PTT Group’s New Vision & Strategic Direction
05

0
2
4
6
8
10
12
14
16
18
20
Jan-19 Apr-19 Jul-19 Oct-19 Jan-20 Apr-20 Jul-20 Oct-20 Jan-21 Apr-21 Jul-21
6.6
11.0
7.28JLC-LNG*
JKM Spot
Avg. Pooled
gas price
4.9
9.5
7.22
4.7
9.7
7.15
5.8
9.4
7.30
* JLC = Japan LNG Cocktail : Landed LNG price in Japan
3.6
9.4
7.23
3.62.1
9.1
6.79
6.20
8.48.0
5.68
6.3
5.89
6.3
10.1
1Q19 2Q19 3Q19 4Q19 1Q20 2Q20 3Q20 4Q20 1Q21 2Q21 Jul’21
Key Business Drivers: QoQ: Increased in most of product prices as demand improved from vaccines rollout, ease of lockdown, and production cut of OPEC+
HoH: Petroleum and petrochemical prices improved from the demand recovery while pooled gas price dropped
AVG. Petroleum Prices ($/bbl)
HDPE
PX
PP
BZ
0
20
40
60
80
100
Jan-19 Apr-19 Jul-19 Oct-19 Jan-20 Apr-20 Jul-20 Oct-20 Jan-21 Apr-21 Jul-21
61.2
67.4
64.1 65.1
62.163.5
62.1
43.4
Dubai
FO
(3.5%)
42.9
40.4
50.7
43.4 30.6
28.9
1Q19 2Q19 3Q19 4Q19 1Q20 2Q20 3Q20 4Q20 1Q21 2Q21 Jul’21
44.1
60.0
56.644.6
2019 Dubai avg.: 63.5 2020 Dubai avg.: 42.2
AVG. Petroleum Prices ($/bbl)
AVG. FX (THB/USD) Petrochemical Prices (Avg. $/ton)
29
30
31
32
33
34
6
31.8 31.8
30.9
30.5
1H20 (end. FX 31.1)End: Baht Depre.
Bt 0.7 or 2.3%
31.5
30.8
1Q21 (end FX 31.5)End: Baht Depre.
Bt 1 .3 or 4.3%
32.1
1Q19 2Q19 3Q19 4Q19 1Q20 2Q20 3Q20 4Q20 1Q21 2Q21 Jul’21
2Q20 (end FX 31.1)End: Baht Appre.
Bt 1.8 or 5.4%
31.5
30.4
31.5
100
400
700
1000
1300
1600
Jan-19 Apr-19 Jul-19 Oct-19 Jan-20 Apr-20 Jul-20 Oct-20 Jan-21 Apr-21 Jul-21
1,080
590
519
1,0931,127 1,143
1,085
Note: F igures are av erage & Naphtha (MO P’J)
1,080
909
625
541
951
813679
494
1,049
841
801
671
540
706
614
440
839986
496
371
274
760
871
546
427
397
919968
561529
408
1,000
1,142
766753
557
1,365
1,145
PP HDPE PX BZ Naphtha
QoQ 2% 4% 12% 28% 9%
YoY 53% 57% 73% >100% >100%
HoH 45% 46% 35% 74% 63%
1Q19 2Q19 3Q19 4Q19 1Q20 2Q20 3Q20 4Q20 1Q21 2Q21 Jul’21
Naphtha
Dubai FO 3.5%
QoQ 12% 8%
YoY >100% >100%
HoH 56% 63%
66.9
61.1
935
1,042
684
1,258
1,131
5
64.5
72.9
859
966
606
1,336
1,191
2Q21 (end FX 32.2)End: Baht Depre.
Bt 0 .7 or 2.2%
1H21 (end. FX 32.2)End: Baht Depre.
Bt 2.0 or 6.6%
32.8
6.36
10.0
8.4
14.1
2019 Avg. : 31.2 / End : 30.4 2020 Avg. : 31.5 / End : 30.2
JLC-LNG* JKM Avg. Pool
QoQ 1% 8%
YoY 8% >100% 6%
HoH 9% >100% 13%

Activities Highlight
Key Drivers
2Q & 1H2021 Performance
OutlookCo
nte
nts
01
02
03
04
6
PTT Group’s New Vision & Strategic Direction
05

QoQ: NI decreased primarily due to non - recurring items despite enhanced operating income
HoH: Robust performance as a result of petroleum & petrochemical demand recovery in line with global trend
21%
32%24%
10%
3%10%6%
14%
31%31%
15%
2%
1%
34%
20%
31%
6%5%
1%
PTT(GAS & Trading)
P&R
TEG5/
Oil &
Retail
PTT Consolidated Performance: 2Q2021 & 1H2021
REVENUE
1,011,093 MB
NI
57,166 MB
1H2021
341,325 477,837
533,256
824,892
1,011,093
2Q20 1Q21 2Q21 1H20 1H21
REVENUE 12% QoQ 23%
12,053
32,58824,578
10,499
57,166
2Q20 1Q21 2Q21 1H20 1H21
>100% YoY
54,208
102,997113,166
86,593
216,163
2Q20 1Q21 2Q21 1H20 1H21
Unit: MB
>100%NI 25% QoQEBITDA 10% QoQ >100%
EBITDA
216,163 MB
Gas1/
P&R
Oil & Retail
P&R
Trading2/
Gas1/
E & PTEG3/
Oil & Retail
TEG3/
Trading2/
3%
Unit: MB Unit: MB56% YoY >100% YoY
Others6/Others4/
Remark: 1/ PTT Gas business and affiliates
2/ PTT Trading business and affiliates3/ Technology and Engineering business mainly contributed from power business
4/ O thers business mainly contributed from coal business
Others4/
Remark: 5/ Technology and Engineering business mainly contributed from power business
6/ O thers business mainly contributed from PTT LNG, PTT NGD, PTTT and PTTGM etc.7
E & PE & P

6.37 5.61 5.596.64
5.60
28.92
56.59
63.98
40.80
60.52
34.9740.38 42.19
40.15 41.35
2Q20 1Q21 2Q21 1H20 1H21
694
(127)(9) (33)
128
282349
418
631
2Q20 1Q21 2Q21 1H20 1H21
213271
317
231294
114
112126
114
119
2Q20 1Q21 2Q21 1H20 1H21
Liquid ($/BBL)
Gas($/MMBTU)
Weighted Avg.
($/BOE)
MMUSD
Liquid
Gas
KBOED
* Includes Gain/(Loss) on FX, Deferred tax from Functional currency, Current Tax from FX
Revaluation, Gain/(Loss) from Financial Instruments, Impairment loss on assets and etc.
Non-recurring*
Recurring NI
327
383
376
134
E&P PerformanceQoQ: Soften net income without recognition of gain from Oman Block 61 acquisition despite improved operating performanceHoH: Strengthen performance from higher sales volume and prices
443
222
4%
8
Net Income (100%)
Product Prices Sales Volume
13%
35% YoY
16% QoQ
QoQ
HoH
41% QoQ
66% YoY
16%
3%
48%345
413
QoQ 20%
598 46%
409
+ Recurring NI : increased from higher sales volume and selling prices
- Non-recurring : mainly from no recognition of gain on a bargain purchase
of Oman Block 61 Project
+ Recurring NI : improved from higher sales volume and liquid prices and lower unit cost
- Non-recurring : primarily from higher loss from oil price hedging and exploration expenses from write-off of Brazil’s project offset with gain from Oman Block 61 acquisition

PTT EBITDA Breakdown by Business
GAS
S&M
TM
GSP
NGV
Others
Trading
Total
Unit: MMTHB
2Q20 1Q21 2Q21 QoQ YoY 1H20 1H21 HoH
11,028 21,775 22,134 2% >100% 25,461 43,909 72%
1,356 4,775 3,732 22% >100% 3,280 8,507 >100%
8,960 8,120 8,577 6% 4% 18,039 16,697 7%
(475) 6,220 7,384 19% >100% 1,328 13,604 >100%
(684) (221) (425) 92% 38% (1,264) (646) 49%
1,871 2,881 2,866 53% 4,078 5,747 41%
1,251 1,138 907 20% 27% 2,158 2,045 5%
12,279 22,913 23,041 1% 88% 27,619 45,954 66%
9

8%
>100%
63%
836 805 796 840 800
495 598 727 560 663
1,288 1,323 1,333 1,274 1,329
847957 958
898 958
670786 803
711794135
150 134164
142
2Q20 1Q21 2Q21 1H20 1H21
Gas Business
NG Price VS FO & Customer Breakdown NGV Price & Sales Volume
QoQ : Improved NG vol. mainly from power producers during summer while pooled price picked upHoH: Increased gas sales vol., lower pooled gas cost and higher industrial selling prices referenced to FO price
7.31 7.19 7.20 7.30 7.23 6.79 6.20 5.68 5.89
6.36
416 422 403
281 281
188
262 286
367 397
0
100
200
300
400
500
4
6
8
10
12
14
1Q19 2Q19 3Q19 4Q19 1Q20 2Q20 3Q20 4Q20 1Q21 2Q21
$/MMBTU
EGAT (17%)
IPP (14%)
SPP (28%)
GSP (21%)
Industry (17%)
NGV (3%)
Unit: MMSCFD
4,271
$/TON
HSFO 180 C ST 2%S
Avg. Pooled gas price
4,619
QoQ
YoYHoH
FO (2%) Pool Price8%
6%
13%
A VG.2019 = 7.25
3% QoQ
11% YoY
4,751
Fuel Oil
14.2
13.413.8
14.5
13.6
3.3 3.7 3.3 4.0
3.5
2Q20 1Q21 2Q21 1H20 1H21
Unit: K.Ton/Day
Unit: THB/KG
NGV Avg. price
NGV Sales Vol.
YoY
11% QoQ
3% QoQ
3% YoY
+ Increased overall NG sales volume mainly from power customer during summer and unplanned shutdown of domestic coal power plants
- NGV vol. reduced from impact of COVID-19 new waves
Key Highlights
NG Price
NG Vol.
QoQ
10
4,447 4,686
5%
HoH+ NG sales vol. increased from almost all customers except NGV due to the recovery of economic activities + Lower pooled gas cost benefit to overall gas business + Industrial selling prices increased according to FO price linked
13%
6%
AVG. 1H21 = 6.13AVG. 1H20 = 7.02A VG. 2020 = 6.48

1,093 1,080
951 841
839 760 919
1,000 1,145
1,191
1,046
1,067 1,008
956 955 866
979
1,239
1,533 1,540
1,037 1,017
916 838
847
754 884
983
1,185
453
490
365 430
500
307
363 418
593
528 456
457
469 472
458
446 464 425 430
423
309 314 314 334 331
328
318 281 281 297
1Q19 2Q19 3Q19 4Q19 1Q20 2Q20 3Q20 4Q20 1Q21 2Q21
1,146
Gas Business : Gas Separation Plant (GSP)QoQ : GSP performance enhanced from higher selling prices & volumeHoH: Outperformed GSP performance due to higher selling prices & volume together with lower feed cost
GSP Sales Vol. & U-Rate
645 748 783
127 168 161
510
582 566
200
271 275
11
11 12
2Q20 1Q21 2Q21
1,493
1,7801,797
Pentane (1%)
LPG (43%)
Propane (15%)
NGL (9%)
Ethane (32%)
81.5%
94.7% 95.9%86.8%
95.3%
1% QoQ
20% YoY
U-Rate
Unit : kTon
QoQUnit: $/Ton
LPG* 2%
*LPG Domestic ** feed cost calculation per GSP production volume
Propane 11%
LDPE 0.5%
HDPE 4%
GSP Feed Cost vs Petchem. Price
LLDPE 3%
Feed Cost** 6%
+ Higher GSP’s selling prices following referenced global petrochemical prices
+ Increased sales volume & U- Rate according to higher petrochemical demand & no planned
maintenance shutdown
- Feed gas cost increased in line with gulf gas
QoQ
Key Highlights
11
1,441 1,531
287329
1,0621,148
399
54624
23
1H20 1H21
11%
3,213
3,577
+ Increased GSP’s selling prices following global petrochemical prices
+ Higher sales volume according to higher petrochemical demand and less plants' shutdown
+ Lower feed gas cost
HoH
Expanding on LNG business by increasing our shipments across the world (10 shipments; 628 KT in 1H21)
- Decreased gross margin from lower spread of LNG, LPG, and FO despite improved domestic
condensate
- Lower sales vol. from Crude & Condensate import impacted by Covid-19 new waves and seasonal
winter demand of LNG, LPG, and FO in 1Q21 - Declined EBITDA following lower gross margin and sales volume
- Volume decreased due to lower out-out & out-in transactions of crude oil impacted by Covid-19
pandemic started since March 2020<-> Overall gross margin remained stable with improved domestic condensate margin in 1H21 offset
with lower sharing from Joint Trade Agreement (JTA)
- EBITDA dropped from lower volume impact 12
0.09 0.09
0.07 0.08 0.08
22% QoQ
Gross Margin1
Trading Business: QoQ: Performance decreased owing to lower gross margin and sales volume
HoH: Lower EBITDA due to lower sales volume impacted from Covid-19 pandemic
Unit1: THB/Liter
22% YoY
18,411 18,933 18,224
38,425 37,157
2Q20 1Q21 2Q21 1H20 1H21
1 PTT Trading BU + trading subsidiaries: FX Adjusted + gain/loss on derivatives
+ Joint Trade Agreement (JTA)2 PTT Trading BU + trading subsidiaries + JTA
Unit2: MM Liter 4% QoQ
1% YoY
Trading – EBITDA3
1,251 1,138 907
2,158 2,045
2Q20 1Q21 2Q21 1H20 1H21
3 PTT Trading BU + trading subsidiaries: FX Adjusted + gain/loss on derivatives
Unit: MMTHB
Key Highlights
20% QoQ
27% YoY
QoQ
HoH
5%
3%
Sales Volume2

50.7
30.6
42.9 44.6
60.0 62.9 66.3 71.6
1Q20 2Q20 3Q20 4Q20 1Q21 Apr'21 May'21 Jun'21
520
4,003 3,225 2,418
7,228
2Q20 1Q21 2Q21 1H20 1H21
Oil Business : OR GroupQoQ : NI dropped from lower oil margin and sales volume pressured by new waves of COVID-19HoH : Improved performance from higher oil margin despite decreased oil sales volume as well as non-oil expansion
Oil Business
Net Income
Unit : MMTHB
2Q20 1Q21 2Q21 1H20 1H21
Dubai (USD/BBL)
Avg. 2Q21 = 66.9
19% QoQ>100% YoY
12% QoQ>100% YoY
Non-Oil Business
1/ Thailand, Japan, O man, My anmar, and Malay sia2/ Domestic, and Laos
Amazon1/
C-Store (7-11, Jiffy) 2/
60 MM Cups3,084 Outlets
73 MM Cups3,376 Outlets
70 MM Cups3,452 Outlets
128 Cups3,084 Outlets
143 Cups3,452 Outlets
1,938 Outlets 1,995 Outlets 2,018 Outlets 1,938 Outlets 2,018 Outlets
14% 14% 15%15% 14%3% 5% 5%
16% 7%51% 47% 47%
40%46%
6% 6% 6%
6%6%
24%25% 24%
21%25%
2%3%
3%
2%2%
5,433 5,910
5,542
12,056 11,452
2Q20 1Q21 2Q21 1H20 1H21
LPGAviation
Diesel
Fuel Oil
Gasoline
Others
0.83
1.31 1.23
0.81
1.27
Margin*(THB/Litre)
(MM Liter)
6% QoQ48% YoY
*Gross margin included stock gain/(loss)
Sales Volume(MM Liter)
Cups4% QoQ17% YoY
C-Store1% QoQ4% YoY
QoQ : Oil : Lower gross margin and dropped sales volume from new waves of COVID-19Non-Oil : Slightly increased margin from lower operating expenses despite reduced sales from COVID-19 impact
HoH: Oil : Better gross margin while sales volume dropped mainly from Aviation fuelNon-Oil : Improved gross margin from outlet expansion 13
5%
12%
57%
Avg. 1H20 = 40.7
>100%
4%
Avg. 1H21 = 63.5
56% HoH
Sales Volume6% QoQ2% YoY

(11,274)
5,483
(9,316)
10,155
(7,113)
34,730
129
162
2,480 3,360 2,123
(411)
5,581 4,574 1,671
9,695
25,035
57
83
79
760
1,145
1,191
800
1,168
754
1,146
1,185
800
1,165 871
1,365 1,336
929
1,351
Olefins
P&R BusinessesQoQ: Performance enhanced mainly from petrochemical business especially Aromatics despite lower stock gainHoH: Significantly improved performance from stock gain and petrochemical prices bounced back following global economic recovery
(GC ’s P lant)
100% 104% 93% 91% 98%Olefins
U-Rate
Aromatics
Refinery Net Income (100%)
95% 96% 96%99%
96%
Refinery
U-Rate
30.660.0 67.0
40.663.5
Acc.
GRM
18,719
99% 98% 102% 98% 100%BTX
U-Rate(GC ’s plant)
Unit : MMTHB
3,797
496 766
859
601812
371
753
966
493
859 Avg. Price:
$/Ton
271 253 287 263 270
146
240
393
155
317
Spread to Condensate: $/Ton
>100%70% QoQ
BZ: 28% QoQ
PX: 12% QoQ
Avg. Price:
$/Ton
Avg.
Dubai
2Q20 1Q21 2Q21 1H20 1H21
BZ: 64% QoQ
PX: 13% QoQ
31,811
PP: 2% QoQ
LLDPE: 3% QoQ
HDPE: 4% QoQ
14
2Q20 1Q21 2Q21 1H20 1H21
2Q20 1Q21 2Q21 1H20 1H21
50,530
(27,574)
PTT TANK
GC
TOPIRPC
>100% YoY
BZ: >100%
PX: 3%
PP: 45%
LLDPE: 46%
HDPE: 46%
BZ: 74%
PX: 35%
2Q20 1Q21 2Q21 1H20 1H21
1.6 1.9 1.6 1.1 1.7
(3.3)
5.1 3.2
(6.3)
4.2 0.2
(0.1) (0.4)
0.5
(0.2)
Hedging G/L
Stock G/L excl. NRV
Mkt GRM
(1.5)6.9 4.4
(4.7)5.7

31% 32% 30% 30% 31%
4,9683,381
4,9413,705
5,2513,779
10,119
6,692
10,192
7,484
2Q20 1Q21 2Q21 1H20 1H21
TEG Business: Power - GPSC QoQ: Higher NI from XPCL’s contribution, higher IPP’s gross profit, and partial insurance claim of Glow Energy Phase 5
HoH: NI increased mainly from XPCL’s contribution
Net Income
Sales Volume Gross profit & Gross profit marginUnit: Power: GWh / Steam: ‘000 Ton
Unit: MMTHB
Steam
Power
1,510 1,019 1,359 2,970 2,378
3,895 4,269 3,996
7,727 8,265 245 51 131
317 182
5,650 5,339 5,486
2Q20 1Q21 2Q21 1H20 1H21
IPP
SPP
VSPP & others
Gross profit margin
Gross profit
1,896 1,9732,302
3,476
4,276
2Q20 1Q21 2Q21 1H20 1H21
+ Higher shares of profit of XPCL due to increased water level in this year
- Lower gross profit margin from IPP due to unplanned outage of GHECO 1 despite SPP higher demand from Industrial power
QoQ
HoH
6% 2% QoQ
6% 12% YoY
Power Steam
Unit: MMTHB
+ Higher shares of profit of Xayaburi (XPCL) due to higher power sales
+ Higher gross profit + IPP: higher gross profit from higher AP due to lower plants maintenance in 2Q21
- SPP: lower gross profit due to increased natural gas and coal cost + Recognized other income from partial insurance claim of Glow Energy Ph. 5 incident
21% YoY
17% QoQ 23%
1% 12%
11,014 10,825 2%
Power Steam
3% QoQ
3% YoY
15

15,221
3,719 1,333
3,572
6,189
3,170
1,765
3,483
1Q21 Margin StockGain/(Loss)
OPEX DD&A Other Income Impairment FX &Derivatives
Int. & CIT Exp.& Other
2Q21
Margin
▲
Stock Gain/(Loss) OPEX
DD&A
Other Income
Impairment FX & Derivatives
Int. & CIT Exp. & Other
2Q21: 119,0891Q21: 103,868
2Q21: 12,1701Q21: 15,889
2Q21: (18,093)1Q21: (16,760) 2Q21: (38,608)
1Q21: (35,036)
2Q21: 9531Q21: 7,142
2Q21: (3,165)1Q21: 05 2Q21: (13,493)
1Q21: (11,728)
2Q21: (34,275)1Q21: (30,792)
7,750
3,400
8,867
3,437 739
3,521
4,874
▼
▲
1Q21: 5
▼
10,343
4,664
8,411
2,425 949
2,247
(4,461)
▼
TEG (mainly from power)
+ Higher share of profits from Xayaburi
+ IPP margin improved due to higher AP from less SD in 2Q21
Oil & Retail- Decreased in sales volume and gross margin from 3rd wave of COVID-19
Others- PTTT: Lower vol. and spread margin due to higher seasonal
demand in 1Q21
- Coal: Lower sales volume from lower production, and higher hedging loss
PTT Gas
+ GSP: Higher avg. selling prices & volume
- S&M: Adjusted gain of LNG resale booked in 1Q21, while
operating improved from sales volume increased and higher industrial customers’ selling prices linked to FO price
Trading- Lower gross margin and crude sales volume
PTTEP+ Higher avg. selling prices from liquid prices increased
+ Higher sales vol. from Oman Block 61, and Malaysia block HPTTEP
PTT
32,588
MMTHB
24,578
1Q21 2Q21
18,566
22,197
P&R
TEG/2
Extra Items
Extra Items*2Q21 : GC: Emery Oleochemicals impairment of 1,463 MB and
tax form selling stakes of GPSC 2,264 MB
1Q21 : EP: Gain on bargain purchase of Oman Block 61 7,033 MB offset write-off assets in Brazil 2,909 MB
Oil & Retails
(*PTT’s portion net tax amount)
2Q21 vs 1Q21 PTT Consolidated Performance (QoQ): NI dropped from extra items while operating margin improved
Petrochemical & Refining
Refinery
- Lower Stock gain in 2Q21
- Softer Mkt GRM due to higher crude premium
Petrochemical
+ Aromatics: Increase in BZ and PX spreads from higher
demand and tight supply
+ Olefins: Improved product prices from demand recovery
16
▲28%
▼29%
▼5%
▲37%
▼36%Others/1
▲33%
▼>100%
Remark: 1/ O thers business mainly contributed from PTT LNG, PTT NGD, PTTT and PTTGM etc.
2/ Technology and Engineering business mainly contributed from power business

Key Financial Ratios
1,292,717 1,387,932
530,535578,987
304,010
418,393
416,921
438,585
1,285,8451,415,903
795,503
874,316
462,835
533,678
1 2 3 4 5
11%
0.29 0.31
1.68
1.23
2020 1H21
MMTHB
Financial PositionStrong Balance Sheets maintained credit ratings
AP & Other Liabilities
PPE
Others Non-
currentAssets
AR & OtherCurrentAssets
Interest Bearing Debt (IBD)
TotalEquity
Cash & ST Invest
2,823,897
2,544,183
30 Jun 2131 Dec 20
Net Debt/EBITDA ≤ 2.0
Net Debt/Equity ≤ 1.0
PTT Ratings at Sovereign Level
Consolidated Balance Sheets
Foreign Currency Baa1 BBB+ BBB+
Local Currency Baa1 BBB+ BBB+
+ Increase in Inventories and Account Receivables from the higher product prices+ Higher PPE from PTTEP’s business acquisition of Oman Block 61 and TOP’s construction in progress of Clean Fuel Project+ Higher Interest Bearing Debt (IBD) from increase in long-term borrowing mainly from GC, GPSC, and IRPC+ Increase in Equity due to OR’s capital increase and PTT group’s net profit
17
Times

Cash Beginning Operating Investing Financing Adj & Others Cash Ending
332,032
84,889 147,171
291,414
+115,148 -203,718
+50,573 -2,621
416,921
Unit : MMTHB
*Investment in financial assets, ST/LT lending loans
Cash &Cash Equivalents
ST Investment
31 Dec 20 30 Jun 21
PTT Consolidated Cash Flows 6M21
18
Free Cash Flow
-88,570
Cash Out
-40,618
Operating 115,148 Investing (203,718) Financing 50,573
Non-Cash Adjustment 152,942 Investment (Sub. & Affiliates) (74,665) Received from Loans/Bonds 66,857
Net Income 57,166 CAPEX (64,686) Ordinary Share Issuance of Subsidiaries 53,665
Changes in Assets & Liabilities (68,046) Current Investment (61,192) Dividend Paid (33,041)
Income Tax (26,914) Others (6,656) Loan Repayment (22,829)
Dividend/Interest Received 3,481 Finance Cost Paid (14,010)
Derivatives (69)
*
438,585

Activities Highlight
Key Drivers
2Q & 1H2021 Performance
OutlookCo
nte
nts
01
02
03
04
19
PTT Group’s New Vision & Strategic Direction
05

Sources: IMF WEO (July 27, 2021), Blog by Gita Gopinath, International Industry Research and Economics Department
Global Economic Outlook: Global Economic Recovery Continues, but with Widening Gaps in Vaccine Access and Policy Support
+ Further normalization of activity in 2H2021, especially in advanced economies, as vaccine rollout proceeds and helps bring down hospitalizations
+ Sizable fiscal support in the US and new measures in other advanced economies (including France, Germany, Italy, Korea, and the UK), with associated spillovers to trading partners
+ Financial market sentiment remaining positive on balance given the expected global recovery
− Lack of access to vaccines, vaccine hesitancy, and renewed waves of COVID-19, following the emergence of highly infectious virus variants, delaying economic reopening in some countries
− Pent-up demand and supply chain bottlenecks, together with currency depreciation, putting upward pressure on prices, possibly causing some economies to begin normalizing monetary policy prematurely
IMF Forecast – 2021 GDP Growth
World: 6.0% US: 7.0% Euro area: 4.6% China: 8.1% Japan: 2.8% India: 9.5% Thailand: 2.1%
20
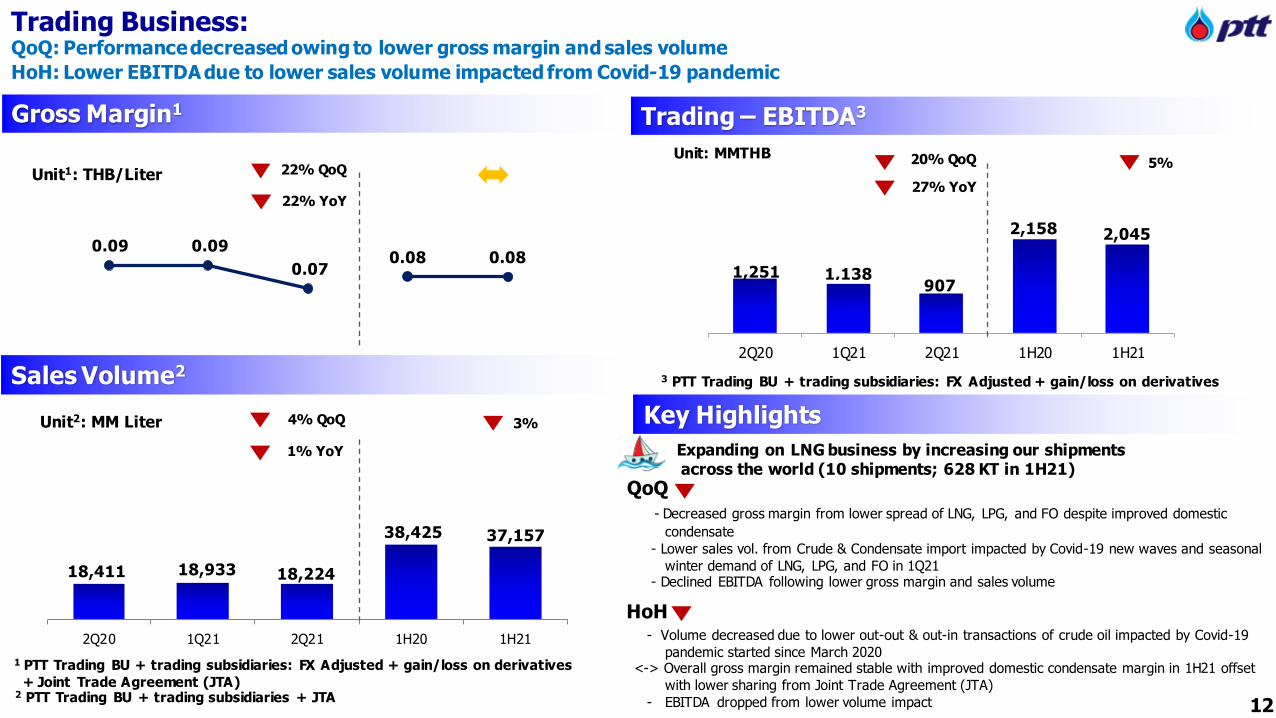
Thailand Economic Outlook: Soaring Infections and More Lockdown Measures Threaten to Derail Thailand’s Economic Recovery
21
+ Merchandise exports providing substantial support to the Thai economy (expected growth of 9 to 16.6% in 2021
vs. 19% in Jan-Jun 2021), driven by recovering global demand for automotive parts, electronics, machinery, and agricultural products
− Marked increase in infections, amid slow vaccine rollout, and renewed restrictions negatively affecting private consumption (expected growth of -1.3 to 2.4% in 2021 vs. 2.1% in 1H2021) and business sentiment
− Tourism recovery plans thrown into doubt (number of foreign tourists expected in 2021 of 0.1 to 0.6 million vs. 0.04
million in Jan-Jun 2021)
-6.1
0.7 1.3 2.1 2.1 0.9 1.2 0.5 2.2 1 1.3
2020 NESDC
(Aug 16)
BOT
(Aug 4)
FPO
(Jul 29)
Oxford
Economics
(Jul 29)
IMF
(Jul 27)
SCB
(Jul 22)
BAY
(Jul 17)
KKP
(Jul 16)
World Bank
(Jul 15)
KBANK
(Jul 14)
KTB
(Jul 14)
CIMB
(Jul 1)
Thailand 2021 GDP Growth (%)
0.5-1.3
Jun 28: daily infections 5,000+
Jul 17: daily infections 10,000+
Jul 20:stricter lockdown
Jul 9: lockdown
0.7-1.2
Sources: BOT, World Bank, Reuters, BBC, Oxford Economics, International Industry Research and Economics Department

Price 1Q21(A) 2Q21(A) 1H20(A) 1H21(A) 2020(A) 2021(E)
Dubai 60.0 66.9 40.6 63.5 42.2 63-68
Mogas 67.1 76.8 45.3 72.0 46.6 74-79
Gasoil 64.8 72.2 49.0 68.5 48.4 71-76
HSFO (3.5%S) 56.6 61.1 36.2 58.8 39.2 60-65
VLSFO (0.5%S) 67.6 71.9 50.2 69.8 49.2 70-75
Singapore GRM 1.8 2.0 0.2 1.9 0.4 2.0-2.5
23
2021 Petroleum and Gas Outlook
-5
0
5
10
15
20
0
20
40
60
80
100
1Q20 2Q20 3Q20 4Q20 1Q21 2Q21 3Q21 4Q21
Dubai Mogas Gasoil HSFO VLSFO Singapore GRM
Dubai
+ Recovered demand driven by a rise in economic activity, vaccination campaigns and mobility recovery, thus demand will gradually improve toward end of this year. However, new Delta cases will drag on near term demand
- Easing supply from OPEC+ following the increase of 2 MBD by year-end & slow supply recovery from U.S. and Iran
Gasoil
+ Demand recovery from the industrial and transportation sectors on the pace of global economic recoveries. However, subdued demand in the near term amid the COVID-19 resurgence in some Asian countries limit the upside
- Higher supply as refineries shifting Jet/Kerosene yield to produce more Gasoil
Singapore GRM
+ Improved from the recovery in light and middle distillate spreads
Fuel Oil
+ HSFO: Firm demand supported by the power demand in Middle East during summer and the upcoming utility demand in South Asia during winter
+ VLSFO: Healthy bunker demand following the global trade recovery
Mogas
+ Increasing demand restrictions are relaxed or lifted in some countries
+ Healthy summer driving demand in the US (July-August) to boost short-term gasoline price
- Concern on coronavirus Delta variant situation in some countries
- Slowdown seasonal demand during winter
Source: PTT, PRISMPetroleum Rolling as of July 2021
Pe
tro
leu
m
(GRM)$/bbl
23
02468
10121416
1Q20 2Q20 3Q20 4Q20 1Q21 2Q21 3Q21 4Q21
Asian Spot LNG
Henry Hub
Gas/LNG
Asian Spot LNG:
+ Strong fundamental gas demand growth from Chinese buyers
+ Increase gas demand in Europe as carbon and coal prices hiked
Henry Hub:
+ Increase in economic activity and easing of the COVID-19 pandemic in US
Price 1Q21(A) 2Q21(A) 1H20(A) 1H21(A) 2020(A) 2021(E)
Asian Spot LNG 10.9 10.0 2.9 10.4 4.3 12.4 – 13.8
Henry Hub (HH) 2.7 3.0 1.8 2.9 2.1 2.9 – 3.5
Ga
s/LN
G
$/MMBTU
Source: PTT, PRISM Petrochemical Rolling as of Jul 2021 22

600
800
1,000
1,200
1,400
1Q20 2Q20 3Q20 4Q20 1Q21 2Q21 3Q21 4Q21
HDPE CFR SEA
PP Yarn CFR SEA
200
400
600
800
1Q20 2Q20 3Q20 4Q20 1Q21 2Q21 3Q21 4Q21
200
400
600
800
1,000
1Q20 2Q20 3Q20 4Q20 1Q21 2Q21 3Q21 4Q21
BZ FOB Korea
PX CFR Taiwan
2021 Petrochemical Outlook
$/Ton
$/Ton
Aromatics
+ Expected more balanced BZ/PX markets from downstream capacities start-up, economic recovery, and firmer upstream crude price
+ Healthy Chinese BZ demand due to relatively low inventories
- Pressured PX price from persistent squeezed PTA and end-products margins & concerns on a sharp spike of COVID-19 infected cases and lockdown in some Asian countries in 3Q21 to affect downstream demand
- Cautious BZ/PX market direction from uncertainty on the start-up timing of China’s Zhejiang PC and Saudi Aramco in 2H21
Naphtha
+ Additional demand from new crackers startup, particularly in China and South Korea, to bolster demand
+ Seasonal demand from Petrochemical sector before New Year holidays
- Expectation on easing supply from higher refinery runs due to better COVID-19 situation
Olefins
+ Expected demand recovery due to brighter economic prospects to support olefins prices
- Easing US export supply to put pressure on Asian market sentiment
- Subdued SEA end-products demand amid rapid spreading of Delta variant COVID-19 and lockdown measures in some countries in 3Q21
- Incoming additional Asian capacities from Northeast Asia and Southeast Asia especially China in 2H21
$/Ton
Source: PTT, PRISM Petrochemical Rolling as of Jul 2021
Price 1Q21(A) 2Q21(A) 1H20(A) 1H21(A) 2020(A) 2021(E)
HDPE 1,145 1,191 800 1,168 880 1,100-1,150
PP Yarn 1,348 1,306 891 1,327 963 1,210-1,260
Price 1Q21(A) 2Q21(A) 1H20(A) 1H21(A) 2020(A) 2021(E)
Naphtha MOPJ 557 606 357 581 380 550-650
Ole
fin
sA
rom
ati
cs
Na
ph
tha
23
Price 1Q21(A) 2Q21(A) 1H20(A) 1H21(A) 2020(A) 2021(E)
BZ 753 966 493 859 485 860-910
PX 766 859 601 812 577 830-880

Upcoming projectOn 2H2021
100.0%
RA#6 : Ratchaburi -Wangnoi
COD:Sep 2021
98.3%
5th Pipeline
COD:3Q2021
84.7%
Phase III
In the process of preparing to construct :
To COD in Dec 2022
Phase I Phase II
High-quality Circular
Plastic Resin Plant
: 45 KTA
COD: Sep 2021
COD:1Q2022
Performance Recovery
PTT GroupGas Business
• Improve GSP U-Rate
GSP’s U-Rate ~ 92-94% in 2021
• Gas Volume Growth: CAGR 3.1% during 2021 -2025
E&P : + Crude oil price recovery+ Vol. rise ~16% + Unit Cost drop ~5%
OIL : - COVID-19 pandemic will suppress domestic demand+ Strong network through expanding
• Oil Stations +192 stations • EV Charging Stations +100 stations • Café Amazon + 552 outlets
P&R : + Refinery U-Rate ~95–97% + SG GRM ➔ 2.0 - 2.5$/bbl+ Petrochemical spread increase
Power : + Industrial demand increase ~4.5%
• Flat Pooled gas cost
• NG DemandIncrease ~1% vs 2020
Maintenance Schedule
2H21: Planned Major TA : Ethane Crackers3Q-4Q: HDPE2 Major TA : ~1 month
2H21
3Q: GSP#6 Major TA : 26 daysGSP#3 SD : 8 days
4Q: GSP#3 SD : 6 days GSP#6 SD : 9 days
Gas Separation Plants
Petrochemical Plants
Avaada Solar Power Platform
in India : 3,060 MW (GPSC’s portion
= 1,273 MW)COD: 2021-2022
Bakery Plant
COD: 4Q2021
24
Non-woven Fabric Plant (Innopolymed)
: 2.1 KTA COD: Dec 2021

Activities Highlight
Key Drivers
2Q & 1H2021 Performance
OutlookCo
nte
nts
01
02
03
04
PTT Group’s New Vision & Strategic Direction
05
25

PTT’s Vision has set directions for our past successes
✓ Energy self-sufficiency
✓ Petrochemical industry development
Strategic
Direction
✓ Resolved economic
crisis
✓ Fuel the Thai economy
– Market cap up by 100
bn THB on IPO✓ TAGNOC to
shift toward
Knowledge-
based
economy
2530 2540 2550 25602521 2563
Energy security for maximum benefit to
the nation
World-Class oil company with competitive edge
High performance org. & balance stakeholders
expectation?Thai Premier Multinational
Energy Company
✓ Inclusive
growth driving
sustainable
growth for all
sectors
History of PTT Vision
✓ – Big company Fortune 100 –
Strong Performance
– DJSI
Energy
security
Value
creation
Debt
restructuring
IPO
Key evolution
Economic growth led development
Economic stability & social development
• People centered development paradigm
• Participation Approach• Sufficiency Economy
Thailand 4.0 “Security, Prosperity,
Sustainability”Country direction
2551
China Japan
Korea
Philippines
Australia
Nigeria
Middle East
CrudePetroleum ProductsPetrochemical Products
CrudePetroleum ProductsPetrochemical Products
Algeria
Indonesia
Brazil
USA
India
Singapore
VietnamTaiwan
Build competitiveness in
global arena
Energy transition &
Technology disruption
Aspiration:
POWERING THAILAND’S TRANSFORMATION
2557254425402524
BIG LONG STRONG
RestartResilience
ReformReimagination
26
(B.E.)

PTT’s vision is revised to set aspirations
along with future trends
with Future Energy and Beyond
Powering Life
27

Technology & Innovation
Partnership & Platform
Positive Contribution to enhance livelihood
Low Carbon Society Growth along the way of life
to empower and better life
Deliver inclusive growth to create economic growth while
enhance quality of life – people, society, community, and environment
Powering Life with future energy and beyond Purpose
28

Powering life with
Future Energy and Beyond Strategic Positioning
Future Energy
BeyondLife
Science
Logistics & Infrastructure
Mobility & Lifestyle
High Value Business
AI, Robotics digitalization
Ready to explore…
Renewable
EV Value Chain
Hydrogen
Energy Storage & System Related
focus more on future energy trend
and new businesses that have potentials to grow
Moving toward future energy and energy technologies which are clean and environmental friendly as
well as stepping into new potential businesses that support people live and drive people well-being
29

Directing energy business in line with future trend
Reinforce Reignite new businessat speed and scaleReimagine
Focus on
Lower-carbon portfolio
▪ Collaboratively build LNG value
chain platform
▪ Accelerate LNG portfolio development through partnership
Fully integrated player in gas and LNG value chain
▪ Coal business divestment
▪ Downstream Business Portfolio
Rebalancing
▪ Resilience for Refinery Business
▪ To be Global Player with Digital
Forefront
▪ Synchronized Upstream &
Downstream Optimization
Acceleration into
LNG value chain Powering
Downstream along with Future Energy
▪ Renewable Energy
▪ Energy Storage
System
▪ EV Value Chain
▪ Energy Platform
▪ Other potential
(e.g. H2)
Expedite execution
New Energy & EV
& integrate Renewable Energy Value Chain with
PTT Group Business
30

Growing along the way of life beyond energyReignite New Business at Speed and Scale
PTT Group’s Marketing PlatformFocus on 3rd Party Logistics (3PL) segment with interest in 2nd Party Logistics (2PL)
Mobility LifestyleStrive one-stop solution for
All Lifestyle
Rail & Terminal
Modern Logistics Solution & Platform▪ Seamless logistic solution provider
▪ Rail-based intermodal logistics services provider
Strengthen energy solution for
Seamless Mobility
Oil Ecosystem
Energy
SolutionEcosystem
F&BEcosystem
One-stop
SolutionEcosystem
through M&A
Coating and Adhesive
Next HVB
▪ Accelerating growth in attractive segments(e.g. composites & UPR, coating additives)
▪ Seeking more opportunities in HPP and Composite
Pharmaceutical
Medical Technology
Nutrition
Investment in Generics / Biopharma Company
(e.g. Covid-19 Test Kit, Meltblown, MED.
GLOVES and MED. DEVICE)
Explore opportunities inAI, Robotics & Digitalization▪ Robotic / AI
▪ Digital platform
▪ Cloud service provider, Data center
co-location
31
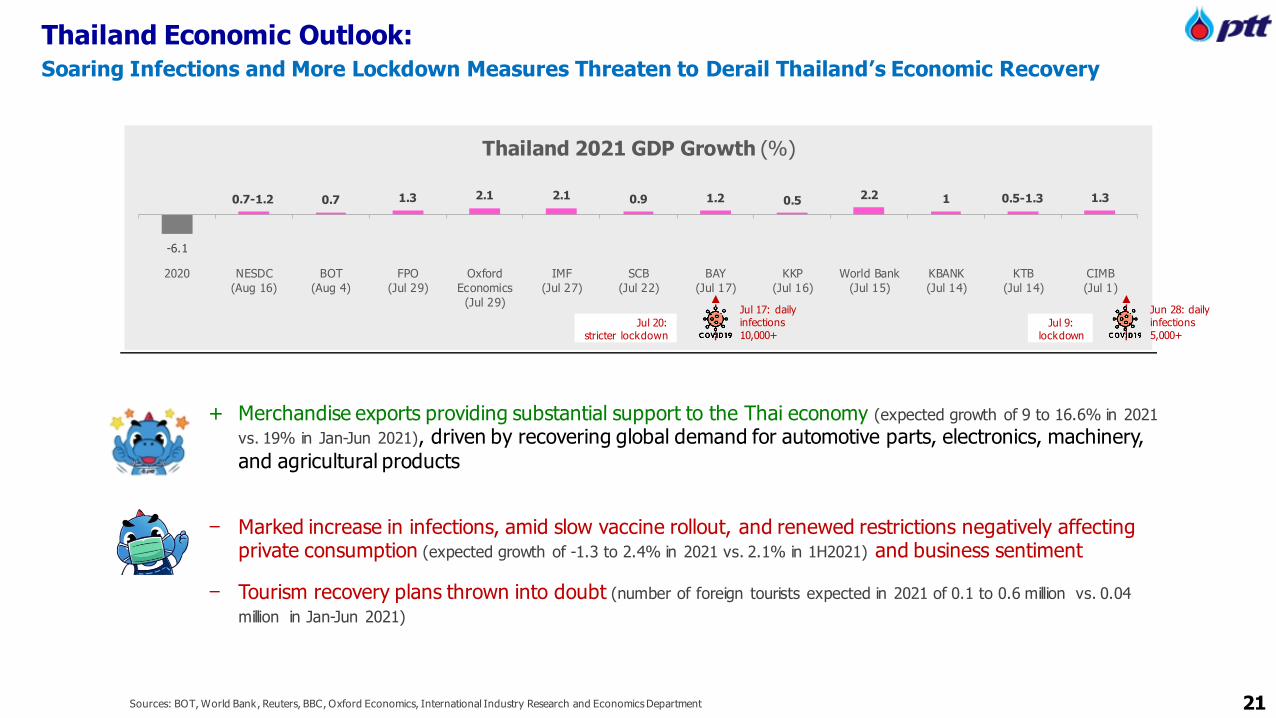
Key investment highlights in line with strategic direction
Renewables
Acquired 90% shares in Taiwan’s solar power plant - Sheng Yang Energy
Acquired 41.6% shares in Indian solar power developer Avaada
EV Value Chain
MOU with Foxconn to collaborate in setting up an open platform for producing electric vehicles (EV)
Established ARUN PLUS, EVme PLUS, SWAP&GO to operate business in EV value chain
Acquired 6.66% stake in Taiwan drug development company – Lotus Pharmaceutical
Life Science
Plant-Based Food
Thai herbs
High Value Business (HVB)
Mobility & Lifestyle
Acquired industrial coating resins producer Allnex to strengthen position in the chemicals business
OR strengthen and expand the Mobility & Lifestyle business to support future market demands
To acquire 25% stake in offshore wind farm in Taiwan
Announced investment ~190,000 MB(Q3/20 –Present)
32

Overall Strategic Direction to achieve purpose of New Vision
E&P
Gas
Oil & Retail
Power
P&R
• Build global LNG portfolio
• Expand growth for high return asset
& mainly invest in gas assets
• Accelerate growth in Thailand &
region
• Grow in retail with customer-
oriented
• Move to mobility & lifestyle
• Supply chain integration
• Move to high value business
Direction Business
Newbusiness
New Energy
• Scale up potential business e.g. life
science, logistics & infrastructure
• Expedite growth in new energy e.g.
renewable, energy storage & system
related and EV value chainFuture Energy(RE, ESS, EV)
New businessFuture
Energy
&
Beyond 32%
15%
17%
CAPEX(2021 – 2030)
PTT Group 68%
Hydrocarbon Business
(E&P, Gas, LNG, Power, P&R, Oil)
NI from Future Energy and Beyond > 30%1
New growth
Power (Conventional) 8 GW
LNG* 9 MTA
Renewable energy 12 GW
Business growth
2
315% GHG reduction from 2020
Clean growth
(Moving to net zero GHG within 2070)
* LNG Equity and controlling of portfolio v olume 33

Thank youPTT Public Company Limited
Investor Relations Department
Disclaimer
The information contained in our presentation is intended solely for your personal reference only. Please do not circulate this material. If you are not an intended recipient, you
must not read, disclose, copy, retain, distribute or take any action in reliance upon it. In addition, such information contains projections and forward-looking statements that
reflect our current views with respect to future events, financial performance and result of PTT’s activities. These views are based on assumptions subject to various risks and
uncertainties. No assurance is given that future events will occur, that projections will be achieved, or that our assumptions are correct. Actual results may differ materially from those projected.
The information contained in this presentation is subject to change without notice and PTT does not undertake any duty to update the forward-looking statements, and the
estimates and assumptions associated with them, except to the extent required by applicable laws and regulations.
35
Tel. +66 2 537-3518, Fax. +66 2 537-3948
Website: http://www.pttplc.com
E-mail: [email protected]
34
Questionnaire

PTT Gas
+ GSP: Higher avg. selling prices & volume and lower feed
gas cost
+ S&M: Higher industrial customers’ selling price linked to FO price, lower pooled gas cost, and higher sales vol.
from most of customers
Trading- Lower sales volume from Covid-19 impact
-
69,485
61,401
1,316 3,177 6,237
1,677
31,782
52,504
-
6M/2020 Margin StockGain/(Loss)
OPEX DD&A Other Income Impairment FX &Derivatives
Int. & CIT Exp.& Other
6M/2021
Margin
▲
Stock Gain/(Loss)
OPEX
DD&A
Other Income
Impairment
FX & Derivatives
Int. & CIT Exp. & Other
1H21: 222,9571H20: 153,472
1H21: 28,0591H20: (33,342)
1H21: (34,853)1H20: (33,537)
1H21: (73,644)1H20: (70,467)
1H21: 8,0951H20: 1,858
1H21: (3,160)1H20: (1,483)
1H21: (25,221)1H20: 6,561
1H21: (65,067)1H20: (12,563)
6,679
9,344
(13,304)
2,423 1,205 5,077
(925)
18,093
8,064
17,278
5,862 1,688 5,768 413
▲
▼
▲
▲
▲
PTTEP- Loss from oil price hedging from upward oil price trend
+ Higher Avg. Selling price from liquid prices increased
+ Higher Sales vol. from Oman Block 61 acquisition,
Bongkot, Contract4, and Malaysia projectPTTEP
PTT
10,499
MMTHB
57,166
1H20 1H21
29,107
40,763
P&R
Extra Items
Oil & Retails
1H21 vs 1H20 PTT Consolidated Performance (HoH): Significantly improved performance in most of PTT Group Businesses
Petrochemical & RefiningRefinery+ Higher Stock gain in 1H21
+ Higher Mkt GRM mainly from gasoline spreadPetrochemical
+ Olefins: Improved product prices and sales volume
+ Aromatics: Increased in BZ & PX spreads
35
TEG/2Others/1
▲40%▲>100%
▼14%
▲>100%
▲>100%
▲>100%▲14%
Remark: 1/ O thers business mainly contributed from PTT LNG, PTT NGD, PTTT and PTTGM etc.
2/ Technology and Engineering business mainly contributed from power business
Oil & Retail+ Improved oil margin, and non-oil expansion- Lower oil volume due to Covid-19 impact
TEG (mainly from power)+ Higher share of profits from XPCL due to higher water level
+ Higher contribution from increasing PTT’s direct holding in
GPSC
OthersCoal: Higher margin due to increased selling prices
following Newcastle coal price
Extra Items*1H21 : EP: Gain on bargain purchase of Oman Block 61
7,033 MB, offset write-off assets in Brazil 2,909 MB
GC: Emery Oleochemicals impairment of 1,463 MB,
and tax from selling stakes in GPSC 2,264 MB
1H20 : EP: Mariana Oil Sands impairment of 925 MB
(*PTT’s portion net tax amount)

52
6876
55
72
45 4652
47 49
55
89
109
61
99
2Q20 1Q21 2Q21 1H20 1H21
- - -
0.9
22.2
3.0
13.1
25.2
2Q20 1Q21 2Q21 1H20 1H21
Other Business : Coal business (SAR) QoQ: NI declined due to lower sales volume, and hedging loss as New Castle price spikedHoH: NI increased from higher selling prices due to referenced New Castle price surged and lower DD&A
1/ Average Calorific value ~ 5,400 kcal/kg
36
Unit: $/Ton
Avg. Selling Price
Total Cash Costs
New Castle
Unit: MMUSD
Avg. Selling Price1/ & Cash cost1/
QoQ
1,472 1,468 1,221
3,257 2,689
150 30
285
30
2Q20 1Q21 2Q21 1H20 1H21
kTon
Jembayan
Sebuku
1,622 1,4681,251
15% QoQ23% YoY
QoQ
- Lower sales volume caused by lower production plan and rainy season in Indonesia
+ Selling price increased due to rising New Castle price
- NI declined mainly from hedging loss, as New Castle price rose
HoH
+ Selling price largely improved following referenced New Castle price
- Cash cost increased from higher mining cost and gas oil price
- Sales volume dropped from lower production plan and cease operation of the Sebuku coal mine
+ NI increased mainly from higher margin from sharply increased selling prices and lower DD&A from impairment of assets in 2020
Sales Volume
Net Income (100%) Key Highlights
86% QoQ>100% YoY
3,542
2,719
23%
92%
12%
22%
13%
31%
62%
4%

7.718.75
13.43
22.40
30.57
34.1434.82
18.33
21.06
29.58
37.24 36.58
32.52
20.34
6.73
32.68
46.74
4.15
2.50 2.854.00
6.75
9.25 10.5011.50
8.008.50
10.2513.00 13.00 13.00
11.00 10.00
16.00
20.00 2.00 2.00
32.4% 32.6% 29.8% 30.1% 30.3% 30.8% 33.0%43.6%
40.4% 34.7% 34.9% 35.5%40.0%
54.1%
148.6%
49.0% 42.8% 48.2%62.5%
75.8%
-900.00%
-600.00%
-300.00%
0.00%
0.00
10.00
20.00
30.00
40.00
50.00
60.00
70.00
80.00
90.00
2001 2002 2003 2004 2005 2006 2007 2008 2009 2010 2011 2012 2013 2014 2015 2016 2017 2018 2019 2020
25% PTT’s min. payout ratio Policy
Baht / share
Dividend Policy & Historical Payments
Y2020 Dividend payout at 75.8%
* Spilt par value from 10 to 1 Baht/share since 24 April 2018
10-Year Avg. 59%
Avg. since IPO46%
1.00
37
Split par*
1.32
3.20
Dividend payout
EPSDPS

*Investment in financial assets, ST/LT lending loans
Cash &Cash Equivalents
ST Investment
31 Dec 20 30 Jun 21
Unit : MMTHB
PTT Only Cash Flows 6M21
38
Free Cash Flow
+27,176
Cash In
+989
Cash Beginning Operating Investing Financing Adj & Others Cash Ending
56,342
44,404 33,770
57,331
+21,594 +5,582 -26,271
+84
91,101
100,746
Operating 21,594 Investing 5,582 Financing (26,271)
Net Income 37,251 Dividend/Interest Received 20,800 Dividend Paid (23,420)
Non-Cash Adjustment 235 Current Investment 8,268 Finance Cost Paid (2,726)
Changes in Assets & Liabilities (13,018) Others 6,643 Loan Repayment (82)
Income Tax (2,874) Investment (Sub. & Affiliates) (26,093) Others (43)
CAPEX (4,036)
*

PTT Group Performance : 2Q2021 (QoQ & YoY)
1/Including PTTGE,BSA, PTT TCC and RTC
39
% PTT
holding
2Q20 1Q21 2Q21 QoQ YoY 2Q20 1Q21 2Q21 QoQ YoY
PTT Net operating Income 4,963 8,498 9,595 13% 93% 4,963 8,498 9,595 13% 93%
E&P - PTTEP 4,322 11,534 7,139 -38% 65% 65.29% 2,823 7,524 4,664 -38% 65%
Petrochemical 1,728 9,778 25,114 >100% >100% 845 4,675 1,469 -69% 74%
- GC 1,671 9,695 25,035 >100% >100% 48.42% 788 4,592 1,390 -70% 76%
- Other 57 83 79 -5% 39% 57 83 79 -5% 39%
Refining 2,069 8,941 6,697 -25% >100% 532 4,192 3,215 -23% >100%
- TOP 2,480 3,360 2,123 -37% -14% 48.03% 704 1,615 1,006 -38% 43%
- IRPC (411) 5,581 4,574 -18% >100% 48.05% (172) 2,577 2,209 -14% >100%
Oil - OR 520 4,003 3,225 -19% >100% 75.00% 559 3,439 2,439 -29% >100%
TEG - GPSC/TP/DCAP/PTTES/PTTDIGITAL/ENCO 2,568 17,037 2,702 -84% 5% 641 739 949 28% 48%
Others Business 2,132 3,485 2,824 -19% 32% 1,702 3,221 2,245 -30% 32%
Inter - PTTER/PTTGM 342 531 345 -35% 1% 100% 40 493 3 -99% -93%
Gas - PTTLNG/PTTNGD/PTTGL/TTM(T)/TTM(M) 1,465 2,255 2,282 1% 56% 1,337 2,029 2,039 0% 53%
Other - PTTT/Others1/ 325 699 197 -72% -39% 325 699 203 -71% -38%
Shared of Net Income from Affiliates 13,339 54,778 47,701 -13% >100% 7,102 23,790 14,981 -37% >100%
Tax adjustment for gain on disposal of investment and asset (12) 300 2 -99% >100% (12) 300 2 -99% >100%
PTT Conso. Net Income 18,290 63,576 57,298 -10% >100% 12,053 32,588 24,578 -25% >100%
Unit : MMTHB
Performance 100% Equity Method % PTT

PTT Group Performance : 1H21 vs 1H20 (HoH)
1/Including PTTGE,BSA, PTT TCC and RTC 40
% PTT
holding
1H20 1H21 HoH 1H20 1H21 HoH
PTT Net operating Income 6,679 18,093 >100% 6,679 18,093 >100%
E&P - PTTEP 12,935 18,673 44% 65.29% 8,419 12,188 45%
Petrochemical (6,984) 34,892 >100% (3,213) 6,144 >100%
- GC (7,113) 34,730 >100% 48.42% (3,343) 5,982 >100%
- Other 129 162 26% 130 162 25%
Refining (20,590) 15,638 >100% (10,091) 7,407 >100%
- TOP (11,274) 5,483 >100% 48.03% (5,659) 2,621 >100%
- IRPC (9,316) 10,155 >100% 48.05% (4,432) 4,786 >100%
Oil - OR 2,418 7,228 >100% 75.00% 2,423 5,878 143%
TEG - GPSC/TP/DCAP/PTTES/PTTDIGITAL/ENCO 4,802 19,739 >100% 1,205 1,688 40%
Others Business 5,672 6,309 >100% 5,491 5,466 0%
Inter - PTTER/PTTGM 448 876 96% 100% 362 496 37%
Gas - PTTLNG/PTTNGD/PTTGL/TTM(T)/TTM(M) 3,818 4,537 19% 3,723 4,068 9%
Other - PTTT/Others1/ 1,406 896 -36% 1,406 902 -36%
Shared of Net Income from Affiliates (1,747) 102,479 >100% 4,234 38,771 >100%
Tax adjustment for gain on disposal of investment and asset (414) 302 >100% (414) 302 >100%
PTT Conso. Net Income 4,518 120,874 >100% 10,499 57,166 >100%
Unit : MMTHB
Performance 100% Equity Method % PTT

Subsidiaries ConsolidatePTT Energy Resources Co., Ltd. PTTER 100.00%PTT Green Energy Pte. Ltd PTTGE 100.00%PTT Global Management Co., Ltd. PTTGM 100.00%
Subsidiaries ConsolidatePTT Oil & Retail Business Co., Ltd. OR 75.00%
Subsidiaries ConsolidatePTT Exploration & Production Plc. PTTEP 65.29% 2/
PTT Natural Gas Distribution Co., Ltd. PTTNGD 58.00%PTT LNG Co., Ltd. PTTLNG 100.00%PTT Global LNG Co., Ltd PTTGL 50.00%
Joint Ventures EquityTrans Thai-Malaysia (Thailand) Co., Ltd. TTM (T) 50.00%Trans Thai-Malaysia (Malaysia) Sdn. Bhd. TTM (M) 50.00%Map Ta Phut Air Products Company Limited MAP 49.00%
Petrochemical Subsidiaries ConsolidatePTT Global Chemical Plc. 1/ GC 48.42% 2/
PTT Tank Terminal Co., Ltd. PTTTANK 100.00%
Refining Subsidiaries ConsolidateThai Oil Plc. 1/ TOP 48.03% 2/
IRPC Plc. 1/ IRPC 48.05% 2/
Subsidiaries ConsolidateBusiness Service Alliance Co., Ltd. 1/ BSA 25.00%4/
PTT Treasury Center Co. Ltd PTT TCC 100.00%
Subsidiaries Consolidate
Global Power Synergy Co., Ltd1/ GPSC 75.23% 2/
Thai Oil Power Co., Ltd. 1/ TP 3/ 26.00%PTT Digital Solutions Co., Ltd. 1/ PTT DIGITAL 20.00%PTT Energy Solutions Co., Ltd. 1/ PTTES 40.00%Energy Complex Co., Ltd. EnCo 50.00%
Joint Ventures EquityDistrict Cooling System and Power Plant DCAP 35.00%
Remark : 1/Subsidiaries that PTT holds less than 50% but being consolidated because PTT has the power to control the financial and operating policies.
2/ Holding portion of PTT Group (direct & indirect)
Data as of 30 Jun 2021
Subsidiaries Consolidate PTT International Trading Pte. PTTT 100.00%PTT International Trading London Ltd PTTT LDN 100.00%PTT International Trading USA Inc. PTTT USA 100.00%
PTT Group Accounting Structure
Others Fair valueBaania (Thailand) Company Ltd. Baania 2.73%HG Robotics Plc. HG Robotics 9.49%Innospace (Thailand) Innospace 15.75%Sunfolding, Inc. Sunfolding 5.59%Luminar Technologies, Inc. Luminar Technologies 0.06%
Others Fair valueSarn Palung Social Enterprise Company Ltd. SPSE 20.00%Dhipaya Insurance Plc. TIP 13.33%
Joint Ventures EquitySuez Environmental Services Co.,Ltd. SES 40.00%
41
E&P and Gas Business Group International Trading Business GroupPetrochemicals &
Refining Business Group
Oil Business Group
Technology and Engineering Business Group International Investment Business Group
Others
3/ Entire business transfer to TOP on 1 Feb. 20214/ PTT holds 100.00% of BSA’s ordinary shares, PTT’s ownership interest in BSA is 100%

14,200
2,000
12,000
24,354
3,000
13,000
2,00012,236
7,0004,000
3,884
3,222
6,346
18,38622,555
-
20,000
40,000
60,000
80,000
100,000
120,000
140,000
-
5,000
10,000
15,000
20,000
25,000
30,000
35,000
40,000USD (LHS)
THB (LHS)
PTT Debt Outstanding (RHS)
84,702 92,487 91,451
369,409449,943 443,644
32,67953,946 57,092
236,049
288,567345,610
117,381 146,433 148,543
605,458
738,510789,254
31 Dec 19 31 Dec 20 30 Jun 21 31 Dec 19 31 Dec 20 30 Jun 21
USD&Others THB
Debt Profile : Control Cost & Manage Risk
Debt Portfolio
Managed debt according to financial risk and policy
ConsolidatedPTT OnlyUnit : MMTHB : Cost of debts ~ 4.60%
: % fixed-rate ~ 77.66%: Avg. debt life ~ 17.38 years
: Cost of debts ~ 3.56%
: % fixed-rate ~ 73.59%: Avg. debt life ~ 11.42 years
(38%)
(62%)
(37%)
(63%)
(44%)
(56%)
(39%)
(61%)
(28%)
(72%)
(39%)
(61%)
Note : 1. PTT Data as of 30 Jun 21 (THB/USD = 32.2219 THB/JPY = 0.2940) excluding liabilities from finance leases.
3. Cost of debts, % fixed rate, and avg. debt life took into account the derivative transactions, including withholding tax (update as of 30 Jun 21).
2. Debt Outstanding represents amount and portion before derivative swaps, and reconciled with accounting.
FX: 32.2219
As of 30 Jun 21
*PTTC10DA (C entury Bonds) is due on 2 Dec 2110
Unit : MMTHB
Note: 1. Debt O utstanding for Repayment Profile represents financial data and portion after derivative swaps
2. Bond repayment amounting 3,884 MB in 2022 is THB swaps to USD and amounting 6,236 MB in 2035 is USD swaps to THB
5,884
15,458
PTT Only : Debt Outstanding and Repayment Profile
42

Gas Business RoadmapShort term Gas Demand growth be maintained
Thailand Gas Demand Outlook (Short Term – 5 year plan)
LNG Terminal 2
+7.5 MTA
New SupplyAdditional capacity
(mmscfd)
Major Project : COD & Capacity/
Accumulate Pipeline distance
5th pipeline
RA#6 Pipeline
4,702 KM
Bongkot Erawan
700 800
GSP#7*
460 mmscfd
BPK-SB** pipeline
4,776 KM
43
*Replace GSP#1 **Bang Pakong–South Bangkok Power Plant

4545
Natural Gas Price Structure : As of Jun 2021
CustomersSales Price Structure
Gas Pool Price Supply Margins Pipeline Tariffs+ +
Average Purchased Gas Price
1.75%
1.75%
9.33%
21.7 Bt/MMBtu
Charged at the same price structure of power producers
Reference to a bi-weekly average of Platt’s FOB Arub Gulf price
Charged at prices comparable to fuel oil
Gas prices are mostly agreed under long term contracts and volatility pass-through to ensure stable returns
Profit-sharing mechanism based on market prices of petrochemicals
Reference to Naphtha market price
At GSPs cost (adjusted every 3 months)
*
*
*
* EGAT IPP and SPP Supply Margins not more than 2.1525 and 11.4759 bt/mmbtu respectively
44
GSP 21%
Petrochemicals Feedstocks
Industry 17%
Ethane, Propane, LPG
NGL
Local Cooking Gas
Export Cooking Gas
Power Producers 59%
: EGAT 17%
: IPP 14%
: SPP 28%
Charged at Avg. gas cost + Operating cost (3.892 bt/kg) for both Public & Private vehiclesNGV’s selling price reflects the natural gas cost and operating cost* (including gas quality adjustment) * The allowed operating cost is still regulated and not fully cover PTT’s operating cost
A s of 16 Jul 2021 = 14.55 Baht/Kg.
Public transportation vehicles : regulated and capped to minimize the impact from the rising global crude prices on end-users• Since 16 May 2018 : Allowance to adjust NGV public price from 10.62 Baht/Kg. to 13.62 Baht/Kg. by every 4 month (16 May 19, 16 Sep 19 and 16 Jan 20)• Since 1 Jan 2021 : Use the same pricing as private vehiclesPrivate vehicles: reflect the natural gas cost, gas quality adjustment and operating cost (not fully cover PTT’s operating cost)• Since 16 Jul 2016 : The retail price is set to reflect the natural gas cost but operating cost is still regulated• Since 5 Sep 2017 : Allowance to adjusted +0.46 Baht/Kg. to 3.8920 Baht/Kg. for gas quality improvement cost
NGV 3%

Gas Business Generates Stable Returns
Sole owner and operator of entire
gas transmission pipelines in
Thailand (~ 4,000 km), a regulated
business
• IRROE ranges between
12.5% - 18% for transmission
pipeline investment
Supply & marketing of natural gas
provides fixed margin with long-term
contracts of 25-30 years
6 Gas Separation Plants; Total
production 6.7 MTA; are on
petrochemical market price-linked
profit sharing basis
Overview Gas transmission pipeline capacity
Gas Separation Plant Capacity
Unit 1 420 MMcf/d
Unit 2 and 3 820 MMcf/d
Unit 4 170 MMcf/d
Unit 5 580 MMcf/d
Unit 6 880 MMcf/d
45

PTT Group Clean & Green Strategic Execution
2030 GOAL
Aim to achieve Carbon Neutrality By 2065-2070 (align with "National Energy Plan")
Aim to reduce GHG emission15% from 2020
Continue execution in GHG reductionand initiate carbon price application to enable green investment
2012
Base year
2018 2021 2030
Financial & investment Mechanism
Carbon Exchange Platform
EnablerCarbon Neutral Framework
Scope 3 (Other Indirect Greenhouse Gas Emission)
Scope 1+2
Carbon Credit Offset
Reforestation & Community GHG Project
Biofuel / Low Carbon Product Electric Mobility
Renewable Energy in Operations
Process Optimization & Energy Efficiency (All facilities)
(All facilities)
CO2 Utilization and Storage (PTTEP, PTT)
Renewable/New Energy Investment(PTT, GPSC)
(PTT)(OR, GC, IRPC, TOP, INI)
(CSR)
R&D Partnership
As Hidden Price in Feasibility Study
Review and adjust price to ensure meeting GHG reduction target
Apply Carbon Price in Investment Decision Process
per ton CO2e
STRATEGIC DIRECTION
to achieve GHG reduction
and manage carbon intensity
Circular Economy(GC, IRPC)
(Direct and Indirect
Greenhouse Gas Emissions)
46

PTT Suggestion for Thailand moving toward low carbon society
Economic tools
Business expansion
Regulationestablishment
& revision
Provide incentives for GHG reduction activities
e.g. tax exemption, low interest loan
Develop clear rules and regulation for carbon
taxes, if imposed
Establish carbon credit platform and support for
transparent trade
Support the potential businesses in GHG
reduction technology
Improve regulations tosupport
CCUS and related technology
Promote wider participation in ‘Low Carbon Business’ among SMEs
Promote ‘Ecotourism’ to offset with the loss from fuel tax income as well as cope with the trends
Energy efficiency in public/private sector
the participation of public sector in reforestation
47

PTT Sustainability Strategic Direction
Sufficiency Economy ESG
Reasonableness Prudence Social Governance & Economics
Environmental
DJSI SDGs
Sufficiency Economy
SUSTAINABILITY as Business Goal
Operate with Integrity (GRC)
Economic Drive by creating ‘Next Growth’
Circular Economy
Low Carbon Society
Social Shared Value
Workforce for
New Growth
PTT’s Sustainability DNA
Sustainable Production and Consumption
ENVIRONMENTAL GOVERNANCE
Good Governance and Performance Excellence
SOCIALPeople’s
Well-being
Safety and Human Rights
VirtuesKnowledge
Moderation
โลกเราตอ้งรกัษ์ สงัคมไทยเราตอ้งอุม้ชู ผลด าเนนิงานเราตอ้งเลศิ
48