2Q 2017 Investor Update - Amazon Web Services€¦ · 2Q 2017 Investor Update Rick Muncrief,...
25
2Q 2017 Investor Update Rick Muncrief, Chairman and Chief Executive Officer August 3, 2017 1
Transcript of 2Q 2017 Investor Update - Amazon Web Services€¦ · 2Q 2017 Investor Update Rick Muncrief,...

2Q 2017 Investor Update
Rick Muncrief, Chairman and Chief Executive OfficerAugust 3, 2017
1
2
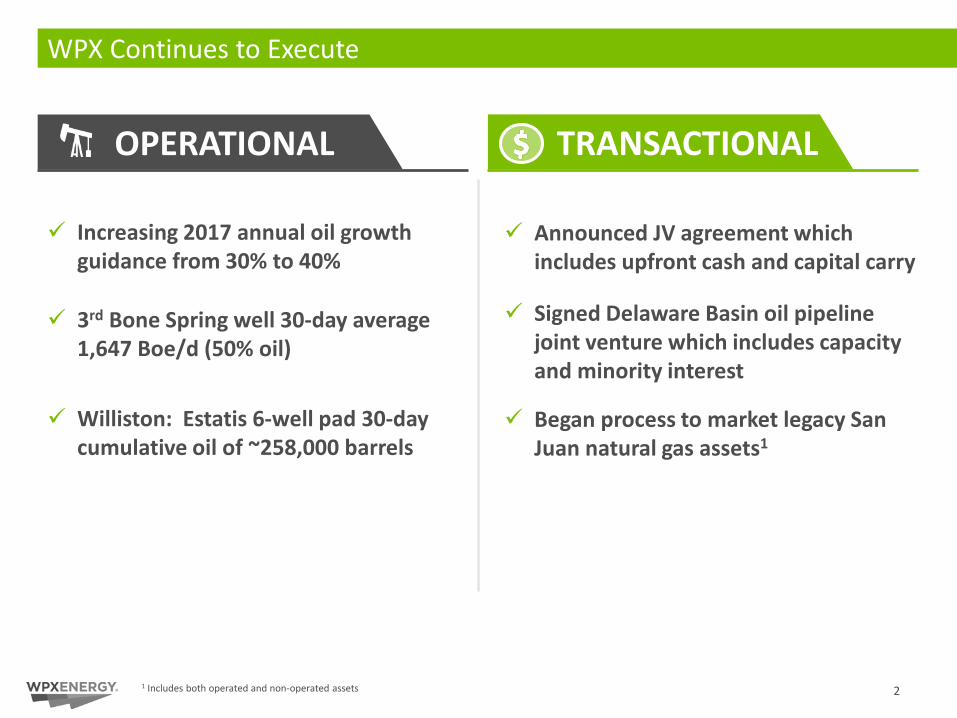
WPX Continues to Execute
Increasing 2017 annual oil growth guidance from 30% to 40%
3rd Bone Spring well 30-day average 1,647 Boe/d (50% oil)
Williston: Estatis 6-well pad 30-day cumulative oil of ~258,000 barrels
OPERATIONAL TRANSACTIONAL
Announced JV agreement which includes upfront cash and capital carry
Signed Delaware Basin oil pipeline joint venture which includes capacity and minority interest
Began process to market legacy San Juan natural gas assets1
1 Includes both operated and non-operated assets
3
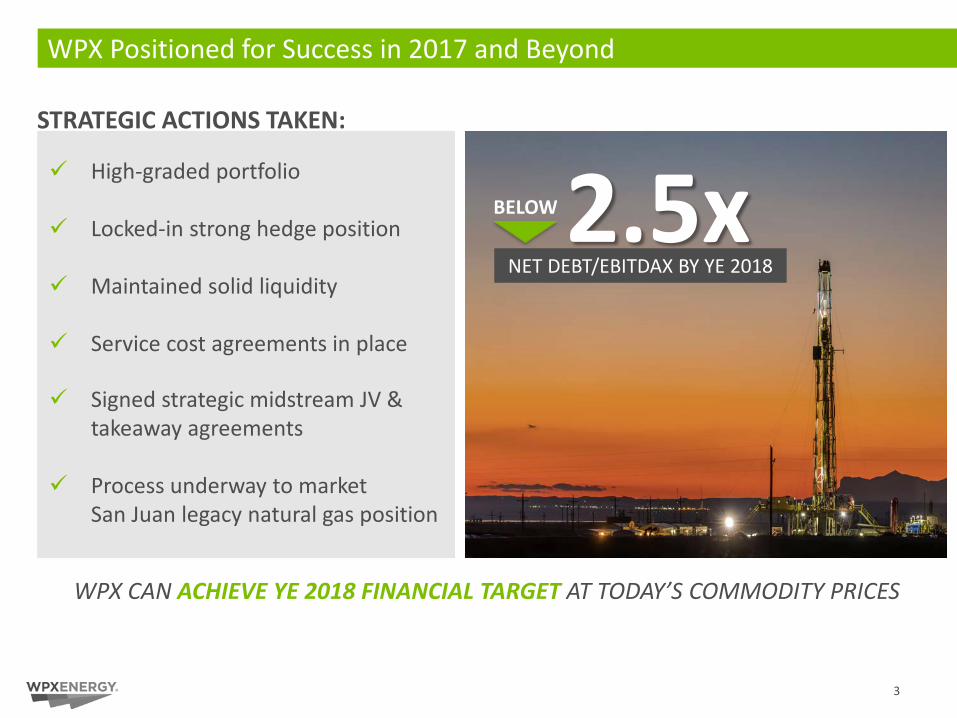
WPX Positioned for Success in 2017 and Beyond
High-graded portfolio
Locked-in strong hedge position
Maintained solid liquidity
Service cost agreements in place
Signed strategic midstream JV & takeaway agreements
Process underway to market San Juan legacy natural gas position
STRATEGIC ACTIONS TAKEN:
2.5xBELOW
NET DEBT/EBITDAX BY YE 2018
WPX CAN ACHIEVE YE 2018 FINANCIAL TARGET AT TODAY’S COMMODITY PRICES
Clay Gaspar, Chief Operating Officer
Operational Update
5
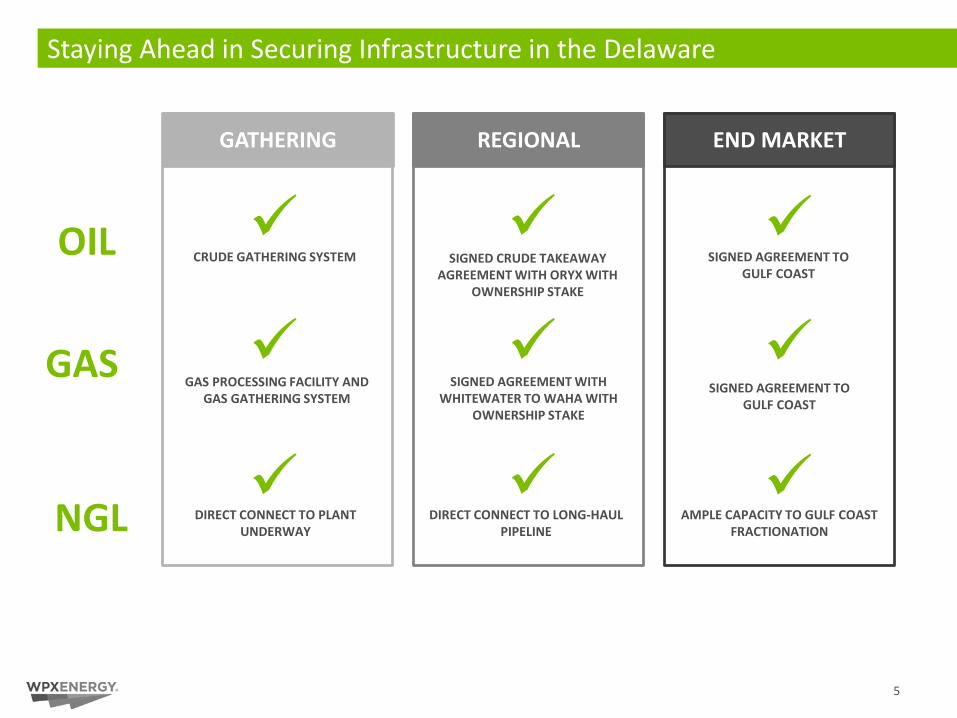
Staying Ahead in Securing Infrastructure in the Delaware
GATHERING REGIONAL END MARKET
NGL
GASGAS PROCESSING FACILITY AND
GAS GATHERING SYSTEMSIGNED AGREEMENT WITH
WHITEWATER TO WAHA WITH OWNERSHIP STAKE
SIGNED AGREEMENT TO GULF COAST
OIL SIGNED AGREEMENT TO GULF COAST
CRUDE GATHERING SYSTEM SIGNED CRUDE TAKEAWAY AGREEMENT WITH ORYX WITH
OWNERSHIP STAKE
DIRECT CONNECT TO PLANT UNDERWAY
DIRECT CONNECT TO LONG-HAUL PIPELINE
AMPLE CAPACITY TO GULF COAST FRACTIONATION

1 MILE
350
FT
6
Wolfcamp A: Shut-In Test Confirms 15 Wells Per DSU
15H-WELL SHUT IN
10
100
1,000
10,000
4/2/2017 5/2/2017 6/2/2017 7/2/2017
OIL
RAT
E, S
TBD
DATE TIME
15H 14H 16H 17H 13H
15H SHUT IN
14H 16H
RESULTS FROM TEST: Minimal communication of offset
wells after 15H well shut-in
WHY ITS IMPORTANT: Validates 330’ spacing in Stateline
Upper/Lower Wolfcamp A
TESTING 15 WELLS PER DSU
13H 15H 17H
7
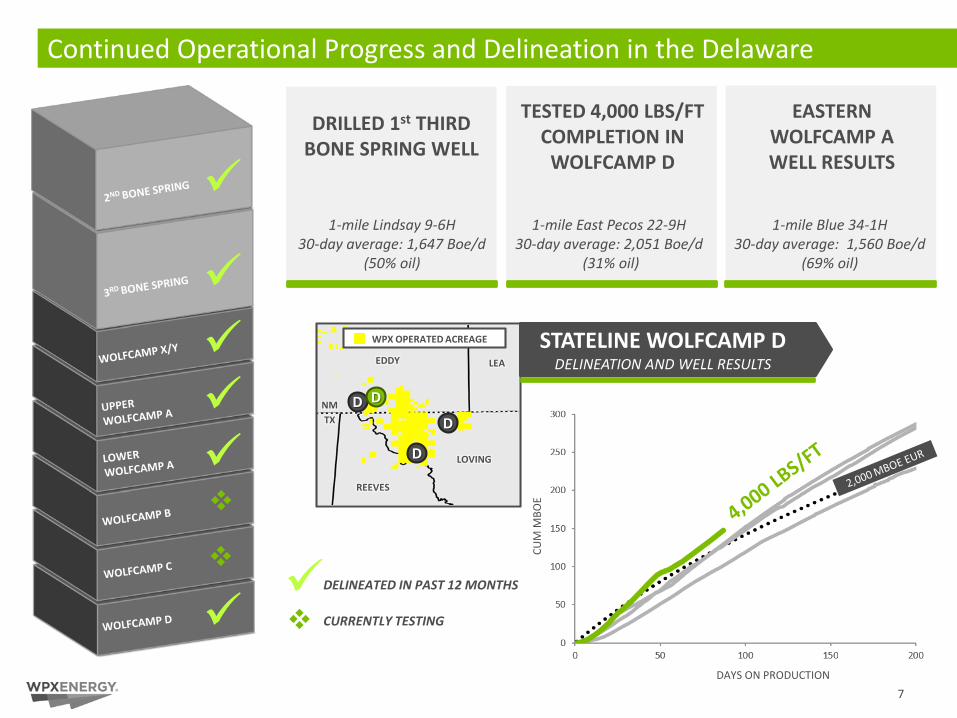
Continued Operational Progress and Delineation in the Delaware
STATELINE WOLFCAMP DDELINEATION AND WELL RESULTS
NMTX
LEAEDDY
LOVING
D
D
D
REEVES
D
WPX OPERATED ACREAGE
DELINEATED IN PAST 12 MONTHS
CURRENTLY TESTING
DAYS ON PRODUCTION
1-mile Lindsay 9-6H30-day average: 1,647 Boe/d
(50% oil)
DRILLED 1st THIRD BONE SPRING WELL
1-mile East Pecos 22-9H 30-day average: 2,051 Boe/d
(31% oil)
TESTED 4,000 LBS/FT COMPLETION IN
WOLFCAMP D
1-mile Blue 34-1H30-day average: 1,560 Boe/d
(69% oil)
EASTERN WOLFCAMP A WELL RESULTS
CUM
MBO
E
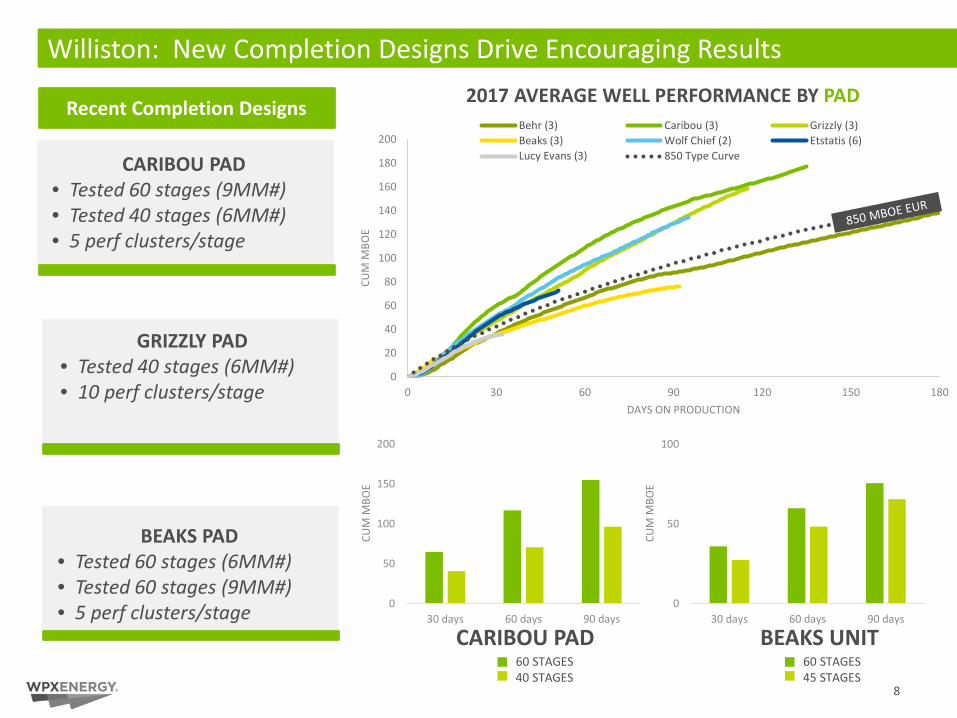
Williston: New Completion Designs Drive Encouraging Results
0
20
40
60
80
100
120
140
160
180
200
0 30 60 90 120 150 180
Behr (3) Caribou (3) Grizzly (3)Beaks (3) Wolf Chief (2) Etstatis (6)Lucy Evans (3) 850 Type Curve
0
50
100
150
200
30 days 60 days 90 days
CARIBOU PAD • Tested 60 stages (9MM#)• Tested 40 stages (6MM#)• 5 perf clusters/stage
GRIZZLY PAD • Tested 40 stages (6MM#)• 10 perf clusters/stage
BEAKS PAD • Tested 60 stages (6MM#)• Tested 60 stages (9MM#)• 5 perf clusters/stage 0
50
100
30 days 60 days 90 days
BEAKS UNITCARIBOU PAD
2017 AVERAGE WELL PERFORMANCE BY PAD
60 STAGES40 STAGES
60 STAGES45 STAGES
CUM
MBO
E
CUM
MBO
E
CUM
MBO
E
DAYS ON PRODUCTION
8
Recent Completion Designs
0
10
20
30
40
50
60
70
80
90
100
0 20 40 60 80 100 120
9
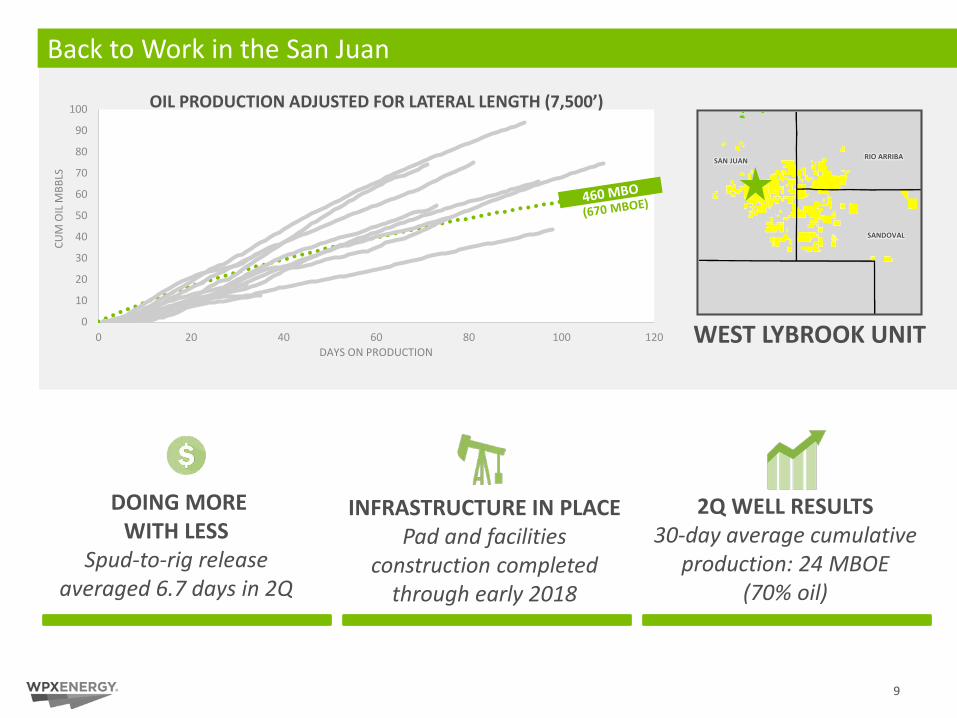
Back to Work in the San Juan
DOING MORE WITH LESS
Spud-to-rig release averaged 6.7 days in 2Q
INFRASTRUCTURE IN PLACEPad and facilities
construction completed through early 2018
2Q WELL RESULTS30-day average cumulative
production: 24 MBOE (70% oil)
SAN JUAN
SANDOVAL
RIO ARRIBA
CUM
OIL
MBB
LS
DAYS ON PRODUCTIONWEST LYBROOK UNIT
OIL PRODUCTION ADJUSTED FOR LATERAL LENGTH (7,500’)

Kevin Vann, Chief Financial Officer
Financial Update
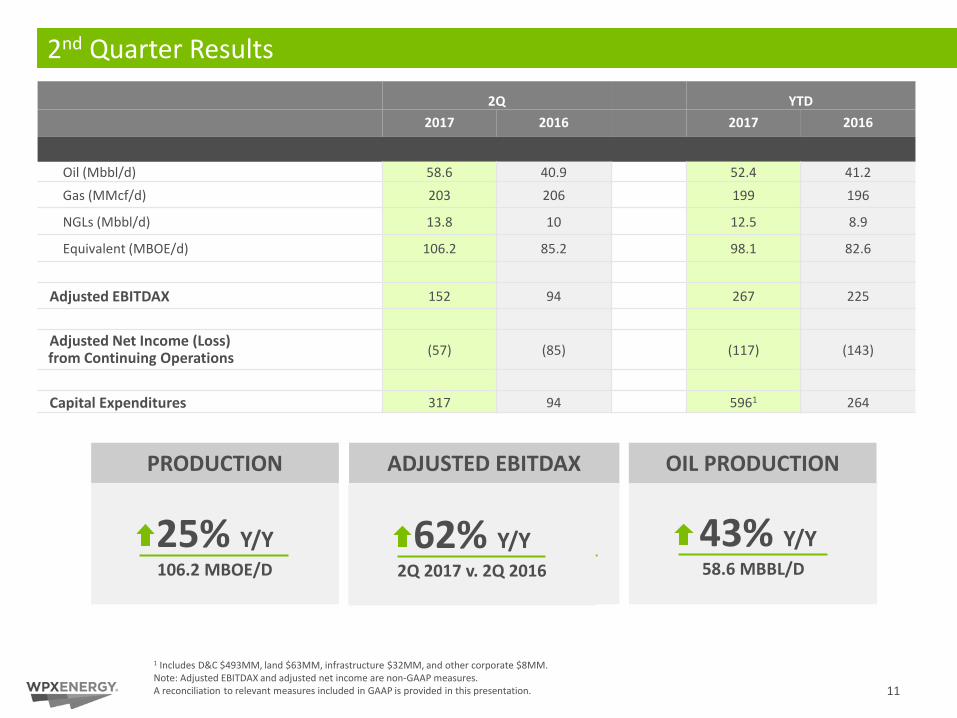
2Q YTD2017 2016 2017 2016
Average Daily ProductionOil (Mbbl/d) 58.6 40.9 52.4 41.2Gas (MMcf/d) 203 206 199 196
NGLs (Mbbl/d) 13.8 10 12.5 8.9
Equivalent (MBOE/d) 106.2 85.2 98.1 82.6
Adjusted EBITDAX 152 94 267 225
Adjusted Net Income (Loss) from Continuing Operations (57) (85) (117) (143)
Capital Expenditures 317 94 5961 264
Dollars in millions, except production numbers2nd Quarter Results
1 Includes D&C $493MM, land $63MM, infrastructure $32MM, and other corporate $8MM.Note: Adjusted EBITDAX and adjusted net income are non-GAAP measures.A reconciliation to relevant measures included in GAAP is provided in this presentation.
PRODUCTION
25% Y/Y106.2 MBOE/D
ADJUSTED EBITDAX
43% Y/Y58.6 MBBL/D
11
OIL PRODUCTION
62% Y/Y2Q 2017 v. 2Q 2016
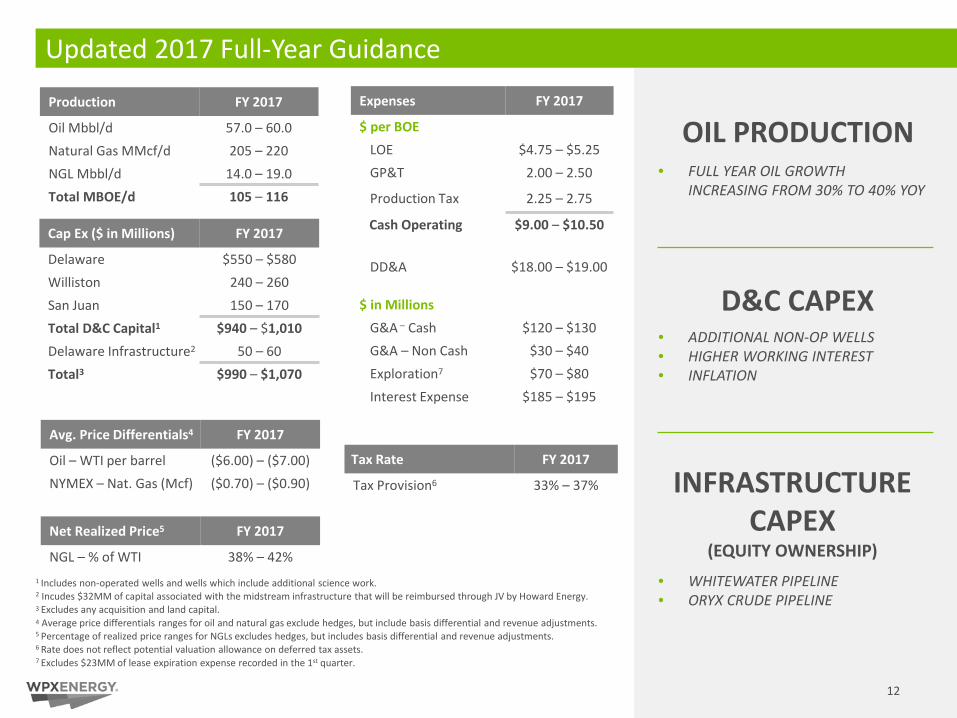
Production FY 2017
Oil Mbbl/d 57.0 – 60.0Natural Gas MMcf/d 205 – 220NGL Mbbl/d 14.0 – 19.0Total MBOE/d 105 – 116
Expenses FY 2017
$ per BOELOE $4.75 – $5.25GP&T 2.00 – 2.50
Production Tax 2.25 – 2.75
Cash Operating $9.00 – $10.50
DD&A $18.00 – $19.00
$ in MillionsG&A – Cash $120 – $130G&A – Non Cash $30 – $40Exploration7 $70 – $80 Interest Expense $185 – $195
Updated 2017 Full-Year Guidance
Tax Rate FY 2017
Tax Provision6 33% – 37%
Net Realized Price5 FY 2017
NGL – % of WTI 38% – 42%
Cap Ex ($ in Millions) FY 2017
Delaware $550 – $580Williston 240 – 260San Juan 150 – 170Total D&C Capital1 $940 – $1,010Delaware Infrastructure2 50 – 60Total3 $990 – $1,070
1 Includes non-operated wells and wells which include additional science work.2 Incudes $32MM of capital associated with the midstream infrastructure that will be reimbursed through JV by Howard Energy.3 Excludes any acquisition and land capital.4 Average price differentials ranges for oil and natural gas exclude hedges, but include basis differential and revenue adjustments.5 Percentage of realized price ranges for NGLs excludes hedges, but includes basis differential and revenue adjustments.6 Rate does not reflect potential valuation allowance on deferred tax assets.7 Excludes $23MM of lease expiration expense recorded in the 1st quarter.
Avg. Price Differentials4 FY 2017
Oil – WTI per barrel ($6.00) – ($7.00)NYMEX – Nat. Gas (Mcf) ($0.70) – ($0.90)
12
OIL PRODUCTION
D&C CAPEX• ADDITIONAL NON-OP WELLS• HIGHER WORKING INTEREST• INFLATION
INFRASTRUCTURE CAPEX
(EQUITY OWNERSHIP)
• WHITEWATER PIPELINE• ORYX CRUDE PIPELINE
• FULL YEAR OIL GROWTH INCREASING FROM 30% TO 40% YOY
PE
LPI
CXO QEPEGN
JAG PDCE
SMRRC
ECA
PXDMTDR
RSPP
CRZOOAS FANG DVNNBL
WLLXEC
CHK0%
10%
20%
30%
40%
50%
60%
70%
80%
$46.00 $48.00 $50.00 $52.00 $54.00 $56.00 $58.00
% o
f 201
8 O
il Pr
oduc
tion
Hedg
ed
Average Price Hedged
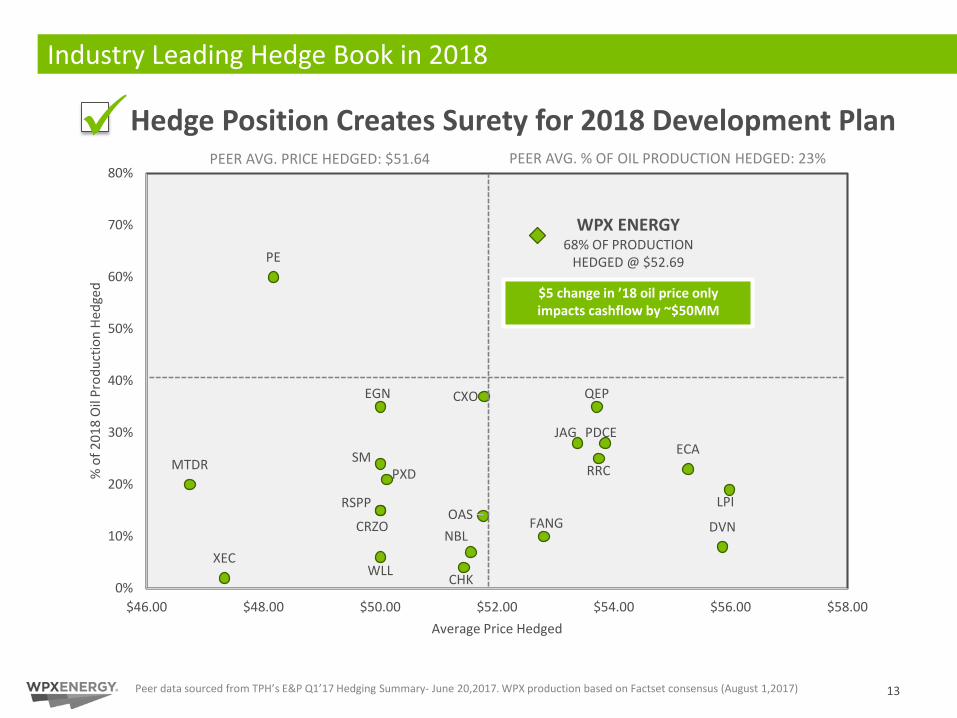
$5 change in ’18 oil price only impacts cashflow by ~$50MM
13
Industry Leading Hedge Book in 2018
PEER AVG. % OF OIL PRODUCTION HEDGED: 23%PEER AVG. PRICE HEDGED: $51.64
Hedge Position Creates Surety for 2018 Development Plan
Peer data sourced from TPH’s E&P Q1’17 Hedging Summary- June 20,2017. WPX production based on Factset consensus (August 1,2017)
WPX ENERGY68% OF PRODUCTION
HEDGED @ $52.69
14
TRACK RECORD OF EXECUTION
Appendix
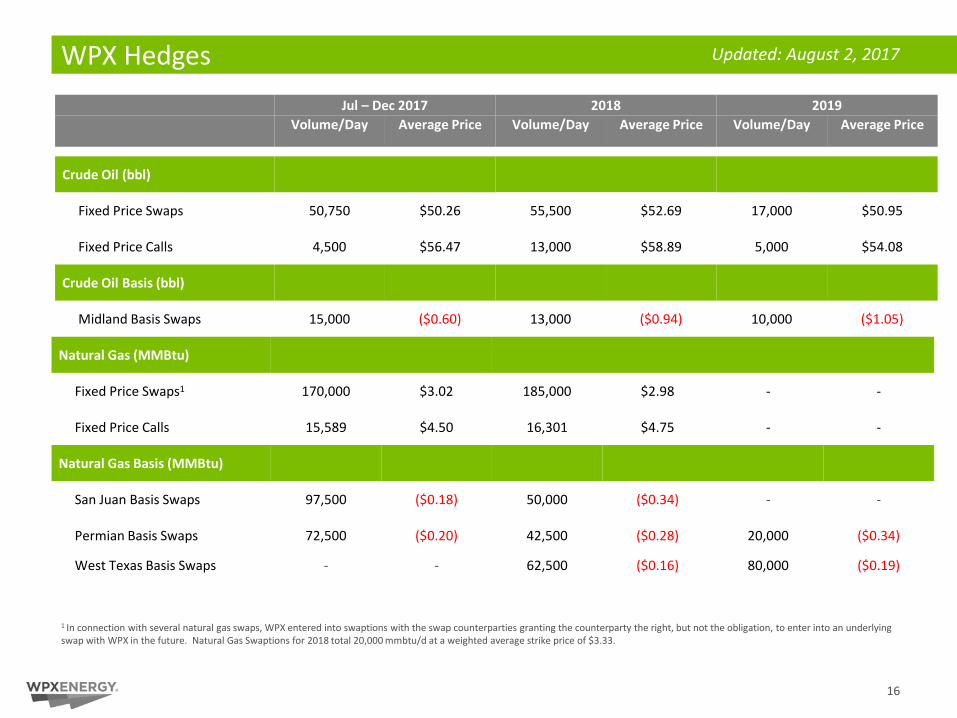
WPX Hedges Jul – Dec 2017 2018 2019
Volume/Day Average Price Volume/Day Average Price Volume/Day Average Price
1 In connection with several natural gas swaps, WPX entered into swaptions with the swap counterparties granting the counterparty the right, but not the obligation, to enter into an underlying swap with WPX in the future. Natural Gas Swaptions for 2018 total 20,000 mmbtu/d at a weighted average strike price of $3.33.
Natural Gas (MMBtu)
Fixed Price Swaps1 170,000 $3.02 185,000 $2.98 - -
Fixed Price Calls 15,589 $4.50 16,301 $4.75 - -
Natural Gas Basis (MMBtu)
San Juan Basis Swaps 97,500 ($0.18) 50,000 ($0.34) - -
Permian Basis Swaps 72,500 ($0.20) 42,500 ($0.28) 20,000 ($0.34)
West Texas Basis Swaps - - 62,500 ($0.16) 80,000 ($0.19)
Crude Oil (bbl)
Fixed Price Swaps 50,750 $50.26 55,500 $52.69 17,000 $50.95
Fixed Price Calls 4,500 $56.47 13,000 $58.89 5,000 $54.08
Crude Oil Basis (bbl)
Midland Basis Swaps 15,000 ($0.60) 13,000 ($0.94) 10,000 ($1.05)
Updated: August 2, 2017
16
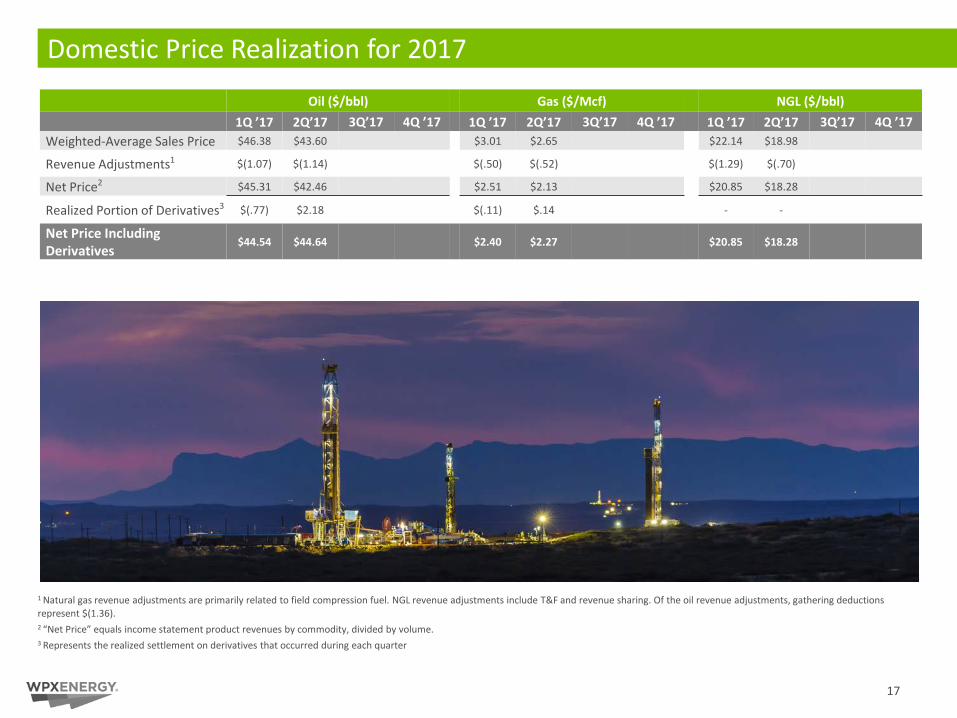
Domestic Price Realization for 2017
Oil ($/bbl) Gas ($/Mcf) NGL ($/bbl)1Q ’17 2Q’17 3Q’17 4Q ’17 1Q ’17 2Q’17 3Q’17 4Q ’17 1Q ’17 2Q’17 3Q’17 4Q ’17
Weighted-Average Sales Price $46.38 $43.60 $3.01 $2.65 $22.14 $18.98
Revenue Adjustments1 $(1.07) $(1.14) $(.50) $(.52) $(1.29) $(.70)
Net Price2 $45.31 $42.46 $2.51 $2.13 $20.85 $18.28
Realized Portion of Derivatives3 $(.77) $2.18 $(.11) $.14 - -
Net Price Including Derivatives
$44.54 $44.64 $2.40 $2.27 $20.85 $18.28
1 Natural gas revenue adjustments are primarily related to field compression fuel. NGL revenue adjustments include T&F and revenue sharing. Of the oil revenue adjustments, gathering deductions represent $(1.36).2 “Net Price” equals income statement product revenues by commodity, divided by volume.3 Represents the realized settlement on derivatives that occurred during each quarter
17
0%
20%
40%
60%
80%
100%
Oil Natural Gas
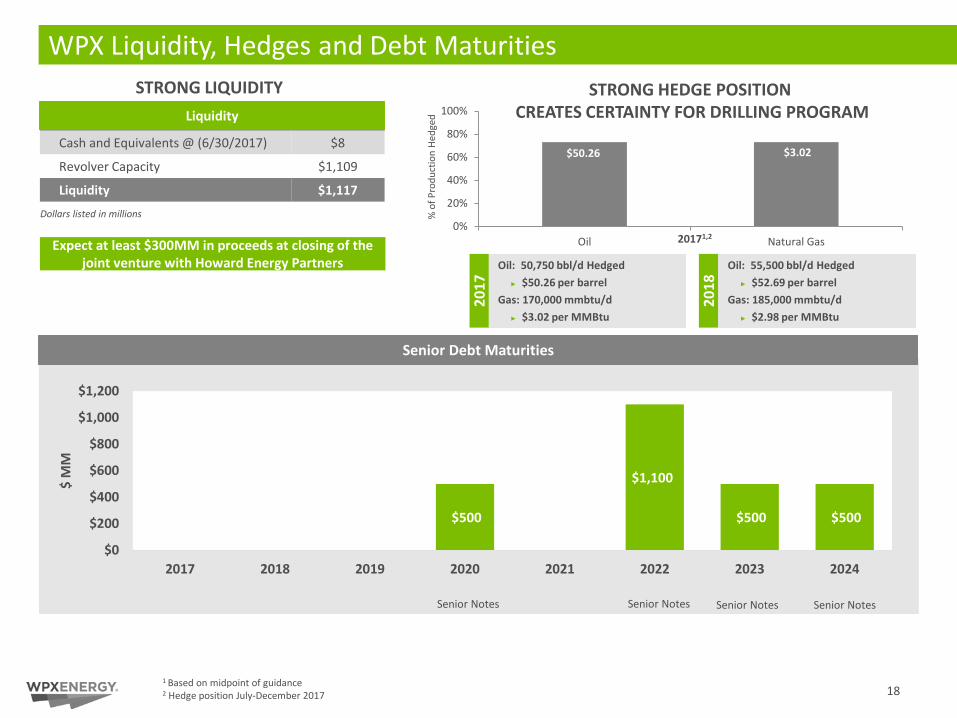
WPX Liquidity, Hedges and Debt Maturities
Cash and Equivalents @ (6/30/2017) $8
Revolver Capacity $1,109
Liquidity $1,117
Senior Debt Maturities
Senior Notes Senior Notes Senior NotesSenior Notes
$50.26
% o
f Pro
duct
ion
Hedg
ed $3.93
1 Based on midpoint of guidance2 Hedge position July-December 2017
20171,2
STRONG HEDGE POSITION CREATES CERTAINTY FOR DRILLING PROGRAM
Oil: 55,500 bbl/d Hedged► $52.69 per barrel
Gas: 185,000 mmbtu/d► $2.98 per MMBtu
Oil: 50,750 bbl/d Hedged► $50.26 per barrel
Gas: 170,000 mmbtu/d► $3.02 per MMBtu
2018
2017
Liquidity
Dollars listed in millions
STRONG LIQUIDITY
$3.02
18
$500
$1,100
$500 $500
$0
$200
$400
$600
$800
$1,000
$1,200
2017 2018 2019 2020 2021 2022 2023 2024
$ M
M
Expect at least $300MM in proceeds at closing of the joint venture with Howard Energy Partners
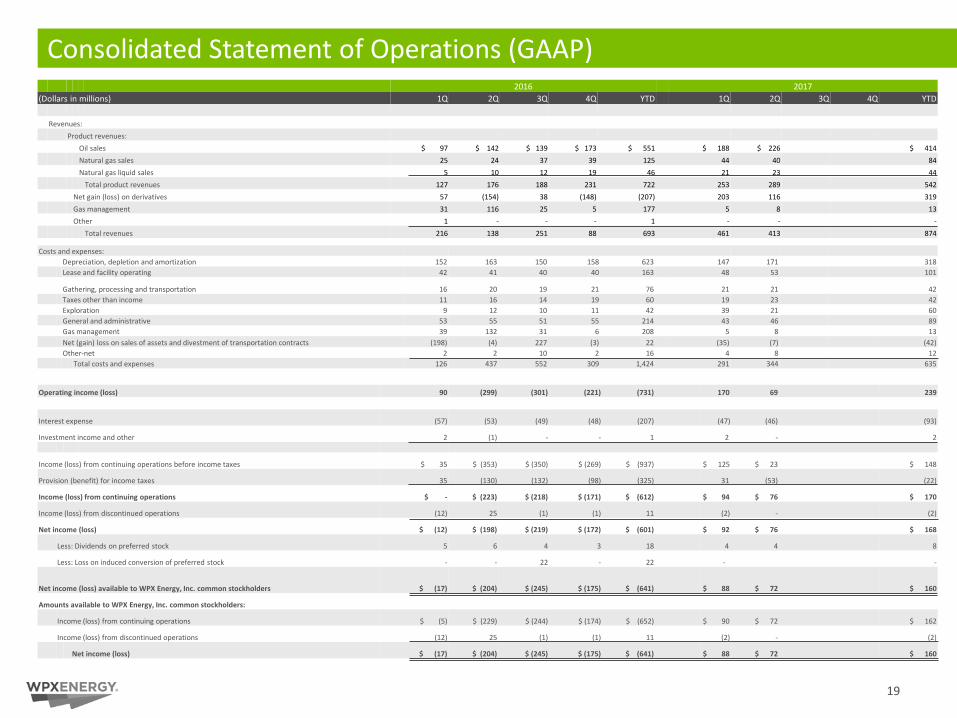
Operating income (loss) 90 (299) (301) (221) (731) 170 69 239
Interest expense (57) (53) (49) (48) (207) (47) (46) (93)
Investment income and other 2 (1) - - 1 2 - 2
Income (loss) from continuing operations before income taxes $ 35 $ (353) $ (350) $ (269) $ (937) $ 125 $ 23 $ 148
Provision (benefit) for income taxes 35 (130) (132) (98) (325) 31 (53) (22)
Income (loss) from continuing operations $ - $ (223) $ (218) $ (171) $ (612) $ 94 $ 76 $ 170
Income (loss) from discontinued operations (12) 25 (1) (1) 11 (2) - (2)
Net income (loss) $ (12) $ (198) $ (219) $ (172) $ (601) $ 92 $ 76 $ 168
Less: Dividends on preferred stock 5 6 4 3 18 4 4 8
Less: Loss on induced conversion of preferred stock - - 22 - 22 - -
Net income (loss) available to WPX Energy, Inc. common stockholders $ (17) $ (204) $ (245) $ (175) $ (641) $ 88 $ 72 $ 160
Amounts available to WPX Energy, Inc. common stockholders:
Income (loss) from continuing operations $ (5) $ (229) $ (244) $ (174) $ (652) $ 90 $ 72 $ 162
Income (loss) from discontinued operations (12) 25 (1) (1) 11 (2) - (2)
Net income (loss) $ (17) $ (204) $ (245) $ (175) $ (641) $ 88 $ 72 $ 160
19
Consolidated Statement of Operations (GAAP)2016 2017
(Dollars in millions) 1Q 2Q 3Q 4Q YTD 1Q 2Q 3Q 4Q YTD
Revenues:Product revenues:
Oil sales $ 97 $ 142 $ 139 $ 173 $ 551 $ 188 $ 226 $ 414 Natural gas sales 25 24 37 39 125 44 40 84 Natural gas liquid sales 5 10 12 19 46 21 23 44
Total product revenues 127 176 188 231 722 253 289 542 Net gain (loss) on derivatives 57 (154) 38 (148) (207) 203 116 319 Gas management 31 116 25 5 177 5 8 13 Other 1 - - - 1 - - -
Total revenues 216 138 251 88 693 461 413 874
Costs and expenses:Depreciation, depletion and amortization 152 163 150 158 623 147 171 318 Lease and facility operating 42 41 40 40 163 48 53 101
Gathering, processing and transportation 16 20 19 21 76 21 21 42 Taxes other than income 11 16 14 19 60 19 23 42 Exploration 9 12 10 11 42 39 21 60 General and administrative 53 55 51 55 214 43 46 89 Gas management 39 132 31 6 208 5 8 13 Net (gain) loss on sales of assets and divestment of transportation contracts (198) (4) 227 (3) 22 (35) (7) (42)Other-net 2 2 10 2 16 4 8 12
Total costs and expenses 126 437 552 309 1,424 291 344 635
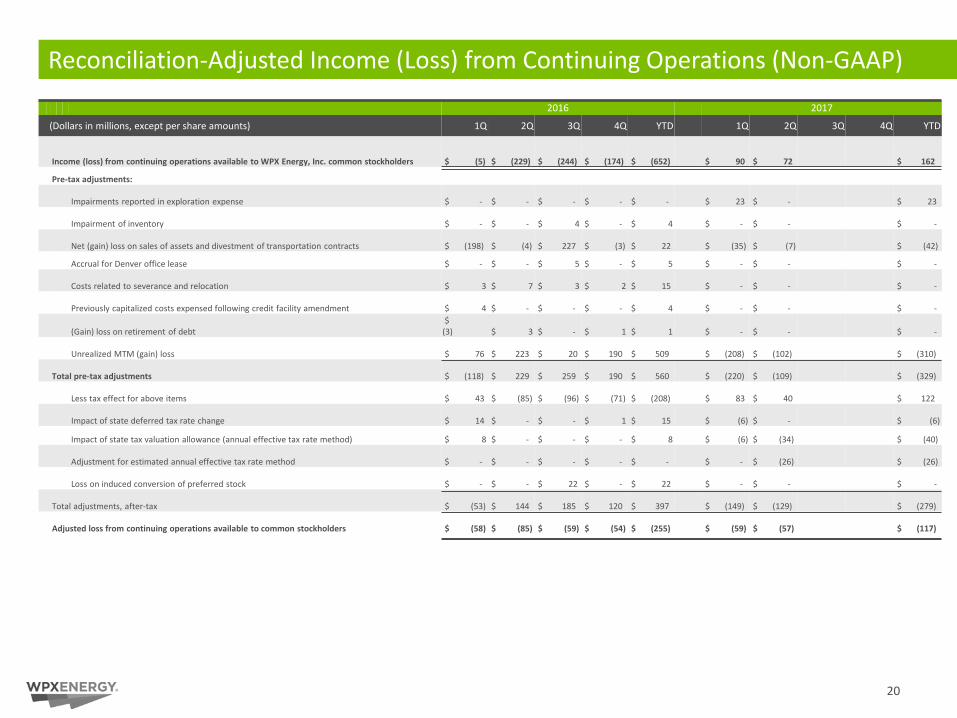
Reconciliation-Adjusted Income (Loss) from Continuing Operations (Non-GAAP)
2016 2017
(Dollars in millions, except per share amounts) 1Q 2Q 3Q 4Q YTD 1Q 2Q 3Q 4Q YTD
Income (loss) from continuing operations available to WPX Energy, Inc. common stockholders $ (5) $ (229) $ (244) $ (174) $ (652) $ 90 $ 72 $ 162
Pre-tax adjustments:
Impairments reported in exploration expense $ - $ - $ - $ - $ - $ 23 $ - $ 23
Impairment of inventory $ - $ - $ 4 $ - $ 4 $ - $ - $ -
Net (gain) loss on sales of assets and divestment of transportation contracts $ (198) $ (4) $ 227 $ (3) $ 22 $ (35) $ (7) $ (42)
Accrual for Denver office lease $ - $ - $ 5 $ - $ 5 $ - $ - $ -
Costs related to severance and relocation $ 3 $ 7 $ 3 $ 2 $ 15 $ - $ - $ -
Previously capitalized costs expensed following credit facility amendment $ 4 $ - $ - $ - $ 4 $ - $ - $ -
(Gain) loss on retirement of debt$
(3) $ 3 $ - $ 1 $ 1 $ - $ - $ -
Unrealized MTM (gain) loss $ 76 $ 223 $ 20 $ 190 $ 509 $ (208) $ (102) $ (310)
Total pre-tax adjustments $ (118) $ 229 $ 259 $ 190 $ 560 $ (220) $ (109) $ (329)
Less tax effect for above items $ 43 $ (85) $ (96) $ (71) $ (208) $ 83 $ 40 $ 122
Impact of state deferred tax rate change $ 14 $ - $ - $ 1 $ 15 $ (6) $ - $ (6)
Impact of state tax valuation allowance (annual effective tax rate method) $ 8 $ - $ - $ - $ 8 $ (6) $ (34) $ (40)
Adjustment for estimated annual effective tax rate method $ - $ - $ - $ - $ - $ - $ (26) $ (26)
Loss on induced conversion of preferred stock $ - $ - $ 22 $ - $ 22 $ - $ - $ -
Total adjustments, after-tax $ (53) $ 144 $ 185 $ 120 $ 397 $ (149) $ (129) $ (279)
Adjusted loss from continuing operations available to common stockholders $ (58) $ (85) $ (59) $ (54) $ (255) $ (59) $ (57) $ (117)
20
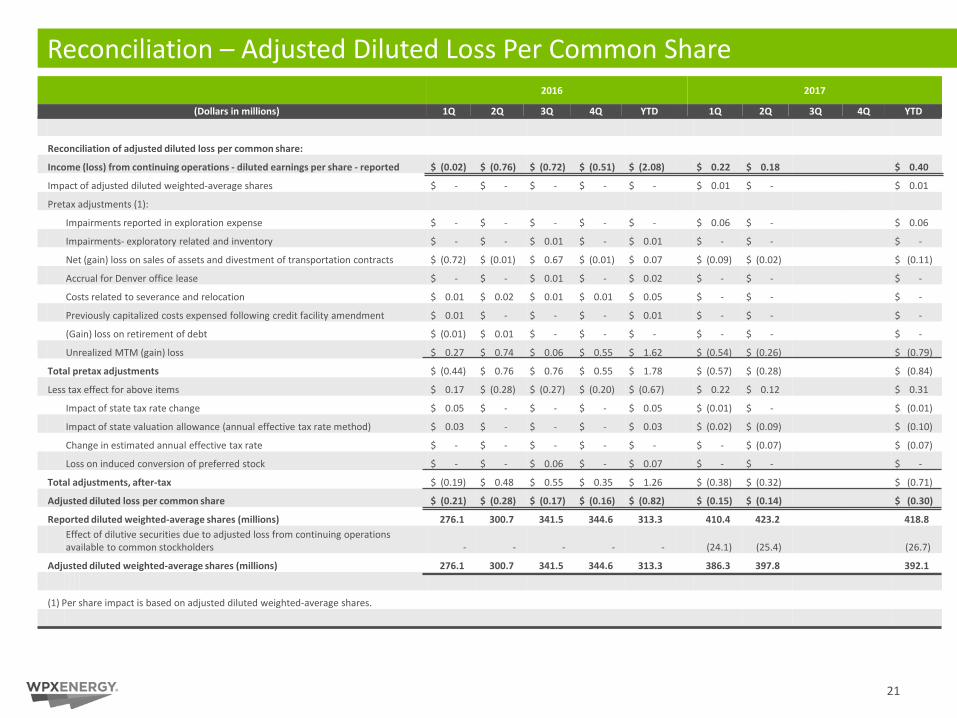
Reconciliation – Adjusted Diluted Loss Per Common Share
21
Reconciliation of adjusted diluted loss per common share:
Income (loss) from continuing operations - diluted earnings per share - reported $ (0.02) $ (0.76) $ (0.72) $ (0.51) $ (2.08) $ 0.22 $ 0.18 $ 0.40
Impact of adjusted diluted weighted-average shares $ - $ - $ - $ - $ - $ 0.01 $ - $ 0.01
Pretax adjustments (1):
Impairments reported in exploration expense $ - $ - $ - $ - $ - $ 0.06 $ - $ 0.06
Impairments- exploratory related and inventory $ - $ - $ 0.01 $ - $ 0.01 $ - $ - $ -
Net (gain) loss on sales of assets and divestment of transportation contracts $ (0.72) $ (0.01) $ 0.67 $ (0.01) $ 0.07 $ (0.09) $ (0.02) $ (0.11)
Accrual for Denver office lease $ - $ - $ 0.01 $ - $ 0.02 $ - $ - $ -
Costs related to severance and relocation $ 0.01 $ 0.02 $ 0.01 $ 0.01 $ 0.05 $ - $ - $ -
Previously capitalized costs expensed following credit facility amendment $ 0.01 $ - $ - $ - $ 0.01 $ - $ - $ -
(Gain) loss on retirement of debt $ (0.01) $ 0.01 $ - $ - $ - $ - $ - $ -
Unrealized MTM (gain) loss $ 0.27 $ 0.74 $ 0.06 $ 0.55 $ 1.62 $ (0.54) $ (0.26) $ (0.79)
Total pretax adjustments $ (0.44) $ 0.76 $ 0.76 $ 0.55 $ 1.78 $ (0.57) $ (0.28) $ (0.84)
Less tax effect for above items $ 0.17 $ (0.28) $ (0.27) $ (0.20) $ (0.67) $ 0.22 $ 0.12 $ 0.31
Impact of state tax rate change $ 0.05 $ - $ - $ - $ 0.05 $ (0.01) $ - $ (0.01)
Impact of state valuation allowance (annual effective tax rate method) $ 0.03 $ - $ - $ - $ 0.03 $ (0.02) $ (0.09) $ (0.10)
Change in estimated annual effective tax rate $ - $ - $ - $ - $ - $ - $ (0.07) $ (0.07)
Loss on induced conversion of preferred stock $ - $ - $ 0.06 $ - $ 0.07 $ - $ - $ -
Total adjustments, after-tax $ (0.19) $ 0.48 $ 0.55 $ 0.35 $ 1.26 $ (0.38) $ (0.32) $ (0.71)
Adjusted diluted loss per common share $ (0.21) $ (0.28) $ (0.17) $ (0.16) $ (0.82) $ (0.15) $ (0.14) $ (0.30)
Reported diluted weighted-average shares (millions) 276.1 300.7 341.5 344.6 313.3 410.4 423.2 418.8Effect of dilutive securities due to adjusted loss from continuing operations available to common stockholders - - - - - (24.1) (25.4) (26.7)
Adjusted diluted weighted-average shares (millions) 276.1 300.7 341.5 344.6 313.3 386.3 397.8 392.1
(1) Per share impact is based on adjusted diluted weighted-average shares.
2016 2017
(Dollars in millions) 1Q 2Q 3Q 4Q YTD 1Q 2Q 3Q 4Q YTD
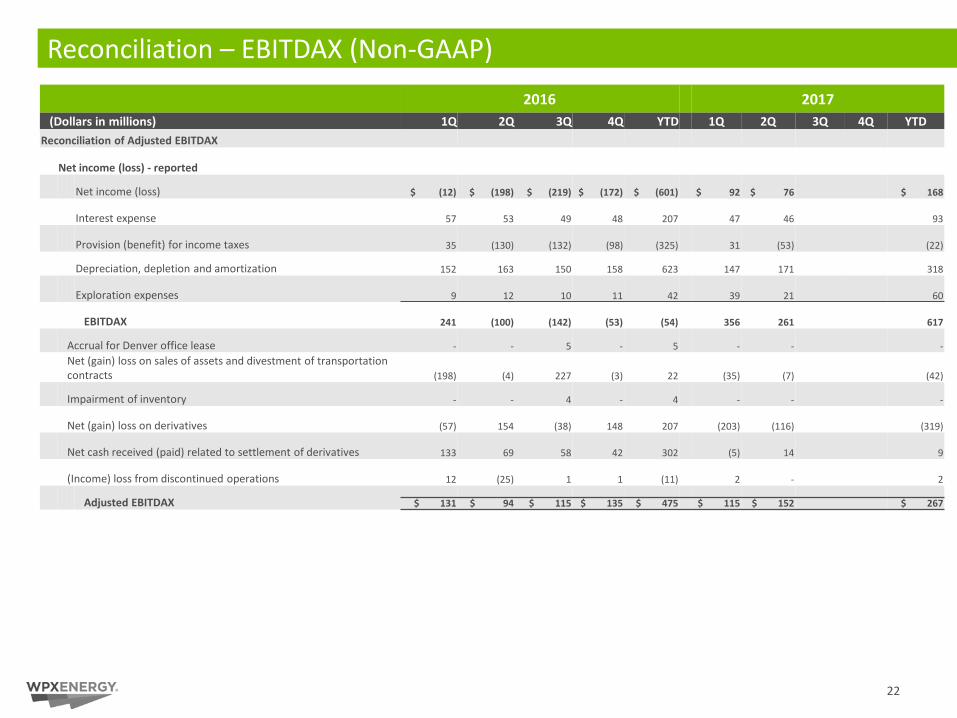
Reconciliation – EBITDAX (Non-GAAP)
2016 2017(Dollars in millions) 1Q 2Q 3Q 4Q YTD 1Q 2Q 3Q 4Q YTD
Reconciliation of Adjusted EBITDAX
Net income (loss) - reported
Net income (loss) $ (12) $ (198) $ (219) $ (172) $ (601) $ 92 $ 76 $ 168
Interest expense 57 53 49 48 207 47 46 93
Provision (benefit) for income taxes 35 (130) (132) (98) (325) 31 (53) (22)
Depreciation, depletion and amortization 152 163 150 158 623 147 171 318
Exploration expenses 9 12 10 11 42 39 21 60
EBITDAX 241 (100) (142) (53) (54) 356 261 617
Accrual for Denver office lease - - 5 - 5 - - -Net (gain) loss on sales of assets and divestment of transportation contracts (198) (4) 227 (3) 22 (35) (7) (42)
Impairment of inventory - - 4 - 4 - - -
Net (gain) loss on derivatives (57) 154 (38) 148 207 (203) (116) (319)
Net cash received (paid) related to settlement of derivatives 133 69 58 42 302 (5) 14 9
(Income) loss from discontinued operations 12 (25) 1 1 (11) 2 - 2
Adjusted EBITDAX $ 131 $ 94 $ 115 $ 135 $ 475 $ 115 $ 152 $ 267
22
DisclaimerThe information contained in this summary has been prepared to assist you in making your own evaluation of the Company and does not purport to contain all of the information you may consider important in deciding whether to invest in shares of the Company’s common stock. In all cases, it is your obligation to conduct your own due diligence. All information contained herein, including any estimates or projections, is based upon information provided by the Company. Any estimates or projections with respect to future performance have been provided to assist you in your evaluation but should not be relied upon as an accurate representation of future results. No persons have been authorized to make any representations other than those contained in this summary, and if given or made, such representations should not be considered as authorized.
Certain statements, estimates and financial information contained in this summary constitute forward-looking statements or information. Such forward-looking statements or information involve known and unknown risks and uncertainties that could cause actual events or results to differ materially from the results implied or expressed in such forward-looking statements or information. While presented with numerical specificity, certain forward-looking statements or information are based (1) upon assumptions that are inherently subject to significant business, economic, regulatory, environmental, seasonal, competitive uncertainties, contingencies and risks including, without limitation, the ability to obtain debt and equity financings, capital costs, construction costs, well production performance, operating costs, commodity pricing, differentials, royalty structures, field upgrading technology, and other known and unknown risks, all of which are difficult to predict and many of which are beyond the Company's control, and (2) upon assumptions with respect to future business decisions that are subject to change.
There can be no assurance that the results implied or expressed in such forward-looking statements or information or the underlying assumptions will be realized and that actual results of operations or future events will not be materially different from the results implied or expressed in such forward-looking statements or information. Under no circumstances should the inclusion of the forward-looking statements or information be regarded as a representation, undertaking, warranty or prediction by the Company or any other person with respect to the accuracy thereof or the accuracy of the underlying assumptions, or that the Company will achieve or is likely to achieve any particular results. The forward-looking statements or information are made as of the date hereof and the Company disclaims any intent or obligation to update publicly or to revise any of the forward-looking statements or information, whether as a result of new information, future events or otherwise. Recipients are cautioned that forward-looking statements or information are not guarantees of futureperformance and, accordingly, recipients are expressly cautioned not to put undue reliance on forward-looking statements or information due to the inherent uncertainty therein.
23
Reserves DisclaimerThe SEC requires oil and gas companies, in filings made with the SEC, to disclose proved reserves, which are those quantities of oil and gas, which, by analysis of geoscience and engineering data, can be estimated with reasonable certainty to be economically producible – from a given date forward, from known reservoirs, under existing economic conditions, operating methods, and governmental regulations. The SEC permits the optional disclosure of probable and possible reserves. We have elected to use in this presentation “probable” reserves and “possible” reserves, excluding their valuation. The SEC defines “probable” reserves as “those additional reserves that are less certain to be recovered than proved reserves but which, together with proved reserves, are as likely as not to be recovered.” The SEC defines “possible” reserves as “those additional reserves that are less certain to be recovered than probable reserves.” The Company has applied these definitions in estimating probable and possible reserves. Statements of reserves are only estimates and may not correspond to the ultimate quantities of oil and gas recovered. Any reserve estimates provided in this presentation that are not specifically designated as being estimates of proved reserves may include estimated reserves not necessarily calculated in accordance with, or contemplated by, the SEC’s reserves reporting guidelines. Investors are urged to consider closely the disclosure regarding our business that may be accessed through the SEC’s website at www.sec.gov.
The SEC’s rules prohibit us from filing resource estimates. Our resource estimations include estimates of hydrocarbon quantities for (i) new areas for which we do not have sufficient information to date to classify as proved, probable or even possible reserves, (ii) other areas to take into account the low level of certainty of recovery of the resources and (iii) uneconomic proved, probable or possible reserves. Resource estimates do not take into account the certainty of resource recovery and are therefore not indicative of the expected future recovery and should not be relied upon. Resource estimates might never be recovered and are contingent on exploration success, technical improvements in drilling access, commerciality and other factors.
24
WPX Non-GAAP DisclaimerThis presentation may include certain financial measures, including adjusted EBITDAX (earnings before interest, taxes, depreciation, depletion, amortization and exploration expenses), that are non-GAAP financial measures as defined under the rules of the Securities and Exchange Commission.
This presentation is accompanied by a reconciliation of these non-GAAP financial measures to their nearest GAAP financial measures. Management uses these financial measures because they are widely accepted financial indicators used by investors to compare a company’s performance. Management believes that these measures provide investors an enhanced perspective of the operating performance of the company and aid investor understanding. Management also believes that these non-GAAP measures provide useful information regarding our ability to meet future debt service, capital expenditures and working capital requirements. These non-GAAP financial measures should not be considered in isolation or as substitutes for a measure of performance prepared in accordance with United States generally accepted accounting principles.
25