2nd review
35
A STUDY ON THE BUILDING DEMAND FORECASTING FOR A SATELLITE TOWN NAME OF THE SCHOLAR NAME OF THE GUIDE T.R.RAGHAVAN Mr.T.PRADEEP 12CMR009 ASST.PROFESSOR DEPARTMENT OF CIVIL ENGINEERING
-
Upload
raghavan-rukmangathan -
Category
Education
-
view
99 -
download
1
Transcript of 2nd review

A STUDY ON THE BUILDING DEMAND FORECASTING FOR A SATELLITE
TOWN
NAME OF THE SCHOLAR NAME OF THE GUIDE
T.R.RAGHAVAN Mr.T.PRADEEP
12CMR009 ASST.PROFESSOR
DEPARTMENT OF CIVIL ENGINEERING

INTRODUCTION
• The effects of population growth are varied and vast. While population growth, of any species, may be beneficial to a certain extent, there may come a time when the number in the population exceeds the natural resources available to sustain it. This is referred to as overpopulation. The consequences of such an event are severe and major.

SATELLITE TOWN
• A satellite town or satellite city is a concept in urban planning that refers essentially to smaller metropolitan areas which are located somewhat near to, but are mostly independent of larger metropolitan areas.
• Satellite cities are small or medium-sized cities near a large metropolis, that:
• predate the metropolis' suburban expansion• are at least partially independent from that
metropolis economically and socially

Continues…
• are physically separated from the metropolis by rural territory or by a major geographic barrier such as a large river;
• satellite cities should have their own independent urbanized area, or equivalent
• have their own bedroom communities• have a traditional downtown surrounded by
traditional "inner city" neighborhoods• may or may not be counted as part of the large
metropolis' Combined Statistical Area

OBJECTIVES
• A study on the building demand forecasting for a satellite town
LITERATURE COLLECTIONS
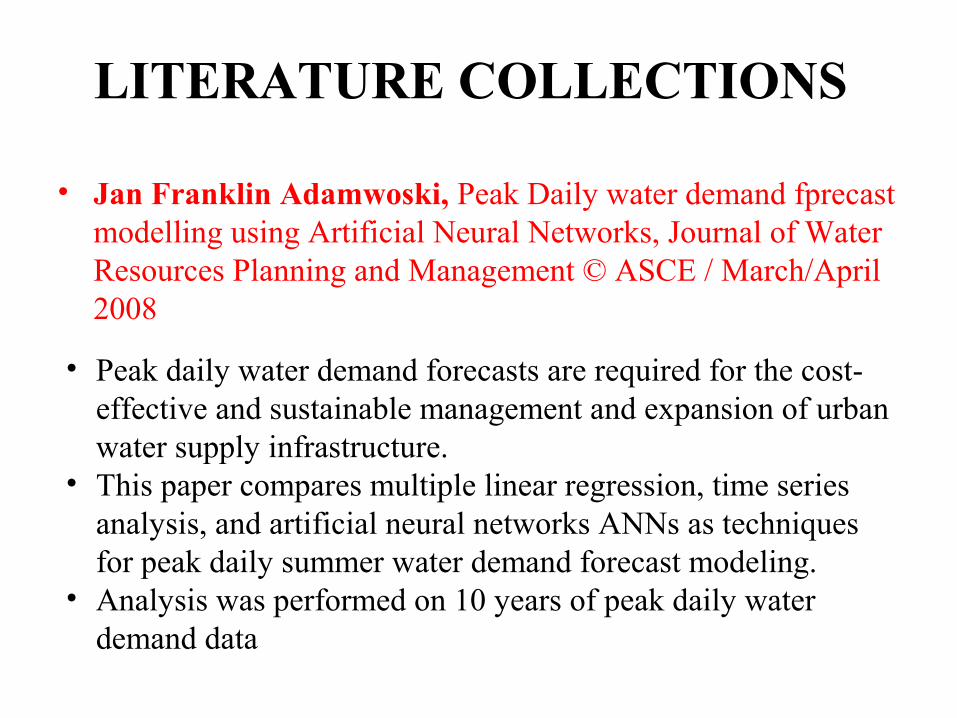
• Jan Franklin Adamwoski, Peak Daily water demand fprecast modelling using Artificial Neural Networks, Journal of Water Resources Planning and Management © ASCE / March/April 2008
• Peak daily water demand forecasts are required for the cost-effective and sustainable management and expansion of urban water supply infrastructure.
• This paper compares multiple linear regression, time series analysis, and artificial neural networks ANNs as techniques for peak daily summer water demand forecast modeling.
• Analysis was performed on 10 years of peak daily water demand data

• S. Saravanan, S. Kannan and C. Thangaraj Department of Electrical and Electronics Engineering, Kalasalingam University, India , India’s Electricity Demand Forecast Using Regression Analysis and Artificial Neural Networks based on Principal Components, ICTACT Journal on Soft Computing, july 2012, Volume: 02, ISSUE: 04
• Power System planning starts with Electric load (demand) forecasting.
• Accurate electricity load forecasting is one of the most important challenges in managing supply and demand of the electricity, since the electricity demand is volatile in nature;
• The aim of this study deals with electricity consumption in India, to forecast future projection of demand for a period of 19 years from 2012 to 2030.

Guoqiang Zhang, B. Eddy Patuwo, Michael Y. Hu*, Forecasting with artificial neural networks: The state of the art, International Journal of Forecasting 14 (1998) 35 –62
•Interest in using artificial neural networks (ANNs) for forecasting has led to a tremendous surge in research activities in the past decade. •While ANNs provide a great deal of promise, they also embody much uncertainty. Researchers to date are still not certain about the effect of key factors on forecasting performance of ANNs. •This paper presents a state-of-the-art survey of ANN applications in forecasting. Our purpose is to provide
(1) a synthesis of published research in this area, (2) insights on ANN modeling issues, and (3) the future research directions.

• Bassam M. AbuAl-Foul, Economics Department, American University of Sharjah, Forecasting Energy Demand in Jordan Using Artificial Neural Networks, Topics in Middle Eastern and African Economies Vol. 14, September 2012
• The purpose of this study is to forecast energy use in one of the MENA countries, Jordan using annual data over the period 1976-2008.
• The methodology used in this study follows the artificial neural networks analyses.
• We use four independent variables, namely, gross domestic product, population, exports, and imports to forecast energy use.
•

Literature collectionLiterature collection
Review of literatureReview of literature
Data CollectionData Collection
Selection of ParametersSelection of Parameters
Population ForecastingPopulation Forecasting
Demand ForecastingDemand Forecasting
METHODOLOGY

Analysing the suitable place for Satellite Town
Analysing the suitable place for Satellite Town
Justifying the analysisJustifying the analysis
Providing SuggestionsProviding Suggestions

SELECTION OF SOFTWARE
• Artificial Neural Network
• Statistical Product and Service Solutions (SPSS)

ARTIFICIAL NEURAL NETWORK
• Neural network software is used to simulate, research, develop and apply artificial neural networks, biological neural networks and in some cases a wider array of adaptive systems.
• Commonly used artificial neural network simulators include the Stuttgart Neural Network Simulator (SNNS), Emergent, JavaNNS, Neural Lab and NetMaker

Continues...
• A neural network (NN), in the case of artificial neurons called artificial neural network (ANN), is an interconnected group of natural or artificial neurons that uses a mathematical or computational model for information processing based on a connectionistic approach to computation.

STATISTICAL PRODUCT AND SERVICE SOLUTIONS (SPSS)
• SPSS consists of an integrated series of computer programs which enable the user to read data from questionnaire surveys and other sources (e.g. Demand and administrative records),to manipulate them in various ways and to produce a wide range of statistical analyses and reports, together with documentation.
Continues...
• SPSS Statistics is a software package used for statistical analysis. It is now officially named "IBM SPSS Statistics". Companion products in the same family are used for survey authoring and deployment (IBM SPSS Data Collection), data mining (IBM SPSS Modeler), text analytics, and collaboration and deployment (batch and automated scoring services).

Continues...
• With SPSS predictive analytics software can predict with confidence what will happen next so that can make smarter decisions, solve problems and improve outcomes.

FOR SOFTWARE ANALYSIS

FACTORS INFLUENCING THE BUILDING DEMAND FORECASTING
• AREA– Free space available inside the city (private &
public)
– Free space available outside the city (private & public)
– Area of the proposed satellite towns separately (Thindal & Solar)

Continues...
• POPULATION – Population of the whole city
– Population of the proposed satellite towns separately (Thindal & Solar)
– Population of the western side of the district (from Thindal to Sengapalli)
– Population of the north-eastern side of the district (from Solar to Sengodampalayam)

Continues...
• BUILDINGS – Number of Residential buildings inside the city
– Number of Governmental buildings
– Capacity of the Governmental building as per the codal provision & raw data
– Utilisation of the government building (in %)

FOR QUESTIONNAIRE SURVEY

FACTORS INFLUENCING THE SELECTION OF A SATELLITE
TOWN
• THINDAL & SOLAR– Accessibility to the city from Thindal & Solar
– Development of the town
– Job opportunities around the town
– Number of peoples approaching the city from Thindal (western side of the district)
Continues...
– Number of peoples approaching the city from Solar (North-eastern side of the district)
– Availability of water facility (ground water & other sources)
– Sources and availability of electricity
– Availability of enough Government land to setup a Satellite Town

REFERENCES
• Refense, A.N.; Zapranis, A. and Francis, G. (1994): “Stock Performance Modelling using Neural Networks: a comparitive study with regression models.” Neural Networks, 7, No.2, PP. 375-388
• Zheng, D.X.M., NG, S.T. and Kumaraswamy, M.M. (2004) Applying a GA-based multiobjective approach for time-cost optimization. Journal of Construction Engineering and Management, ASCE, 130(2), 168-176.

Continues…
• Zhang, G. and Hu, M. Y.(1998): “Neural Network forecasting of the British/US dollar exchange rate.” Omega, Vol.26, No. 44, PP. 495-506.
• Tse, R.Y.C., Ho, C.W. and Ganesan, S.(1999) Matching housing supply and demand: an emprical study of Hong Kong’s market, Construction Management and Economics, 17(5), 625-634.
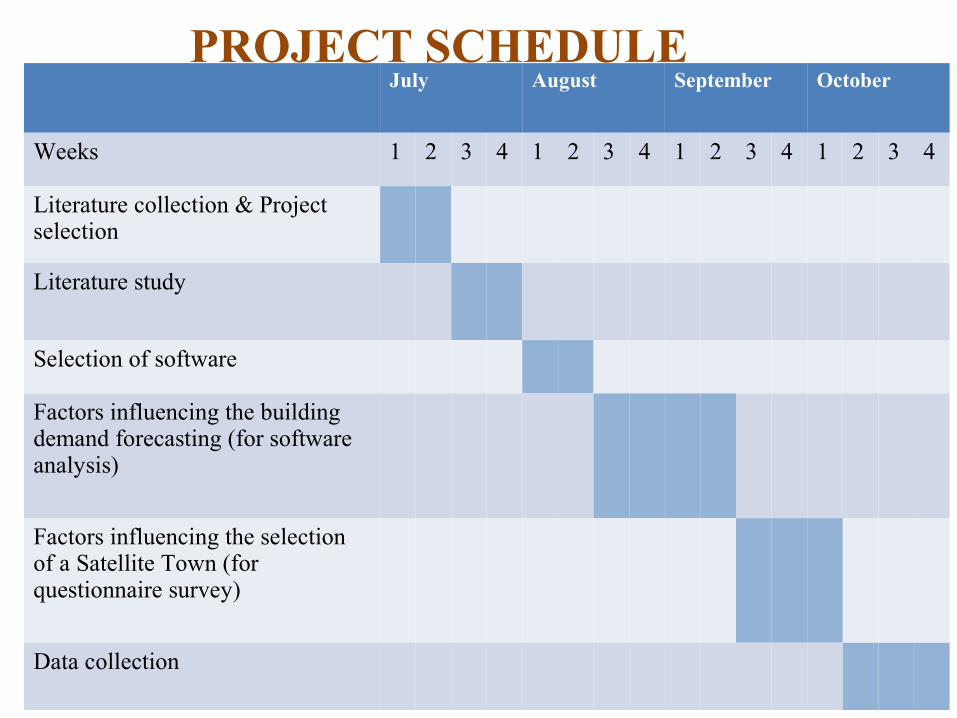
PROJECT SCHEDULEJuly August September October
Weeks 1 2 3 4 1 2 3 4 1 2 3 4 1 2 3 4
Literature collection & Project selection
Literature study
Selection of software
Factors influencing the building demand forecasting (for software analysis)
Factors influencing the selection of a Satellite Town (for questionnaire survey)
Data collection

POPULATION OF THE ERODE DISTRICT
• 1991 - 18,02,900 peoples
• 2001 - 20,16,582 peoples (11.85% incd.)
• 2011 - 22,51,744 peoples (11.66% incd.)
No.of.Males - 10,24,732
No.of.Females - 991850

POPULATION OF THE ERODE CITY
• 2011 - 5,21,776 peoples
• Male - 2,61,470 peoples (82.2%)
• Female - 2,60,306 peoples (72.42%)
• Ratio - 996 Females : 1000 Males

AREA OF THE ERODE DISTRICT
• Area - 2198 sq.miles (5692 sq.kms)
(whole district)
• Area of the Erode City :– Rural Area - 287 sq.miles (743 sq.kms)
– Urban Area - 3.22 sq.miles (8.34 sq.kms)

Continues…
• Area of the North-eastern side of the district – From Solar to Sengodampalayam
– 400 sq.miles (1037 sq.kms)
• Area of the Western side of the District– From Thindal to Sengapalli
– 1798 sq.miles (4655 sq.kms)

LAND USAGE
• 83.25% of the ERODE municipal area has been developed along the road side in all major roads, in municipal area along Kongan road near the southern boundary of the local planning area, mainly the commercial area in Erode town is concentrated near the junction of Brough road and archery road and Bazaar area.


![[ 2nd Review ] [ SIMS ]](https://static.fdocuments.us/doc/165x107/577d2a7a1a28ab4e1ea94a1c/-2nd-review-sims-.jpg)