2nd Quarter Results - Sabesp · 2nd Quarter Results August 2012- Economic - Financial Office and...
21
2nd Quarter Results August 2012- Economic - Financial Office and Investor Relations Office
Transcript of 2nd Quarter Results - Sabesp · 2nd Quarter Results August 2012- Economic - Financial Office and...

2nd Quarter Results
August 2012- Economic - Financial Office and Investor Relations Office

This presentation may contain forward-looking statements referring to
SABESP’s business outlook, operating and financial results estimates, and growth
prospects. These are only projections, and as such, they are exclusively based on
SABESP’s management expectation in relation to the future of business and its
continuous access to capital to finance the Company’s business plan. These
forward-looking statements largely depend on changes in market conditions,
governmental rules, industry performance and the Brazilian economy, among
other factors, in addition to risks exhibited in disclosure documents filed by
SABESP. Therefore, they are subject to changes without prior notice.
Disclaimer

Agenda
Company Overview 1
Our Operations 2
Our Financial Performance 3

Sabesp is one of the largest water and sewage
service providers in the world based on the
number of Customers
Provides water to 24.0 million people and sewage
services to 20.6 million people
Also sells wholesale treated water to 7
municipalities (3.7 million people)
Natural monopoly, low operating risk
Serves the City of São Paulo and 362 out of 645
municipalities in the State
Covers 60% of State's urban population
Operations in the São Paulo Metropolitan Region*
represent 75.1% of our total revenues
(1) As of June 30, 2012
(2) Treated sewage as percentage of collected sewage
São Paulo Regional Systems
Metropolitan Region
One of the largest water and sewage service providers
in the world…
*The Metropolitan Region we consider for this estimate, includes 8
municipalities outside the legal boundaries of the São Paulo
Metropolitan Region and represent the total cities served by the
Company’s Metropolitan Division
4
Main Operational Indicators(1) Company Overview
Water Sewage
Connections (million) 7.5 6.0
Coverage (%) 100 82
Treatment (%) 100 76(²)
Billed Volume (m³ million) 1,035.1 757.1

We are a mixed capital company, majority-owned by the State of São Paulo, with significant private
ownership
State law requires the State of São Paulo to own at least 50% + 1 voting shares at all times
Currently the Government of São Paulo has 50.3% share
Listed on the “Novo Mercado” and NYSE, to the highest corporate governance standards. We are
also part of BM&FBovespa’s Sustainability Index – ISE
100% common shares
Market Cap: R$ 17,543.42 mn (as of June, 2012)
(1) As of June, 2012
…with strong corporate governance
5
Ownership Structure(1)
24.9%
24.8%
50.3%

Agenda
6
3
Our Operations 2
Our Company 1
Our Financial Performance

Diversified customer base
7
Water Volume by Type of Customer Sewage Volume by Type of Customer
Over 80% of water volume comes from
residential, commercial and industrial
customer
Over 90% of sewage volume comes from
residential, commercial and industrial
customer
Residential73%
Commercial8%
Industrial2%
Public3%
Whosale14%
Reused Water<1%
Residential82%
Commercial10%
Industrial3%
Public3%
Whosale2%

Broad coverage of municipalities
8
Nº of
municipalities
% of revenue
Renewed/Secured (Program and Service Contract) 231 69.8
Metropolitan Region Without Contract 28 13.2
Expired/Under Negotiations 66 5.8
To be expired:
Today to 2017 07 1.5
2018 to 2033 31 7.4
Total Retail 363 97.7
Wholesale 7 2.3
Total Sabesp 370 100
Concessions Contracts
30 years services agreement between Sabesp, Municipality of São Paulo and State Government
(expires in 2040)
Investment plan for the Municipality – R$ 16.9 billion for 30 years
Minimum investment of 13% of the Gross Revenues, net of Cofins and Pasep, approximately R$
500 million/year
Transfer of 7.5% of the Gross Revenues, net of Cofins and Pasep to the Municipal Environmental
Sanitation and Infrastructure Fund – to be recovered in tariff
Regulatory agency ARSESP
Agreement and Contract with the Municipality of São Paulo

9
Regulatory Framework
Discussion on Power of Concession
Obligatory creation of a Regulatory Agency Municipal or State level
Clarifies the payment conditions of non-amortized investments up to 4 years
Disbursement of federal funds conditioned to the existence of a sanitation plan Deadline 2014
Basic discussion: sanitation services are of local interest or common interest
Still remains a discussion in the Federal level over the power of concession for sanitation services
in Metropolitan regions Law 11.445/07 does not address this matter
Two Legal proceeding under Supreme Court (STF) appraisal
Federal Law # 11,445/07 Federal Decree 7,217/10
Regulation activities and responsibilities include:
Services quality
Tariff structure and reviews
Planning is a concession holder attribution
ARSESP´s attribution

07% 08%
17%
07% 07%
04%04%
06%
05% 05%
6.87%
5.20%
13%
08%
19%
07%
09%
07%
04%
05%04% 4.05%
6.83%
5.15%
2001 2002 2003 2004 2005 2006 2007 2008 2009 2010 2011 2012
Inflation (IPCA) Tarif Increase
Tariff adjustments
10
Annual Tariffs Adjustments vs. Inflation (%) Sabesp Annual Tariffs Adjustment
Inflation (IPCA)
X
Controllable Costs
Full “Pass-Through”
of Non-Controllable Costs
Includes:
Electricity
Treatment material
Taxes
Use of water resources
Part A Part B
Tariffs revision - Sabesp formula Adjustment established by
ARSESP

New Tariff Methodology
11
BRR0 CAPEX + OPEX + Taxes + ∆ WC
BRRT = BRR0 + ∑(CAPEX+∆ WC-DEP) Volume (M3)
P0 IRR = WACC
18-May-2011 ARSESP disclosed WACC at 8.06%
16-Jan-2012 ARSESP released the Methodology for Sabesp’s Tariff Revision Process
29-Feb-2012 to
14-Mar-2012 Public hearings to discuss the Tariff Revision Process Methodology
30-Aug-2012 Sabesp presents to ARSESP the BRR – Regulatory Remuneration Basis and detailed Business Plan data
ARSESP releases final Tariff Methodology Process
21-Sep-2012 ARSESP sends the Average Tariff Proposal (P0) and Efficiency Gains Factor (X) to Sabesp, and requests Sabesp to
prepare a proposal for the Tariff Structure
01-Oct-2012 Sabesp presents proposal for the Tariff Structure
09-Oct-2012 Disclosure for public hearing of the Average Tariff (P0), Efficiency Gains Factor (X) and Tariff Structure
09-Nov-2012 Public hearing to discuss the Average Tariff (P0), Efficiency Gains Factor (X) and Tariff Structure
30-Nov-2012 Final disclosure of the Average Tariff (P0), Efficiency Gains Factor(X) and Tariff Structure

12
Water Connection Evolution (million) Water Coverage (Connections in ´000s)
Evolution of operations
Sewage Connection Evolution (million) Sewage Coverage (Connections in ´000s)
Collection: From: 82% in 4Q11 to 90% in 2019
Treatment : From: 75.8% in 4Q11 to 95% in 2019
Adding 1.9 million new connections through 2019
Adding 1.2 million new connections through 2019 to
match organic population growth
6.66.8 6.9
7.17.3
7.5 7.6
2006 2007 2008 2009 2010 2011 2Q12
101.0 159.0 161.0 160.0 156.0
635.0
2012 Real 2012 2013 2014 2015 2016 - 2019
5.00 5.200
5.300 5.500
5.700 5.8770
6.00
2006 2007 2008 2009 2010 2011 2Q12
112.0 207.0 212.0 231.0 236.0
996.0
2012 Real 2.012 2.013 2.014 2.015 2016 - 2019
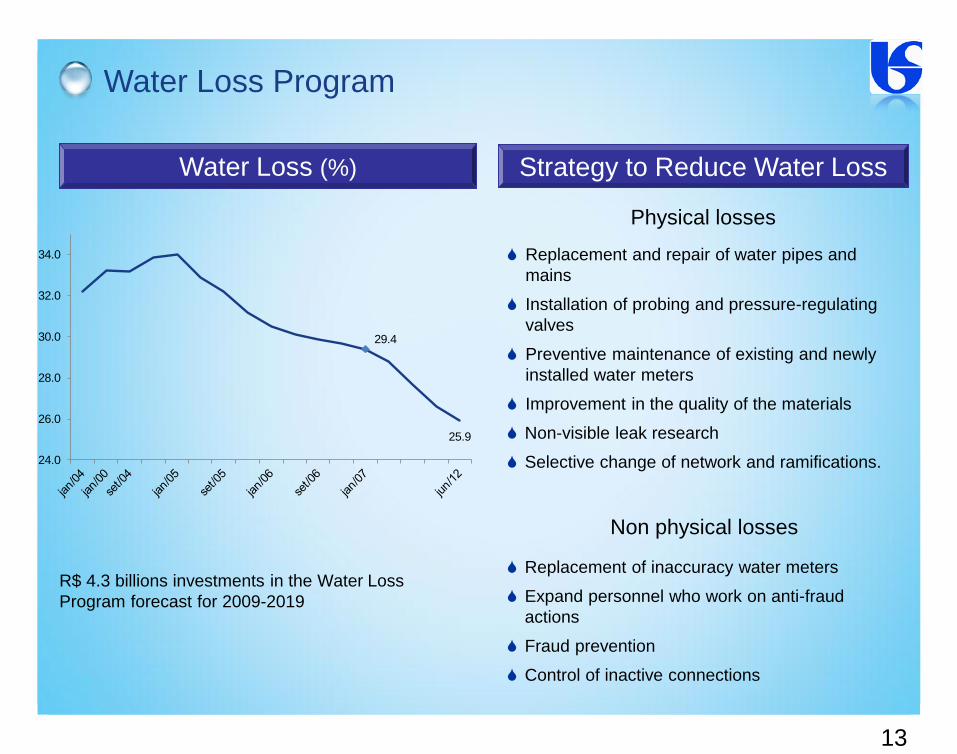
Water Loss Program
13
Replacement and repair of water pipes and
mains
Installation of probing and pressure-regulating
valves
Preventive maintenance of existing and newly
installed water meters
Improvement in the quality of the materials
Non-visible leak research
Selective change of network and ramifications.
Physical losses
Non physical losses
Replacement of inaccuracy water meters
Expand personnel who work on anti-fraud
actions
Fraud prevention
Control of inactive connections
R$ 4.3 billions investments in the Water Loss
Program forecast for 2009-2019
Water Loss (%) Strategy to Reduce Water Loss
29.4
25.9
24.0
26.0
28.0
30.0
32.0
34.0

Capex plan
14
Total Investment Plan of R$ 7.9 billion for 2012 to 2015
Metropolitan Water Program
Tietê Project
Corporate Program for Water Loss Reduction
Clean Wave Program
Coastal Water Program
Main Programs
R$ million
746 599 607 580
927991 846
368
337 395505
988
2,009 1,986 1,958 1,936
2012 2013 2014 2015
Water Suply Sewage collection Collected sewage treatment
1,124
Real.

15
CAIXA R$ 918 mn JICA R$ 716 mn IDB R$ 689 mn BNDES R$ 558 mn IBRD R$ 102 mn
CAIXA
BNDES R$ 607 mn CAIXA R$ 505 mn
Company Funds R$ 3.65 bn
46.3 %
Contracted R$ 2.9 bn
70.4%
Under contracting R$ 144.8 mn
3.4% Under negotiation
R$ 1.1 bn 26.2%
Financing R$ 4.2 bn
53.7 %
Capex financing
2012 to 2015 – R$ 7.9 billion

16
Our Company 1
Our Operations 2
Our Financial Performance 3
Agenda

JICA 12.4%
BID 9.1%
Eurobônus 12.5%
Debêntures 23.1%
BNDES 13.4%
CEF 19.4%
0 0.3%
B Brasil 8.4%
Others 1.3%
17
Long term low, cost funding
R$ million
Total Debt Breakdown Total Debt by Currency
Debt Amortization Profile
(*) Index that measures the variations of the world’s major currencies –
type of international currency (IDB 713 agreement)
Local Currency
66%
US Dollar 18%
Yen 12%
Currency Basket*
04%
0
150
300
450
600
750
900
1,050
1,200
1,350
1,500
1,650
2012 2013 2014 2015 2016 2017 2018 2019 2020 2021 2022 2023+
430
1,244
750 756 773
500601 592
1,031
280 241
1,190
Local Currency
Foregin Currency

18
Net Revenues (R$ million)
EBITDA (R$ million)
Consistent performance
Net Income (R$ million)
2006 2007 2008 2009 2010 2011
Dividend
Declared 9.5* 1.32 1.30 1.73 2.00 2,54
Pay Out % 34.7 28.5 34.3 26.1 27.9 47.3
Dividends/Pay Out
* R$ / 000 shares
5,527 5,971
7,809* 8,580*9,230*
9,927*
5,053*
6,1326,541 7,099
7,703
3,924
2006 2007 2008 2009 2010 2011 2Q12
*Since 2008 calculated in accordance with CPCs / IFRS, w hich includes construction Costs
Net Renevues Net Renevues Without Construction
2,4462,699
2,865* 2,727*
3,222* 3,213*
1,687*44% 45%
37% 32% 35% 32%
33%
47%42% 45%
41% 41%
2006 2007 2008 2009 2010 2011 2Q12
Since 2008 calculated in accordance with CPCs / IFRS, w hich includes construction Costs
EBITDA Margin EBITDA Margin EBITDA Without Constrution
789
1,055863*
1,508* 1,630*
1,223*
785*
2006 2007 2008 2009 2010 2011 2Q12
*Since 2008 calculated in accordance with CPCs / IFRS, which includes construction Costs

19
* EBITDA – LTM
Calculated in accordance with CPCs/IFRS
Capital structure has remained consistent with operating cash generation and
capitalization
Historical leverage metrics
Net Debt vs. EBITDA* (R$ million) Net Debt vs. Shareholders’ Equity (R$ million)
5,2205,787
6,220 6,2816,643
2,865 2,7273,222 3,213
3,470
1.8x
2.1x1.9x
2.0x
1.9x
2008 2009 2010 2011 2Q12
Net Debt EBITDA Net Debt/EBITDA
5,220 5,7876,220 6,281
6,6436,758
8,4399,682
10,54611,043
0.8x 0.7x
0.5x 0.6x 0.5x
2008 2009 2010 2011 2Q12
Net Debt Shareholders' Equity Net Debt/SE

Financial Highlights
20
* In accordance with CPCs / IFRS, which includes construction Costs.
(In R$ million)
** R$ / 000 shares
2002 2003 2004 2005 2006 2007 2008* 2009* 2010* 2011* 2Q12
Net Revenues (R$) 3.767,1 4.130,8 4.397,1 4.953,4 5.527,3 5.970,8 7.809,3 8.579,5 9.230,4 9.927,4 5.052,7
EBITDA (R$) 1.860,0 2.076,5 1.927,0 2.285,6 2.446,1 2.698,9 2.865,1 2.727,3 3.222,5 3.213,4 1.686,7
EBITDA Margin (%) 49,4 50,3 43,8 46,1 44,3 45,2 36,7 31,8 34,9 32,4 33,4
Net Income (R$) (651,0) 833,3 513,1 865,6 789,4 1.055,3 862,9 1.507,7 1.630,4 1.223,4 784,7
Net Margin (%) 20,2 11,7 17,5 14,3 17,7 11,0 17,6 17,7 12,3 15,5
Total Assets (R$) 16.331,9 16.590,1 16.783,8 17.431,1 17.999,9 18.659,9 17.206,0 20.242,9 23.293,1 25.018,6 25.149,8
Total Debt (R$) 7.925,1 7.264,3 7.050,7 6.664,2 6.326,7 5.685,2 6.865,0 6.557,9 8.264,6 7.892,4 8.386,5
Short-term Debt (R$) 1.132,4 997,0 1.496,8 759,0 852,5 742,1 1.449,0 1.009,9 1.242,1 1.629,2 1.323,6
Long-Term Debt (R$) 6.592,6 6.267,3 5.553,8 5.905,2 5.474,2 4.943,1 5.416,0 5.548,0 7.022,5 6.794,1 7.062,9
Foreign Currency Debt (R$) 3.708,0 3.012,7 2.680,9 1.575,9 1.472,2 1.242,3 2.281,0 1.745,6 2.249,9 3.053,4 3.189,1
Shareholders' Equity (R$) 4.217,1 7.576,9 7.951,6 8.482,5 9.018,5 9.780,5 6.758,2 8.438,6 9.681,8 10.545,9 11.042,5
Total Debt/Total Cap. (%) 65,3 48,9 47,0 44,0 41,2 36,8 50,4 43,7 46,1 42,8 43,2
Investments (R$) 619 594 601 678 905 921 1.734 2.059 2.194 2.440 1.124
Dividend Declared (R$/ share) 17,7 5,4 12,2 9,5 1,3 1,3 1,7 2,0 2,5 -
Pay Out (%) 60,5 29,8 40,2 34,7 28,5 34,3 26,1 27,9 47,3 -
Dividend Yield (%) 10,8 3,4 7,8 3,2 3,2 4,7 5,0 4,7 4,9 -
Outstanding shares - 227,836,623

www.sabesp.com.br
IR Contacts
Mario Azevedo de Arruda Sampaio Angela Beatriz Airoldi [email protected] [email protected] (55 11) 3388 8664 (55 11) 3388 8793