2nd Quarter 2013 Earnings Conference Call Presentation - Ellington
25
Second Quarter 2014 Earnings Conference Call August 12, 2014
Transcript of 2nd Quarter 2013 Earnings Conference Call Presentation - Ellington

Second Quarter 2014 Earnings Conference Call
August 12, 2014

Important Notice Forward-Looking Statements
This presentation contains forward-looking statements within the meaning of the safe harbor provisions of the Private Securities Litigation Reform Act of 1995. Forward-looking
statements involve numerous risks and uncertainties. Actual results may differ from the Company’s beliefs, expectations, estimates, and projections and, consequently, you should
not rely on these forward-looking statements as predictions of future events. Forward-looking statements are not historical in nature and can be identified by words such as "believe,"
"expect," "anticipate," "estimate," "project," "plan," "continue," "intend," "should," "would," "could," "goal," "objective," "will," "may," "seek," or similar expressions or their negative
forms, or by references to strategy, plans, or intentions.
The Company's results can fluctuate from month to month and from quarter to quarter depending on a variety of factors, some of which are beyond the Company's control and/or are
difficult to predict, including, without limitation, changes in interest rates and the market value of the Company's securities, changes in mortgage default rates and prepayment rates,
the Company's ability to borrow to finance its assets, changes in government regulations affecting the Company's business, the Company's ability to maintain its exemption from
registration under the Investment Company Act of 1940 and other changes in market conditions and economic trends. Furthermore, forward-looking statements are subject to risks
and uncertainties, including, among other things, those described under Item 1A of our Annual Report on Form 10-K filed on March 21, 2014 which can be accessed through the link
to our SEC filings under "For Our Shareholders" on our website (www.earnreit.com) or at the SEC's website (www.sec.gov). Other risks, uncertainties, and factors that could cause
actual results to differ materially from those projected may be described from time to time in reports we file with the SEC, including reports on Forms 10-Q, 10-K and 8-K. The
Company undertakes no obligation to update or revise any forward-looking statements, whether as a result of new information, future events, or otherwise.
Modeling Some statements in this presentation may be derived from proprietary models developed by Ellington Management Group, L.L.C. (“Ellington”). Some examples provided may be based upon the hypothetical performance of such models. Models, however, are inherently imperfect and subject to a number of risks, including that the underlying data used by the models is incorrect, inaccurate, or incomplete, or that the models rely upon assumptions that may prove to be incorrect. The utility of model-based information is highly limited. The information is designed to illustrate Ellington’s current view and expectations and is based on a number of assumptions and limitations, including those specified herein. Certain models make use of discretionary settings or parameters which can have a material effect on the output of the model. Ellington exercises discretion as to which settings or parameters to use in different situations, including using different settings or parameters to model different securities. Actual results and events may differ materially from those described by such models. Projected Yields and Spreads Projected yields and spreads discussed herein are based upon Ellington models and rely on a number of assumptions, including as to prepayment, default and interest rates and changes in home prices. Such models are inherently imperfect and there is no assurance that any particular investment will perform as predicted by the models, or that any such investment will be profitable. Projected yields are presented for the purposes of (i) providing insight into the strategy’s objectives, (ii) detailing anticipated risk and reward characteristics in order to facilitate comparisons with other investments, (iii) illustrating Ellington’s current views and expectations, and (iv) aiding future evaluations of performance. They are not a guarantee of future performance. They are based upon assumptions regarding current and future events and conditions, which may not prove to be accurate. There can be no assurance that the projected yields will be achieved. Investments involve risk of loss.
Financial Information
All financial information included in this presentation is as of June 30, 2014 unless otherwise indicated. We undertake no duty or obligation to update this presentation to reflect
subsequent events or developments.
2

Second
Quarter 2014

Overall Results
Second quarter net income of $11.1 million or $1.21 per share
Book value increase of 3.7% to $18.71 per share as of June 30, 2014 from $18.05 per share as of
March 31, 2014, after giving effect to $0.55 second quarter dividend
Economic return on book value of 6.7% for the quarter
Core Earnings(1)
Core Earnings of $6.8 million or $0.75 per share
Net Interest Margin of 2.33%
“Catch-up” positive premium amortization adjustment was negligible
Shareholders’
Equity Shareholders’ equity of $171.0 million as of June 30, 2014, or $18.71 per share
Portfolio
Agency RMBS Portfolio: $1.309 billion as of June 30, 2014
$1.207 billion fixed rate “specified” pools
$70.5 million ARM pools
$17.4 million in reverse mortgage pools
$14.3 million IOs
Non-Agency RMBS Portfolio: $35.7 million as of June 30, 2014
Leverage Debt to equity ratio: approximately 7.5:1 as of June 30, 2014, down from 7.8:1 as of March 31, 2014
Average cost of funds 0.34% for the quarter or 1.10% including interest rate swaps
Dividend Declared second quarter dividend of $0.55 per share (paid in July 2014)
Annualized dividend yield of 13.2% based on closing price of $16.64 on August 8, 2014
Ellington Residential: Second Quarter Highlights
4 (1) Core Earnings is a non-GAAP financial measure. See slide 23 for a reconciliation of Core Earnings to Net Income.

Overall Market
Conditions
Federal Reserve’s continued tapering of purchases in Q2 was uneventful
Strong spread tightening in corporate credit made RMBS attractive on a relative value basis
Prepayment and interest rate volatility were subdued
New Agency RMBS supply remains depressed by weak new home sales and large percentage of
cash transactions
Portfolio
Trends and
Outlook
Turned over approximately 30% of the portfolio as measured by sales, excluding principal
paydowns
Federal Reserve net purchases expected to end in Q4; this should be supportive of specified
pools relative to TBAs
Volatility has increased post quarter-end; we expect continued volatility to create trading
opportunities
Prepay speeds have increased for certain cohorts
We expect this to continue, which could drive pay-up volatility
Ellington Residential: Agency RMBS
5
Overall Market
Conditions
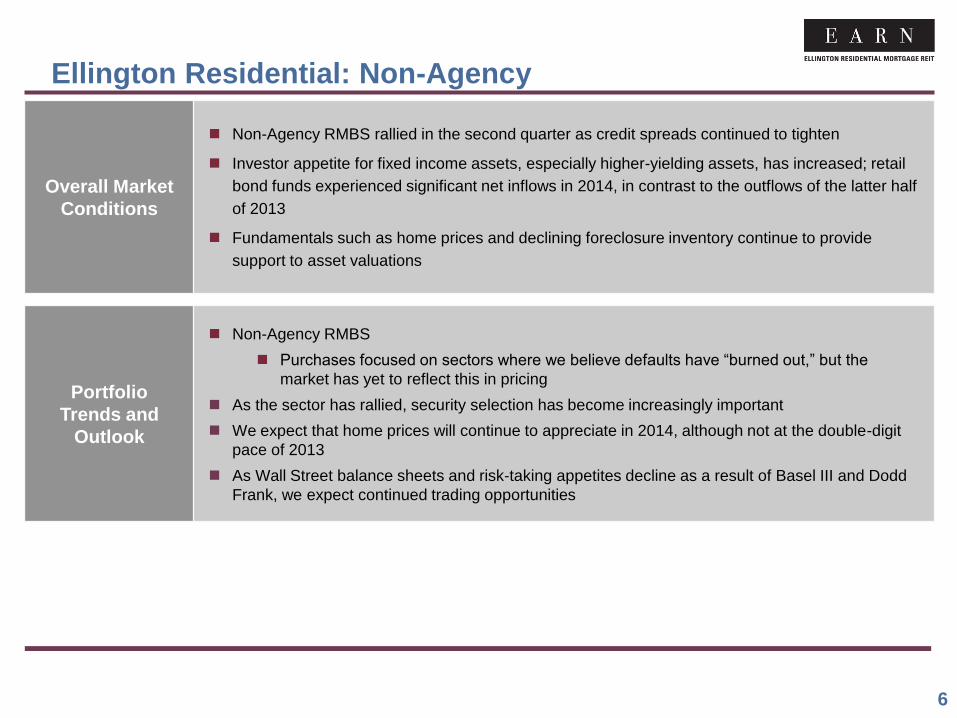
Non-Agency RMBS rallied in the second quarter as credit spreads continued to tighten
Investor appetite for fixed income assets, especially higher-yielding assets, has increased; retail
bond funds experienced significant net inflows in 2014, in contrast to the outflows of the latter half
of 2013
Fundamentals such as home prices and declining foreclosure inventory continue to provide
support to asset valuations
Portfolio
Trends and
Outlook
Non-Agency RMBS
Purchases focused on sectors where we believe defaults have “burned out,” but the
market has yet to reflect this in pricing
As the sector has rallied, security selection has become increasingly important
We expect that home prices will continue to appreciate in 2014, although not at the double-digit
pace of 2013
As Wall Street balance sheets and risk-taking appetites decline as a result of Basel III and Dodd
Frank, we expect continued trading opportunities
Ellington Residential: Non-Agency
6

TBA Rolls
7
TBA Rolls have Declined
Reduction in Federal Reserve RMBS purchases may continue to weigh on TBA roll levels
Even small changes in TBA roll levels can lead to large changes in pool pay-ups
The Federal Reserve is unique among all investors in its willingness to take delivery of potentially fast-paying, cheapest-to-deliver pools
Source: Barclays
6
7
8
9
10
11
12
13
May 1, 2014 May 31, 2014 June 30, 2014 July 30, 2014
Tic
ks (
32
nd
s o
f a p
oin
t)
FNCL 4.5 FNCL 4.0 FNCL 3.5

As TBA Rolls Decline, Pay-ups are Increasing
8
Regression of Pay-up to LLB (loans below $85k) FNCL 4.5 vs TBA Roll Levels
As roll levels decline, specified pools become relatively more attractive
This may be a gradual process as it will take months for float to be rebuilt in some coupons
Fast prepayments on even a small portion of a coupon’s float can lead to big changes in roll levels
Source: Barclays
30
35
40
45
50
55
60
6.5 7.0 7.5 8.0 8.5 9.0 9.5 10.0 10.5 11.0 11.5
Pay-u
ps (
in t
icks)
TBA Roll 3/3/2014 to 7/9/2014 7/10/2014 to 7/30/2014

Agency RMBS vs. Corporate Bond Performance
9
While Agency RMBS performed well in Q2, they didn’t keep pace with corporate bonds
Even after strong Agency RMBS performance in Q2, they have still lagged the performance of Investment Grade corporate bonds
Agency RMBS has also substantially lagged the rally in many sovereign credits
Agency RMBS had no problem attracting capital in the second quarter
Source: Barclays
65
70
75
80
85
90
12
14
16
18
20
22
24
26
28
30
3-Mar 18-Mar 2-Apr 17-Apr 2-May 17-May 1-Jun 16-Jun 1-Jul 16-Jul
Inte
rme
dia
te C
orp
ora
te L
ibo
r O
AS
FN
CL
3.5
TB
A L
ibo
r O
AS
FNCL 3.5 TBA Libor OAS Intermediate Corporate Libor OAS

Portfolio

Ellington Residential: Portfolio Summary
11
(1) Represents the dollar amount (not shown in thousands) per $100 of current principal of the price or cost for the security.
(2) Excludes Agency IOs.
June 30, 2014
March 31, 2014
(In thousands)
Current
Principal Fair Value
Average
Price(1) Cost
Average
Cost(1)
Current
Principal Fair Value
Average
Price(1) Cost
Average
Cost(1)
Agency RMBS(2)
15-year fixed rate
mortgages $ 166,910 $ 175,583 $ 105.20 $ 174,726 $ 104.68
$ 144,422 $ 149,429 $ 103.47 $ 150,184 $ 103.99
20-year fixed rate
mortgages 10,158 10,936 107.66 10,762 105.95
10,347 10,908 105.42 10,980 106.12
30-year fixed rate
mortgages 957,162 1,020,084 106.57 1,009,739 105.49
1,004,293 1,040,012 103.56 1,052,115 104.76
ARMs 66,864 70,540 105.50 70,586 105.57
46,804 49,840 106.49 49,869 106.55
Reverse mortgages 15,824 17,357 109.69 17,108 108.11
27,081 29,471 108.83 29,299 108.19
Total Agency RMBS 1,216,918 1,294,500 106.38 1,282,921 105.42
1,232,947 1,279,660 103.79 1,292,447 104.83
Non-Agency RMBS 55,395 35,668 64.39 32,088 57.93
54,115 32,045 59.22 30,409 56.19
Total RMBS(2) 1,272,313 1,330,168 104.55 1,315,009 103.36
1,287,062 1,311,705 101.91 1,322,856 102.78
Agency Interest Only
RMBS n/a 14,276 n/a 12,469 n/a
n/a 15,924 n/a 13,232 n/a
Total mortgage-backed
securities $ 1,344,444 $ 1,327,478
$ 1,327,629 $ 1,336,088

(1) Does not include long TBA positions. (2) Fair value shown in millions. Excludes fixed rate IOs. (3) Represents weighted average net pass-through rate.
Ellington Residential: Agency Long Portfolio
Previous Quarter Agency Long Portfolio As of 3/31/14: $1.30BN(1)
12
Current Quarter Agency Long Portfolio As of 6/30/14: $1.31BN(1)
FNMA Fixed 30-Yr 57.9%
FNMA Fixed 15-Yr 4.7%
FHLM Fixed 30-Yr 22.4%
FHLM Fixed 15-Yr 6.9%
FNMA ARMS 3.8%
GNMA/FNMA/ FHLM Fixed IOs
1.2% GNMA RM Fixed
2.3% FNMA Fixed
20-Yr 0.8%
Fixed Portfolio(2)
Category Fair Value(1) Weighted Average Coupon(3)
FNMA Fixed - 30-Yr $749.9 3.98
FNMA Fixed - 20-Yr 10.9 4.00
FNMA Fixed - 15-Yr 60.7 3.21
FHLM Fixed - 30-Yr 290.1 3.89
FHLM Fixed - 15-Yr 88.7 3.22
GNMA RM Fixed 29.5 3.83
Total $1,229.8 3.86
Fixed Portfolio(2)
Category Fair Value(1) Weighted Average Coupon(3)
FNMA Fixed - 30-Yr $707.3 4.08
FNMA Fixed - 20-Yr 10.9 4.00
FNMA Fixed - 15-Yr 63.9 3.49
FHLM Fixed - 30-Yr 312.8 4.03
FHLM Fixed - 15-Yr 111.7 3.28
GNMA RM Fixed 17.4 4.77
Total $1,224.0 3.97
FNMA Fixed 30-Yr 54.1%
FNMA Fixed 15-Yr 4.9%
FHLM Fixed 30-Yr 23.9%
FHLM Fixed 15-Yr 8.5%
FNMA ARMS 5.4%
GNMA/FNMA/ FHLM Fixed IOs
1.1%
GNMA RM Fixed 1.3%
FNMA Fixed 20-Yr 0.8%

(1) Does not include long TBA positions, reverse mortgage pools, or fixed rate IOs. (2) Classification methodology may change over time as market practices change. (3) Fair value shown in millions. (4) Excludes Agency fixed rate RMBS without any prepayment history with a total value of $120.5 million as
of June 30, 2014 and $87.3 million as of March 31, 2014.
Ellington Residential: Agency Long Portfolio
Collateral Characteristics and Historical 3-month CPR Agency Fixed Rate Pool Portfolio 3/31/14: $1.20BN(1)
13
(5) “MHA” indicates those pools where underlying borrowers have participated in the Making Homes Affordable program.
Collateral Characteristics and Historical 3-month CPR Agency Fixed Rate Pool Portfolio 6/30/14: $1.21BN(1)
Characteristic(2) Fair Value(1)(3) 3-Month CPR %(4)
Loan Balance $689.0 2.8
MHA(5) 362.1 0.7
Low FICO 46.9 0.6
Non-Owner 13.1 7.2
High Non-Owner 1.4 15.7
Geography 7.8 0.2
Other 80.0 4.1
Total $1,200.3 2.2
Loan Balance 57%
MHA 30%
Low FICO 4%
Non-Owner 1%
High Non-Owner
<1%
Geography 1% Other
7%
Loan Balance66%
MHA26%
Low FICO2%
Non-Owner1%
Geography<1% Other
5%
Characteristic(2) Fair Value(1)(3) 3-Month CPR %(4)
Loan Balance $797.9 4.3
MHA(5) 312.7 2.1
Low FICO 19.7 0.3
Non-Owner 15.9 6.5
Geography 4.3 0.2
Other 56.1 13.0
Total $1,206.6 4.0

Ellington Residential: Non-Agency Long Portfolio
Previous Quarter
Non-Agency Long Portfolio 3/31/14: $32.0MM
14
Current Quarter
Non-Agency Long Portfolio 6/30/14: $35.7MM
Total Non-Agency Long Avg Mkt Px 59.2
Total Non-Agency Long Avg Mkt Px 64.4
Average book yield for the second quarter was 10.64% as compared to 10.39% for the first quarter
Underlying cash flows strengthening on held positions
As assets have rallied, prudent asset selection based on security-by-security, loan level analysis has become critical
Senior Jumbo/ Alt-A/Alt-B
51.9%
Seasoned Subprime
9.6%
Sub Jumbo/ Alt-A
36.0%
Other 2.5%
Senior Jumbo/ Alt-A/Alt-B
45.0%
Seasoned Subprime
8.8%
Sub Jumbo/ Alt-A 41.2%
Other 5.0%

Borrowings
and Hedges
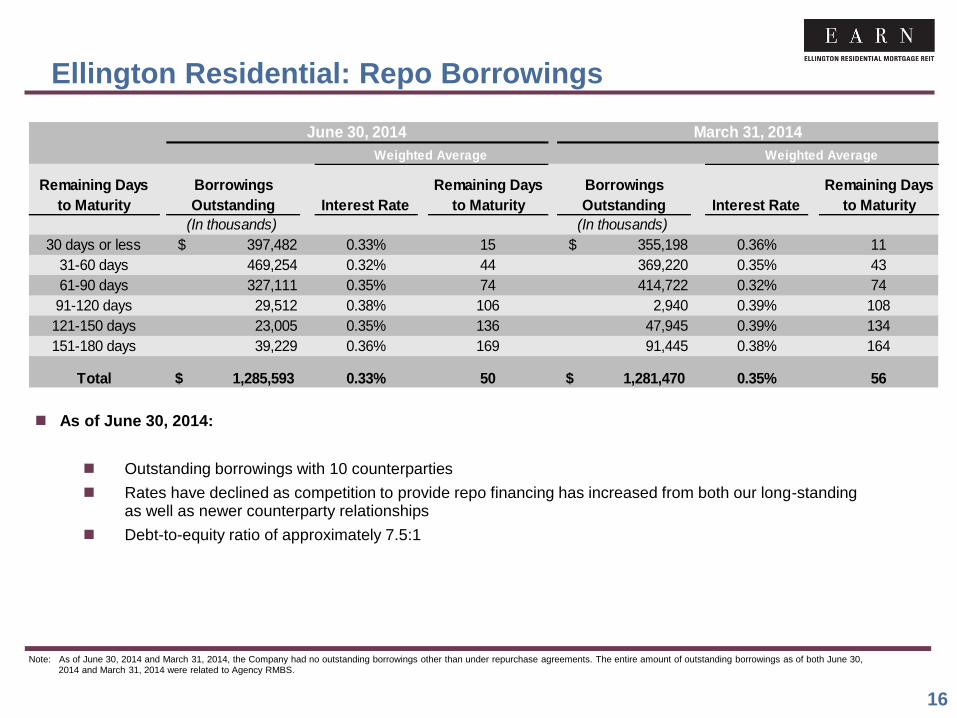
As of June 30, 2014:
Outstanding borrowings with 10 counterparties
Rates have declined as competition to provide repo financing has increased from both our long-standing as well as newer counterparty relationships
Debt-to-equity ratio of approximately 7.5:1
Ellington Residential: Repo Borrowings
Note: As of June 30, 2014 and March 31, 2014, the Company had no outstanding borrowings other than under repurchase agreements. The entire amount of outstanding borrowings as of both June 30, 2014 and March 31, 2014 were related to Agency RMBS.
16
Remaining Days
to Maturity
Borrowings
Outstanding Interest Rate
Remaining Days
to Maturity
Borrowings
Outstanding Interest Rate
Remaining Days
to Maturity
(In thousands) (In thousands)
30 days or less $ 397,482 0.33% 15 $ 355,198 0.36% 11
31-60 days 469,254 0.32% 44 369,220 0.35% 43
61-90 days 327,111 0.35% 74 414,722 0.32% 74
91-120 days 29,512 0.38% 106 2,940 0.39% 108
121-150 days 23,005 0.35% 136 47,945 0.39% 134
151-180 days 39,229 0.36% 169 91,445 0.38% 164
Total $ 1,285,593 0.33% 50 $ 1,281,470 0.35% 56
Weighted Average
March 31, 2014
Weighted Average
June 30, 2014

Ellington Residential: Interest Rate Hedging Portfolio
Previous Quarter Agency Interest Rate Hedging Portfolio 3/31/14:
Short $736.7MM 10-year equivalents
17
Agency interest rate hedges are shown in normalized units of risk, with each group of positions measured in “10-
year equivalents”
During the second quarter:
Continued to hold significant hedge position in the form of short TBAs
Maintained average term of interest rate swaps relative to the first quarter
Current Quarter Agency Interest Rate Hedging Portfolio 6/30/14:
Short $647.8MM 10-year equivalents
Note: “10-year equivalents” for a group of positions represent the amount of 10-year U.S. Treasury securities that would experience a similar change in market value under a standard parallel move in interest rates.
>5 Yr Interest Rate Swaps
54.1%
2-5 Yr Interest Rate Swaps
12.4%
Swaptions 0.9%
TBA Securities 32.6%
>5 Yr Interest Rate Swaps
55.4%
2-5 Yr Interest Rate Swaps
10.7%
TBA Securities 33.9%

Shorting “generic” pools (or TBAs) allows EARN to significantly reduce interest rate risk and basis risk in its Agency portfolio; interest rate risk is also hedged with swaps, swaptions, U.S. Treasuries, etc.
Average pay-up on Agency pools was 0.49% as of June 30, 2014 compared to 0.32% as of March 31, 2014
Estimated Change in Fair Value as of June 30, 2014 if Interest Rates Move(2):
Calculation of Exposure to Agency RMBS Based on Fair Value of TBA Portfolio:
18
(1) Net short TBA positions represents the current market value of the underlying Agency RMBS (on a forward delivery basis) as of June 30, 2014 and March 31, 2014. The net carrying value of the TBA positions as of June 30, 2014 and March 31, 2014 on the Consolidated Balance Sheet was $(3.0) million and $0.7 million, respectively.
(2) Based on the market environment as of June 30, 2014. Results are based on forward-looking models, which are inherently imperfect, and incorporate various simplifying assumptions. Therefore, the table above is for illustrative purposes only and actual changes in interest rates would likely cause changes in the actual value of our portfolio that would differ from those presented above, and such differences might be significant and adverse.
Ellington Residential: Interest Rate Hedging
(In millions) 6/30/2014 3/31/2014
Agency-related Portfolio
Long Agency RMBS $ 1,309 $ 1,296
Net Short TBA Positions(1) (523) (443)
Net Long Exposure to Agency RMBS $ 786 $ 853
(In thousands) Down 50 bps Up 50 bps
Agency RMBS - ARM Pools $ 1,164 $ (1,329)
Agency RMBS - Fixed Pools and IOs 22,856 (31,121)
TBAs (7,896) 11,161
Non-Agency RMBS 516 (493)
Interest Rate Swaps (19,387) 18,218
Swaptions 354 (32)
Repurchase Agreements (584) 857
Total $ (2,977) $ (2,739)

Ellington Residential: Interest Rate Hedging (Continued)
19
(1) Notional amount represents the principal balance of the underlying Agency RMBS. (2) Cost basis represents the forward price to be paid for the underlying Agency RMBS. (3) Market value represents the current market value of the underlying Agency RMBS (on a forward delivery basis) as of June 30, 2014. (4) Net carrying value represents the difference between the market value of the TBA contract as of June 30, 2014 and the cost basis, and is reported in Financial derivatives-assets, at fair value and Financial
derivatives-liabilities, at fair value on the Consolidated Balance Sheet.
June 30, 2014
Interest Rate Swap
Maturity Notional Amount Fair Value Weighted
Average Pay Rate
Weighted
Average
Receive Rate
Weighted
Average Years
to Maturity
(In thousands)
2016 $ 48,000 $ (197) 0.80 % 0.23 % 2.28
2017 93,750 (874) 1.23 % 0.23 % 3.11
2018 61,500 967 0.88 % 0.22 % 3.87
2020 52,600 1,380 1.43 % 0.23 % 5.88
2023 210,600 5,344 2.13 % 0.23 % 8.90
2024 14,200 (409) 2.84 % 0.23 % 9.80
2043 54,500 1,428 3.15 % 0.23 % 28.93
2044 5,000 (445) 3.69 % 0.23 % 29.72
Total $ 540,150 $ 7,194 1.78 % 0.23 % 8.68
TBA Securities
(In thousands)
Notional Cost Basis (2) Market Value (3) Net Carrying Value (4)
Amount (1)
Total TBAs,
Net $ (487,487) $ (520,512) $ (523,474) $ (2,962)
Interest Rate Swaptions
Option Underlying Swap
($ in thousands) Fair Value Months to Expiration Notional Amount Term (Years) Fixed Rate
Fixed Payer $ (723) 2.9 $ 22,000 10.0 3.31%
Straddle $ (201) 3.9 $ 8,000 10.0 3.08%

Supplemental
Information

Ellington Residential: Income Statement (Unaudited)
21
CONSOLIDATED STATEMENT OF OPERATIONS
June 30, 2014 March 31, 2014 June 30, 2014
(In thousands except share amounts)
INTEREST INCOME (EXPENSE)
Interest income $ 11,575 $ 11,959 $ 23,534
Interest expense (1,070) (1,155) (2,225)
Total net interest income 10,505 10,804 21,309
EXPENSES
Management fees 567 592 1,159
Professional fees 137 139 276
Other operating expenses 613 663 1,276
Total expenses 1,317 1,394 2,711
OTHER INCOME (LOSS)
Net realized gains (losses) on mortgage-backed securities 382 (3,025) (2,643)
Net realized (losses) on financial derivatives (11,155) (3,409) (14,564)
Change in net unrealized gains (losses) on mortgage-backed securities 25,424 17,581 43,005
Change in net unrealized gains (losses) on financial derivatives (12,789) (17,796) (30,585)
Total other income (loss) 1,862 (6,649) (4,787)
NET INCOME $ 11,050 $ 2,761 $ 13,811
NET INCOME PER COMMON SHARE
Basic $ 1.21 $ 0.30 $ 1.51
WEIGHTED AVERAGE SHARES OUTSTANDING 9,139,842 9,139,842 9,139,842
CASH DIVIDENDS PER SHARE:
Dividends Declared $ 0.55 $ 0.55 $ 1.10
Six Month Period
EndedThree Month Period Ended

Ellington Residential: Balance Sheet (Unaudited)
22
(1) Derived from audited financial statements as of December 31, 2013.
CONSOLIDATED BALANCE SHEET
As of
June 30, 2014 March 31, 2014
December 31,
2013 (1)
(In thousands except share amounts)
ASSETS
Cash and cash equivalents $ 49,908 $ 51,106 $ 50,112
Mortgage-backed securities, at fair value 1,344,444 1,327,629 1,326,036
Due from brokers 13,338 10,725 18,347
Financial derivatives-assets, at fair value 10,115 18,117 34,963
Receivable for securities sold 100,267 119,887 76,692
Interest receivable 5,769 5,522 4,766
Other assets 468 112 174
Total Assets $ 1,524,309 $ 1,533,098 $ 1,511,090
LIABILITIES AND SHAREHOLDERS' EQUITY
LIABILITIES
Repurchase agreements $ 1,285,593 $ 1,281,470 $ 1,310,347
Payable for securities purchased 46,467 65,812 2,776
Due to brokers 7,320 11,764 22,788
Financial derivatives-liabilities, at fair value 6,807 2,020 1,069
Dividend payable 5,027 5,027 4,570
Accrued expenses 930 874 996
Management fee payable 567 592 600
Interest payable 605 584 764
Total Liabilities 1,353,316 1,368,143 1,343,910
SHAREHOLDERS' EQUITY
Preferred shares, par value $0.01 per share, 100,000,000 shares authorized;
- - - (0 shares issued and outstanding, respectively)
Common shares, par value $0.01 per share, 500,000,000 shares authorized;
91 91
91 (9,139,842 shares issued and outstanding, respectively)
Additional paid-in-capital 181,203 181,188 181,147
Accumulated deficit (10,301) (16,324) (14,058)
Total Shareholders' Equity 170,993 164,955 167,180
Total Liabilities and Shareholders' Equity $ 1,524,309 $ 1,533,098 $ 1,511,090

Reconciliation of Core Earnings(1)
(1) Core Earnings consists of net income (loss), excluding realized and unrealized gains and losses on mortgage-backed securities and financial derivatives, and, if applicable, items of income or loss that are of a non-recurring nature. Core Earnings includes net realized and unrealized gains (losses) associated with payments and accruals of periodic payments on interest rate swaps. Core Earnings is a supplemental non-GAAP financial measure. We believe Core Earnings provides information useful to investors, because it is a metric used by our management to assess our performance and to evaluate the effective net yield provided by our portfolio. Moreover, one of our objectives is to generate income from the net interest margin on our portfolio and we use Core Earnings to help measure the extent to which we are achieving this objective. However, because Core Earnings is an incomplete measure of our financial results and differs from net income or net (loss) computed in accordance with GAAP, it should be considered as supplementary to, and not as a substitute for, our net income (loss) computed in accordance with GAAP. The table above reconciles, for the three month periods ended June 30, 2014 and March 31, 2014, our Core Earnings on a consolidated basis to the line on our consolidated statement of operations entitled Net Income, which we believe is the most directly comparable GAAP measure on our Consolidated Statement of Operations to Core Earnings.
(2) For the three month period ended June 30, 2014, represents Net realized gains (losses) on financial derivatives of $(11,155) less Net realized gains (losses) on periodic settlements of interest rate swaps of $(4,102). For the three month period ended March 31, 2014, represents Net realized gains (losses) on financial derivatives of $(3,409) less Net realized gains (losses) on periodic settlements of interest rate swaps of $(795).
(3) For the three month period ended June 30, 2014, represents Net change in unrealized gains (losses) on financial derivatives of $(12,789) less Change in net unrealized gains (losses) on accrued periodic settlements of interest rate swaps of $1,744. For the three month period ended March 31, 2014, represents Net change in unrealized gains (losses) on financial derivatives of $(17,796) less Change in net unrealized gains (losses) on accrued periodic settlements of interest rate swaps of $(1,583).
23
(In thousands except share amounts) Three Month Period
Ended June 30, 2014
Three Month Period
Ended March 31, 2014
Net Income $ 11,050 $ 2,761
Less:
Net realized gains (losses) on mortgage-backed securities 382 (3,025)
Net realized gains (losses) on financial derivatives, excluding periodic payments(2) (7,053) (2,614)
Change in net unrealized gains (losses) on mortgage-backed securities 25,424 17,581
Change in net unrealized gains (losses) on financial derivatives, excluding accrued periodic
payments(3)
(14,533)
(16,213)
Subtotal 4,220 (4,271)
Core Earnings $ 6,830 $ 7,032
Weighted Average Shares Outstanding 9,139,842 9,139,842
Core Earnings Per Share $ 0.75 $ 0.77

About Ellington
EARN is managed by Ellington Residential Mortgage Management LLC, an affiliate of
Ellington Management Group, L.L.C. (“EMG”)
EMG was founded in 1994 by Michael Vranos and five partners; currently has over 140
employees, giving EARN access to time-tested infrastructure and industry-leading
resources in trading, research, risk management, and operational support
EMG has approximately $5.6 billion in assets under management as of June 30, 2014
EMG's portfolio managers are among the most experienced in the MBS sector and the
firm’s analytics have been developed over a 19-year history
Prior to forming EMG, five of the founding partners constituted the core of Kidder
Peabody’s MBS trading and research group, while one spent ten years at Lehman
Brothers where he ran collateralized mortgage obligation (“CMO”) trading
The founding partners each have advanced academic training in mathematics and
engineering, including among them several Ph.D.’s and Master’s degrees
EARN was formed through an initial strategic venture between affiliates of EMG and a
group of funds managed by an affiliate of The Blackstone Group LP
24

Investor Contact:
Lisa Mumford
Chief Financial Officer
Ellington Residential Mortgage REIT
(203) 409-3773
Media Contact:
Steve Bruce or Taylor Ingraham
ASC Advisors, for
Ellington Residential Mortgage REIT
(203) 992-1230
Ellington Residential Mortgage REIT
53 Forest Ave
Old Greenwich, CT 06870
www.earnreit.com