2nd Chapter Failure (Chapter 8)cc.usst.edu.cn/G2S/eWebEditor/uploadfile/...2018-06-19 · affect the...
54
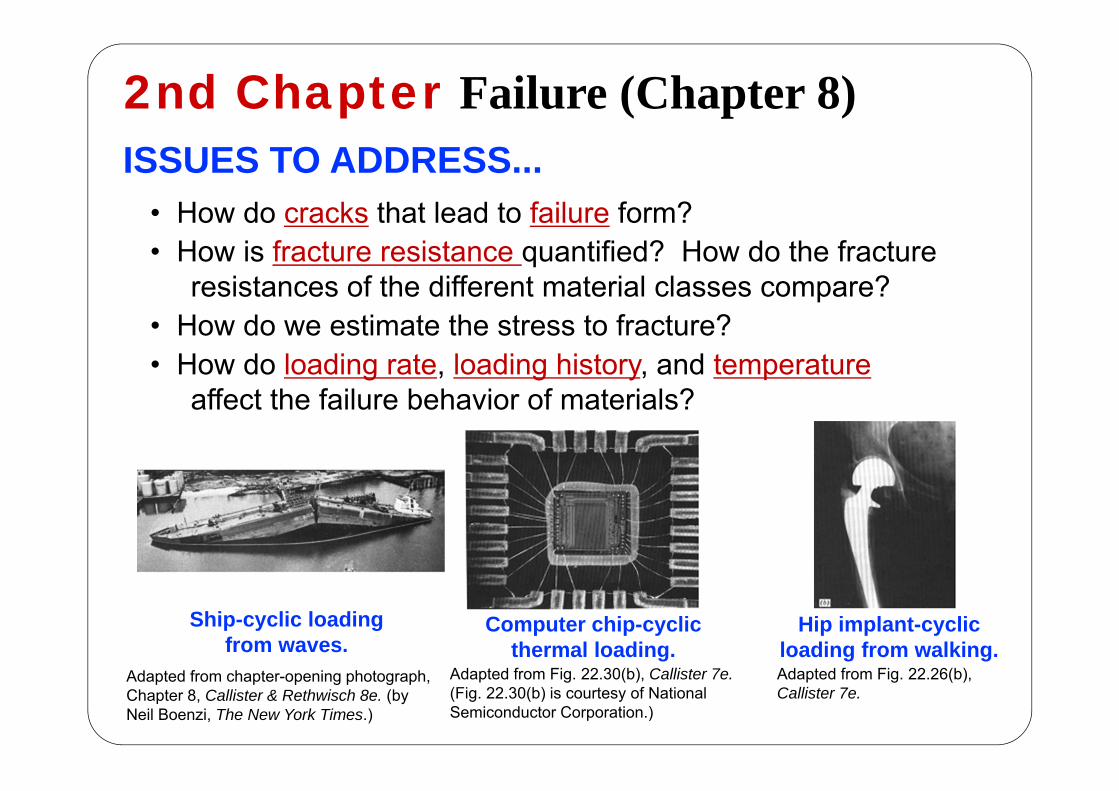
1 ISSUES TO ADDRESS... • How do cracks that lead to failure form? • How is fracture resistance quantified? How do the fracture resistances of the different material classes compare? • How do we estimate the stress to fracture? • How do loading rate, loading history , and temperature affect the failure behavior of materials? Ship-cyclic loading from waves. Computer chip-cyclic thermal loading. Hip implant-cyclic loading from walking. Adapted from Fig. 22.30(b), Callister 7e. (Fig. 22.30(b) is courtesy of National Semiconductor Corporation.) Adapted from Fig. 22.26(b), Callister 7e. Adapted from chapter-opening photograph, Chapter 8, Callister & Rethwisch 8e. (by Neil Boenzi, The New York Times.) 2nd Chapter Failure (Chapter 8)
Transcript of 2nd Chapter Failure (Chapter 8)cc.usst.edu.cn/G2S/eWebEditor/uploadfile/...2018-06-19 · affect the...
1
ISSUES TO ADDRESS...• How do cracks that lead to failure form?• How is fracture resistance quantified? How do the fracture
resistances of the different material classes compare?• How do we estimate the stress to fracture?• How do loading rate, loading history, and temperature
affect the failure behavior of materials?
Ship-cyclic loadingfrom waves.
Computer chip-cyclicthermal loading.
Hip implant-cyclicloading from walking.
Adapted from Fig. 22.30(b), Callister 7e.(Fig. 22.30(b) is courtesy of National Semiconductor Corporation.)
Adapted from Fig. 22.26(b), Callister 7e.
Adapted from chapter-opening photograph, Chapter 8, Callister & Rethwisch 8e. (by Neil Boenzi, The New York Times.)
2nd Chapter Failure (Chapter 8)

2
1. Describe the mechanism of crack propagation for bothductile and brittle modes of fracture.2. Explain why the strengths of brittle materials are muchlower than predicted by theoretical calculations.3. Define fracture toughness in terms of(a) a brief statement(b) an equation; define all parameters in this equation.4. Make a distinction between fracture toughness and planestrain fracture toughness.5. Name and describe the two impact fracture testingtechniques.
Learning Objectives
School of Materials Science and Engineering
3
6. Define fatigue and specify the conditions underwhich it occurs.7. From a fatigue plot for some material, determine(a) the fatigue lifetime (at a specified stress level)(b) the fatigue strength (at a specified number of cycles).8. Define creep and specify the conditions underwhich it occurs.9. Given a creep plot for some material, determine(a) the steady-state creep rate(b) the rupture lifetime.
Learning Objectives
School of Materials Science and Engineering
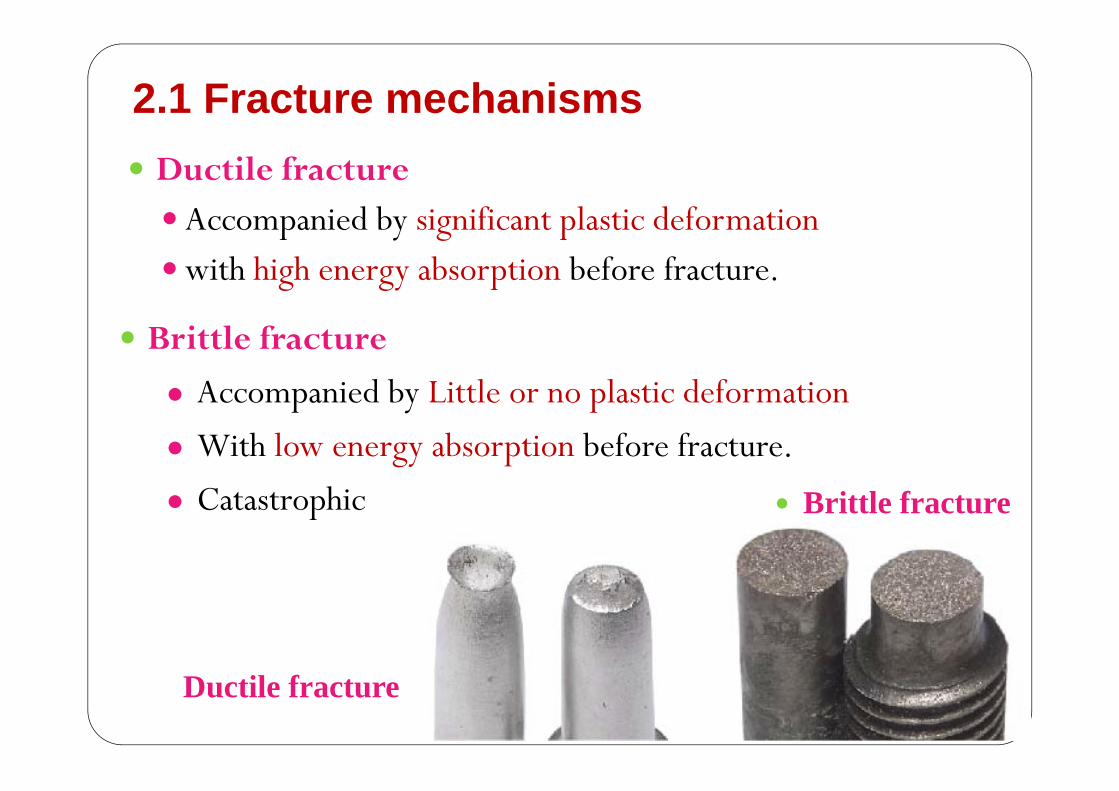
2.1 Fracture mechanisms
4
Ductile fractureAccompanied by significant plastic deformationwith high energy absorption before fracture.
Brittle fracture
Accompanied by Little or no plastic deformation
With low energy absorption before fracture.
Catastrophic
Ductile fracture
Brittle fracture
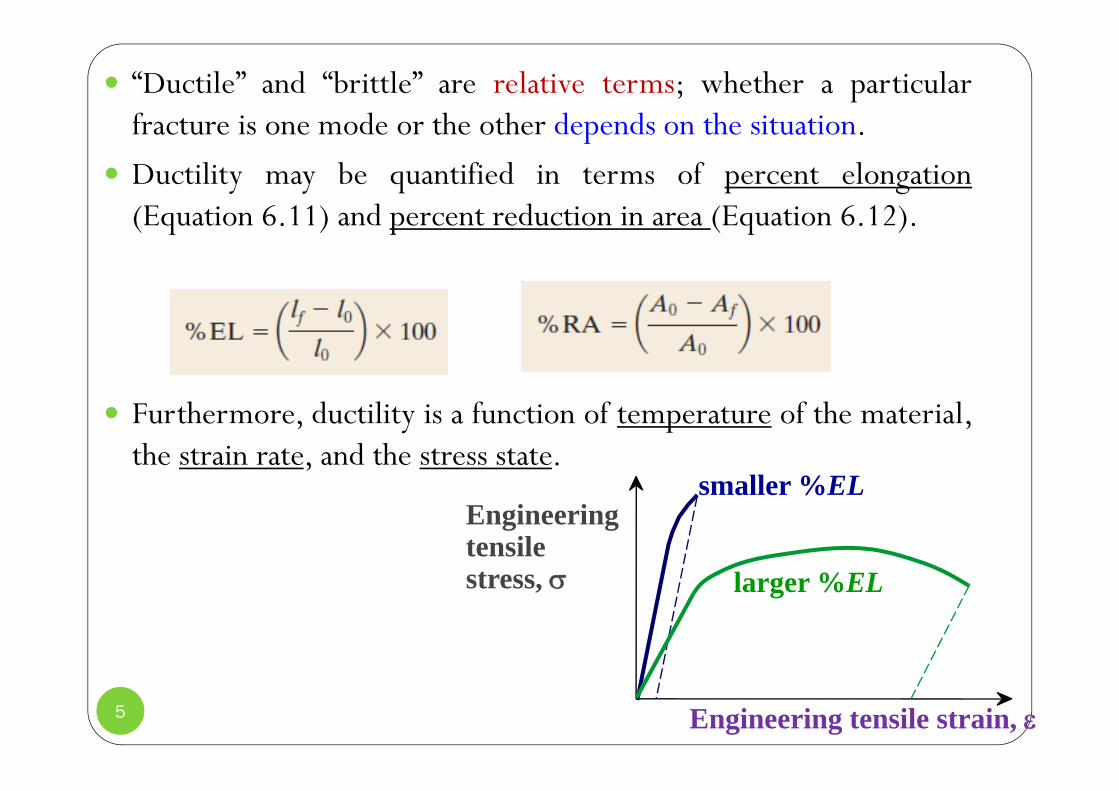
“Ductile” and “brittle” are relative terms; whether a particularfracture is one mode or the other depends on the situation.
Ductility may be quantified in terms of percent elongation(Equation 6.11) and percent reduction in area (Equation 6.12).
Furthermore, ductility is a function of temperature of the material,the strain rate, and the stress state.
5 Engineering tensile strain,
Engineering tensile stress,
smaller %EL
larger %EL
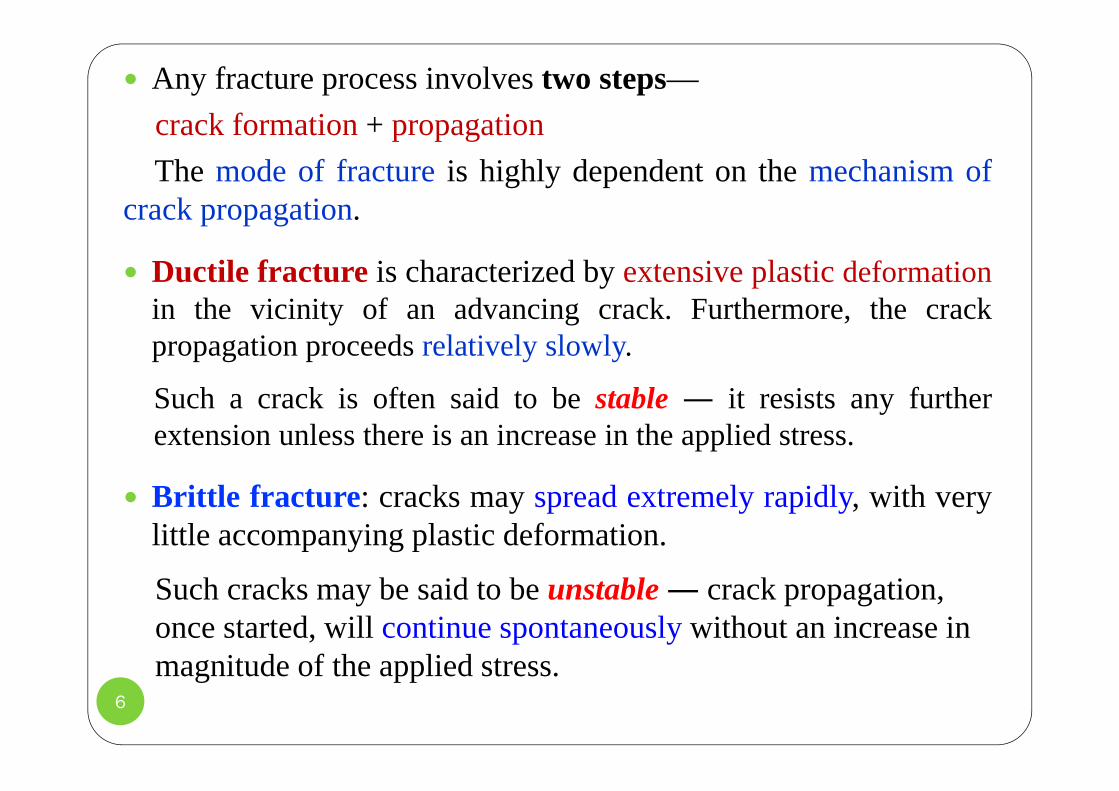
Any fracture process involves two steps—crack formation + propagationThe mode of fracture is highly dependent on the mechanism of
crack propagation.
Ductile fracture is characterized by extensive plastic deformationin the vicinity of an advancing crack. Furthermore, the crackpropagation proceeds relatively slowly.
Such a crack is often said to be stable ― it resists any furtherextension unless there is an increase in the applied stress.
Brittle fracture: cracks may spread extremely rapidly, with verylittle accompanying plastic deformation.
Such cracks may be said to be unstable ― crack propagation,once started, will continue spontaneously without an increase inmagnitude of the applied stress.
6
7
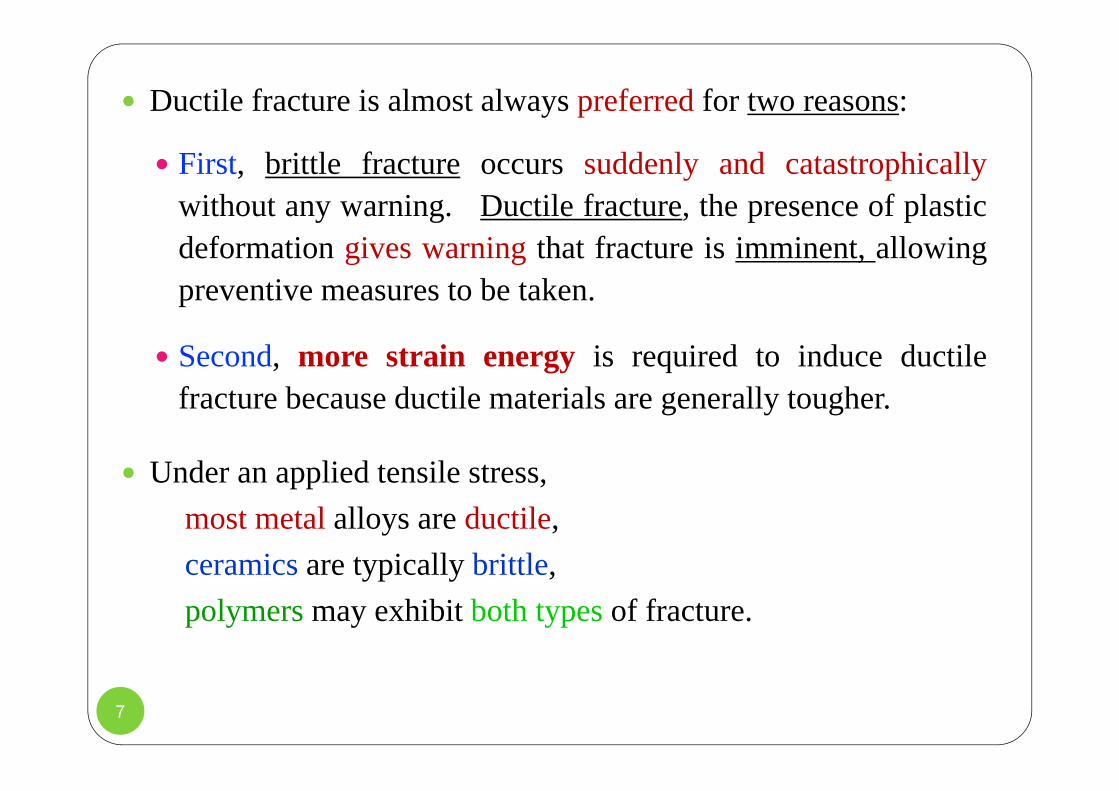
Ductile fracture is almost always preferred for two reasons:
First, brittle fracture occurs suddenly and catastrophicallywithout any warning. Ductile fracture, the presence of plasticdeformation gives warning that fracture is imminent, allowingpreventive measures to be taken.
Second, more strain energy is required to induce ductilefracture because ductile materials are generally tougher.
Under an applied tensile stress,most metal alloys are ductile,ceramics are typically brittle,polymers may exhibit both types of fracture.

Ductile vs Brittle FailureVery
DuctileModerately
Ductile BrittleFracturebehavior:
Large Moderate%RA or %EL Small
• Classification:
• Ductile fracture is usually moredesirable than brittle fracture!
Ductile:Warning before
fracture
Brittle:No
warning
(a) Highly ductile fracture in which the specimen necks down to a point.(b) Moderately ductile fracture after some necking. (c) Brittle fracture without any plastic deformation.
9
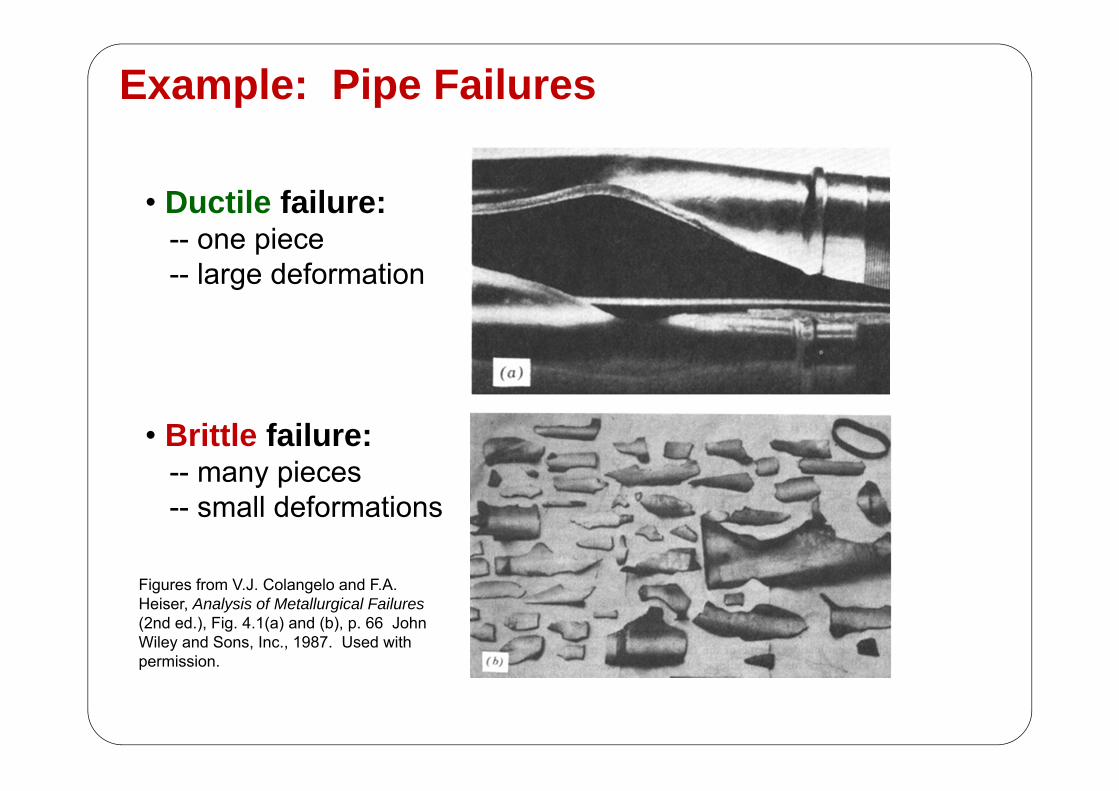
Example: Pipe Failures
• Ductile failure:-- one piece-- large deformation
Figures from V.J. Colangelo and F.A. Heiser, Analysis of Metallurgical Failures(2nd ed.), Fig. 4.1(a) and (b), p. 66 John Wiley and Sons, Inc., 1987. Used with permission.
• Brittle failure:-- many pieces-- small deformations

10
Moderately Ductile Failure
• Resultingfracturesurfaces(steel)
50 mm
Particles serve as void nucleationsites.
50 mm
From V.J. Colangelo and F.A. Heiser, Analysis of Metallurgical Failures (2nd ed.), Fig. 11.28, p. 294, John Wiley and Sons, Inc., 1987. (Orig. source: P. Thornton, J. Mater. Sci., Vol. 6, 1971, pp. 347-56.)
100 mmFracture surface of tire cord wire loaded in tension. Courtesy of F. Roehrig, CC Technologies, Dublin, OH. Used with permission.
• Failure Stages:necking
void nucleation
void growthand coalescenceto form crack
shearing at surface fracture

Moderately Ductile vs. Brittle Failure
11
cup-and-cone fracture
In aluminum
brittle fracture
In a mild steel 低碳钢
Fractographic StudiesMuch more detailed information regarding the mechanism of
fracture is available from microscopic examination.
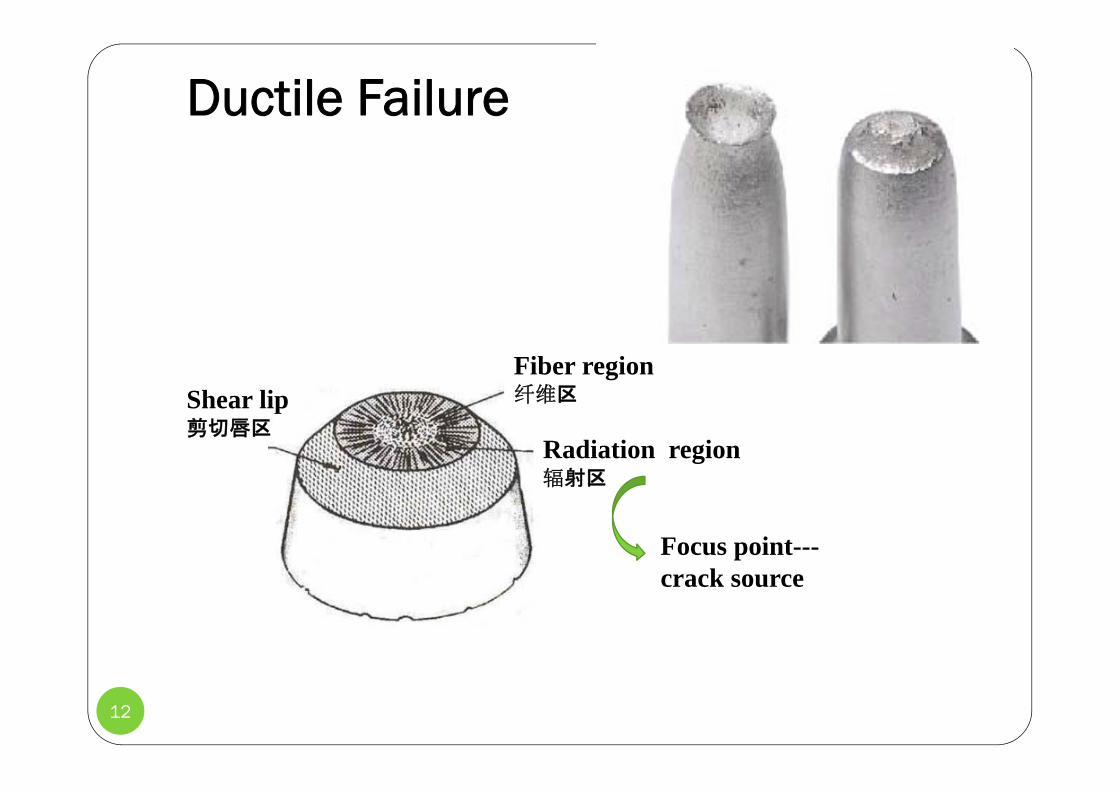
Ductile Failure
12
Shear lip剪切唇区
Fiber region纤维区
Radiation region辐射区
Focus point---crack source
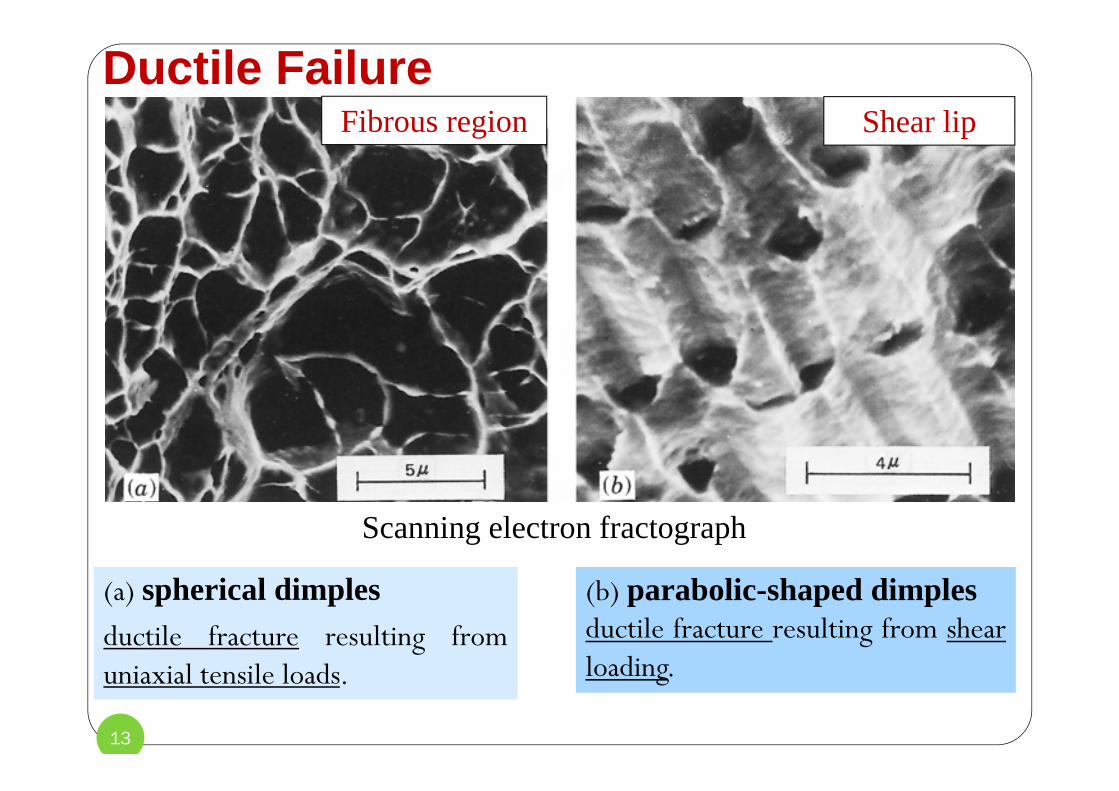
(a) spherical dimplesductile fracture resulting fromuniaxial tensile loads.
13
(b) parabolic-shaped dimplesductile fracture resulting from shearloading.
Scanning electron fractograph
Ductile FailureFibrous region Shear lip
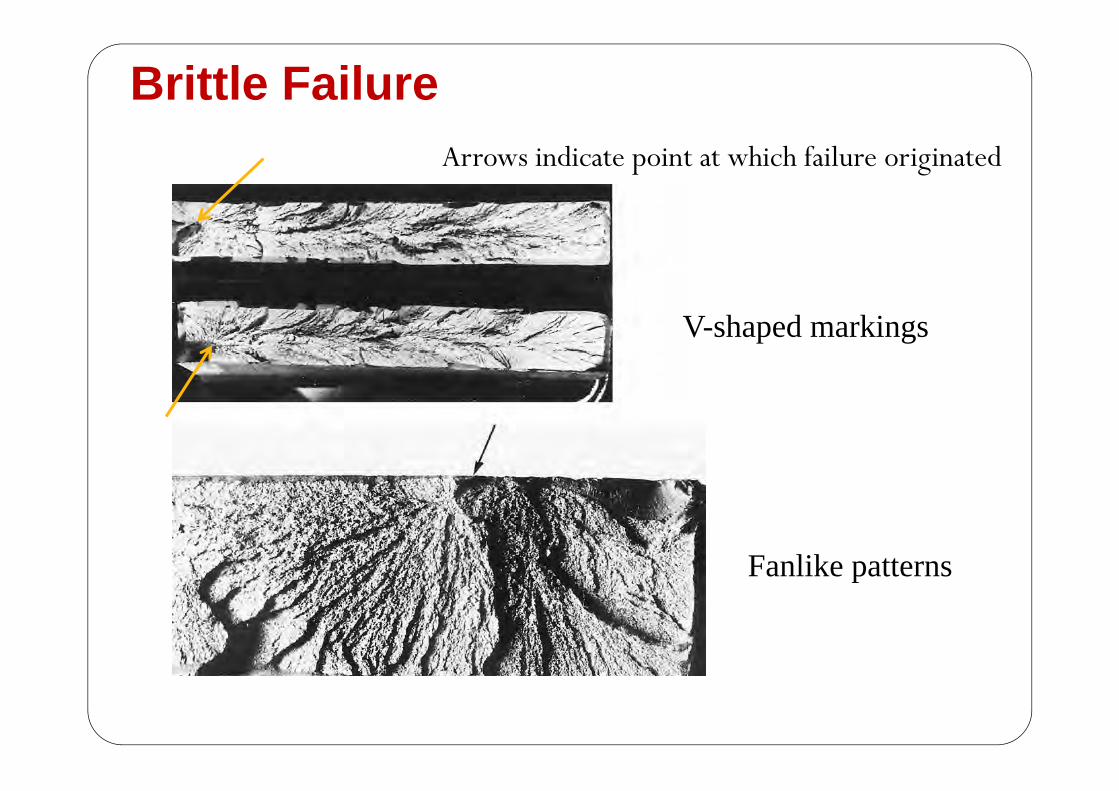
Brittle Failure
14
Arrows indicate point at which failure originated
V-shaped markings
Fanlike patterns
15
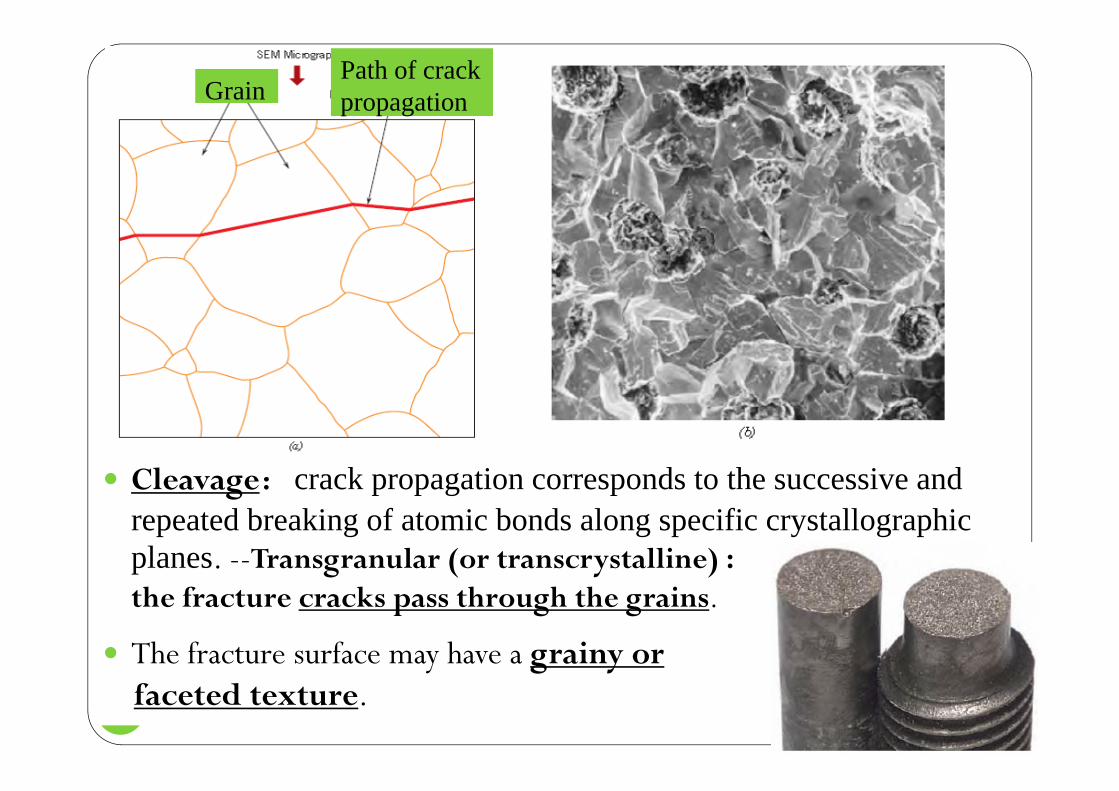
Grain Path of crack propagation
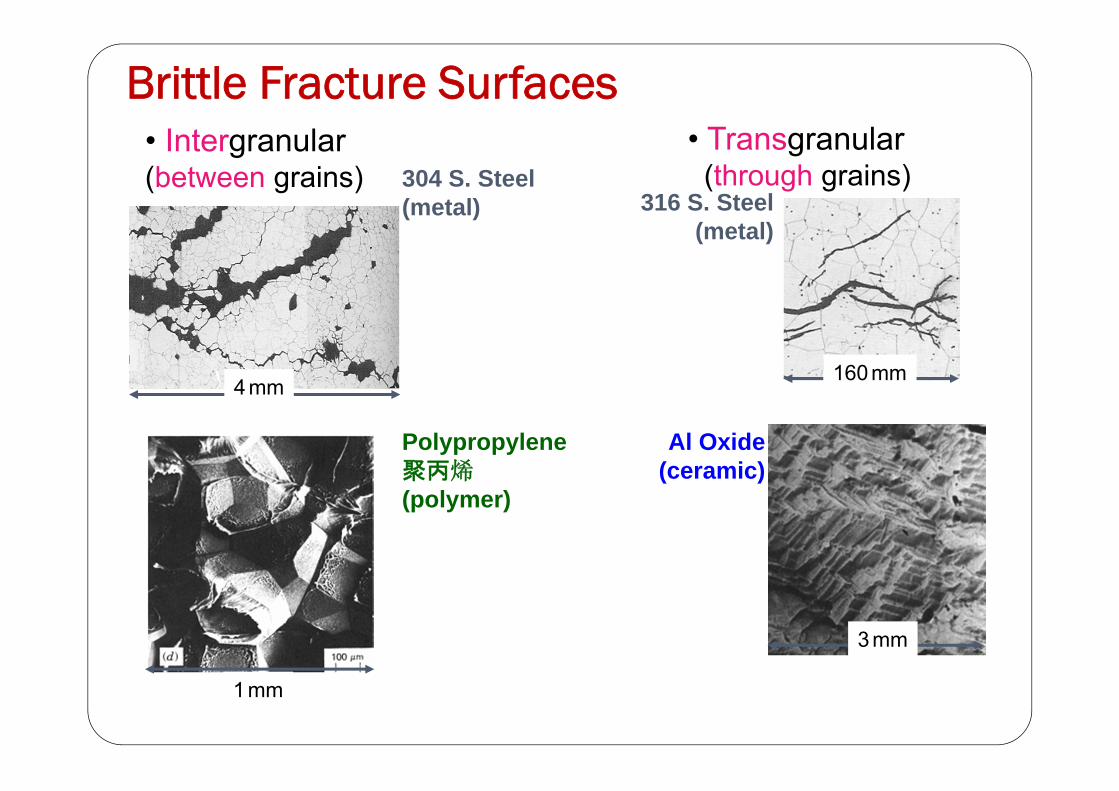
Cleavage:crack propagation corresponds to the successive and repeated breaking of atomic bonds along specific crystallographic planes. --Transgranular (or transcrystalline) :the fracture cracks pass through the grains.
The fracture surface may have a grainy or faceted texture.
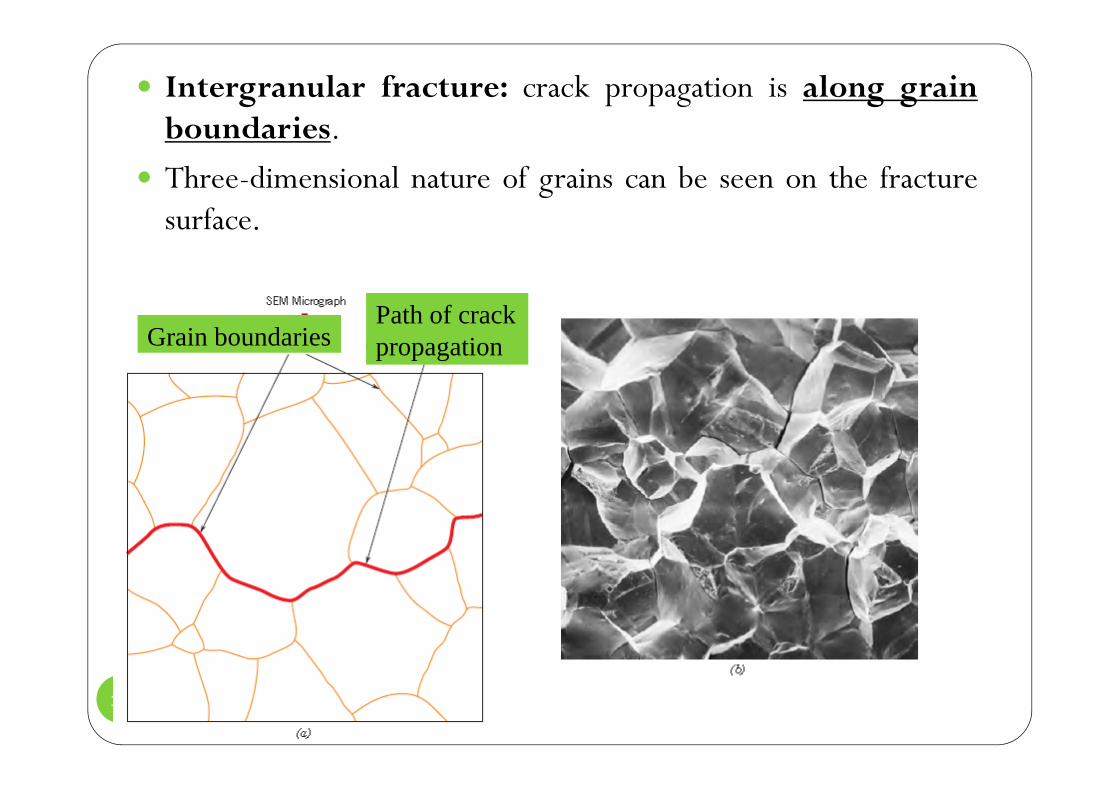
Intergranular fracture: crack propagation is along grainboundaries.
Three-dimensional nature of grains can be seen on the fracturesurface.
16
Grain boundaries Path of crack propagation
17
Brittle Fracture Surfaces• Intergranular(between grains) 304 S. Steel
(metal)
Polypropylene聚丙烯(polymer)
4mm
• Transgranular(through grains)
Al Oxide(ceramic)
316 S. Steel (metal)
3mm
160mm
1mm
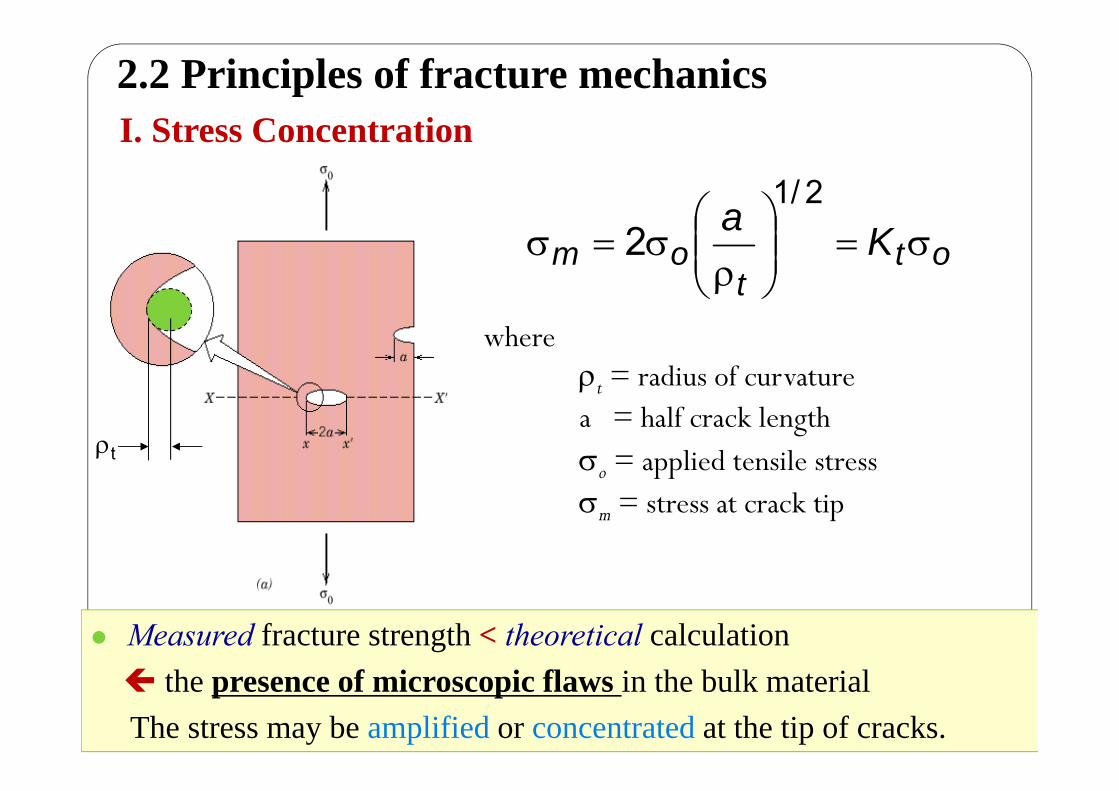
I. Stress Concentration
18
where t = radius of curvaturea = half crack lengtho = applied tensile stressm = stress at crack tip
t
ott
om K
2/1
2 a
2.2 Principles of fracture mechanics
Measured fracture strength < theoretical calculation the presence of microscopic flaws in the bulk materialThe stress may be amplified or concentrated at the tip of cracks.
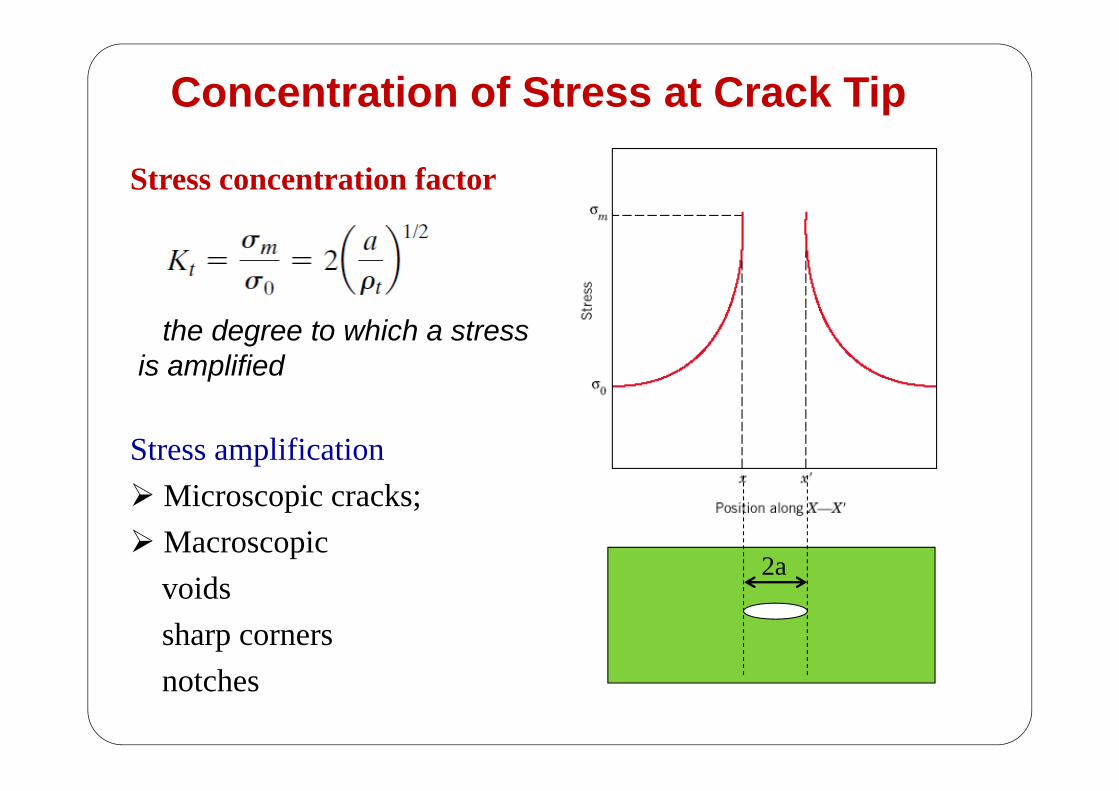
Concentration of Stress at Crack Tip
19
Stress concentration factor
the degree to which a stressis amplified
2a
Stress amplificationMicroscopic cracks;Macroscopic
voidssharp cornersnotches
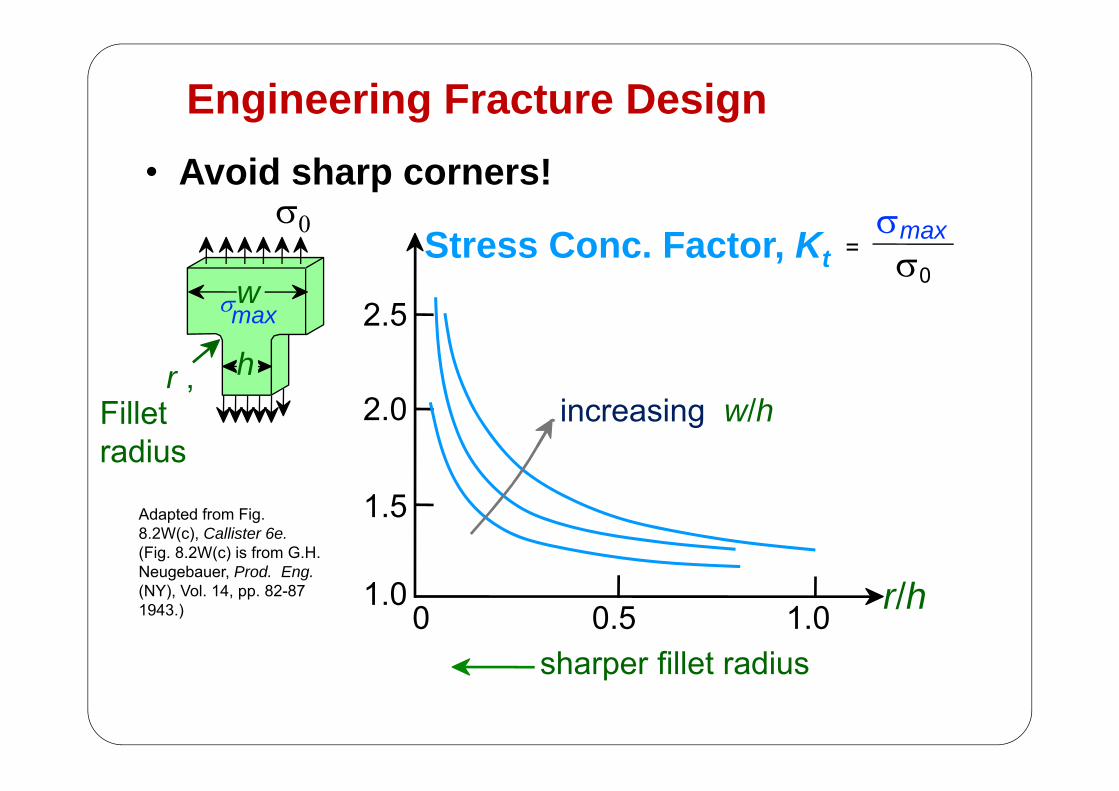
Engineering Fracture Design
20
r/h
sharper fillet radius
increasing w/h
0 0.5 1.01.0
1.5
2.0
2.5
Stress Conc. Factor, Kt =
• Avoid sharp corners!
Adapted from Fig. 8.2W(c), Callister 6e.(Fig. 8.2W(c) is from G.H. Neugebauer, Prod. Eng.(NY), Vol. 14, pp. 82-87 1943.)
r , Fillet radius
w
h
max
max0
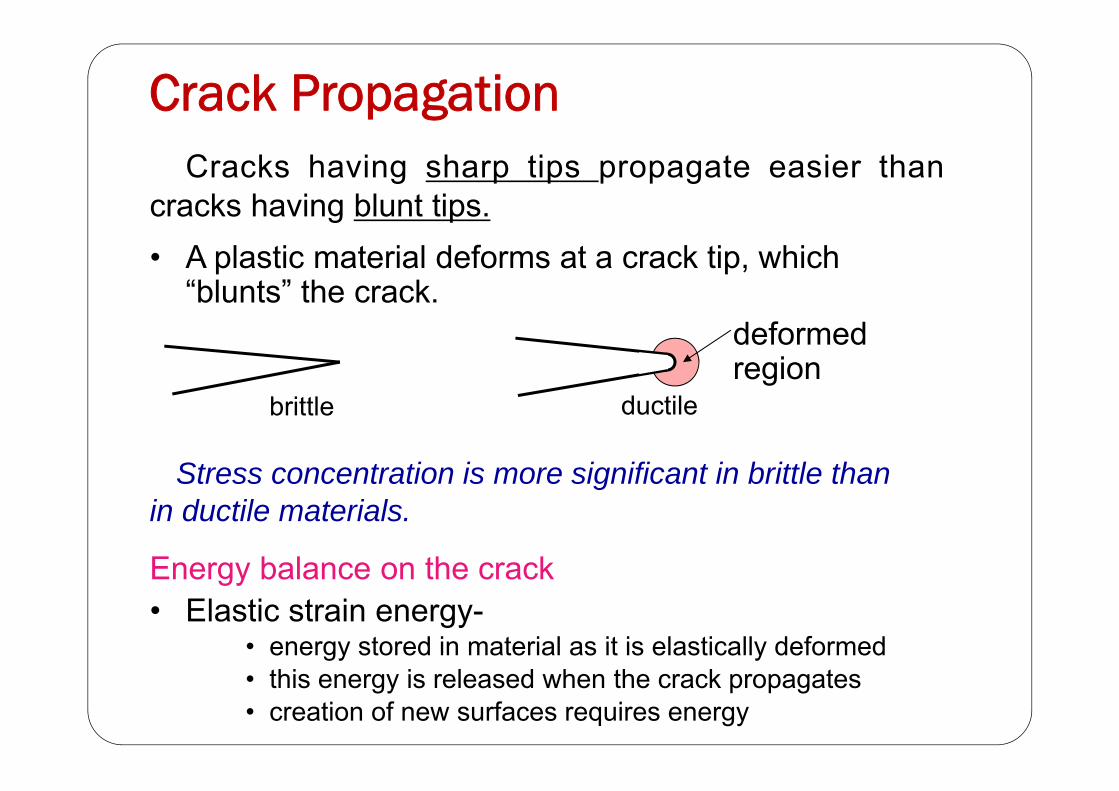
Crack Propagation
21
Cracks having sharp tips propagate easier thancracks having blunt tips.• A plastic material deforms at a crack tip, which
“blunts” the crack.deformed region
brittle
Stress concentration is more significant in brittle than in ductile materials.
Energy balance on the crack• Elastic strain energy-
• energy stored in material as it is elastically deformed• this energy is released when the crack propagates• creation of new surfaces requires energy
ductile

Criterion for Crack Propagation
22
Crack propagates if crack-tip stress (m) exceeds a critical stress (c)
where– E = modulus of elasticity– s = specific surface energy– a = one half length of internal crack
• For ductile materials => replace s with s + pwhere p is plastic deformation energy
2/1s
c aE2
i.e., m > c
EXAMPLE PROBLEM 8.1
brittle materials

II. Fracture Toughness
Unit:
Y is a dimensionless parameter or function that depends onboth crack and specimen sizes and geometries, as well as themanner of load application.
23
Fracture toughness:a measure of a material’s resistance to brittle fracture when a crack is present.
• thin specimens: Kc ----depend on specimen thickness. • thick specimens: independent of thickness; under these conditions a condition of plane strain exists.
plane strain fracture toughness

Fracture Toughness
24
Fracture toughness: KIC is fracture toughness for most situations.
The three modes of crack surface displacement.(a) Mode I, opening or tensile mode;(b) Mode II, sliding mode(c) Mode III, tearing mode.
Based on data in Table B.5,Callister & Rethwisch 8e.Composite reinforcement geometry is: f = fibers; sf = short fibers; w = whiskers; p = particles. Addition data as noted (vol. fraction of reinforcement):1. (55vol%) ASM Handbook, Vol. 21, ASM Int., Materials Park, OH (2001) p. 606.2. (55 vol%) Courtesy J. Cornie, MMC, Inc., Waltham, MA.3. (30 vol%) P.F. Becher et al., Fracture Mechanics of Ceramics, Vol. 7, Plenum Press (1986). pp. 61-73.4. Courtesy CoorsTek, Golden, CO.5. (30 vol%) S.T. Buljan et al., "Development of Ceramic Matrix Composites for Application in Technology for Advanced Engines Program", ORNL/Sub/85-22011/2, ORNL, 1992.6. (20vol%) F.D. Gace et al., Ceram. Eng. Sci. Proc., Vol. 7 (1986) pp. 978-82.
Graphite/ Ceramics/ Semicond
Metals/ Alloys
Composites/ fibersPolymers
5
KIc
(MP
a · m
0.5)
1
Mg alloysAl alloys
Ti alloys
Steels
Si crystalGlass -sodaConcrete
Si carbide
PC
Glass 6
0.5
0.7
2
43
10
20
30
<100><111>
Diamond
PVCPP
Polyester
PS
PET
C-C(|| fibers) 1
0.6
67
40506070
100
Al oxideSi nitride
C/C( fibers) 1
Al/Al oxide(sf) 2
Al oxid/SiC(w) 3
Al oxid/ZrO 2(p)4Si nitr/SiC(w) 5
Glass/SiC(w) 6
Y2O3/ZrO 2(p)4
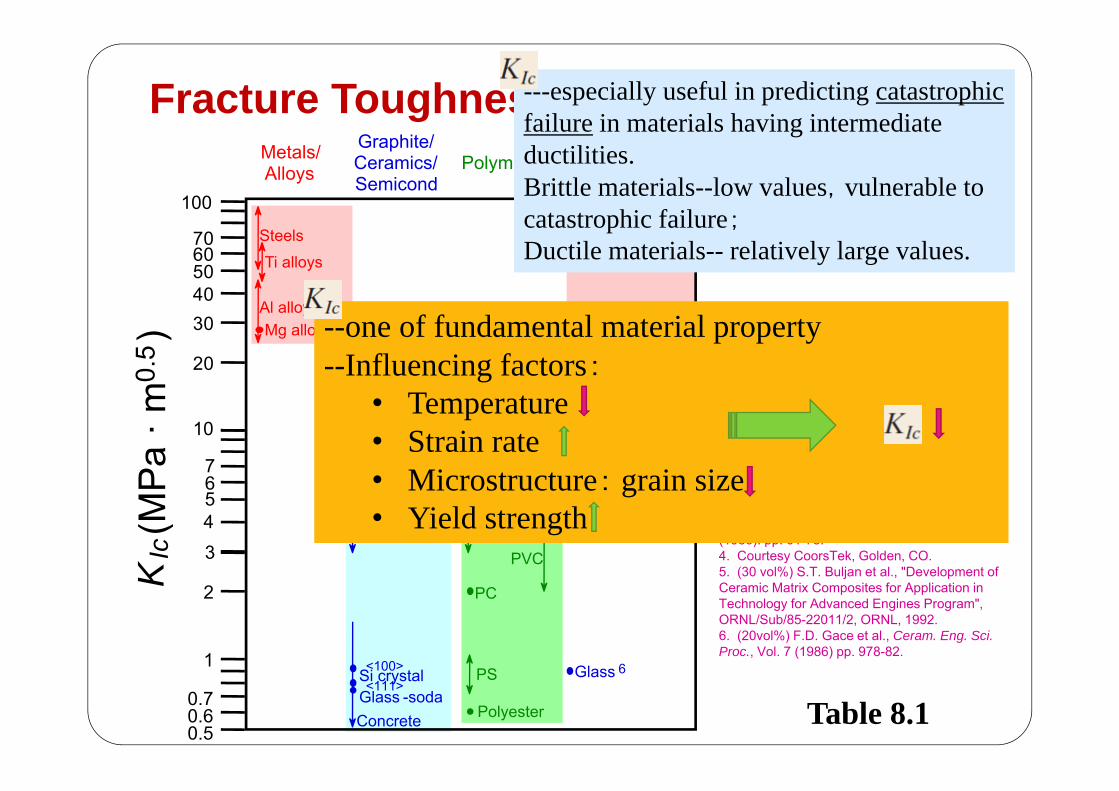
Fracture Toughness Ranges---especially useful in predicting catastrophic failure in materials having intermediate ductilities.Brittle materials--low values,vulnerable to catastrophic failure;Ductile materials-- relatively large values.
--one of fundamental material property--Influencing factors:
• Temperature• Strain rate• Microstructure: grain size • Yield strength
25 Table 8.1

26
III. Design Against Crack Growth
• Crack growth condition:
• Largest, most highly stressed cracks grow first!
K ≥ Kc = aY
--Scenario 1: Max. flaw size dictates design stress.
maxa
YKc
design
amaxno fracture
fracture
--Scenario 2: Design stressdictates max. flaw size.
2
max1
design
c
YKa
amax
no fracture
fracture
27
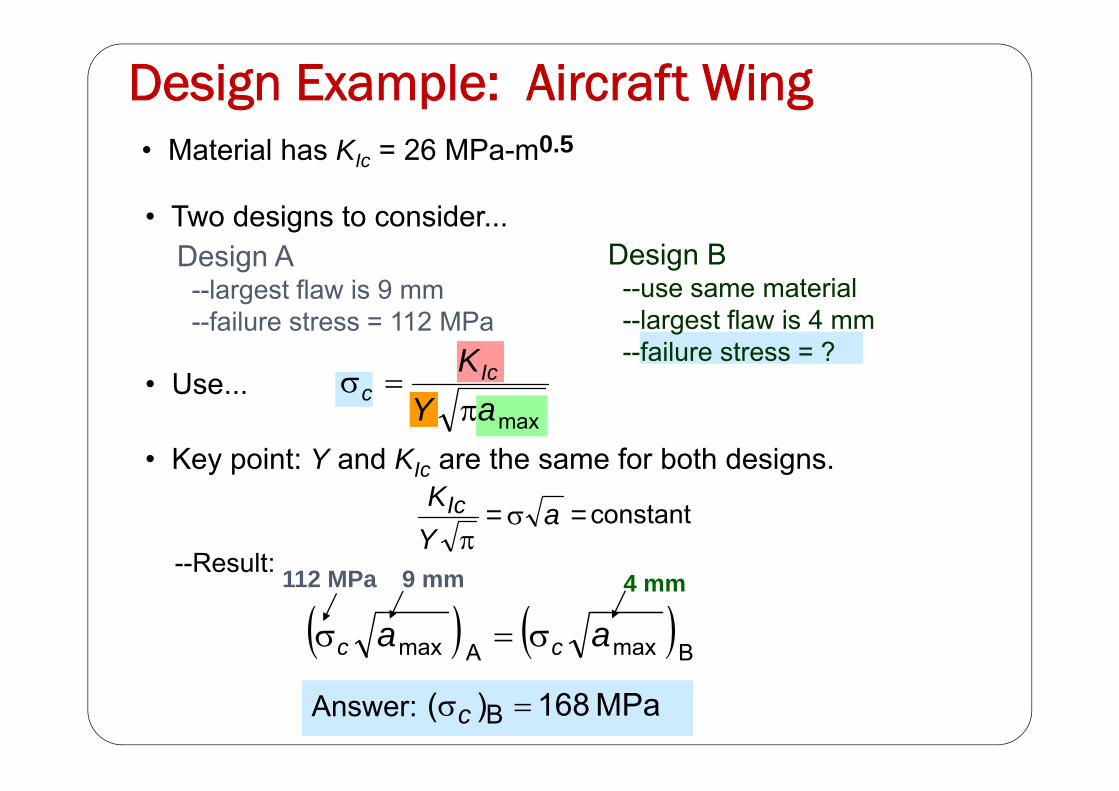
Design Example: Aircraft Wing
Answer: MPa 168)( B c
• Two designs to consider...Design A--largest flaw is 9 mm--failure stress = 112 MPa
Design B--use same material--largest flaw is 4 mm--failure stress = ?
• Key point: Y and KIc are the same for both designs.
• Material has KIc = 26 MPa-m0.5
• Use...maxa
Y
KIcc
B max Amax aa cc
9 mm112 MPa 4 mm--Result:
= a = Y
KIc constant
28
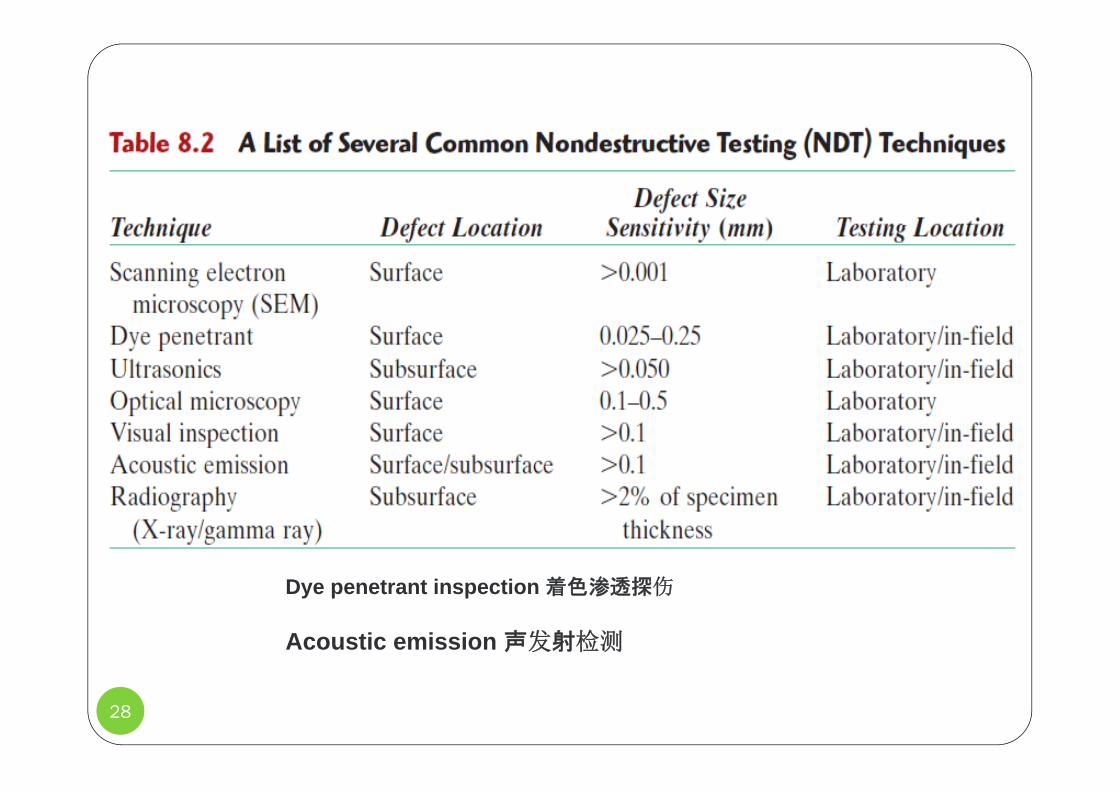
Dye penetrant inspection 着色渗透探伤
Acoustic emission 声发射检测

29
DESIGN EXAMPLE 8.1
Material Specification for a Pressurized Spherical Tank
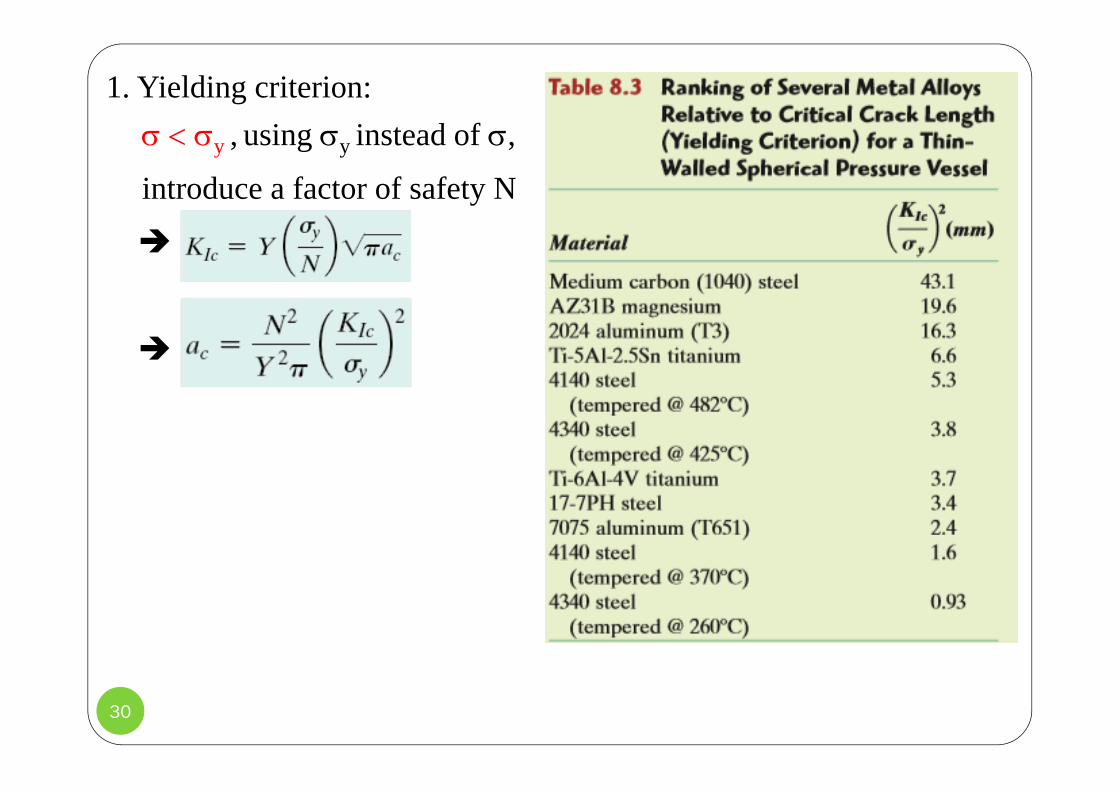
30
1. Yielding criterion:y , using y instead of ,
introduce a factor of safety N
31
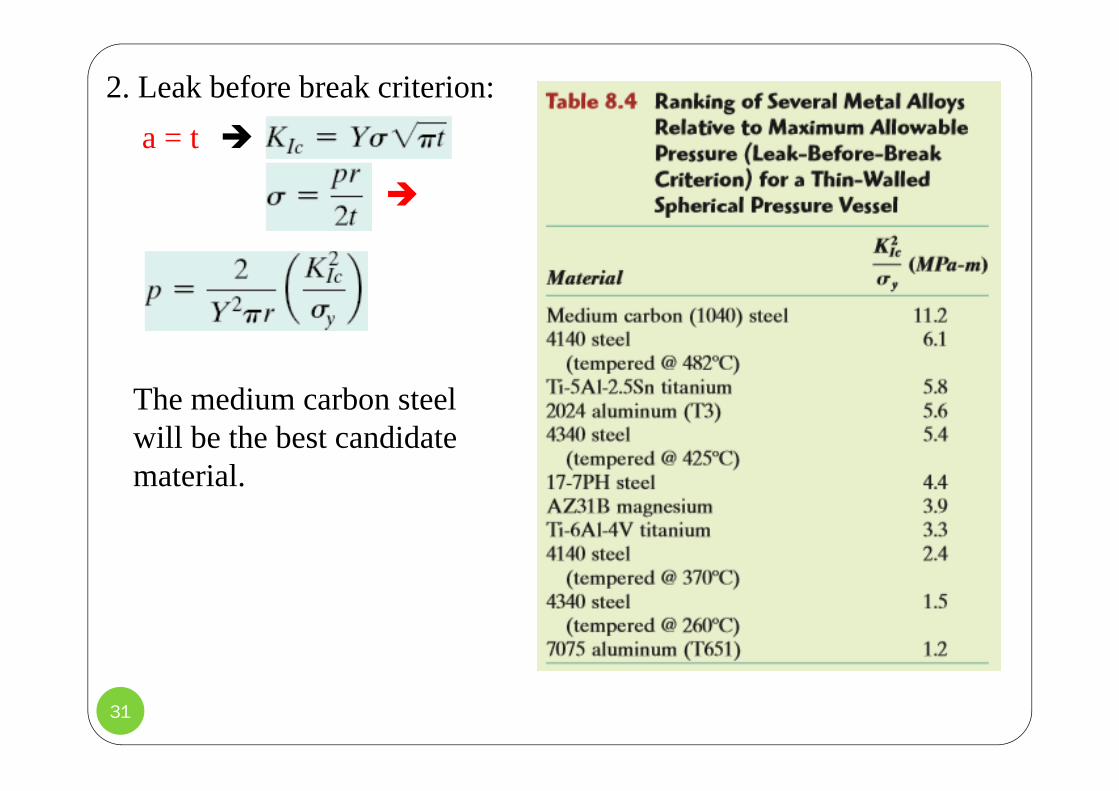
2. Leak before break criterion:a = t
The medium carbon steel will be the best candidate material.
32
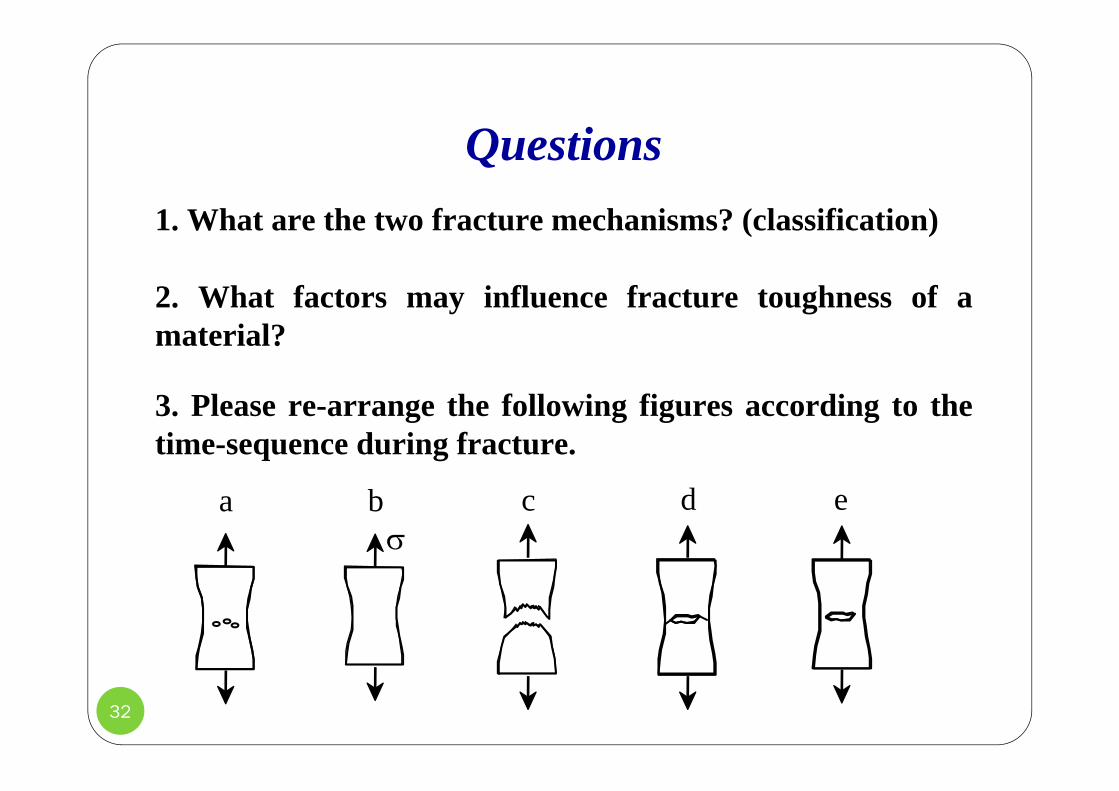
Questions1. What are the two fracture mechanisms? (classification)
2. What factors may influence fracture toughness of amaterial?
3. Please re-arrange the following figures according to thetime-sequence during fracture.
a
b c d e
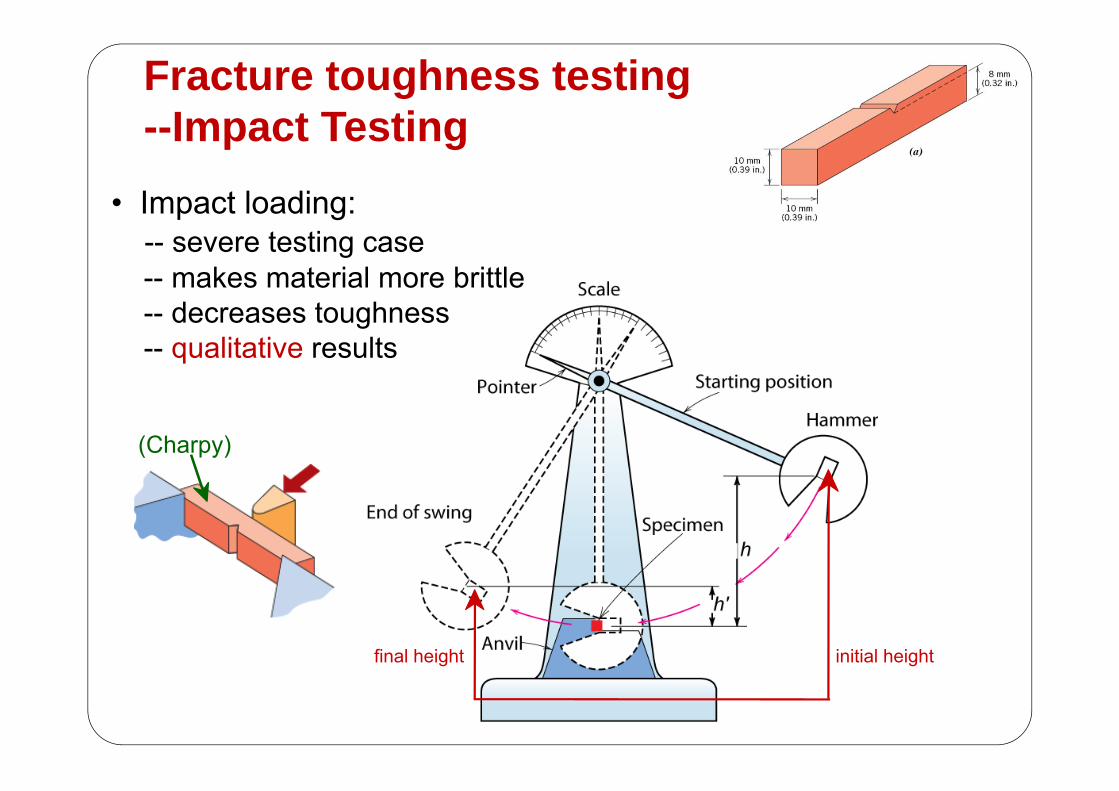
Fracture toughness testing--Impact Testing
33
final height initial height
• Impact loading: -- severe testing case-- makes material more brittle-- decreases toughness-- qualitative results
(Charpy)
34
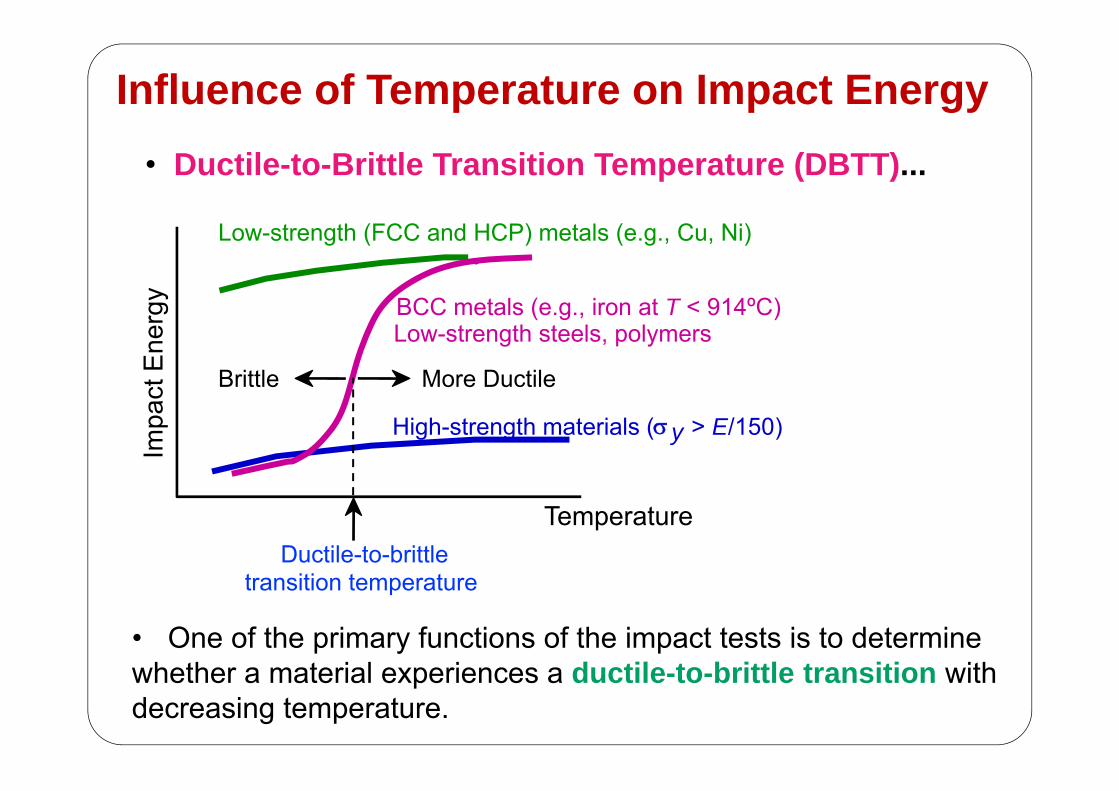
Influence of Temperature on Impact Energy • Ductile-to-Brittle Transition Temperature (DBTT)...
BCC metals (e.g., iron at T < 914ºC)
Impa
ct E
nerg
y
Temperature
High-strength materials (y > E/150)
Low-strength steels, polymers
More DuctileBrittle
Ductile-to-brittle transition temperature
Low-strength (FCC and HCP) metals (e.g., Cu, Ni)
• One of the primary functions of the impact tests is to determine whether a material experiences a ductile-to-brittle transition with decreasing temperature.
35
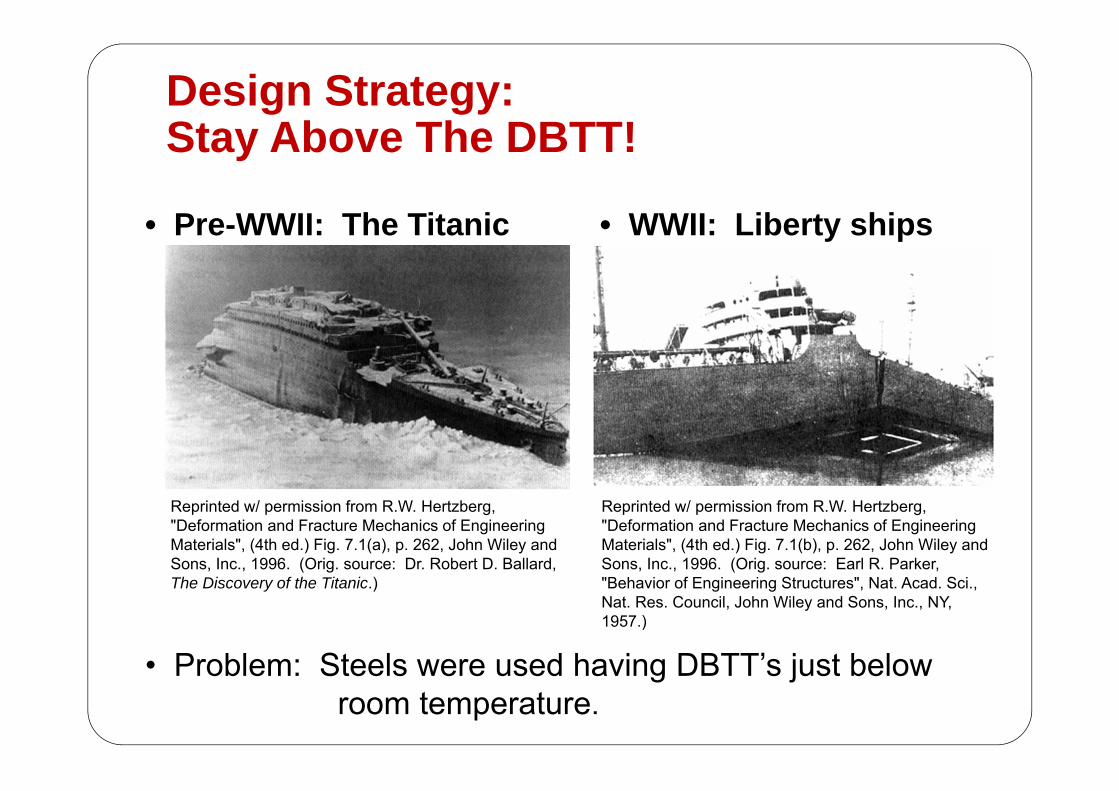
Design Strategy:Stay Above The DBTT!
• Pre-WWII: The Titanic • WWII: Liberty ships
• Problem: Steels were used having DBTT’s just below room temperature.
Reprinted w/ permission from R.W. Hertzberg, "Deformation and Fracture Mechanics of Engineering Materials", (4th ed.) Fig. 7.1(a), p. 262, John Wiley and Sons, Inc., 1996. (Orig. source: Dr. Robert D. Ballard, The Discovery of the Titanic.)
Reprinted w/ permission from R.W. Hertzberg, "Deformation and Fracture Mechanics of Engineering Materials", (4th ed.) Fig. 7.1(b), p. 262, John Wiley and Sons, Inc., 1996. (Orig. source: Earl R. Parker, "Behavior of Engineering Structures", Nat. Acad. Sci., Nat. Res. Council, John Wiley and Sons, Inc., NY, 1957.)
36
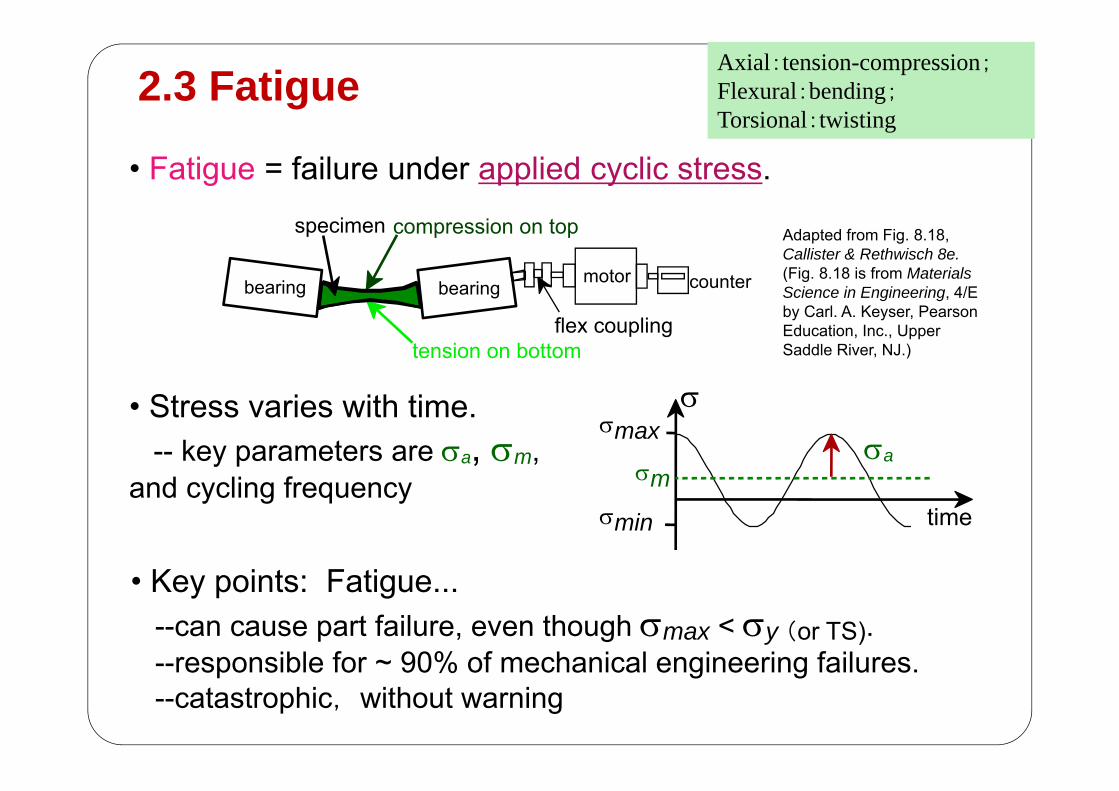
2.3 Fatigue
37
Adapted from Fig. 8.18, Callister & Rethwisch 8e. (Fig. 8.18 is from Materials Science in Engineering, 4/E by Carl. A. Keyser, Pearson Education, Inc., Upper Saddle River, NJ.)
• Fatigue = failure under applied cyclic stress.
• Stress varies with time.-- key parameters are a, m,
and cycling frequency
max
min
time
m
• Key points: Fatigue...--can cause part failure, even though max < y (or TS).--responsible for ~ 90% of mechanical engineering failures.--catastrophic, without warning
tension on bottom
compression on top
countermotor
flex coupling
specimen
bearing bearing
Axial:tension-compression;Flexural:bending;Torsional:twisting
a
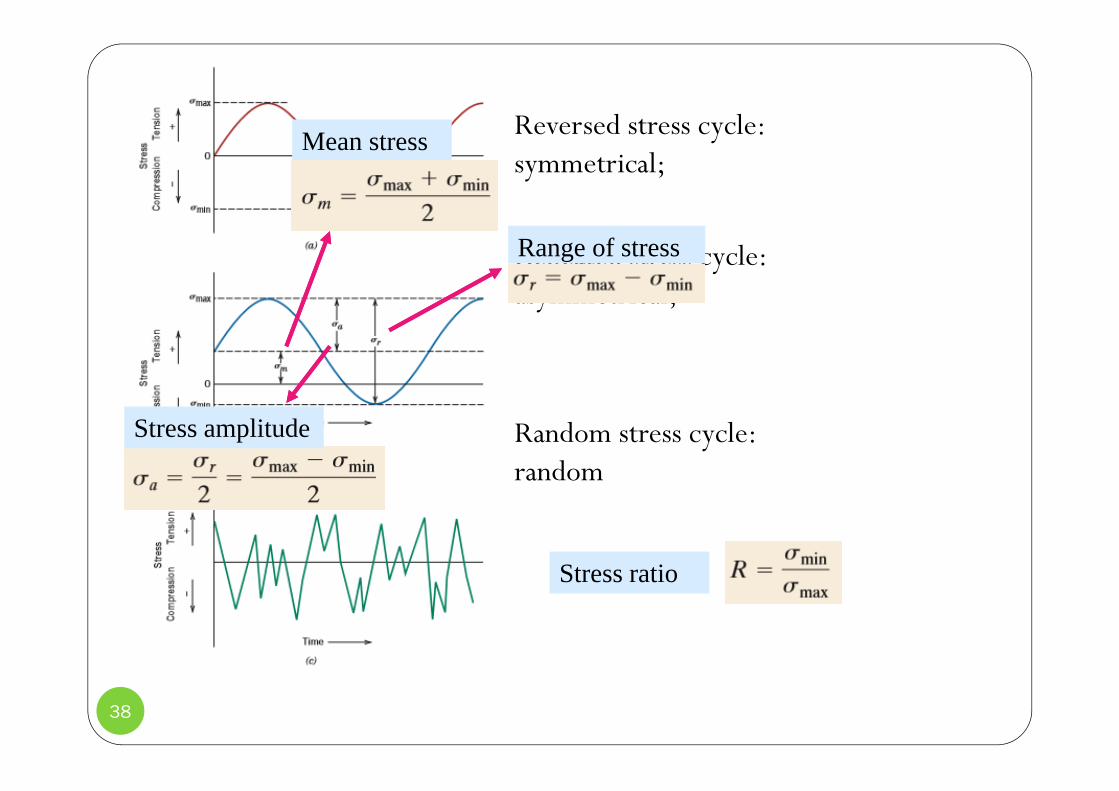
Reversed stress cycle: symmetrical;
Repeated stress cycle: asymmetrical;
Random stress cycle: random
38
Mean stress
Range of stress
Stress amplitude
Stress ratio
39
Types of Fatigue Behavior
Adapted from Fig. 8.19(a), Callister & Rethwisch 8e.
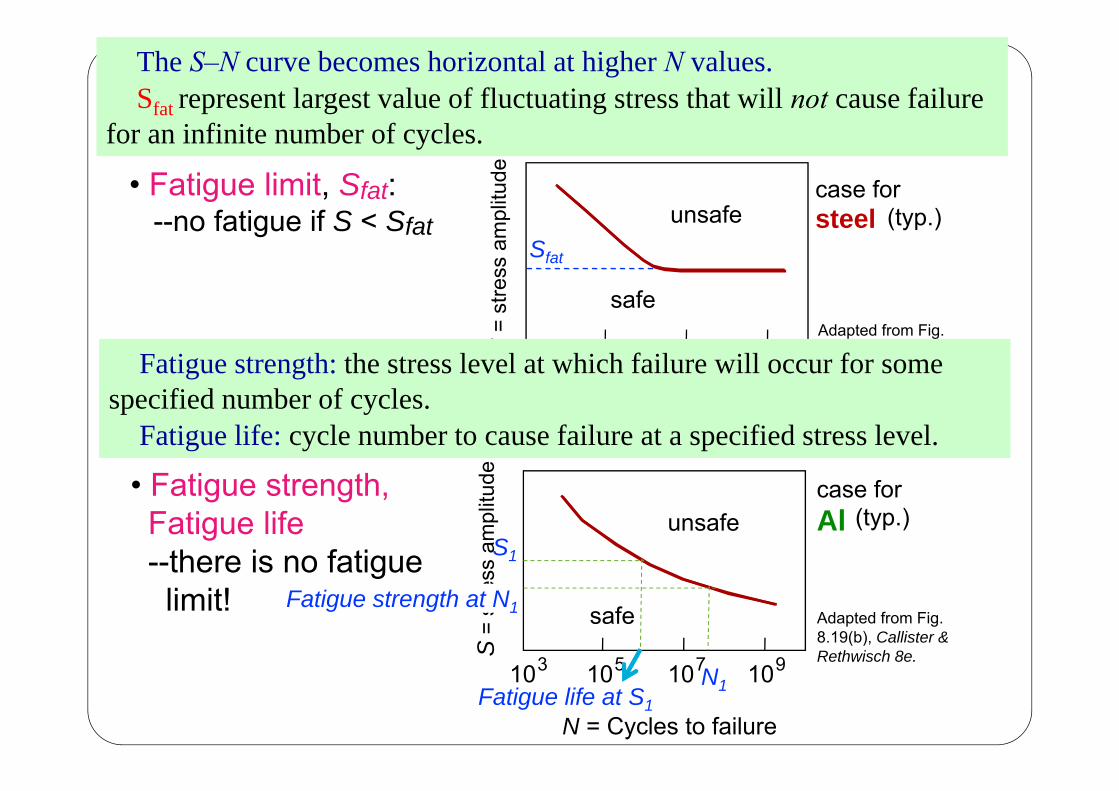
• Fatigue limit, Sfat:--no fatigue if S < Sfat
Sfat
case for steel (typ.)
N = Cycles to failure103 105 107 109
unsafe
safe
S=
stre
ss a
mpl
itude
• Fatigue strength,Fatigue life--there is no fatigue limit!
Adapted from Fig. 8.19(b), Callister & Rethwisch 8e.
case for Al (typ.)
N = Cycles to failure
103 105 107 109
unsafe
safe
S=
stre
ss a
mpl
itude
S1
Fatigue life at S1N1
Fatigue strength at N1
The S–N curve becomes horizontal at higher N values. Sfat represent largest value of fluctuating stress that will not cause failure
for an infinite number of cycles.
Fatigue strength: the stress level at which failure will occur for some specified number of cycles.
Fatigue life: cycle number to cause failure at a specified stress level.

40
Rate of Fatigue Crack Growth
• Crack grows graduallytyp. 1 to 6
a~increase in crack length per loading cycle
• Failed rotating shaft-- crack grew even though
Kmax < Kc fracture toughness-- crack grows faster as
• increases• crack gets longer• loading freq. increases.
crack origin
Adapted fromFig. 8.21, Callister & Rethwisch 8e
mKdNd
a
The process of fatigue (1) crack initiation;(2) crack propagation(3) final failure
beachmarks /clamshell mark

41
Factors affact Fatigue Life
Mean stress
mean stress fatigue life
Surface effectsFatigue life is especially sensitive to the condition and
configuration of the component surface.
Design criteria as well as various surface treatments may be the
factors that affect fatigue life.
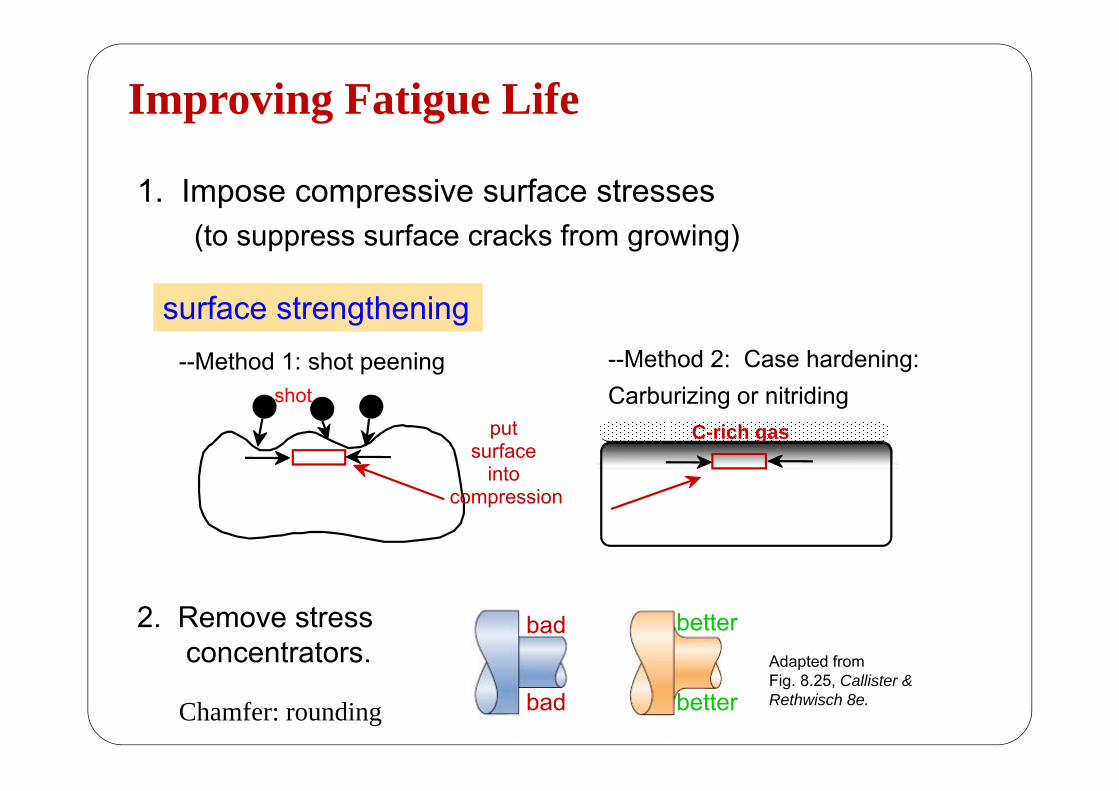
Improving Fatigue Life
42
2. Remove stressconcentrators. Adapted from
Fig. 8.25, Callister & Rethwisch 8e.
bad
bad
better
better
1. Impose compressive surface stresses(to suppress surface cracks from growing)
--Method 1: shot peening
put surface
into compression
shot
--Method 2: Case hardening:Carburizing or nitriding
C-rich gas
Chamfer: rounding
surface strengthening

2.4 Creep
43
Sample deformation at a constant stress () vs. time
Primary / transient Creep: slope (creep rate) decreases with time.
Secondary Creep: steady-state creep 稳态蠕变 i.e., constant slope /t)
Tertiary Creep: slope (creep rate) increases with time, 加速蠕变
i.e. acceleration of rate.
0 t
初始蠕变/暂态蠕变
< yield stressPlastic deformation, > yield stress
Constant-load creep of metals
44
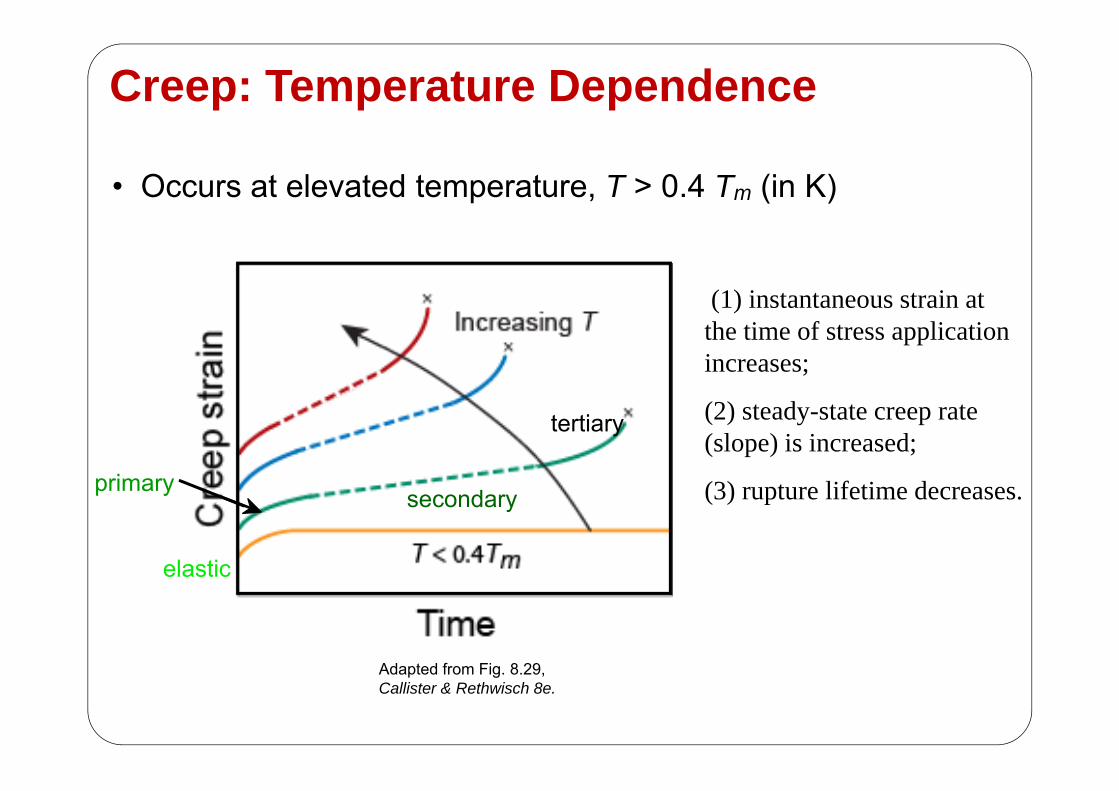
Creep: Temperature Dependence
• Occurs at elevated temperature, T > 0.4 Tm (in K)
Adapted from Fig. 8.29, Callister & Rethwisch 8e.
elastic
primarysecondary
tertiary
(1) instantaneous strain at the time of stress application increases;
(2) steady-state creep rate(slope) is increased;
(3) rupture lifetime decreases.
45
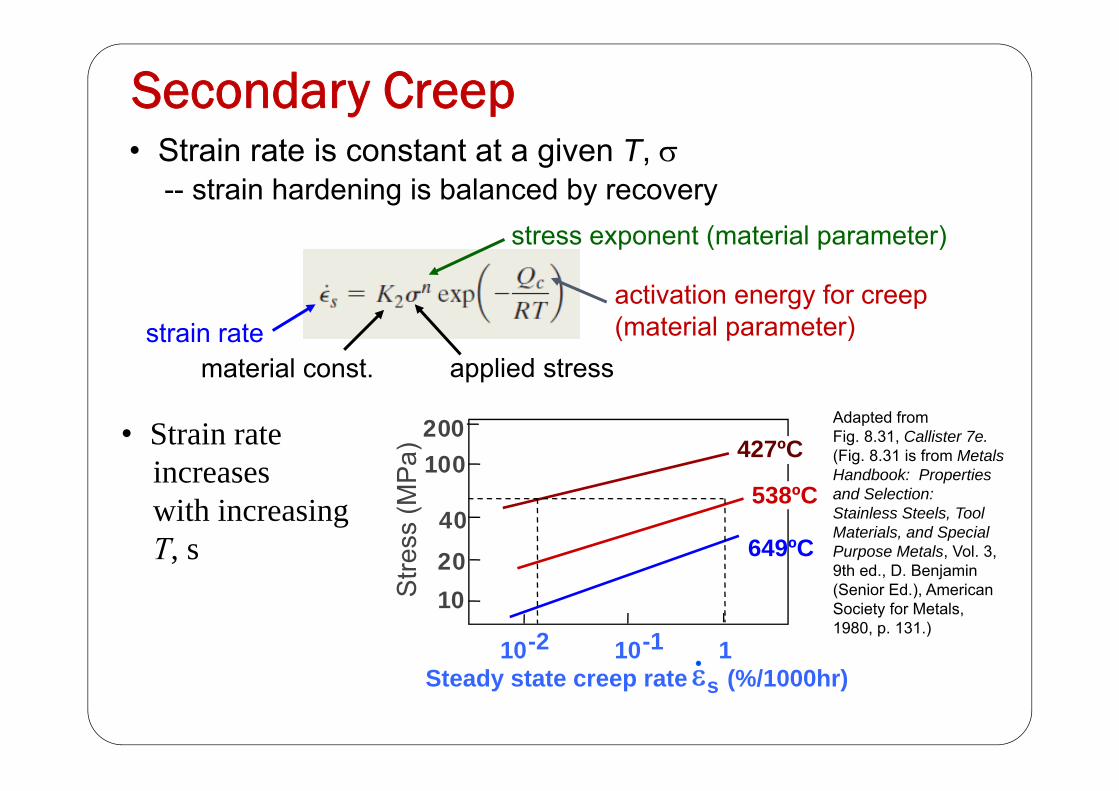
Secondary Creep• Strain rate is constant at a given T,
-- strain hardening is balanced by recoverystress exponent (material parameter)
strain rateactivation energy for creep(material parameter)
applied stressmaterial const.
• Strain rateincreaseswith increasingT, s
102040
100200
10-2 10-1 1Steady state creep rate (%/1000hr)s
Stre
ss (M
Pa) 427ºC
538ºC
649ºC
Adapted fromFig. 8.31, Callister 7e. (Fig. 8.31 is from Metals Handbook: Properties and Selection: Stainless Steels, Tool Materials, and Special Purpose Metals, Vol. 3, 9th ed., D. Benjamin (Senior Ed.), American Society for Metals, 1980, p. 131.)
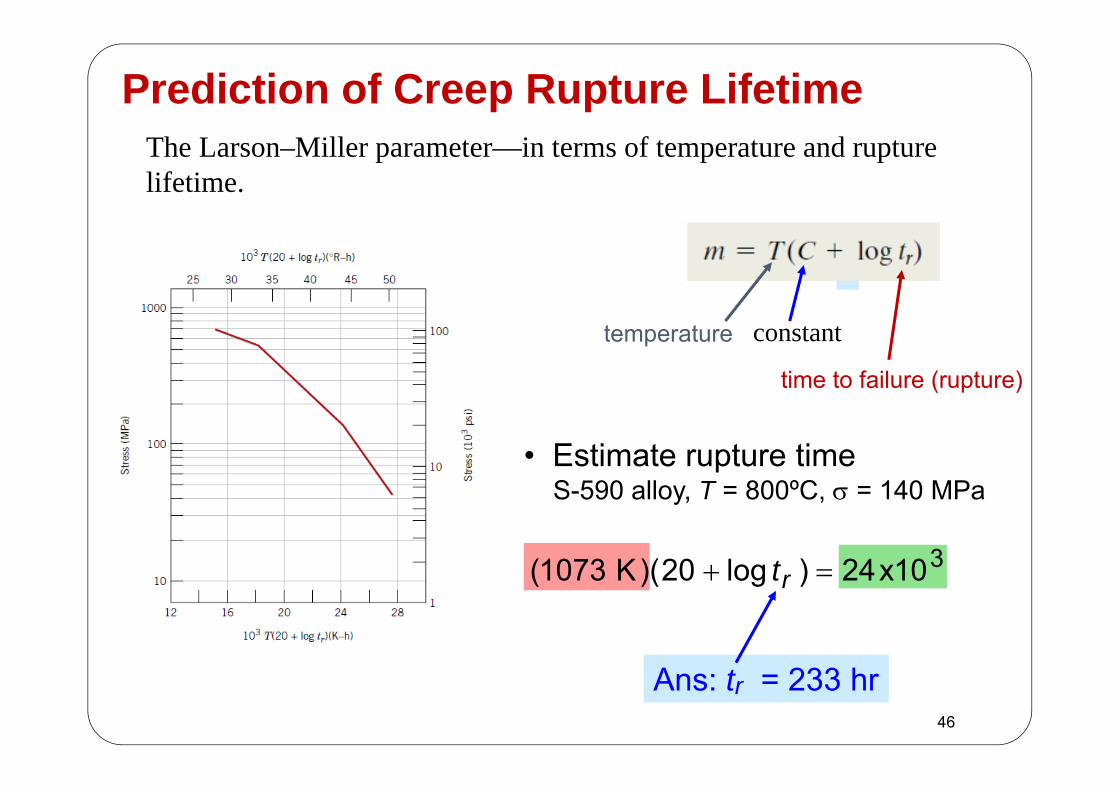
Prediction of Creep Rupture Lifetime
• Estimate rupture timeS-590 alloy, T = 800ºC, = 140 MPa
time to failure (rupture)
temperature
310x24)log20)(K 1073( rt
Ans: tr = 233 hr46
The Larson–Miller parameter—in terms of temperature and rupture lifetime.
constant
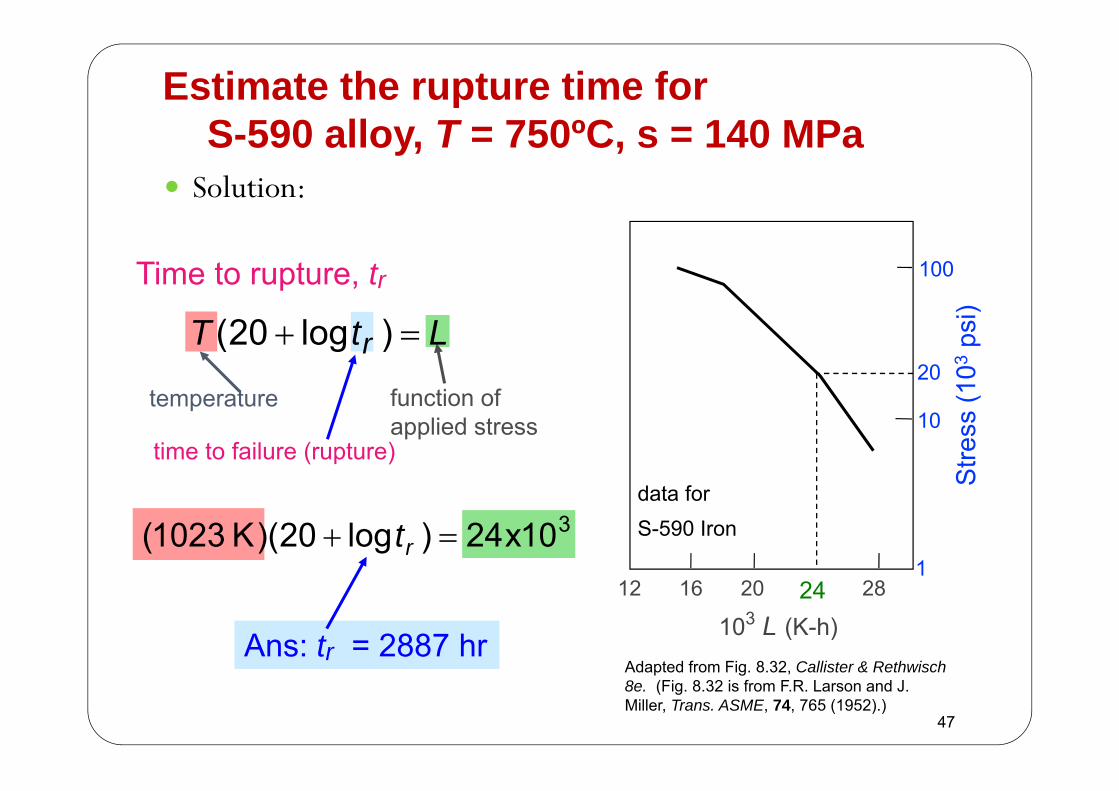
Estimate the rupture time forS-590 alloy, T = 750ºC, s = 140 MPa
Solution:
47 47
Adapted from Fig. 8.32, Callister & Rethwisch 8e. (Fig. 8.32 is from F.R. Larson and J. Miller, Trans. ASME, 74, 765 (1952).)
103 L (K-h)
Stre
ss (1
03ps
i)
100
10
112 20 24 2816
data for S-590 Iron
20
24
310x24)log20)(K 1023( rt
Ans: tr = 2887 hr
time to failure (rupture)
function ofapplied stress
temperature
LtT r )log20(
Time to rupture, tr
48
SUMMARY
• Sharp corners produce large stress concentrationsand premature failure.
• Engineering materials not as strong as predicted by theory• Flaws act as stress concentrators that cause failure at
stresses lower than theoretical values.
• Failure type depends on T and :-For simple fracture (noncyclic and T < 0.4Tm), failure stress
decreases with:- increased maximum flaw size,- decreased T,- increased rate of loading.
- For fatigue (cyclic :- cycles to fail decreases as increases.
- For creep (T > 0.4Tm):- time to rupture decreases as or T increases.
49
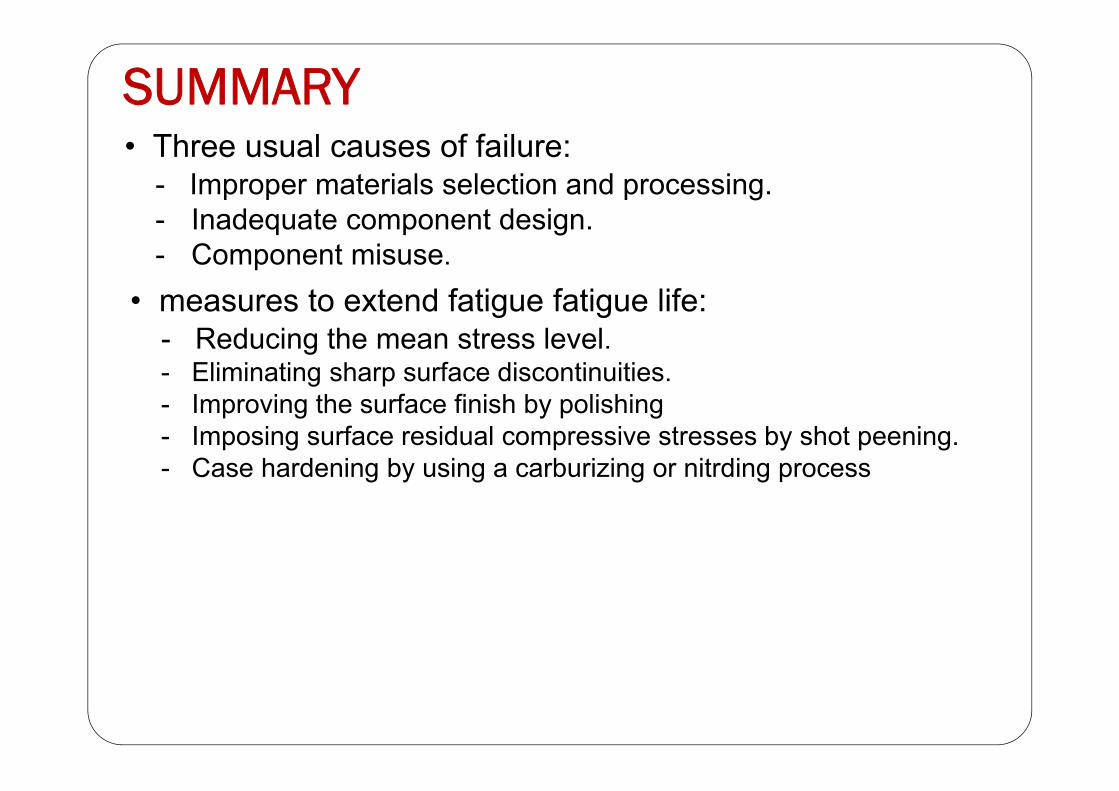
SUMMARY• Three usual causes of failure:
- Improper materials selection and processing.- Inadequate component design.- Component misuse.
• measures to extend fatigue fatigue life:- Reducing the mean stress level.- Eliminating sharp surface discontinuities.- Improving the surface finish by polishing- Imposing surface residual compressive stresses by shot peening.- Case hardening by using a carburizing or nitrding process

50
Homeworks
8.18.9

That’s all for today, thanks!

52
53
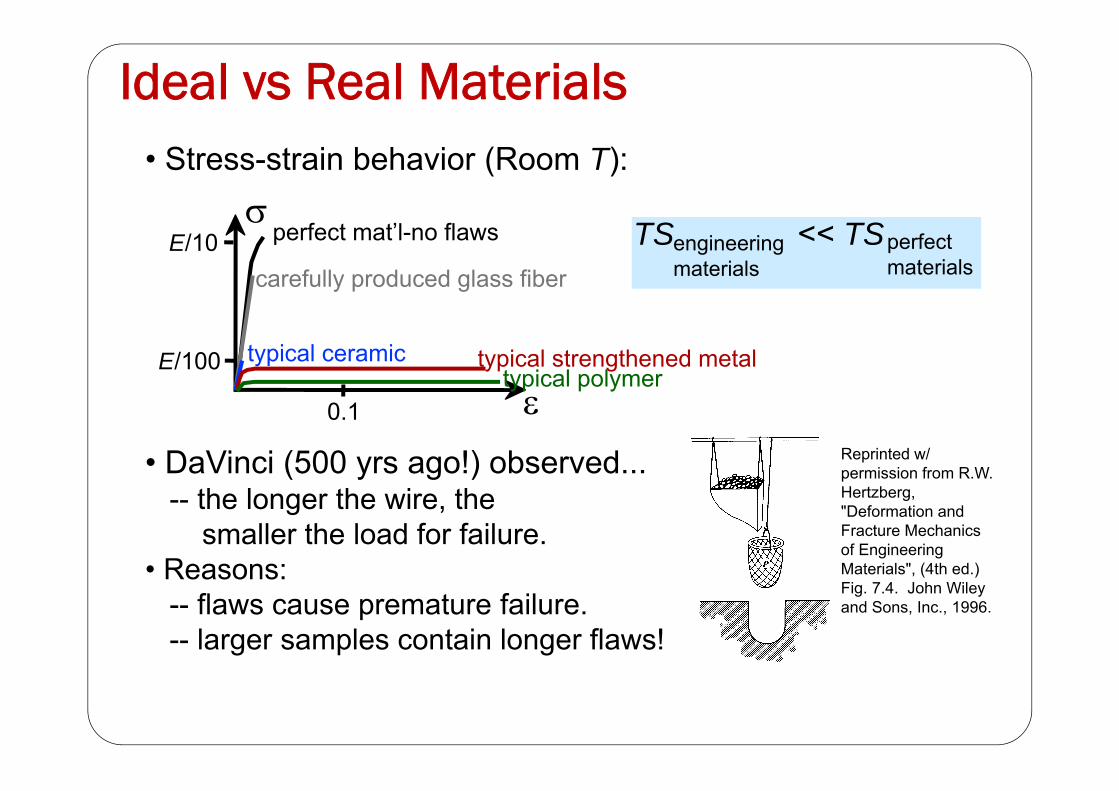
Ideal vs Real Materials• Stress-strain behavior (Room T):
TS << TSengineeringmaterials
perfectmaterials
E/10
E/100
0.1
perfect mat’l-no flaws
carefully produced glass fiber
typical ceramic typical strengthened metaltypical polymer
• DaVinci (500 yrs ago!) observed...-- the longer the wire, the
smaller the load for failure.• Reasons:
-- flaws cause premature failure.-- larger samples contain longer flaws!
Reprinted w/ permission from R.W. Hertzberg, "Deformation and Fracture Mechanics of Engineering Materials", (4th ed.) Fig. 7.4. John Wiley and Sons, Inc., 1996.
54
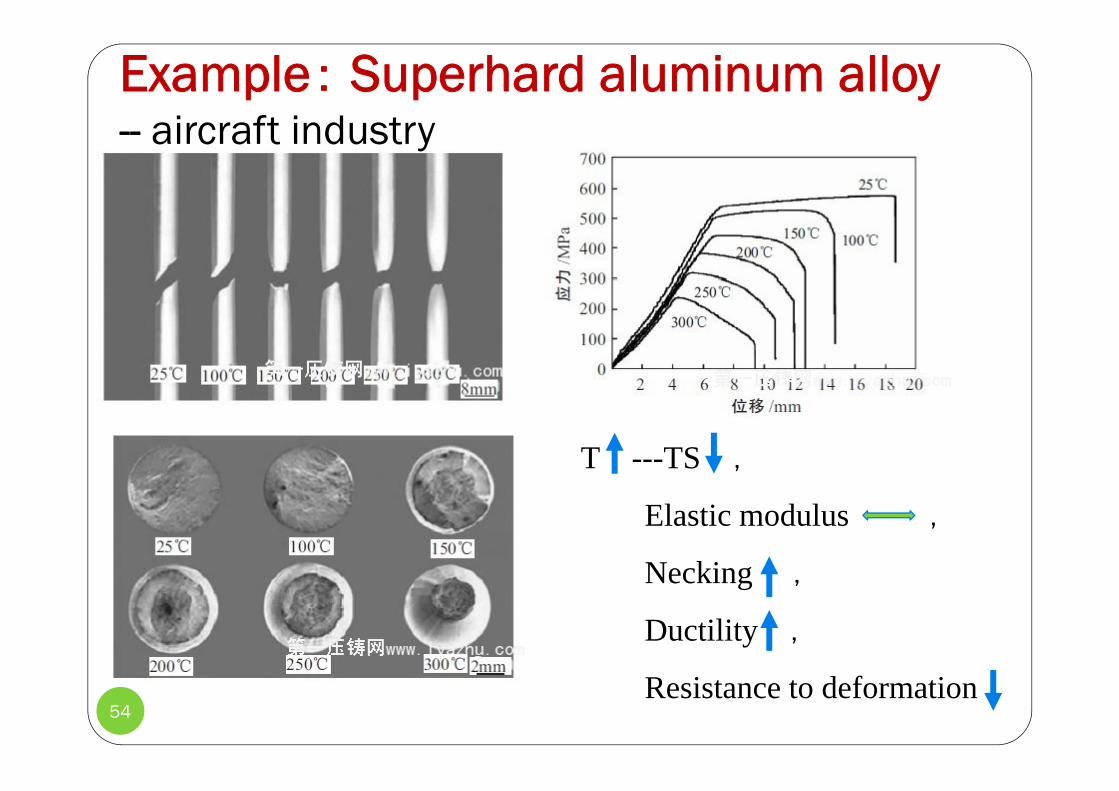
Example: Superhard aluminum alloy-- aircraft industry
T ---TS ,
Elastic modulus ,
Necking ,
Ductility ,
Resistance to deformation