2ND BIENNIAL REPORT TO THE UNITED NATIONS FRAMEWORK
73
2 nd Biennial Report to the United Nations Framework Convention on Climate Change 1 2 ND BIENNIAL REPORT TO THE UNITED NATIONS FRAMEWORK CONVENTION ON CLIMATE CHANGE Portugal Amadora 2015
Transcript of 2ND BIENNIAL REPORT TO THE UNITED NATIONS FRAMEWORK
2nd Biennial Report to the United Nations Framework Convention on Climate Change 1
2ND BIENNIAL REPORT TO THE UNITED NATIONS FRAMEWORK
CONVENTION ON CLIMATE CHANGE
Portugal
Amadora
2015

2nd Biennial Report to the United Nations Framework Convention on Climate Change 2
TECHNICAL REFERENCE:
TITLE:2ND BIENNIAL REPORT TO THE UNITED NATIONS FRAMEWORK CONVENTION
ON CLIMATE CHANGE
AUTHOR: PORTUGUESE ENVIRONMENT AGENCY CLIMATE CHANGE DEPARTMENT
EDUARDO SANTOS JOSÉ PAULINO RUI PAPUDO
EDITION: PORTUGUESE ENVIRONMENT AGENCY
DATE: DECEMBER 2015
PLACE: AMADORA
2nd Biennial Report to the United Nations Framework Convention on Climate Change 3
Contents I. Acronyms 6
II. Acknowledgements 7
III. Introduction 8
IV. Information on Greenhouse gas emissions and trends 9
A. BACKGROUND INFORMATION 9
1. The Convention, the Kyoto Protocol and National Commitments 9
B. NATIONAL INVENTORY 9
1. General Information 9
i. History of national inventories 9
ii. Global warming potentials 11
2. Institutional Arrangements for Inventory Preparation 11
i. Institutional arrangements in place 11
C. EMISSION TRENDS 13
1. Overall greenhouse gas emission trends 13
i. Emissions trends by gases 16
V. Quantified economy-wide emission reduction target 21
VI. Progress in achievement of quantified economy-wide emission reduction targets and relevant information 26
A. MITIGATION ACTIONS AND THEIR EFFECTS 26
1. Strategic Framework for Climate Policy 26
2. National Climate Change Programme 2020/2030 28
3. Overarching policies and measures: ETS and ESD 30
4. Assessment of the economic and social consequences of response measures 31
B. ESTIMATES OF EMISSION REDUCTIONS AND REMOVALS AND THE USE OF UNITS FROM THE MARKET-BASED
MECHANISMS AND LAND USE CHANGE AND FORESTRY ACTIVITIES 32
VII. Projections 33
A. GENERAL INFORMATION 33
B. PROJECTIONS METHODOLOGY 36
VIII. Provisions of financial, technological and capacity-building support to developing country Parties 38
A. FINANCE 38
1. Mitigation 40
2. Adaptation 40
1. Portuguese Carbon Fund 40
2. Private Finantial Flows 41
B. TECHNOLOGY TRANSFER 41
C. CAPACITY BUILDING 42
IX. Common Table Format 44

2nd Biennial Report to the United Nations Framework Convention on Climate Change 4
I. ACRONYMS
APA Portuguese Environment Agency
ARA Autonomous Region of the Azores
ARM Autonomous Region of Madeira
CC Climate Change
CPLP Community of Portuguese Speaking Countries
CRF Common Report Format
EMEP European Monitoring and Evaluation Programme
ENAAC National Climate Change Adaptation Strategy
EU European Union
EU ETS European Union Emissions Trading Scheme
FPC Portuguese Carbon Fund
GDP Gross Domestic Product
GHG Greenhouse Gas
HFC Hydrofluorocarbons
HW Heat Wave
INE National Statistics Institute
INERPA National Inventory of Anthropogenic Emissions by Sources and Removals by Sinks of Air Pollutants
IPCC Intergovernmental Panel on Climate Change
KP Kyoto Protocol
LULUCF Land Use, Land-Use Change and Forestry
NIR National Inventory Report
NMVOC Non-methane Volatile Organic Compound
ODA Official Development Assistance
OECD Organization for Economic Cooperation and Development
PALOP Portuguese Speaking Countries of Africa
PEC Primary Energy Consumption
PEN National Energy Plan
PNAC National Programme for Climate Change
PNDFCI National Plan for the Protection from Forest Fires
RCM Resolution of the Council of Ministers
RCP Representative Concentration Pathways
RES Renewable Energy Sources
SIRAPA Integrated System of Registration of the Portuguese Environmental Agency
SNIERPA National Inventory System of Emissions by Sources of Removals by Sinks of Air Pollutants
UNFCCC United Nations Framework Convention on Climate Changes

2nd Biennial Report to the United Nations Framework Convention on Climate Change 5
II. ACKNOWLEDGEMENTS
The Portuguese Environment Agency task force for the 2nd Biennial Report would like to express their
gratitude to Camões - Instituto da Cooperação e da Língua (Camões – Institute for Cooperation and
Language) for their collaboration in this assignment:

2nd Biennial Report to the United Nations Framework Convention on Climate Change 6
III. INTRODUCTION
This report constitute the second Biennial Report of Portugal, as required under Article 18(1) of Regulation
(EU) No 525/2013 and Decision 2/CP.17 of the Conference of the Parties under the United Nations
Framework Convention on Climate Change (UNFCCC).
2nd Biennial Report to the United Nations Framework Convention on Climate Change 7
IV. INFORMATION ON GREENHOUSE GAS EMISSIONS AND TRENDS
A. BACKGROUND INFORMATION
1. The Convention, the Kyoto Protocol and National Commitments
The UNFCCC appeared as the response of the international community to the emerging evidences of
Climate Change (CC), having as its ultimate objective the stabilization of greenhouse gas concentrations
in the atmosphere at a level that would prevent dangerous anthropogenic interference with the climate
system. and the UNFCCC was adopted and opened for signature in Rio de Janeiro in 1992 and Portugal
ratified it on 31st of May of 1994.
The Kyoto Protocol (KP), adopted in 1997, implies a deepening in the commitments inscribed in the
Convention. The KP introduced legally binding commitments for developed countries to reduce their
collective emissions of GHG by at least 5% by the period 2008-2012 (1stcommitment period of the KP),
below their 1990 level.
Portugal signed the KP on 29thof April of1998 and ratified it on 31stof May of 2002. The European Union
(EU) as a whole agreed to a -8% reduction and under the EU burden-sharing agreement, Portugal pledged
to limit its emissions during the 1stcommitment period at levels no greater than +27%comparing to the
1990 values.
The KP entered into force on the 16th of February of 2005, after Russia’s ratification in November of 2004
which fulfilled the requirement that at least 55 Parties to the Convention, including developed countries
representing 55% of the level of their emissions in 1990.
Detailed rules for the implementation of the KP were set out at the 7th Conference of the Parties1 (COP)
and are described in the Marrakech Accords adopted in 2001. At the 1st Conference of Parties serving as
the Meeting of the Parties to the Protocol2 were adopted the KP’s implementation rules agreed at the COP7.
B. NATIONAL INVENTORY
1. General Information
i. History of national inventories
Air emission inventories in Portugal were initiated in the late 80’s, early 90’s when the first estimations of
NOx, SOx and VOC emissions from combustion where made under the development of the National
Energetic Plan (PEN), and emissions from combustion and industrial processes were made under the
Organization for Economic Co-operation and Development (OECD) inventory and CORINAIR85
programme. A major breakthrough occurred during the CORINAIR90 inventory realized during 1992 and
1993 by the General-Directorate of Environment3.
This inventory exercise, aiming also to respond to the European Monitoring and Evaluation Programme
(EMEP) and OECD/IPCC, extended the range of the pollutants4 and emission sources covered, including
not only combustion activities but also:
- Storage and distribution of fossil fuels;
- Production processes;
1 Held in Marrakech (Morocco).
2 held in Canada in December of 2005.
3 Currently designated as APA.
4 SOx, NOx, NMVOC, CH4, CO, CO2, N2O and NH3.

2nd Biennial Report to the United Nations Framework Convention on Climate Change 8
- Use of solvents;
- Agriculture;
- Urban and industrial wastes and nature (forest fires and NMVOC from forest).
The information received under the Large Combustion Plant (LCP) directive was also helpful to improve
inventory quality and the individualization of Large Point Sources, as well as statistical data received from
the National Statistical Institute (INE) which allows an amplification of the activity data coverage (more
emission sources). The CORINAIR90 Default Emission Factors Handbook (2ndedition), updating the
1stedition from CORINAIR85 was used extensively in the development of the current inventory and it was
also a key point in the enhancement of the inventory.
The fulfilment of international commitments under the UNFCCC and Long-range Transboundary Air
Pollution(CLRTAP) conventions, together with the publication of the IPCC Draft Guidelines for National
Greenhouse Gas Inventories (IPPC, 1995) and the Revised 1996 IPCC Guidelines for National Greenhouse
Gas Inventories (IPCC, 1997), it generated a substantial improvement of the methodologies applied in the
inventory process, with a particularly emphasis to agriculture and waste, and that were included at first
time in the Portuguese1stNational Communication(1994).
The results attained by the CORINAIR90 (CEC,1992) and the following adjustments imposed by the IPCC
methodology are the main structure of the current inventory approach in what concerns activity data and
methodology. Under the evaluation process of the 1st Communication, the inventory was revised by an
international experts group (IEG). The 2nd, 3rd, 4thand 5thcommunications were also reviewed by IEG and
these exercises had an important role in the problem’s revealing and contribute to overall improvement.
Since its first compilation, the Portuguese Inventory has been continuously revised due to the use of the
following progress measures:
Appeal for more advanced methodologies;
Better access to core data which allows the development of comprehensiveness of the inventory;
Better database storage, calculation process and procedures.
All the methodological changes, the source coverage or scope of the data were reflected in the estimation
of the emissions for the different years considered (1990-2011), i.e., the inventory is internally consistent.
Greenhouse gas emissions inventories
Parties to the Convention (Article 4(1)(a)) “shall develop, periodically update, publish and make available
to the COP, …., national inventories of anthropogenic emissions by sources and removals by sinks of all
GHG not controlled by the Montreal Protocol, using comparable methodologies”.
Portugal, as a Party to the Convention, is required to produce and regularly update National GHG
Inventories. Furthermore Parties shall submit a National Inventory Report (NIR) containing detailed and
complete information on their inventories, in order to ensure the transparency of the inventory.
The inventory covers the six gaseous air pollutants included in Annex A5 to the KP, as well as estimates
for indirect GHGs (CO, NOx and NMVOC) and data regarding SOx. Emissions are estimated for each civil
year from 1990 to 2013.
As a general rule, the inventory covers emissions occurring in the whole Portuguese territory (mainland
and the Madeira and Azores Archipelagos6). The emissions from air traffic and navigation generated in the
Portuguese Territory include the movements between mainland and islands, information included in the
total of national emissions.
With regard to the economic sectors covered, the inventory considers the following:
5 CO2, CH4, N2O, HFC, PFCs, SF6 and NF3.
6 This two archipelagos of the Portuguese Territory are Autonomous Regions.

2nd Biennial Report to the United Nations Framework Convention on Climate Change 9
- Energy production and transformation; - Transportation (road, rail, maritime and air);
- Combustion in industry; - Industrial production and use of solvents;
- Domestic; - Waste production, disposition and treatment7;
- Agriculture; - Animal husbandry emissions;
- Fisheries; - Emissions and removals from forestry and land use change.
- Institutional and commerce sectors;
ii. Global warming potentials
The former GWP considered in the IPCC Second Assessment Report8(SAR)have been replaced by the values
proposed by the IPCC Fourth Assessment Report9(AR4), as required by the revised UNFCCC reporting
guidelines.
2. Institutional Arrangements for Inventory Preparation
i. Institutional arrangements in place
In order to comply with the commitments at the international and EU levels, a National Inventory System
of Emissions by Sources and Removals by Sinks of Air Pollutants (SNIERPA) was created. This system
contains a set of legal, institutional and procedural arrangements that aim at ensuring the accurate
estimation of emissions by sources and removals by sinks of air pollutants, as well as the communication
and archiving of all relevant information.
The main purpose of the SNIERPA is to prepare and ensure the transparency, consistency, comparability,
completeness, accuracy and timeliness of the inventory of air pollutants, in accordance with the directives
defined at international and EU levels, in order to make easier and more cost-effective the tasks of
inventory planning, implementation and management,
This system was first established in 2005 through a Council of Ministers Resolution10, which defined the
entities relevant for its implementation based on the principle of institutional cooperation. This clear
allocation of responsibilities is essential to ensure the inventory takes place within the defined deadlines.
A new legal national arrangement has been adopted in 201511 in order to take into account the recent
developments at international level relating to the UNFCCC and the KP, and the new monitoring and
reporting requirements provided at the EU level by Regulation (EU) 525/2013 of the European Parliament
and of the Council of 21 May 2013, on a mechanism for monitoring and reporting greenhouse gas emissions
and for reporting other information at national and Union level relevant to Climate Change and repealing
Decision N.º 280/2004/EC, and the Commission Implementing Regulation (EU) 749/2014 of 30 June 2014
on structure, format, submission processes and review of information reported by Member States pursuant
to Regulation (EU) N.º 525/2013 of the European Parliament and of the Council, and the requirements
under the CLRTAP and the NECD.
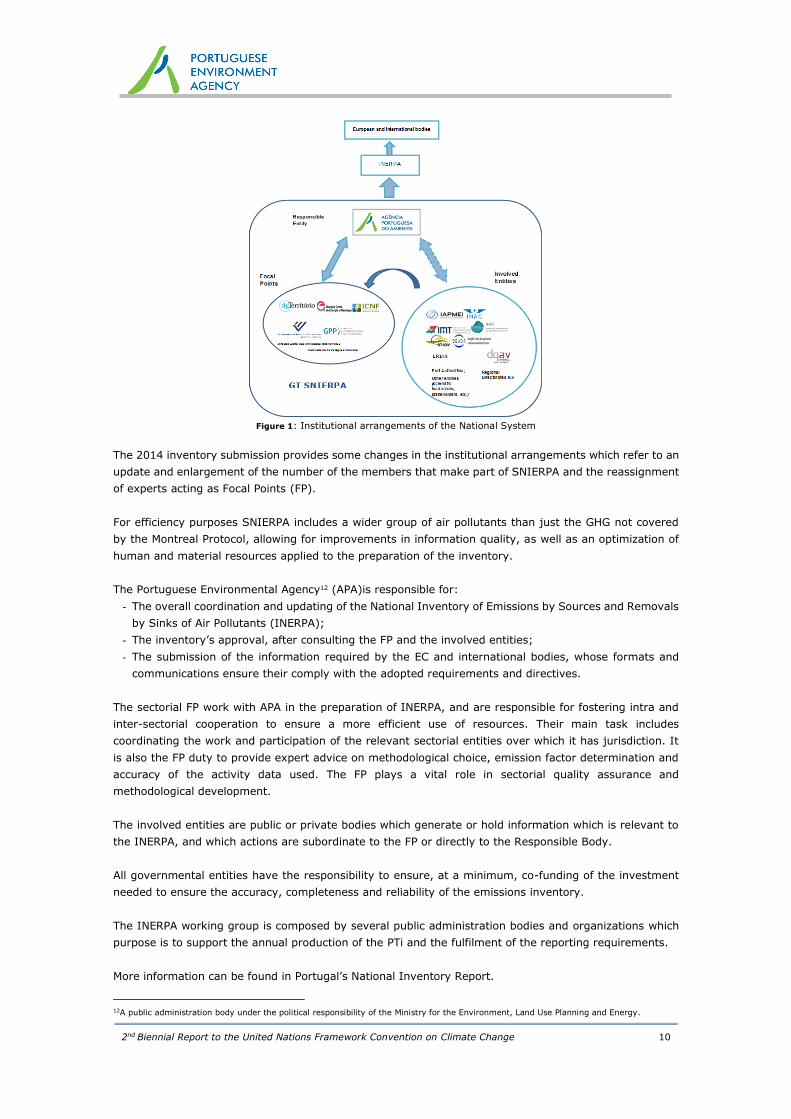
Figure 1 presents the institutional framework and the main entities that compose the national system.
7 Urban, industrial and hospitals solid wastes, and domestic and industrial waste water.
8 IPCC, 1996.
9 IPCC, 2007.
10 RCM n.º 68/2005 of 17th of March.
11 RCM n.º 20/2015 of 14th of April.
2nd Biennial Report to the United Nations Framework Convention on Climate Change 10
Figure 1: Institutional arrangements of the National System
The 2014 inventory submission provides some changes in the institutional arrangements which refer to an
update and enlargement of the number of the members that make part of SNIERPA and the reassignment
of experts acting as Focal Points (FP).
For efficiency purposes SNIERPA includes a wider group of air pollutants than just the GHG not covered
by the Montreal Protocol, allowing for improvements in information quality, as well as an optimization of
human and material resources applied to the preparation of the inventory.
The Portuguese Environmental Agency12 (APA)is responsible for:
- The overall coordination and updating of the National Inventory of Emissions by Sources and Removals
by Sinks of Air Pollutants (INERPA);
- The inventory’s approval, after consulting the FP and the involved entities;
- The submission of the information required by the EC and international bodies, whose formats and
communications ensure their comply with the adopted requirements and directives.
The sectorial FP work with APA in the preparation of INERPA, and are responsible for fostering intra and
inter-sectorial cooperation to ensure a more efficient use of resources. Their main task includes
coordinating the work and participation of the relevant sectorial entities over which it has jurisdiction. It
is also the FP duty to provide expert advice on methodological choice, emission factor determination and
accuracy of the activity data used. The FP plays a vital role in sectorial quality assurance and
methodological development.
The involved entities are public or private bodies which generate or hold information which is relevant to
the INERPA, and which actions are subordinate to the FP or directly to the Responsible Body.
All governmental entities have the responsibility to ensure, at a minimum, co-funding of the investment
needed to ensure the accuracy, completeness and reliability of the emissions inventory.
The INERPA working group is composed by several public administration bodies and organizations which
purpose is to support the annual production of the PTi and the fulfilment of the reporting requirements.
More information can be found in Portugal’s National Inventory Report.
12A public administration body under the political responsibility of the Ministry for the Environment, Land Use Planning and Energy.
2nd Biennial Report to the United Nations Framework Convention on Climate Change 11
C. EMISSION TRENDS
1. Overall greenhouse gas emission trends
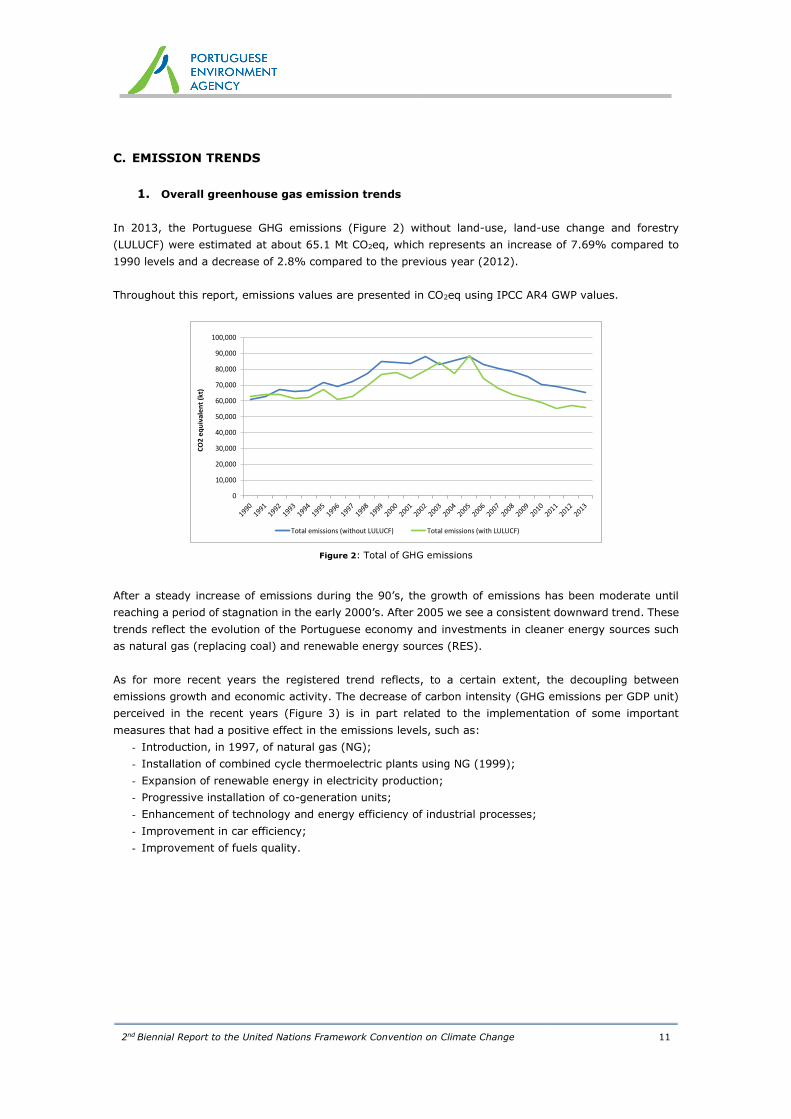
In 2013, the Portuguese GHG emissions (Figure 2) without land-use, land-use change and forestry
(LULUCF) were estimated at about 65.1 Mt CO2eq, which represents an increase of 7.69% compared to
1990 levels and a decrease of 2.8% compared to the previous year (2012).
Throughout this report, emissions values are presented in CO2eq using IPCC AR4 GWP values.
Figure 2: Total of GHG emissions
After a steady increase of emissions during the 90’s, the growth of emissions has been moderate until
reaching a period of stagnation in the early 2000’s. After 2005 we see a consistent downward trend. These
trends reflect the evolution of the Portuguese economy and investments in cleaner energy sources such
as natural gas (replacing coal) and renewable energy sources (RES).
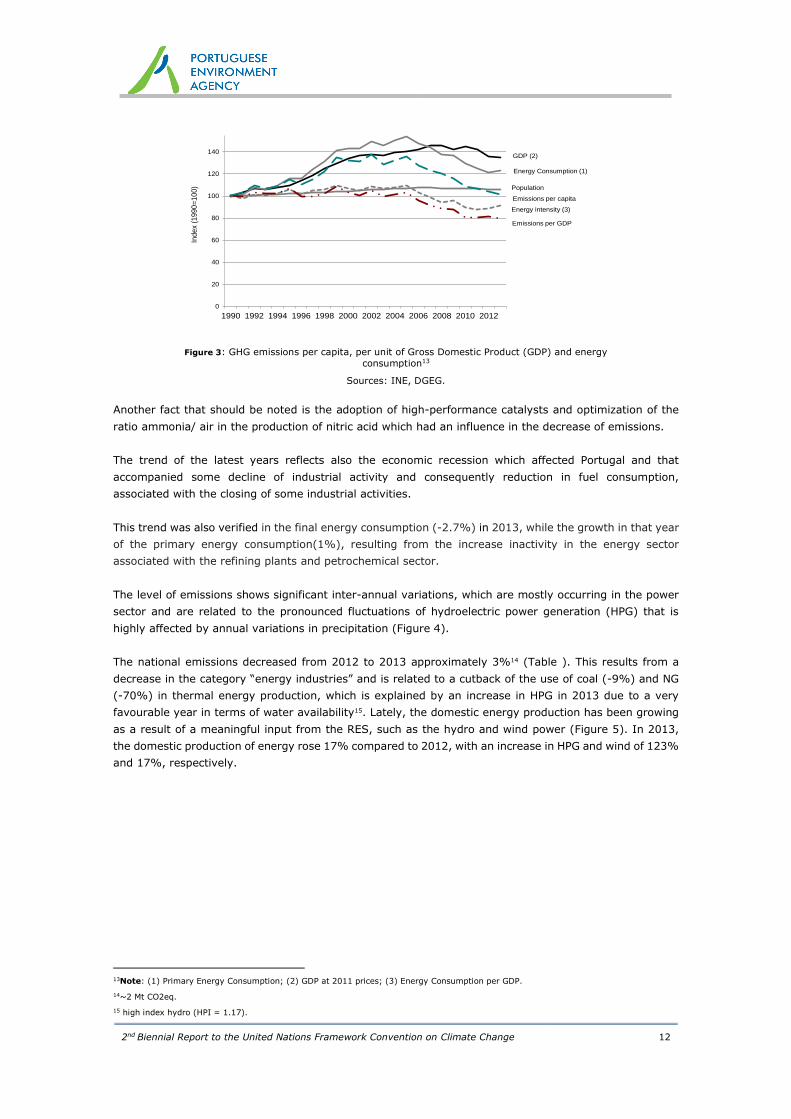
As for more recent years the registered trend reflects, to a certain extent, the decoupling between
emissions growth and economic activity. The decrease of carbon intensity (GHG emissions per GDP unit)
perceived in the recent years (Figure 3) is in part related to the implementation of some important
measures that had a positive effect in the emissions levels, such as:
- Introduction, in 1997, of natural gas (NG);
- Installation of combined cycle thermoelectric plants using NG (1999);
- Expansion of renewable energy in electricity production;
- Progressive installation of co-generation units;
- Enhancement of technology and energy efficiency of industrial processes;
- Improvement in car efficiency;
- Improvement of fuels quality.
0
10,000
20,000
30,000
40,000
50,000
60,000
70,000
80,000
90,000
100,000
CO
2 e
qu
iva
len
t (k
t)
Total emissions (without LULUCF) Total emissions (with LULUCF)
2nd Biennial Report to the United Nations Framework Convention on Climate Change 12
Figure 3: GHG emissions per capita, per unit of Gross Domestic Product (GDP) and energy
consumption13
Sources: INE, DGEG.
Another fact that should be noted is the adoption of high-performance catalysts and optimization of the
ratio ammonia/ air in the production of nitric acid which had an influence in the decrease of emissions.
The trend of the latest years reflects also the economic recession which affected Portugal and that
accompanied some decline of industrial activity and consequently reduction in fuel consumption,
associated with the closing of some industrial activities.
This trend was also verified in the final energy consumption (-2.7%) in 2013, while the growth in that year
of the primary energy consumption(1%), resulting from the increase inactivity in the energy sector
associated with the refining plants and petrochemical sector.
The level of emissions shows significant inter-annual variations, which are mostly occurring in the power
sector and are related to the pronounced fluctuations of hydroelectric power generation (HPG) that is
highly affected by annual variations in precipitation (Figure 4).
The national emissions decreased from 2012 to 2013 approximately 3%14 (Table ). This results from a
decrease in the category “energy industries” and is related to a cutback of the use of coal (-9%) and NG
(-70%) in thermal energy production, which is explained by an increase in HPG in 2013 due to a very
favourable year in terms of water availability15. Lately, the domestic energy production has been growing
as a result of a meaningful input from the RES, such as the hydro and wind power (Figure 5). In 2013,
the domestic production of energy rose 17% compared to 2012, with an increase in HPG and wind of 123%
and 17%, respectively.
13Note: (1) Primary Energy Consumption; (2) GDP at 2011 prices; (3) Energy Consumption per GDP.
14~2 Mt CO2eq.
15 high index hydro (HPI = 1.17).
0
20
40
60
80
100
120
140
1990 1992 1994 1996 1998 2000 2002 2004 2006 2008 2010 2012
Ind
ex
(19
90
=1
00
)
Energy intensity (3)
Energy Consumption (1)
GDP (2)
Emissions per capita
Emissions per GDP
Population

2nd Biennial Report to the United Nations Framework Convention on Climate Change 13
Figure 4: Hydraulic index16
Source: EDP, REN
Figure 5: Gross electric power production and emissions from electricity and heat
generation
Source: DGGE
An analysis of the different energy sources consumption (Figure 6) shows that in 2013 Oil remains as the
main primary energy supply (44%), followed by RES (25%) and NG (17%). Nevertheless the weight of
Oil has declined in the latest years (58% in 2004 vs. 45% in 2013), whereas the importance of RES (14%
in 2004 vs. 24% in 2013) and NG (14% in 2004 vs. 17% in 2013) increased considerably.
Figure 6:Primary energy consumption by energy source Source: DGGE
16Note: HI = 1 corresponds to the average hydrologic availability.
Coal13%
Oil58%
Natural Gas13%
Renewables14%
Other2%
2004
Coal12%
Oil45%
Natural Gas17%
Renewables24%
Other2%
2013
2nd Biennial Report to the United Nations Framework Convention on Climate Change 14
i. Emissions trends by gases
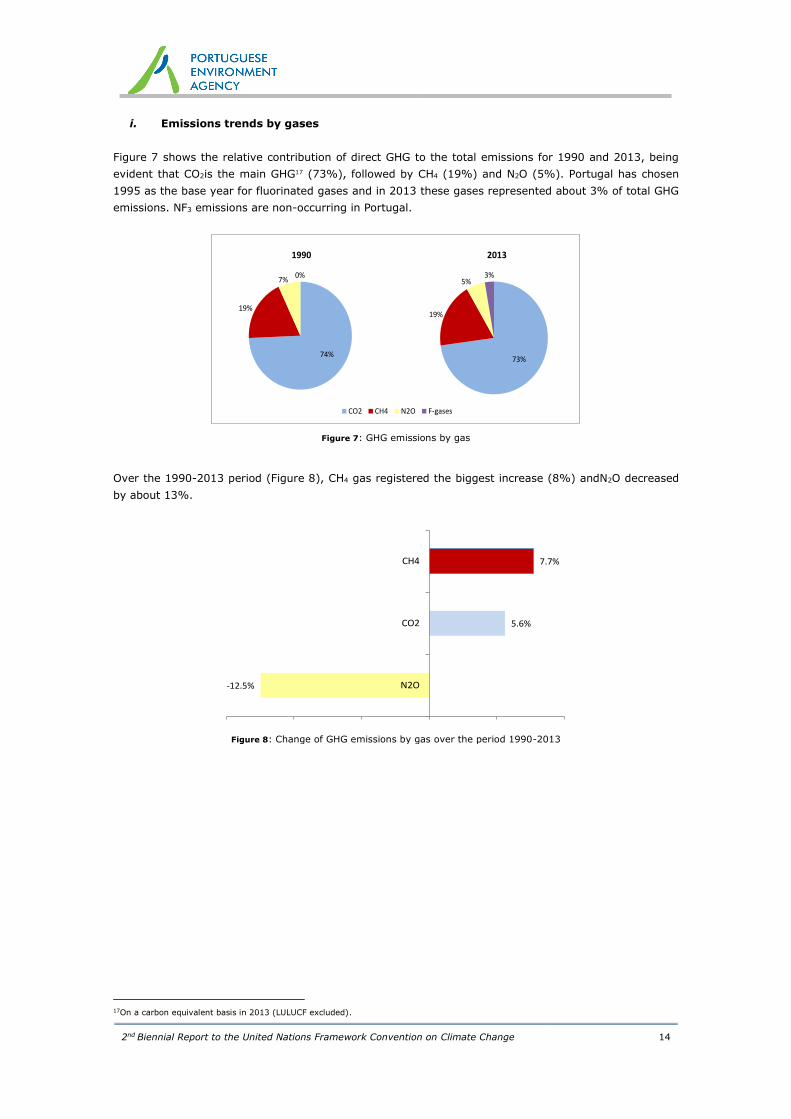
Figure 7 shows the relative contribution of direct GHG to the total emissions for 1990 and 2013, being
evident that CO2is the main GHG17 (73%), followed by CH4 (19%) and N2O (5%). Portugal has chosen
1995 as the base year for fluorinated gases and in 2013 these gases represented about 3% of total GHG
emissions. NF3 emissions are non-occurring in Portugal.
Figure 7: GHG emissions by gas
Over the 1990-2013 period (Figure 8), CH4 gas registered the biggest increase (8%) andN2O decreased
by about 13%.
Figure 8: Change of GHG emissions by gas over the period 1990-2013
17On a carbon equivalent basis in 2013 (LULUCF excluded).
73%
19%
5%3%
CO2 CH4 N2O F-gases
74%
19%
7%0%
1990 2013
-12.5%
5.6%
7.7%
N2O
CO2
CH4

2nd Biennial Report to the United Nations Framework Convention on Climate Change 15
Table I: GHG emissions and removals in Portugal
GHG’s Emissions 1990 1991 1992 1993 1994 1995 1996 1997 1998 1999 2000 2001
CO2 equivalent (Gg)
CO2 emissions without net CO2 from LULUCF 44,896.42 46,537.77 50,767.20 49,432.14 50,090.68 54,105.06 51,478.46 54,317.10 58,833.38 66,530.60 65,355.02 65,061.56
CO2 emissions with net CO2 from LULUCF 45,933.37 47,527.30 47,153.11 44,687.68 44,614.51 48,846.96 42,510.92 44,443.63 51,113.57 57,772.06 58,741.25 55,092.08
CO2 emissions without net CH4 from LULUCF 11,339.18 11,594.39 11,784.81 11,812.75 12,248.47 12,602.33 12,567.44 12,763.17 13,210.37 13,425.70 13,290.73 13,561.55
CO2 emissions with net CO2 from LULUCF 11,544.25 11,870.86 11,872.89 11,888.00 12,368.75 12,858.73 12,664.45 12,802.35 13,415.42 13,532.32 13,475.69 13,672.42
CO2 emissions without net N2O from LULUCF 4,190.03 4,160.87 4,141.59 4,127.97 4,179.03 4,369.04 4,597.95 4,602.55 4,581.71 4,673.11 4,649.02 4,486.76
CO2 emissions with net N2O from LULUCF 4,730.84 4,694.47 4,625.41 4,590.78 4,637.08 4,846.46 5,046.31 5,038.50 5,041.91 5,113.22 5,098.03 4,919.67
HFCs IE, NE, NO IE, NE, NO IE, NE, NO IE, NE, NO IE, NE, NO 30.65 48.91 71.47 100.63 185.93 288.45 374.38
PFCs NE, NO NE, NO NE, NO NE, NO NE, NO NE, NO NE, NO NE, NO NE, NO NE, NO NE, NO NE, NO
Unspecified mix HFCs and PFCs NE, NO NE, NO NE, NO NE, NO NE, NO NE, NO NE, NO NE, NO NE, NO NE, NO NE, NO NE, NO
SF6 NE, NO NE, NO NE, NO NE, NO NE, NO 14.62 15.12 16.87 17.38 18.39 18.43 20.29
NF3 NO NO NO NO NO NO NO NO NO NO NO NO
Total (without LULUCF) 60,425.62 62,292.03 66,693.60 65,372.87 66,518.18 71,121.70 68,707.88 71,771.17 76,743.46 84,833.72 83,601.66 83,504.54
Total (with LULUCF) 62,208.46 64,092.63 63,651.41 61,166.46 61,620.34 66,597.41 60,285.71 62,372.83 69,688.91 76,621.92 77,621.85 74,078.86
Total (without LULUCF, with indirect) 60,723.71 62,587.02 66,991.11 65,661.94 66,816.73 71,415.50 69,012.93 72,089.90 77,063.15 85,159.22 83,931.81 83,801.47
Total (with LULUCF, with indirect) 62,506.55 64,387.62 63,948.92 61,455.53 61,918.89 66,891.21 60,590.76 62,691.55 70,008.60 76,947.42 77,952.00 74,375.78
GHG’s Emissions 2002 2003 2004 2005 2006 2007 2008 2009 2010 2011 2012 2013 % Change
1990-2013 CO2 equivalent (Gg)
CO2 emissions without net CO2 from LULUCF 68,805.94 63,647.02 66,291.22 68,816.33 64,250.55 61,565.95 59,486.09 56,724.15 52,204.49 50,918.55 49,146.43 47.408.47 5.60
CO2 emissions with net CO2 from LULUCF 59,254.32 63,980.73 57,625.09 68,123.89 54,645.75 48,472.39 44,988.89 42,340.50 40,297.89 36,819.54 38,448.79 37,499.68 -18.36
CO2 emissions without net CH4 from LULUCF 13,811.33 14,021.90 13,991.63 13,997.14 13,517.76 13,342.75 13,129.70 13,077.00 12,770.64 12,823.40 12,476.64 12,212.58 7.70
CO2 emissions with net CO2 from LULUCF 13,983.21 14,739.22 14,130.31 14,555.01 13,620.54 13,384.39 13,150.86 13,134.07 12,922.34 12,884.25 12,650.92 12,366.12 7.12
CO2 emissions without net N2O from LULUCF 4,532.16 4,195.88 4,356.67 4,207.85 4,066.67 4,255.27 4,133.69 3,803.64 3,803.55 3,541.60 3,542.77 3,667.32 -12.47
CO2 emissions with net N2O from LULUCF 4,971.13 4,720.31 4,782.33 4,690.06 4,462.14 4,619.93 4,474.20 4,150.85 4,167.08 3,890.86 3,911.24 4,033.01 -14.75
HFCs 484.32 618.25 733.36 841.36 954.98 1,105.22 1,266.58 1,380.44 1,508.23 1,612.00 1,737.40 1,727.82 -
PFCs NE, NO NE, NO NE, NO 0.00 0.13 0.01 0.01 0.01 0.01 0.01 0.01 0.01 -
Unspecified mix HFCs and PFCs NE, NO NE, NO NE, NO NE, NO NE, NO NE, NO NE, NO NE, NO NE, NO NE, NO NE, NO NE, NO -
SF6 19.84 26.18 35.21 35.50 37.09 45.75 44.52 49.57 52.08 48.58 52.68 55.25 -
NF3 NO NO NO NO NO NO NO NO NO NO NO NO -
Total (without LULUCF) 87,653.59 82,509.23 85,408.08 87,898.18 82,827.19 80,314.94 78,060.58 75,034.82 70,338.99 68,944.15 66,955.92 65,071.46 7.69
Total (with LULUCF) 78,712.82 84,084.69 77,306.30 88,245.81 73,720.64 67,627.68 63,925.06 61,055.44 58,947.63 55,255.25 56,801.04 55,681.89 -10.49
Total (without LULUCF, with indirect) 87,936.94 82,785.94 85,683.65 88,167.23 83,097.00 80,588.05 78,323.51 75,275.70 70,588.68 69,182.53 67,188.85 65,307.62 7.55
Total (with LULUCF, with indirect) 78,996.18 84,361.41 77,581.86 88,514.87 73,990.45 67,900.80 64,187.99 61,296.33 59,197.31 55,493.63 57,033.97 55,918.05 -10.54
NA- Not applicable; NE – Not estimated; NO – Not occurring.
2nd Biennial Report to the United Nations Framework Convention on Climate Change 16
ii. Emissions trends by main sources and sinks categories
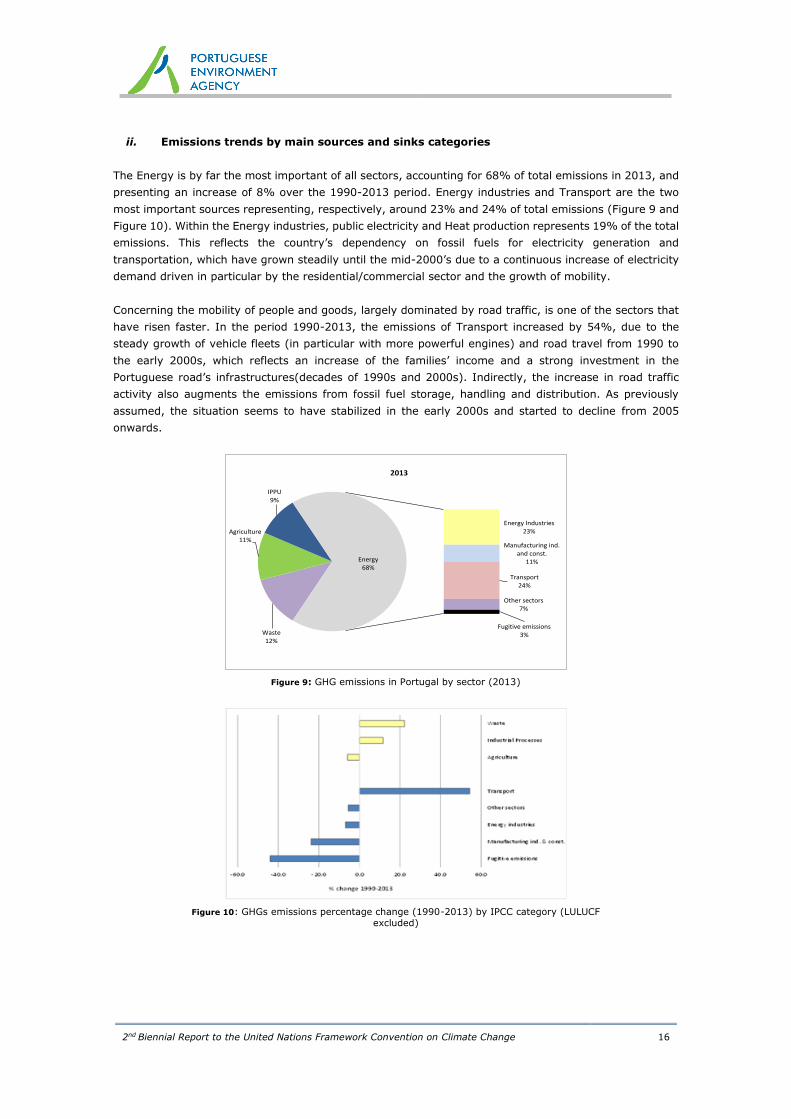
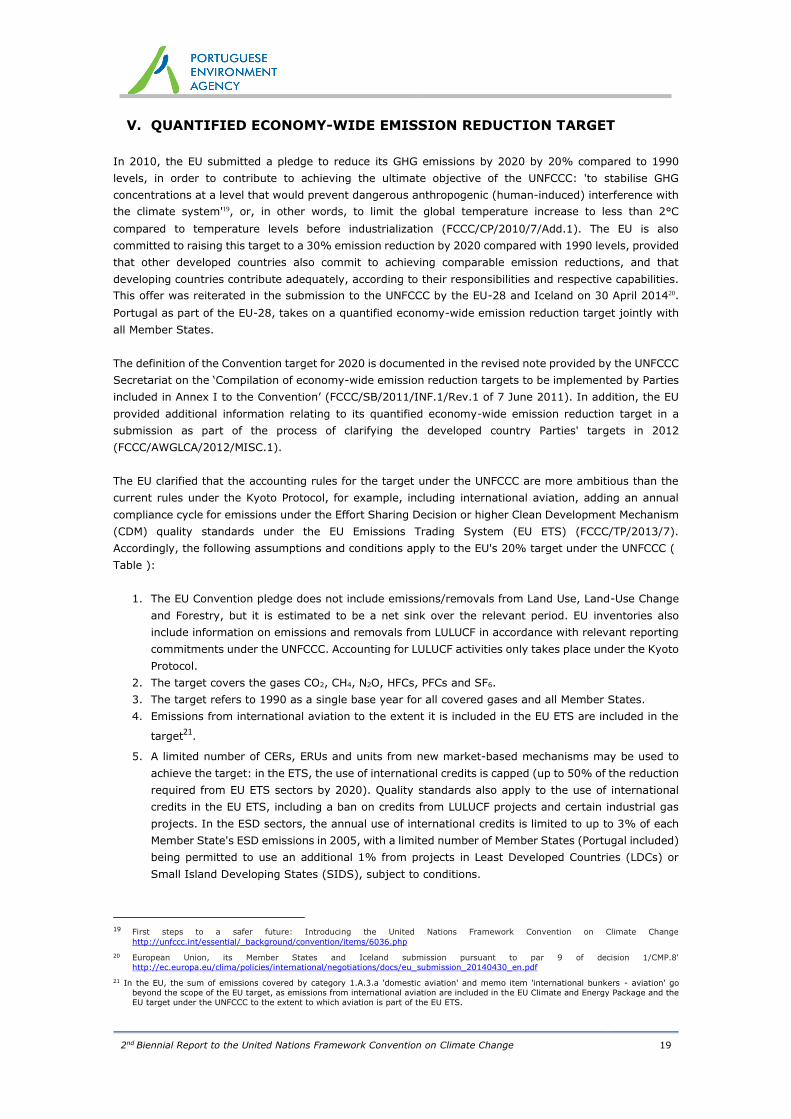
The Energy is by far the most important of all sectors, accounting for 68% of total emissions in 2013, and
presenting an increase of 8% over the 1990-2013 period. Energy industries and Transport are the two
most important sources representing, respectively, around 23% and 24% of total emissions (Figure 9 and
Figure 10). Within the Energy industries, public electricity and Heat production represents 19% of the total
emissions. This reflects the country’s dependency on fossil fuels for electricity generation and
transportation, which have grown steadily until the mid-2000’s due to a continuous increase of electricity
demand driven in particular by the residential/commercial sector and the growth of mobility.
Concerning the mobility of people and goods, largely dominated by road traffic, is one of the sectors that
have risen faster. In the period 1990-2013, the emissions of Transport increased by 54%, due to the
steady growth of vehicle fleets (in particular with more powerful engines) and road travel from 1990 to
the early 2000s, which reflects an increase of the families’ income and a strong investment in the
Portuguese road’s infrastructures(decades of 1990s and 2000s). Indirectly, the increase in road traffic
activity also augments the emissions from fossil fuel storage, handling and distribution. As previously
assumed, the situation seems to have stabilized in the early 2000s and started to decline from 2005
onwards.
Figure 9: GHG emissions in Portugal by sector (2013)
Figure 10: GHGs emissions percentage change (1990-2013) by IPCC category (LULUCF
excluded)
Waste12%
Agriculture11%
IPPU9%
Energy Industries23%
Manufacturing ind. and const.
11%
Transport24%
Other sectors7%
Fugitive emissions3%
Energy68%
2013

2nd Biennial Report to the United Nations Framework Convention on Climate Change 17
Still within the Energy sector, the category Other sectors18 registered a significant increase of the emissions
in the 1990-2005 period (with almost 55% rise).
In the same time period, Agriculture was another significant source of GHG emissions and was responsible
for 11% of the Portuguese emissions in 2013, which corresponds to a decrease of 6% since 1990. This
fact is related with the decline of relevance of this sector in the national economy, reducing of the livestock
number (e.g. swine), investment in extensive livestock production systems and a decrease of fertilizer
consumption, related to a conversion process of arable crops to pastures.
Regarding Waste, this sector represented approximately 12% of the Portuguese emissions in 2013,
recording an increase of approximately 22% since 1990. This is mainly related to the increase in waste
generation (related with development of the family income and the urbanization growth registered in the
country during the last decade) and the deposition of waste in landfills.
The Industrial processes represented 9% of the Portuguese emissions in 2013 and have grown 12% since
1990. These emissions, which are generated as by-product of many non-energy-related activities, are
mostly related to the increase of cement production, road paving, limestone and dolomite use, lime
production, glass and ammonia production.
The estimative of emissions and sinks from LULUCF category (Figure 11 and Table ) show that this category
has changed from being a net emitter in 1990 (1.8 Mt CO2eq) to a carbon sink in 1992. This condition was
again reverted in the years 2003 and 2005 due to the severe forest wildfires events registered in these
years. In 2013 this sector represents a sequester of -9.4 Mt CO2eq.
Figure 11: GHG emissions and removals by sector
18 This category includes the residential and commercial activities.

2nd Biennial Report to the United Nations Framework Convention on Climate Change 18
Table II: GHG emissions and removals by sector
GHG’s SOURCE AND SINK CATEGORIES 1990 1991 1992 1993 1994 1995 1996 1997 1998 1999 2000 2001
CO2 equivalent (Gg)
1. Energy 41,388 42926.617 47,468 46,213 46,871 50,409 47,753 50,381 54,873 62,326 60,770 61,194
2. Industrial process and product use 5,246 5310.00357 5,009 4,912 4,906 5,616 5,737 6,009 6,176 6,583 6,861 6,544
3. Agriculture 7,573 7652.3079 7,580 7,442 7,606 7,734 7,888 7,801 7,831 7,993 8,144 7,894
4. Land use, land use change and forestry 1,783 1800.5981 -3,042 -4,206 -4,898 -4,524 -8,422 -9,398 -7,055 -8,212 -5,980 -9,426
5. Waste 6,218 6403.0718 6,637 6,806 7,135 7,363 7,330 7,580 7,864 7,932 7,826 7,872
6. Other NO NO NO NO NO NO NO NO NO NO NO NO
GHG’s SOURCE AND SINK CATEGORIES 2002 2003 2004 2005 2006 2007 2008 2009 2010 2011 2012 2013 % Change
1990-2013
CO2 equivalent (Gg)
1. Energy 64875.35 59825.67 61808.24 64396.11 56677.89 55040.97 55040.97 53987.86 48936.23 48075.74 46426.27 44473.76 7.5
2. Industrial process and product use 6856.97 6889.53 7506.62 7526.80 7332.13 7929.42 7869.03 62222.34 6466.69 5712.97 5656.36 5862.26 11.7
3. Agriculture 7746.19 7256.51 7436.92 7335.53 7232.15 7325.25 7303.42 7139.72 7058.06 7017.07 7081.92 7132.85 -5.8
4. Land use, land use change and forestry -8940.76 1575.47 -8101.78 347,63 -9106.55 -12687.26 -14135.53 -13979.37 -11391.37 -13688.90 -10154.88 -9389.57 -626.7
5. Waste 8175.08 8537.52 8656.34 8639.73 8497.90 8382.38 7847.16 7684.90 7878.01 8138.36 7791.37 7602.59 22.3
6. Other NO NO NO NO NO NO NO NO NO NO NO NO NO
NA- Not applicable; NE – Not estimated; NO – Not occurring.
2nd Biennial Report to the United Nations Framework Convention on Climate Change 19
V. QUANTIFIED ECONOMY-WIDE EMISSION REDUCTION TARGET
In 2010, the EU submitted a pledge to reduce its GHG emissions by 2020 by 20% compared to 1990
levels, in order to contribute to achieving the ultimate objective of the UNFCCC: 'to stabilise GHG
concentrations at a level that would prevent dangerous anthropogenic (human-induced) interference with
the climate system'19, or, in other words, to limit the global temperature increase to less than 2°C
compared to temperature levels before industrialization (FCCC/CP/2010/7/Add.1). The EU is also
committed to raising this target to a 30% emission reduction by 2020 compared with 1990 levels, provided
that other developed countries also commit to achieving comparable emission reductions, and that
developing countries contribute adequately, according to their responsibilities and respective capabilities.
This offer was reiterated in the submission to the UNFCCC by the EU-28 and Iceland on 30 April 201420.
Portugal as part of the EU-28, takes on a quantified economy-wide emission reduction target jointly with
all Member States.
The definition of the Convention target for 2020 is documented in the revised note provided by the UNFCCC
Secretariat on the ‘Compilation of economy-wide emission reduction targets to be implemented by Parties
included in Annex I to the Convention’ (FCCC/SB/2011/INF.1/Rev.1 of 7 June 2011). In addition, the EU
provided additional information relating to its quantified economy-wide emission reduction target in a
submission as part of the process of clarifying the developed country Parties' targets in 2012
(FCCC/AWGLCA/2012/MISC.1).
The EU clarified that the accounting rules for the target under the UNFCCC are more ambitious than the
current rules under the Kyoto Protocol, for example, including international aviation, adding an annual
compliance cycle for emissions under the Effort Sharing Decision or higher Clean Development Mechanism
(CDM) quality standards under the EU Emissions Trading System (EU ETS) (FCCC/TP/2013/7).
Accordingly, the following assumptions and conditions apply to the EU's 20% target under the UNFCCC (
Table ):
1. The EU Convention pledge does not include emissions/removals from Land Use, Land-Use Change
and Forestry, but it is estimated to be a net sink over the relevant period. EU inventories also
include information on emissions and removals from LULUCF in accordance with relevant reporting
commitments under the UNFCCC. Accounting for LULUCF activities only takes place under the Kyoto
Protocol.
2. The target covers the gases CO2, CH4, N2O, HFCs, PFCs and SF6.
3. The target refers to 1990 as a single base year for all covered gases and all Member States.
4. Emissions from international aviation to the extent it is included in the EU ETS are included in the
target21
.
5. A limited number of CERs, ERUs and units from new market-based mechanisms may be used to
achieve the target: in the ETS, the use of international credits is capped (up to 50% of the reduction
required from EU ETS sectors by 2020). Quality standards also apply to the use of international
credits in the EU ETS, including a ban on credits from LULUCF projects and certain industrial gas
projects. In the ESD sectors, the annual use of international credits is limited to up to 3% of each
Member State's ESD emissions in 2005, with a limited number of Member States (Portugal included)
being permitted to use an additional 1% from projects in Least Developed Countries (LDCs) or
Small Island Developing States (SIDS), subject to conditions.
19 First steps to a safer future: Introducing the United Nations Framework Convention on Climate Change
http://unfccc.int/essential/_background/convention/items/6036.php
20 European Union, its Member States and Iceland submission pursuant to par 9 of decision 1/CMP.8'
http://ec.europa.eu/clima/policies/international/negotiations/docs/eu_submission_20140430_en.pdf
21 In the EU, the sum of emissions covered by category 1.A.3.a 'domestic aviation' and memo item 'international bunkers - aviation' go
beyond the scope of the EU target, as emissions from international aviation are included in the EU Climate and Energy Package and the
EU target under the UNFCCC to the extent to which aviation is part of the EU ETS.
2nd Biennial Report to the United Nations Framework Convention on Climate Change 20
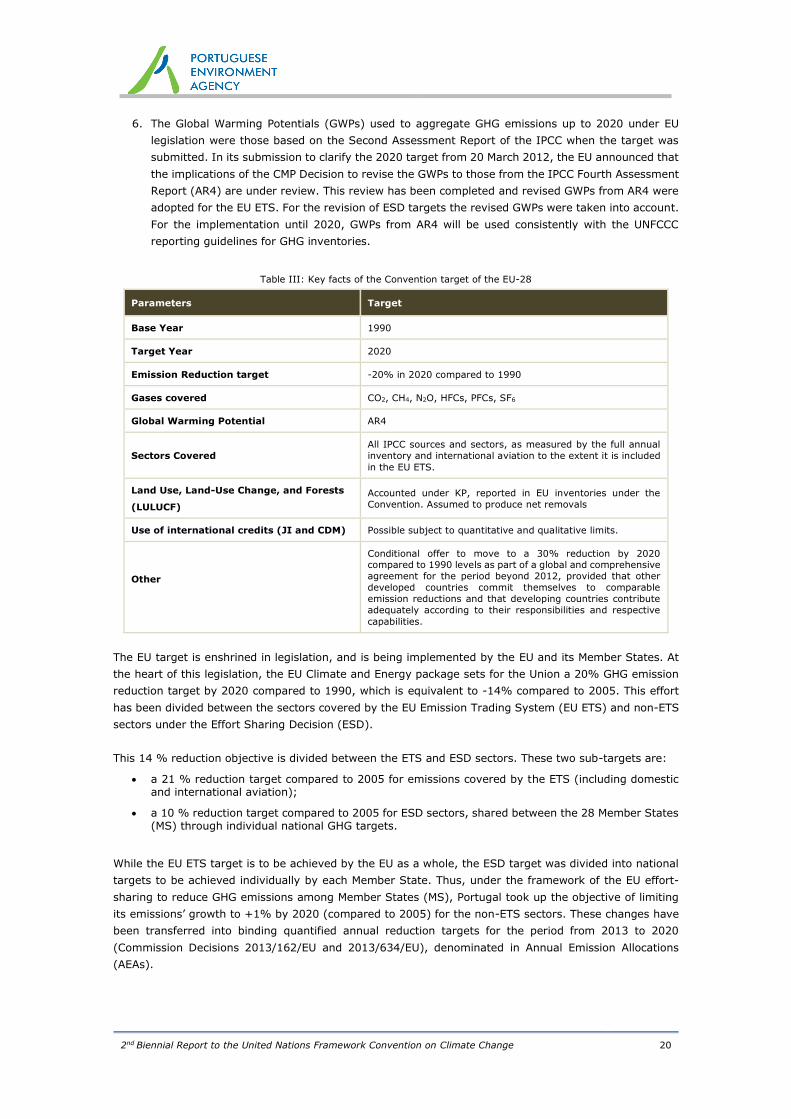
6. The Global Warming Potentials (GWPs) used to aggregate GHG emissions up to 2020 under EU
legislation were those based on the Second Assessment Report of the IPCC when the target was
submitted. In its submission to clarify the 2020 target from 20 March 2012, the EU announced that
the implications of the CMP Decision to revise the GWPs to those from the IPCC Fourth Assessment
Report (AR4) are under review. This review has been completed and revised GWPs from AR4 were
adopted for the EU ETS. For the revision of ESD targets the revised GWPs were taken into account.
For the implementation until 2020, GWPs from AR4 will be used consistently with the UNFCCC
reporting guidelines for GHG inventories.
Table III: Key facts of the Convention target of the EU-28
Parameters Target
Base Year 1990
Target Year 2020
Emission Reduction target -20% in 2020 compared to 1990
Gases covered CO2, CH4, N2O, HFCs, PFCs, SF6
Global Warming Potential AR4
Sectors Covered
All IPCC sources and sectors, as measured by the full annual
inventory and international aviation to the extent it is included
in the EU ETS.
Land Use, Land-Use Change, and Forests
(LULUCF)
Accounted under KP, reported in EU inventories under the
Convention. Assumed to produce net removals
Use of international credits (JI and CDM) Possible subject to quantitative and qualitative limits.
Other
Conditional offer to move to a 30% reduction by 2020 compared to 1990 levels as part of a global and comprehensive
agreement for the period beyond 2012, provided that other
developed countries commit themselves to comparable
emission reductions and that developing countries contribute
adequately according to their responsibilities and respective
capabilities.
The EU target is enshrined in legislation, and is being implemented by the EU and its Member States. At
the heart of this legislation, the EU Climate and Energy package sets for the Union a 20% GHG emission
reduction target by 2020 compared to 1990, which is equivalent to -14% compared to 2005. This effort
has been divided between the sectors covered by the EU Emission Trading System (EU ETS) and non-ETS
sectors under the Effort Sharing Decision (ESD).
This 14 % reduction objective is divided between the ETS and ESD sectors. These two sub-targets are:
a 21 % reduction target compared to 2005 for emissions covered by the ETS (including domestic and international aviation);
a 10 % reduction target compared to 2005 for ESD sectors, shared between the 28 Member States (MS) through individual national GHG targets.
While the EU ETS target is to be achieved by the EU as a whole, the ESD target was divided into national
targets to be achieved individually by each Member State. Thus, under the framework of the EU effort-
sharing to reduce GHG emissions among Member States (MS), Portugal took up the objective of limiting
its emissions’ growth to +1% by 2020 (compared to 2005) for the non-ETS sectors. These changes have
been transferred into binding quantified annual reduction targets for the period from 2013 to 2020
(Commission Decisions 2013/162/EU and 2013/634/EU), denominated in Annual Emission Allocations
(AEAs).
2nd Biennial Report to the United Nations Framework Convention on Climate Change 21
The quantified annual reduction targets 2013-2020 of Portugal are set at49.3 Million AEAs in 2013,
increasing to 51.2Million AEAs in 2020. In the year 2013 verified emission of stationary installations
covered under the EU-ETS in Portugal summed up to 24.6 Mt CO2 equivalent. With total GHG emissions
of 65.1 Mt CO2 equivalent (without LULUCF) the share of ETS emissions is around 38%.
The target levels have been set on the basis of Member States’ relative Gross Domestic Product per capita.
In addition, different levels of development in the EU-28 are taken into account by the provision of several
flexibility options. Up to certain limitations, the ESD allows Member States to make use of flexibility
provisions for meeting their annual targets: carry-over of over-achievements to subsequent years within
each Member State, transfers of AEAs between Member States and the use of international credits (credits
from Joint Implementation and the Clean Development Mechanism). Nevertheless ESD targets are
designed in a strict manner: Every year, once MS emissions are reviewed according to strict criteria
(described in Chapter III of the Commission Implementing Regulation 749/2014), the European
Commission issues an implementing decision on MS ESD emissions in the given year. MS exceeding their
annual AEA, even after taking into account the flexibility provisions and the use of JI/CDM credits, will face
inter alia a penalty – a deduction from their emission allocation of the following year (excess emissions,
multiplied by 1.08).
Under the framework of the 2020 climate and energy package Portugal also adopted a target to increase
RES in the final energy consumption by 31%, 10% of which in the transport sector. Portugal also adopted
an overall national target of 25% increase in energy efficiency (EE) and a specific national EE target of
30% for the Public Administration.
Under the revised EU ETS Directive (Directive 2009/29/EC), a single ETS cap covers the EU Member States
and three participating non-EU countries (Norway, Iceland and Liechtenstein), i.e. there are no further
individual caps by country. Allowances allocated in the EU ETS from 2013 to 2020 decrease by 1.74 %
annually, starting from the average level of allowances issued by Member States for the second trading
period (2008–2012).
For the monitoring of GHG emissions at the EU and the Member State level, the Monitoring Mechanism
Regulation No 525/2013 (MMR) was adopted in May 2013 and entered into force on 8 July 2013. The main
aims of the MMR are to improve the quality of the data reported and assist the EU and Member States
with the tracking of their progress towards emission targets for 2013-2020. The mechanism refers to the
following reporting elements:
Reporting on historical GHG emissions and removals, including national and Union inventory
systems and approximated inventories;
Reporting on low-carbon development strategies;
Reporting on policies and measures and on projections of GHG emissions and removals
Member States reporting on financial and technology support provided to developing countries;
Member States' use of revenues from the auctioning of allowances in the EU Emissions Trading
System (EU ETS);
Member States' reporting on adaptation to climate change.
In 2014 the Implementing Regulation (EU No 749/2014) and Delegated Regulation (EU No 666/2014)
were adopted to enable the implementation of the Monitoring Mechanism Regulation in several of its
provisions, specifying in more detail the structure of the information, reporting formats, and submission
procedures.
The reform of the EU Emission Trading System in Phase III (2013-2020) has resulted in important changes
with regard to domestic institutional arrangements for the monitoring and reporting of GHG emissions
under the EU ETS. EU ETS MRV now requires complying with two Commission Regulations, one specific to
monitoring and reporting (EU No 601/2012) and the other to verification and accreditation (EU No
2nd Biennial Report to the United Nations Framework Convention on Climate Change 22
600/2012). The latter introduces a framework of rules for the accreditation of verifiers to ensure that the
verification of an installation's or an aircraft operator’s emission report is carried out by a verifier that
possesses the technical competence to perform the entrusted task in an independent and impartial manner
and in conformity with the requirements and principles set out. These regulations have direct legal effect
in the Member States and their provisions apply directly to operators or aircraft operators, verifiers, and
accreditation parties. The regulations provide clarity on the roles and responsibilities of all parties (i.e.
industrial installations and aircraft operators are required to have an approved monitoring plan) which will
strengthen the compliance chain.22
In general, in the EU the use of flexible mechanisms can take place on the one hand by operators in the
EU ETS, on the other hand by governments for the achievement of ESD targets.
As part of phase II of the EU ETS (the period 2008-2012), Member States were required to inform the
European Commission in their National Allocation Plans of the limit on JI and CDM credits that could be
used by operators. This limit was then assessed according to the principle of supplementarity, and where
appropriate approved or revised by the European Commission. In total, this adds up to approximately 1.4
billion CERs or ERUs that could have been used by operators for compliance in phase II of the EU ETS.
The amended EU ETS Directive 2009/29/EC (Article 11a (8)) sets the upper limit for credit use for the
period from 2008 to 2020 at a maximum of 50 % of the reduction effort below 2005 levels. This is further
specified into installation-level limits in the Commission Regulation on international credit entitlements
(RICE) (EU No 1123/2013). The sum of the installation-level limits is expected to be lower than the upper
limit, but higher than the 1.4 billion CERs and ERUs already allowed in the second period. Since some
entitlements are expressed as a percentage of verified emissions over the entire period, the overall
maximum amount will only be known at the end of the third trading period.
Since 2013 it is no longer possible to track the use of flexible mechanisms in the EU ETS directly via
information on EUTL public website because CERs and ERUs are no longer surrendered directly but are
exchanged into EUAs. These exchanges will become public on installation level after three years, with the
first information reflecting the use in 2013 available in 2016.
The ESD allows Member States to make use of flexibility provisions for meeting their annual targets, with
certain limitations. In the ESD sectors, the annual use of carbon credits is limited to up to 3 % of each
Member State's ESD emissions in 2005. Member States that do not use their 3 % limit for the use of
international credits in any specific year can transfer the unused part of their limit to another Member
State or bank it for their own use until 2020. Member States fulfilling additional criteria, as is the case for
Portugal, may use credits from projects in Least Developed Countries (LDCs) and Small Island Developing
States (SIDS) up to an additional 1 % of their verified emissions in 2005. These credits are not bankable
and transferable.
Moreover, higher CDM quality standards apply to the use of CERs for compliance with the EU's target
under the Convention.
In addition to the EU target under the Convention, the EU also committed to a legally binding quantified
emission limitation reduction commitment for the second commitment period of the Kyoto Protocol (2013
- 2020).
In Table all relevant GHG reduction targets for the EU and their key facts are displayed in an overview.
On the left, the table includes the international commitments under the Kyoto Protocol and the UNFCCC.
On the right, the EU commitments under the Climate and Energy Package are included.
22 http://ec.europa.eu/clima/policies/ets/monitoring/documentation_en.htm

2nd Biennial Report to the United Nations Framework Convention on Climate Change 23
Table IV: Overview on EU targets
International commitments EU domestic legislation
Kyoto Protocol UNFCCC Climate and Energy Package
EU ETS ESD
Target year of
period
First
commitment
period (2008-
2012)
Second
commitment
period (2013-
2020)
2020 2013-2020 2013-2020
Emission reduction target
-8% -20% -20%
-21% compared to
2005 for ETS
emissions
Annual targets by MS.
In 2020 -10% compared to 2005 for
non-ETS emissions
Further targets
Conditional target
of -30% if other
Parties take on adequate
commitments
Renewable Energy Directive: 20% share of
renewable energy of gross final energy
consumption; Energy Efficiency Directive : Increase energy
efficiency by 20 %
Base year
1990
KP Flexibility rules (Art 3(5))
regarding F-
gases and
Economies in
Transition
1990, but
subject to flexibility rules.
1995 or 2000
may be used as
its base year for
NF3
1990
1990 for overall emission reduction target;
2005 for renewable energy and energy
efficiency target; as well as for targets broken down into ETS and non-ETS emissions
LULUCF
Included ARD and other
activities if
elected
Included ARD
and forest
management,
other activities
if elected (new accounting
rules)
Excluded Excluded
Aviation
Domestic
aviation included.
International
aviation
excluded.
Domestic
aviation included.
International
aviation
excluded.
Aviation in the
scope of the EU
ETS included. In
practice total aviation
emissions
considered.
Domestic and international
aviation, as in the
scope of EU ETS
Aviation generally
excluded, some domestic aviation
included (operators
below ETS de minimis
thresholds)
Use of international
credits
Use of KP
flexible
mechanisms subject to KP
rules
Use of KP
flexible
mechanisms subject to KP
rules
Subject to
quantitative and qualitative limits
Subject to
quantitative and qualitative limits
Subject to quantitative
and qualitative limits
Carry-over of units from preceding
periods
Not applicable
Subject to KP
rules including those agreed in
the Doha
Amendment
Not applicable
EU ETS allowances
can be banked into
subsequent ETS
trading periods since the second trading
period
No carry-over from
previous period
Gases covered
CO2, CH4, N2O,
HFCs, PFCs,
SF6,
CO2, CH4, N2O,
HFCs, PFCs,
SF6, NF3
CO2, CH4, N2O,
HFCs, PFCs, SF6
CO2, CH4, N2O, HFCs, PFCs, SF6
Sectors included
Annex A of KP
(Energy, IPPU,
agriculture, waste), LULUCF
according to KP
accounting rules
for CP1
Annex A of KP
(Energy, IPPU,
agriculture, waste), LULUCF
according to
accounting rules
for CP2
Energy, IPPU,
agriculture, waste, aviation in
the scope of the
EU ETS
Power & heat
generation, energy-
intensive industry
sectors, aviation
(Annex 1 of ETS directive)
Transport (except
aviation), buildings, non-ETS industry,
agriculture (except
forestry) and waste
GWPs used IPCC SAR IPCC AR4 IPCC AR4 IPCC AR4

2nd Biennial Report to the United Nations Framework Convention on Climate Change 24
VI. PROGRESS IN ACHIEVEMENT OF QUANTIFIED ECONOMY-WIDE
EMISSION REDUCTION TARGETS AND RELEVANT INFORMATION
This chapter provides an overview on Portugal’s policies and measures (PaMs) which contribute to meeting
its emission reduction target.
Two distinct levels of PaMs that have an impact on greenhouse gas emissions need to be considered:
European Union policies, which are proposed by the Commission and subsequently approved,
amended or rejected by the Council of the European Union and the European Parliament. These
common and coordinated policies and measures are applicable to all Member States, though Member
States may implement Directives at different points in time. This report concentrates on these EU
policies.
National policies developed and implemented by Portugal.
A. MITIGATION ACTIONS AND THEIR EFFECTS
1. Strategic Framework for Climate Policy
Portugal has successfully concluded a climate policy cycle on mitigation and adaptation in the period up to
2013, that allowed achieving both the fulfilment of the national objectives as regards climate change under
the Kyoto Protocol framework as well as the remaining sectoral challenges in what vulnerabilities are
concerned.
In 2015, the political and institutional response in this regard was updated and further developed
establishing an integrated framework of policy instruments in the 2020/2030 timeframe: the Strategic
Framework for Climate Policy (QEPiC). It includes the main national policy instruments in the areas of
climate change mitigation and adaptation: the National Programme for Climate Change 2020/2030 (PNAC)
and the National Strategy for Adaptation to Climate Change 2020 (ENAAC).
The QEPiC – which constitutes a climate policy innovation in Portugal by integrating, for the first time, all
the dimensions of climate change and all the instruments – provides the national response to the
commitments made for 2020 (under the UNFCCC and the 2020 Climate and Energy Package) and put
forward for 2030 in the framework of the European Union (and under the Paris Agreement) and integrates
the relevant national targets established under the Green Growth Commitment (CCV).
The vision of QEPiC is the development of a competitive, resilient and low carbon economy, setting a new
development paradigm for Portugal in the context of Green Growth., which relies on the following nine
objectives:
1. Promote the transition to a low carbon economy, generating more wealth and employment,
contributing to green growth;
2. Ensure a sustainable greenhouse gases (GHG) emissions’ reduction trajectory;
3. Strengthen the resilience and the national capacity for adaptation;
4. Ensure an engaged participation in the international negotiations and cooperation;
5. Stimulate research, innovation and knowledge production;
6. Involve the society in climate change challenges, contributing to increase the individual and
collective action;
7. Increase the efficiency of information management, reporting and monitoring systems;
8. Ensure funding conditions and increase the investment levels;
9. Ensure effective governance conditions and climate change mainstreaming.
2nd Biennial Report to the United Nations Framework Convention on Climate Change 25
The QEPiC also identifies its support mechanisms as regards financing, reporting and monitoring the
implementation of climate policy and actions undertaken. It establishes a National System for Policies and
Measures (SPeM) and a governance, monitoring and reporting structure for the ENAAC. The role of the
National System for the Inventory of Emissions by Sources and Removals by Sinks of Air Pollutants
(SNIERPA) is also reviewed and integrated into the QEPiC. The integration of these support mechanisms
represents and articulated framework for the implementation and follow-up of the national climate policy,
constituting the national reference for Monitoring, Reporting and Verification (MRV).
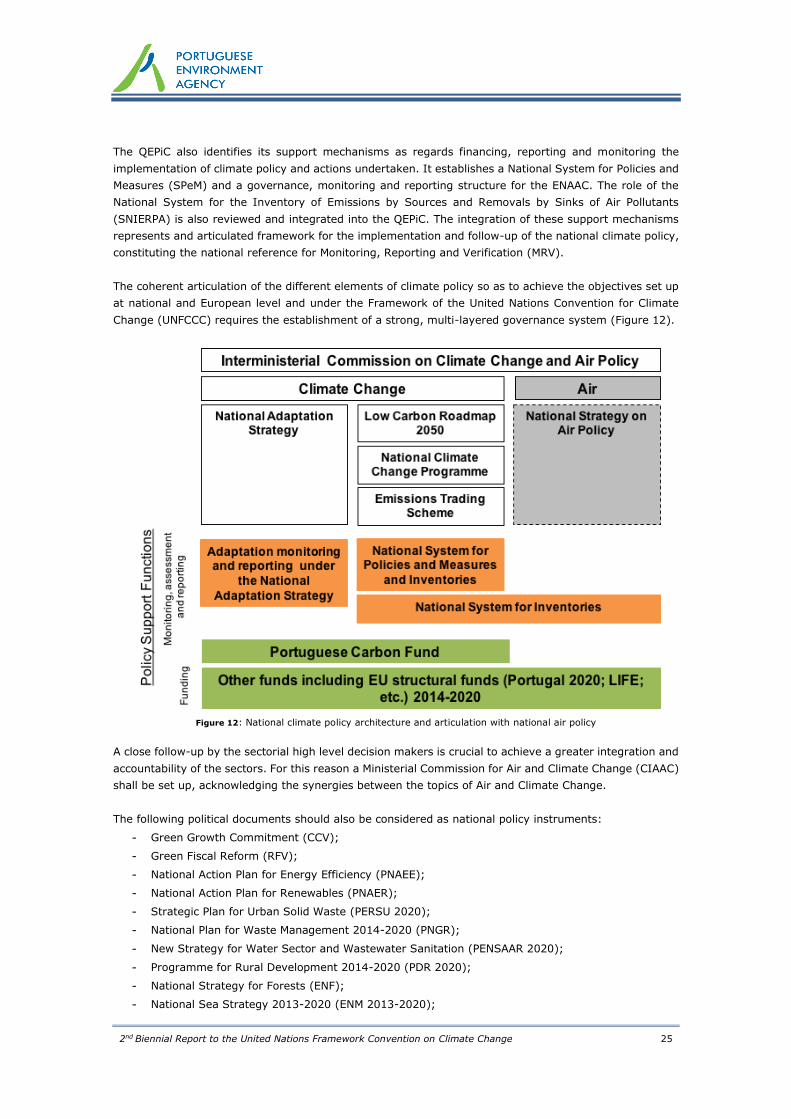
The coherent articulation of the different elements of climate policy so as to achieve the objectives set up
at national and European level and under the Framework of the United Nations Convention for Climate
Change (UNFCCC) requires the establishment of a strong, multi-layered governance system (Figure 12).
Figure 12: National climate policy architecture and articulation with national air policy
A close follow-up by the sectorial high level decision makers is crucial to achieve a greater integration and
accountability of the sectors. For this reason a Ministerial Commission for Air and Climate Change (CIAAC)
shall be set up, acknowledging the synergies between the topics of Air and Climate Change.
The following political documents should also be considered as national policy instruments:
- Green Growth Commitment (CCV);
- Green Fiscal Reform (RFV);
- National Action Plan for Energy Efficiency (PNAEE);
- National Action Plan for Renewables (PNAER);
- Strategic Plan for Urban Solid Waste (PERSU 2020);
- National Plan for Waste Management 2014-2020 (PNGR);
- New Strategy for Water Sector and Wastewater Sanitation (PENSAAR 2020);
- Programme for Rural Development 2014-2020 (PDR 2020);
- National Strategy for Forests (ENF);
- National Sea Strategy 2013-2020 (ENM 2013-2020);
2nd Biennial Report to the United Nations Framework Convention on Climate Change 26
- National Transport and Infrastructure Plan (PETi3+);
- Nacional Strategy for Sustainable Cities 2020;
- National Strategy for Smart Research and Innovation.
It should be underlined that the changes imposed by the Portuguese environmental tax reform (Law n.º
82-D/2014 of 31st of December23)will contribute for eco-innovation and efficiency of the resources
application, a reduction of energy dependency from abroad and to encourage a more sustainable
production and consumption patterns, promote the entrepreneurship and job’s generation, an efficient
achievement of international goals and purposes plus a diversification of the revenue sources framed by
a fiscal neutrality and economic competitiveness.
Concerning the Energy and Transports sectors, it should be underlined the following measures:
- The indexation of the Emissions Trading System (ETS)sectors carbon price’s to the Non-ETS sectors
taxation (Carbon Tax);
- Measures in order to promote the electric mobility;
- Increase of the tax burden over the vehicles(ISV) according to theirCO2 emissions;
- Measures to promote the use of public transport;
- Promotion of incentives to scrap cars at the end of life.
It should be emphasized that the impacts of the Portuguese environmental tax reform were not considered
in the political scenarios that support the reported projections because their political approval only happen
after the end of the projection’s works.
2. National Climate Change Programme 2020/2030
PNAC 2020/2030 is focused on climate change mitigation and covers all sectors of the national economy.
It identifies the climate policy objectives, in line with the cost-effective emissions’ reduction potential, to
maintain a low carbon trajectory, consolidating the progress achieved in the past years.
Nowadays, climate change public policies are already part of a set of sectoral policies in Portugal. In fact,
in areas such as energy and industry covered by the EU emissions trading system (ETS), the carbon
dimension is one of the strategic and economic considerations of the companies. The ETS remains a
fundamental instrument for climate change mitigation policy, both at national and European level.
As regards agriculture and forestry there is also a growing awareness of the important contribution these
sectors can give in terms of GHG emissions mitigation. Even in areas with important challenges such as
transports, important steps were given towards the decarbonisation of vehicle fleets, for example by
renewing the fleets, converting urban public buses to natural gas and promoting the electric mobility by
setting a pilot charging infrastructure network for electric vehicles (EV), creating incentives for the
acquisition of EV and acquiring 30 EV for the Public Administration fleet.
The Green Taxation Reform is one of the drivers identified in the Commitment to Green Growth in order
to stimulate innovation and sustainable growth, helping to reconcile protection of the environment with
economic growth. The reform must also encourage the efficient use of resources, thereby preserving and
harnessing natural capital and fostering fair and sustainable use of the soil, territory and urban areas while
introducing signs which facilitate the transition to a low-carbon economy. Furthermore, it includes a carbon
tax, indexed to the price of carbon permits in the EU ETS, incentives to electric vehicles and sustainable
mobility.
23 Lei n.º82-D/2014, de 31 de dezembro.
2nd Biennial Report to the United Nations Framework Convention on Climate Change 27
PNAC sets the guidelines, de sectoral emissions reduction targets and identifies a set of policies and
measures to be developed together with the relevant policy sectors in areas such as transports, energy,
agriculture and forestry. The PNAC therefore features a compilation of other policy instruments (being a
“plan of plans”) and becomes a dynamic reference framework for the identification and definition of
sectoral policies and measures, based on their ex-ante and ex-post evaluation as regards the low carbon
dimension.
PNAC 2020/2030 sets the following objectives:
a) Promote the low carbon transition, generating more wealth and employment and contributing to green
growth;
b) Ensure a sustainable national GHG emissions reduction trajectory to achieve the target of -18% to -
23% in 2020 and -30% to -40% in 2030 compared to 2005, thus fulfilling the national mitigation
commitments and keeping Portugal in line with the European objectives;
c) Mainstream mitigation objectives into sectoral policies.
PNAC also contributes to other objectives of the QEPiC such as promoting research, innovation and
knowledge production and the involvement of the society in climate change challenges, contributing to
increasing individual and collective action, and provides guidelines for policies and measures to achieve
the emissions reduction targets set. In particular, it puts forward sectoral emission reduction targets for
the non-ETS sectors for 2020 and 2030.
To ensure the transition to a low carbon economy it is fundamental to align the objectives of climate and
energy policies, in particular as regards the level of ambition for EE and RES penetration so as to collect
the inherent benefits in terms of energy security, petroleum products trade balance and emissions
reduction trajectory.
Climate and energy objectives are mutually reinforcing so the PNAC has incorporated sectoral policies and
measures to achieve the energy policy objectives for 2030 needed in the CCV (30% reduction on the
energy baseline and 40% of RES in the national energy consumption).
In this context a new support mechanism is established to follow-up on policies and measures and
projections, to uphold the evaluation of progress in the implementation of sectoral mitigation policies and
measures, promoting the engagement and reinforcing the accountability of the different policy sectors in
order to mainstream climate policy.
The National System for Policies and Measures (SPeM) ensures the management of the process regarding
the definition of policies and measures and the elaboration of projections and promotes the connection
between the national inventory and the emissions’ projections. Through the SPeM the sectors can identify
the policies and measures to be implemented in the 2020/2030 timeframe in more detail.
Besides the traditional sectoral areas, the measures are organised into crosscutting areas (research,
development and innovation; knowledge, information and awareness) and integrated intervention areas
(public administration; sustainable cities) in accordance to their implementation.
It should be underlined that in the crosscutting areas there is both a reinforcement of participation,
communication and awareness-raising of citizens, to promote a greater involvement of civil society as
regards climate change as well as the consideration of specific measures regarding innovation and
development, which are crucial elements for the transition to a low carbon economy.
The sustainable cities dimension seeks to highlight the relevant role of cities in tackling climate change
and the wide variety of initiative taking place at local and regional level. The creation of an intervention
area dedicated to the role of the State in the transition to a low carbon economy is justified by the relevance

2nd Biennial Report to the United Nations Framework Convention on Climate Change 28
of the public sector in the national economy and the impacts that the actions undertaken might have in
the economy.
Policies and measures in place are reported in CTF Table 3 and as an Annex to this report.
3. Overarching policies and measures: ETS and ESD
The two main overarching policies are the EU Emission Trading System (ETS) and the Effort Sharing
Decision (ESD), both establishing EU internal rules under the “2020 climate and energy package” which
underpin the implementation of the target under the Convention.
i. EU Emissions Trading System
The following structural changes to the ETS have taken place or have been decided since the publication
of the BR1.
Firstly, the scope of the ETS with regard to aviation has been changed. Since 2012 emissions from all
flights from, to and within the European Economic Area (EEA) - the 28 EU Member States, plus Iceland,
Liechtenstein and Norway - are included in the EU Emissions Trading System (ETS). The legislation,
adopted in 2008, applies to both EU and non-EU airlines alike. To allow time for negotiations on a global
market-based measure applying to international aviation emissions, the ETS requirements were suspended
for flights in 2012 to and from non-European countries (Decision No 377/2013/EU). For the period 2013
to 2016 the legislation has also been amended so that only emissions from flights within the EEA fall under
the ETS (Regulation EU No 421/2014). The EU made this change following agreement by the International
Civil Aviation Organization (ICAO) Assembly in October 2013 to develop a global market-based mechanism
addressing international aviation emissions by 2016 and apply it by 2020. The amended law provides for
the Commission to report to the European Parliament and Council on the outcome of the 2016 ICAO
Assembly and propose measures as appropriate to take international developments into account with
effect from 2017. With Regulation EU No 421/2014 exemptions for operators with low emissions have also
been introduced.
Since 2013, the EU ETS operates under the improved and harmonised rules of Phase 3. In October 2014
EU Heads of State and Government have decided- within the 2030 Climate and Energy Framework- that
a well-functioning, reformed EU ETS together with an instrument to stabilise the market (Market Stability
Reserve – MSR) will constitute the main mechanism to achieve the reduction of emissions in the EU ETS
by 43% compared to 2005.
The MSR has adopted in October 2015 (Decision (EU) 2015/1814). The reserve will start operating in
January 2019. It will neutralise the negative impacts of the existing surplus of allowances and improve the
system's resilience to future shocks by adjusting the supply of allowances to be auctioned.
On 15 July 2015, the Commission presented a legislative proposal on the revision of the EU ETS for Phase
4 in line with the 2030 Climate and Energy policy Framework.
The key changes are:
• The overall number of emission allowances will decline at an annual rate of 2.2% from 2021
onwards, compared to 1.74% currently. This leads to a significant additional emissions reduction
of some 556 million tonnes between 2021 and 2030.
• The proposal further develops predictable, robust and fair rules to address the risk of carbon
leakage. The system of free allocation is revised in order to distribute the available allowances in
the most effective and efficient way to those sectors at highest risk of relocating their production
outside the EU (around 50 sectors in total).

2nd Biennial Report to the United Nations Framework Convention on Climate Change 29
• An Innovation Fund will be set up to extend existing support for the demonstration of innovative
technologies to breakthrough innovation in industry. Free allowances will continue to be available
to modernise the power sector in lower-income Member States. In addition, a dedicated
Modernisation Fund will be established to facilitate investments in modernising the power sector
and wider energy systems and boost energy efficiency in these Member States.
ii. Effort Sharing Decision
Since the publication of the BR1 the national ESD targets have been adjusted to reflect the change in
scope of the EU ETS with Decision 2013/634/EU. The progress of Member States in meeting the emission
reduction targets set in the ESD is assessed under the Monitoring Mechanism Regulation (Regulation No
525/2013), and also as part of the European Semester24.
iii. Other Cross-cutting policies and measures
To respond to challenges and investment needs related to climate change, the EU has agreed that at least
20% of its budget for 2014-2020 – as much as €180 billion − should be spent on climate change-related
action. To achieve this increase, mitigation and adaptation actions are integrated into all major EU
spending programmes, in particular cohesion policy, regional development, energy, transport, research
and innovation and the Common Agricultural Policy.
4. Assessment of the economic and social consequences of response measures
Portugal’s contribution to the minimisation of the adverse effects of climate change in other Parties,
particularly developing countries, is carried out through a strong commitment to implementing the
Convention and the Kyoto Protocol.
As such, the policies and measures implemented, adopted or foreseen in PNAC, targeting the six GHG of
the Kyoto Protocol through its broad portfolio of instruments and wide-ranging coverage of all sectors of
the economy, make up a significant effort by the Portuguese Government to address climate change,
including the minimization of adverse effects of such policies.
In some cases, such as measures pertaining to the diversification of primary energy sources (namely
shifting to natural gas), there can simultaneously be positive effects on Portugal’s emissions reduction and
in the economy of some fossil fuel exporting countries.
To ensure that all relevant possible impacts are taken into account, the SPeM to be established will address
to the extent possible information on the economic and social consequences of climate policy measures.
B. ESTIMATES OF EMISSION REDUCTIONS AND REMOVALS AND THE USE OF UNITS
FROM THE MARKET-BASED MECHANISMS AND LAND USE CHANGE AND FORESTRY
ACTIVITIES
After a rapid GHG emissions growth during the 90’s, Portugal peaked its emissions in 2005 and since then
a significant and sustained decrease of emissions has been registered, thus consolidating a decarbonisation
trajectory of the national economy.
During the first commitment period under the Kyoto Protocol, and under the framework of the European
Union effort-sharing, Portugal was bound to limit the increase of its emissions to no more than +27%,
24 The European Semester is the EU's annual cycle of economic policy guidance and surveillance:
http://ec.europa.eu/economy_finance/economic_governance/the_european_semester/index_en.htm
2nd Biennial Report to the United Nations Framework Convention on Climate Change 30
compared to 1990, in the period 2008-2012. The trajectory since 2005 allowed Portugal to fulfil its Kyoto
commitment. All sectors, including the land use, land-use changes and forestry (LULUCF) contributed to
this endeavour.
In complying with its KP1st commitment period commitment Portugal made use of LULUCF credits
generated (RMU) and of flexible mechanisms (both CER and ERU). Use of RMU amounted to some 12,4%
of Portugal’s compliance. Use of CER and ERU use amounted to some 4% of Portugal’s compliance.
The use of flexible mechanisms takes place on the one hand by operators in the EU ETS, on the other hand
by governments for the achievement of ESD targets. For information on the use in the ETS please see the
2nd BR of the European Union.
The use of flexible mechanisms under the ESD cannot be quantified in the moment. As the compliance
assessment for the first year 2013 under the ESD will only take place in 2016, any potential use of units
for the first year will only take place in 2016. Thus, for the 2nd BR the EU and its MS can only report that
no units have been used under the ESD so far. This is why no quantitative information can be given for
the use of flexible mechanisms in BR2 in CTF Table 4b.
2nd Biennial Report to the United Nations Framework Convention on Climate Change 31
VII. PROJECTIONS
A. GENERAL INFORMATION
The PNAC sets guidelines, defines sectoral emissions reduction targets and identifies a set of policies and
measures to be developed together with the relevant policy sectors in areas such as transports, energy,
agriculture and forestry. The PNAC therefore features a compilation of other policy instruments (being a
“plan of plans”) and becomes a dynamic reference framework for the identification and definition of
sectoral policies and measures, based on their ex-ante and ex-post evaluation as regards the low carbon
dimension.
The PNAC 2020/2030 provides guidelines for policies and measures to achieve the emissions reduction
targets set. In particular, it puts forward sectoral emission reduction targets for the non-ETS sectors for
2020 and 2030.
The reported projections are part of a task that began in 2013 and ended in 2014which were included in
the production of the PNAC2020/2030. Preliminary results from the work undertaken were already
reported in BR1. The reported projections should be considered in the timeframe of 2030 and their data
are in compliance to the Global Warming Potentials (GWP) of the 4th Assessment Report (4AR).
In the context of TIMES_PT model, emissions that were not covered by this model, as for example fugitive
emissions and fluorinated gases, were estimated based on the results obtained by the activity model,
especially in the refining, distribution of petroleum products and natural gas sectors; and by the
refrigeration level used in the various sectors. The results were subsequently added to the energy sector
ones.
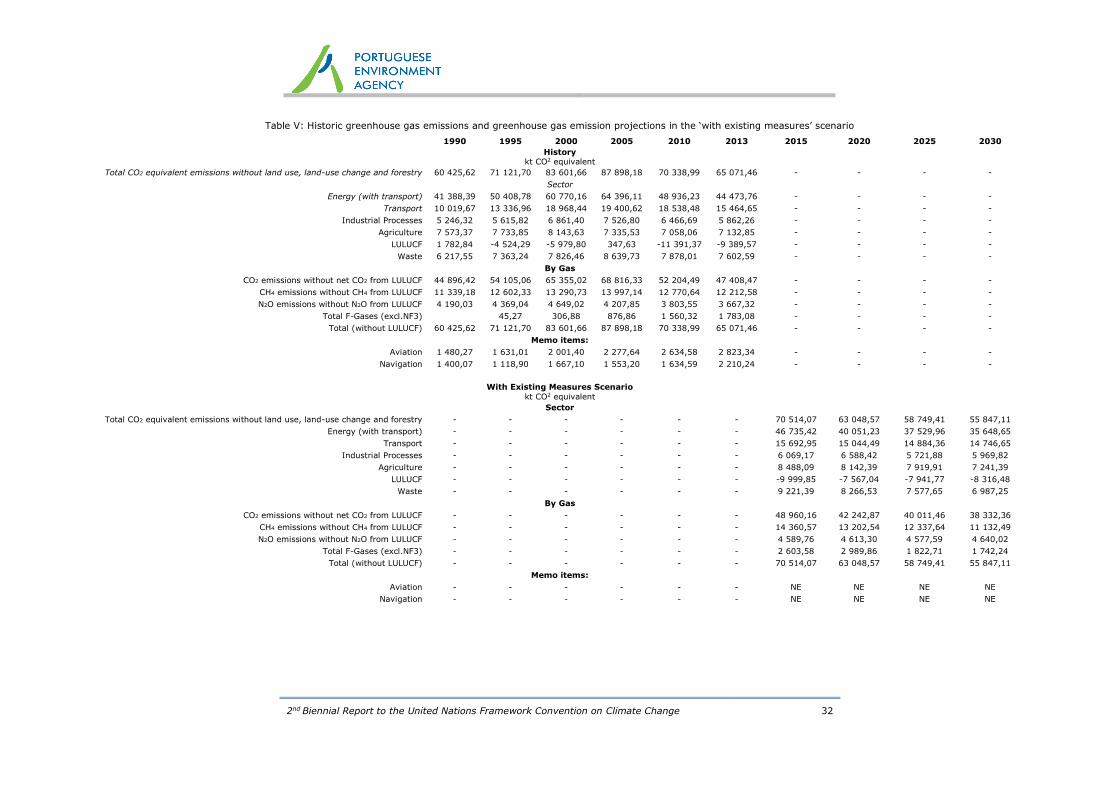
2nd Biennial Report to the United Nations Framework Convention on Climate Change 32
Table V: Historic greenhouse gas emissions and greenhouse gas emission projections in the ‘with existing measures’ scenario
1990 1995 2000 2005 2010 2013 2015 2020 2025 2030
History kt CO2 equivalent
Total CO2 equivalent emissions without land use, land-use change and forestry 60 425,62 71 121,70 83 601,66 87 898,18 70 338,99 65 071,46 - - - -
Sector
Energy (with transport) 41 388,39 50 408,78 60 770,16 64 396,11 48 936,23 44 473,76 - - - -
Transport 10 019,67 13 336,96 18 968,44 19 400,62 18 538,48 15 464,65 - - - -
Industrial Processes 5 246,32 5 615,82 6 861,40 7 526,80 6 466,69 5 862,26 - - - -
Agriculture 7 573,37 7 733,85 8 143,63 7 335,53 7 058,06 7 132,85 - - - -
LULUCF 1 782,84 -4 524,29 -5 979,80 347,63 -11 391,37 -9 389,57 - - - -
Waste 6 217,55 7 363,24 7 826,46 8 639,73 7 878,01 7 602,59 - - - -
By Gas
CO2 emissions without net CO2 from LULUCF 44 896,42 54 105,06 65 355,02 68 816,33 52 204,49 47 408,47 - - - -
CH4 emissions without CH4 from LULUCF 11 339,18 12 602,33 13 290,73 13 997,14 12 770,64 12 212,58 - - - -
N2O emissions without N2O from LULUCF 4 190,03 4 369,04 4 649,02 4 207,85 3 803,55 3 667,32 - - - -
Total F-Gases (excl.NF3) 45,27 306,88 876,86 1 560,32 1 783,08 - - - -
Total (without LULUCF) 60 425,62 71 121,70 83 601,66 87 898,18 70 338,99 65 071,46 - - - -
Memo items:
Aviation 1 480,27 1 631,01 2 001,40 2 277,64 2 634,58 2 823,34 - - - -
Navigation 1 400,07 1 118,90 1 667,10 1 553,20 1 634,59 2 210,24 - - - -
With Existing Measures Scenario
kt CO2 equivalent
Sector
Total CO2 equivalent emissions without land use, land-use change and forestry - - - - - - 70 514,07 63 048,57 58 749,41 55 847,11
Energy (with transport) - - - - - - 46 735,42 40 051,23 37 529,96 35 648,65
Transport - - - - - - 15 692,95 15 044,49 14 884,36 14 746,65
Industrial Processes - - - - - - 6 069,17 6 588,42 5 721,88 5 969,82
Agriculture - - - - - - 8 488,09 8 142,39 7 919,91 7 241,39
LULUCF - - - - - - -9 999,85 -7 567,04 -7 941,77 -8 316,48
Waste - - - - - - 9 221,39 8 266,53 7 577,65 6 987,25
By Gas
CO2 emissions without net CO2 from LULUCF - - - - - - 48 960,16 42 242,87 40 011,46 38 332,36
CH4 emissions without CH4 from LULUCF - - - - - - 14 360,57 13 202,54 12 337,64 11 132,49
N2O emissions without N2O from LULUCF - - - - - - 4 589,76 4 613,30 4 577,59 4 640,02
Total F-Gases (excl.NF3) - - - - - - 2 603,58 2 989,86 1 822,71 1 742,24
Total (without LULUCF) - - - - - - 70 514,07 63 048,57 58 749,41 55 847,11
Memo items:
Aviation - - - - - - NE NE NE NE
Navigation - - - - - - NE NE NE NE

2nd Biennial Report to the United Nations Framework Convention on Climate Change 33
Figure 13: Total, aggregate, absolute historic and projected GHG emissions (Portugal)
Figure 14: Portuguese GHG emissions per sector in the WEM scenario
Figure 15: GHG emissions per gas in the WEM scenario (total excluding LULUCF)
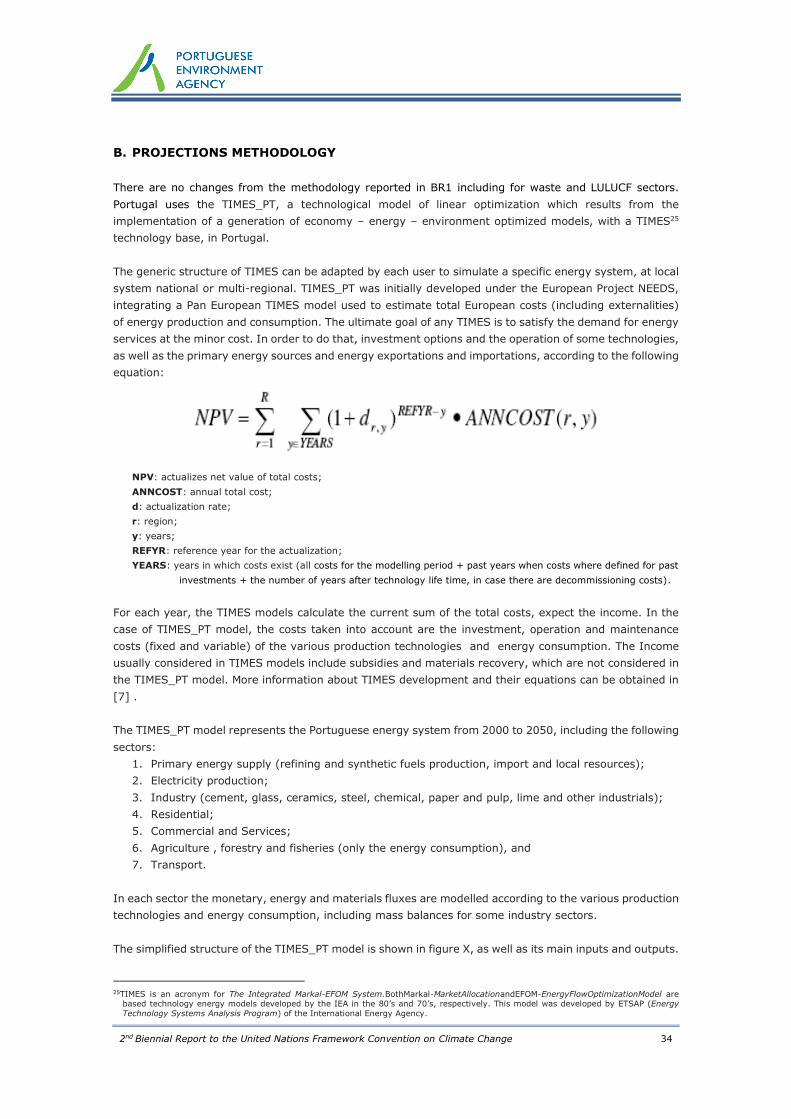
2nd Biennial Report to the United Nations Framework Convention on Climate Change 34
B. PROJECTIONS METHODOLOGY
There are no changes from the methodology reported in BR1 including for waste and LULUCF sectors.
Portugal uses the TIMES_PT, a technological model of linear optimization which results from the
implementation of a generation of economy – energy – environment optimized models, with a TIMES25
technology base, in Portugal.
The generic structure of TIMES can be adapted by each user to simulate a specific energy system, at local
system national or multi-regional. TIMES_PT was initially developed under the European Project NEEDS,
integrating a Pan European TIMES model used to estimate total European costs (including externalities)
of energy production and consumption. The ultimate goal of any TIMES is to satisfy the demand for energy
services at the minor cost. In order to do that, investment options and the operation of some technologies,
as well as the primary energy sources and energy exportations and importations, according to the following
equation:
NPV: actualizes net value of total costs;
ANNCOST: annual total cost;
d: actualization rate;
r: region;
y: years;
REFYR: reference year for the actualization;
YEARS: years in which costs exist (all costs for the modelling period + past years when costs where defined for past
investments + the number of years after technology life time, in case there are decommissioning costs).
For each year, the TIMES models calculate the current sum of the total costs, expect the income. In the
case of TIMES_PT model, the costs taken into account are the investment, operation and maintenance
costs (fixed and variable) of the various production technologies and energy consumption. The Income
usually considered in TIMES models include subsidies and materials recovery, which are not considered in
the TIMES_PT model. More information about TIMES development and their equations can be obtained in
[7] .
The TIMES_PT model represents the Portuguese energy system from 2000 to 2050, including the following
sectors:
1. Primary energy supply (refining and synthetic fuels production, import and local resources);
2. Electricity production;
3. Industry (cement, glass, ceramics, steel, chemical, paper and pulp, lime and other industrials);
4. Residential;
5. Commercial and Services;
6. Agriculture , forestry and fisheries (only the energy consumption), and
7. Transport.
In each sector the monetary, energy and materials fluxes are modelled according to the various production
technologies and energy consumption, including mass balances for some industry sectors.
The simplified structure of the TIMES_PT model is shown in figure X, as well as its main inputs and outputs.
25TIMES is an acronym for The Integrated Markal-EFOM System.BothMarkal-MarketAllocationandEFOM-EnergyFlowOptimizationModel are
based technology energy models developed by the IEA in the 80’s and 70’s, respectively. This model was developed by ETSAP (Energy
Technology Systems Analysis Program) of the International Energy Agency.
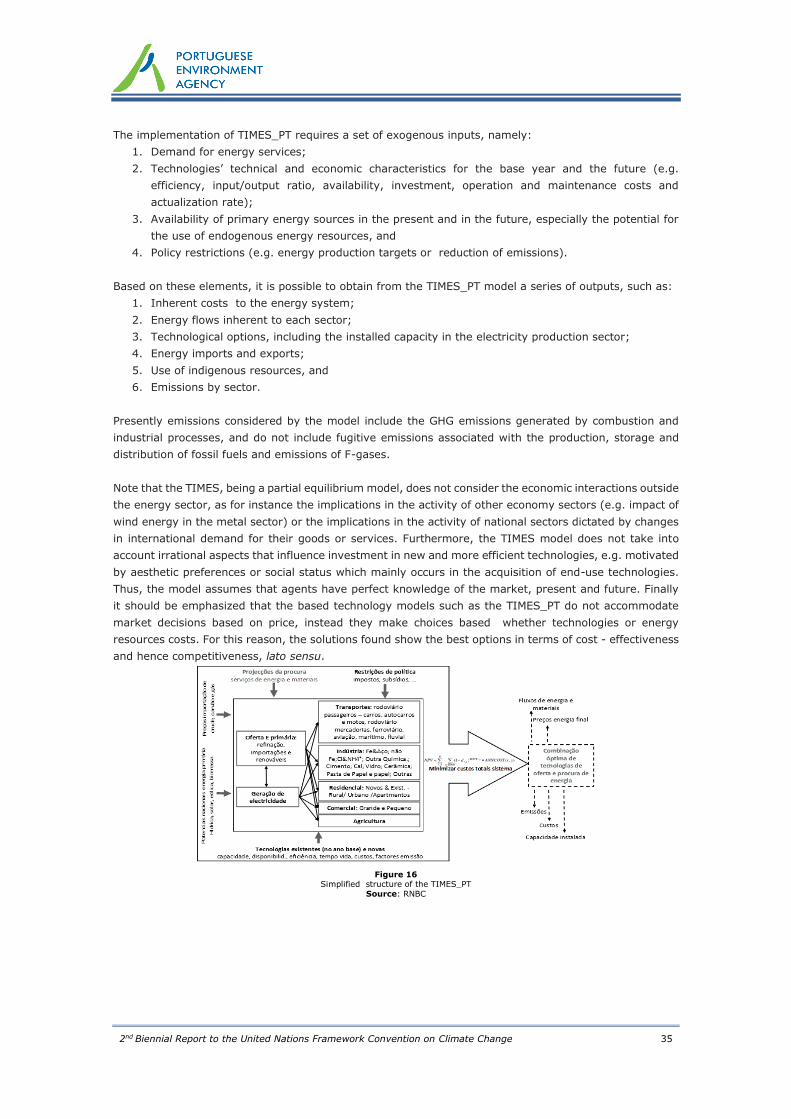
2nd Biennial Report to the United Nations Framework Convention on Climate Change 35
The implementation of TIMES_PT requires a set of exogenous inputs, namely:
1. Demand for energy services;
2. Technologies’ technical and economic characteristics for the base year and the future (e.g.
efficiency, input/output ratio, availability, investment, operation and maintenance costs and
actualization rate);
3. Availability of primary energy sources in the present and in the future, especially the potential for
the use of endogenous energy resources, and
4. Policy restrictions (e.g. energy production targets or reduction of emissions).
Based on these elements, it is possible to obtain from the TIMES_PT model a series of outputs, such as:
1. Inherent costs to the energy system;
2. Energy flows inherent to each sector;
3. Technological options, including the installed capacity in the electricity production sector;
4. Energy imports and exports;
5. Use of indigenous resources, and
6. Emissions by sector.
Presently emissions considered by the model include the GHG emissions generated by combustion and
industrial processes, and do not include fugitive emissions associated with the production, storage and
distribution of fossil fuels and emissions of F-gases.
Note that the TIMES, being a partial equilibrium model, does not consider the economic interactions outside
the energy sector, as for instance the implications in the activity of other economy sectors (e.g. impact of
wind energy in the metal sector) or the implications in the activity of national sectors dictated by changes
in international demand for their goods or services. Furthermore, the TIMES model does not take into
account irrational aspects that influence investment in new and more efficient technologies, e.g. motivated
by aesthetic preferences or social status which mainly occurs in the acquisition of end-use technologies.
Thus, the model assumes that agents have perfect knowledge of the market, present and future. Finally
it should be emphasized that the based technology models such as the TIMES_PT do not accommodate
market decisions based on price, instead they make choices based whether technologies or energy
resources costs. For this reason, the solutions found show the best options in terms of cost - effectiveness
and hence competitiveness, lato sensu.
Figure 16
Simplified structure of the TIMES_PT
Source: RNBC

2nd Biennial Report to the United Nations Framework Convention on Climate Change 36
VIII. PROVISIONS OF FINANCIAL, TECHNOLOGICAL AND CAPACITY-
BUILDING SUPPORT TO DEVELOPING COUNTRY PARTIES
A. FINANCE
Portugal’s public climate finance (Table ) for programmes and projects in partner countries is channelled
through Official Development Assistance (ODA). In Portugal, ODA for environment has had little expression
regarding total values by virtue of the strategic priorities that essentially lie in areas such as Education,
Health, Security and Justice. The Portuguese Carbon Fund (FPC) is a domestic fund established in 2006
with the main objective of supporting actions at national level to meet the Portuguese commitments under
the Kyoto Protocol. However, the Portuguese Carbon Fund (FPC) was revised to become a new source of
funding for CC development cooperation since 2010.
The majority of Portuguese Cooperation climate related Programmes, Projects and Actions (PPA) includes
capacity building components. Nevertheless the CRS does not allow actually the data tracking by
component.
In this context it should be noted that under the Portuguese Cooperation the following amounts on CC
cooperation have been disbursed for 2014 by country (see table VI).
Table VI: Total amount committed by country (Bilateral Cooperation - only Principal Objective)
Until December 2014, bilateral financial flows amounted to approximately 9.2 M€. Furthermore, there are
still some projects undergoing implementation that will be financed in 2015 and 2016 onwards.
BILATERAL COOPERATION 2013 2014
Angola 0,00 € 0,00 €
Cape Vert 12.973.752,00€ 6.276.715,00 €
Mozambique 2.699.679,00 € 2.283.077,00 €
Guiné-Bissau 145.938,00 € 235.709,00 €
São Tomé e Príncipe 156.391,00 € 357.546,00 €
East Timor 0.00 € 61.269,00 €
Total 15,975,760.00 € 9.214.316,00 €
Source: Camões, I.P. (2015)
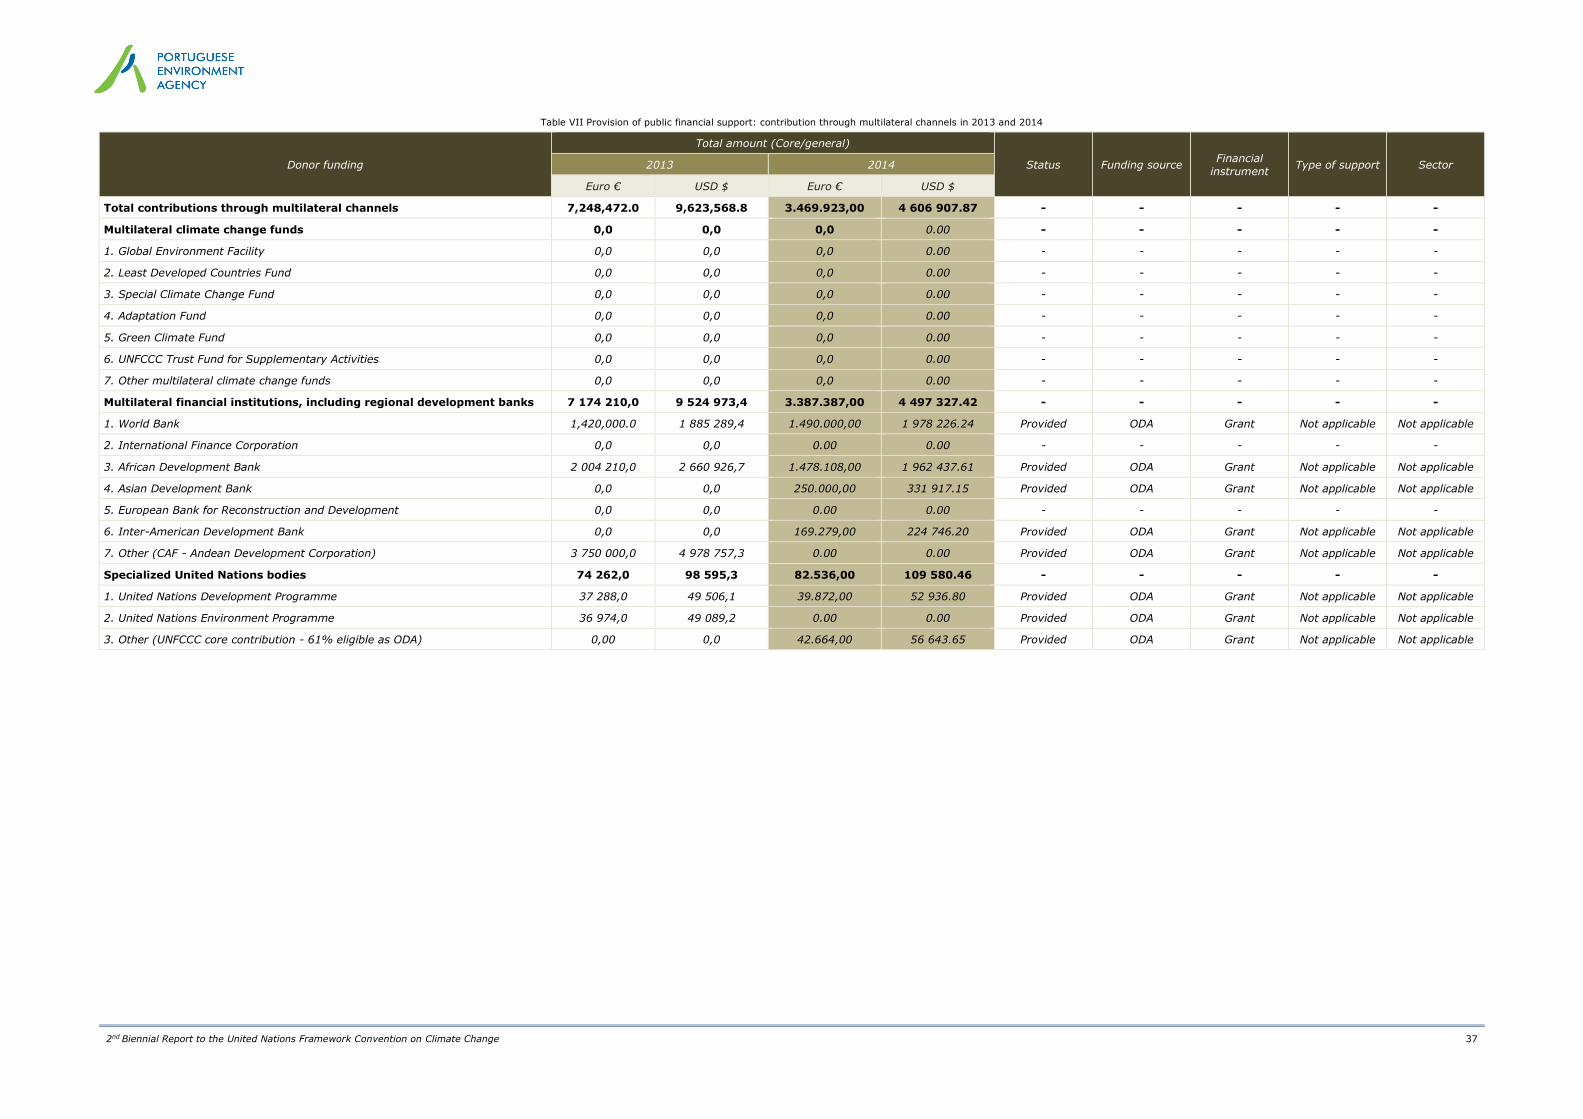
2nd Biennial Report to the United Nations Framework Convention on Climate Change 37
Table VII Provision of public financial support: contribution through multilateral channels in 2013 and 2014
Donor funding
Total amount (Core/general)
Status Funding source Financial
instrument Type of support Sector 2013 2014
Euro € USD $ Euro € USD $
Total contributions through multilateral channels 7,248,472.0 9,623,568.8 3.469.923,00 4 606 907.87 - - - - -
Multilateral climate change funds 0,0 0,0 0,0 0.00 - - - - -
1. Global Environment Facility 0,0 0,0 0,0 0.00 - - - - -
2. Least Developed Countries Fund 0,0 0,0 0,0 0.00 - - - - -
3. Special Climate Change Fund 0,0 0,0 0,0 0.00 - - - - -
4. Adaptation Fund 0,0 0,0 0,0 0.00 - - - - -
5. Green Climate Fund 0,0 0,0 0,0 0.00 - - - - -
6. UNFCCC Trust Fund for Supplementary Activities 0,0 0,0 0,0 0.00 - - - - -
7. Other multilateral climate change funds 0,0 0,0 0,0 0.00 - - - - -
Multilateral financial institutions, including regional development banks 7 174 210,0 9 524 973,4 3.387.387,00 4 497 327.42 - - - - -
1. World Bank 1,420,000.0 1 885 289,4 1.490.000,00 1 978 226.24 Provided ODA Grant Not applicable Not applicable
2. International Finance Corporation 0,0 0,0 0.00 0.00 - - - - -
3. African Development Bank 2 004 210,0 2 660 926,7 1.478.108,00 1 962 437.61 Provided ODA Grant Not applicable Not applicable
4. Asian Development Bank 0,0 0,0 250.000,00 331 917.15 Provided ODA Grant Not applicable Not applicable
5. European Bank for Reconstruction and Development 0,0 0,0 0.00 0.00 - - - - -
6. Inter-American Development Bank 0,0 0,0 169.279,00 224 746.20 Provided ODA Grant Not applicable Not applicable
7. Other (CAF - Andean Development Corporation) 3 750 000,0 4 978 757,3 0.00 0.00 Provided ODA Grant Not applicable Not applicable
Specialized United Nations bodies 74 262,0 98 595,3 82.536,00 109 580.46 - - - - -
1. United Nations Development Programme 37 288,0 49 506,1 39.872,00 52 936.80 Provided ODA Grant Not applicable Not applicable
2. United Nations Environment Programme 36 974,0 49 089,2 0.00 0.00 Provided ODA Grant Not applicable Not applicable
3. Other (UNFCCC core contribution - 61% eligible as ODA) 0,00 0,0 42.664,00 56 643.65 Provided ODA Grant Not applicable Not applicable

2nd Biennial Report to the United Nations Framework Convention on Climate Change 38
1. Mitigation
The bilateral projects that had Mitigation as a Principal Objective represents 93.18% in 2013 and 94,95%
of the total CC – mitigation related ODA in 2014 (Erro! A origem da referência não foi
encontrada.).
The 2013’s rates are due the financing of renewable energy projects under the Line of Credit for Cape Vert
and ongoing projects in Mozambique26. In December 2014, Portugal has approved and begun its
disbursement for two additional projects for CC mitigation: Waste Roadmap in Cape Verde and Bioenergy
use in São Tomé.
Table VIII
Climate change related ODA - Mitigation27
YEAR SIGNIFICANT OBJECTIVE PRINCIPAL OBJECTIVE BILATERAL ODA TOTAL
2013 334,270.00 € 15,605,329.00 € 15,939,599.00 €
2.10 % 97.90 % 100.00 %
2014 444.605,00 € 8.359.311,00 € 8.803.916,00 €
5,05 % 94,95 % 100 %
Source: Camões, P.I./DPC
2. Adaptation
Lately, Portugal has been paying particular attention to Adaptation to CC, specially its integration in terms
of Development Cooperation (DC), thus seeking to follow international guidelines. In this context Portugal
has been following the negotiations on Adaptation under the UNFCCC and, at EU and OECD level, in the
latter two cases, in particular with regard to the integration of Adaptation to CC in DC policy. Thus the
data in Table IX
Climate change related ODA - AdaptationErro! Marcador não definido.
YEAR SIGNIFICANT OBJECTIVE PRINCIPAL OBJECTIVE BILATERAL ODA TOTAL
2013
794,612.00 € 370,431.00 € 1,165,043.00 €
68.20 % 31.80 % 100.00 %
2014
1.729.623,00 € 855.000,00 € 2.584.628,00 €
66,92 % 33,08 % 100.00 %
Source: Camões, P.I./DPC
is representing the application of Rio Marker Adaptation to Portuguese ODA.
Table IX
Climate change related ODA - AdaptationErro! Marcador não definido.
YEAR SIGNIFICANT OBJECTIVE PRINCIPAL OBJECTIVE BILATERAL ODA TOTAL
2013
794,612.00 € 370,431.00 € 1,165,043.00 €
68.20 % 31.80 % 100.00 %
26Ssupported by the Portuguese Fast Start Implementation Initiative.
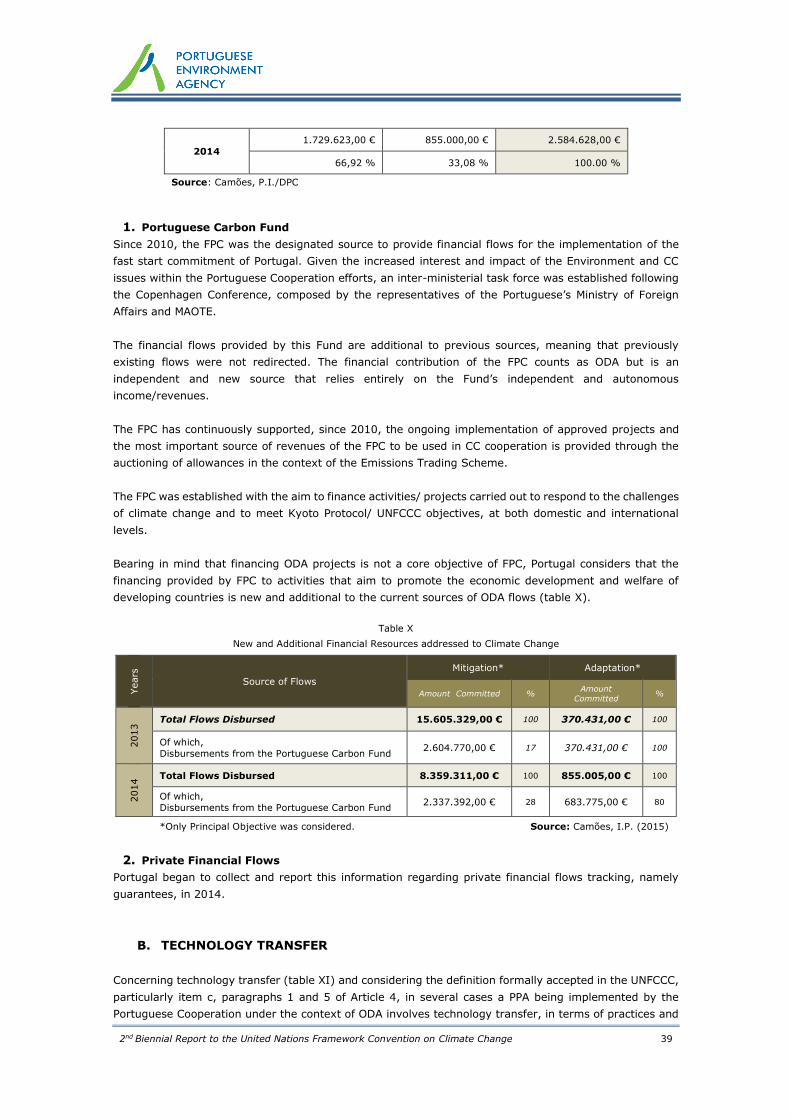
2nd Biennial Report to the United Nations Framework Convention on Climate Change 39
2014
1.729.623,00 € 855.000,00 € 2.584.628,00 €
66,92 % 33,08 % 100.00 %
Source: Camões, P.I./DPC
1. Portuguese Carbon Fund
Since 2010, the FPC was the designated source to provide financial flows for the implementation of the
fast start commitment of Portugal. Given the increased interest and impact of the Environment and CC
issues within the Portuguese Cooperation efforts, an inter-ministerial task force was established following
the Copenhagen Conference, composed by the representatives of the Portuguese’s Ministry of Foreign
Affairs and MAOTE.
The financial flows provided by this Fund are additional to previous sources, meaning that previously
existing flows were not redirected. The financial contribution of the FPC counts as ODA but is an
independent and new source that relies entirely on the Fund’s independent and autonomous
income/revenues.
The FPC has continuously supported, since 2010, the ongoing implementation of approved projects and
the most important source of revenues of the FPC to be used in CC cooperation is provided through the
auctioning of allowances in the context of the Emissions Trading Scheme.
The FPC was established with the aim to finance activities/ projects carried out to respond to the challenges
of climate change and to meet Kyoto Protocol/ UNFCCC objectives, at both domestic and international
levels.
Bearing in mind that financing ODA projects is not a core objective of FPC, Portugal considers that the
financing provided by FPC to activities that aim to promote the economic development and welfare of
developing countries is new and additional to the current sources of ODA flows (table X).
Table X
New and Additional Financial Resources addressed to Climate Change
Years
Source of Flows
Mitigation* Adaptation*
Amount Committed % Amount
Committed %
2013 Total Flows Disbursed 15.605.329,00 € 100 370.431,00 € 100
Of which,
Disbursements from the Portuguese Carbon Fund 2.604.770,00 € 17 370.431,00 € 100
2014 Total Flows Disbursed 8.359.311,00 € 100 855.005,00 € 100
Of which,
Disbursements from the Portuguese Carbon Fund 2.337.392,00 € 28 683.775,00 € 80
*Only Principal Objective was considered. Source: Camões, I.P. (2015)
2. Private Financial Flows
Portugal began to collect and report this information regarding private financial flows tracking, namely
guarantees, in 2014.
B. TECHNOLOGY TRANSFER
Concerning technology transfer (table XI) and considering the definition formally accepted in the UNFCCC,
particularly item c, paragraphs 1 and 5 of Article 4, in several cases a PPA being implemented by the
Portuguese Cooperation under the context of ODA involves technology transfer, in terms of practices and
2nd Biennial Report to the United Nations Framework Convention on Climate Change 40
appropriate processes to each area of the PPA as well as the necessary knowledge to implement these
technologies.
Notwithstanding what was already said, it becomes difficult to specify a case due to the policy of statistical
report of the OECD/ DAC that currently does not foresee a marker for the transfer of technology that
allows the qualification of the PPA in this perspective or to specifically identify the technology or
technologies transferred in each case. However that in the context of the approval process, one of the
criteria relates specifically to the issue of technology transfer.
Portuguese cooperative action in the context of tackling CChas increased significantly since the
establishment (in 2005) of the Network of CC Offices of CPLP countries, which seeks the development and
implementation of actions in the area of training and cooperation with our partner countries, including
PALOP’s and East Timor.
In this context, the Portuguese Ministry of Environment, Spatial Planning and Energy (MAOTE) started the
promotion of some activities and projects which focused on the transfer of know–how, processes and
technology for these countries, in different sectors and aligned with the strategic vision for Portuguese
Cooperation. The energy sector, and particularly renewables, has been a recurring commitment of the
Portuguese Cooperation and two worthy examples to highlight are the projects conducted in Mozambique
in the last years.
Portugal has also been involved in the translation of a technical document related to CC - a guidebook
which provides ways to identify approaches to integrate adaptation into national development policies at
a sectoral and project level, both in the urban and rural environment.
C. CAPACITY BUILDING
When it comes to Development Cooperation, Portugal has paid special attention to capacity building (see
table XI) at institutional level when prioritizing the Portuguese Speaking African Countries and East Timor
in the bilateral context or in the CPLP. This is true both for PPA that are exclusively dedicated to capacity
building or when capacity building is a component included in the PPA. The intention is to develop strengths
in existing national systems in the recipient countries in a way to produce capabilities for autonomous
problem solving.
The PPA supported by the Portuguese Cooperation usually has a strong technical assistance component
with strong focus on the development of national capacities. Portugal tries to pay special attention to the
efficiency and aid principles formally assumed in the Declaration of Paris and developed in Accra and
Busan, especially:
leadership and control by beneficiaries so they can strategically earmark their resources;
enhance existing capabilities as a starting point, avoiding the creation of parallel structures and
systematically using the national systems for aid implementation;
technical driven cooperation for the demand of partners.
Regarding the Portuguese cooperation projects on CC, several projects should be highlighted, such as:
a) 50 Villages;
b) Atlas of the renewable energy28 (developed in Mozambique by FUNAE);
c) Implementation of Pilot Projects Local Adaptation Program of Action in Mozambique.
d) Plan for Urban Drainage from the perspective of Emission Reduction and Adaptation to Climate
Change;
e) Waste Roadmap of Cape Verde
28Concluded in 2013.

2nd Biennial Report to the United Nations Framework Convention on Climate Change 41
f) Bioenergy use in São Tomé e Príncipe
Regarding projects with more than one country as a promoter, Cape Verde, Mozambique and São Tomé e
Príncipe are taking part in the two following examples:
a) Capacity Building for the Low Carbon Resilient Development Strategies;
b) Integrating Adaptation to Climate Change into Development.
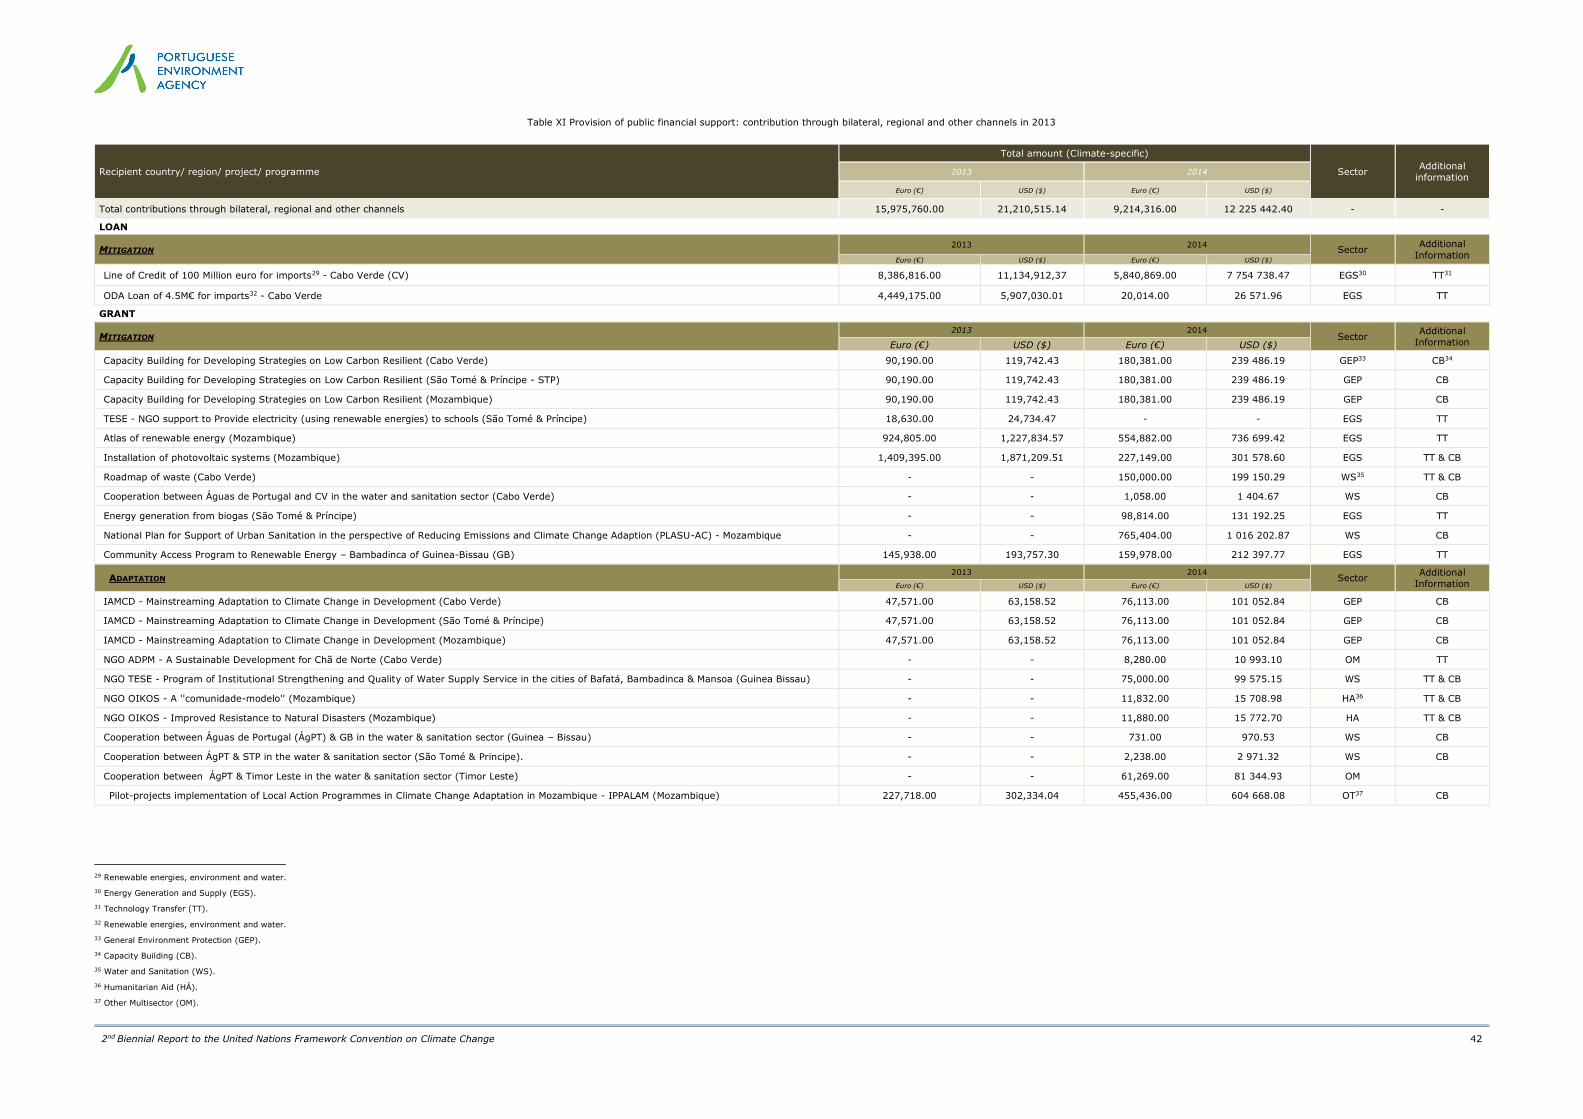
2nd Biennial Report to the United Nations Framework Convention on Climate Change 42
Table XI Provision of public financial support: contribution through bilateral, regional and other channels in 2013
Recipient country/ region/ project/ programme
Total amount (Climate-specific)
Sector Additional
information 2013 2014
Euro (€) USD ($) Euro (€) USD ($)
Total contributions through bilateral, regional and other channels 15,975,760.00 21,210,515.14 9,214,316.00 12 225 442.40 - -
LOAN
MITIGATION 2013 2014
Sector Additional
Information Euro (€) USD ($) Euro (€) USD ($)
Line of Credit of 100 Million euro for imports29 - Cabo Verde (CV) 8,386,816.00 11,134,912,37 5,840,869.00 7 754 738.47 EGS30 TT31
ODA Loan of 4.5M€ for imports32 - Cabo Verde 4,449,175.00 5,907,030.01 20,014.00 26 571.96 EGS TT
GRANT
MITIGATION 2013 2014
Sector Additional
Information Euro (€) USD ($) Euro (€) USD ($)
Capacity Building for Developing Strategies on Low Carbon Resilient (Cabo Verde) 90,190.00 119,742.43 180,381.00 239 486.19 GEP33 CB34
Capacity Building for Developing Strategies on Low Carbon Resilient (São Tomé & Príncipe - STP) 90,190.00 119,742.43 180,381.00 239 486.19 GEP CB
Capacity Building for Developing Strategies on Low Carbon Resilient (Mozambique) 90,190.00 119,742.43 180,381.00 239 486.19 GEP CB
TESE - NGO support to Provide electricity (using renewable energies) to schools (São Tomé & Príncipe) 18,630.00 24,734.47 - - EGS TT
Atlas of renewable energy (Mozambique) 924,805.00 1,227,834.57 554,882.00 736 699.42 EGS TT
Installation of photovoltaic systems (Mozambique) 1,409,395.00 1,871,209.51 227,149.00 301 578.60 EGS TT & CB
Roadmap of waste (Cabo Verde) - - 150,000.00 199 150.29 WS35 TT & CB
Cooperation between Águas de Portugal and CV in the water and sanitation sector (Cabo Verde) - - 1,058.00 1 404.67 WS CB
Energy generation from biogas (São Tomé & Príncipe) - - 98,814.00 131 192.25 EGS TT
National Plan for Support of Urban Sanitation in the perspective of Reducing Emissions and Climate Change Adaption (PLASU-AC) - Mozambique - - 765,404.00 1 016 202.87 WS CB
Community Access Program to Renewable Energy – Bambadinca of Guinea-Bissau (GB) 145,938.00 193,757.30 159,978.00 212 397.77 EGS TT
ADAPTATION 2013 2014
Sector Additional
Information Euro (€) USD ($) Euro (€) USD ($)
IAMCD - Mainstreaming Adaptation to Climate Change in Development (Cabo Verde) 47,571.00 63,158.52 76,113.00 101 052.84 GEP CB
IAMCD - Mainstreaming Adaptation to Climate Change in Development (São Tomé & Príncipe) 47,571.00 63,158.52 76,113.00 101 052.84 GEP CB
IAMCD - Mainstreaming Adaptation to Climate Change in Development (Mozambique) 47,571.00 63,158.52 76,113.00 101 052.84 GEP CB
NGO ADPM - A Sustainable Development for Chã de Norte (Cabo Verde) - - 8,280.00 10 993.10 OM TT
NGO TESE - Program of Institutional Strengthening and Quality of Water Supply Service in the cities of Bafatá, Bambadinca & Mansoa (Guinea Bissau) - - 75,000.00 99 575.15 WS TT & CB
NGO OIKOS - A ''comunidade-modelo'' (Mozambique) - - 11,832.00 15 708.98 HA36 TT & CB
NGO OIKOS - Improved Resistance to Natural Disasters (Mozambique) - - 11,880.00 15 772.70 HA TT & CB
Cooperation between Águas de Portugal (ÁgPT) & GB in the water & sanitation sector (Guinea – Bissau) - - 731.00 970.53 WS CB
Cooperation between ÁgPT & STP in the water & sanitation sector (São Tomé & Principe). - - 2,238.00 2 971.32 WS CB
Cooperation between ÁgPT & Timor Leste in the water & sanitation sector (Timor Leste) - - 61,269.00 81 344.93 OM
Pilot-projects implementation of Local Action Programmes in Climate Change Adaptation in Mozambique - IPPALAM (Mozambique) 227,718.00 302,334.04 455,436.00 604 668.08 OT37 CB
29 Renewable energies, environment and water.
30 Energy Generation and Supply (EGS).
31 Technology Transfer (TT).
32 Renewable energies, environment and water.
33 General Environment Protection (GEP).
34 Capacity Building (CB).
35 Water and Sanitation (WS).
36 Humanitarian Aid (HÁ).
37 Other Multisector (OM).

2nd Biennial Report to the United Nations Framework Convention on Climate Change 43
IX. COMMON TABLE FORMAT
Table 1a
GREENHOUSE GAS SOURCE AND SINK CATEGORIES (CO2) Base year 1990 1991 1992 1993 1994 1995 1996 1997 1998 1999
kt
1. Energy 40 210,77 40 210,77 41 747,61 46 273,47 44 936,13 45 534,61 49 042,14 46 313,16 48 925,33 53 377,37 60 705,23
A. Fuel combustion (sectoral approach) 39 946,37 39 946,37 41 481,89 45 995,95 44 641,29 44 996,94 48 334,44 45 672,74 48 151,48 52 629,37 60 004,30
1. Energy industries 16 297,31 16 297,31 16 920,35 19 990,43 18 049,12 17 233,72 19 867,23 15 910,65 16 634,12 19 253,27 25 311,46
2. Manufacturing industries and construction 9 655,92 9 655,92 9 764,09 10 201,78 10 229,15 10 544,93 10 762,28 11 021,27 12 004,94 11 926,87 12 016,14
3. Transport 9 827,58 9 827,58 10 398,02 11 260,96 11 669,21 12 267,76 12 897,15 13 542,82 14 324,81 16 070,09 16 905,64
4. Other sectors 4 061,86 4 061,86 4 286,81 4 457,19 4 615,35 4 865,97 4 726,49 5 093,86 5 087,57 5 274,83 5 691,28
5. Other 103,69 103,69 112,61 85,60 78,46 84,57 81,30 104,14 100,05 104,30 79,77
B. Fugitive emissions from fuels 264,40 264,40 265,72 277,51 294,84 537,66 707,69 640,42 773,85 748,00 700,93
1. Solid fuels 10,20 10,20 9,47 8,53 8,67 6,65 1,83 1,72 1,63 1,55 1,48
2. Oil and natural gas and other emissions from energy production 254,19 254,19 256,26 268,98 286,18 531,01 705,86 638,70 772,22 746,46 699,45
C. CO2 transport and storage NO NO NO NO NO NO NO NO NO NO NO
2. Industrial processes 4 644,91 4 644,91 4 748,38 4 452,90 4 455,13 4 515,14 5 031,97 5 122,59 5 346,29 5 423,87 5 782,90
A. Mineral industry 3 585,65 3 585,65 3 714,35 3 613,52 3 690,00 3 831,04 4 047,42 3 975,57 4 199,21 4 220,31 4 533,18
B. Chemical industry 658,41 658,41 657,95 423,48 375,42 281,34 586,25 726,52 716,05 770,31 826,70
C. Metal industry 122,13 122,13 102,41 149,36 143,27 147,19 144,82 147,90 153,36 142,08 153,09
D. Non-energy products from fuels and solvent use 250,51 250,51 247,12 239,49 220,69 230,42 229,78 248,17 251,61 264,38 243,51
E. Electronic industry - - - - - - - - - - -
F. Product uses as ODS substitutes - - - - - - - - - - -
G. Other product manufacture and use - - - - - - - - - - -
H. Other 28,21 28,21 26,55 27,04 25,75 25,15 23,69 24,43 26,06 26,79 26,42
3. Agriculture 33,87 33,87 33,87 33,87 33,87 33,87 23,84 35,03 36,92 24,95 35,73
A. Enteric fermentation - - - - - - - - - - -
B. Manure management - - - - - - - - - - -
C. Rice cultivation - - - - - - - - - - -
D. Agricultural soils - - - - - - - - - - -
E. Prescribed burning of savannas - - - - - - - - - - -
F. Field burning of agricultural residues - - - - - - - - - - -
G. Liming 12,59 12,59 12,59 12,59 12,59 12,59 12,59 12,59 12,59 12,59 12,59
H. Urea application 21,28 21,28 21,28 21,28 21,28 21,28 11,25 22,43 24,33 12,36 23,14
I. Other carbon-containing fertilizers NO NO NO NO NO NO NO NO NO NO NO
J. Other NO NO NO NO NO NO NO NO NO NO NO
4. Land Use, Land-Use Change and Forestry 1 036,95 1 036,95 990,53 -3 614,09 -4 744,47 -5 476,17 -5 258,11 -8 967,54 -9 873,47 -7 719,80 -8 758,53
A. Forest land -5 784,67 -5 784,67 -5 428,63 -9 658,72 -10 417,89 -10 561,80 -8 592,54 -11 953,58 -13 020,98 -11 025,25 -11 741,83
B. Cropland 4 335,51 4 335,51 3 994,98 3 654,50 3 313,91 3 046,95 2 817,53 2 563,59 2 309,65 2 055,76 1 945,56
C. Grassland 3 335,72 3 335,72 3 412,29 3 488,87 3 565,44 3 644,91 2 606,11 2 618,06 2 630,01 2 641,96 2 495,53
D. Wetlands IE,NO IE,NO IE,NO IE,NO IE,NO IE,NO 114,77 143,08 171,39 199,70 228,01
E. Settlements 30,49 30,49 38,01 40,55 43,02 45,57 536,42 665,00 793,78 922,55 1 051,54

2nd Biennial Report to the United Nations Framework Convention on Climate Change 44
F. Other land 865,23 865,23 513,88 162,38 -189,28 -540,80 -1 750,39 -1 815,68 -1 880,97 -1 946,18 -2 011,35
G. Harvested wood products -1 745,33 -1 745,33 -1 540,00 -1 301,67 -1 059,67 -1 111,00 -990,00 -1 188,00 -876,33 -568,33 -726,00
H. Other NO NO NO NO NO NO NO NO NO NO NO
5. Waste 6,86 6,86 6,91 6,96 7,01 7,07 7,12 7,69 8,56 7,19 6,74
A. Solid waste disposal NO NO NO NO NO NO NO NO NO NO NO
B. Biological treatment of solid waste - - - - - - - - - - -
C. Incineration and open burning of waste 6,86 6,86 6,91 6,96 7,01 7,07 7,12 7,69 8,56 7,19 6,74
D. Waste water treatment and discharge - - - - - - - - - - -
E. Other NA NA NA NA NA NA NA NA NA NA NA
6. Other (as specified in the summary table in CRF) NO NO NO NO NO NO NO NO NO NO NO
Memo items:
International bunkers 2 850,79 2 850,79 2 912,16 2 998,10 2 697,58 2 601,86 2 721,75 2 767,36 2 788,57 2 892,29 3 423,94
Aviation 1 464,82 1 464,82 1 537,05 1 626,17 1 540,79 1 549,34 1 614,17 1 598,90 1 649,55 1 744,89 1 924,58
Navigation 1 385,97 1 385,97 1 375,11 1 371,93 1 156,79 1 052,52 1 107,58 1 168,46 1 139,02 1 147,40 1 499,36
Multilateral operations NO NO NO NO NO NO NO NO NO NO NO
CO2 emissions from biomass 11 400,71 11 400,71 11 432,74 11 384,80 11 140,30 10 912,67 11 042,56 11 117,89 11 309,97 11 140,37 11 408,70
CO2 captured IE,NO IE,NO IE,NO IE,NO IE,NO IE,NO IE,NO IE,NO IE,NO IE,NO IE,NO
Long-term storage of C in waste disposal sites NE NE NE NE NE NE NE NE NE NE NE
Indirect N2O - - - - - - - - - - -
Indirect CO2 (3) 298,09 298,09 294,99 297,52 289,07 298,55 293,80 305,05 318,72 319,69 325,50
Total CO2 equivalent emissions without land use, land-use change and forestry 60 425,62 60 425,62 62 292,03 66 693,60 65 372,87 66 518,18 71 121,70 68 707,88 71 771,17 76 743,46 84 833,72
Total CO2 equivalent emissions with land use, land-use change and forestry 62 208,46 62 208,46 64 092,63 63 651,41 61 166,46 61 620,34 66 597,41 60 285,71 62 372,83 69 688,91 76 621,92
Total CO2 equivalent emissions, including indirect CO2, without land use, land-use change and forestry 45 194,51 45 194,51 46 831,76 51 064,71 49 721,22 50 389,23 54 398,86 51 783,51 54 635,82 59 153,06 66 856,10
Total CO2 equivalent emissions, including indirect CO2, with land use, land-use change and forestry 46 231,46 46 231,46 47 822,29 47 450,62 44 976,75 44 913,06 49 140,76 42 815,97 44 762,36 51 433,26 58 097,56
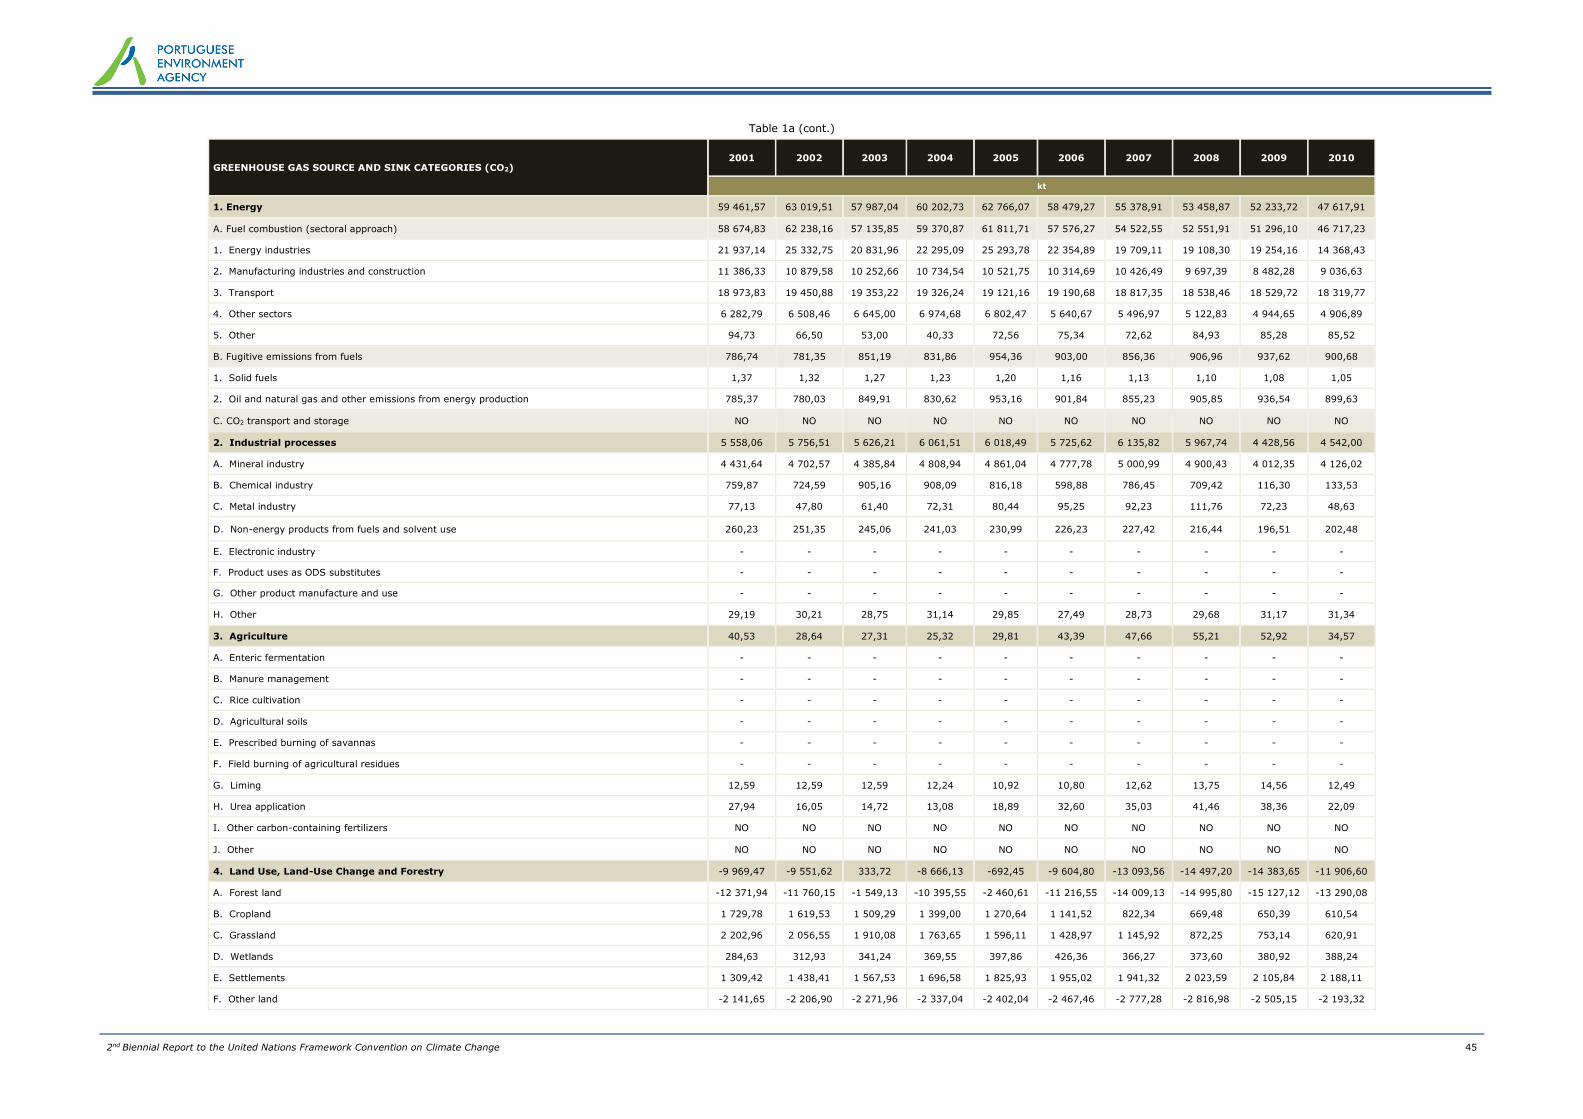
2nd Biennial Report to the United Nations Framework Convention on Climate Change 45
Table 1a (cont.)
GREENHOUSE GAS SOURCE AND SINK CATEGORIES (CO2) 2001 2002 2003 2004 2005 2006 2007 2008 2009 2010
kt
1. Energy 59 461,57 63 019,51 57 987,04 60 202,73 62 766,07 58 479,27 55 378,91 53 458,87 52 233,72 47 617,91
A. Fuel combustion (sectoral approach) 58 674,83 62 238,16 57 135,85 59 370,87 61 811,71 57 576,27 54 522,55 52 551,91 51 296,10 46 717,23
1. Energy industries 21 937,14 25 332,75 20 831,96 22 295,09 25 293,78 22 354,89 19 709,11 19 108,30 19 254,16 14 368,43
2. Manufacturing industries and construction 11 386,33 10 879,58 10 252,66 10 734,54 10 521,75 10 314,69 10 426,49 9 697,39 8 482,28 9 036,63
3. Transport 18 973,83 19 450,88 19 353,22 19 326,24 19 121,16 19 190,68 18 817,35 18 538,46 18 529,72 18 319,77
4. Other sectors 6 282,79 6 508,46 6 645,00 6 974,68 6 802,47 5 640,67 5 496,97 5 122,83 4 944,65 4 906,89
5. Other 94,73 66,50 53,00 40,33 72,56 75,34 72,62 84,93 85,28 85,52
B. Fugitive emissions from fuels 786,74 781,35 851,19 831,86 954,36 903,00 856,36 906,96 937,62 900,68
1. Solid fuels 1,37 1,32 1,27 1,23 1,20 1,16 1,13 1,10 1,08 1,05
2. Oil and natural gas and other emissions from energy production 785,37 780,03 849,91 830,62 953,16 901,84 855,23 905,85 936,54 899,63
C. CO2 transport and storage NO NO NO NO NO NO NO NO NO NO
2. Industrial processes 5 558,06 5 756,51 5 626,21 6 061,51 6 018,49 5 725,62 6 135,82 5 967,74 4 428,56 4 542,00
A. Mineral industry 4 431,64 4 702,57 4 385,84 4 808,94 4 861,04 4 777,78 5 000,99 4 900,43 4 012,35 4 126,02
B. Chemical industry 759,87 724,59 905,16 908,09 816,18 598,88 786,45 709,42 116,30 133,53
C. Metal industry 77,13 47,80 61,40 72,31 80,44 95,25 92,23 111,76 72,23 48,63
D. Non-energy products from fuels and solvent use 260,23 251,35 245,06 241,03 230,99 226,23 227,42 216,44 196,51 202,48
E. Electronic industry - - - - - - - - - -
F. Product uses as ODS substitutes - - - - - - - - - -
G. Other product manufacture and use - - - - - - - - - -
H. Other 29,19 30,21 28,75 31,14 29,85 27,49 28,73 29,68 31,17 31,34
3. Agriculture 40,53 28,64 27,31 25,32 29,81 43,39 47,66 55,21 52,92 34,57
A. Enteric fermentation - - - - - - - - - -
B. Manure management - - - - - - - - - -
C. Rice cultivation - - - - - - - - - -
D. Agricultural soils - - - - - - - - - -
E. Prescribed burning of savannas - - - - - - - - - -
F. Field burning of agricultural residues - - - - - - - - - -
G. Liming 12,59 12,59 12,59 12,24 10,92 10,80 12,62 13,75 14,56 12,49
H. Urea application 27,94 16,05 14,72 13,08 18,89 32,60 35,03 41,46 38,36 22,09
I. Other carbon-containing fertilizers NO NO NO NO NO NO NO NO NO NO
J. Other NO NO NO NO NO NO NO NO NO NO
4. Land Use, Land-Use Change and Forestry -9 969,47 -9 551,62 333,72 -8 666,13 -692,45 -9 604,80 -13 093,56 -14 497,20 -14 383,65 -11 906,60
A. Forest land -12 371,94 -11 760,15 -1 549,13 -10 395,55 -2 460,61 -11 216,55 -14 009,13 -14 995,80 -15 127,12 -13 290,08
B. Cropland 1 729,78 1 619,53 1 509,29 1 399,00 1 270,64 1 141,52 822,34 669,48 650,39 610,54
C. Grassland 2 202,96 2 056,55 1 910,08 1 763,65 1 596,11 1 428,97 1 145,92 872,25 753,14 620,91
D. Wetlands 284,63 312,93 341,24 369,55 397,86 426,36 366,27 373,60 380,92 388,24
E. Settlements 1 309,42 1 438,41 1 567,53 1 696,58 1 825,93 1 955,02 1 941,32 2 023,59 2 105,84 2 188,11
F. Other land -2 141,65 -2 206,90 -2 271,96 -2 337,04 -2 402,04 -2 467,46 -2 777,28 -2 816,98 -2 505,15 -2 193,32
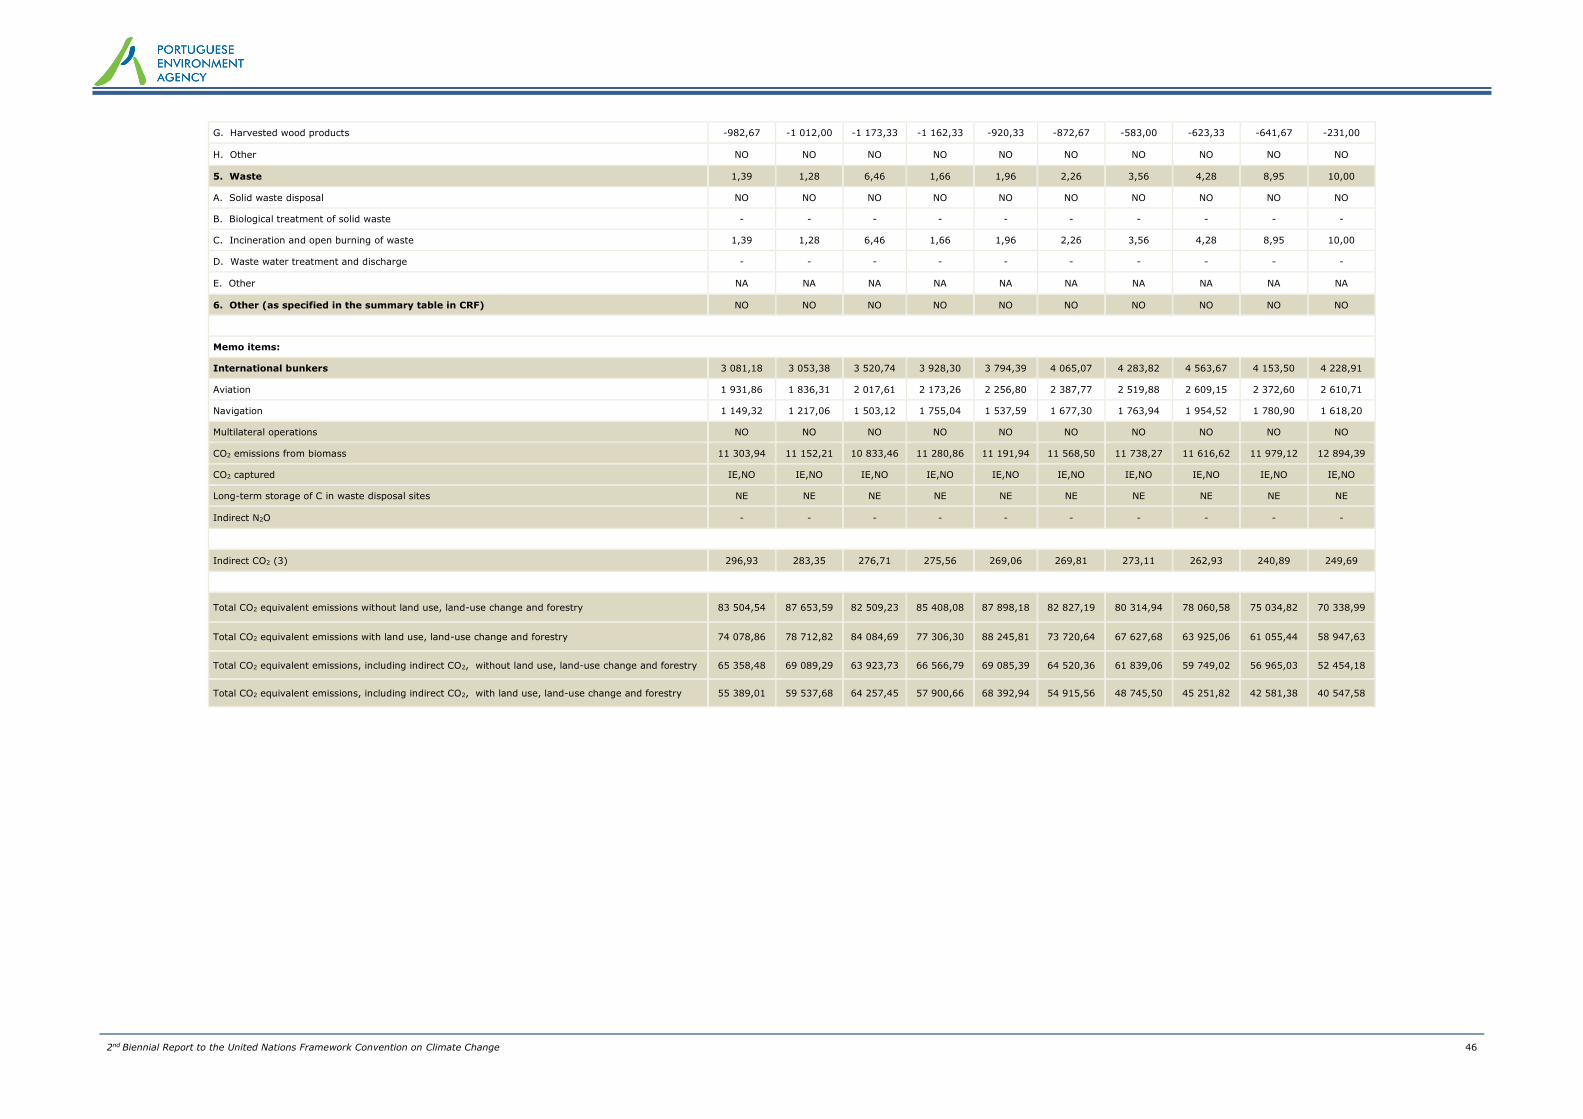
2nd Biennial Report to the United Nations Framework Convention on Climate Change 46
G. Harvested wood products -982,67 -1 012,00 -1 173,33 -1 162,33 -920,33 -872,67 -583,00 -623,33 -641,67 -231,00
H. Other NO NO NO NO NO NO NO NO NO NO
5. Waste 1,39 1,28 6,46 1,66 1,96 2,26 3,56 4,28 8,95 10,00
A. Solid waste disposal NO NO NO NO NO NO NO NO NO NO
B. Biological treatment of solid waste - - - - - - - - - -
C. Incineration and open burning of waste 1,39 1,28 6,46 1,66 1,96 2,26 3,56 4,28 8,95 10,00
D. Waste water treatment and discharge - - - - - - - - - -
E. Other NA NA NA NA NA NA NA NA NA NA
6. Other (as specified in the summary table in CRF) NO NO NO NO NO NO NO NO NO NO
Memo items:
International bunkers 3 081,18 3 053,38 3 520,74 3 928,30 3 794,39 4 065,07 4 283,82 4 563,67 4 153,50 4 228,91
Aviation 1 931,86 1 836,31 2 017,61 2 173,26 2 256,80 2 387,77 2 519,88 2 609,15 2 372,60 2 610,71
Navigation 1 149,32 1 217,06 1 503,12 1 755,04 1 537,59 1 677,30 1 763,94 1 954,52 1 780,90 1 618,20
Multilateral operations NO NO NO NO NO NO NO NO NO NO
CO2 emissions from biomass 11 303,94 11 152,21 10 833,46 11 280,86 11 191,94 11 568,50 11 738,27 11 616,62 11 979,12 12 894,39
CO2 captured IE,NO IE,NO IE,NO IE,NO IE,NO IE,NO IE,NO IE,NO IE,NO IE,NO
Long-term storage of C in waste disposal sites NE NE NE NE NE NE NE NE NE NE
Indirect N2O - - - - - - - - - -
Indirect CO2 (3) 296,93 283,35 276,71 275,56 269,06 269,81 273,11 262,93 240,89 249,69
Total CO2 equivalent emissions without land use, land-use change and forestry 83 504,54 87 653,59 82 509,23 85 408,08 87 898,18 82 827,19 80 314,94 78 060,58 75 034,82 70 338,99
Total CO2 equivalent emissions with land use, land-use change and forestry 74 078,86 78 712,82 84 084,69 77 306,30 88 245,81 73 720,64 67 627,68 63 925,06 61 055,44 58 947,63
Total CO2 equivalent emissions, including indirect CO2, without land use, land-use change and forestry 65 358,48 69 089,29 63 923,73 66 566,79 69 085,39 64 520,36 61 839,06 59 749,02 56 965,03 52 454,18
Total CO2 equivalent emissions, including indirect CO2, with land use, land-use change and forestry 55 389,01 59 537,68 64 257,45 57 900,66 68 392,94 54 915,56 48 745,50 45 251,82 42 581,38 40 547,58

2nd Biennial Report to the United Nations Framework Convention on Climate Change 47
Table 1a (cont.)
GREENHOUSE GAS SOURCE AND SINK CATEGORIES (CO2) 2011 2012 2013
Change from base to latest reported year
kt %
1. Energy 46 956,98 45 355,26 43 428,80 8,00
A. Fuel combustion (sectoral approach) 46 056,29 44 404,37 41 857,75 4,78
1. Energy industries 16 349,36 17 318,60 15 109,70 -7,29
2. Manufacturing industries and construction 8 297,97 7 358,93 7 321,46 -24,18
3. Transport 17 006,51 15 530,73 15 290,41 55,59
4. Other sectors 4 325,54 4 147,80 4 078,02 0,40
5. Other 76,90 48,32 58,16 -43,91
B. Fugitive emissions from fuels 900,69 950,88 1 571,05 494,20
1. Solid fuels 1,03 1,01 0,99 -90,33
2. Oil and natural gas and other emissions from energy production 899,66 949,87 1 570,06 517,66
C. CO2 transport and storage NO NO NO -
2. Industrial processes 3 905,59 3 734,26 3 914,81 -15,72
A. Mineral industry 3 497,85 3 363,30 3 549,80 -1,00
B. Chemical industry 130,92 98,03 89,61 -86,39
C. Metal industry 53,66 61,74 65,69 -46,21
D. Non-energy products from fuels and solvent use 194,11 181,64 179,14 -28,49
E. Electronic industry - - - -
F. Product uses as ODS substitutes - - - -
G. Other product manufacture and use - - - -
H. Other 29,06 29,56 30,56 8,33
3. Agriculture 47,97 45,72 50,84 50,11
A. Enteric fermentation - - - -
B. Manure management - - - -
C. Rice cultivation - - - -
D. Agricultural soils - - - -
E. Prescribed burning of savannas - - - -
F. Field burning of agricultural residues - - - -
G. Liming 12,59 12,59 12,59 0,00
H. Urea application 35,38 33,13 38,25 79,76
I. Other carbon-containing fertilizers NO NO NO -
J. Other NO NO NO -
4. Land Use, Land-Use Change and Forestry -14 099,00 -10 697,63 -9 908,79 -1 055,57
A. Forest land -15 219,95 -12 222,65 -12 609,66 117,98
B. Cropland 604,73 600,84 598,57 -86,19
C. Grassland 482,06 380,98 302,12 -90,94
D. Wetlands 395,57 402,89 410,22 -
E. Settlements 2 268,09 2 348,00 2 427,88 7 862,82

2nd Biennial Report to the United Nations Framework Convention on Climate Change 48
F. Other land -1 881,51 -1 569,70 -1 257,92 -245,39
G. Harvested wood products -748,00 -638,00 220,00 -112,61
H. Other NO NO NO -
5. Waste 8,01 11,19 14,02 104,22
A. Solid waste disposal NO NO NO -
B. Biological treatment of solid waste - - - -
C. Incineration and open burning of waste 8,01 11,19 14,02 104,22
D. Waste water treatment and discharge - - - -
E. Other NA NA NA -
6. Other (as specified in the summary table in CRF) NO NO NO -
Memo items:
International bunkers 4 638,22 4 803,34 4 986,03 74,90
Aviation 2 705,75 2 726,96 2 797,92 91,01
Navigation 1 932,47 2 076,37 2 188,11 57,88
Multilateral operations NO NO NO -
CO2 emissions from biomass 11 294,61 10 999,81 11 052,31 -3,06
CO2 captured IE,NO IE,NO IE,NO -
Long-term storage of C in waste disposal sites NE NE NE -
Indirect N2O - - - -
Indirect CO2 (3) 238,39 232,93 236,16 -20,78
Total CO2 equivalent emissions without land use, land-use change and forestry 68 944,15 66 955,92 65 071,46 7,69
Total CO2 equivalent emissions with land use, land-use change and forestry 55 255,25 56 801,04 55 681,89 -10,49
Total CO2 equivalent emissions, including indirect CO2, without land use, land-use change and forestry 51 156,93 49 379,35 47 644,63 5,42
Total CO2 equivalent emissions, including indirect CO2, with land use, land-use change and forestry 37 057,93 38 681,72 37 735,84 -18,38

2nd Biennial Report to the United Nations Framework Convention on Climate Change 49
Table 1b
GREENHOUSE GAS SOURCE AND SINK CATEGORIES (CH4) Base year 1990 1991 1992 1993 1994 1995 1996 1997 1998 1999
kt
1. Energy 27,62 27,62 26,96 26,78 26,43 25,70 23,99 23,62 25,37 28,12 30,21
A. Fuel combustion (sectoral approach) 22,25 22,25 21,91 21,88 21,38 21,10 21,12 21,06 20,62 20,24 19,94
1. Energy industries 0,22 0,22 0,22 0,26 0,24 0,25 0,27 0,23 0,24 0,28 0,45
2. Manufacturing industries and construction 1,32 1,32 1,41 1,48 1,46 1,48 1,57 1,59 1,72 1,74 1,83
3. Transport 4,14 4,14 4,43 4,80 4,68 4,52 4,43 4,34 4,17 4,16 4,01
4. Other sectors 16,57 16,57 15,85 15,32 14,99 14,85 14,84 14,90 14,49 14,06 13,65
5. Other 0,01 0,01 0,01 0,01 0,00 0,00 0,00 0,00 0,00 0,00 0,00
B. Fugitive emissions from fuels 5,37 5,37 5,05 4,90 5,04 4,60 2,86 2,56 4,74 7,88 10,27
1. Solid fuels 3,54 3,54 3,29 2,96 3,02 2,32 0,67 0,63 0,59 0,56 0,54
2. Oil and natural gas and other emissions from energy production 1,83 1,83 1,76 1,94 2,02 2,27 2,20 1,94 4,15 7,32 9,73
C. CO2 transport and storage - - - - - - - - - - -
2. Industrial processes 0,83 0,83 0,71 0,84 0,84 0,87 0,89 0,84 1,00 1,08 1,09
A. Mineral industry - - - - - - - - - - -
B. Chemical industry 0,57 0,57 0,46 0,50 0,51 0,54 0,55 0,50 0,60 0,67 0,66
C. Metal industry 0,22 0,22 0,20 0,27 0,28 0,27 0,27 0,28 0,32 0,32 0,36
D. Non-energy products from fuels and solvent use 0,04 0,04 0,05 0,06 0,06 0,06 0,07 0,06 0,08 0,09 0,07
E. Electronic industry - - - - - - - - - - -
F. Product uses as ODS substitutes - - - - - - - - - - -
G. Other product manufacture and use - - - - - - - - - - -
H. Other NO NO NO NO NO NO NO NO NO NO NO
3. Agriculture 197,13 197,13 200,99 199,71 194,77 200,66 207,60 207,68 204,46 209,16 213,27
A. Enteric fermentation 133,71 133,71 135,99 135,76 131,12 137,55 144,21 146,01 142,77 147,50 151,35
B. Manure management 56,58 56,58 58,78 58,87 59,11 58,53 57,87 55,88 55,58 55,74 56,27
C. Rice cultivation 5,36 5,36 4,76 3,69 3,20 3,27 4,16 4,43 4,74 4,57 4,32
D. Agricultural soils NO NO NO NO NO NO NO NO NO NO NO
E. Prescribed burning of savannas NO NO NO NO NO NO NO NO NO NO NO
F. Field burning of agricultural residues 1,49 1,49 1,45 1,39 1,34 1,32 1,36 1,36 1,37 1,35 1,33
G. Liming - - - - - - - - - - -
H. Urea application - - - - - - - - - - -
I. Other carbon-containing fertilizers - - - - - - - - - - -
J. Other NO NO NO NO NO NO NO NO NO NO NO
4. Land use, land-use change and forestry 8,20 8,20 11,06 3,52 3,01 4,81 10,26 3,88 1,57 8,20 4,26
A. Forest land 7,15 7,15 9,57 3,06 2,60 4,18 8,87 3,25 1,41 7,17 3,79
B. Cropland 0,65 0,65 0,86 0,27 0,24 0,37 0,81 0,21 0,05 0,38 0,21
C. Grassland 0,24 0,24 0,32 0,10 0,09 0,13 0,29 0,18 0,04 0,30 0,12
D. Wetlands NO NO NO NO NO NO NO NO NO NO NO
E. Settlements NO NO NO NO NO NO NO NO NO NO NO
F. Other land 0,16 0,16 0,30 0,09 0,08 0,13 0,28 0,24 0,07 0,35 0,14
G. Harvested wood products - - - - - - - - - - -
H. Other NO NO NO NO NO NO NO NO NO NO NO

2nd Biennial Report to the United Nations Framework Convention on Climate Change 50
5. Waste 227,99 227,99 235,12 244,06 250,47 262,71 271,62 270,55 279,69 290,06 292,45
A. Solid waste disposal 109,14 109,14 114,31 120,21 126,24 132,41 138,83 145,40 152,36 159,89 168,93
B. Biological treatment of solid waste 0,45 0,45 0,18 0,23 0,29 0,62 0,82 0,82 0,84 0,86 0,90
C. Incineration and open burning of waste 0,01 0,01 0,01 0,01 0,01 0,01 0,01 0,01 0,01 0,01 0,01
D. Waste water treatment and discharge 118,39 118,39 120,61 123,61 123,92 129,66 131,96 124,32 126,48 129,30 122,61
E. Other NO NO NO NO NO NO NO NO NO NO NO
6. Other (as specified in the summary table in CRF) NO NO NO NO NO NO NO NO NO NO NO
Total CH4 emissions without CH4 from LULUCF 453,57 453,57 463,78 471,39 472,51 489,94 504,09 502,70 510,53 528,41 537,03
Total CH4 emissions with CH4 from LULUCF 461,77 461,77 474,83 474,92 475,52 494,75 514,35 506,58 512,09 536,62 541,29
Memo items:
International bunkers 0,25 0,25 0,25 0,26 0,23 0,22 0,23 0,23 0,23 0,24 0,29
Aviation 0,12 0,12 0,13 0,13 0,12 0,12 0,13 0,12 0,12 0,14 0,15
Navigation 0,13 0,13 0,13 0,13 0,11 0,10 0,10 0,11 0,11 0,11 0,14
Multilateral operations NO NO NO NO NO NO NO NO NO NO NO
CO2 emissions from biomass - - - - - - - - - - -
CO2 captured - - - - - - - - - - -
Long-term storage of C in waste disposal sites - - - - - - - - - - -
Indirect N2O - - - - - - - - - - -
Indirect CO2 (3) - - - - - - - - - - -
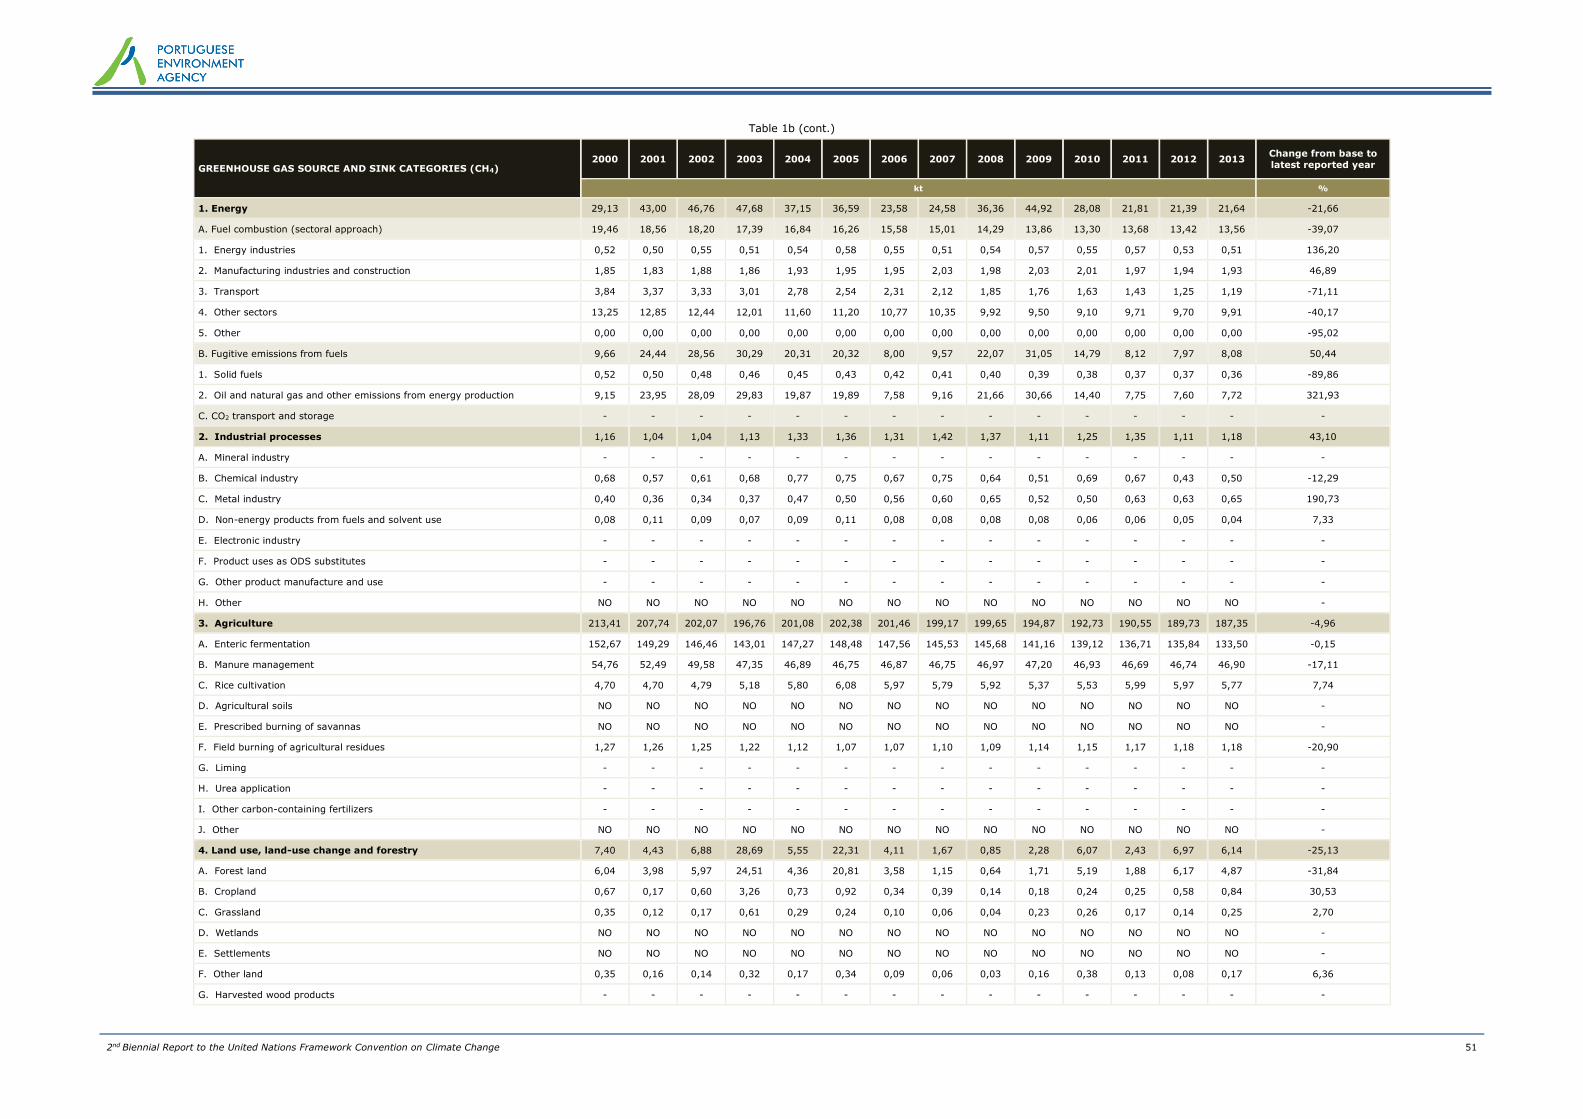
2nd Biennial Report to the United Nations Framework Convention on Climate Change 51
Table 1b (cont.)
GREENHOUSE GAS SOURCE AND SINK CATEGORIES (CH4) 2000 2001 2002 2003 2004 2005 2006 2007 2008 2009 2010 2011 2012 2013
Change from base to
latest reported year
kt %
1. Energy 29,13 43,00 46,76 47,68 37,15 36,59 23,58 24,58 36,36 44,92 28,08 21,81 21,39 21,64 -21,66
A. Fuel combustion (sectoral approach) 19,46 18,56 18,20 17,39 16,84 16,26 15,58 15,01 14,29 13,86 13,30 13,68 13,42 13,56 -39,07
1. Energy industries 0,52 0,50 0,55 0,51 0,54 0,58 0,55 0,51 0,54 0,57 0,55 0,57 0,53 0,51 136,20
2. Manufacturing industries and construction 1,85 1,83 1,88 1,86 1,93 1,95 1,95 2,03 1,98 2,03 2,01 1,97 1,94 1,93 46,89
3. Transport 3,84 3,37 3,33 3,01 2,78 2,54 2,31 2,12 1,85 1,76 1,63 1,43 1,25 1,19 -71,11
4. Other sectors 13,25 12,85 12,44 12,01 11,60 11,20 10,77 10,35 9,92 9,50 9,10 9,71 9,70 9,91 -40,17
5. Other 0,00 0,00 0,00 0,00 0,00 0,00 0,00 0,00 0,00 0,00 0,00 0,00 0,00 0,00 -95,02
B. Fugitive emissions from fuels 9,66 24,44 28,56 30,29 20,31 20,32 8,00 9,57 22,07 31,05 14,79 8,12 7,97 8,08 50,44
1. Solid fuels 0,52 0,50 0,48 0,46 0,45 0,43 0,42 0,41 0,40 0,39 0,38 0,37 0,37 0,36 -89,86
2. Oil and natural gas and other emissions from energy production 9,15 23,95 28,09 29,83 19,87 19,89 7,58 9,16 21,66 30,66 14,40 7,75 7,60 7,72 321,93
C. CO2 transport and storage - - - - - - - - - - - - - - -
2. Industrial processes 1,16 1,04 1,04 1,13 1,33 1,36 1,31 1,42 1,37 1,11 1,25 1,35 1,11 1,18 43,10
A. Mineral industry - - - - - - - - - - - - - - -
B. Chemical industry 0,68 0,57 0,61 0,68 0,77 0,75 0,67 0,75 0,64 0,51 0,69 0,67 0,43 0,50 -12,29
C. Metal industry 0,40 0,36 0,34 0,37 0,47 0,50 0,56 0,60 0,65 0,52 0,50 0,63 0,63 0,65 190,73
D. Non-energy products from fuels and solvent use 0,08 0,11 0,09 0,07 0,09 0,11 0,08 0,08 0,08 0,08 0,06 0,06 0,05 0,04 7,33
E. Electronic industry - - - - - - - - - - - - - - -
F. Product uses as ODS substitutes - - - - - - - - - - - - - - -
G. Other product manufacture and use - - - - - - - - - - - - - - -
H. Other NO NO NO NO NO NO NO NO NO NO NO NO NO NO -
3. Agriculture 213,41 207,74 202,07 196,76 201,08 202,38 201,46 199,17 199,65 194,87 192,73 190,55 189,73 187,35 -4,96
A. Enteric fermentation 152,67 149,29 146,46 143,01 147,27 148,48 147,56 145,53 145,68 141,16 139,12 136,71 135,84 133,50 -0,15
B. Manure management 54,76 52,49 49,58 47,35 46,89 46,75 46,87 46,75 46,97 47,20 46,93 46,69 46,74 46,90 -17,11
C. Rice cultivation 4,70 4,70 4,79 5,18 5,80 6,08 5,97 5,79 5,92 5,37 5,53 5,99 5,97 5,77 7,74
D. Agricultural soils NO NO NO NO NO NO NO NO NO NO NO NO NO NO -
E. Prescribed burning of savannas NO NO NO NO NO NO NO NO NO NO NO NO NO NO -
F. Field burning of agricultural residues 1,27 1,26 1,25 1,22 1,12 1,07 1,07 1,10 1,09 1,14 1,15 1,17 1,18 1,18 -20,90
G. Liming - - - - - - - - - - - - - - -
H. Urea application - - - - - - - - - - - - - - -
I. Other carbon-containing fertilizers - - - - - - - - - - - - - - -
J. Other NO NO NO NO NO NO NO NO NO NO NO NO NO NO -
4. Land use, land-use change and forestry 7,40 4,43 6,88 28,69 5,55 22,31 4,11 1,67 0,85 2,28 6,07 2,43 6,97 6,14 -25,13
A. Forest land 6,04 3,98 5,97 24,51 4,36 20,81 3,58 1,15 0,64 1,71 5,19 1,88 6,17 4,87 -31,84
B. Cropland 0,67 0,17 0,60 3,26 0,73 0,92 0,34 0,39 0,14 0,18 0,24 0,25 0,58 0,84 30,53
C. Grassland 0,35 0,12 0,17 0,61 0,29 0,24 0,10 0,06 0,04 0,23 0,26 0,17 0,14 0,25 2,70
D. Wetlands NO NO NO NO NO NO NO NO NO NO NO NO NO NO -
E. Settlements NO NO NO NO NO NO NO NO NO NO NO NO NO NO -
F. Other land 0,35 0,16 0,14 0,32 0,17 0,34 0,09 0,06 0,03 0,16 0,38 0,13 0,08 0,17 6,36
G. Harvested wood products - - - - - - - - - - - - - - -
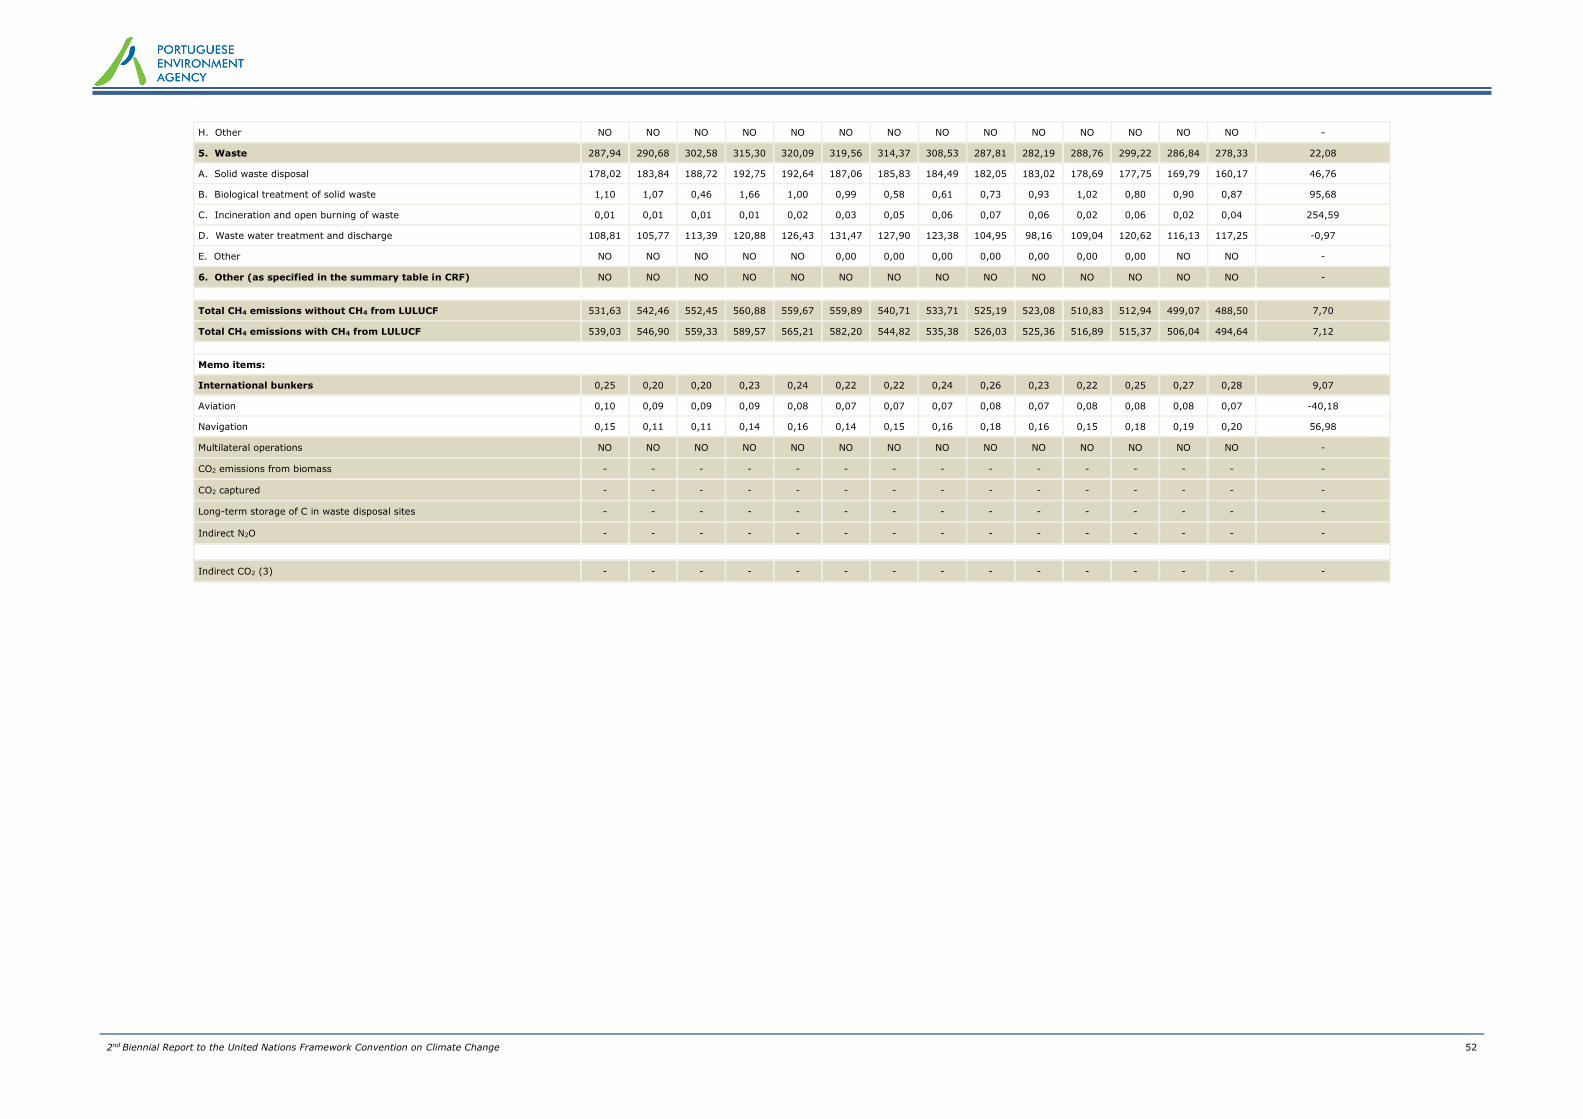
2nd Biennial Report to the United Nations Framework Convention on Climate Change 52
H. Other NO NO NO NO NO NO NO NO NO NO NO NO NO NO -
5. Waste 287,94 290,68 302,58 315,30 320,09 319,56 314,37 308,53 287,81 282,19 288,76 299,22 286,84 278,33 22,08
A. Solid waste disposal 178,02 183,84 188,72 192,75 192,64 187,06 185,83 184,49 182,05 183,02 178,69 177,75 169,79 160,17 46,76
B. Biological treatment of solid waste 1,10 1,07 0,46 1,66 1,00 0,99 0,58 0,61 0,73 0,93 1,02 0,80 0,90 0,87 95,68
C. Incineration and open burning of waste 0,01 0,01 0,01 0,01 0,02 0,03 0,05 0,06 0,07 0,06 0,02 0,06 0,02 0,04 254,59
D. Waste water treatment and discharge 108,81 105,77 113,39 120,88 126,43 131,47 127,90 123,38 104,95 98,16 109,04 120,62 116,13 117,25 -0,97
E. Other NO NO NO NO NO 0,00 0,00 0,00 0,00 0,00 0,00 0,00 NO NO -
6. Other (as specified in the summary table in CRF) NO NO NO NO NO NO NO NO NO NO NO NO NO NO -
Total CH4 emissions without CH4 from LULUCF 531,63 542,46 552,45 560,88 559,67 559,89 540,71 533,71 525,19 523,08 510,83 512,94 499,07 488,50 7,70
Total CH4 emissions with CH4 from LULUCF 539,03 546,90 559,33 589,57 565,21 582,20 544,82 535,38 526,03 525,36 516,89 515,37 506,04 494,64 7,12
Memo items:
International bunkers 0,25 0,20 0,20 0,23 0,24 0,22 0,22 0,24 0,26 0,23 0,22 0,25 0,27 0,28 9,07
Aviation 0,10 0,09 0,09 0,09 0,08 0,07 0,07 0,07 0,08 0,07 0,08 0,08 0,08 0,07 -40,18
Navigation 0,15 0,11 0,11 0,14 0,16 0,14 0,15 0,16 0,18 0,16 0,15 0,18 0,19 0,20 56,98
Multilateral operations NO NO NO NO NO NO NO NO NO NO NO NO NO NO -
CO2 emissions from biomass - - - - - - - - - - - - - - -
CO2 captured - - - - - - - - - - - - - - -
Long-term storage of C in waste disposal sites - - - - - - - - - - - - - - -
Indirect N2O - - - - - - - - - - - - - - -
Indirect CO2 (3) - - - - - - - - - - - - - - -

2nd Biennial Report to the United Nations Framework Convention on Climate Change 53
Table 1c
GREENHOUSE GAS SOURCE AND SINK CATEGORIES (N2O) Base yeara 1990 1991 1992 1993 1994 1995 1996 1997 1998 1999
Kt
1. Energy 1,63 1,63 1,69 1,76 2,07 2,33 2,57 2,85 2,76 2,66 2,90
A. Fuel combustion (sectoral approach) 1,63 1,63 1,69 1,75 2,06 2,32 2,56 2,84 2,75 2,65 2,89
1. Energy industries 0,15 0,15 0,16 0,18 0,18 0,18 0,21 0,18 0,19 0,22 0,43
2. Manufacturing industries and construction 0,36 0,36 0,37 0,38 0,38 0,38 0,40 0,40 0,43 0,42 0,42
3. Transport 0,30 0,30 0,32 0,35 0,63 0,88 1,10 1,33 1,33 1,39 1,41
4. Other sectors 0,81 0,81 0,84 0,84 0,87 0,87 0,85 0,92 0,80 0,62 0,63
5. Other 0,00 0,00 0,00 0,00 0,00 0,00 0,00 0,00 0,00 0,00 0,00
B. Fugitive emissions from fuels 0,01 0,01 0,01 0,01 0,01 0,01 0,01 0,01 0,01 0,01 0,01
1. Solid fuels NO NO NO NO NO NO NO NO NO NO NO
2. Oil and natural gas and other emissions from energy production 0,01 0,01 0,01 0,01 0,01 0,01 0,01 0,01 0,01 0,01 0,01
C. CO2 transport and storage - - - - - - - - - - -
2. Industrial processes 1,95 1,95 1,83 1,79 1,46 1,24 1,73 1,78 1,84 2,04 1,91
A. Mineral industry - - - - - - - - - - -
B. Chemical industry 1,67 1,67 1,55 1,53 1,20 0,99 1,50 1,54 1,60 1,80 1,67
C. Metal industry NO NO NO NO NO NO NO NO NO NO NO
D. Non-energy products from fuels and solvent use NO NO NO NO NO NO NO NO NO NO NO
E. Electronic industry - - - - - - - - - - -
F. Product uses as ODS substitutes - - - - - - - - - - -
G. Other product manufacture and use 0,28 0,28 0,27 0,27 0,26 0,25 0,24 0,24 0,24 0,23 0,23
H. Other NO NO NO NO NO NO NO NO NO NO NO
3. Agriculture 8,76 8,76 8,70 8,57 8,52 8,57 8,46 8,93 8,90 8,65 8,81
A. Enteric fermentation - - - - - - - - - - -
B. Manure management 0,84 0,84 0,83 0,82 0,82 0,82 0,81 0,81 0,80 0,81 0,85
C. Rice cultivation - - - - - - - - - - -
D. Agricultural soils 7,85 7,85 7,80 7,67 7,64 7,69 7,58 8,06 8,03 7,77 7,89
E. Prescribed burning of savannas NO NO NO NO NO NO NO NO NO NO NO
F. Field burning of agricultural residues 0,07 0,07 0,07 0,07 0,07 0,07 0,07 0,07 0,07 0,06 0,06
G. Liming - - - - - - - - - - -
H. Urea application - - - - - - - - - - -
I. Other carbon containing fertilizers - - - - - - - - - - -
J. Other NO NO NO NO NO NO NO NO NO NO NO
4. Land use, land-use change and forestry 1,81 1,81 1,79 1,62 1,55 1,54 1,60 1,50 1,46 1,54 1,48
A. Forest land 0,18 0,18 0,22 0,13 0,13 0,15 0,22 0,15 0,13 0,21 0,17
B. Cropland 1,08 1,08 1,00 0,90 0,81 0,75 0,69 0,61 0,55 0,48 0,45
C. Grassland 0,54 0,54 0,57 0,58 0,60 0,63 0,63 0,63 0,63 0,64 0,60
D. Wetlands IE,NO IE,NO IE,NO IE,NO IE,NO IE,NO 0,01 0,02 0,02 0,03 0,04
E. Settlements 0,01 0,01 0,01 0,01 0,01 0,01 0,05 0,08 0,12 0,15 0,19
F. Other land 0,00 0,00 0,00 0,00 0,00 0,00 0,01 0,01 0,01 0,02 0,02
G. Harvested wood products - - - - - - - - - - -
H. Other NO NO NO NO NO NO NO NO NO NO NO

2nd Biennial Report to the United Nations Framework Convention on Climate Change 54
5. Waste 1,71 1,71 1,74 1,77 1,80 1,88 1,90 1,87 1,94 2,03 2,06
A. Solid waste disposal - - - - - - - - - - -
B. Biological treatment of solid waste 0,03 0,03 0,01 0,02 0,02 0,05 0,06 0,06 0,06 0,06 0,07
C. Incineration and open burning of waste 0,00 0,00 0,00 0,00 0,00 0,00 0,00 0,00 0,00 0,00 0,00
D. Waste water treatment and discharge 1,68 1,68 1,72 1,75 1,78 1,83 1,83 1,81 1,88 1,96 1,99
E. Other NO NO NO NO NO NO NO NO NO NO NO
6. Other (as specified in the summary table in CRF) NO NO NO NO NO NO NO NO NO NO NO
Total direct N2O emissions without N2O from LULUCF 14,06 14,06 13,96 13,90 13,85 14,02 14,66 15,43 15,44 15,37 15,68
Total direct N2O emissions with N2O from LULUCF 15,88 15,88 15,75 15,52 15,41 15,56 16,26 16,93 16,91 16,92 17,16
Memo items:
International bunkers 0,08 0,08 0,08 0,08 0,07 0,07 0,07 0,08 0,08 0,08 0,09
Aviation 0,04 0,04 0,04 0,05 0,04 0,04 0,05 0,05 0,05 0,05 0,05
Navigation 0,04 0,04 0,04 0,04 0,03 0,03 0,03 0,03 0,03 0,03 0,04
Multilateral operations NO NO NO NO NO NO NO NO NO NO NO
CO2 emissions from biomass - - - - - - - - - - -
CO2 captured - - - - - - - - - - -
Long-term storage of C in waste disposal sites - - - - - - - - - - -
Indirect N2O NE,NO NE,NO NE,NO NE,NO NE,NO NE,NO NE,NO NE,NO NE,NO NE,NO NE,NO
Indirect CO2 (3) - - - - - - - - - - -
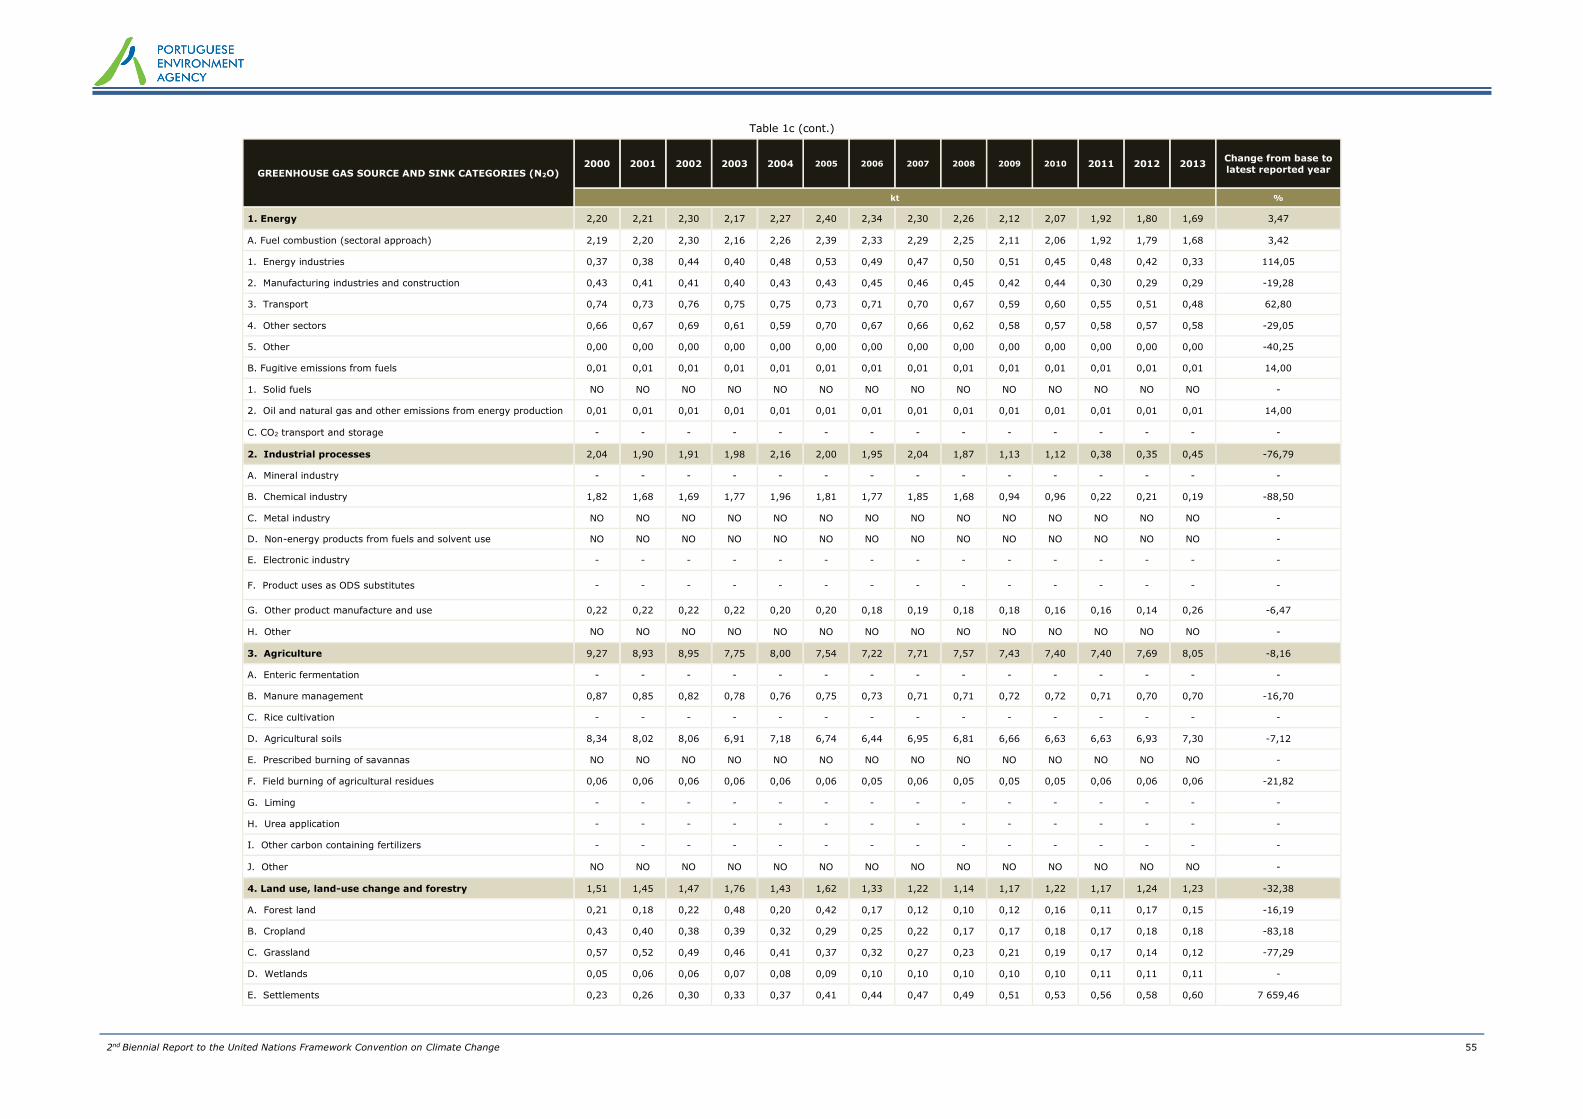
2nd Biennial Report to the United Nations Framework Convention on Climate Change 55
Table 1c (cont.)
GREENHOUSE GAS SOURCE AND SINK CATEGORIES (N2O) 2000 2001 2002 2003 2004 2005 2006 2007 2008 2009 2010 2011 2012 2013
Change from base to
latest reported year
kt %
1. Energy 2,20 2,21 2,30 2,17 2,27 2,40 2,34 2,30 2,26 2,12 2,07 1,92 1,80 1,69 3,47
A. Fuel combustion (sectoral approach) 2,19 2,20 2,30 2,16 2,26 2,39 2,33 2,29 2,25 2,11 2,06 1,92 1,79 1,68 3,42
1. Energy industries 0,37 0,38 0,44 0,40 0,48 0,53 0,49 0,47 0,50 0,51 0,45 0,48 0,42 0,33 114,05
2. Manufacturing industries and construction 0,43 0,41 0,41 0,40 0,43 0,43 0,45 0,46 0,45 0,42 0,44 0,30 0,29 0,29 -19,28
3. Transport 0,74 0,73 0,76 0,75 0,75 0,73 0,71 0,70 0,67 0,59 0,60 0,55 0,51 0,48 62,80
4. Other sectors 0,66 0,67 0,69 0,61 0,59 0,70 0,67 0,66 0,62 0,58 0,57 0,58 0,57 0,58 -29,05
5. Other 0,00 0,00 0,00 0,00 0,00 0,00 0,00 0,00 0,00 0,00 0,00 0,00 0,00 0,00 -40,25
B. Fugitive emissions from fuels 0,01 0,01 0,01 0,01 0,01 0,01 0,01 0,01 0,01 0,01 0,01 0,01 0,01 0,01 14,00
1. Solid fuels NO NO NO NO NO NO NO NO NO NO NO NO NO NO -
2. Oil and natural gas and other emissions from energy production 0,01 0,01 0,01 0,01 0,01 0,01 0,01 0,01 0,01 0,01 0,01 0,01 0,01 0,01 14,00
C. CO2 transport and storage - - - - - - - - - - - - - - -
2. Industrial processes 2,04 1,90 1,91 1,98 2,16 2,00 1,95 2,04 1,87 1,13 1,12 0,38 0,35 0,45 -76,79
A. Mineral industry - - - - - - - - - - - - - - -
B. Chemical industry 1,82 1,68 1,69 1,77 1,96 1,81 1,77 1,85 1,68 0,94 0,96 0,22 0,21 0,19 -88,50
C. Metal industry NO NO NO NO NO NO NO NO NO NO NO NO NO NO -
D. Non-energy products from fuels and solvent use NO NO NO NO NO NO NO NO NO NO NO NO NO NO -
E. Electronic industry - - - - - - - - - - - - - - -
F. Product uses as ODS substitutes - - - - - - - - - - - - - - -
G. Other product manufacture and use 0,22 0,22 0,22 0,22 0,20 0,20 0,18 0,19 0,18 0,18 0,16 0,16 0,14 0,26 -6,47
H. Other NO NO NO NO NO NO NO NO NO NO NO NO NO NO -
3. Agriculture 9,27 8,93 8,95 7,75 8,00 7,54 7,22 7,71 7,57 7,43 7,40 7,40 7,69 8,05 -8,16
A. Enteric fermentation - - - - - - - - - - - - - - -
B. Manure management 0,87 0,85 0,82 0,78 0,76 0,75 0,73 0,71 0,71 0,72 0,72 0,71 0,70 0,70 -16,70
C. Rice cultivation - - - - - - - - - - - - - - -
D. Agricultural soils 8,34 8,02 8,06 6,91 7,18 6,74 6,44 6,95 6,81 6,66 6,63 6,63 6,93 7,30 -7,12
E. Prescribed burning of savannas NO NO NO NO NO NO NO NO NO NO NO NO NO NO -
F. Field burning of agricultural residues 0,06 0,06 0,06 0,06 0,06 0,06 0,05 0,06 0,05 0,05 0,05 0,06 0,06 0,06 -21,82
G. Liming - - - - - - - - - - - - - - -
H. Urea application - - - - - - - - - - - - - - -
I. Other carbon containing fertilizers - - - - - - - - - - - - - - -
J. Other NO NO NO NO NO NO NO NO NO NO NO NO NO NO -
4. Land use, land-use change and forestry 1,51 1,45 1,47 1,76 1,43 1,62 1,33 1,22 1,14 1,17 1,22 1,17 1,24 1,23 -32,38
A. Forest land 0,21 0,18 0,22 0,48 0,20 0,42 0,17 0,12 0,10 0,12 0,16 0,11 0,17 0,15 -16,19
B. Cropland 0,43 0,40 0,38 0,39 0,32 0,29 0,25 0,22 0,17 0,17 0,18 0,17 0,18 0,18 -83,18
C. Grassland 0,57 0,52 0,49 0,46 0,41 0,37 0,32 0,27 0,23 0,21 0,19 0,17 0,14 0,12 -77,29
D. Wetlands 0,05 0,06 0,06 0,07 0,08 0,09 0,10 0,10 0,10 0,10 0,10 0,11 0,11 0,11 -
E. Settlements 0,23 0,26 0,30 0,33 0,37 0,41 0,44 0,47 0,49 0,51 0,53 0,56 0,58 0,60 7 659,46
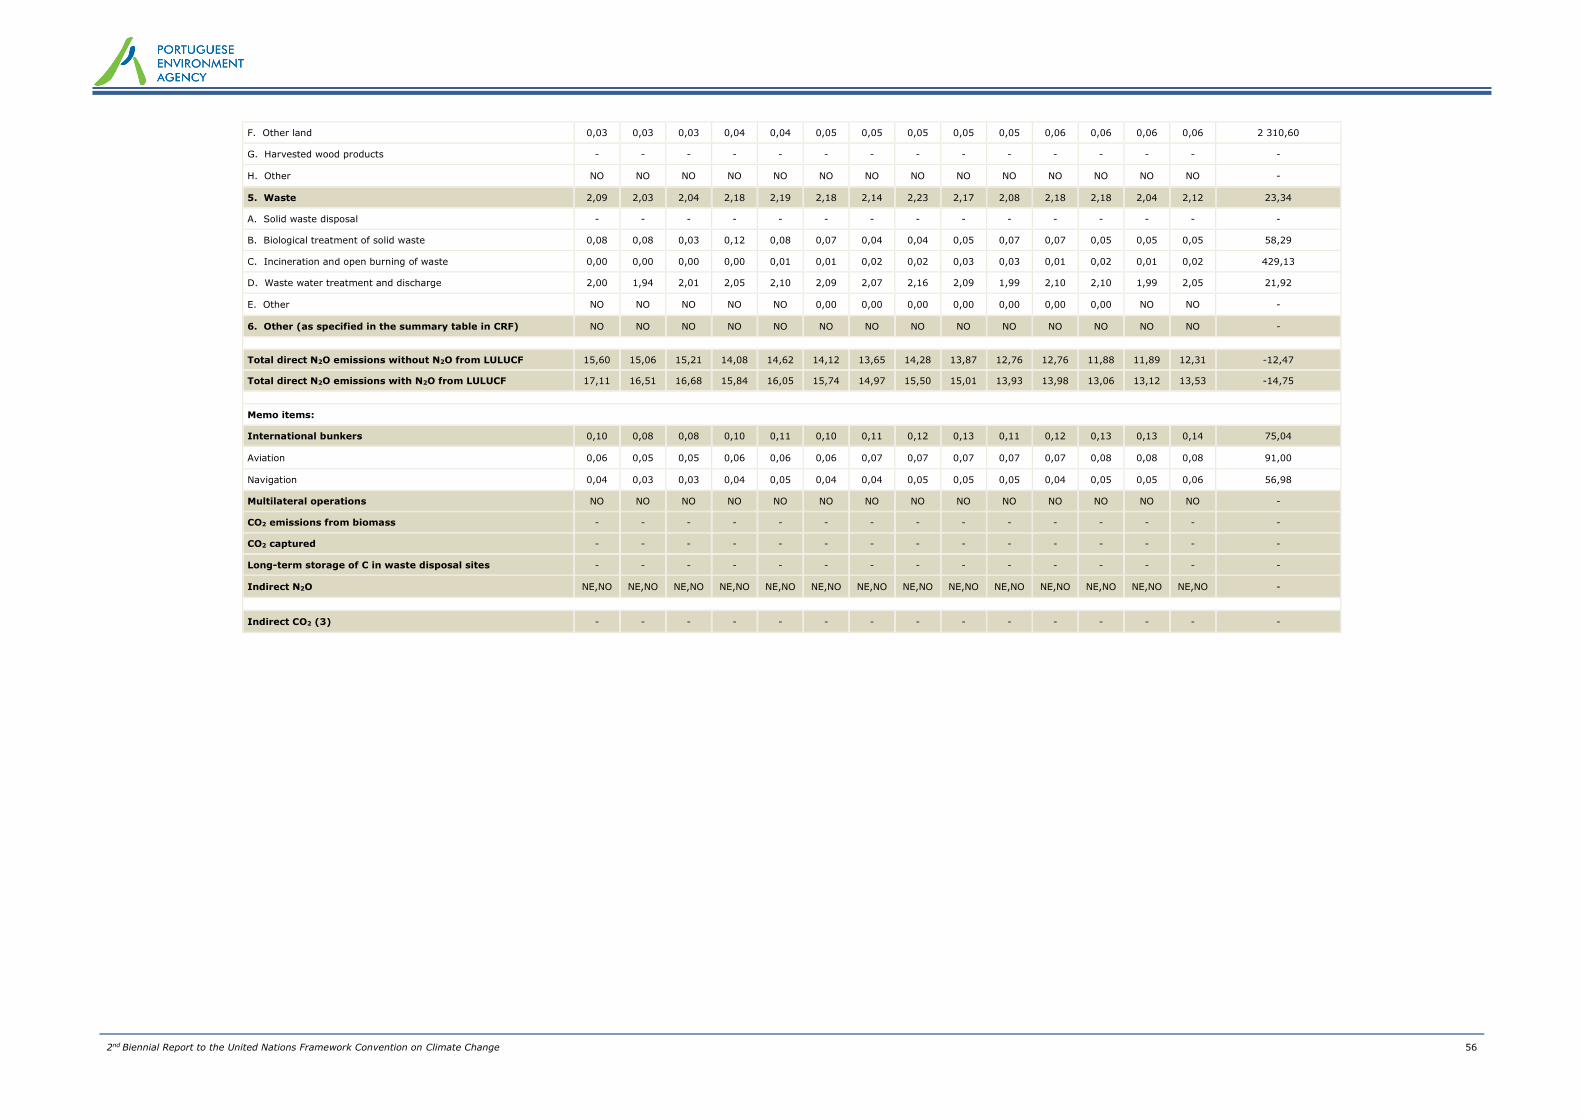
2nd Biennial Report to the United Nations Framework Convention on Climate Change 56
F. Other land 0,03 0,03 0,03 0,04 0,04 0,05 0,05 0,05 0,05 0,05 0,06 0,06 0,06 0,06 2 310,60
G. Harvested wood products - - - - - - - - - - - - - - -
H. Other NO NO NO NO NO NO NO NO NO NO NO NO NO NO -
5. Waste 2,09 2,03 2,04 2,18 2,19 2,18 2,14 2,23 2,17 2,08 2,18 2,18 2,04 2,12 23,34
A. Solid waste disposal - - - - - - - - - - - - - - -
B. Biological treatment of solid waste 0,08 0,08 0,03 0,12 0,08 0,07 0,04 0,04 0,05 0,07 0,07 0,05 0,05 0,05 58,29
C. Incineration and open burning of waste 0,00 0,00 0,00 0,00 0,01 0,01 0,02 0,02 0,03 0,03 0,01 0,02 0,01 0,02 429,13
D. Waste water treatment and discharge 2,00 1,94 2,01 2,05 2,10 2,09 2,07 2,16 2,09 1,99 2,10 2,10 1,99 2,05 21,92
E. Other NO NO NO NO NO 0,00 0,00 0,00 0,00 0,00 0,00 0,00 NO NO -
6. Other (as specified in the summary table in CRF) NO NO NO NO NO NO NO NO NO NO NO NO NO NO -
Total direct N2O emissions without N2O from LULUCF 15,60 15,06 15,21 14,08 14,62 14,12 13,65 14,28 13,87 12,76 12,76 11,88 11,89 12,31 -12,47
Total direct N2O emissions with N2O from LULUCF 17,11 16,51 16,68 15,84 16,05 15,74 14,97 15,50 15,01 13,93 13,98 13,06 13,12 13,53 -14,75
Memo items:
International bunkers 0,10 0,08 0,08 0,10 0,11 0,10 0,11 0,12 0,13 0,11 0,12 0,13 0,13 0,14 75,04
Aviation 0,06 0,05 0,05 0,06 0,06 0,06 0,07 0,07 0,07 0,07 0,07 0,08 0,08 0,08 91,00
Navigation 0,04 0,03 0,03 0,04 0,05 0,04 0,04 0,05 0,05 0,05 0,04 0,05 0,05 0,06 56,98
Multilateral operations NO NO NO NO NO NO NO NO NO NO NO NO NO NO -
CO2 emissions from biomass - - - - - - - - - - - - - - -
CO2 captured - - - - - - - - - - - - - - -
Long-term storage of C in waste disposal sites - - - - - - - - - - - - - - -
Indirect N2O NE,NO NE,NO NE,NO NE,NO NE,NO NE,NO NE,NO NE,NO NE,NO NE,NO NE,NO NE,NO NE,NO NE,NO -
Indirect CO2 (3) - - - - - - - - - - - - - - -

2nd Biennial Report to the United Nations Framework Convention on Climate Change 57
Table 1d
GREENHOUSE GAS SOURCE AND SINK CATEGORIES
(HFCs, PFCs, SF6, and NF3)
Base yeara 1990 1991 1992 1993 1994 1995 1996 1997 1998 1999 2000
kt
Emissions of HFCs and PFCs - (kt CO2 equivalent) NE,NA,NO NE,NA,NO NE,NA,NO NE,NA,NO NE,NA,NO NE,NA,NO 30,65 48,91 71,47 100,63 185,93 288,45
Emissions of HFCs - (kt CO2 equivalent) NE,NA,NO NE,NA,NO NE,NA,NO NE,NA,NO NE,NA,NO NE,NA,NO 30,65 48,91 71,47 100,63 185,93 288,45
HFC-23 NE,NO NE,NO NE,NO NE,NO NE,NO NE,NO NO NO NO NO 0,00 0,00
HFC-32 NE,NA,NO NE,NA,NO NE,NA,NO NE,NA,NO NE,NA,NO NE,NA,NO IE,NO IE,NO IE,NO IE,NO 0,00 0,01
HFC-41 NO NO NO NO NO NO NO NO NO NO NO NO
HFC-43-10mee NO NO NO NO NO NO NO NO NO NO NO NO
HFC-125 NE,NA,NO NE,NA,NO NE,NA,NO NE,NA,NO NE,NA,NO NE,NA,NO IE,NO 0,00 0,00 0,00 0,01 0,02
HFC-134 NO NO NO NO NO NO NO NO NO NO NO NO
HFC-134a NA,NE,NO NA,NE,NO NA,NE,NO NA,NE,NO NA,NE,NO NA,NE,NO 0,02 0,03 0,04 0,06 0,08 0,10
HFC-143 NO NO NO NO NO NO NO NO NO NO NO NO
HFC-143a NA,NE,NO NA,NE,NO NA,NE,NO NA,NE,NO NA,NE,NO NA,NE,NO IE,NO 0,00 0,00 0,00 0,00 0,01
HFC-152 NO NO NO NO NO NO NO NO NO NO NO NO
HFC-152a NE,NO NE,NO NE,NO NE,NO NE,NO NE,NO 0,01 0,01 0,02 0,04 0,06 0,09
HFC-161 NO NO NO NO NO NO NO NO NO NO NO NO
HFC-227ea NE,NO NE,NO NE,NO NE,NO NE,NO NE,NO 0,00 0,00 0,00 0,00 0,00 0,00
HFC-236cb NO NO NO NO NO NO NO NO NO NO NO NO
HFC-236ea NO NO NO NO NO NO NO NO NO NO NO NO
HFC-236fa NO NO NO NO NO NO NO NO NO NO NO NO
HFC-245ca NO NO NO NO NO NO NO NO NO NO NO NO
HFC-245fa NO NO NO NO NO NO NO NO NO NO NO NO
HFC-365mfc NO NO NO NO NO NO NO NO NO NO NO NO
Unspecified mix of HFCs(4) - (kt CO2 equivalent) NO NO NO NO NO NO NO NO NO NO NO NO
Emissions of PFCs - (kt CO2 equivalent) NE,NO NE,NO NE,NO NE,NO NE,NO NE,NO NO NO NO NO NO NO
CF4 NO NO NO NO NO NO NO NO NO NO NO NO
C2F6 NE,NO NE,NO NE,NO NE,NO NE,NO NE,NO NO NO NO NO NO NO
C3F8 NO NO NO NO NO NO NO NO NO NO NO NO
C4F10 NO NO NO NO NO NO NO NO NO NO NO NO
c-C4F8 NO NO NO NO NO NO NO NO NO NO NO NO
C5F12 NO NO NO NO NO NO NO NO NO NO NO NO
C6F14 NO NO NO NO NO NO NO NO NO NO NO NO
C10F18 NO NO NO NO NO NO NO NO NO NO NO NO
c-C3F6 NO NO NO NO NO NO NO NO NO NO NO NO
Unspecified mix of PFCs(4) - (kt CO2 equivalent) NO NO NO NO NO NO NO NO NO NO NO NO
Unspecified mix of HFCs and PFCs - (kt CO2 equivalent) NO NO NO NO NO NO NO NO NO NO NO NO
Emissions of SF6 - (kt CO2 equivalent) NE,NO NE,NO NE,NO NE,NO NE,NO NE,NO 14,62 15,12 16,87 17,38 18,39 18,43
SF6 NE,NO NE,NO NE,NO NE,NO NE,NO NE,NO 0,00 0,00 0,00 0,00 0,00 0,00
Emissions of NF3 - (kt CO2 equivalent) NO NO NO NO NO NO NO NO NO NO NO NO

2nd Biennial Report to the United Nations Framework Convention on Climate Change 58
Table 1d (cont.)
GREENHOUSE GAS SOURCE AND SINK CATEGORIES
(HFCs, PFCs, SF6, and NF3)
2001 2002 2003 2004 2005 2006 2007 2008 2009 2010 2011 2012 2013 Change from base to
latest reported year (%) kt
Emissions of HFCs and PFCs - (kt CO2 equivalent) 374,38 484,32 618,25 733,36 841,36 955,12 1 105,22 1 266,58 1 380,45 1 508,24 1 612,01 1 737,41 1 727,83 -
Emissions of HFCs - (kt CO2 equivalent) 374,38 484,32 618,25 733,36 841,36 954,98 1 105,22 1 266,58 1 380,44 1 508,23 1 612,00 1 737,40 1 727,82 -
HFC-23 0,00 0,00 0,00 0,00 0,00 0,00 0,00 0,00 0,00 0,00 0,00 0,00 0,00 -
HFC-32 0,02 0,03 0,04 0,05 0,05 0,06 0,06 0,07 0,08 0,08 0,09 0,11 0,10 -
HFC-41 NO NO NO NO NO NO NO NO NO NO NO NO NO -
HFC-43-10mee NO NO NO NO NO NO NO NO NO NO NO NO NO -
HFC-125 0,03 0,04 0,05 0,07 0,08 0,09 0,10 0,12 0,13 0,14 0,15 0,17 0,16 -
HFC-134 NO NO NO NO NO NO NO NO NO NO NO NO NO -
HFC-134a 0,12 0,15 0,19 0,22 0,26 0,29 0,33 0,36 0,39 0,44 0,48 0,51 0,51 -
HFC-143 NO NO NO NO NO NO NO NO NO NO NO NO NO -
HFC-143a 0,01 0,02 0,02 0,02 0,03 0,03 0,04 0,05 0,06 0,07 0,07 0,07 0,07 -
HFC-152 NO NO NO NO NO NO NO NO NO NO NO NO NO -
HFC-152a 0,12 0,14 0,28 0,30 0,30 0,30 0,30 0,29 0,28 0,29 0,28 0,27 0,27 -
HFC-161 NO NO NO NO NO NO NO NO NO NO NO NO NO -
HFC-227ea 0,00 0,00 0,00 0,00 0,00 0,00 0,00 0,00 0,00 0,00 0,00 0,00 0,00 -
HFC-236cb NO NO NO NO NO NO NO NO NO NO NO NO NO -
HFC-236ea NO NO NO NO NO NO NO NO NO NO NO NO NO -
HFC-236fa NO NO NO NO NO NO NO NO NO NO NO NO NO -
HFC-245ca NO NO NO NO NO NO NO NO NO NO NO NO NO -
HFC-245fa NO NO NO NO NO NO NO NO NO NO NO NO NO -
HFC-365mfc NO NO NO NO NO NO NO NO NO NO NO NO NO -
Unspecified mix of HFCs(4) - (kt CO2 equivalent) NO NO NO NO NO NO NO NO NO NO NO NO NO -
Emissions of PFCs - (kt CO2 equivalent) NO NO NO NO 0,00 0,13 0,01 0,01 0,01 0,01 0,01 0,01 0,01 -
CF4 NO NO NO NO NO NO NO NO NO NO NO NO NO -
C2F6 NO NO NO NO 0,00 0,00 0,00 0,00 0,00 0,00 0,00 0,00 0,00 -
C3F8 NO NO NO NO NO NO NO NO NO NO NO NO NO -
C4F10 NO NO NO NO NO NO NO NO NO NO NO NO NO -
c-C4F8 NO NO NO NO NO NO NO NO NO NO NO NO NO -
C5F12 NO NO NO NO NO NO NO NO NO NO NO NO NO -
C6F14 NO NO NO NO NO NO NO NO NO NO NO NO NO -
C10F18 NO NO NO NO NO NO NO NO NO NO NO NO NO -
c-C3F6 NO NO NO NO NO NO NO NO NO NO NO NO NO -
Unspecified mix of PFCs(4) - (kt CO2 equivalent) NO NO NO NO NO NO NO NO NO NO NO NO NO -
Unspecified mix of HFCs and PFCs - (kt CO2 equivalent) NO NO NO NO NO NO NO NO NO NO NO NO NO -
Emissions of SF6 - (kt CO2 equivalent) 20,29 19,84 26,18 35,21 35,50 37,09 45,75 44,52 49,57 52,08 48,58 52,68 55,25 -
SF6 0,00 0,00 0,00 0,00 0,00 0,00 0,00 0,00 0,00 0,00 0,00 0,00 0,00 -
Emissions of NF3 - (kt CO2 equivalent) NO NO NO NO NO NO NO NO NO NO NO NO NO -
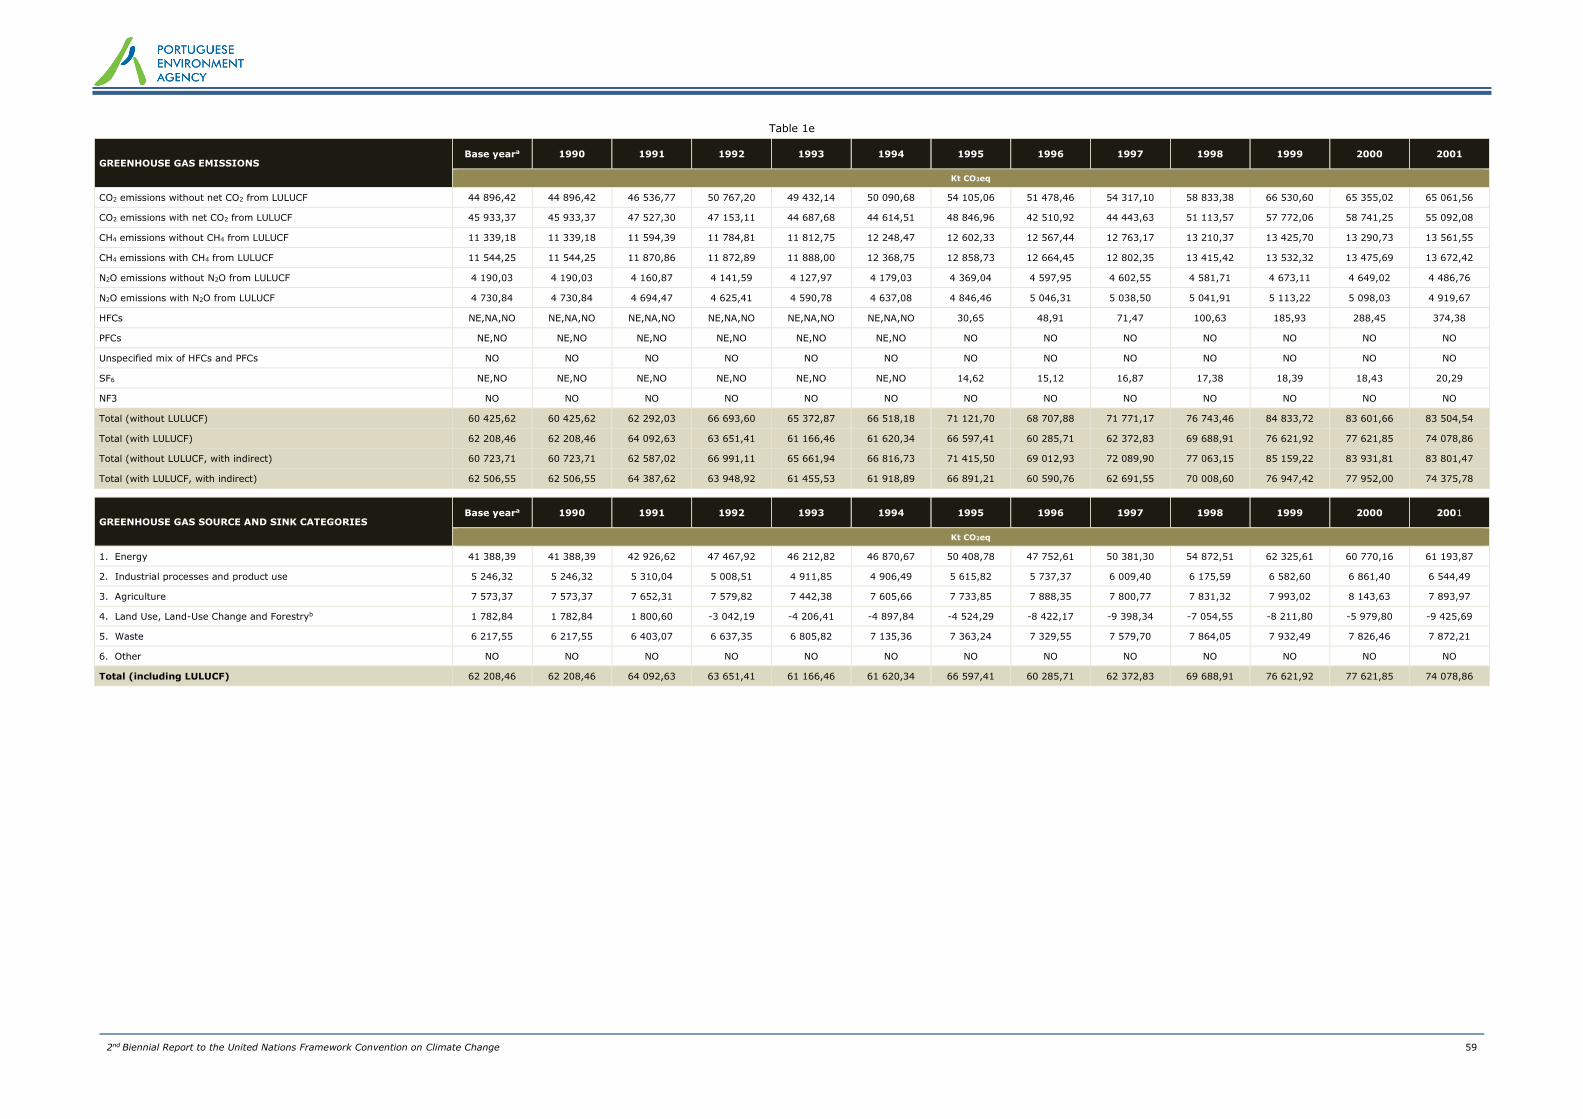
2nd Biennial Report to the United Nations Framework Convention on Climate Change 59
Table 1e
GREENHOUSE GAS EMISSIONS Base yeara 1990 1991 1992 1993 1994 1995 1996 1997 1998 1999 2000 2001
Kt CO2eq
CO2 emissions without net CO2 from LULUCF 44 896,42 44 896,42 46 536,77 50 767,20 49 432,14 50 090,68 54 105,06 51 478,46 54 317,10 58 833,38 66 530,60 65 355,02 65 061,56
CO2 emissions with net CO2 from LULUCF 45 933,37 45 933,37 47 527,30 47 153,11 44 687,68 44 614,51 48 846,96 42 510,92 44 443,63 51 113,57 57 772,06 58 741,25 55 092,08
CH4 emissions without CH4 from LULUCF 11 339,18 11 339,18 11 594,39 11 784,81 11 812,75 12 248,47 12 602,33 12 567,44 12 763,17 13 210,37 13 425,70 13 290,73 13 561,55
CH4 emissions with CH4 from LULUCF 11 544,25 11 544,25 11 870,86 11 872,89 11 888,00 12 368,75 12 858,73 12 664,45 12 802,35 13 415,42 13 532,32 13 475,69 13 672,42
N2O emissions without N2O from LULUCF 4 190,03 4 190,03 4 160,87 4 141,59 4 127,97 4 179,03 4 369,04 4 597,95 4 602,55 4 581,71 4 673,11 4 649,02 4 486,76
N2O emissions with N2O from LULUCF 4 730,84 4 730,84 4 694,47 4 625,41 4 590,78 4 637,08 4 846,46 5 046,31 5 038,50 5 041,91 5 113,22 5 098,03 4 919,67
HFCs NE,NA,NO NE,NA,NO NE,NA,NO NE,NA,NO NE,NA,NO NE,NA,NO 30,65 48,91 71,47 100,63 185,93 288,45 374,38
PFCs NE,NO NE,NO NE,NO NE,NO NE,NO NE,NO NO NO NO NO NO NO NO
Unspecified mix of HFCs and PFCs NO NO NO NO NO NO NO NO NO NO NO NO NO
SF6 NE,NO NE,NO NE,NO NE,NO NE,NO NE,NO 14,62 15,12 16,87 17,38 18,39 18,43 20,29
NF3 NO NO NO NO NO NO NO NO NO NO NO NO NO
Total (without LULUCF) 60 425,62 60 425,62 62 292,03 66 693,60 65 372,87 66 518,18 71 121,70 68 707,88 71 771,17 76 743,46 84 833,72 83 601,66 83 504,54
Total (with LULUCF) 62 208,46 62 208,46 64 092,63 63 651,41 61 166,46 61 620,34 66 597,41 60 285,71 62 372,83 69 688,91 76 621,92 77 621,85 74 078,86
Total (without LULUCF, with indirect) 60 723,71 60 723,71 62 587,02 66 991,11 65 661,94 66 816,73 71 415,50 69 012,93 72 089,90 77 063,15 85 159,22 83 931,81 83 801,47
Total (with LULUCF, with indirect) 62 506,55 62 506,55 64 387,62 63 948,92 61 455,53 61 918,89 66 891,21 60 590,76 62 691,55 70 008,60 76 947,42 77 952,00 74 375,78
GREENHOUSE GAS SOURCE AND SINK CATEGORIES Base yeara 1990 1991 1992 1993 1994 1995 1996 1997 1998 1999 2000 2001
Kt CO2eq
1. Energy 41 388,39 41 388,39 42 926,62 47 467,92 46 212,82 46 870,67 50 408,78 47 752,61 50 381,30 54 872,51 62 325,61 60 770,16 61 193,87
2. Industrial processes and product use 5 246,32 5 246,32 5 310,04 5 008,51 4 911,85 4 906,49 5 615,82 5 737,37 6 009,40 6 175,59 6 582,60 6 861,40 6 544,49
3. Agriculture 7 573,37 7 573,37 7 652,31 7 579,82 7 442,38 7 605,66 7 733,85 7 888,35 7 800,77 7 831,32 7 993,02 8 143,63 7 893,97
4. Land Use, Land-Use Change and Forestryb 1 782,84 1 782,84 1 800,60 -3 042,19 -4 206,41 -4 897,84 -4 524,29 -8 422,17 -9 398,34 -7 054,55 -8 211,80 -5 979,80 -9 425,69
5. Waste 6 217,55 6 217,55 6 403,07 6 637,35 6 805,82 7 135,36 7 363,24 7 329,55 7 579,70 7 864,05 7 932,49 7 826,46 7 872,21
6. Other NO NO NO NO NO NO NO NO NO NO NO NO NO
Total (including LULUCF) 62 208,46 62 208,46 64 092,63 63 651,41 61 166,46 61 620,34 66 597,41 60 285,71 62 372,83 69 688,91 76 621,92 77 621,85 74 078,86

2nd Biennial Report to the United Nations Framework Convention on Climate Change 60
Table 1e (cont.)
GREENHOUSE GAS EMISSIONS
2002 2003 2004 2005 2006 2007 2008 2009 2010 2011 2012 2013 Change from base to latest
reported year (%) Kt CO2eq
CO2 emissions without net CO2 from LULUCF 68 805,94 63 647,02 66 291,22 68 816,33 64 250,55 61 565,95 59 486,09 56 724,15 52 204,49 50 918,55 49 146,43 47 408,47 5,60
CO2 emissions with net CO2 from LULUCF 59 254,32 63 980,73 57 625,09 68 123,89 54 645,75 48 472,39 44 988,89 42 340,50 40 297,89 36 819,54 38 448,79 37 499,68 -18,36
CH4 emissions without CH4 from LULUCF 13 811,33 14 021,90 13 991,63 13 997,14 13 517,76 13 342,75 13 129,70 13 077,00 12 770,64 12 823,40 12 476,64 12 212,58 7,70
CH4 emissions with CH4 from LULUCF 13 983,21 14 739,22 14 130,31 14 555,01 13 620,54 13 384,39 13 150,86 13 134,07 12 922,34 12 884,25 12 650,92 12 366,12 7,12
N2O emissions without N2O from LULUCF 4 532,16 4 195,88 4 356,67 4 207,85 4 066,67 4 255,27 4 133,69 3 803,64 3 803,55 3 541,60 3 542,77 3 667,32 -12,47
N2O emissions with N2O from LULUCF 4 971,13 4 720,31 4 782,33 4 690,06 4 462,14 4 619,93 4 474,20 4 150,85 4 167,08 3 890,86 3 911,24 4 033,01 -14,75
HFCs 484,32 618,25 733,36 841,36 954,98 1 105,22 1 266,58 1 380,44 1 508,23 1 612,00 1 737,40 1 727,82 -
PFCs NO NO NO 0,00 0,13 0,01 0,01 0,01 0,01 0,01 0,01 0,01 -
Unspecified mix of HFCs and PFCs NO NO NO NO NO NO NO NO NO NO NO NO -
SF6 19,84 26,18 35,21 35,50 37,09 45,75 44,52 49,57 52,08 48,58 52,68 55,25 -
NF3 NO NO NO NO NO NO NO NO NO NO NO NO -
Total (without LULUCF) 87 653,59 82 509,23 85 408,08 87 898,18 82 827,19 80 314,94 78 060,58 75 034,82 70 338,99 68 944,15 66 955,92 65 071,46 7,69
Total (with LULUCF) 78 712,82 84 084,69 77 306,30 88 245,81 73 720,64 67 627,68 63 925,06 61 055,44 58 947,63 55 255,25 56 801,04 55 681,89 -10,49
Total (without LULUCF, with indirect) 87 936,94 82 785,94 85 683,65 88 167,23 83 097,00 80 588,05 78 323,51 75 275,70 70 588,68 69 182,53 67 188,85 65 307,62 7,55
Total (with LULUCF, with indirect) 78 996,18 84 361,41 77 581,86 88 514,87 73 990,45 67 900,80 64 187,99 61 296,33 59 197,31 55 493,63 57 033,97 55 918,05 -10,54
GREENHOUSE GAS SOURCE AND SINK CATEGORIES 2002 2003 2004 2005 2006 2007 2008 2009 2010 2011 2012 2013
Change from base to latest
reported year (%) Kt CO2eq
1. Energy 64 875,35 59 825,67 61 808,24 64 396,11 59 765,01 56 677,89 55 040,97 53 987,86 48 936,23 48 075,74 46 426,27 44 473,76 7,45
2. Industrial processes and product use 6 856,97 6 889,53 7 506,62 7 526,80 7 332,13 7 929,42 7 869,03 6 222,34 6 466,69 5 712,97 5 656,36 5 862,26 11,74
3. Agriculture 7 746,19 7 256,51 7 436,92 7 335,53 7 232,15 7 325,25 7 303,42 7 139,72 7 058,06 7 017,07 7 081,92 7 132,85 -5,82
4. LULUCF -8 940,76 1 575,47 -8 101,78 347,63 -9 106,55 -12 687,26 -14 135,53 -13 979,37 -11 391,37 -13 688,90 -10 154,88 -9 389,57 -626,66
5. Waste 8 175,08 8 537,52 8 656,31 8 639,73 8 497,90 8 382,38 7 847,16 7 684,90 7 878,01 8 138,36 7 791,37 7 602,59 22,28
6. Other NO NO NO NO NO NO NO NO NO NO NO NO -
Total (including LULUCF) 78 712,82 84 084,69 77 306,30 88 245,81 73 720,64 67 627,68 63 925,06 61 055,44 58 947,63 55 255,25 56 801,04 55 681,89 -10,49

2nd Biennial Report to the United Nations Framework Convention on Climate Change 61
Table 2 (a) Description of quantified economy-wide emission reduction target
Base year/ base period 1990
Emission reductions target (% of base year/base period) -
Emission reductions target (% of 1990) 20.00
Period for reaching target BY-2020
Table 2 (b) Description of quantified economy-wide emission reduction target
Gases covered Covered Base Year GWP reference source
CO2 Yes 1990 4th AR
CH4 Yes 1990 4th AR
N2O Yes 1990 4th AR
HFCs Yes 1990 4th AR
PFCs Yes 1990 4th AR
SF6 Yes 1990 4th AR
NF3 No 4th AR
Other Specify
Table 2 ( c ) Description of quantified economy-wide emission reduction target
Sectors covered Covered
Energy Yes
Transportf Yes
Industrial processesg Yes
Agriculture Yes
LULUCF No
Waste Yes
Other Specify
Aviation in the scope of the EU-ETS Yes
Table 2 (d) Description of quantified economy-wide emission reduction target
Role of LULUCF sector
LULUCF in base year level and target Excluded
Contribution of LULUCF is calculated using -

2nd Biennial Report to the United Nations Framework Convention on Climate Change 62
Table 2 (e)I Description of quantified economy-wide emission reduction target
Market-based mechanisms under the
Convention Comments
Possible scale of contributions of market-
based mechanisms under the Convention (estimated kt CO2 eq)
The 2020 Climate and Energy Package allows Certified Emission Reductions (CERs) and
Emission Reduction Units (ERUs) to be used for compliance purposes, subject to a number of restrictions in terms of origin and type of project and up to an established
limit. In addition, the legislation foresees the possible recognition of units from new
market mechanisms.
Under the EU ETS the limit does not exceed 50% of the required reduction below 2005 levels. In the sectors not covered by the ETS, annual use shall not exceed to 3 % of
each Member States’ non-ETS greenhouse gas emissions in 2005. A limited number of
Member States may use an additional 1%, from projects in LDCs or SIDS subject to
conditions.
CERs The use of these units under the ETS Directive and the Effort Sharing Decision is subject to the limits specified above which do not separate between CERs and ERUs, but include
additional criteria for the use of CERs.
ERUs
The use of these units under the ETS Directive and the Effort Sharing Decision is subject
to the limits specified above which do not separate between CERs and ERUs, but include
additional criteria for the use of CERs.
AAUsi
AAUs for the period 2013-2020 have not yet been determined. The EU expects to achieve its 20% target for the period 2013-2020 with the implementation of the ETS
Directive and the ESD Decision in the non-ETS sectors which do not allow the use of
AAUs from non-EU Parties.
Carry-over unitsj The time-period of the Convention target is from 1990-2020, no carry-over units will
be used to achieve the 2020 target.
Other mechanism units under the
Convention (specify)k
There are general provisions in place in the EU legislation that allow for the use of such
units provided that the necessary legal arrangements for the creation of such units have
been put in place in the EU which is not the case at the point in time of the provision of
this report.
Table 2 (e)II Description of quantified economy-wide emission reduction target
Other market-based mechanisms
Possible scale of contributions of other market-based mechanisms (estimated kt CO2 eq)
Table 2 (f) Description of quantified economy-wide emission reduction target
Any other information
In December 2009, the European Council reiterated the conditional offer of the EU to move to a 30% reduction by 2020 compared to 1990 levels as part of a global and comprehensive agreement for the period beyond 2012, provided that other developed countries commit themselves to comparable emissions reductions and that developing countries contribute adequately according to their responsibilities and respective capabilities.
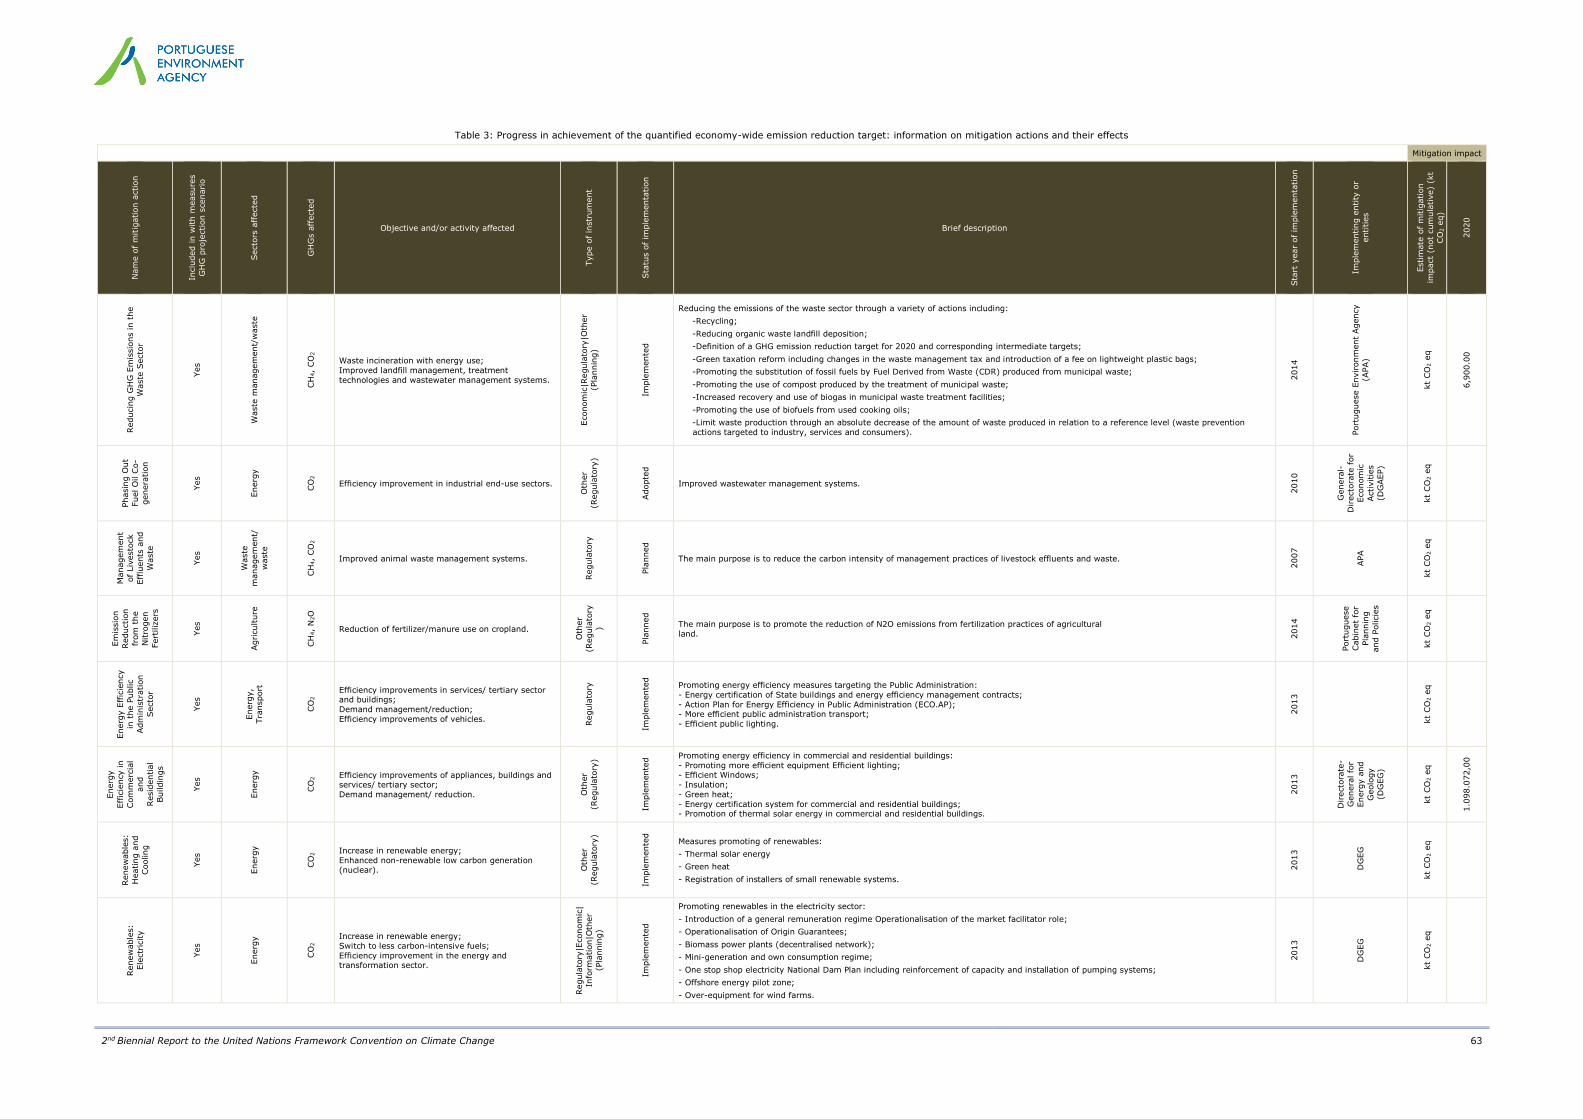
2nd Biennial Report to the United Nations Framework Convention on Climate Change 63
Table 3: Progress in achievement of the quantified economy-wide emission reduction target: information on mitigation actions and their effects
Mitigation impact
Nam
e o
f m
itig
ation a
ction
Inclu
ded in w
ith m
easure
s
GH
G p
roje
ction s
cenario
Secto
rs a
ffecte
d
GH
Gs a
ffecte
d
Objective and/or activity affected
Type o
f in
str
um
ent
Sta
tus o
f im
ple
menta
tion
Brief description
Sta
rt y
ear
of im
ple
menta
tion
Imple
menting e
ntity
or
entities
Estim
ate
of m
itig
ation
impact
(not
cum
ula
tive)
(kt
CO
2 e
q)
2020
Reducin
g G
HG
Em
issio
ns in t
he
Waste
Secto
r
Yes
Waste
managem
ent/
waste
CH
4,
CO
2
Waste incineration with energy use;
Improved landfill management, treatment
technologies and wastewater management systems.
Econom
ic|R
egula
tory
|Oth
er
(Pla
nnin
g)
Imple
mente
d
Reducing the emissions of the waste sector through a variety of actions including:
-Recycling;
-Reducing organic waste landfill deposition;
-Definition of a GHG emission reduction target for 2020 and corresponding intermediate targets;
-Green taxation reform including changes in the waste management tax and introduction of a fee on lightweight plastic bags;
-Promoting the substitution of fossil fuels by Fuel Derived from Waste (CDR) produced from municipal waste;
-Promoting the use of compost produced by the treatment of municipal waste;
-Increased recovery and use of biogas in municipal waste treatment facilities;
-Promoting the use of biofuels from used cooking oils;
-Limit waste production through an absolute decrease of the amount of waste produced in relation to a reference level (waste prevention
actions targeted to industry, services and consumers).
2014
Port
uguese E
nvironm
ent
Agency
(APA)
kt
CO
2 e
q
6,9
00.0
0
Phasin
g O
ut
Fuel O
il C
o-
genera
tion
Yes
Energ
y
CO
2
Efficiency improvement in industrial end-use sectors.
Oth
er
(Regula
tory
)
Adopte
d
Improved wastewater management systems.
2010
Genera
l-
Directo
rate
for
Econom
ic
Activitie
s
(DG
AEP)
kt
CO
2 e
q
Managem
ent
of
Liv
esto
ck
Efflu
ents
and
Waste
Yes
Waste
managem
ent/
waste
CH
4,
CO
2
Improved animal waste management systems.
Regula
tory
Pla
nned
The main purpose is to reduce the carbon intensity of management practices of livestock effluents and waste.
2007
APA
kt
CO
2 e
q
Em
issio
n
Reduction
from
the
Nitro
gen
Fert
iliz
ers
Yes
Agriculture
CH
4,
N2O
Reduction of fertilizer/manure use on cropland.
Oth
er
(Regula
tory
)
Pla
nned
The main purpose is to promote the reduction of N2O emissions from fertilization practices of agricultural
land. 2014
Port
uguese
Cabin
et
for
Pla
nnin
g
and P
olicie
s
kt
CO
2 e
q
Energ
y E
ffic
iency
in t
he P
ublic
Adm
inis
tration
Secto
r
Yes
Energ
y,
Tra
nsport
CO
2 Efficiency improvements in services/ tertiary sector
and buildings;
Demand management/reduction;
Efficiency improvements of vehicles.
Regula
tory
Imple
mente
d
Promoting energy efficiency measures targeting the Public Administration:
- Energy certification of State buildings and energy efficiency management contracts;
- Action Plan for Energy Efficiency in Public Administration (ECO.AP); - More efficient public administration transport;
- Efficient public lighting.
2013
kt
CO
2 e
q
Energ
y
Effic
iency in
Com
merc
ial
and
Resid
ential
Buildin
gs
Yes
Energ
y
CO
2 Efficiency improvements of appliances, buildings and
services/ tertiary sector;
Demand management/ reduction. Oth
er
(Regula
tory
)
Imple
mente
d Promoting energy efficiency in commercial and residential buildings:
- Promoting more efficient equipment Efficient lighting; - Efficient Windows;
- Insulation;
- Green heat;
- Energy certification system for commercial and residential buildings; - Promotion of thermal solar energy in commercial and residential buildings.
2013
Directo
rate
-
Genera
l fo
r
Energ
y a
nd
Geolo
gy
(DG
EG
)
kt
CO
2 e
q
1.0
98.0
72,0
0
Renew
able
s:
Heating a
nd
Cooling
Yes
Energ
y
CO
2 Increase in renewable energy;
Enhanced non-renewable low carbon generation (nuclear). O
ther
(Regula
tory
)
Imple
mente
d
Measures promoting of renewables:
- Thermal solar energy
- Green heat
- Registration of installers of small renewable systems.
2013
DG
EG
kt
CO
2 e
q
Renew
able
s:
Ele
ctr
icity
Yes
Energ
y
CO
2 Increase in renewable energy;
Switch to less carbon-intensive fuels;
Efficiency improvement in the energy and transformation sector.
Regula
tory
|Econom
ic|
Info
rmation|O
ther
(Pla
nnin
g)
Imple
mente
d
Promoting renewables in the electricity sector:
- Introduction of a general remuneration regime Operationalisation of the market facilitator role;
- Operationalisation of Origin Guarantees;
- Biomass power plants (decentralised network);
- Mini-generation and own consumption regime;
- One stop shop electricity National Dam Plan including reinforcement of capacity and installation of pumping systems;
- Offshore energy pilot zone;
- Over-equipment for wind farms.
2013
DG
EG
kt
CO
2 e
q
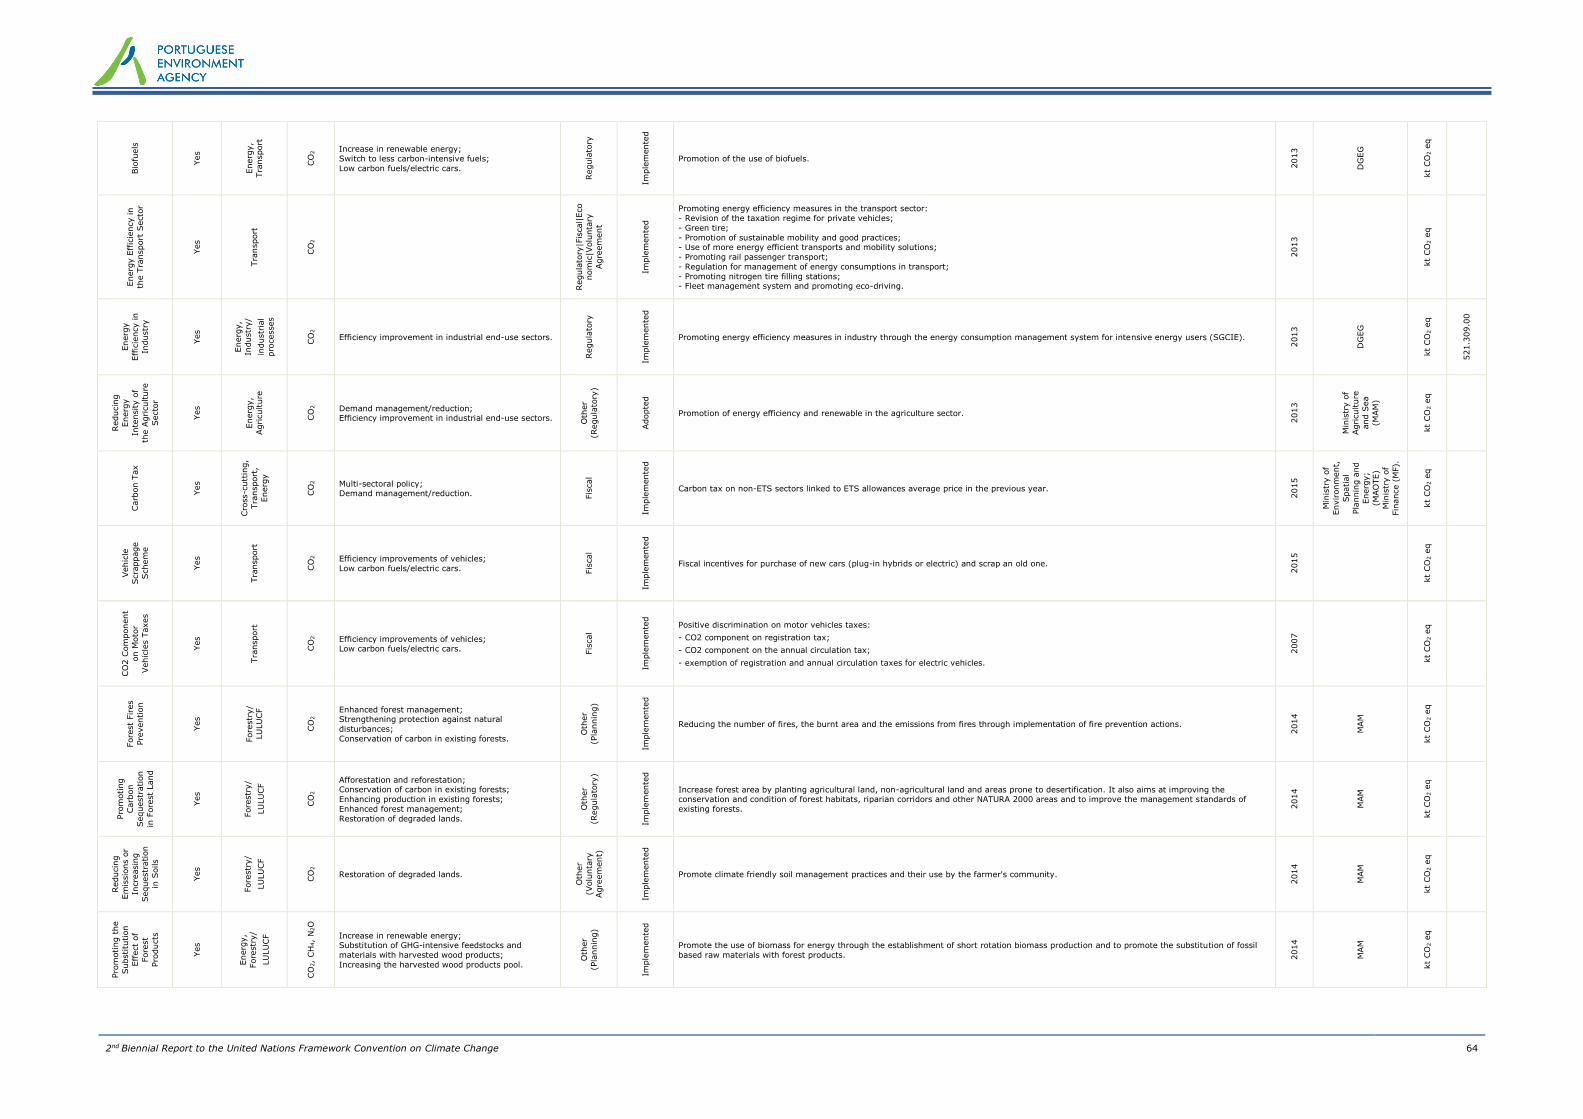
2nd Biennial Report to the United Nations Framework Convention on Climate Change 64
Bio
fuels
Yes
Energ
y,
Tra
nsport
CO
2 Increase in renewable energy;
Switch to less carbon-intensive fuels;
Low carbon fuels/electric cars.
Regula
tory
Imple
mente
d
Promotion of the use of biofuels.
2013
DG
EG
kt
CO
2 e
q
Energ
y E
ffic
iency in
the T
ransport
Secto
r
Yes
Tra
nsport
CO
2
Regula
tory
|Fis
cal|
Eco
nom
ic|V
olu
nta
ry
Agre
em
ent
Imple
mente
d
Promoting energy efficiency measures in the transport sector:
- Revision of the taxation regime for private vehicles;
- Green tire;
- Promotion of sustainable mobility and good practices; - Use of more energy efficient transports and mobility solutions;
- Promoting rail passenger transport;
- Regulation for management of energy consumptions in transport;
- Promoting nitrogen tire filling stations; - Fleet management system and promoting eco-driving.
2013
kt
CO
2 e
q
Energ
y
Effic
iency in
Industr
y
Yes
Energ
y,
Industr
y/
industr
ial
pro
cesses
CO
2
Efficiency improvement in industrial end-use sectors.
Regula
tory
Imple
mente
d
Promoting energy efficiency measures in industry through the energy consumption management system for intensive energy users (SGCIE).
2013
DG
EG
kt
CO
2 e
q
521.3
09.0
0
Reducin
g
Energ
y
Inte
nsity o
f
the A
griculture
Secto
r
Yes
Energ
y,
Agriculture
CO
2
Demand management/reduction; Efficiency improvement in industrial end-use sectors. O
ther
(Regula
tory
)
Adopte
d
Promotion of energy efficiency and renewable in the agriculture sector.
2013
Min
istr
y o
f
Agriculture
and S
ea
(MAM
)
kt
CO
2 e
q
Carb
on T
ax
Yes
Cro
ss-c
utt
ing,
Tra
nsport
,
Energ
y
CO
2
Multi-sectoral policy; Demand management/reduction. F
iscal
Imple
mente
d
Carbon tax on non-ETS sectors linked to ETS allowances average price in the previous year.
2015
Min
istr
y o
f
Environm
ent,
Spatial
Pla
nnin
g a
nd
Energ
y;
(MAO
TE)
Min
istr
y o
f
Fin
ance (
MF).
kt
CO
2 e
q
Vehic
le
Scra
ppage
Schem
e
Yes
Tra
nsport
CO
2
Efficiency improvements of vehicles;
Low carbon fuels/electric cars. Fis
cal
Imple
mente
d
Fiscal incentives for purchase of new cars (plug-in hybrids or electric) and scrap an old one.
2015
kt
CO
2 e
q
CO
2 C
om
ponent
on M
oto
r
Vehic
les T
axes
Yes
Tra
nsport
CO
2
Efficiency improvements of vehicles; Low carbon fuels/electric cars. F
iscal
Imple
mente
d
Positive discrimination on motor vehicles taxes:
- CO2 component on registration tax;
- CO2 component on the annual circulation tax;
- exemption of registration and annual circulation taxes for electric vehicles.
2007
kt
CO
2 e
q
Fore
st
Fires
Pre
vention
Yes
Fore
str
y/
LU
LU
CF
CO
2 Enhanced forest management;
Strengthening protection against natural
disturbances;
Conservation of carbon in existing forests.
Oth
er
(Pla
nnin
g)
Imple
mente
d
Reducing the number of fires, the burnt area and the emissions from fires through implementation of fire prevention actions.
2014
MAM
kt
CO
2 e
q
Pro
moting
Carb
on
Sequestr
ation
in F
ore
st
Land
Yes
Fore
str
y/
LU
LU
CF
CO
2
Afforestation and reforestation; Conservation of carbon in existing forests;
Enhancing production in existing forests;
Enhanced forest management;
Restoration of degraded lands.
Oth
er
(Regula
tory
)
Imple
mente
d
Increase forest area by planting agricultural land, non-agricultural land and areas prone to desertification. It also aims at improving the conservation and condition of forest habitats, riparian corridors and other NATURA 2000 areas and to improve the management standards of
existing forests. 2014
MAM
kt
CO
2 e
q
Reducin
g
Em
issio
ns o
r
Incre
asin
g
Sequestr
ation
in S
oils
Yes
Fore
str
y/
LU
LU
CF
CO
2
Restoration of degraded lands.
Oth
er
(Volu
nta
ry
Agre
em
ent)
Imple
mente
d
Promote climate friendly soil management practices and their use by the farmer's community.
2014
MAM
kt
CO
2 e
q
Pro
moting t
he
Substitu
tion
Eff
ect
of
Fore
st
Pro
ducts
Yes
Energ
y,
Fore
str
y/
LU
LU
CF
CO
2,
CH
4,
N2O
Increase in renewable energy; Substitution of GHG-intensive feedstocks and
materials with harvested wood products;
Increasing the harvested wood products pool.
Oth
er
(Pla
nnin
g)
Imple
mente
d
Promote the use of biomass for energy through the establishment of short rotation biomass production and to promote the substitution of fossil
based raw materials with forest products. 2014
MAM
kt
CO
2 e
q
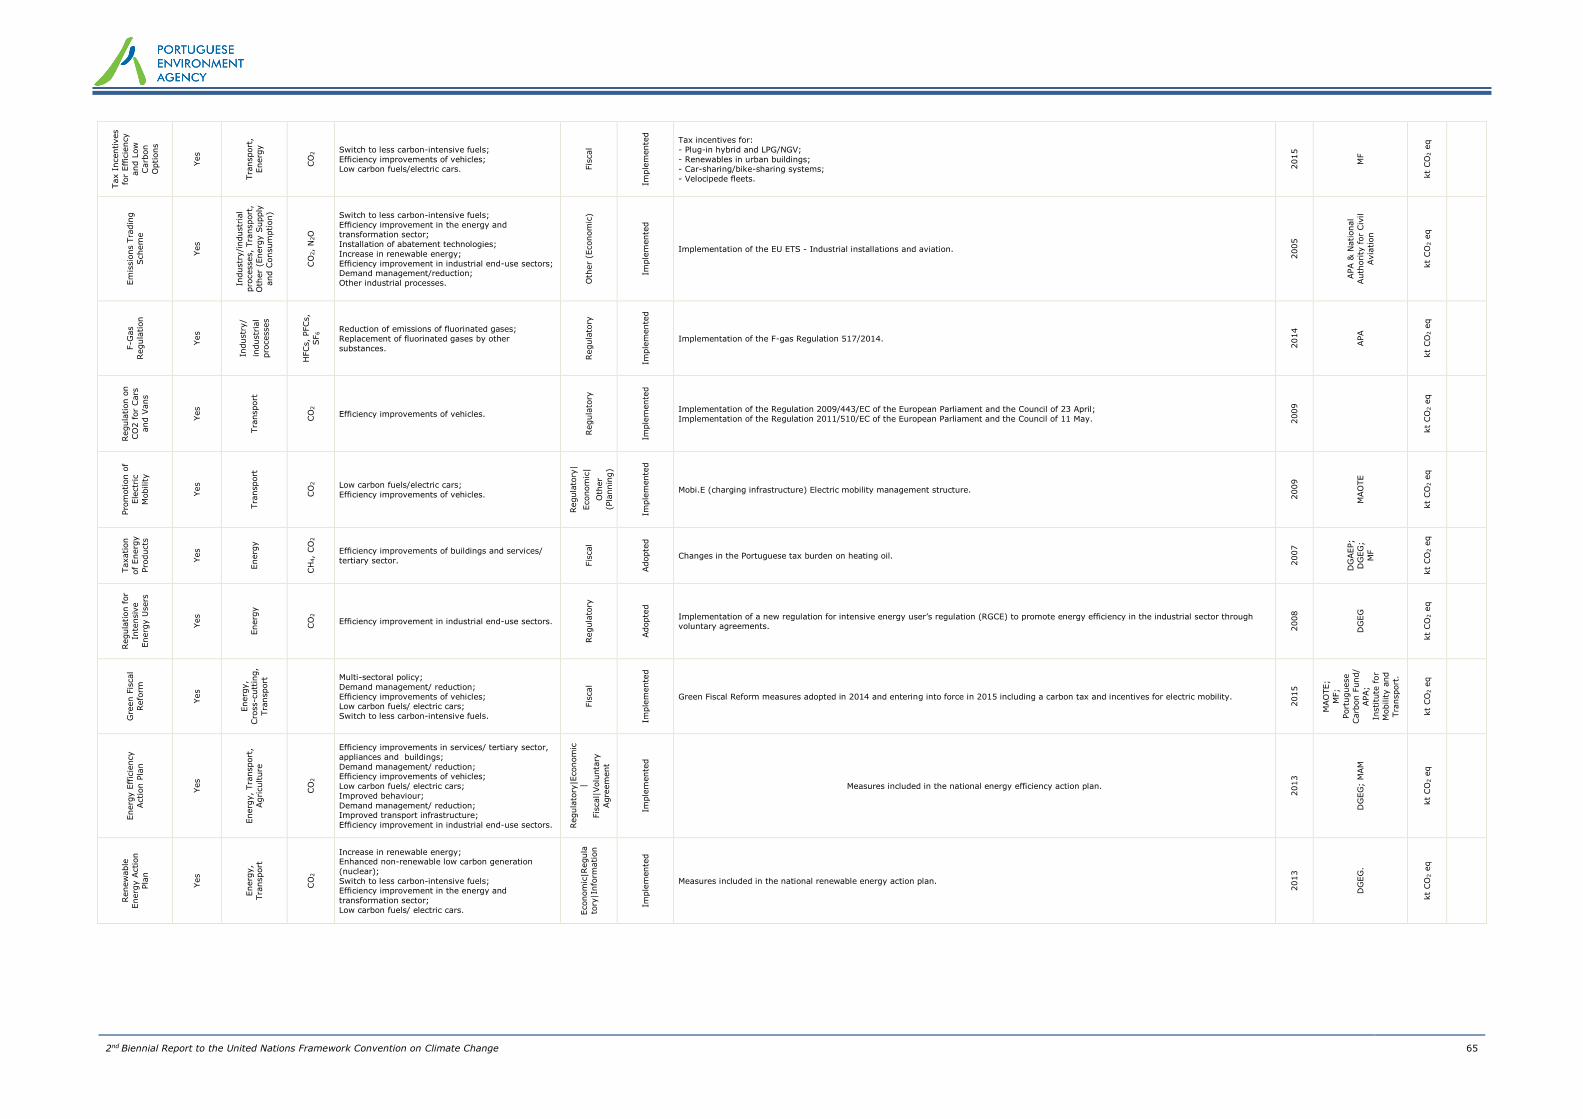
2nd Biennial Report to the United Nations Framework Convention on Climate Change 65
Tax I
ncentives
for
Effic
iency
and L
ow
Carb
on
Options
Yes
Tra
nsport
,
Energ
y
CO
2 Switch to less carbon-intensive fuels;
Efficiency improvements of vehicles; Low carbon fuels/electric cars. F
iscal
Imple
mente
d
Tax incentives for:
- Plug-in hybrid and LPG/NGV;
- Renewables in urban buildings; - Car-sharing/bike-sharing systems;
- Velocipede fleets.
2015
MF
kt
CO
2 e
q
Em
issio
ns T
radin
g
Schem
e
Yes
Industr
y/i
ndustr
ial
pro
cesses,
Tra
nsport
,
Oth
er
(Energ
y S
upply
and C
onsum
ption)
CO
2,
N2O
Switch to less carbon-intensive fuels;
Efficiency improvement in the energy and transformation sector;
Installation of abatement technologies;
Increase in renewable energy;
Efficiency improvement in industrial end-use sectors; Demand management/reduction;
Other industrial processes. Oth
er
(Econom
ic)
Imple
mente
d
Implementation of the EU ETS - Industrial installations and aviation.
2005
APA &
National
Auth
ority
for
Civ
il
Avia
tion
kt
CO
2 e
q
F-G
as
Regula
tion
Yes
Industr
y/
industr
ial
pro
cesses
HFCs,
PFCs,
SF
6 Reduction of emissions of fluorinated gases;
Replacement of fluorinated gases by other
substances.
Regula
tory
Imple
mente
d
Implementation of the F-gas Regulation 517/2014.
2014
APA
kt
CO
2 e
q
Regula
tion o
n
CO
2 f
or
Cars
and V
ans
Yes
Tra
nsport
CO
2
Efficiency improvements of vehicles.
Regula
tory
Imple
mente
d
Implementation of the Regulation 2009/443/EC of the European Parliament and the Council of 23 April;
Implementation of the Regulation 2011/510/EC of the European Parliament and the Council of 11 May. 2009
kt
CO
2 e
q
Pro
motion o
f
Ele
ctr
ic
Mobility
Yes
Tra
nsport
CO
2
Low carbon fuels/electric cars;
Efficiency improvements of vehicles.
Regula
tory
|
Econom
ic|
Oth
er
(Pla
nnin
g)
Imple
mente
d
Mobi.E (charging infrastructure) Electric mobility management structure.
2009
MAO
TE
kt
CO
2 e
q
Taxation
of
Energ
y
Pro
ducts
Yes
Energ
y
CH
4,
CO
2
Efficiency improvements of buildings and services/
tertiary sector. Fis
cal
Adopte
d
Changes in the Portuguese tax burden on heating oil.
2007
DG
AEP;
DG
EG
;
MF
kt
CO
2 e
q
Regula
tion f
or
Inte
nsiv
e
Energ
y U
sers
Yes
Energ
y
CO
2
Efficiency improvement in industrial end-use sectors.
Regula
tory
Adopte
d
Implementation of a new regulation for intensive energy user’s regulation (RGCE) to promote energy efficiency in the industrial sector through voluntary agreements. 2
008
DG
EG
kt
CO
2 e
q
Gre
en F
iscal
Refo
rm
Yes
Energ
y,
Cro
ss-c
utt
ing,
Tra
nsport
Multi-sectoral policy;
Demand management/ reduction;
Efficiency improvements of vehicles; Low carbon fuels/ electric cars;
Switch to less carbon-intensive fuels.
Fis
cal
Imple
mente
d
Green Fiscal Reform measures adopted in 2014 and entering into force in 2015 including a carbon tax and incentives for electric mobility.
2015
MAO
TE;
MF;
Port
uguese
Carb
on F
und/
APA;
Institu
te for
Mobility a
nd
Tra
nsport
.
kt
CO
2 e
q
Energ
y E
ffic
iency
Action P
lan
Yes
Energ
y,
Tra
nsport
,
Agriculture
CO
2
Efficiency improvements in services/ tertiary sector,
appliances and buildings;
Demand management/ reduction; Efficiency improvements of vehicles;
Low carbon fuels/ electric cars;
Improved behaviour;
Demand management/ reduction; Improved transport infrastructure;
Efficiency improvement in industrial end-use sectors. Regula
tory
|Econom
ic
|
Fis
cal|
Volu
nta
ry
Agre
em
ent
Imple
mente
d
Measures included in the national energy efficiency action plan.
2013
DG
EG
; M
AM
kt
CO
2 e
q
Renew
able
Energ
y A
ction
Pla
n
Yes
Energ
y,
Tra
nsport
CO
2
Increase in renewable energy; Enhanced non-renewable low carbon generation
(nuclear);
Switch to less carbon-intensive fuels; Efficiency improvement in the energy and
transformation sector;
Low carbon fuels/ electric cars. Econom
ic|R
egula
tory
|Info
rmation
Imple
mente
d
Measures included in the national renewable energy action plan.
2013
DG
EG
.
kt
CO
2 e
q

2nd Biennial Report to the United Nations Framework Convention on Climate Change 66
Table 4: Report on progress
Unit Base Year 2010 2011 2012 2013 2014
Total (without LULUCF) kt CO2 eq 60 425.62 70 338.99 68 944.15 66 955.92 65 071.46 -
Contribution from LULUCF c 1) kt CO2 eq - - - - - -
Market-based mechanisms under the
Convention 2) number of units - - - - - -
kt CO2 eq - - - - - -
Other market-based mechanisms 3) number of units - - - - - -
kt CO2 eq - - - - - -
1) Numbers for LULUCF are not reported because this sector is not included under the Convention target of the EU.
2) Market-based mechanism under the Convention: Not applicable: Use of CER and ERU cannot be quantified at the time of reporting.
3) No "other" market-based mechanisms are in use.
Table 4(a)I: Progress in achieving the quantified economy-wide emission reduction targets – further information on
mitigation actions relevant to the contribution of the land use, land-use change and forestry sector
Unit
Net GHG
emissions/remo
vals from LULUCF
categories
Base
year/period or
reference level
value
Contribution
from LULUCF for reported year
Cumulative
contribution from LULUCF
Accounting
approach
2013
Total LULUCF kt CO2 eq -9 389.57 - - - -
A. Forest land kt CO2 eq -12 442.94 - - - -
1. Forest land remaining forest land kt CO2 eq -8 742.96 - - - -
2. Land converted to forest land kt CO2 eq -3 699.98 - - - -
3. Other g kt CO2 eq - - - - -
B. Cropland kt CO2 eq 673.84 - - - -
1. Cropland remaining cropland kt CO2 eq -191.71 - - - -
2. Land converted to cropland kt CO2 eq 865.55 - - - -
3. Other g kt CO2 eq - - - - -
C. Grassland kt CO2 eq 345.21 - - - -
1. Grassland remaining grassland kt CO2 eq -267.59 - - - -
2. Land converted to grassland kt CO2 eq 612.80 - - - -
3. Other g kt CO2 eq - - - - -
D. Wetlands kt CO2 eq 442.93 - - - -
1. Wetland remaining wetland kt CO2 eq - - - - -
2. Land converted to wetland kt CO2 eq 442.93 - - - -
3. Other g kt CO2 eq - - - - -
E. Settlements kt CO2 eq 2 607.05 - - - -
1. Settlements remaining settlements kt CO2 eq - - - - -
2. Land converted to settlements kt CO2 eq 2 607.05 - - - -
3. Other g kt CO2 eq v - - - -
F. Other land kt CO2 eq -1 235.66 - - - -
1. Other land remaining other land kt CO2 eq - - - - -
2. Land converted to other land kt CO2 eq -1 235.66 - - - -
3. Other g kt CO2 eq - - - - -
Harvested wood products kt CO2 eq 220.00 - - - -
2014
Total LULUCF kt CO2 eq - - - -
A. Forest land kt CO2 eq - - - - -
1. Forest land remaining forest land kt CO2 eq - - - - -
2. Land converted to forest land kt CO2 eq - - - - -

2nd Biennial Report to the United Nations Framework Convention on Climate Change 67
3. Other g kt CO2 eq - - - - -
B. Cropland kt CO2 eq - - - - -
1. Cropland remaining cropland kt CO2 eq - - - - -
2. Land converted to cropland kt CO2 eq - - - - -
3. Other g kt CO2 eq - - - - -
C. Grassland kt CO2 eq - - - - -
1. Grassland remaining grassland kt CO2 eq - - - - -
2. Land converted to grassland kt CO2 eq - - - - -
3. Other g kt CO2 eq - - - - -
D. Wetlands kt CO2 eq - - - - -
1. Wetland remaining wetland kt CO2 eq - - - - -
2. Land converted to wetland kt CO2 eq - - - - -
3. Other g kt CO2 eq - - - - -
E. Settlements kt CO2 eq - - - - -
1. Settlements remaining settlements kt CO2 eq - - - - -
2. Land converted to settlements kt CO2 eq - - - - -
3. Other g kt CO2 eq - - - - -
F. Other land kt CO2 eq - - - - -
1. Other land remaining other land kt CO2 eq - - - - -
2. Land converted to other land kt CO2 eq - - - - -
3. Other g kt CO2 eq - - - - -
Harvested wood products kt CO2 eq - - - - -
Table 4(b). Reporting on progress
Quantity of units kt CO2 eq
2013
Kyoto Protocol Units d
AAUs
ERUs
CERs
tCERs
lCERs
Units from market-based mechanisms under the Convention d, e
Units from other market-based mechanisms d, e
Total
2014
Kyoto Protocol Units d
AAUs
ERUs
CERs
tCERs
lCERs
Units from market-based mechanisms under the Convention d, e
Units from other market-based mechanisms d, e
Total
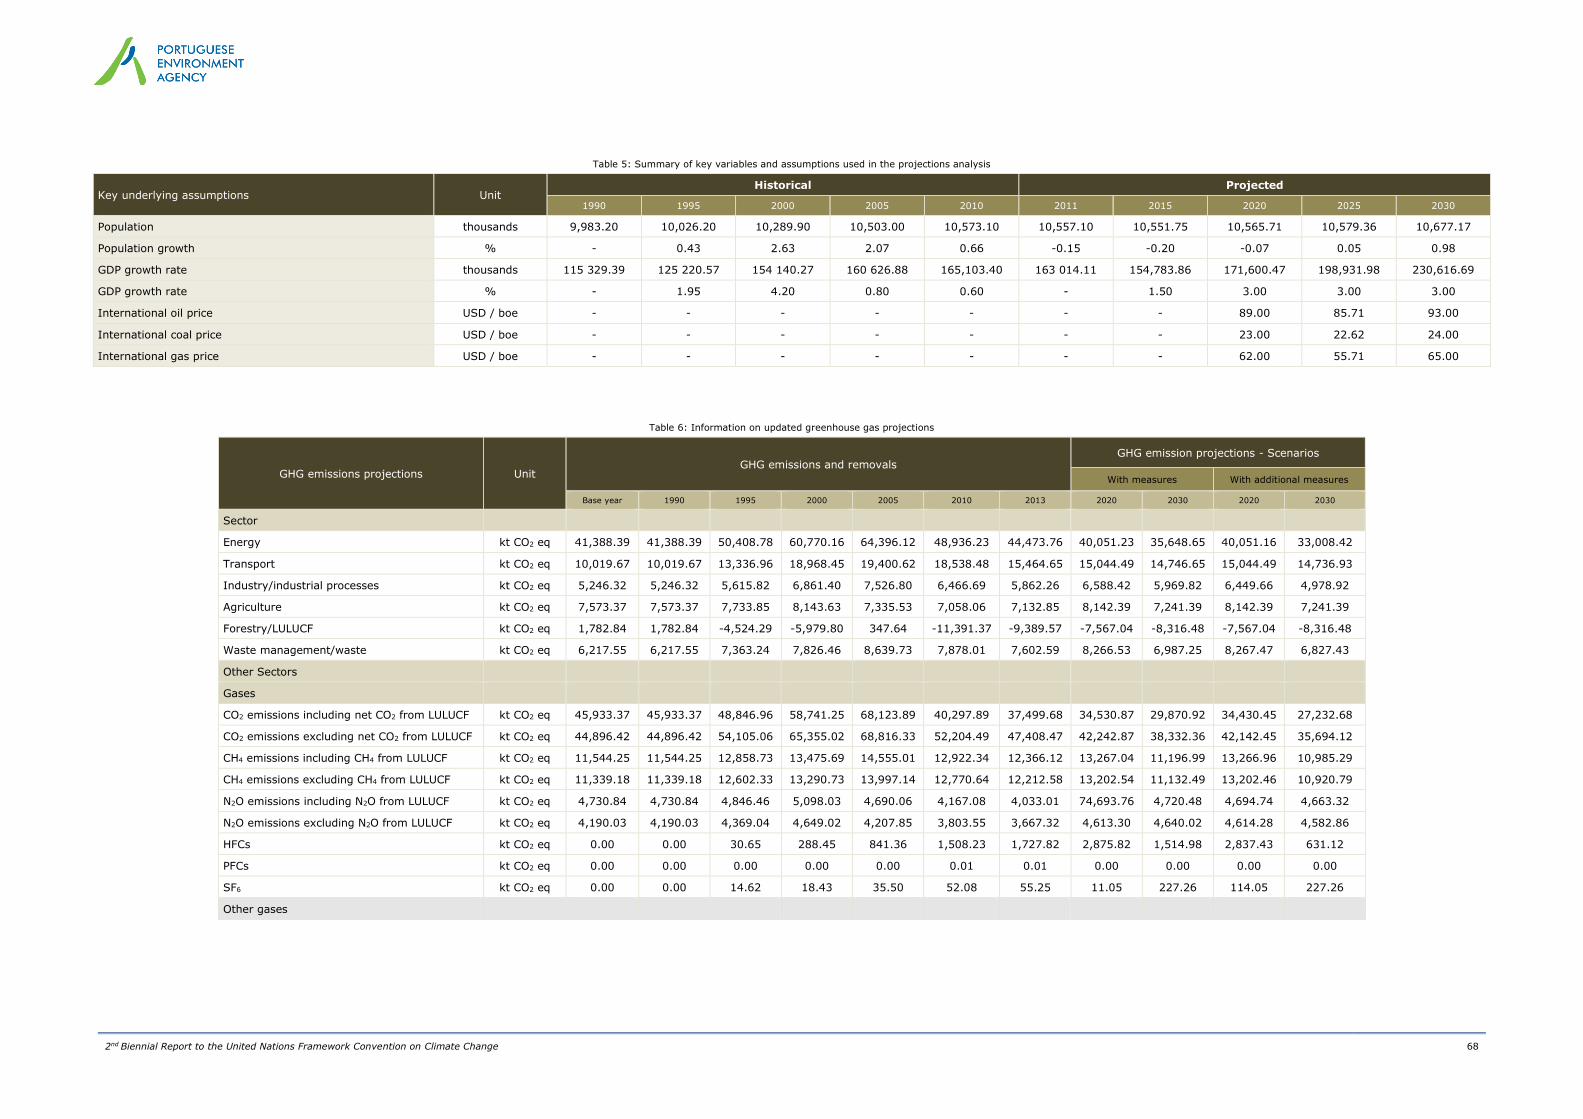
2nd Biennial Report to the United Nations Framework Convention on Climate Change 68
Table 5: Summary of key variables and assumptions used in the projections analysis
Key underlying assumptions Unit Historical Projected
1990 1995 2000 2005 2010 2011 2015 2020 2025 2030
Population thousands 9,983.20 10,026.20 10,289.90 10,503.00 10,573.10 10,557.10 10,551.75 10,565.71 10,579.36 10,677.17
Population growth % - 0.43 2.63 2.07 0.66 -0.15 -0.20 -0.07 0.05 0.98
GDP growth rate thousands 115 329.39 125 220.57 154 140.27 160 626.88 165,103.40 163 014.11 154,783.86 171,600.47 198,931.98 230,616.69
GDP growth rate % - 1.95 4.20 0.80 0.60 - 1.50 3.00 3.00 3.00
International oil price USD / boe - - - - - - - 89.00 85.71 93.00
International coal price USD / boe - - - - - - - 23.00 22.62 24.00
International gas price USD / boe - - - - - - - 62.00 55.71 65.00
Table 6: Information on updated greenhouse gas projections
GHG emissions projections Unit GHG emissions and removals
GHG emission projections - Scenarios
With measures With additional measures
Base year 1990 1995 2000 2005 2010 2013 2020 2030 2020 2030
Sector
Energy kt CO2 eq 41,388.39 41,388.39 50,408.78 60,770.16 64,396.12 48,936.23 44,473.76 40,051.23 35,648.65 40,051.16 33,008.42
Transport kt CO2 eq 10,019.67 10,019.67 13,336.96 18,968.45 19,400.62 18,538.48 15,464.65 15,044.49 14,746.65 15,044.49 14,736.93
Industry/industrial processes kt CO2 eq 5,246.32 5,246.32 5,615.82 6,861.40 7,526.80 6,466.69 5,862.26 6,588.42 5,969.82 6,449.66 4,978.92
Agriculture kt CO2 eq 7,573.37 7,573.37 7,733.85 8,143.63 7,335.53 7,058.06 7,132.85 8,142.39 7,241.39 8,142.39 7,241.39
Forestry/LULUCF kt CO2 eq 1,782.84 1,782.84 -4,524.29 -5,979.80 347.64 -11,391.37 -9,389.57 -7,567.04 -8,316.48 -7,567.04 -8,316.48
Waste management/waste kt CO2 eq 6,217.55 6,217.55 7,363.24 7,826.46 8,639.73 7,878.01 7,602.59 8,266.53 6,987.25 8,267.47 6,827.43
Other Sectors
Gases
CO2 emissions including net CO2 from LULUCF kt CO2 eq 45,933.37 45,933.37 48,846.96 58,741.25 68,123.89 40,297.89 37,499.68 34,530.87 29,870.92 34,430.45 27,232.68
CO2 emissions excluding net CO2 from LULUCF kt CO2 eq 44,896.42 44,896.42 54,105.06 65,355.02 68,816.33 52,204.49 47,408.47 42,242.87 38,332.36 42,142.45 35,694.12
CH4 emissions including CH4 from LULUCF kt CO2 eq 11,544.25 11,544.25 12,858.73 13,475.69 14,555.01 12,922.34 12,366.12 13,267.04 11,196.99 13,266.96 10,985.29
CH4 emissions excluding CH4 from LULUCF kt CO2 eq 11,339.18 11,339.18 12,602.33 13,290.73 13,997.14 12,770.64 12,212.58 13,202.54 11,132.49 13,202.46 10,920.79
N2O emissions including N2O from LULUCF kt CO2 eq 4,730.84 4,730.84 4,846.46 5,098.03 4,690.06 4,167.08 4,033.01 74,693.76 4,720.48 4,694.74 4,663.32
N2O emissions excluding N2O from LULUCF kt CO2 eq 4,190.03 4,190.03 4,369.04 4,649.02 4,207.85 3,803.55 3,667.32 4,613.30 4,640.02 4,614.28 4,582.86
HFCs kt CO2 eq 0.00 0.00 30.65 288.45 841.36 1,508.23 1,727.82 2,875.82 1,514.98 2,837.43 631.12
PFCs kt CO2 eq 0.00 0.00 0.00 0.00 0.00 0.01 0.01 0.00 0.00 0.00 0.00
SF6 kt CO2 eq 0.00 0.00 14.62 18.43 35.50 52.08 55.25 11.05 227.26 114.05 227.26
Other gases

2nd Biennial Report to the United Nations Framework Convention on Climate Change 69
Table 7(a) Provision of public financial support: contribution through multilateral channels
Donor funding
Total Amount
Status Funding source Financial instrument Type of support Sector Core/general Climate-specific
Domestic Currency USD Domestic Currency USD
2013 7 248 472.00 9 623 568.80 - - - - - - -
Total contributions through multilateral channels - - - - - - - - -
Multilateral climate change funds g - - - - - - - - -
1. Global Environment Facility - - - - - - - - -
2. Least Developed Countries Fund - - - - - - - - -
3. Special Climate Change Fund - - - - - - - - -
4. Adaptation Fund - - - - - - - - -
5. Green Climate Fund - - - - - - - - -
6. UNFCCC Trust Fund for Supplementary Activities - - - - - - - - -
7. Other multilateral climate change funds - - - - - - - - -
Multilateral financial institutions, including regional development banks - - - - - - - - -
1. World Bank 1 420 000,00 1 885 289,40 - - Provided ODA Grant Other (Not Applicable) Not applicable
2. International Finance Corporation - - - - - - - - -
3. African Development Bank 2 004 210,00 2 660 926,70 - - Provided ODA Grant Other (Not Applicable) Not applicable
4. Asian Development Bank - - - - - - - - -
5. European Bank for Reconstruction and Development - - - - - - - - -
6. Inter-American Development Bank - - - - - - - - -
7. Other - - - - - - - - -
Andean Development Corporation (CAF) 3 750 000,00 4 978 757,30 - - Provided ODA Grant Other (Not applicable) Not applicable
Specialized United Nations bodies - - - - - - - - -
1. United Nations Development Programme - - - - - - - - -
UNDP 37 288,00 49 506,10 - - Provided ODA Grant Other (Not Applicable) Not applicable
2. United Nations Environment Programme - - - -
UNEP 36 974,00 49 089,20 - - Provided ODA Grant Other (Not Applicable) Not applicable
3. Other - - - - - - - - -
2014 3 469 923.00 4 606 907.87 - - - - - - -
Total contributions through multilateral channels - - - - - - - - -
Multilateral climate change funds g - - - - - - - - -
1. Global Environment Facility - - - - - - - - -
2. Least Developed Countries Fund - - - - - - - - -
3. Special Climate Change Fund - - - - - - - - -
4. Adaptation Fund - - - - - - - - -
5. Green Climate Fund - - - - - - - - -
6. UNFCCC Trust Fund for Supplementary Activities - - - - - - - - -
7. Other multilateral climate change funds - - - - - - - - -
Multilateral financial institutions, including regional development banks - - - - - - - - -
1. World Bank 1 490 000,00 1 978 226,24 - - Provided ODA Grant Other (Not Applicable) Not applicable
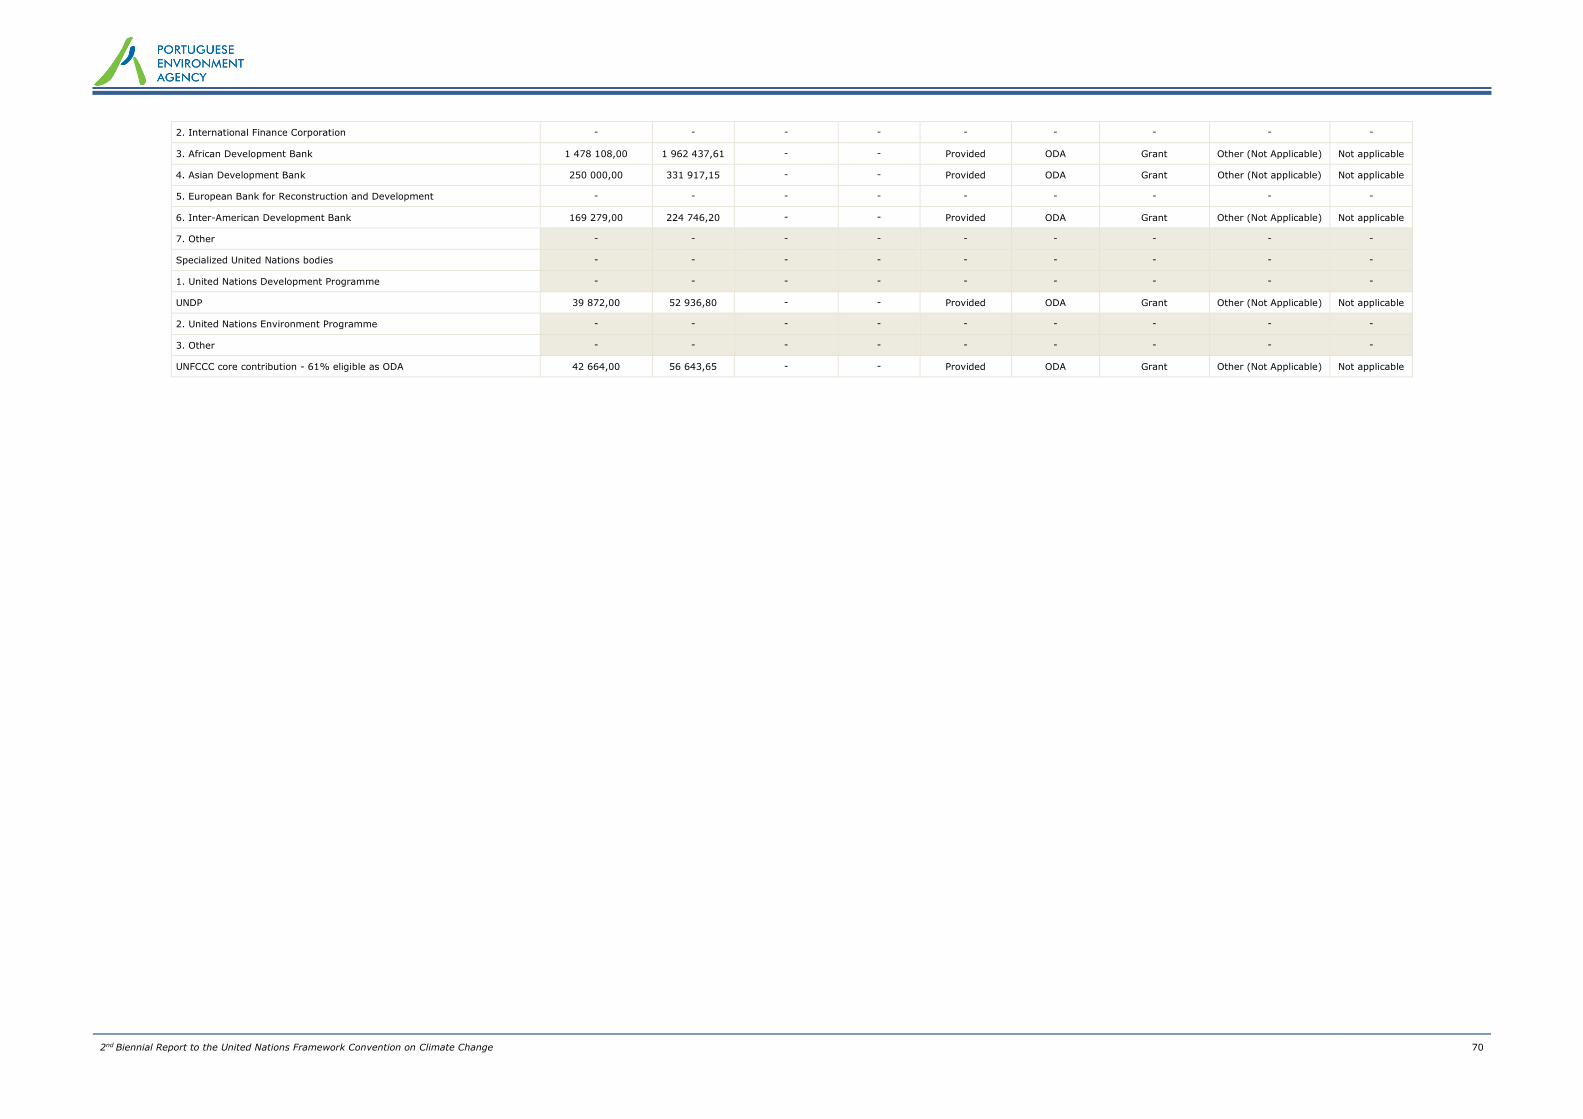
2nd Biennial Report to the United Nations Framework Convention on Climate Change 70
2. International Finance Corporation - - - - - - - - -
3. African Development Bank 1 478 108,00 1 962 437,61 - - Provided ODA Grant Other (Not Applicable) Not applicable
4. Asian Development Bank 250 000,00 331 917,15 - - Provided ODA Grant Other (Not applicable) Not applicable
5. European Bank for Reconstruction and Development - - - - - - - - -
6. Inter-American Development Bank 169 279,00 224 746,20 - - Provided ODA Grant Other (Not Applicable) Not applicable
7. Other - - - - - - - - -
Specialized United Nations bodies - - - - - - - - -
1. United Nations Development Programme - - - - - - - - -
UNDP 39 872,00 52 936,80 - - Provided ODA Grant Other (Not Applicable) Not applicable
2. United Nations Environment Programme - - - - - - - - -
3. Other - - - - - - - - -
UNFCCC core contribution - 61% eligible as ODA 42 664,00 56 643,65 - - Provided ODA Grant Other (Not Applicable) Not applicable
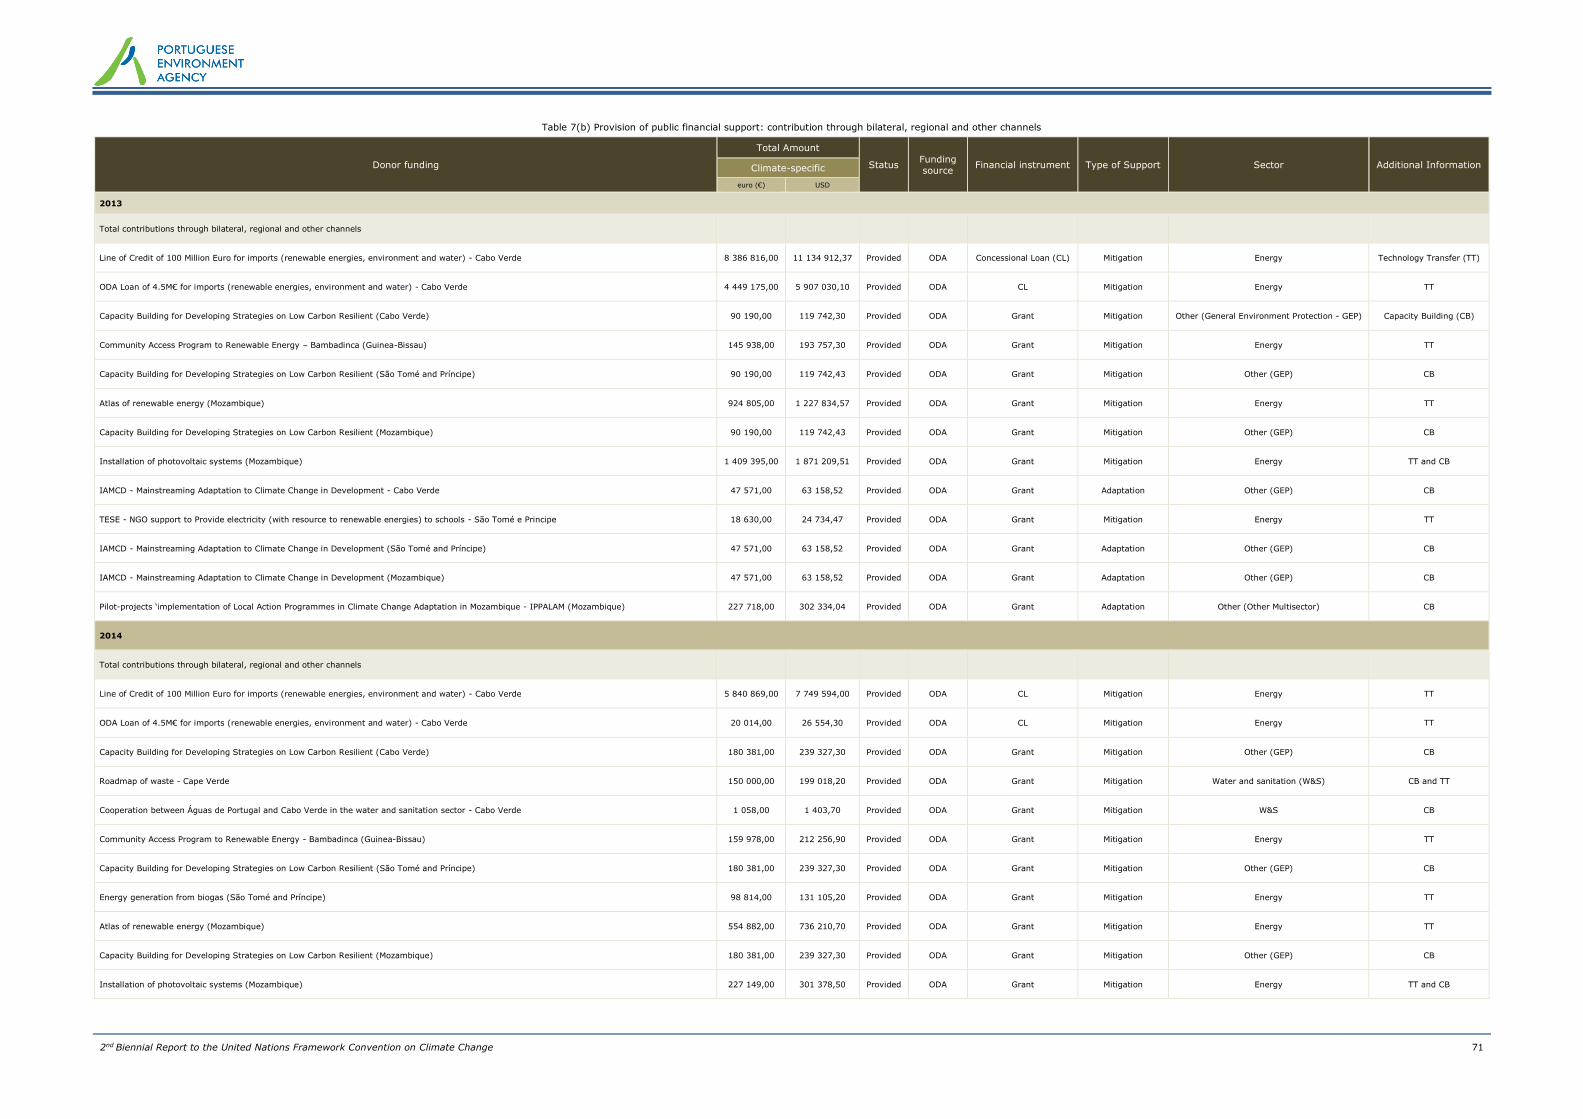
2nd Biennial Report to the United Nations Framework Convention on Climate Change 71
Table 7(b) Provision of public financial support: contribution through bilateral, regional and other channels
Donor funding
Total Amount
Status Funding source
Financial instrument Type of Support Sector Additional Information Climate-specific
euro (€) USD
2013
Total contributions through bilateral, regional and other channels
Line of Credit of 100 Million Euro for imports (renewable energies, environment and water) - Cabo Verde 8 386 816,00 11 134 912,37 Provided ODA Concessional Loan (CL) Mitigation Energy Technology Transfer (TT)
ODA Loan of 4.5M€ for imports (renewable energies, environment and water) - Cabo Verde 4 449 175,00 5 907 030,10 Provided ODA CL Mitigation Energy TT
Capacity Building for Developing Strategies on Low Carbon Resilient (Cabo Verde) 90 190,00 119 742,30 Provided ODA Grant Mitigation Other (General Environment Protection - GEP) Capacity Building (CB)
Community Access Program to Renewable Energy – Bambadinca (Guinea-Bissau) 145 938,00 193 757,30 Provided ODA Grant Mitigation Energy TT
Capacity Building for Developing Strategies on Low Carbon Resilient (São Tomé and Príncipe) 90 190,00 119 742,43 Provided ODA Grant Mitigation Other (GEP) CB
Atlas of renewable energy (Mozambique) 924 805,00 1 227 834,57 Provided ODA Grant Mitigation Energy TT
Capacity Building for Developing Strategies on Low Carbon Resilient (Mozambique) 90 190,00 119 742,43 Provided ODA Grant Mitigation Other (GEP) CB
Installation of photovoltaic systems (Mozambique) 1 409 395,00 1 871 209,51 Provided ODA Grant Mitigation Energy TT and CB
IAMCD - Mainstreaming Adaptation to Climate Change in Development - Cabo Verde 47 571,00 63 158,52 Provided ODA Grant Adaptation Other (GEP) CB
TESE - NGO support to Provide electricity (with resource to renewable energies) to schools - São Tomé e Principe 18 630,00 24 734,47 Provided ODA Grant Mitigation Energy TT
IAMCD - Mainstreaming Adaptation to Climate Change in Development (São Tomé and Príncipe) 47 571,00 63 158,52 Provided ODA Grant Adaptation Other (GEP) CB
IAMCD - Mainstreaming Adaptation to Climate Change in Development (Mozambique) 47 571,00 63 158,52 Provided ODA Grant Adaptation Other (GEP) CB
Pilot-projects ‘implementation of Local Action Programmes in Climate Change Adaptation in Mozambique - IPPALAM (Mozambique) 227 718,00 302 334,04 Provided ODA Grant Adaptation Other (Other Multisector) CB
2014
Total contributions through bilateral, regional and other channels
Line of Credit of 100 Million Euro for imports (renewable energies, environment and water) - Cabo Verde 5 840 869,00 7 749 594,00 Provided ODA CL Mitigation Energy TT
ODA Loan of 4.5M€ for imports (renewable energies, environment and water) - Cabo Verde 20 014,00 26 554,30 Provided ODA CL Mitigation Energy TT
Capacity Building for Developing Strategies on Low Carbon Resilient (Cabo Verde) 180 381,00 239 327,30 Provided ODA Grant Mitigation Other (GEP) CB
Roadmap of waste - Cape Verde 150 000,00 199 018,20 Provided ODA Grant Mitigation Water and sanitation (W&S) CB and TT
Cooperation between Águas de Portugal and Cabo Verde in the water and sanitation sector - Cabo Verde 1 058,00 1 403,70 Provided ODA Grant Mitigation W&S CB
Community Access Program to Renewable Energy - Bambadinca (Guinea-Bissau) 159 978,00 212 256,90 Provided ODA Grant Mitigation Energy TT
Capacity Building for Developing Strategies on Low Carbon Resilient (São Tomé and Príncipe) 180 381,00 239 327,30 Provided ODA Grant Mitigation Other (GEP) CB
Energy generation from biogas (São Tomé and Príncipe) 98 814,00 131 105,20 Provided ODA Grant Mitigation Energy TT
Atlas of renewable energy (Mozambique) 554 882,00 736 210,70 Provided ODA Grant Mitigation Energy TT
Capacity Building for Developing Strategies on Low Carbon Resilient (Mozambique) 180 381,00 239 327,30 Provided ODA Grant Mitigation Other (GEP) CB
Installation of photovoltaic systems (Mozambique) 227 149,00 301 378,50 Provided ODA Grant Mitigation Energy TT and CB
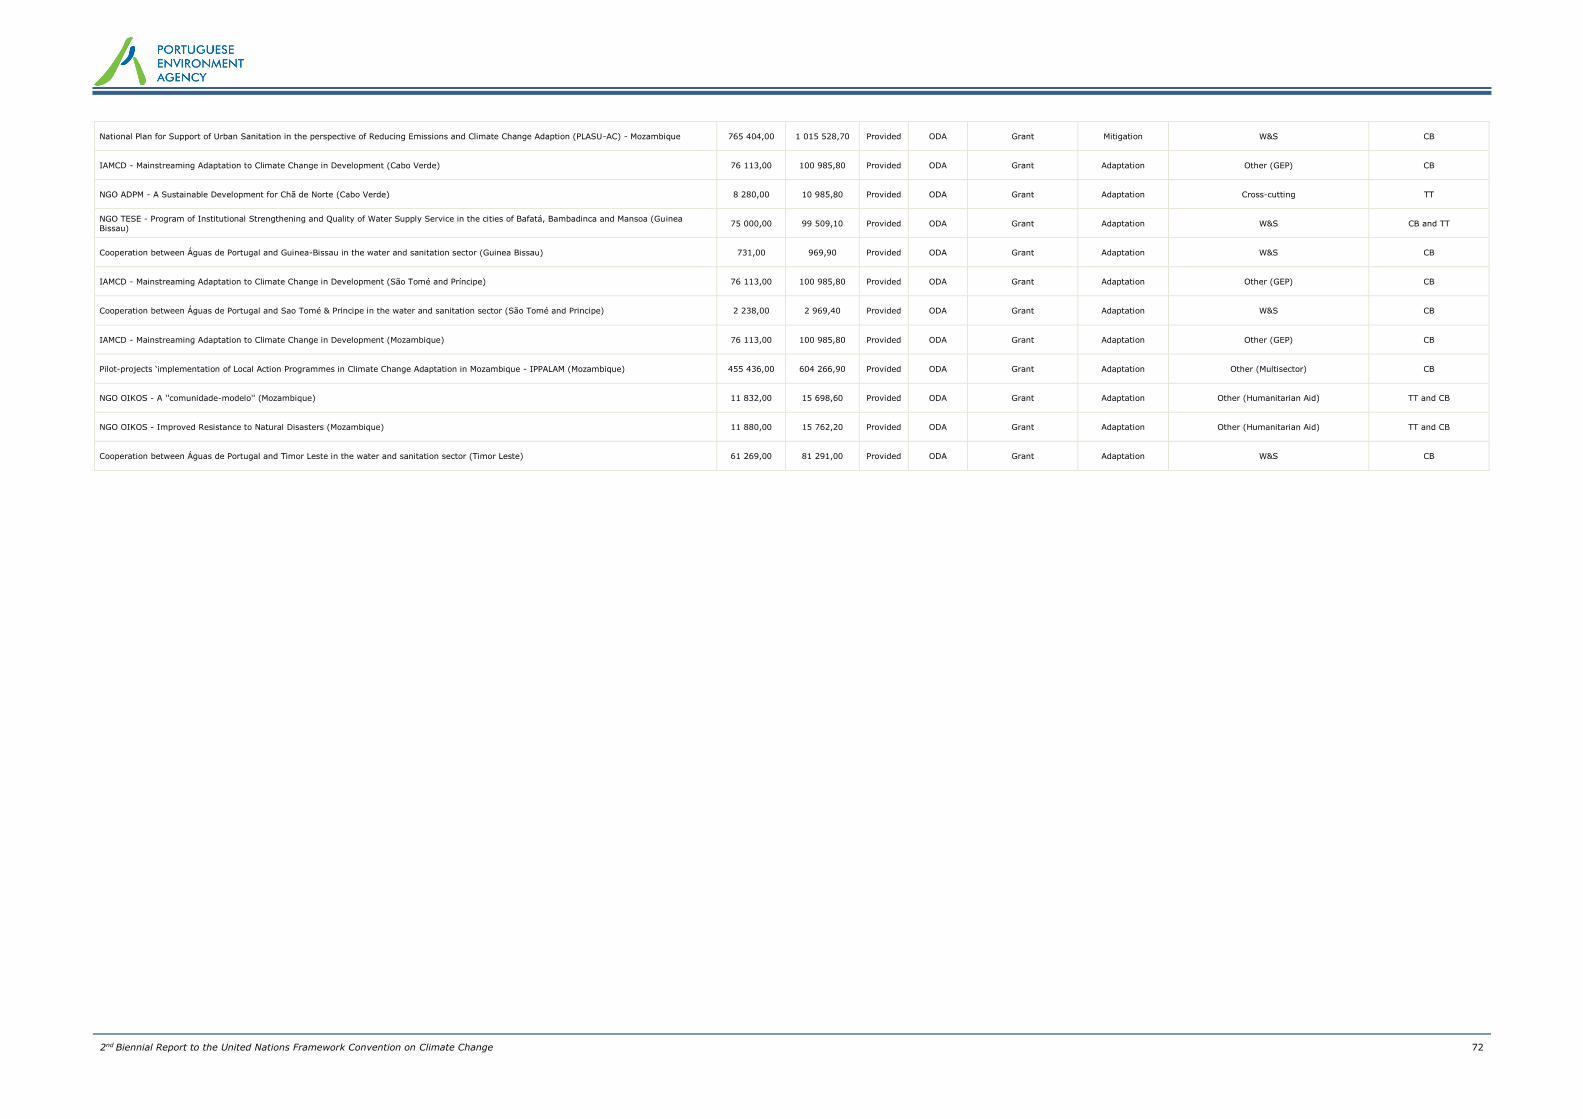
2nd Biennial Report to the United Nations Framework Convention on Climate Change 72
National Plan for Support of Urban Sanitation in the perspective of Reducing Emissions and Climate Change Adaption (PLASU-AC) - Mozambique 765 404,00 1 015 528,70 Provided ODA Grant Mitigation W&S CB
IAMCD - Mainstreaming Adaptation to Climate Change in Development (Cabo Verde) 76 113,00 100 985,80 Provided ODA Grant Adaptation Other (GEP) CB
NGO ADPM - A Sustainable Development for Chã de Norte (Cabo Verde) 8 280,00 10 985,80 Provided ODA Grant Adaptation Cross-cutting TT
NGO TESE - Program of Institutional Strengthening and Quality of Water Supply Service in the cities of Bafatá, Bambadinca and Mansoa (Guinea Bissau)
75 000,00 99 509,10 Provided ODA Grant Adaptation W&S CB and TT
Cooperation between Águas de Portugal and Guinea-Bissau in the water and sanitation sector (Guinea Bissau) 731,00 969,90 Provided ODA Grant Adaptation W&S CB
IAMCD - Mainstreaming Adaptation to Climate Change in Development (São Tomé and Príncipe) 76 113,00 100 985,80 Provided ODA Grant Adaptation Other (GEP) CB
Cooperation between Águas de Portugal and Sao Tomé & Principe in the water and sanitation sector (São Tomé and Principe) 2 238,00 2 969,40 Provided ODA Grant Adaptation W&S CB
IAMCD - Mainstreaming Adaptation to Climate Change in Development (Mozambique) 76 113,00 100 985,80 Provided ODA Grant Adaptation Other (GEP) CB
Pilot-projects ‘implementation of Local Action Programmes in Climate Change Adaptation in Mozambique - IPPALAM (Mozambique) 455 436,00 604 266,90 Provided ODA Grant Adaptation Other (Multisector) CB
NGO OIKOS - A ''comunidade-modelo'' (Mozambique) 11 832,00 15 698,60 Provided ODA Grant Adaptation Other (Humanitarian Aid) TT and CB
NGO OIKOS - Improved Resistance to Natural Disasters (Mozambique) 11 880,00 15 762,20 Provided ODA Grant Adaptation Other (Humanitarian Aid) TT and CB
Cooperation between Águas de Portugal and Timor Leste in the water and sanitation sector (Timor Leste) 61 269,00 81 291,00 Provided ODA Grant Adaptation W&S CB
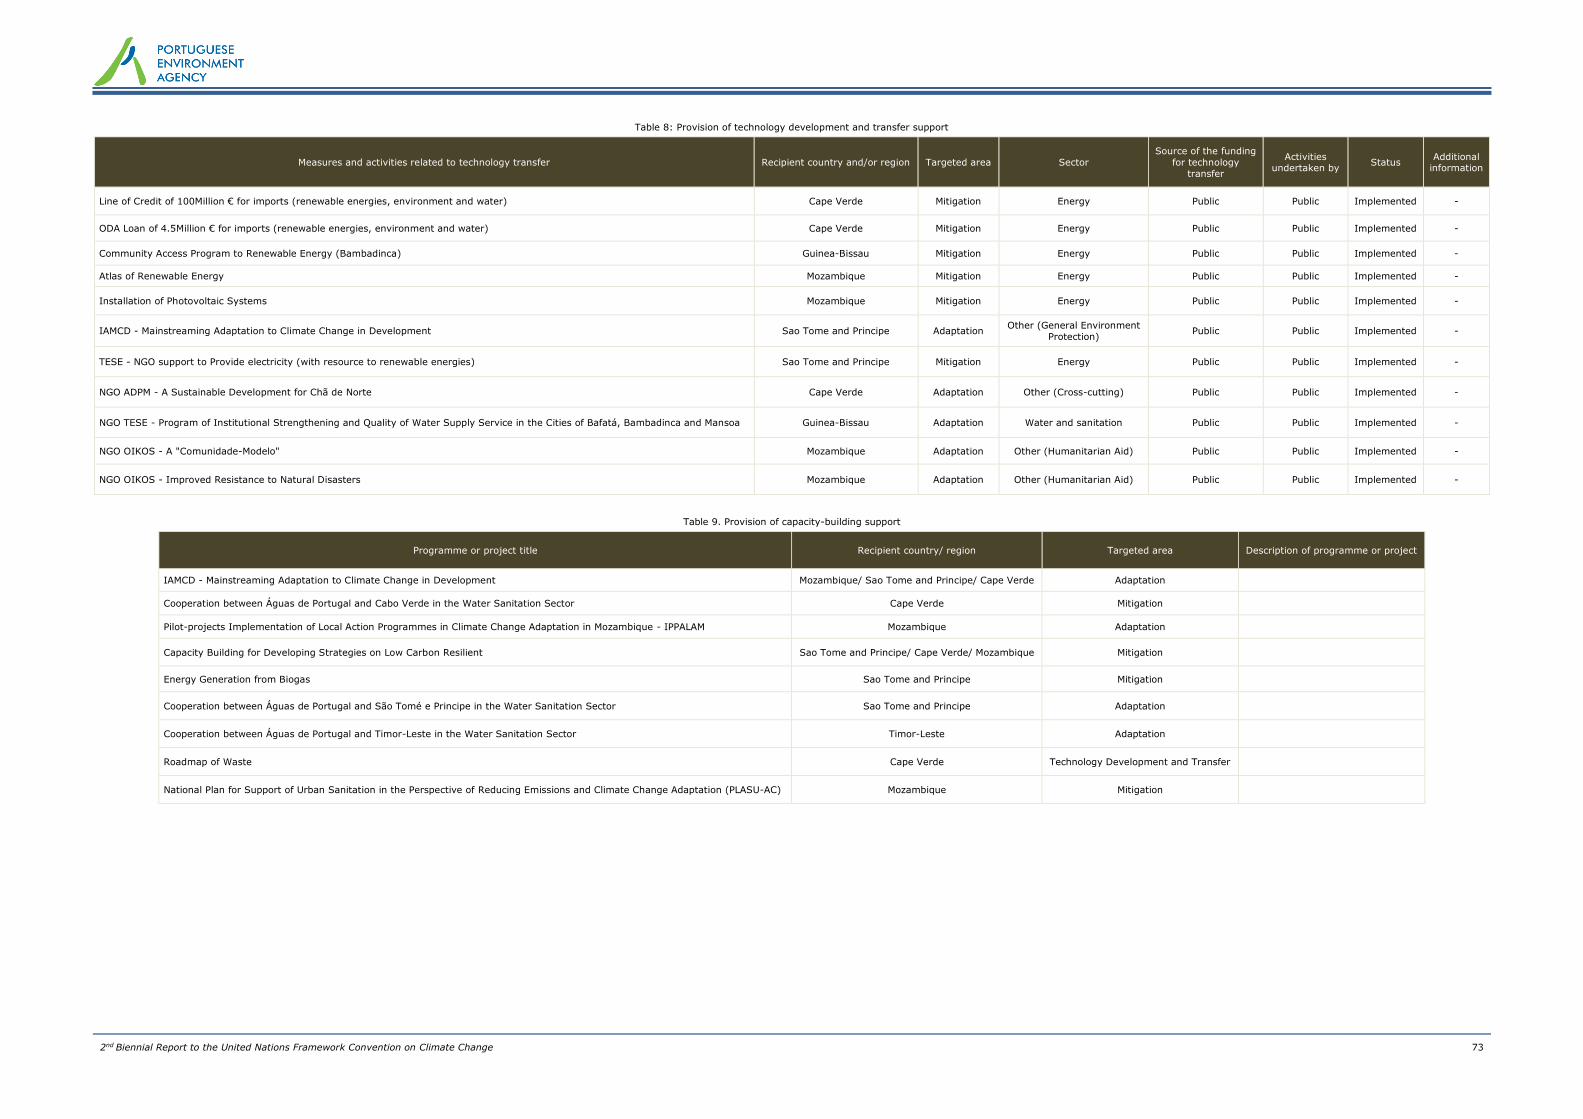
2nd Biennial Report to the United Nations Framework Convention on Climate Change 73
Table 8: Provision of technology development and transfer support
Measures and activities related to technology transfer Recipient country and/or region Targeted area Sector
Source of the funding
for technology
transfer
Activities undertaken by
Status Additional
information
Line of Credit of 100Million € for imports (renewable energies, environment and water) Cape Verde Mitigation Energy Public Public Implemented -
ODA Loan of 4.5Million € for imports (renewable energies, environment and water) Cape Verde Mitigation Energy Public Public Implemented -
Community Access Program to Renewable Energy (Bambadinca) Guinea-Bissau Mitigation Energy Public Public Implemented -
Atlas of Renewable Energy Mozambique Mitigation Energy Public Public Implemented -
Installation of Photovoltaic Systems Mozambique Mitigation Energy Public Public Implemented -
IAMCD - Mainstreaming Adaptation to Climate Change in Development Sao Tome and Principe Adaptation Other (General Environment
Protection) Public Public Implemented -
TESE - NGO support to Provide electricity (with resource to renewable energies) Sao Tome and Principe Mitigation Energy Public Public Implemented -
NGO ADPM - A Sustainable Development for Chã de Norte Cape Verde Adaptation Other (Cross-cutting) Public Public Implemented -
NGO TESE - Program of Institutional Strengthening and Quality of Water Supply Service in the Cities of Bafatá, Bambadinca and Mansoa Guinea-Bissau Adaptation Water and sanitation Public Public Implemented -
NGO OIKOS - A "Comunidade-Modelo" Mozambique Adaptation Other (Humanitarian Aid) Public Public Implemented -
NGO OIKOS - Improved Resistance to Natural Disasters Mozambique Adaptation Other (Humanitarian Aid) Public Public Implemented -
Table 9. Provision of capacity-building support
Programme or project title Recipient country/ region Targeted area Description of programme or project
IAMCD - Mainstreaming Adaptation to Climate Change in Development Mozambique/ Sao Tome and Principe/ Cape Verde Adaptation
Cooperation between Águas de Portugal and Cabo Verde in the Water Sanitation Sector Cape Verde Mitigation
Pilot-projects Implementation of Local Action Programmes in Climate Change Adaptation in Mozambique - IPPALAM Mozambique Adaptation
Capacity Building for Developing Strategies on Low Carbon Resilient Sao Tome and Principe/ Cape Verde/ Mozambique Mitigation
Energy Generation from Biogas Sao Tome and Principe Mitigation
Cooperation between Águas de Portugal and São Tomé e Principe in the Water Sanitation Sector Sao Tome and Principe Adaptation
Cooperation between Águas de Portugal and Timor-Leste in the Water Sanitation Sector Timor-Leste Adaptation
Roadmap of Waste Cape Verde Technology Development and Transfer
National Plan for Support of Urban Sanitation in the Perspective of Reducing Emissions and Climate Change Adaptation (PLASU-AC) Mozambique Mitigation