2D and 3D Millimeter-Wave Synthetic Aperture Radar Imaging ...planc509/iros2016.pdf · 2D and 3D...
7
2D and 3D Millimeter-Wave Synthetic Aperture Radar Imaging on a PR2 Platform Claire M. Watts 1 , Patrick Lancaster 2 , Andreas Pedross-Engel 1 , Joshua R. Smith 1,2 , and Matthew S. Reynolds 1,2 Abstract— Optical depth cameras, including both time-of- flight and structured-light sensors, have led to dramatic im- provements in robot sensing and perception. We propose the use of millimeter-wave (mmW) radar as an important complement to optical sensors. While the millimeter wavelengths of radar sensors do not support as high resolution as the nanometer wavelength of optical sensors, the ability of mmW signals to penetrate smoky and foggy environments as well as see through many opaque objects makes them a compelling sensor for navigation as well as manipulation in challenging environments. We present a series of 2D and 3D mmW images made with a hand-held antenna grasped by a PR2 robot. The radar image sensor uses a mechanical “painting” motion to acquire multiple views of the target object over the 15 - 26.5 GHz K-band. A GPU-based reconstruction algorithm synthesizes 2D and 3D images of the target object. We demonstrate a ground range resolution of 13.6 mm and a cross-range resolution of 7.1 mm for objects up to 0.5 m away from the robot. We further demonstrate imaging objects through fog, as well as through opaque paper. I. I NTRODUCTION Radar imaging systems have their roots in military sensing applications and were developed during World War II [1]. Radar is still an essential sensing technology today, and has increasing potential to augment widely-used optical sensors such as depth cameras and lidar in challenging environments. Millimeter wave (mmW) imaging can augment optical systems by overcoming some of their fundamental limita- tions, such as nighttime imaging, sensing over long distances, and even imaging in adverse weather such as rain and fog [2]. Mobile autonomous systems could benefit greatly from mmW imaging for navigation. For example, the lidar systems currently mounted on many self-driving cars have trouble operating in heavy rain [3]. The integration of a mmW imager into an autonomous vehicle would pave the way for all-weather operation. Current technology for robot navigation includes optical cameras, sonar [4], laser range finders [5], and structured light such as the Microsoft Kinect [6]. In addition to adding improved resolution to sonar sensing systems, millimeter 1 Claire M. Watts, Andreas Pedross-Engel, Joshua R. Smith, and Matthew S. Reynolds are with the Department of Electrical Engineering, University of Washington, Seattle, WA 98105, USA [email protected], [email protected], [email protected], [email protected] 2 Patrick Lancaster, Joshua R. Smith, and Matthew S. Reynolds are with the Department of Computer Science and Engineering, University of Washington, Seattle, WA 98105, USA [email protected] wave imaging could also greatly expand the utility of robotic systems operating in hazardous environments, such as in a smoke-filled building, or in other environments where threat objects may be concealed from optical view. For example, there has been significant investment in robots to seek out land mines, where navigating dangerous obscured threats is essential [7]. In this work, we demonstrate synthetic aperture radar (SAR) imaging with K-band (15 - 26.5 GHz) antennas mounted on a PR2 robot. The robot arm allows the antennas to be moved with 7 degrees of freedom to gather multiple views of a scene that can be coherently reconstructed to form 2D and 3D images. In addition, we demonstrate the capability of mmW imaging through various impairments that optical cameras cannot penetrate, such as opaque coverings and fog. We show that K-band SAR images add a new imaging capability for sensing and perception in autonomous robotic systems. II. RELATED WORK While SAR imaging for mobile robot navigation has been previously demonstrated, factors have prevented systems from achieving the resolution we achieve here, which is closer to optical images. Ultra wideband imaging systems have typically given limited resolution, on the order of meters, due to their long operation wavelength [8]. In ad- dition, current systems that operate at shorter wavelengths, into the millimeter wave regime, have narrow bandwidths on the order of a few hundred MHz, also limiting their resolution [9], [10]. We are able to image smaller and more complex objects than similar robotic SAR systems through the use of both high frequency millimeter waves and a much wider bandwidth of over 10 GHz, yielding range resolution on the order of 10 mm. In addition, this work is not limited to sensing objects that have been previously tagged, as is the case when localizing RFID tagged objects [11], [12]. The approach presented here allows for imaging of arbitrary scenes with unknown objects, as long as the objects have reflectivity in the mmW band. III. OVERVIEW OF SAR I MAGING A. Basic SAR Mechanism Radar (radio detection and ranging) imaging transmits electromagnetic radiation onto a scene and uses the backscat- tered signal to gain information about the reflectivity profile of the scene [1]. Often, chirps (compressed high intensity
Transcript of 2D and 3D Millimeter-Wave Synthetic Aperture Radar Imaging ...planc509/iros2016.pdf · 2D and 3D...
2D and 3D Millimeter-Wave Synthetic Aperture Radar Imaging on aPR2 Platform
Claire M. Watts1, Patrick Lancaster2, Andreas Pedross-Engel1, Joshua R. Smith1,2, and Matthew S. Reynolds1,2
Abstract— Optical depth cameras, including both time-of-flight and structured-light sensors, have led to dramatic im-provements in robot sensing and perception. We propose the useof millimeter-wave (mmW) radar as an important complementto optical sensors. While the millimeter wavelengths of radarsensors do not support as high resolution as the nanometerwavelength of optical sensors, the ability of mmW signals topenetrate smoky and foggy environments as well as see throughmany opaque objects makes them a compelling sensor fornavigation as well as manipulation in challenging environments.We present a series of 2D and 3D mmW images made with ahand-held antenna grasped by a PR2 robot. The radar imagesensor uses a mechanical “painting” motion to acquire multipleviews of the target object over the 15 − 26.5 GHz K-band. AGPU-based reconstruction algorithm synthesizes 2D and 3Dimages of the target object. We demonstrate a ground rangeresolution of 13.6 mm and a cross-range resolution of 7.1 mmfor objects up to 0.5 m away from the robot. We furtherdemonstrate imaging objects through fog, as well as throughopaque paper.
I. INTRODUCTION
Radar imaging systems have their roots in military sensingapplications and were developed during World War II [1].Radar is still an essential sensing technology today, and hasincreasing potential to augment widely-used optical sensorssuch as depth cameras and lidar in challenging environments.
Millimeter wave (mmW) imaging can augment opticalsystems by overcoming some of their fundamental limita-tions, such as nighttime imaging, sensing over long distances,and even imaging in adverse weather such as rain andfog [2]. Mobile autonomous systems could benefit greatlyfrom mmW imaging for navigation. For example, the lidarsystems currently mounted on many self-driving cars havetrouble operating in heavy rain [3]. The integration of ammW imager into an autonomous vehicle would pave theway for all-weather operation.
Current technology for robot navigation includes opticalcameras, sonar [4], laser range finders [5], and structuredlight such as the Microsoft Kinect [6]. In addition to addingimproved resolution to sonar sensing systems, millimeter
1Claire M. Watts, Andreas Pedross-Engel, Joshua R. Smith, and MatthewS. Reynolds are with the Department of Electrical Engineering, Universityof Washington, Seattle, WA 98105, USA [email protected],[email protected], [email protected],[email protected]
2Patrick Lancaster, Joshua R. Smith, and Matthew S.Reynolds are with the Department of Computer Science andEngineering, University of Washington, Seattle, WA 98105, [email protected]
wave imaging could also greatly expand the utility of roboticsystems operating in hazardous environments, such as in asmoke-filled building, or in other environments where threatobjects may be concealed from optical view. For example,there has been significant investment in robots to seek outland mines, where navigating dangerous obscured threats isessential [7].
In this work, we demonstrate synthetic apertureradar (SAR) imaging with K-band (15 − 26.5 GHz)antennas mounted on a PR2 robot. The robot arm allowsthe antennas to be moved with 7 degrees of freedom togather multiple views of a scene that can be coherentlyreconstructed to form 2D and 3D images. In addition,we demonstrate the capability of mmW imaging throughvarious impairments that optical cameras cannot penetrate,such as opaque coverings and fog. We show that K-bandSAR images add a new imaging capability for sensing andperception in autonomous robotic systems.
II. RELATED WORK
While SAR imaging for mobile robot navigation has beenpreviously demonstrated, factors have prevented systemsfrom achieving the resolution we achieve here, which iscloser to optical images. Ultra wideband imaging systemshave typically given limited resolution, on the order ofmeters, due to their long operation wavelength [8]. In ad-dition, current systems that operate at shorter wavelengths,into the millimeter wave regime, have narrow bandwidthson the order of a few hundred MHz, also limiting theirresolution [9], [10]. We are able to image smaller and morecomplex objects than similar robotic SAR systems throughthe use of both high frequency millimeter waves and a muchwider bandwidth of over 10 GHz, yielding range resolutionon the order of 10 mm. In addition, this work is not limitedto sensing objects that have been previously tagged, as isthe case when localizing RFID tagged objects [11], [12].The approach presented here allows for imaging of arbitraryscenes with unknown objects, as long as the objects havereflectivity in the mmW band.
III. OVERVIEW OF SAR IMAGING
A. Basic SAR Mechanism
Radar (radio detection and ranging) imaging transmitselectromagnetic radiation onto a scene and uses the backscat-tered signal to gain information about the reflectivity profileof the scene [1]. Often, chirps (compressed high intensity
Antenna Aperture Positions
Azimuth (y)
Ground Range (x)
α
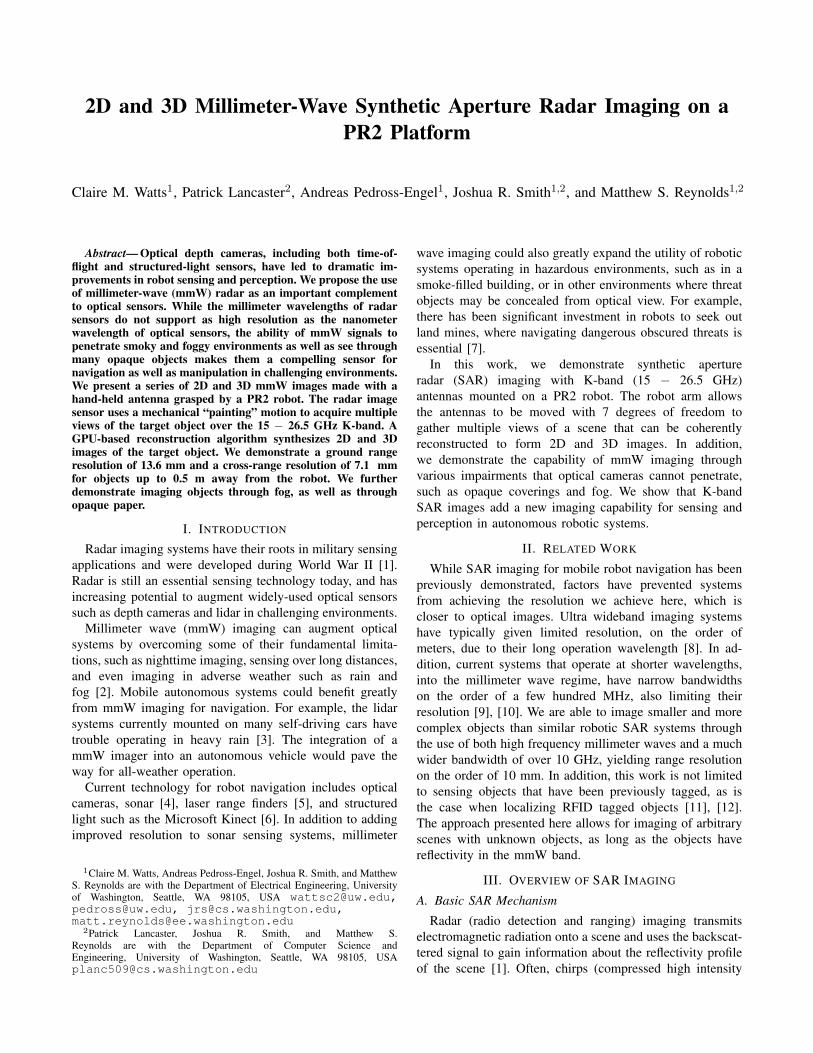
Fig. 1. Conceptual schematic of synthetic aperture radar imaging using an antenna with an aperture da. (a) Stripmap imaging with a fixed squintangle, β and looking angle, α. (b) Spotlight imaging - the antenna beam is steered with variable squint angles, β = [β1, ..., βK ], and looking angles,α = [α1, ..., αK ], in order to constantly illuminate a single area.
radar pulses), in which the frequency linearly changes oversome time period T , are used as the transmit waveform [13].Radar images are usually assumed to be comprised of adense array of point scatterers. Range information for somescattering point in the scene is determined from the timedelay of the backscattered signal via cross-correlation of thetransmitted and received waveforms. The range resolution δr,given as
δr =c02B
, (1)
is proportional to the period of the chirp, T , or inversely pro-portional to the frequency bandwidth, B, where c0 denotesthe speed of light [1].
By moving the radar antenna, another dimension of in-formation is gained (called the cross-range or azimuth di-mension) and is determined by the placement of the antennabeam footprint. Hence, the azimuth resolution δa, given as
δa =λ
dar0, (2)
of these systems is set by the beamwidth of the antenna [13].Here, λ is the wavelength of operation, da is the antennaaperture size, and r0 is the range distance to the target.
B. Benefits of SAR Imaging over Conventional Radar Imag-ing
Synthetic aperture radar imaging is a method which usesthe motion of an antenna to increase the antennas’s effectiveaperture beyond the antenna’s physical size, and henceimproves image resolution. SAR imaging has widespread usein airborne and spaceborne systems, for example to observe
physical properties of the earth, monitor disaster sites, anddetect man-made targets [1].
SAR imaging uses the Doppler shift of backscatteredpulses to determine the cross range position of point scat-terers in the scene. The cross-range resolution is basedon the Doppler resolution of the system, and is thereforeproportional to the time a point in the scene is exposed tothe antenna beam. Thus, in SAR systems δa,SAR is inverselyproportional to the length of the synthetic aperture (LSA),which again is inversely proportional to the size of theantenna [13], so that
δa,SAR =λ
2LSAr0 =
da2. (3)
By moving the antenna, a large antenna aperture is synthe-sized without the size and weight burden that would comefrom having extremely large physical antennas.
C. SAR Imaging Geometry
Fig. 1 shows a conceptual schematic of a SAR imagingsystem. Transmitted and received power can come from thesame source (monostatic SAR) or different sources (bistaticor multistatic SAR). For a 1D scan of a scene (producing a2D image), the antenna moves along the azimuth dimensionand emits radiation in the range dimension, towards theimaged scene. The direction perpendicular to the antennamotion along the plane of the imaging scene is the groundrange dimension. The antenna can be oriented at some anglewith respect to the nadir (the looking angle, α) or the rangevector (the squint angle, β). The looking angle will affect
TX RX
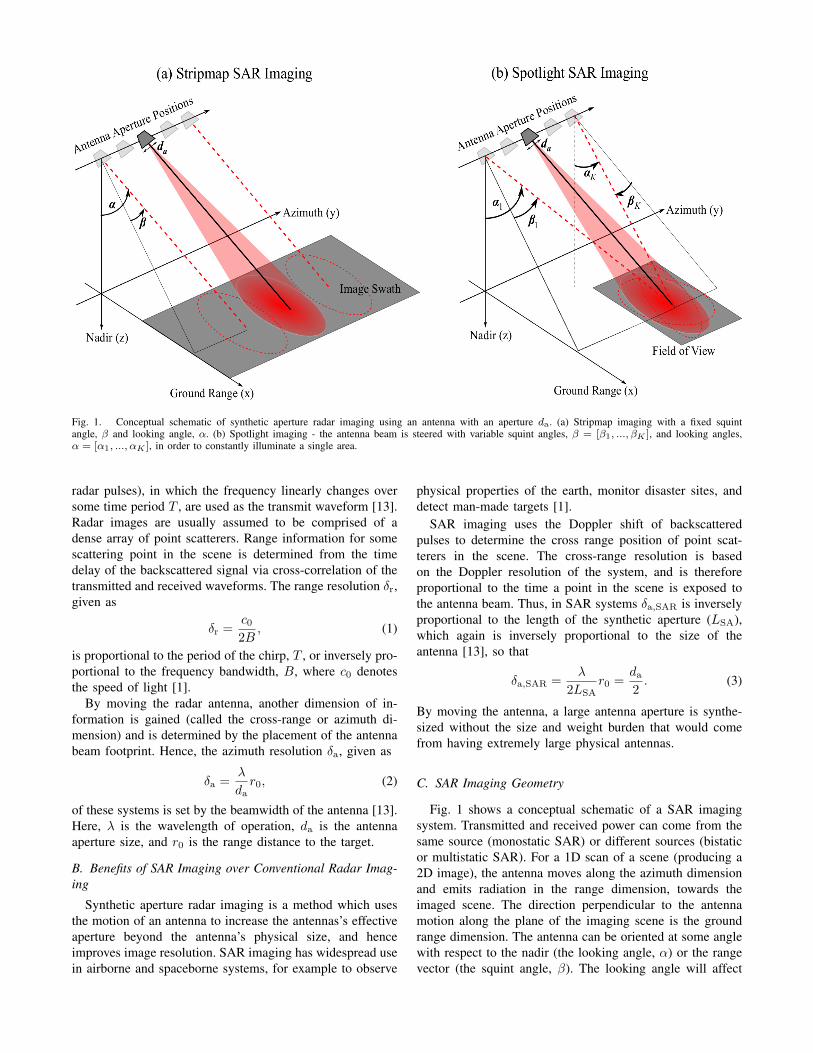
Fig. 2. Photograph of SAR imaging set up with key components labeled.The inset shows the antennas mounted in the grip of the PR2.
the resolution δgr of the ground range, which is given as
δgr =δr
sinα. (4)
D. Modalities of SAR Imaging
There are several methods of SAR imaging that are usefulfor different purposes. Two of the most common typesare called stripmap SAR and spotlight SAR. Fig. 1 detailsthe main difference between these two processes. Stripmap(Fig. 1a) imaging fixes the looking angle and the squintangle, mapping out a swath as the antenna moves. In contrast,spotlight imaging (Fig. 1b) changes the radiation directionof the antenna to illuminate a single area while the antennamoves. While spotlight imaging restricts the image size, theresolution in the azimuth dimension can be increased overstripmap imaging [13].
E. Reconstructing SAR Images
When reconstructing SAR images from measured signals,it is assumed that the region of interest (ROI) can beapproximated by a uniform grid of point targets each with acomplex reflectivity. The SAR hardware collects a numberof transmitter/receiver position dependent transfer functions.These transfer functions encode the position and reflectivityof each point target comprising the region of interest. In mostcases, the equivalent impulse response is obtained from avariant of cross-correlation of the received signal with thetransmitted signal.
The equivalent discrete (sampled) frequency response vec-tor yk at SAR system position k ∈ {1, . . . ,K} of theROI can also be directly measured using a vector networkanalyzer, as we have done in our laboratory imaging mea-surements.
Assuming a scene consisting of M hypothetical pointscatterers, the l-th discretely sampled frequency point of the
measurement vector yk is given as
yk,l =∑m∈M
ρmαk,l,me−jωl
R(xTXk ,xRX
k ,xm)c0 + νk,l, (5)
where ρm is the complex reflection coefficient of the m-th point scatterer, αk,l,m is the propagation channel in-cluding path loss and antenna response, ωl is the angularfrequency of interest, and νk,l is measurement noise. Notethat R
(xTXk ,xRX
k ,xm
)denotes the distance between the
m-th point scatterer and the positions of the antennas at thek-th measurement position, hence
R(xTXk ,xRX
k ,xm
)= ||xTX
k − xm||+ ||xRXk − xm||, (6)
where xTXk is the k-th position of the transmit antenna
phase center, xRXk is the k-th position of the receive antenna
phase center, xm is the position of m-th point scattereras determined by the defined reconstruction grid, and ||x||denotes the norm of the vector x.
Concatenating all K measurements gives
y = Hρ + ν (7)
where y =[yT1 . . .y
TK
]T, ρ = [ρ1 . . . ρM ]
T , ν is mea-surement noise, and (.)T is the transpose operator. Themeasurement matrix H gives the dependence between thepoint scatterers and each measurement.
SAR reconstruction is the solution of the inverse problemdefined in (7) to obtain an estimate of the reflection coeffi-cients ρ̂ from the measurements y, hence
ρ̂ = Ay (8)
where A is the reconstruction matrix. As H is in manycases ill-conditioned, obtaining ρ̂ by multiplying y with e.g.the Moore-Penrose pseudo inverse A =
(H†H
)−1H† [14]
gives an unstable solution, where (.)† denotes the complex-transpose operator. An alternative, which is used in thiswork, is to define A = H† [1], [15], i.e. the matchedfilter reconstruction algorithm. To improve computation timewe implemented this algorithm using Nvidia CUDA, aparallel computing platform and application programminginterface [16].
F. PR2 Robot System
The radar antenna module is actuated by the PR2, shownin Fig. 2, a highly versatile robot created by Willow Garagefor mobile manipulation research. The PR2’s ability to serveas a hardware platform for a wide variety of manipulationtasks is facilitated by its two 7-degree-of-freedom arms.Given a kinematically favorable goal position, the PR2 istypically capable of moving the specified end effector towithin half of a centimeter of that goal. The PR2’s twoend effectors take the form of parallel jaw grippers whosefingertips can be fitted with pressure, optical, electric fieldand other types of sensors in order to gather geometric,surface, and other properties of an object of interest atclose range. The PR2 can also utilize head-mounted cameras,including the Microsoft Kinect, to perceive the surrounding
-0.11
-0.105
-0.1
-0.095
-0.09
-0.085
-0.08
-0.075
-0.07 -3
-2.5
-2
-1.5
-1
-0.5
0-0.1
-0.095
-0.09
-0.085
-0.08
-0.075
-0.07
-0.065
-0.06 -3
-2.5
-2
-1.5
-1
-0.5
0
a) Stripmap PSF
Ground Range (m)
Azim
uth
(m
)
Refl
ecti
on
Co
eff
icie
nt
(dB
)
-0.1
0.04
-0.06
-0.07
-0.08
-0.09
0.05 0.06 0.07 0.08
0
-0.5
-1
-1.5
-2
-2.5
-3
b) Spotlight PSF
Ground Range (m)
Azim
uth
(m
)
Refl
ecti
on
Co
eff
icie
nt
(dB
)
-0.11
0.04
-0.07
-0.08
-0.09
-0.1
0.05 0.06 0.07 0.08
0
-0.5
-1
-1.5
-2
-2.5
-3
δgr = 1.52 cm
δgr = 1.36 cm
δa, SAR
= 1.45 cmδ = 0.71 cma, SAR
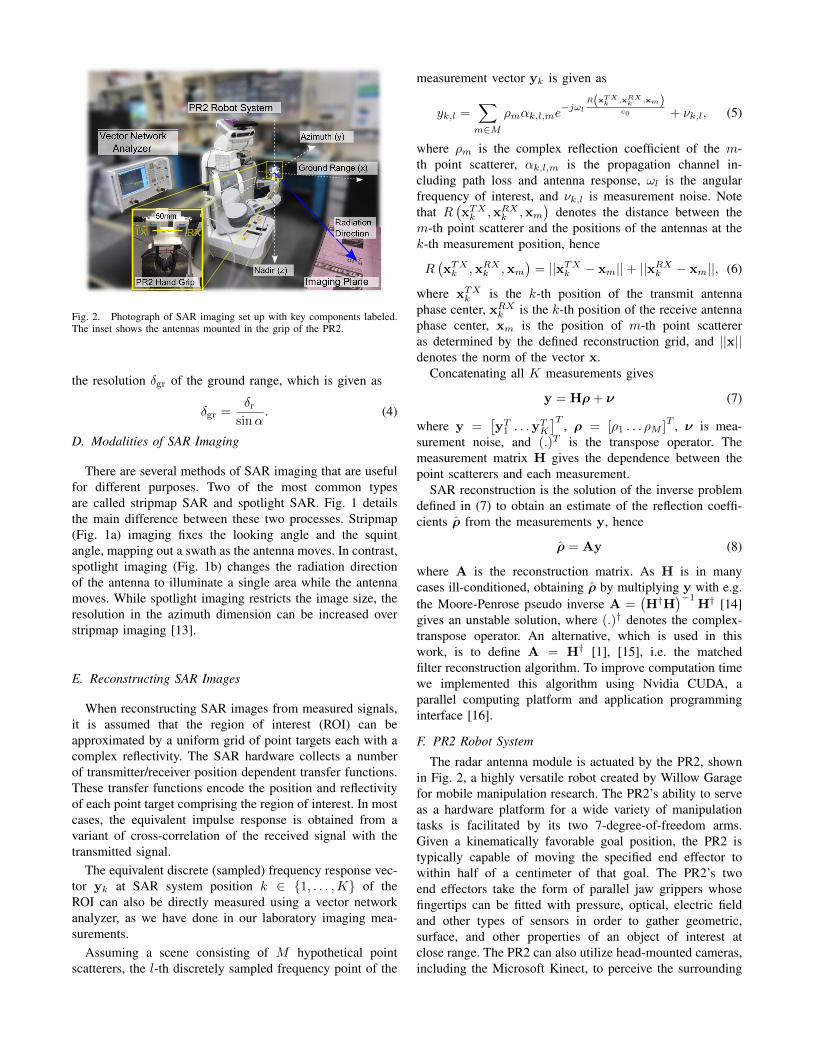
Fig. 3. (a) Stripmap and (b) spotlight images of point sources. Point spread functions display ground range and azimuth resolution.
environment. Two quad core i7 Xeon Processors in the baseof the robot provide the computational power necessary todrive each of the PR2s modules [17].
G. Antenna System
We have outfitted the PR2 with bistatic antennas for SARimaging. The antennas are 10 dB standard gain horn antennaswith beamwidths in the E-field and H-field dimensions of58◦ and 57◦ respectively [18]. The antenna has physicaldimensions of da = 13.2 mm in the azimuth dimension. Thetransmit and receive antennas are mounted approximately50 mm apart, as shown in the inset of Fig. 2.
We use an Agilent A5222N network analyzer as the sourceand receiver. The cables have been calibrated out of themeasurement with a full 2 port calibration method. At eachaperture position, we collect a measurement in the form ofS-parameters, where S12(f ) is the frequency dependent phaseand amplitude measurement of radiation emitted by port 2and received by port 1. These measurements make up thevector y as described in Sec. III-E.
H. SAR Parameters
As seen in Figs. 1 and 2, the antennas move alongthe y axis (azimuth dimension) with a looking angle, α,measured from the z-axis (Nadir). The x-axis (ground range)is parallel to the imaging plane. For the 2D images, wemove the antennas with the PR2 hand at an approximateheight h = 0.36 m above the imaging scene. For allimages shown here, we collect 151 frequency-dependentmeasurements as we step through the aperture positions,thus giving us information to reconstruct the image. Wemove the antennas a total linear distance of 0.6 m in theazimuth direction using a step size of 4 mm. With 151points, each SAR imaging measurement takes approximately12 minutes, limited by the MATLAB control of the PR2 and
very slow data acquisition from the network analyzer (thiswould require only milliseconds with dedicated hardware). Inaddition, for each image, we take a background measurementin order to remove spurious reflections. When reconstructingthe image, we coherently subtract the background from themeasurement of the scene. The images we show here havebeen normalized and displayed on a log scale.
The step size of the moving aperture in SAR imagingmust meet the Nyquist criterion to avoid spatial aliasing. Thelimit on the step size can be given by the azimuth resolution∆ymax = da
2 = 6.6 mm with our antenna characteristics.Therefore, a step size of 4 mm will prevent aliasing in theazimuth domain. For both stripmap and spotlight mode, weuse a bandwidth of 11.5 GHz, predicting a range resolutionof δr = 1.3 cm.
In stripmap imaging, the length of our synthetic aper-ture is related to the physical antenna size in the az-imuth dimension. Thus our predicted azimuth resolution isδa,SAR = da
2 = 6.6 mm. For these measurements weuse a looking angle of α = 55◦ and a squint angle ofβ = 0◦. The main lobe of the antennas is centered at aground range of approximately Rg = 0.5 m from the planeof antenna motion. Our predicted ground range resolution isδgr = 1.59 cm. In spotlight mode, we move the squint anglefrom approximately −29◦ to 21◦ as we move the antennasalong the linear path.
One potential source of error in our system is mismatchin the antenna positions for the background and imagemeasurements due to limited repeatability of PR2 gripperposition. These mismatches will result in noise (phantompoints) in the reconstructed image.
-0.094 -0.061 -0.028 0.005
Azimuth (m)
-0.12
-0.086
-0.052
-0.018
Gro
und R
ange
(m)
-0.2 -0.12 -0.04 0.04 0.12
Azimuth (m)
-0.2
-0.13
-0.06
0.01
0.08
0.15
Gro
un
d R
ang
e (m
)
-0.1 -0.04 0.02 0.08 0.14 0.2
Ground Range (m)
-0.1
-0.06
-0.02
0.02
0.06
0.1
Azi
mu
th (
m)
a)
d)
b)
c)
e)
0.2-8
-7
-6
-5
-4
-3
-2-2
-4
-6
-8 Ref
lect
ion
Coef
fici
ent
(dB
)
0.12-10
-9
-8
-7
-6
-5-5
-7
-9
Ref
lect
ion C
oef
fici
ent
(dB
)
-11
-10
-9
-8
-7
-6
-5
-4-4
-6
-8
Ref
lect
ion C
oef
fici
ent
(dB
)
-10
f)
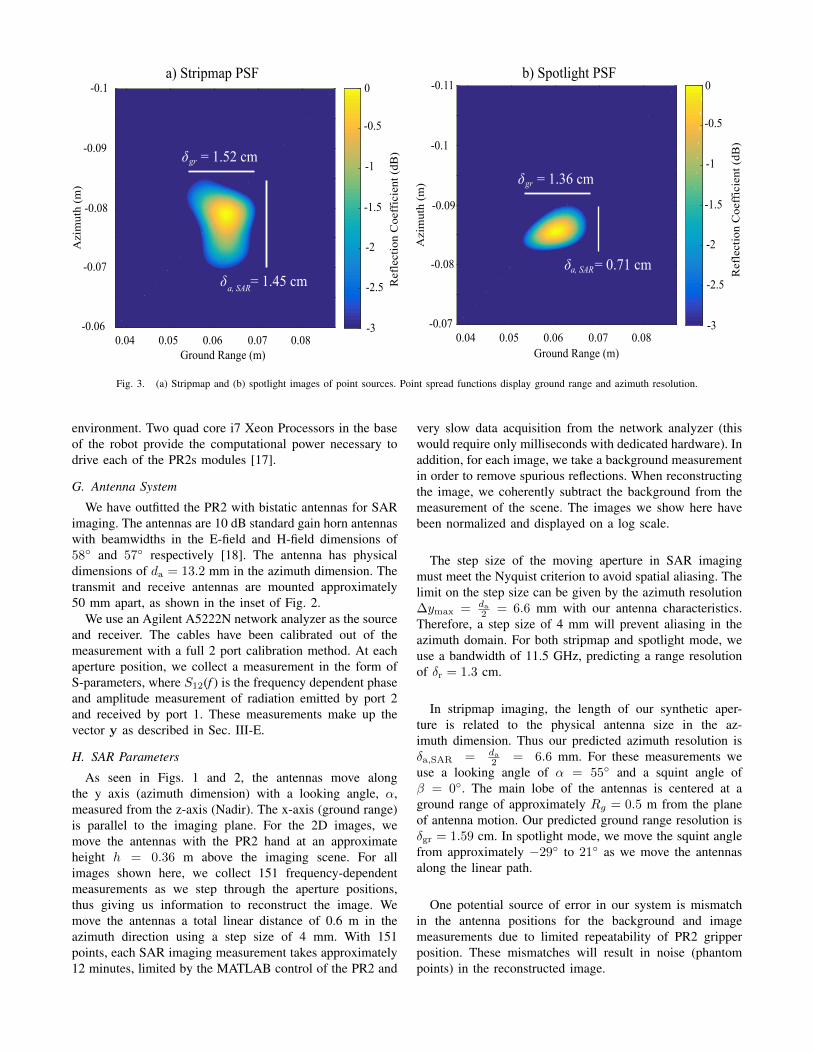
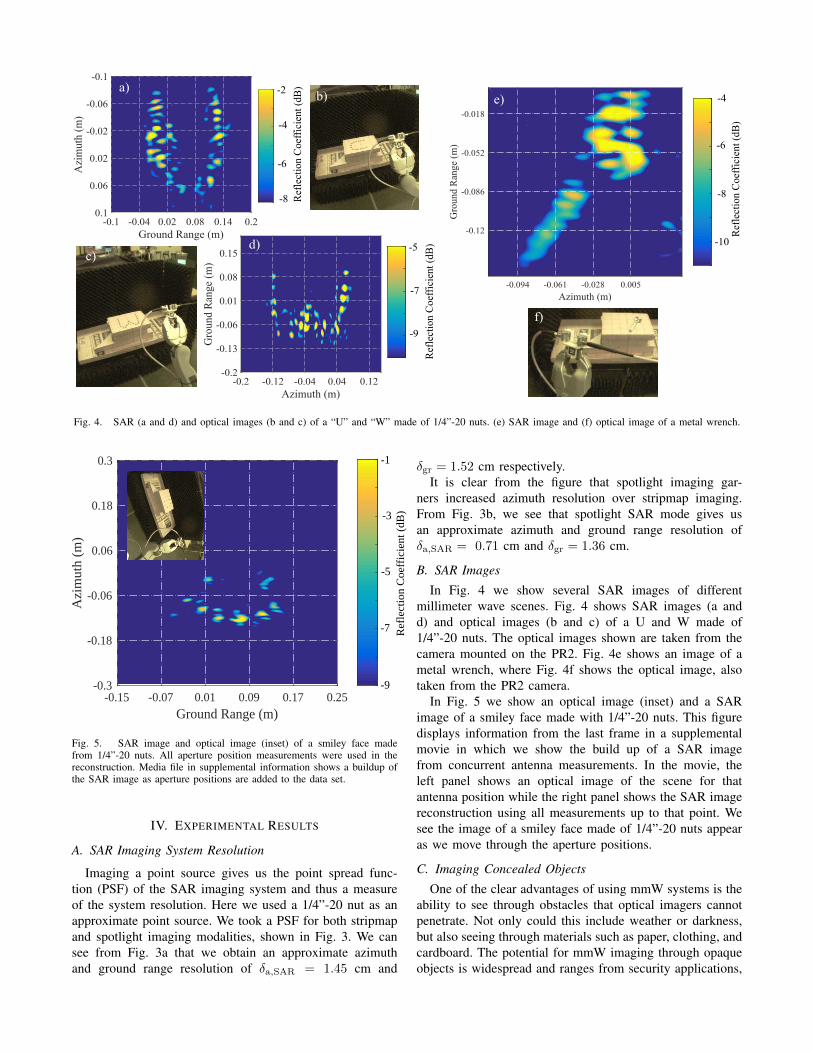
Fig. 4. SAR (a and d) and optical images (b and c) of a “U” and “W” made of 1/4”-20 nuts. (e) SAR image and (f) optical image of a metal wrench.
-0.15 -0.07 0.01 0.09 0.17 0.25
Ground Range (m)
-0.3
-0.18
-0.06
0.06
0.18
0.3
Azi
muth
(m
)
-1
-3
-5
-7
-9
Ref
lect
ion
Co
effi
cien
t (d
B)
Fig. 5. SAR image and optical image (inset) of a smiley face madefrom 1/4”-20 nuts. All aperture position measurements were used in thereconstruction. Media file in supplemental information shows a buildup ofthe SAR image as aperture positions are added to the data set.
IV. EXPERIMENTAL RESULTS
A. SAR Imaging System Resolution
Imaging a point source gives us the point spread func-tion (PSF) of the SAR imaging system and thus a measureof the system resolution. Here we used a 1/4”-20 nut as anapproximate point source. We took a PSF for both stripmapand spotlight imaging modalities, shown in Fig. 3. We cansee from Fig. 3a that we obtain an approximate azimuthand ground range resolution of δa,SAR = 1.45 cm and
δgr = 1.52 cm respectively.It is clear from the figure that spotlight imaging gar-
ners increased azimuth resolution over stripmap imaging.From Fig. 3b, we see that spotlight SAR mode gives usan approximate azimuth and ground range resolution ofδa,SAR = 0.71 cm and δgr = 1.36 cm.
B. SAR Images
In Fig. 4 we show several SAR images of differentmillimeter wave scenes. Fig. 4 shows SAR images (a andd) and optical images (b and c) of a U and W made of1/4”-20 nuts. The optical images shown are taken from thecamera mounted on the PR2. Fig. 4e shows an image of ametal wrench, where Fig. 4f shows the optical image, alsotaken from the PR2 camera.
In Fig. 5 we show an optical image (inset) and a SARimage of a smiley face made with 1/4”-20 nuts. This figuredisplays information from the last frame in a supplementalmovie in which we show the build up of a SAR imagefrom concurrent antenna measurements. In the movie, theleft panel shows an optical image of the scene for thatantenna position while the right panel shows the SAR imagereconstruction using all measurements up to that point. Wesee the image of a smiley face made of 1/4”-20 nuts appearas we move through the aperture positions.
C. Imaging Concealed Objects
One of the clear advantages of using mmW systems is theability to see through obstacles that optical imagers cannotpenetrate. Not only could this include weather or darkness,but also seeing through materials such as paper, clothing, andcardboard. The potential for mmW imaging through opaqueobjects is widespread and ranges from security applications,
-0.3 -0.23 -0.16 -0.09 -0.02 0.05
Azimuth (m)
-0.1
-0.05
0
0.05
0.1
0.15G
round R
ange (
m)
-0.3 -0.23 -0.16 -0.09 -0.02 0.05
Azimuth (m)
-0.1
-0.05
0
0.05
0.1
0.15
-0.3 -0.23 -0.16 -0.09 -0.02 0.05
Azimuth (m)
-0.1
-0.05
0
0.05
0.1
0.15
-0.3 -0.23 -0.16 -0.09 -0.02 0.05
Azimuth (m)
-0.1
-0.05
0
0.05
0.1
0.15
-14
-12
-10
-8
-6
-4
a) b) c) d)-4
-8
-12
Refl
ecti
on
Co
eff
icie
nt
(dB
)
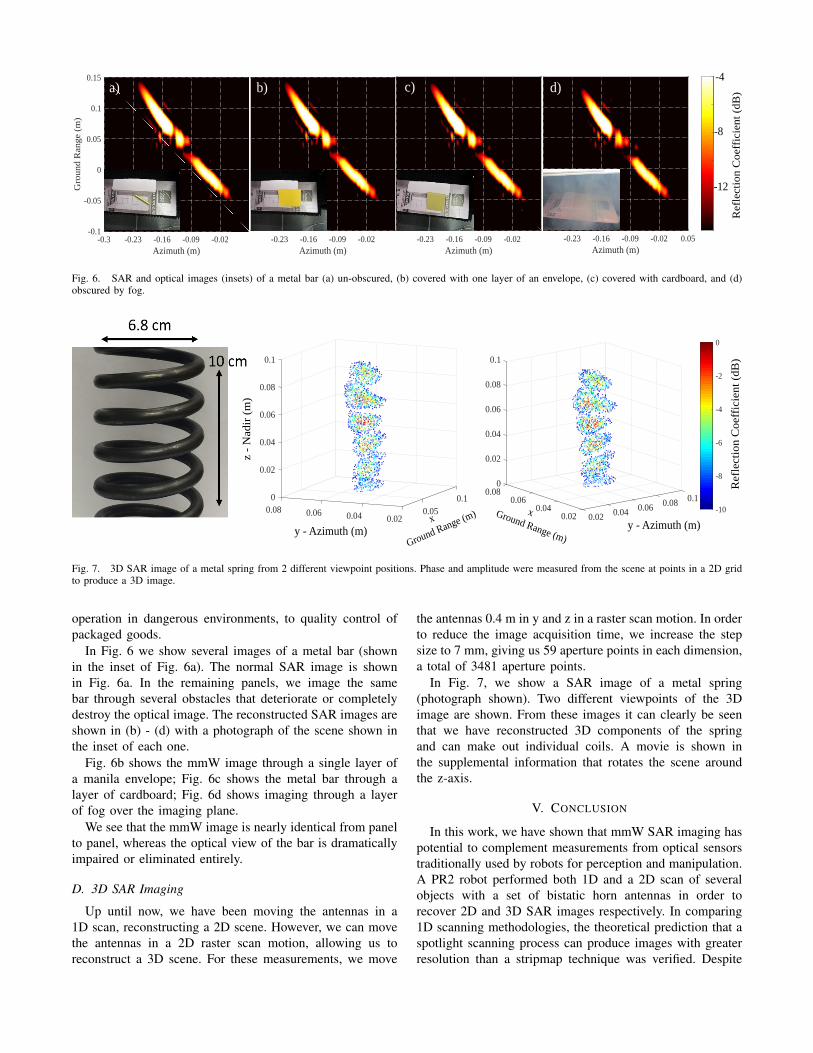
Fig. 6. SAR and optical images (insets) of a metal bar (a) un-obscured, (b) covered with one layer of an envelope, (c) covered with cardboard, and (d)obscured by fog.
0.10
0.08
0.02
0.04
0.05
0.06
0.08
0.06
0.1
0.04 0.02
0
0.02
0.08
0.04
0.06
0.08
0.1
0.10.06 0.080.060.04 0.040.02 0.02
-10
-8
-6
-4
-2
0
refl
ecti
on
co
eff
icie
nt
(dB
)R
efl
ecti
on
Co
eff
icie
nt
(dB
)
x
Ground Range (m)
x Ground Range (m)y - Azimuth (m)
y - Azimuth (m)
z -
Nad
ir (
m)
Fig. 7. 3D SAR image of a metal spring from 2 different viewpoint positions. Phase and amplitude were measured from the scene at points in a 2D gridto produce a 3D image.
operation in dangerous environments, to quality control ofpackaged goods.
In Fig. 6 we show several images of a metal bar (shownin the inset of Fig. 6a). The normal SAR image is shownin Fig. 6a. In the remaining panels, we image the samebar through several obstacles that deteriorate or completelydestroy the optical image. The reconstructed SAR images areshown in (b) - (d) with a photograph of the scene shown inthe inset of each one.
Fig. 6b shows the mmW image through a single layer ofa manila envelope; Fig. 6c shows the metal bar through alayer of cardboard; Fig. 6d shows imaging through a layerof fog over the imaging plane.
We see that the mmW image is nearly identical from panelto panel, whereas the optical view of the bar is dramaticallyimpaired or eliminated entirely.
D. 3D SAR Imaging
Up until now, we have been moving the antennas in a1D scan, reconstructing a 2D scene. However, we can movethe antennas in a 2D raster scan motion, allowing us toreconstruct a 3D scene. For these measurements, we move
the antennas 0.4 m in y and z in a raster scan motion. In orderto reduce the image acquisition time, we increase the stepsize to 7 mm, giving us 59 aperture points in each dimension,a total of 3481 aperture points.
In Fig. 7, we show a SAR image of a metal spring(photograph shown). Two different viewpoints of the 3Dimage are shown. From these images it can clearly be seenthat we have reconstructed 3D components of the springand can make out individual coils. A movie is shown inthe supplemental information that rotates the scene aroundthe z-axis.
V. CONCLUSION
In this work, we have shown that mmW SAR imaging haspotential to complement measurements from optical sensorstraditionally used by robots for perception and manipulation.A PR2 robot performed both 1D and a 2D scan of severalobjects with a set of bistatic horn antennas in order torecover 2D and 3D SAR images respectively. In comparing1D scanning methodologies, the theoretical prediction that aspotlight scanning process can produce images with greaterresolution than a stripmap technique was verified. Despite

imperfect replicability in the robot’s end effector positionbetween background and object image scans, compositionsof point sources and real objects were successfully imagedeven when the object is obscured by opaque materialsor fog. Finally, a 2D radar scan was applied to a metalspring, producing a 3D point cloud that could provide usefulgeometric information in a robot manipulation scenario.
ACKNOWLEDGMENTP.L. and J.R.S. are supported in part by the National Sci-
ence Foundation under grant IIS-1427419. C.M.W., A.P.E.,and M.S.R. acknowledge the support of the United StatesGovernment.
REFERENCES
[1] I. Cumming and F. H. Wong, Digital processing of synthetic apertureradar data: algorithms and implementation. Artech House, 2005.
[2] C. C. Chen, “Attenuation of electromagnetic radiation by haze, fog,clouds, and rain,” DTIC Document, Tech. Rep., 1975.
[3] L. Gomes, “Hidden obstacles for Google‘s self-driving cars,” 2014.[4] J. J. Leonard and H. F. Durrant-Whyte, Directed sonar sensing for
mobile robot navigation. Springer Science & Business Media, 2012,vol. 175.
[5] H. Surmann, K. Lingemann, A. Nuchter, and J. Hertzberg, “A 3Dlaser range finder for autonomous mobile robots,” in Proceedings ofthe 32nd International Symposium on Robotics, 2001, pp. 153–158.
[6] R. El-laithy, J. Huang, and M. Yeh, “Study on the use of MicrosoftKinect for robotics applications,” in Position Location and NavigationSymposium (PLANS), 2012, 2012, pp. 1280 – 1288.
[7] L. Robledo, M. Carrasco, , and D. Mery, “A survey of landmine de-tection technology,” International Journal of Remote Sensing, vol. 30,no. 9, pp. 2399 – 2410, 2009.
[8] L. H. Nguyen, D. C. Wong, B. Stanton, and G. Smith, “Forwardimaging for obstacle avoidance using ultrawideband synthetic apertureradar,” in AeroSense 2003. International Society for Optics andPhotonics, 2003, pp. 519–528.
[9] D. Langer, “An integrated MMW radar system for outdoor naviga-tion,” in Proceedings IEEE International Conference on Robotics andAutomation, vol. 1. IEEE, 1996, pp. 417–422.
[10] F. Ali, G. Bauer, and M. Vossiek, “A rotating synthetic apertureradar imaging concept for robot navigation,” IEEE Transactions onMicrowave Theory and Techniques, vol. 62, no. 7, pp. 1545–1553,2014.
[11] T. Deyle, M. S. Reynolds, and C. C. Kemp, “Finding and navigatingto household objects with UHF RFID tags by optimizing RF signalstrength,” in 2014 IEEE/RSJ International Conference on IntelligentRobots and Systems (IROS 2014). IEEE, 2014, pp. 2579–2586.
[12] A. Marschall, T. Voigt, G. Li, U. Konigorski, and M. Vossiek,“Position control of a robot end-effector based on synthetic aperturewireless localization,” in 2014 IEEE/RSJ International Conference onIntelligent Robots and Systems (IROS 2014). IEEE, 2014, pp. 163–168.
[13] A. Moreira, P. Prats-Iraola, M. Younis, G. Krieger, I. Hajnsek, and K. P.Papathanassiou, “A tutorial on synthetic aperture radar,” Geoscienceand Remote Sensing Magazine, IEEE, vol. 1, no. 1, pp. 6–43, 2013.
[14] A. Albert, Regression and the Moore-Penrose Pseudoinverse. Aca-demic Press, New York, 1972.
[15] R. Solimene, I. Catapano, G. Gennarelli, A. Cuccaro,A. Dell’Aversano, and F. Soldovieri, “SAR imaging algorithmsand some unconventional applications: A unified mathematicaloverview,” IEEE Signal Processing Magazine, vol. 31, no. 4, pp.90–98, July 2014.
[16] J. Nickolls, I. Buck, M. Garland, and K. Skadron, “Scalable parallelprogramming with CUDA,” Queue, vol. 6, no. 2, pp. 40–53, Mar. 2008.[Online]. Available: http://doi.acm.org/10.1145/1365490.1365500
[17] PR2 User Manual, 321st ed., Willow Garage, 10 2012.[18] “WR-42 standard gain horn antenna,” http://www.pasternack.com.