29 June 2016 Precious Metals OutlookEquity Research ...
18
DISCLOSURE APPENDIX AT THE BACK OF THIS REPORT CONTAINS IMPORTANT DISCLOSURES, ANALYST CERTIFICATIONS, AND THE STATUS OF NON-US ANALYSTS. US Disclosure: Credit Suisse does and seeks to do business with companies covered in its research reports. As a result, investors should be aware that the Firm may have a conflict of interest that could affect the objectivity of this report. Investors should consider this report as only a single factor in making their investment decision. 29 June 2016 Americas/Canada Equity Research Precious Metals Precious Metals Outlook SECTOR FORECAST Research Analysts Anita Soni, P. Eng., CFA 416 352 4587 [email protected] Ralph M. Profiti, CFA 416 352 4563 [email protected] Robert Reynolds, CPA, CA, CFA 416 352 4516 [email protected] Yan Truong, CFA 416 352 4584 [email protected] Gold bull market extended, $1,500 in view This report details our commodity specific view for gold and silver. For equity implications see "Metals & Mining – 3Q16 Commodities Forecast Update". ■ Gold hits our prior peak price six months ahead on Brexit: Our April 6 th update had forecast $1,350/oz by Q1/17, driven by a gold market deficit in 2016 and 2017 due to supply constraints, stable physical demand and negative real rates supporting gold ETF buying. This price was achieved briefly last week. ■ Prolonged gold strength on prolonged macro uncertainty – we forecast $1,500/oz by early 2017: We raise our gold price forecasts to $1,475/oz in Q4/16 and $1,500/oz in Q1/17. Our average price for 2016 increases by 4%, to $1,317/oz, and by 10% in 2017, to $1,450/oz. The common argument we hear from gold participants is that gold is currently benefitting from a fear trade on Brexit, and that may indeed be the case. But we think this recent fear trade leads to something more enduring as the surprise Brexit vote has solidified and intensified macro and political uncertainty and extended the timeframe for a negative real rate environment in the US and potentially abroad. ■ Growing long term gold demand requires a higher long term price: We increase our long term gold price forecast to $1,300/oz from $1,200/oz as we incorporate our expectation of gold demand growth over the long term from a variety of drivers; including central bank diversification and consumer asset diversification in light of the current economic outlook. We continue to expect gold mine supply to decline at $1,300/oz over the longer term, which could put further upward pressure on LT price expectations. ■ Silver to follow gold higher: We raise our silver price forecasts to $19.50/oz by Q4/16. Our average price for 2016 increases by 6%, to $17.28/oz, and by 15% in 2017, to $19.03/oz. Silver market deficits drive our higher price forecast as we see increased ETF demand and lower our expectation for mine supply. ■ Long term silver price increased to $20/oz from $17.90/oz: Which reflects our higher long term gold price and a return to a 65:1 gold/silver ratio over the long term.
Transcript of 29 June 2016 Precious Metals OutlookEquity Research ...

DISCLOSURE APPENDIX AT THE BACK OF THIS REPORT CONTAINS IMPORTANT DISCLOSURES, ANALYST CERTIFICATIONS, AND THE STATUS OF NON-US ANALYSTS. US Disclosure: Credit Suisse does and seeks to do business with companies covered in its research reports. As a result, investors should be aware that the Firm may have a conflict of interest that could affect the objectivity of this report. Investors should consider this report as only a single factor in making their investment decision.
29 June 2016Americas/CanadaEquity Research
Precious Metals
Precious Metals Outlook SECTOR FORECASTResearch Analysts
Anita Soni, P. Eng., CFA416 352 4587
Ralph M. Profiti, CFA416 352 4563
Robert Reynolds, CPA, CA, CFA416 352 4516
Yan Truong, CFA416 352 4584
Gold bull market extended, $1,500 in viewThis report details our commodity specific view for gold and silver. For equity implications see "Metals & Mining – 3Q16 Commodities Forecast Update".
■ Gold hits our prior peak price six months ahead on Brexit: Our April 6th update had forecast $1,350/oz by Q1/17, driven by a gold market deficit in 2016 and 2017 due to supply constraints, stable physical demand and negative real rates supporting gold ETF buying. This price was achieved briefly last week.
■ Prolonged gold strength on prolonged macro uncertainty – we forecast $1,500/oz by early 2017: We raise our gold price forecasts to $1,475/oz in Q4/16 and $1,500/oz in Q1/17. Our average price for 2016 increases by 4%, to $1,317/oz, and by 10% in 2017, to $1,450/oz. The common argument we hear from gold participants is that gold is currently benefitting from a fear trade on Brexit, and that may indeed be the case. But we think this recent fear trade leads to something more enduring as the surprise Brexit vote has solidified and intensified macro and political uncertainty and extended the timeframe for a negative real rate environment in the US and potentially abroad.
■ Growing long term gold demand requires a higher long term price: We increase our long term gold price forecast to $1,300/oz from $1,200/oz as we incorporate our expectation of gold demand growth over the long term from a variety of drivers; including central bank diversification and consumer asset diversification in light of the current economic outlook. We continue to expect gold mine supply to decline at $1,300/oz over the longer term, which could put further upward pressure on LT price expectations.
■ Silver to follow gold higher: We raise our silver price forecasts to $19.50/oz by Q4/16. Our average price for 2016 increases by 6%, to $17.28/oz, and by 15% in 2017, to $19.03/oz. Silver market deficits drive our higher price forecast as we see increased ETF demand and lower our expectation for mine supply.
■ Long term silver price increased to $20/oz from $17.90/oz: Which reflects our higher long term gold price and a return to a 65:1 gold/silver ratio over the long term.

29 June 2016
Precious Metals Outlook 2
Gold: advancing with the aid of BrexitGold shines again, hits our prior peak price six months ahead on BrexitIn our April 6th, 2016 update (Precious Metals Outlook - Gold & Silver - more upside ahead) we forecast a gold market deficit in 2016 and 2017, driven by supply constraints and stable physical demand (central banks, bar hoarding and jewelry). In addition, we believed real interest rates would remain under pressure in the US and globally, supporting continued gold ETF buying. We forecast the gold price to peak at US$1,350/oz by 1Q-17, being US$112/oz of upside vs. the spot price at that time. This price was achieved briefly last week.
We see prolonged strength, on prolonged macro uncertaintyThe common argument we hear from gold participants is that gold is currently benefitting from a fear trade on Brexit, and that may indeed be the case. But we think this recent fear trade leads to something more enduring (similar to the 1Q-16 catalyst of China weakness and global implications). We forecast the gold price to increase through 2016, averaging $1,475/oz in 4Q-16 and $1,500 in 1Q-17 with a price average of $1,450 in 2017.
Even before the Brexit vote, we saw positive price drivers: a strong chance of additional QE from the Eurozone, a 12-18 month period of negative real rates in the US and continued wealth diversification globally from central banks and consumers given the uncertain macro environment.
We believe the surprise Brexit vote has solidified and intensified macro and political uncertainty and extended the timeframe for a negative real rate environment in the US (ETF buyers), and potentially abroad (bar & coin buyers). The Brexit time-clock may now begin in October 2016 and extend to October 2018 when negotiations between Britain and the EU would conclude. In the interim, Scotland and potentially (Northern) Ireland may seek to hold independence referendums in order to remain in the EU. There may also be further votes tabled in other EU nations which would continue to raise the question of the Eurozone's sustainability.
Gold price forecasts revised upwards We believe the $1,500/oz mark could be tested by late 2016 or early 2017 as the macro implications of the Brexit vote are clarified and the 8 November US election weigh on sentiment. Our LT gold price forecast increases to $1,300/oz from $1,200/oz as we incorporate our expectation of growing long term gold demand from a variety of drivers, including central bank diversification and consumer asset diversification in light of the current global economic outlook.
Gold market deficits in 2016 and 2017 drive our higher price forecasts. We increase our investment demand forecasts for 2016 and 2017 to reflect continued strength from ETFs and bar/coin hoarding. Meanwhile, we continue to expect mine supply to decline over the next three years.
Figure 1: Revised gold price forecasts2015 1Q-16 2Q-16 3Q-16 4Q-16 2016E 1Q-17 2Q-17 3Q-17 4Q-17 2017E 2018E 2019E
New US$/oz 1,160 1,181 1,262 1,350 1,475 1,317 1,500 1,450 1,400 1,450 1,450 1,375 1,350Old US$/oz 1,160 1,181 1,275 1,300 1,325 1,270 1,350 1,275 1,300 1,325 1,313 1,250 1,225Chg % 0% 0% -1% 4% 11% 4% 11% 14% 8% 9% 10% 10% 10%Source: Credit Suisse estimates
Equity ResearchAnita Soni, P. Eng., CFA
[email protected]+1 416 352 4587
Forecast $1,475/oz in Q4/16 and $1,500/oz in
Q1/17
Brexit has extended the timeframe for negative
real rates
Higher price needed to meet ETF and bar
hoarding demand and plug supply deficit

29 June 2016
Precious Metals Outlook 3
Low rates, currency devaluation, central banks and mine supply supports bullish gold price viewMacro concerns to push gold ETF demand to continue on its torrid paceSince April, US and global economic data has weakened, the Fed's rate hike outlook has been downgraded and short-term real interest rates have declined further into negative territory in the US, Europe and Japan. Meanwhile, the Brexit fallout is likely to involve increased currency volatility, a reduced Fed rate hike probability, lower rates and additional major central bank quantitative easing.
With gold now through its key $1,304/oz technical resistance level, we expect political/macro uncertainty to persist over the next few quarters as the UK/Europe situation evolves and as the 8 November US presidential election looms as an additional catalyst that could continue to drive investment demand and a higher gold price. Post-election in 2017, we believe real rates will remain under pressure as key market concerns will be UK and European recession risk, US recession risk (given the age of the current cycle) and a potential China hard landing. We expect negative rates in the US will continue to be positive for ETFs.
Wealth preservation the underlying driver of bar hoarding, coins and jewelry We expect global macro concerns to spur bar hoarding in the rest of the world (ex-US) in order to offset potential currency devaluation. Bar hoarding increased in 2010 & 2011 from Germany and Switzerland on Euro bailout concerns, in 2013 in India, and in late-2015 in China on currency devaluation concerns. In addition, wealth diversification and population growth has been a primary driver of demand and we expect this to continue. Over the last 25 years, consumer and investor demand for gold (jewelry, bar/coin hoarding and ETFs) has increased at a 1% pa CAGR.
In 2H-16 we expect Chinese demand supported by growing currency devaluation and real estate related inflation concerns. The resolution of supply chain issues that impacted 1Q will provide a further boost. India's demand should be supported by forecasts for an above-average monsoon season (following two years of droughts) and a salary hike for government employees in July.
We see no reason for Central bank diversification into gold to abateCentral banks became net buyers of gold in 2009, a buying period which has extended beyond one year for the first time since the 1960's. The shift was driven by a desire to diversify out of fiat currencies following the 2008 financial crisis and subsequent bank bail-outs. The buying has been led by central banks in China, Russia, Turkey and India. Currently, China, Russia and Kazakhstan are the only active buyers. We see good potential for other large central banks to begin buying over the next three years to diversify foreign exchange reserves as monetary QE continues and fiscal QE becomes more likely (see Global Equity Strategy: Fiscal QE: when, where and how to play it). We view the most likely candidates as Brazil, Japan, India, Switzerland and the UK.
Mine supply challenged without higher long term price (above $1,300/oz)We note that the total delineated gold reserves at current prices are unlikely to keep pace with demand over the long term. A higher sustained gold price point is needed to convert resources into reserves and bring new projects on stream (7 to 10 years find-to-produce time frame).
Wealth preservation at the heart of gold demandShown below (Figure 3) is our estimate for the components of the above-ground stocks of gold at 2015YE. This represents our estimate for the end use of all gold mined throughout history. We estimate the gold stocks totaled 183,676t (~5.9 billion ounces): this is often argued as a bear point given it represents ~60 years' worth of mine supply. However, the value of the entire gold stocks represented ~3% of global wealth at 2015YE (US$7.7

29 June 2016
Precious Metals Outlook 4
trillion of gold at our $1,300/oz LT price vs. US$250 trillion of global wealth). As gold provides a currency devaluation and inflation hedge, we believe this allocation will be sustained in the world's portfolio by central banks and consumers.
Figure 2: Sources of gold demand, 2000-2015 Figure 3: Above ground stocks of gold – 2015YE
India Jewellery15%
India bar hoarding
5%
China Jewellery12%
China bar hoarding
3%Other Jewellery
39%
Other bar hoarding
12%
Central banks (net)-1%
ETFs2%
Industrial11%
Jewellery, 90,839, 49%
Central Banks, 32,733, 18%
Bar and Coin, 36,416, 20%
ETFs, 1,411, 1%
Industrial use, 22,277, 12%
2015YE total = 183,676t
Source: World Gold Council, Credit Suisse estimates Source: World Gold Council, Credit Suisse estimates
Drivers of additional investment demand include a strong chance of additional QE from the Eurozone, a 12-18 month period of negative real rates in the US and continued wealth diversification globally from central banks and consumers given the uncertain macro environment.
Figure 4: Gold price – current vs. prior forecast Figure 5: ETF holdings still have room to expand
$900
$1,000
$1,100
$1,200
$1,300
$1,400
$1,500
$1,600
$1,700
$1,800
$1,900
Jan-09 Jan-11 Jan-13 Jan-15 Jan-17 Jan-19
US$/o
z
Gold price Current forecast Prior forecast
$900
$1,000
$1,100
$1,200
$1,300
$1,400
$1,500
$1,600
$1,700
$1,800
$1,900
0.00
10.00
20.00
30.00
40.00
50.00
60.00
70.00
80.00
90.00
100.00
Jan-09
Jan-10
Jan-11
Jan-12
Jan-13
Jan-14
Jan-15
Jan-16
US$/o
z
Millio
ns of
gold
ounc
es
ETF holdings (Moz) Gold price (US$/oz)
Source: RAVE, Credit Suisse estimates Source: Bloomberg, Credit Suisse estimates
29 June 2016
Precious Metals Outlook 5
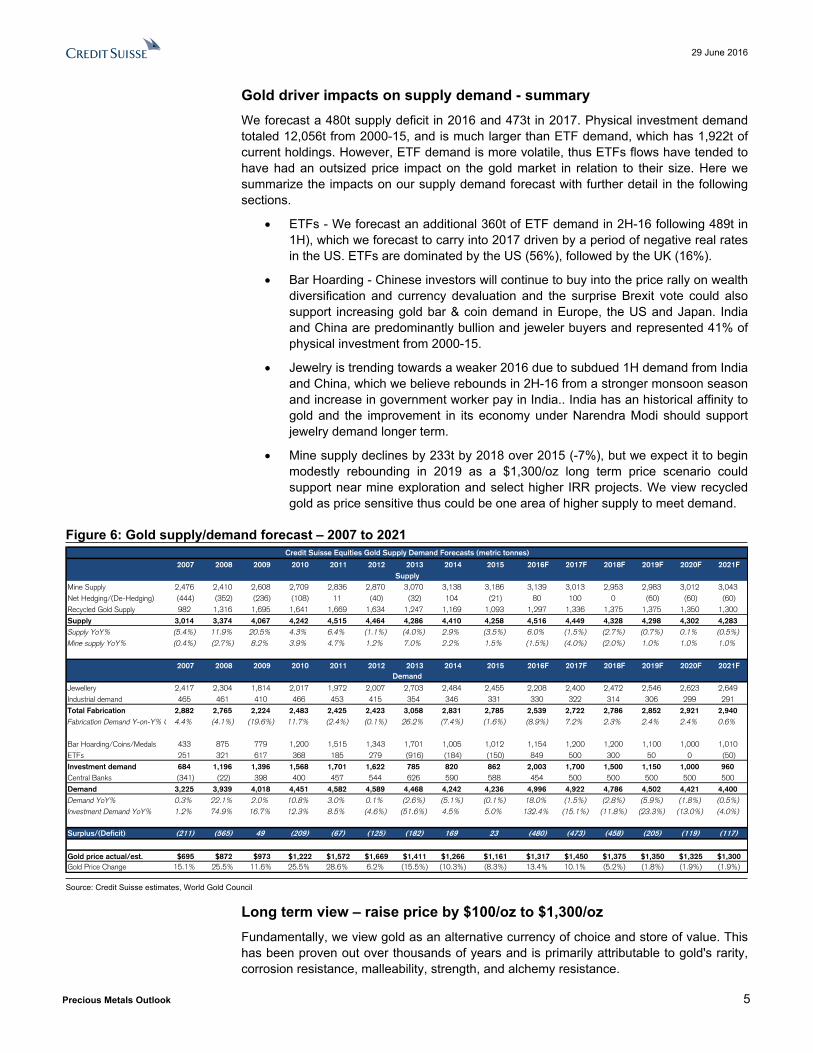
Gold driver impacts on supply demand - summaryWe forecast a 480t supply deficit in 2016 and 473t in 2017. Physical investment demand totaled 12,056t from 2000-15, and is much larger than ETF demand, which has 1,922t of current holdings. However, ETF demand is more volatile, thus ETFs flows have tended to have had an outsized price impact on the gold market in relation to their size. Here we summarize the impacts on our supply demand forecast with further detail in the following sections.
ETFs - We forecast an additional 360t of ETF demand in 2H-16 following 489t in 1H), which we forecast to carry into 2017 driven by a period of negative real rates in the US. ETFs are dominated by the US (56%), followed by the UK (16%).
Bar Hoarding - Chinese investors will continue to buy into the price rally on wealth diversification and currency devaluation and the surprise Brexit vote could also support increasing gold bar & coin demand in Europe, the US and Japan. India and China are predominantly bullion and jeweler buyers and represented 41% of physical investment from 2000-15.
Jewelry is trending towards a weaker 2016 due to subdued 1H demand from India and China, which we believe rebounds in 2H-16 from a stronger monsoon season and increase in government worker pay in India.. India has an historical affinity to gold and the improvement in its economy under Narendra Modi should support jewelry demand longer term.
Mine supply declines by 233t by 2018 over 2015 (-7%), but we expect it to begin modestly rebounding in 2019 as a $1,300/oz long term price scenario could support near mine exploration and select higher IRR projects. We view recycled gold as price sensitive thus could be one area of higher supply to meet demand.
Figure 6: Gold supply/demand forecast – 2007 to 2021Credit Suisse Equities Gold Supply Demand Forecasts (metric tonnes)
2007 2008 2009 2010 2011 2012 2013 2014 2015 2016F 2017F 2018F 2019F 2020F 2021FSupply
Mine Supply 2,476 2,410 2,608 2,709 2,836 2,870 3,070 3,138 3,186 3,139 3,013 2,953 2,983 3,012 3,043Net Hedging/(De-Hedging) (444) (352) (236) (108) 11 (40) (32) 104 (21) 80 100 0 (60) (60) (60)Recycled Gold Supply 982 1,316 1,695 1,641 1,669 1,634 1,247 1,169 1,093 1,297 1,336 1,375 1,375 1,350 1,300Supply 3,014 3,374 4,067 4,242 4,515 4,464 4,286 4,410 4,258 4,516 4,449 4,328 4,298 4,302 4,283Supply YoY% (5.4%) 11.9% 20.5% 4.3% 6.4% (1.1%) (4.0%) 2.9% (3.5%) 6.0% (1.5%) (2.7%) (0.7%) 0.1% (0.5%)Mine supply YoY% (0.4%) (2.7%) 8.2% 3.9% 4.7% 1.2% 7.0% 2.2% 1.5% (1.5%) (4.0%) (2.0%) 1.0% 1.0% 1.0%
2007 2008 2009 2010 2011 2012 2013 2014 2015 2016F 2017F 2018F 2019F 2020F 2021FDemand
Jewellery 2,417 2,304 1,814 2,017 1,972 2,007 2,703 2,484 2,455 2,208 2,400 2,472 2,546 2,623 2,649Industrial demand 465 461 410 466 453 415 354 346 331 330 322 314 306 299 291Total Fabrication 2,882 2,765 2,224 2,483 2,425 2,423 3,058 2,831 2,785 2,539 2,722 2,786 2,852 2,921 2,940Fabrication Demand Y-on-Y% Change4.4% (4.1%) (19.6%) 11.7% (2.4%) (0.1%) 26.2% (7.4%) (1.6%) (8.9%) 7.2% 2.3% 2.4% 2.4% 0.6%
Bar Hoarding/Coins/Medals 433 875 779 1,200 1,515 1,343 1,701 1,005 1,012 1,154 1,200 1,200 1,100 1,000 1,010ETFs 251 321 617 368 185 279 (916) (184) (150) 849 500 300 50 0 (50)Investment demand 684 1,196 1,396 1,568 1,701 1,622 785 820 862 2,003 1,700 1,500 1,150 1,000 960Central Banks (341) (22) 398 400 457 544 626 590 588 454 500 500 500 500 500Demand 3,225 3,939 4,018 4,451 4,582 4,589 4,468 4,242 4,236 4,996 4,922 4,786 4,502 4,421 4,400Demand YoY% 0.3% 22.1% 2.0% 10.8% 3.0% 0.1% (2.6%) (5.1%) (0.1%) 18.0% (1.5%) (2.8%) (5.9%) (1.8%) (0.5%)Investment Demand YoY% 1.2% 74.9% 16.7% 12.3% 8.5% (4.6%) (51.6%) 4.5% 5.0% 132.4% (15.1%) (11.8%) (23.3%) (13.0%) (4.0%)
Surplus/(Deficit) (211) (565) 49 (209) (67) (125) (182) 169 23 (480) (473) (458) (205) (119) (117)
Gold price actual/est. $695 $872 $973 $1,222 $1,572 $1,669 $1,411 $1,266 $1,161 $1,317 $1,450 $1,375 $1,350 $1,325 $1,300Gold Price Change 15.1% 25.5% 11.6% 25.5% 28.6% 6.2% (15.5%) (10.3%) (8.3%) 13.4% 10.1% (5.2%) (1.8%) (1.9%) (1.9%)
Source: Credit Suisse estimates, World Gold Council
Long term view – raise price by $100/oz to $1,300/ozFundamentally, we view gold as an alternative currency of choice and store of value. This has been proven out over thousands of years and is primarily attributable to gold's rarity, corrosion resistance, malleability, strength, and alchemy resistance.
29 June 2016
Precious Metals Outlook 6
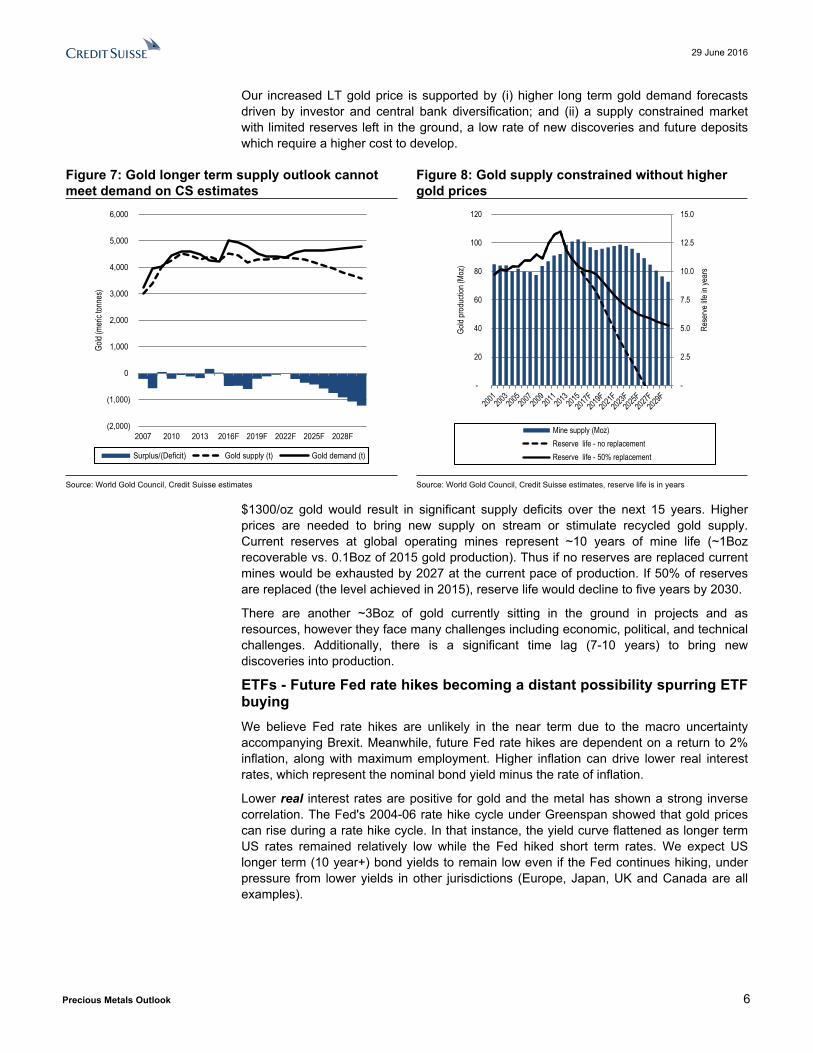
Our increased LT gold price is supported by (i) higher long term gold demand forecasts driven by investor and central bank diversification; and (ii) a supply constrained market with limited reserves left in the ground, a low rate of new discoveries and future deposits which require a higher cost to develop.
Figure 7: Gold longer term supply outlook cannot meet demand on CS estimates
Figure 8: Gold supply constrained without higher gold prices
(2,000)
(1,000)
0
1,000
2,000
3,000
4,000
5,000
6,000
2007 2010 2013 2016F 2019F 2022F 2025F 2028F
Gold
(meri
c ton
nes)
Surplus/(Deficit) Gold supply (t) Gold demand (t)
-
2.5
5.0
7.5
10.0
12.5
15.0
-
20
40
60
80
100
120
Rese
rve lif
e in y
ears
Gold
prod
uctio
n (Mo
z)
Mine supply (Moz)Reserve life - no replacementReserve life - 50% replacement
Source: World Gold Council, Credit Suisse estimates Source: World Gold Council, Credit Suisse estimates, reserve life is in years
$1300/oz gold would result in significant supply deficits over the next 15 years. Higher prices are needed to bring new supply on stream or stimulate recycled gold supply. Current reserves at global operating mines represent ~10 years of mine life (~1Boz recoverable vs. 0.1Boz of 2015 gold production). Thus if no reserves are replaced current mines would be exhausted by 2027 at the current pace of production. If 50% of reserves are replaced (the level achieved in 2015), reserve life would decline to five years by 2030.
There are another ~3Boz of gold currently sitting in the ground in projects and as resources, however they face many challenges including economic, political, and technical challenges. Additionally, there is a significant time lag (7-10 years) to bring new discoveries into production.
ETFs - Future Fed rate hikes becoming a distant possibility spurring ETF buyingWe believe Fed rate hikes are unlikely in the near term due to the macro uncertainty accompanying Brexit. Meanwhile, future Fed rate hikes are dependent on a return to 2% inflation, along with maximum employment. Higher inflation can drive lower real interest rates, which represent the nominal bond yield minus the rate of inflation.
Lower real interest rates are positive for gold and the metal has shown a strong inverse correlation. The Fed's 2004-06 rate hike cycle under Greenspan showed that gold prices can rise during a rate hike cycle. In that instance, the yield curve flattened as longer term US rates remained relatively low while the Fed hiked short term rates. We expect US longer term (10 year+) bond yields to remain low even if the Fed continues hiking, under pressure from lower yields in other jurisdictions (Europe, Japan, UK and Canada are all examples).

29 June 2016
Precious Metals Outlook 7
Figure 9: US 10-year TIPs yield (real rates) vs. gold Figure 10: 10-year real bond yields are low globally
(1.50)
(1.00)
(0.50)
0.00
0.50
1.00
1.50
2.00
2.502009 2010 2011 2012 2013 2014 2015 2016
$600
$800
$1,000
$1,200
$1,400
$1,600
$1,800
$2,000Gold price10 year TIPs yield (rhs, inverted)
(0.36)(0.34)(0.15)
0.03 0.12 0.38 0.43 0.61 0.92 0.92
1.33 1.58 1.79
-1.00
0.00
1.00
2.00
3.00
4.00
5.00
6.00
7.00
8.00
10 ye
ar bo
nd yi
eld
Nominal bond yield Real bond yield
Source: Bloomberg, Credit Suisse estimates Source: Bloomberg, Credit Suisse estimates, real bond yield calculated by CS as the nominal 10 year bond yield minus the forecast 2016 Consumer Price Index
Global outlook impacts the US dollar and USD ratesOur view on US real rates is lower for longer as low nominal interest rates in global developed markets and policy easing from central banks such as the ECB, BoJ and PBoC put downward pressure on US nominal rates. Rates took another leg down following the Brexit vote, which adds to the macro uncertainty and could further dampen the economic outlook.
Data currently shows inflation running below central bank targets in the developed world. This provides the Fed, ECB, BoJ and PBoC with a clear mandate to target higher inflation as nominal growth is below target. Gold also tends to benefit when investors worry that central banks will fall behind the curve and overstimulate, resulting in a loss of purchasing power in local currency terms.
Long term gold demand underpinned by population and wealth growthWealth diversification and population growth has been a primary driver of demand and we expect this to continue. As a primary benchmark for our LT forecasts, we note that over the last 25 years, consumer and investor demand for gold (jewelry, bar/coin hoarding and ETFs) has increased at a 1% pa CAGR.
As a secondary benchmark for our long term forecasts, we consider the wealth trends in the Credit Suisse Global Wealth Databook 2015. Global Wealth increased by 3.8% per year from 2005 (US$172 trillion) to 2015 (US$250 trillion). Over the same period, the volume of above-ground gold stocks increased by 2.6% per year. Meanwhile the gold price increased by 10.3% per year primarily because supply did not keep pace with demand as (i) China and India wealth creation outperformed the global average and investors there prefer a higher allocation to gold; (ii) Western investor demand for gold returned due to the threat of inflation and the reality of negative real interest rates; and (iii) Central banks became net buyers of gold, following ~30 years of selling.
Our long term (post 2020) gold demand forecast assumes physical investment and jewelry growth of 1% pa (previously flat), in-line with the United Nations projected population growth to 2050 and average growth over the last 25 years.

29 June 2016
Precious Metals Outlook 8
Figure 11: Global wealth has grown by 3.8%/year since 2005, China and India have faster growth rates
Figure 12: Long term CS forecasts now assumes gold as ~3% of global wealth longer term
$0
$50,000
$100,000
$150,000
$200,000
$250,000
$300,000
2005 2006 2007 2008 2009 2010 2011 2012 2013 2014 2015
US$B
Rest of world China India
Global wealth growth = 3.8%/yearChina wealth growth = 10.2%/yearIndia wealth growth = 4.9%/year
0.00%
0.70%
1.40%
2.10%
2.80%
3.50%
4.20%
$0
$2,000
$4,000
$6,000
$8,000
$10,000
$12,000
2005 2008 2011 2014 2017 2020 2023
Abov
e gro
und g
old as
% of
glob
al we
alth
US$B
Value of above ground gold Gold as % of global wealth (rhs)
Source: Credit Suisse Global Wealth Databook 2015 Source: Credit Suisse estimates, World Gold Council
Wealth allocation to gold at ~3% in 2015 – we forecast this level as stable due to diversification demand: The global wealth allocation to gold peaked at 3.85% in 2012 and was 2.74% in 2015. This is significant growth from the 1% allocation in 2000 – the earliest year for which Credit Suisse wealth data is available (wealth measurement is a relatively new endeavour). We believe a 3% gold allocation is sustainable as both investors and central banks look to diversify their exposure to fiat currencies.
Central bank diversification into gold likely to continueCentral banks became net buyers of gold in 2009, a buying period which has extended beyond one year for the first time since the 1960's. The shift was driven by a desire to diversify out of fiat currencies following the 2008 financial crisis and subsequent bank bail-outs. The buying has been led by central banks in China, Russia, Turkey and India.

29 June 2016
Precious Metals Outlook 9
Figure 13: Central bank gold holdings over time Figure 14: Gold as a % of FX reserves near a low
-
5,000
10,000
15,000
20,000
25,000
30,000
35,000
40,000
45,000
Metric
tonn
es
Central bank holdings - actual Credit Suisse forecasts
0%
2%
4%
6%
8%
10%
12%
14%
16%
$0.00
$2.00
$4.00
$6.00
$8.00
$10.00
$12.00
$14.00
$16.00
US$ t
rillion
Global FX reserves Gold % of FX reserves (rhs)
Source: World Gold Council, Credit Suisse estimates Source: World Gold Council, Credit Suisse estimates
Potential for a new central bank buyer to emerge as diversification demand persistsCurrently, China, Russia and Kazakhstan are the only active gold buyers. We see good potential for other large central banks to begin buying over the next three years to diversify foreign exchange reserves as monetary QE continues and fiscal QE becomes more likely (see Global Equity Strategy: Fiscal QE: when, where and how to play it). We view the most likely candidates as Brazil, Japan, India, Switzerland and the UK, based on the relatively low gold allocation in each of those central bank's FX reserves.
Figure 15: Central banks – top holders of goldFigure 16: Central banks – largest buyers and sellers from 2006 to Q1/16 (in metric tonnes)
0.0%
10.0%
20.0%
30.0%
40.0%
50.0%
60.0%
70.0%
80.0%
-
1,000
2,000
3,000
4,000
5,000
6,000
7,000
8,000
9,000
Gold
holdi
ngs (
metric
tonn
es)
Gold holdings As % of total FX reserves (rhs)
1,197 1,074
363 200 180 169
118 90 84 68
41 34 31 27 22
(403)(390)
(250)(215)(176)
(127)(82)(47)(43)(35)
-600 -400 -200 0 200 400 600 800 1000 1200China1)RussiaTurkey
IndiaSaudi Arabia2)
KazakhstanMexicoKorea
IraqThailand
PhilippinesBrazil
Belarus4)Jordan
AfghanistanIMF
FranceSwitzerland
ECBSpain
VenezuelaNetherlands
GermanySwedenPortugal
Source: World gold council, Credit Suisse estimates Source: World gold council, Credit Suisse estimates
29 June 2016
Precious Metals Outlook 10
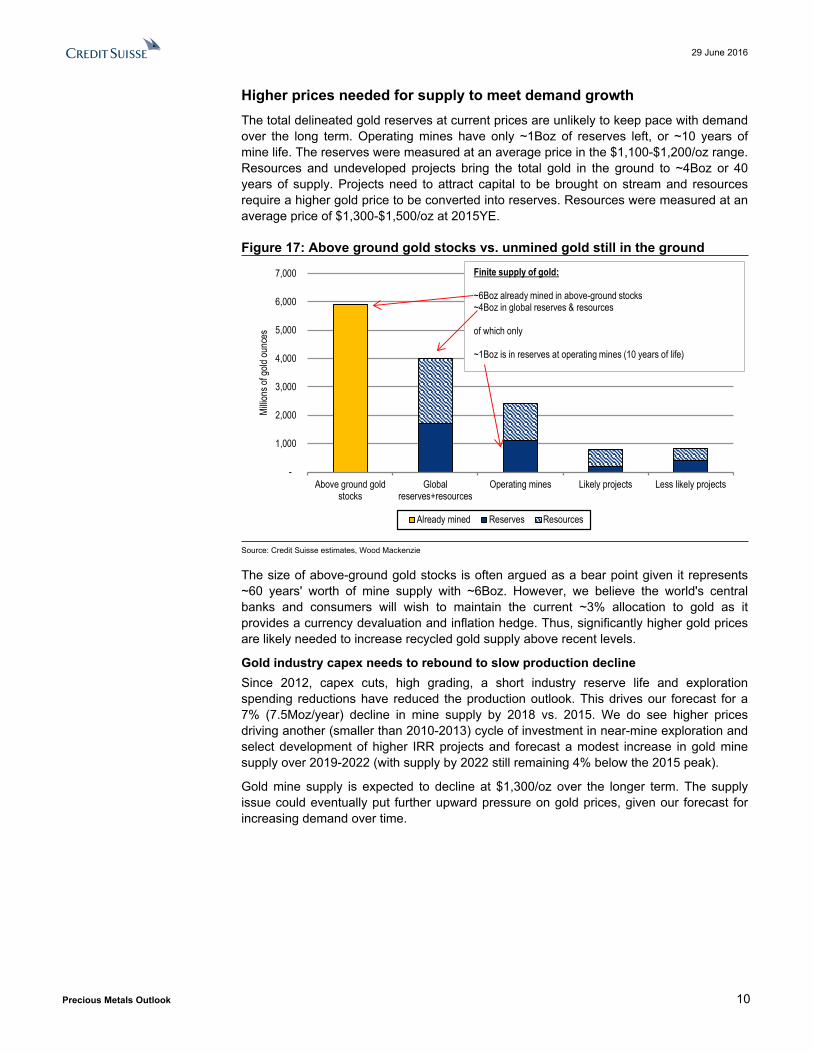
Higher prices needed for supply to meet demand growthThe total delineated gold reserves at current prices are unlikely to keep pace with demand over the long term. Operating mines have only ~1Boz of reserves left, or ~10 years of mine life. The reserves were measured at an average price in the $1,100-$1,200/oz range. Resources and undeveloped projects bring the total gold in the ground to ~4Boz or 40 years of supply. Projects need to attract capital to be brought on stream and resources require a higher gold price to be converted into reserves. Resources were measured at an average price of $1,300-$1,500/oz at 2015YE.
Figure 17: Above ground gold stocks vs. unmined gold still in the ground
-
1,000
2,000
3,000
4,000
5,000
6,000
7,000
Above ground goldstocks
Globalreserves+resources
Operating mines Likely projects Less likely projects
Millio
ns of
gold
ounc
es
Already mined Reserves Resources
Finite supply of gold:
~6Boz already mined in above-ground stocks~4Boz in global reserves & resources
of which only
~1Boz is in reserves at operating mines (10 years of life)
Source: Credit Suisse estimates, Wood Mackenzie
The size of above-ground gold stocks is often argued as a bear point given it represents ~60 years' worth of mine supply with ~6Boz. However, we believe the world's central banks and consumers will wish to maintain the current ~3% allocation to gold as it provides a currency devaluation and inflation hedge. Thus, significantly higher gold prices are likely needed to increase recycled gold supply above recent levels.
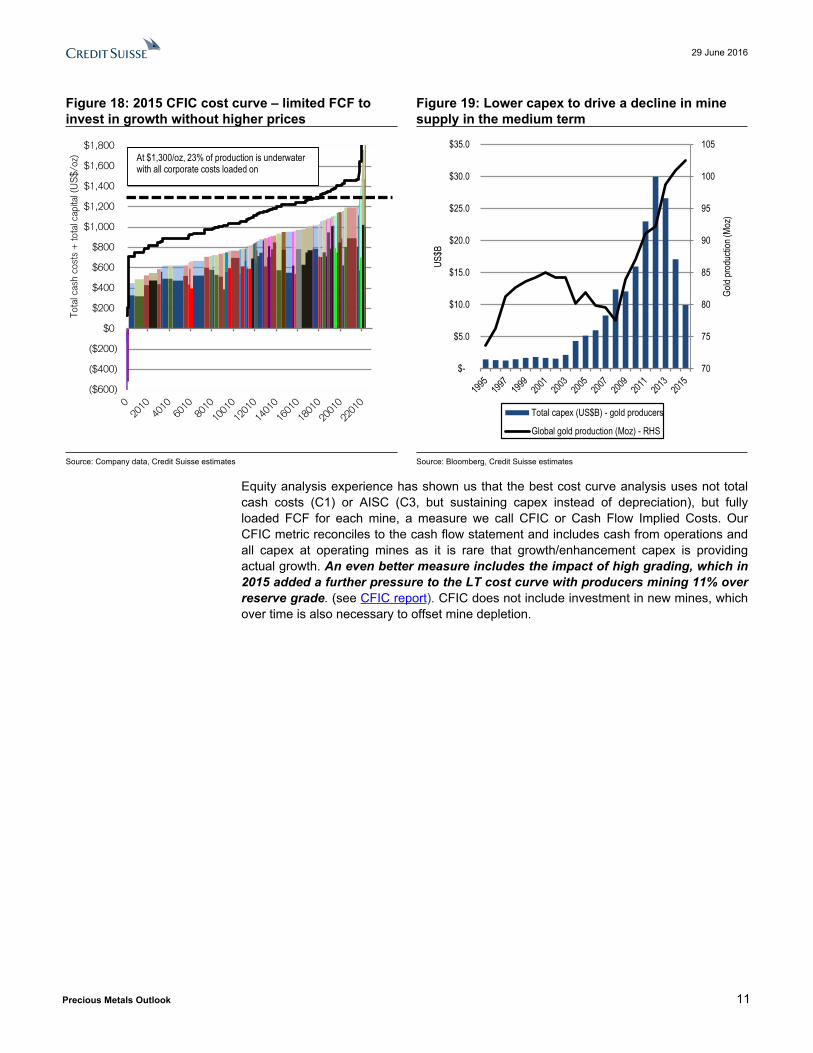
Gold industry capex needs to rebound to slow production declineSince 2012, capex cuts, high grading, a short industry reserve life and exploration spending reductions have reduced the production outlook. This drives our forecast for a 7% (7.5Moz/year) decline in mine supply by 2018 vs. 2015. We do see higher prices driving another (smaller than 2010-2013) cycle of investment in near-mine exploration and select development of higher IRR projects and forecast a modest increase in gold mine supply over 2019-2022 (with supply by 2022 still remaining 4% below the 2015 peak).
Gold mine supply is expected to decline at $1,300/oz over the longer term. The supply issue could eventually put further upward pressure on gold prices, given our forecast for increasing demand over time.
29 June 2016
Precious Metals Outlook 11
Figure 18: 2015 CFIC cost curve – limited FCF to invest in growth without higher prices
Figure 19: Lower capex to drive a decline in mine supply in the medium term
($600)
($400)
($200)
$0
$200
$400
$600
$800
$1,000
$1,200
$1,400
$1,600
$1,800
Tota
l cas
h co
sts
+ to
tal c
apita
l (U
S$/
oz) At $1,300/oz, 23% of production is underwater
with all corporate costs loaded on
70
75
80
85
90
95
100
105
$-
$5.0
$10.0
$15.0
$20.0
$25.0
$30.0
$35.0
Gold
prod
uctio
n (Mo
z)
US$B
Total capex (US$B) - gold producers
Global gold production (Moz) - RHS
Source: Company data, Credit Suisse estimates Source: Bloomberg, Credit Suisse estimates
Equity analysis experience has shown us that the best cost curve analysis uses not total cash costs (C1) or AISC (C3, but sustaining capex instead of depreciation), but fully loaded FCF for each mine, a measure we call CFIC or Cash Flow Implied Costs. Our CFIC metric reconciles to the cash flow statement and includes cash from operations and all capex at operating mines as it is rare that growth/enhancement capex is providing actual growth. An even better measure includes the impact of high grading, which in 2015 added a further pressure to the LT cost curve with producers mining 11% over reserve grade. (see CFIC report). CFIC does not include investment in new mines, which over time is also necessary to offset mine depletion.
29 June 2016
Precious Metals Outlook 12
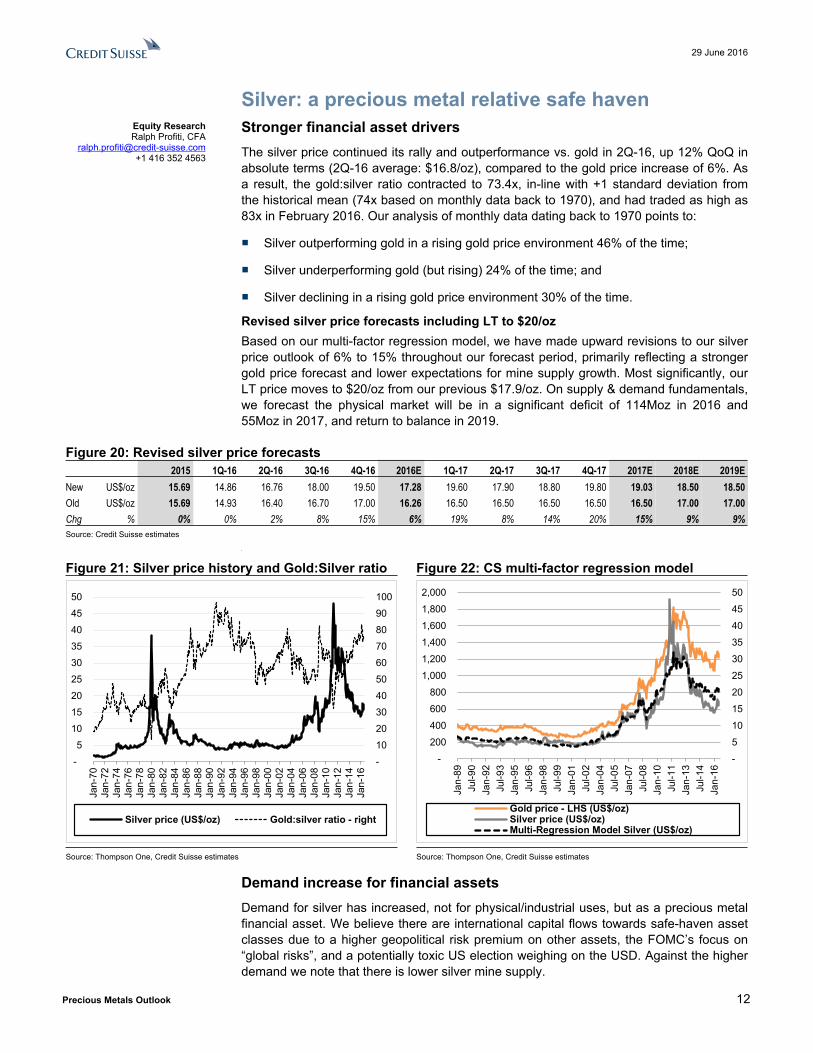
Silver: a precious metal relative safe havenStronger financial asset driversThe silver price continued its rally and outperformance vs. gold in 2Q-16, up 12% QoQ in absolute terms (2Q-16 average: $16.8/oz), compared to the gold price increase of 6%. As a result, the gold:silver ratio contracted to 73.4x, in-line with +1 standard deviation from the historical mean (74x based on monthly data back to 1970), and had traded as high as 83x in February 2016. Our analysis of monthly data dating back to 1970 points to:
■ Silver outperforming gold in a rising gold price environment 46% of the time;
■ Silver underperforming gold (but rising) 24% of the time; and
■ Silver declining in a rising gold price environment 30% of the time.
Revised silver price forecasts including LT to $20/ozBased on our multi-factor regression model, we have made upward revisions to our silver price outlook of 6% to 15% throughout our forecast period, primarily reflecting a stronger gold price forecast and lower expectations for mine supply growth. Most significantly, our LT price moves to $20/oz from our previous $17.9/oz. On supply & demand fundamentals, we forecast the physical market will be in a significant deficit of 114Moz in 2016 and 55Moz in 2017, and return to balance in 2019.
Figure 20: Revised silver price forecasts2015 1Q-16 2Q-16 3Q-16 4Q-16 2016E 1Q-17 2Q-17 3Q-17 4Q-17 2017E 2018E 2019E
New US$/oz 15.69 14.86 16.76 18.00 19.50 17.28 19.60 17.90 18.80 19.80 19.03 18.50 18.50Old US$/oz 15.69 14.93 16.40 16.70 17.00 16.26 16.50 16.50 16.50 16.50 16.50 17.00 17.00Chg % 0% 0% 2% 8% 15% 6% 19% 8% 14% 20% 15% 9% 9%Source: Credit Suisse estimates
■
Figure 21: Silver price history and Gold:Silver ratio Figure 22: CS multi-factor regression model
-
10
20
30
40
50
60
70
80
90
100
-
5
10
15
20
25
30
35
40
45
50
Jan-
70Ja
n-72
Jan-
74Ja
n-76
Jan-
78Ja
n-80
Jan-
82Ja
n-84
Jan-
86Ja
n-88
Jan-
90Ja
n-92
Jan-
94Ja
n-96
Jan-
98Ja
n-00
Jan-
02Ja
n-04
Jan-
06Ja
n-08
Jan-
10Ja
n-12
Jan-
14Ja
n-16
Silver price (US$/oz) Gold:silver ratio - right
-
5
10
15
20
25
30
35
40
45
50
-
200
400
600
800
1,000
1,200
1,400
1,600
1,800
2,000
Jan-
89Ju
l-90
Jan-
92Ju
l-93
Jan-
95Ju
l-96
Jan-
98Ju
l-99
Jan-
01Ju
l-02
Jan-
04Ju
l-05
Jan-
07Ju
l-08
Jan-
10Ju
l-11
Jan-
13Ju
l-14
Jan-
16
Gold price - LHS (US$/oz)Silver price (US$/oz)Multi-Regression Model Silver (US$/oz)
Source: Thompson One, Credit Suisse estimates Source: Thompson One, Credit Suisse estimates
Demand increase for financial assetsDemand for silver has increased, not for physical/industrial uses, but as a precious metal financial asset. We believe there are international capital flows towards safe-haven asset classes due to a higher geopolitical risk premium on other assets, the FOMC’s focus on “global risks”, and a potentially toxic US election weighing on the USD. Against the higher demand we note that there is lower silver mine supply.
Equity ResearchRalph Profiti, CFA
[email protected]+1 416 352 4563
29 June 2016
Precious Metals Outlook 13
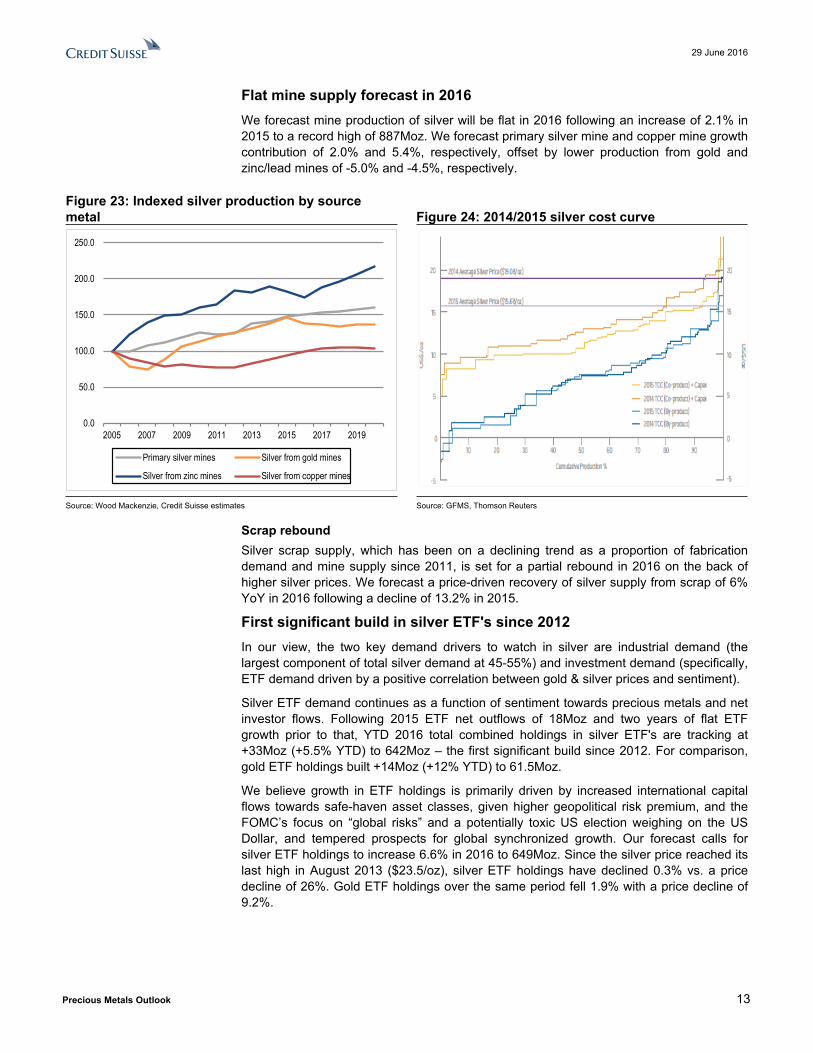
Flat mine supply forecast in 2016We forecast mine production of silver will be flat in 2016 following an increase of 2.1% in 2015 to a record high of 887Moz. We forecast primary silver mine and copper mine growth contribution of 2.0% and 5.4%, respectively, offset by lower production from gold and zinc/lead mines of -5.0% and -4.5%, respectively.
Figure 23: Indexed silver production by source metal Figure 24: 2014/2015 silver cost curve
0.0
50.0
100.0
150.0
200.0
250.0
2005 2007 2009 2011 2013 2015 2017 2019
Primary silver mines Silver from gold mines
Silver from zinc mines Silver from copper mines
Source: Wood Mackenzie, Credit Suisse estimates Source: GFMS, Thomson Reuters
Scrap reboundSilver scrap supply, which has been on a declining trend as a proportion of fabrication demand and mine supply since 2011, is set for a partial rebound in 2016 on the back of higher silver prices. We forecast a price-driven recovery of silver supply from scrap of 6% YoY in 2016 following a decline of 13.2% in 2015.
First significant build in silver ETF's since 2012In our view, the two key demand drivers to watch in silver are industrial demand (the largest component of total silver demand at 45-55%) and investment demand (specifically, ETF demand driven by a positive correlation between gold & silver prices and sentiment).
Silver ETF demand continues as a function of sentiment towards precious metals and net investor flows. Following 2015 ETF net outflows of 18Moz and two years of flat ETF growth prior to that, YTD 2016 total combined holdings in silver ETF's are tracking at +33Moz (+5.5% YTD) to 642Moz – the first significant build since 2012. For comparison, gold ETF holdings built +14Moz (+12% YTD) to 61.5Moz.
We believe growth in ETF holdings is primarily driven by increased international capital flows towards safe-haven asset classes, given higher geopolitical risk premium, and the FOMC’s focus on “global risks” and a potentially toxic US election weighing on the US Dollar, and tempered prospects for global synchronized growth. Our forecast calls for silver ETF holdings to increase 6.6% in 2016 to 649Moz. Since the silver price reached its last high in August 2013 ($23.5/oz), silver ETF holdings have declined 0.3% vs. a price decline of 26%. Gold ETF holdings over the same period fell 1.9% with a price decline of 9.2%.

29 June 2016
Precious Metals Outlook 14
Figure 25: Silver ETF holdings vs. silver price Figure 26: Change in silver ETF holdings vs price
-
10
20
30
40
50
60
0
100
200
300
400
500
600
700
Oct
-07
Apr-0
8O
ct-0
8Ap
r-09
Oct
-09
Apr-1
0O
ct-1
0Ap
r-11
Oct
-11
Apr-1
2O
ct-1
2Ap
r-13
Oct
-13
Apr-1
4O
ct-1
4Ap
r-15
Oct
-15
Apr-1
6
Silv
er P
rice
(US
$/oz
)
Silv
er E
TF H
oldi
ngs
(Moz
)
-40%
-30%
-20%
-10%
0%
10%
20%
30%
40%
-10%
-8%
-6%
-4%
-2%
0%
2%
4%
6%
8%
10%
Oct
-07
May
-08
Dec
-08
Jul-0
9Fe
b-10
Sep-
10Ap
r-11
Nov
-11
Jun-
12Ja
n-13
Aug-
13M
ar-1
4O
ct-1
4M
ay-1
5D
ec-1
5
Cha
nge
in S
ilver
Pric
e
Cha
nge
in S
ilver
ETF
Hol
ding
s
% Change in Silver ETF Holdings (%)Silver price (M-M% change)
Source: Bloomberg, Credit Suisse estimates Source: Bloomberg, Credit Suisse estimates
Flat industrial demand forecastOur industrial demand forecast comprises of flat YoY gross unit growth (currently tracking at -2.2% YTD), while reduction in the intensity of use of silver of 6% continues to add negative pressure to actual silver consumption. Industrial uses continue to be impacted by thrifting in the electronics and photovoltaic sectors. Recent breakthroughs in new low-cost configurations in solar cell structures may allow for the elimination of silver from mass-produced solar cells in the long-run. According to industry sources, roughly 1.5Moz of silver are required to generate 1GWe of solar power.
Figure 27: Semiconductor shipments vs. silver demand Figure 28: Semiconductor shipments vs. silver price
0
100
200
300
400
500
600
700
800
900
1994
1995
1996
1997
1998
1999
2000
2001
2002
2003
2004
2005
2006
2007
2008
2009
2010
2011
2012
2013
2014
2015
2016
E
Global semiconductor shipments (Bln units)Silver demand - Industrial applications (Moz)
-40%
-30%
-20%
-10%
0%
10%
20%
30%
40%
-30%
-20%
-10%
0%
10%
20%
30%
Oct
-07
May
-08
Dec
-08
Jul-0
9Fe
b-10
Sep-
10Ap
r-11
Nov
-11
Jun-
12Ja
n-13
Aug-
13M
ar-1
4O
ct-1
4M
ay-1
5D
ec-1
5
Cha
nge
in S
ilver
Pric
e
Cha
nge
in s
emis
uni
ts
Worldwide semiconductor units (MoM %)Silver price (M-M% change)
Source: Bloomberg, Credit Suisse estimates Source: Bloomberg, Credit Suisse estimates
Global semiconductor shipments (our proxy for industrial demand in silver from the electronics sector, which accounts for ~50% of industrial demand) grew at 2.7% in 2015; offset by a 6.2% reduction in intensity of use of silver for net demand contraction of 3.7%. We forecast flat growth in semiconductor shipments in 2016, with continued pressure from silver thrifting (6% YoY) yielding net demand contraction of 6.0%.
29 June 2016
Precious Metals Outlook 15
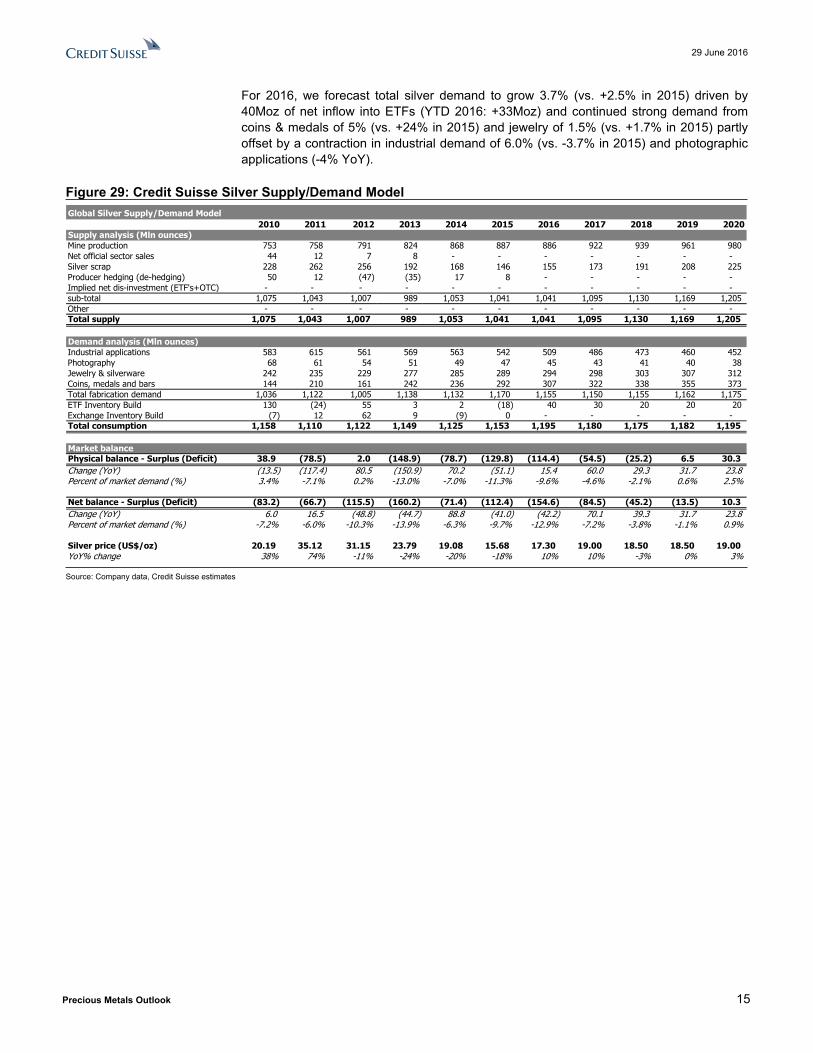
For 2016, we forecast total silver demand to grow 3.7% (vs. +2.5% in 2015) driven by 40Moz of net inflow into ETFs (YTD 2016: +33Moz) and continued strong demand from coins & medals of 5% (vs. +24% in 2015) and jewelry of 1.5% (vs. +1.7% in 2015) partly offset by a contraction in industrial demand of 6.0% (vs. -3.7% in 2015) and photographic applications (-4% YoY).
Figure 29: Credit Suisse Silver Supply/Demand ModelGlobal Silver Supply/Demand Model
2010 2011 2012 2013 2014 2015 2016 2017 2018 2019 2020Supply analysis (Mln ounces)Mine production 753 758 791 824 868 887 886 922 939 961 980Net official sector sales 44 12 7 8 - - - - - - -Silver scrap 228 262 256 192 168 146 155 173 191 208 225Producer hedging (de-hedging) 50 12 (47) (35) 17 8 - - - - -Implied net dis-investment (ETF's+OTC) - - - - - - - - - - -sub-total 1,075 1,043 1,007 989 1,053 1,041 1,041 1,095 1,130 1,169 1,205Other - - - - - - - - - - -Total supply 1,075 1,043 1,007 989 1,053 1,041 1,041 1,095 1,130 1,169 1,205
Demand analysis (Mln ounces)Industrial applications 583 615 561 569 563 542 509 486 473 460 452Photography 68 61 54 51 49 47 45 43 41 40 38Jewelry & silverware 242 235 229 277 285 289 294 298 303 307 312Coins, medals and bars 144 210 161 242 236 292 307 322 338 355 373Total fabrication demand 1,036 1,122 1,005 1,138 1,132 1,170 1,155 1,150 1,155 1,162 1,175ETF Inventory Build 130 (24) 55 3 2 (18) 40 30 20 20 20Exchange Inventory Build (7) 12 62 9 (9) 0 - - - - -Total consumption 1,158 1,110 1,122 1,149 1,125 1,153 1,195 1,180 1,175 1,182 1,195
Market balancePhysical balance - Surplus (Deficit) 38.9 (78.5) 2.0 (148.9) (78.7) (129.8) (114.4) (54.5) (25.2) 6.5 30.3Change (YoY) (13.5) (117.4) 80.5 (150.9) 70.2 (51.1) 15.4 60.0 29.3 31.7 23.8Percent of market demand (%) 3.4% -7.1% 0.2% -13.0% -7.0% -11.3% -9.6% -4.6% -2.1% 0.6% 2.5%
Net balance - Surplus (Deficit) (83.2) (66.7) (115.5) (160.2) (71.4) (112.4) (154.6) (84.5) (45.2) (13.5) 10.3Change (YoY) 6.0 16.5 (48.8) (44.7) 88.8 (41.0) (42.2) 70.1 39.3 31.7 23.8Percent of market demand (%) -7.2% -6.0% -10.3% -13.9% -6.3% -9.7% -12.9% -7.2% -3.8% -1.1% 0.9%
Silver price (US$/oz) 20.19 35.12 31.15 23.79 19.08 15.68 17.30 19.00 18.50 18.50 19.00YoY% change 38% 74% -11% -24% -20% -18% 10% 10% -3% 0% 3%
Source: Company data, Credit Suisse estimates

29 June 2016
Precious Metals Outlook 16
Disclosure AppendixImportant Global Disclosures Anita Soni, P. Eng., CFA, and Ralph M. Profiti, CFA, each certify, with respect to the companies or securities that the individual analyzes, that (1) the views expressed in this report accurately reflect his or her personal views about all of the subject companies and securities and (2) no part of his or her compensation was, is or will be directly or indirectly related to the specific recommendations or views expressed in this report.The analyst(s) responsible for preparing this research report received Compensation that is based upon various factors including Credit Suisse's total revenues, a portion of which are generated by Credit Suisse's investment banking activitiesAs of December 10, 2012 Analysts’ stock rating are defined as follows:Outperform (O) : The stock’s total return is expected to outperform the relevant benchmark* over the next 12 months.Neutral (N) : The stock’s total return is expected to be in line with the relevant benchmark* over the next 12 months.Underperform (U) : The stock’s total return is expected to underperform the relevant benchmark* over the next 12 months. *Relevant benchmark by region: As of 10th December 2012, Japanese ratings are based on a stock’s total return relative to the analyst's coverage universe which consists of all companies covered by the analyst within the relevant sector, with Outperforms representing the most attractive, Neutrals the less attractive, and Underperforms the least attractive investment opportunities. As of 2nd October 2012, U.S. and Canadian as well as European ratings are based on a stock’s total return relative to the analyst's coverage universe which consists of all companies covered by the analyst within the relevant sector, with Outperforms representing the most attractive, Neutrals the less attractive, and Underperforms the least attractive investment opportunities. For Latin American and non-Japan Asia stocks, ratings are based on a stock’s total return relative to the average total return of the relevant country or regional benchmark; prior to 2nd October 2012 U.S. and Canadian ratings were based on (1) a stock’s absolute total return potential to its current share price and (2) the relative attractiveness of a stock’s total return potential within an analyst’s coverage universe. For Australian and New Zealand stocks, the expected total return (ETR) calculation includes 12-month rolling dividend yield. An Outperform rating is assigned where an ETR is greater than or equal to 7.5%; Underperform where an ETR less than or equal to 5%. A Neutral may be assigned where the ETR is between -5% and 15%. The overlapping rating range allows analysts to assign a rating that puts ETR in the context of associated risks. Prior to 18 May 2015, ETR ranges for Outperform and Underperform ratings did not overlap with Neutral thresholds between 15% and 7.5%, which was in operation from 7 July 2011.Restricted (R) : In certain circumstances, Credit Suisse policy and/or applicable law and regulations preclude certain types of communications, including an investment recommendation, during the course of Credit Suisse's engagement in an investment banking transaction and in certain other circumstances.Volatility Indicator [V] : A stock is defined as volatile if the stock price has moved up or down by 20% or more in a month in at least 8 of the past 24 months or the analyst expects significant volatility going forward.Analysts’ sector weightings are distinct from analysts’ stock ratings and are based on the analyst’s expectations for the fundamentals and/or valuation of the sector* relative to the group’s historic fundamentals and/or valuation:Overweight : The analyst’s expectation for the sector’s fundamentals and/or valuation is favorable over the next 12 months.Market Weight : The analyst’s expectation for the sector’s fundamentals and/or valuation is neutral over the next 12 months.Underweight : The analyst’s expectation for the sector’s fundamentals and/or valuation is cautious over the next 12 months. *An analyst’s coverage sector consists of all companies covered by the analyst within the relevant sector. An analyst may cover multiple sectors.
Credit Suisse's distribution of stock ratings (and banking clients) is:
Global Ratings DistributionRating Versus universe (%) Of which banking clients (%)Outperform/Buy* 56% (39% banking clients)Neutral/Hold* 34% (18% banking clients)Underperform/Sell* 10% (40% banking clients)Restricted 0%*For purposes of the NYSE and NASD ratings distribution disclosure requirements, our stock ratings of Outperform, Neutral, and Underperform most closely correspond to Buy, Hold, and Sell, respectively; however, the meanings are not the same, as our stock ratings are determined on a relative basis. (Please refer to definitions above.) An investor's decision to buy or sell a security should be based on investment objectives, current holdings, and other individual factors.
Credit Suisse’s policy is to update research reports as it deems appropriate, based on developments with the subject company, the sector or the market that may have a material impact on the research views or opinions stated herein. Credit Suisse's policy is only to publish investment research that is impartial, independent, clear, fair and not misleading. For more detail please refer to Credit Suisse's Policies for Managing Conflicts of Interest in connection with Investment Research: http://www.csfb.com/research-and-analytics/disclaimer/managing_conflicts_disclaimer.htmlCredit Suisse does not provide any tax advice. Any statement herein regarding any US federal tax is not intended or written to be used, and cannot be used, by any taxpayer for the purposes of avoiding any penalties.Important Regional Disclosures Singapore recipients should contact Credit Suisse AG, Singapore Branch for any matters arising from this research report.The analyst(s) involved in the preparation of this report may participate in events hosted by the subject company, including site visits. Credit Suisse does not accept or permit analysts to accept payment or reimbursement for travel expenses associated with these events.Restrictions on certain Canadian securities are indicated by the following abbreviations: NVS--Non-Voting shares; RVS--Restricted Voting Shares; SVS--Subordinate Voting Shares.Individuals receiving this report from a Canadian investment dealer that is not affiliated with Credit Suisse should be advised that this report may not contain regulatory disclosures the non-affiliated Canadian investment dealer would be required to make if this were its own report.

29 June 2016
Precious Metals Outlook 17
For Credit Suisse Securities (Canada), Inc.'s policies and procedures regarding the dissemination of equity research, please visit https://www.credit-suisse.com/sites/disclaimers-ib/en/canada-research-policy.html.As of the date of this report, Credit Suisse acts as a market maker or liquidity provider in the equities securities that are the subject of this report.Principal is not guaranteed in the case of equities because equity prices are variable.Commission is the commission rate or the amount agreed with a customer when setting up an account or at any time after that.To the extent this is a report authored in whole or in part by a non-U.S. analyst and is made available in the U.S., the following are important disclosures regarding any non-U.S. analyst contributors: The non-U.S. research analysts listed below (if any) are not registered/qualified as research analysts with FINRA. The non-U.S. research analysts listed below may not be associated persons of CSSU and therefore may not be subject to the NASD Rule 2711 and NYSE Rule 472 restrictions on communications with a subject company, public appearances and trading securities held by a research analyst account.Credit Suisse Securities (Canada), Inc. ..Anita Soni, P. Eng., CFA ; Ralph M. Profiti, CFA ; Robert Reynolds, CPA, CA, CFA ; Yan Truong, CFAFor Credit Suisse disclosure information on other companies mentioned in this report, please visit the website at https://rave.credit-suisse.com/disclosures or call +1 (877) 291-2683.

29 June 2016
Precious Metals Outlook 18
References in this report to Credit Suisse include all of the subsidiaries and affiliates of Credit Suisse operating under its investment banking division. For more information on our structure, please use the following link: https://www.credit-suisse.com/who-we-are This report may contain material that is not directed to, or intended for distribution to or use by, any person or entity who is a citizen or resident of or located in any locality, state, country or other jurisdiction where such distribution, publication, availability or use would be contrary to law or regulation or which would subject Credit Suisse AG or its affiliates ("CS") to any registration or licensing requirement within such jurisdiction. All material presented in this report, unless specifically indicated otherwise, is under copyright to CS. None of the material, nor its content, nor any copy of it, may be altered in any way, transmitted to, copied or distributed to any other party, without the prior express written permission of CS. All trademarks, service marks and logos used in this report are trademarks or service marks or registered trademarks or service marks of CS or its affiliates. The information, tools and material presented in this report are provided to you for information purposes only and are not to be used or considered as an offer or the solicitation of an offer to sell or to buy or subscribe for securities or other financial instruments. CS may not have taken any steps to ensure that the securities referred to in this report are suitable for any particular investor. CS will not treat recipients of this report as its customers by virtue of their receiving this report. The investments and services contained or referred to in this report may not be suitable for you and it is recommended that you consult an independent investment advisor if you are in doubt about such investments or investment services. Nothing in this report constitutes investment, legal, accounting or tax advice, or a representation that any investment or strategy is suitable or appropriate to your individual circumstances, or otherwise constitutes a personal recommendation to you. CS does not advise on the tax consequences of investments and you are advised to contact an independent tax adviser. Please note in particular that the bases and levels of taxation may change. Information and opinions presented in this report have been obtained or derived from sources believed by CS to be reliable, but CS makes no representation as to their accuracy or completeness. CS accepts no liability for loss arising from the use of the material presented in this report, except that this exclusion of liability does not apply to the extent that such liability arises under specific statutes or regulations applicable to CS. This report is not to be relied upon in substitution for the exercise of independent judgment. CS may have issued, and may in the future issue, other communications that are inconsistent with, and reach different conclusions from, the information presented in this report. Those communications reflect the different assumptions, views and analytical methods of the analysts who prepared them and CS is under no obligation to ensure that such other communications are brought to the attention of any recipient of this report. Some investments referred to in this report will be offered solely by a single entity and in the case of some investments solely by CS, or an associate of CS or CS may be the only market maker in such investments. Past performance should not be taken as an indication or guarantee of future performance, and no representation or warranty, express or implied, is made regarding future performance. Information, opinions and estimates contained in this report reflect a judgment at its original date of publication by CS and are subject to change without notice. The price, value of and income from any of the securities or financial instruments mentioned in this report can fall as well as rise. The value of securities and financial instruments is subject to exchange rate fluctuation that may have a positive or adverse effect on the price or income of such securities or financial instruments. Investors in securities such as ADR's, the values of which are influenced by currency volatility, effectively assume this risk. Structured securities are complex instruments, typically involve a high degree of risk and are intended for sale only to sophisticated investors who are capable of understanding and assuming the risks involved. The market value of any structured security may be affected by changes in economic, financial and political factors (including, but not limited to, spot and forward interest and exchange rates), time to maturity, market conditions and volatility, and the credit quality of any issuer or reference issuer. Any investor interested in purchasing a structured product should conduct their own investigation and analysis of the product and consult with their own professional advisers as to the risks involved in making such a purchase. Some investments discussed in this report may have a high level of volatility. High volatility investments may experience sudden and large falls in their value causing losses when that investment is realised. Those losses may equal your original investment. Indeed, in the case of some investments the potential losses may exceed the amount of initial investment and, in such circumstances, you may be required to pay more money to support those losses. Income yields from investments may fluctuate and, in consequence, initial capital paid to make the investment may be used as part of that income yield. Some investments may not be readily realisable and it may be difficult to sell or realise those investments, similarly it may prove difficult for you to obtain reliable information about the value, or risks, to which such an investment is exposed. This report may provide the addresses of, or contain hyperlinks to, websites. Except to the extent to which the report refers to website material of CS, CS has not reviewed any such site and takes no responsibility for the content contained therein. Such address or hyperlink (including addresses or hyperlinks to CS's own website material) is provided solely for your convenience and information and the content of any such website does not in any way form part of this document. Accessing such website or following such link through this report or CS's website shall be at your own risk. This report is issued and distributed in Europe (except Switzerland) by Credit Suisse Securities (Europe) Limited, One Cabot Square, London E14 4QJ, England, which is authorised by the Prudential Regulation Authority and regulated by the Financial Conduct Authority and the Prudential Regulation Authority. This report is issued and distributed in Europe (except Switzerland) by Credit Suisse International, One Cabot Square, London E14 4QJ, England, which is authorised by the Prudential Regulation Authority and regulated by the Financial Conduct Authority and the Prudential Regulation Authority. This report is being distributed in Germany by Credit Suisse Securities (Europe) Limited Niederlassung Frankfurt am Main regulated by the Bundesanstalt fuer Finanzdienstleistungsaufsicht ("BaFin"). This report is being distributed in the United States and Canada by Credit Suisse Securities (USA) LLC; in Switzerland by Credit Suisse AG; in Brazil by Banco de Investimentos Credit Suisse (Brasil) S.A or its affiliates; in Mexico by Banco Credit Suisse (México), S.A. (transactions related to the securities mentioned in this report will only be effected in compliance with applicable regulation); in Japan by Credit Suisse Securities (Japan) Limited, Financial Instruments Firm, Director-General of Kanto Local Finance Bureau (Kinsho) No. 66, a member of Japan Securities Dealers Association, The Financial Futures Association of Japan, Japan Investment Advisers Association, Type II Financial Instruments Firms Association; elsewhere in Asia/ Pacific by whichever of the following is the appropriately authorised entity in the relevant jurisdiction: Credit Suisse (Hong Kong) Limited, Credit Suisse Equities (Australia) Limited, Credit Suisse Securities (Thailand) Limited, regulated by the Office of the Securities and Exchange Commission, Thailand, having registered address at 990 Abdulrahim Place, 27th Floor, Unit 2701, Rama IV Road, Silom, Bangrak, Bangkok 10500, Thailand, Tel. +66 2614 6000, Credit Suisse Securities (Malaysia) Sdn Bhd, Credit Suisse AG, Singapore Branch, Credit Suisse Securities (India) Private Limited (CIN no. U67120MH1996PTC104392) regulated by the Securities and Exchange Board of India as Research Analyst (registration no. INH 000001030) and as Stock Broker (registration no. INB230970637; INF230970637; INB010970631; INF010970631), having registered address at 9th Floor, Ceejay House, Dr.A.B. Road, Worli, Mumbai - 18, India, T- +91-22 6777 3777, Credit Suisse Securities (Europe) Limited, Seoul Branch, Credit Suisse AG, Taipei Securities Branch, PT Credit Suisse Securities Indonesia, Credit Suisse Securities (Philippines ) Inc., and elsewhere in the world by the relevant authorised affiliate of the above. Credit Suisse (Hong Kong) Limited ("CSHK") is licensed and regulated by the Securities and Futures Commission of Hong Kong under the laws of Hong Kong, which differ from Australian laws. CSHKL does not hold an Australian financial services licence (AFSL) and is exempt from the requirement to hold an AFSL under the Corporations Act 2001 (the Act) under Class Order 03/1103 published by the ASIC in respect of financial services provided to Australian wholesale clients (within the meaning of section 761G of the Act). Research on Taiwanese securities produced by Credit Suisse AG, Taipei Securities Branch has been prepared by a registered Senior Business Person. Research provided to residents of Malaysia is authorised by the Head of Research for Credit Suisse Securities (Malaysia) Sdn Bhd, to whom they should direct any queries on +603 2723 2020. This report has been prepared and issued for distribution in Singapore to institutional investors, accredited investors and expert investors (each as defined under the Financial Advisers Regulations) only, and is also distributed by Credit Suisse AG, Singapore branch to overseas investors (as defined under the Financial Advisers Regulations). By virtue of your status as an institutional investor, accredited investor, expert investor or overseas investor, Credit Suisse AG, Singapore branch is exempted from complying with certain compliance requirements under the Financial Advisers Act, Chapter 110 of Singapore (the "FAA"), the Financial Advisers Regulations and the relevant Notices and Guidelines issued thereunder, in respect of any financial advisory service which Credit Suisse AG, Singapore branch may provide to you. This information is being distributed by Credit Suisse AG (DIFC Branch), duly licensed and regulated by the Dubai Financial Services Authority (“DFSA”). Related financial services or products are only made available to Professional Clients or Market Counterparties, as defined by the DFSA, and are not intended for any other persons. Credit Suisse AG (DIFC Branch) is located on Level 9 East, The Gate Building, DIFC, Dubai, United Arab Emirates. This research may not conform to Canadian disclosure requirements. In jurisdictions where CS is not already registered or licensed to trade in securities, transactions will only be effected in accordance with applicable securities legislation, which will vary from jurisdiction to jurisdiction and may require that the trade be made in accordance with applicable exemptions from registration or licensing requirements. Non-U.S. customers wishing to effect a transaction should contact a CS entity in their local jurisdiction unless governing law permits otherwise. U.S. customers wishing to effect a transaction should do so only by contacting a representative at Credit Suisse Securities (USA) LLC in the U.S. Please note that this research was originally prepared and issued by CS for distribution to their market professional and institutional investor customers. Recipients who are not market professional or institutional investor customers of CS should seek the advice of their independent financial advisor prior to taking any investment decision based on this report or for any necessary explanation of its contents. This research may relate to investments or services of a person outside of the UK or to other matters which are not authorised by the Prudential Regulation Authority and regulated by the Financial Conduct Authority and the Prudential Regulation Authority or in respect of which the protections of the Prudential Regulation Authority and Financial Conduct Authority for private customers and/or the UK compensation scheme may not be available, and further details as to where this may be the case are available upon request in respect of this report. CS may provide various services to US municipal entities or obligated persons ("municipalities"), including suggesting individual transactions or trades and entering into such transactions. Any services CS provides to municipalities are not viewed as "advice" within the meaning of Section 975 of the Dodd-Frank Wall Street Reform and Consumer Protection Act. CS is providing any such services and related information solely on an arm's length basis and not as an advisor or fiduciary to the municipality. In connection with the provision of the any such services, there is no agreement, direct or indirect, between any municipality (including the officials, management, employees or agents thereof) and CS for CS to provide advice to the municipality. Municipalities should consult with their financial, accounting and legal advisors regarding any such services provided by CS. In addition, CS is not acting for direct or indirect compensation to solicit the municipality on behalf of an unaffiliated broker, dealer, municipal securities dealer, municipal advisor, or investment adviser for the purpose of obtaining or retaining an engagement by the municipality for or in connection with Municipal Financial Products, the issuance of municipal securities, or of an investment adviser to provide investment advisory services to or on behalf of the municipality. If this report is being distributed by a financial institution other than Credit Suisse AG, or its affiliates, that financial institution is solely responsible for distribution. Clients of that institution should contact that institution to effect a transaction in the securities mentioned in this report or require further information. This report does not constitute investment advice by Credit Suisse to the clients of the distributing financial institution, and neither Credit Suisse AG, its affiliates, and their respective officers, directors and employees accept any liability whatsoever for any direct or consequential loss arising from their use of this report or its content. Principal is not guaranteed. Commission is the commission rate or the amount agreed with a customer when setting up an account or at any time after that.Copyright © 2016 CREDIT SUISSE AG and/or its affiliates. All rights reserved. Investment principal on bonds can be eroded depending on sale price or market price. In addition, there are bonds on which investment principal can be eroded due to changes in redemption amounts. Care is required when investing in such instruments. When you purchase non-listed Japanese fixed income securities (Japanese government bonds, Japanese municipal bonds, Japanese government guaranteed bonds, Japanese corporate bonds) from CS as a seller, you will be requested to pay the purchase price only.