28th March 2013 STATISTICAL RELEASE 2012 UK GREENHOUSE GAS
44
2013 UK Greenhouse Gas Emissions, Provisional Figures and 2012 UK Greenhouse Gas Emissions, Final Figures by Fuel Type and End-User Statistical release 27 th March 2014
Transcript of 28th March 2013 STATISTICAL RELEASE 2012 UK GREENHOUSE GAS

2013 UK Greenhouse Gas Emissions, Provisional
Figures and 2012 UK Greenhouse Gas Emissions,
Final Figures by Fuel Type and End-User
Statistical release
27th March 2014

2
© Crown copyright 2014
You may re-use this information (not including logos) free of charge in any format or medium, under the terms of the Open Government Licence.
To view this licence, visit www.nationalarchives.gov.uk/doc/open-government-licence/ or write to the Information Policy Team, The National Archives, Kew, London TW9 4DU, or email: [email protected].
Any enquiries regarding this publication should be sent to us at: [email protected].
The responsible statistician for this publication is Laura Bates.
Contact telephone: 0300 068 2948.
This document is also available from our website at: https://www.gov.uk/government/publications/final-uk-emissions-estimates

3
Contents
Executive summary .................................................................................................................. 4
Coverage of emissions reporting .............................................................................................. 8
2013 Provisional Emissions ...................................................................................................... 9
Energy supply ..................................................................................................................... 13
Transport ............................................................................................................................ 15
Residential .......................................................................................................................... 15
Business ............................................................................................................................. 15
Industrial Process ............................................................................................................... 16
Public Sector ....................................................................................................................... 16
Agriculture, waste management and land use, land use change and forestry .................... 16
Carbon dioxide emissions by fuel type ................................................................................ 17
2012 Greenhouse Gas emissions by end-user ...................................................................... 19
Transport ............................................................................................................................ 23
Business ............................................................................................................................. 24
Residential .......................................................................................................................... 26
Agriculture ........................................................................................................................... 28
Waste management ............................................................................................................ 29
Industrial process ................................................................................................................ 31
Public sector ....................................................................................................................... 32
Land Use, Land Use Change and Forestry (LULUCF) ....................................................... 34
Exports ................................................................................................................................ 35
Revisions to the estimates of end-user emissions .............................................................. 37
Embedded Emissions ......................................................................................................... 37
Uncertainties around the 2012 estimates ............................................................................... 39
UK performance against emissions reduction targets ............................................................ 41
Future updates to emissions estimates .................................................................................. 42
Further information and feedback ........................................................................................... 42
Notes for editors ..................................................................................................................... 43

4
Executive summary
This publication provides the latest provisional estimates of 2013 UK greenhouse gas emissions by source, and final estimates of 2012 UK greenhouse gas emissions by fuel type and end-user.
In 2013, UK emissions of the basket of six greenhouse gases covered by the Kyoto Protocol were provisionally estimated to be 569.9 million tonnes carbon dioxide equivalent (MtCO2e). This was 1.9 per cent lower than the 2012 figure of 581.1 million tonnes.
The largest decrease between 2012 emissions and provisional 2013 emissions was a 7.5 per cent (14.5MtCO2e) decrease in the energy supply sector, due to a decrease in fossil fuel use for electricity generation.
In 2013, UK net emissions of carbon dioxide were provisionally estimated to be 464.3 million tonnes (Mt). This was 2.1 per cent lower than the 2012 figure of 474.1Mt. Carbon dioxide (CO2) is the main greenhouse gas, accounting for 82 per cent of total UK greenhouse gas emissions in 2012, the latest year for which final results are available.
The sectoral breakdowns for provisional emissions are based on the source of the emissions. Emissions related to electricity generation are therefore attributed to power stations, the source of these emissions, rather than homes and businesses where electricity is used. For 1990-2012 emissions, an end-user breakdown is presented which reallocates emissions to where the “end-use” occurred. The main impact is to reallocate emissions from the energy supply sector to other sectors, the business and residential sectors in particular.

5
0
100
200
300
400
500
600
700
800
900
19
90
19
91
19
92
19
93
19
94
19
95
19
96
19
97
19
98
19
99
20
00
20
01
20
02
20
03
20
04
20
05
20
06
20
07
20
08
20
09
20
10
20
11
20
12
20
13
(p)
Mill
ion
to
nn
es (
carb
on
dio
xid
e eq
uiv
alen
t)
Basket of greenhouse gases Carbon Dioxide
Table 1: Emissions of greenhouse gases (MtCO2e)
2012 2013(p) Change
Total greenhouse gas emissions 581.1 569.9 -1.9%
Carbon dioxide emissions 474.1 464.3 -2.1%
Note: 1. (p) 2013 estimates are provisional 2. Carbon dioxide emissions figures are for the UK and Crown Dependencies. Total greenhouse gas emissions figures are for UK
emissions under the Kyoto Protocol, which include some Overseas Territories and a narrower definition for the Land Use, Land Use Change and Forestry (LULUCF) sector.
3. Emissions are reported as net emissions, to include removals from the atmosphere by carbon sinks.
Figure 1: Emissions of greenhouse gases, 1990-2013 provisional, (MtCO2e)
Note: (p) 2013 estimates are provisional.

6
Introduction
This publication provides provisional estimates of UK greenhouse gas emissions by source only for 2013, and final estimates of 2012 UK greenhouse gas emissions by end-user. It also includes uncertainty estimates for 2012 emissions by gas and sector.
Emissions by end user and by fuel type, and uncertainty data, are published in updated data tables alongside the final estimates for 2012 UK greenhouse gas emissions by source. Also published in this dataset are uncertainties analysis for 2012 emissions by gas and sector. Note that this publication does not discuss 2012 emissions by fuel type, but these are included in the updated data tables.
The estimates of 2012 UK greenhouse gas emissions by fuel type and end-user are based on, and consistent with, final estimates of 2012 UK greenhouse gas emissions by source which were published on 4th February 2014. For the purposes of reporting, greenhouse gas emissions are allocated into sectors as follows:
Energy supply o Emissions from fuel combustion for electricity and other energy production sources.
Business o Emissions from combustion in industrial/commercial sectors, industrial off-road
machinery and refrigeration and air conditioning.
Transport o Emissions from aviation, road transport, railways, shipping, fishing and aircraft
support vehicles.
Public o Emissions from combustion of fuel in public sector buildings.
Residential o Emissions from fuel combustion for heating/cooking, garden machinery and
fluorinated gases released from aerosols/metered dose inhalers.
Agriculture o Emissions from livestock, agricultural soils, stationary combustion sources and off-
road machinery.
Industrial processes o Emissions from industry except for those associated with fuel combustion (for
example, emissions from cement manufacture).
Land use land use change and forestry (LULUCF) o Emissions from forestland, cropland, grassland, settlements and harvested wood
products.

7
Waste management. o Emissions from waste disposed of to landfill sites, waste incineration, and the
treatment of waste water. When emissions are reported by source, emissions are attributed to the sector that emits them directly. The end-user breakdown reallocates emissions by source in to where the “end-use” occurred. The main impact is to reallocate emissions from the energy supply sector to other sectors, the business and residential sectors in particular
These high-level sectors are made up of a number of more detailed sectors, which follow the definitions set out by the Intergovernmental Panel on Climate Change (IPCC), and which are used in international reporting tables which are submitted to the United Nations Framework Convention on Climate Change (UNFCCC) every year.
Provisional emissions are calculated based on the latest energy statistics to give an early indication of emissions estimates for 2013. Final emissions estimates for 2013 based on data from the UK’s National Atmospheric Emissions Inventory and the Digest of UK Energy Statistics for 2013 will be published in February 2015.
No temperature or seasonal adjustments are applied to data in this publication.
Note that all 2013 greenhouse gas emissions and energy statistics figures in this statistics release are provisional and subject to change.

8
Coverage of emissions reporting
The basket of greenhouse gases covered by the Kyoto Protocol consists of six gases: carbon dioxide, methane, nitrous oxide, hydrofluorocarbons, perfluorocarbons and sulphur hexafluoride. The last three gases are collectively referred to as fluorinated gases or F-gases. In accordance with international reporting and carbon trading protocols, each of these gases is weighted by its global warming potential (GWP), so that total greenhouse gas emissions can be reported on a consistent basis. The GWP for each gas is defined as its warming influence relative to that of carbon dioxide. Greenhouse gas emissions are then presented in carbon dioxide equivalent units.
Carbon dioxide (CO2) is reported in terms of net emissions, which means total emissions from burning fuel minus total removals of carbon dioxide from the atmosphere by carbon sinks. Carbon sinks are incorporated within the Land Use, Land Use Change and Forestry (LULUCF) sector, which covers afforestation, reforestation, deforestation and forest management. They are defined by the United Nations Framework Convention on Climate Change (UNFCCC) as “any process, activity or mechanism which removes a greenhouse gas, an aerosol or a precursor of a greenhouse gas from the atmosphere”.
Unless otherwise stated, any figures included in this release represent emissions from within the UK and its Crown Dependencies (Jersey, Guernsey, and the Isle of Man) and are expressed in millions of tonnes of carbon dioxide equivalent (MtCO2e).
Reporting of greenhouse gas emissions under the Kyoto Protocol is based on emissions in the UK, its Crown Dependencies, and those Overseas Territories (Bermuda, Cayman Islands, Falkland Islands, Gibraltar and Montserrat) that are party to the UK ratification of the Kyoto Protocol. This now includes emissions from all direct flights and shipping between the UK and these Territories. The Kyoto Protocol also uses a narrower definition of carbon sinks than that applied for domestic UK carbon dioxide reporting, which therefore results in a slightly different total. These adjustments mean that the greenhouse gas basket reported for Kyoto differs slightly from the sum of the individual gases as shown.

9
2013 Provisional Emissions
Provisional estimates of carbon dioxide emissions are produced based on provisional inland energy consumption statistics which are being published at the same time in DECC’s quarterly Energy Trends publication. Details of the provisional energy consumption statistics which have been used to estimate emissions can be found in Energy Trends.
Carbon dioxide accounts for the majority of UK greenhouse gas emissions (82 per cent in 2013). However, in order to give an indication of what the latest provisional carbon dioxide emissions estimates imply for the basket total, an estimate of emissions is produced of the remaining gases in the basket. This estimate is based on a simple approach which assumes that the trend for these gases will be half-way between no change on 2012 and a repeat of the trend indicated by the last 12 years’ data (2000-2012).
Finally, in order to establish an estimate of total emissions which is consistent with the Kyoto Protocol definition for the basket as a whole, a further adjustment is made in respect of emissions from Overseas Territories and the narrower definition of carbon sinks used by the Protocol.
These provisional emissions estimates will be subject to revision when the final estimates are
published in February 2015; however, they provide an early indication of emissions in the most recent full calendar year. The majority of provisional estimates in the past have been within 2 per cent of the final figures.
To ensure consistency with other National Statistics publications on UK greenhouse gas emissions, the sectoral breakdowns in this statistical release are based on the UK’s National Communication sectors, by which we report our greenhouse gas emissions to the UNFCCC.
10
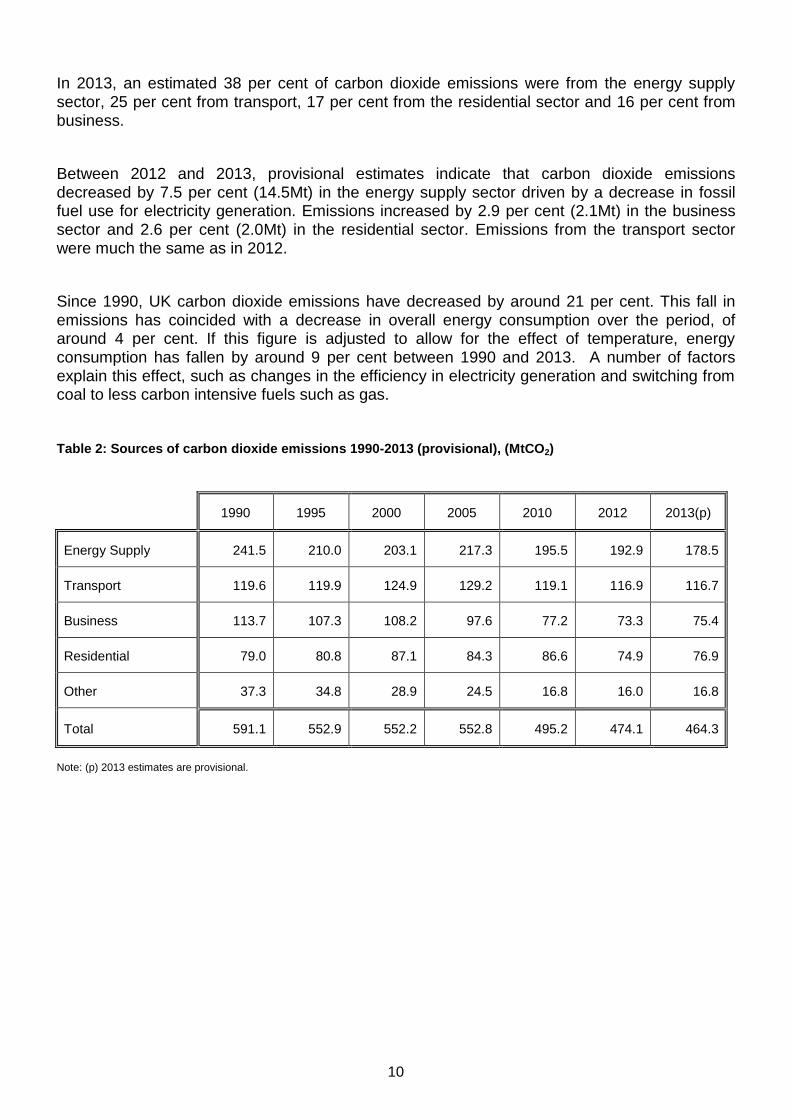
In 2013, an estimated 38 per cent of carbon dioxide emissions were from the energy supply sector, 25 per cent from transport, 17 per cent from the residential sector and 16 per cent from business.
Between 2012 and 2013, provisional estimates indicate that carbon dioxide emissions decreased by 7.5 per cent (14.5Mt) in the energy supply sector driven by a decrease in fossil fuel use for electricity generation. Emissions increased by 2.9 per cent (2.1Mt) in the business sector and 2.6 per cent (2.0Mt) in the residential sector. Emissions from the transport sector were much the same as in 2012.
Since 1990, UK carbon dioxide emissions have decreased by around 21 per cent. This fall in emissions has coincided with a decrease in overall energy consumption over the period, of around 4 per cent. If this figure is adjusted to allow for the effect of temperature, energy consumption has fallen by around 9 per cent between 1990 and 2013. A number of factors explain this effect, such as changes in the efficiency in electricity generation and switching from coal to less carbon intensive fuels such as gas.
Table 2: Sources of carbon dioxide emissions 1990-2013 (provisional), (MtCO2)
1990 1995 2000 2005 2010 2012 2013(p)
Energy Supply 241.5 210.0 203.1 217.3 195.5 192.9 178.5
Transport 119.6 119.9 124.9 129.2 119.1 116.9 116.7
Business 113.7 107.3 108.2 97.6 77.2 73.3 75.4
Residential 79.0 80.8 87.1 84.3 86.6 74.9 76.9
Other 37.3 34.8 28.9 24.5 16.8 16.0 16.8
Total 591.1 552.9 552.2 552.8 495.2 474.1 464.3
Note: (p) 2013 estimates are provisional.

11
0
100
200
300
400
500
600
700
19
90
19
91
19
92
19
93
19
94
19
95
19
96
19
97
19
98
19
99
20
00
20
01
20
02
20
03
20
04
20
05
20
06
20
07
20
08
20
09
20
10
20
11
20
12
20
13
(p
)
Other
Residential
Business
Transport
Energy supply
Figure 2: Carbon dioxide emissions by source, 1990-2013 (provisional), (MtCO2)
Note: (p) 2013 estimates are provisional.

12
Table 3: UK Greenhouse Gas Emissions 1990-2013, provisional headline results
Greenhouse gas emissions: weighted by global warming potential (million tonnes carbon dioxide equivalent)
1990 1995 2000 2005 2006 2007 2008 2009 2010 2011 2012 2013 (p)
Net CO2 emissions (emissions minus
removals)
Energy supply 241.5 210.0 203.1 217.3 224.4 219.2 212.7 189.7 195.5 182.0 192.9 178.5
from power stations 203.5 163.4 158.5 172.8 182.0 177.8 172.8 151.1 156.6 144.1 158.1 145.1
other Energy supply 38.0 46.6 44.6 44.5 42.4 41.4 39.9 38.6 38.9 37.8 34.8 33.4
Business 113.7 107.3 108.2 97.6 94.6 92.9 88.4 77.1 77.2 72.7 73.3 75.4
Transport 119.6 119.9 124.9 129.2 129.7 132.7 125.5 120.7 119.1 117.4 116.9 116.7
Public 13.1 12.7 11.5 11.0 10.0 9.3 9.9 9.7 10.5 9.7 10.1 10.4
Residential 79.0 80.8 87.1 84.3 81.7 78.1 79.9 74.8 86.6 66.5 74.9 76.9
Agriculture 5.2 5.3 4.8 4.6 4.3 4.1 4.1 4.0 4.1 4.2 4.1 4.1
Industrial process 16.7 15.3 15.2 15.0 14.3 15.6 14.1 9.3 9.9 9.5 9.3 9.8
Waste Management 1.3 0.9 0.5 0.4 0.3 0.3 0.3 0.3 0.3 0.3 0.3 0.3
LULUCF 1.0 0.6 -3.0 -6.5 -7.0 -7.4 -7.6 -7.7 -8.0 -8.2 -7.7 -7.7
Total CO2 591.1 552.9 552.2 552.8 552.3 544.9 527.3 477.9 495.2 454.0 474.1 464.3
Other greenhouse gases 187.8 173.7 137.6 117.7 114.9 112.3 110.5 106.4 104.6 102.7 101.3 99.9
Kyoto greenhouse gas basket 777.6 725.2 692.2 676.3 673.2 663.7 644.2 590.7 606.2 563.2 581.1 569.9
Note: 1. (p) 2013 estimates are provisional.
2. Provisional 2013 CO2 emissions for the agriculture, waste and LULUCF sectors have not been estimated; 2012 estimates have been used for this component of the provisional estimates of total UK emissions.
3. Kyoto basket total differs slightly from sum of individual pollutants above as the basket uses a narrower definition for LULUCF, and includes emissions from UK Overseas Territories, as well as emissions from direct flights between the UK and these Territories.
4. The entire time series is revised each year to take account of methodological improvements in the UK emissions inventory.
5. Emissions are presented as carbon dioxide equivalent in line with international reporting and carbon trading. To convert carbon dioxide into carbon equivalents, divide figures by 44/12. 6. Figures shown do not include any adjustment for the effect of the EU Emissions Trading System (EUETS), which was introduced in 2005.
7. Totals for CO2 emissions and Energy Supply may not sum due to rounding.

13
0
10
20
30
40
50
60
70
80
90
100
19
90
19
91
19
92
19
93
19
94
19
95
19
96
19
97
19
98
19
99
20
00
20
01
20
02
20
03
20
04
20
05
20
06
20
07
20
08
20
09
20
10
20
11
20
12
20
13
(p)
Renewables
Nuclear
Bioenergy and wastes
Oil
Gas
Coal
Energy supply
The energy supply sector was the largest contributor to the decrease in carbon dioxide emissions between 2012 and 2013. Emissions from this sector were provisionally estimated to be 178.5Mt in 2013, a decrease of around 7.5 per cent compared to 2012.
The decrease in emissions from this sector since 2012 can largely be attributed to an 8 per cent decrease in emissions from electricity generation. There was a change in the fuel mix used at power stations for electricity generation, with a 9 per cent decrease in coal use for generation and a 7 per cent decrease in gas use. In 2013, carbon dioxide emissions from power stations,
at 145.1Mt, accounted for just under a third of all carbon dioxide emissions.
Carbon dioxide emissions from the energy supply sector were estimated to be around 26 per cent lower in 2013 than they were in 1990. Between 1990 and 2013, final consumption of electricity is provisionally estimated to have increased by around 11 per cent; domestic electricity consumption in particular was around 21 per cent higher in 2013 than in 1990. However, emissions from electricity generation have decreased by 29 per cent over the same period.
The decrease in emissions from power stations since 1990 has resulted from a combination of changes in the fuel mix over the period together with greater efficiency due to improvements in technology. It is difficult to assess the relative impacts of the two, but it is likely that the majority of the saving since 1990 will have been due to fuel switching from coal to gas for electricity generation.
Figure 3: Fuel mix for UK electricity generation, 1990-2013 (provisional), (MtOe)
Note: (p) 2013 estimates are provisional.

14
0
50
100
150
200
2501
99
0
19
91
19
92
19
93
19
94
19
95
19
96
19
97
19
98
19
99
20
00
20
01
20
02
20
03
20
04
20
05
20
06
20
07
20
08
20
09
20
10
20
11
20
12
20
13
(p)
Other
Oil
Gas
Coal
0
100
200
300
400
500
600
700
19
90
19
91
19
92
19
93
19
94
19
95
19
96
19
97
19
98
19
99
20
00
20
01
20
02
20
03
20
04
20
05
20
06
20
07
20
08
20
09
20
10
20
11
20
12
20
13
(p)
Other sectors
Power Stations
Figure 4: Carbon dioxide emissions from electricity generation, 1990-2013 (provisional), (MtCO2)
Note: (p) 2013 estimates are provisional.
Figure 5: Carbon dioxide emissions from power stations as a proportion of total carbon dioxide emissions,
1990-2013 (provisional), (MtCO2)
Note: (p) 2013 estimates are provisional.

15
Transport
In 2013, carbon dioxide emissions from the transport sector, at 117Mt, accounted for about a quarter of all carbon dioxide emissions. Between 2012 and 2013, transport emissions decreased by 0.2 per cent (0.2Mt).
Emissions from this sector are similar to 1990 levels (down 2 per cent, or 3Mt). There was a general increase in these emissions throughout the period up to 2007, but they have been decreasing since then.
It should be noted that these estimates do not include emissions from international aviation and shipping; domestic aviation and shipping, however, are included.
Residential
In 2013, the residential sector, with emissions of 77Mt, accounted for around 17 per cent of all carbon dioxide emissions. Between 2012 and 2013 there was a 3 per cent increase in emissions from this sector.
The average temperature for 2013 was very similar to the average temperature for 2012, but the first quarter of 2013 was on average 2.7 degrees Celsius cooler than the first quarter of 2012 which has contributed to an increase in the use of natural gas for space heating.
In 2013, emissions from this sector were estimated around 3 per cent lower than in 1990.
It should be noted that emissions from this sector do not include emissions from power stations
related to domestic electricity consumption, as these emissions are included in the energy supply sector.
Business
Carbon dioxide emissions from the business sector, at 75Mt, accounted for around 16 per cent of all carbon dioxide emissions in 2013. This was 3 per cent higher than in 2012, which is largely due to increased use of manufactured fuels in the iron and steel industry caused by the re-opening of Teesside Steelworks in April 2012 since when it has gradually increased operations, and the opening of a furnace at Port Talbot in February 2013.
There has been a 34 per cent decrease in business sector emissions since 1990.

16
Industrial Process
In 2013, carbon dioxide emissions from the industrial process sector were estimated to be 10Mt, an increase of around 6 per cent compared with 2012. Between 1990 and 2013, emissions from this sector are estimated to have decreased by around 41 per cent.
Public Sector
Carbon dioxide emissions from the public sector, at 10Mt, were estimated to have increased by about 2 per cent from 2012 emissions. Between 1990 and 2013, emissions from this sector are estimated to have decreased by around 21 per cent.
Agriculture, waste management and land use, land use change and forestry
Updated emissions estimates for these sectors are not yet available for 2013, so for these provisional estimates of 2013 carbon dioxide emissions, emissions from these sectors are assumed to be the same as in 2012.
On this basis, 2013 carbon dioxide emissions from the agriculture sector are estimated to be 4Mt, 1Mt lower than in 1990. Carbon dioxide emissions from waste management were estimated to be 0.3Mt in 2013, and net land use, land use change and forestry emissions are estimated to be -8Mt in 2013 as the sector is currently a net carbon sink, with removals of carbon dioxide from the atmosphere being greater than emissions.

17
Carbon dioxide emissions by fuel type
The amount of carbon dioxide released by the consumption of one unit of energy depends on the type of fuel consumed. For example, since coal has a higher carbon content than gas, more carbon dioxide emissions result from burning one unit of coal than from one unit of gas.
Emissions per unit of electricity supplied by major power producers from fossil fuels are estimated to have been 640 tonnes of carbon dioxide per GWh in 2013 overall; within this, emissions from electricity generated from coal (870 tonnes of carbon dioxide per GWh electricity supplied) were over two times higher than for electricity supplied by gas (330 tonnes of carbon dioxide per GWh). For all sources of electricity (including nuclear, renewables and autogeneration), the average amount of carbon dioxide emitted in 2013 amounted to 410 tonnes per GWh of electricity supplied.
In 2013, carbon dioxide emissions from the use of fossil fuels, including fuel used for generating electricity, were estimated at 457Mt. This was 2 per cent lower than the 2012 figure of 467Mt. The biggest change in emissions was from the use of coal, down 10Mt (8 per cent) from 131Mt in 2012 to 121Mt in 2013. This largely resulted from decreased use of coal for electricity generation at power stations.
Over the period 1990 to 2013, carbon dioxide emissions from fossil fuels decreased by 20 per cent. Over the same period, overall primary consumption of fossil fuels has dropped by nearly 10 per cent. The relatively higher decrease in emissions can be attributed to an increase in the use of gas accompanied by a decrease in the use of coal and other solid fuels; gas consumption as a proportion of all fossil fuels has increased from 26 per cent in 1990 to 41 per cent in 2013, whilst the proportion used of coal and other solid fuels has decreased from 34 per cent to 22 per cent over the same period. Oil use, as a proportion of all fossil fuels, has remained relatively stable over the period; this accounted for almost 40 per cent of all fossil fuels used in 1990 and 37 per cent in 2013.
Table 4: UK Carbon dioxide Emissions by fuel, 1990-2013 (provisional), (MtCO2)
1990 1995 2000 2005 2010 2011 2012 2013 (p)
Gas 146.0 188.2 241.8 235.2 228.4 193.5 183.8 184.5
Oil 191.1 178.6 166.1 170.0 150.5 144.0 143.1 141.7
Coal 217.7 151.4 116.7 124.7 100.7 101.3 130.9 120.5
Other solid fuels 15.4 12.5 11.9 10.2 8.3 8.0 8.9 10.2
Non-fuel 20.8 22.2 15.7 12.7 7.3 7.2 7.3 7.3
Total 591.1 552.9 552.2 552.8 495.2 454.0 474.1 464.3
Note: (p) 2013 estimates are provisional.

18
Figure 6: Carbon dioxide emissions by fossil fuels, 1990-2013 (provisional), (MtCO2)
Note: (p) 2013 estimates are provisional.
0
100
200
300
400
500
600
700
19
90
19
91
19
92
19
93
19
94
19
95
19
96
19
97
19
98
19
99
20
00
20
01
20
02
20
03
20
04
20
05
20
06
20
07
20
08
20
09
20
10
20
11
20
12
20
13
(p)
Coal and other solid fuels
Oil
Gas

19
2012 Greenhouse Gas emissions by end-user
These results are based on, and consistent with, the breakdown by gas and national communication sector of 2012 emissions by source which was published on 4th February 2014. Total 2012 greenhouse gas emissions for the UK and Crown Dependencies were 575.4Mt CO2e.
The end-user breakdown reallocates emissions by source to where the “end-use” occurred. The main impact is to reallocate emissions from the energy supply sector to flows of energy i.e. to other sectors, the business and residential sectors in particular. Amongst other things, this therefore reallocates emissions occurring at power stations in generating electricity to where the electricity is actually consumed. It should be noted that the results shown by this breakdown are based on a number of assumptions, and we would therefore expect them to be subject to a wider margin of error than the breakdown of emissions by source.
Figure 7: Allocation of 2012 greenhouse gas emissions from source sectors to end-user sectors (MtCO2e)
20
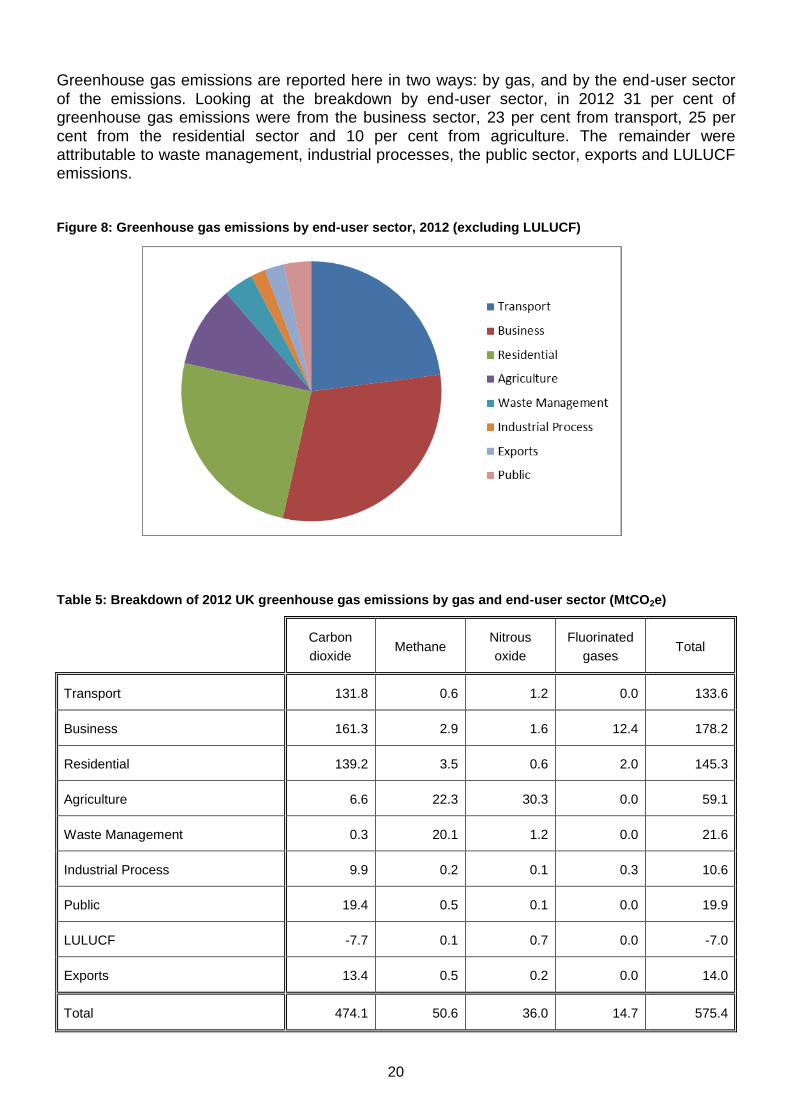
Greenhouse gas emissions are reported here in two ways: by gas, and by the end-user sector of the emissions. Looking at the breakdown by end-user sector, in 2012 31 per cent of greenhouse gas emissions were from the business sector, 23 per cent from transport, 25 per cent from the residential sector and 10 per cent from agriculture. The remainder were attributable to waste management, industrial processes, the public sector, exports and LULUCF emissions.
Figure 8: Greenhouse gas emissions by end-user sector, 2012 (excluding LULUCF)
Table 5: Breakdown of 2012 UK greenhouse gas emissions by gas and end-user sector (MtCO2e)
Carbon
dioxide Methane
Nitrous
oxide
Fluorinated
gases Total
Transport 131.8 0.6 1.2 0.0 133.6
Business 161.3 2.9 1.6 12.4 178.2
Residential 139.2 3.5 0.6 2.0 145.3
Agriculture 6.6 22.3 30.3 0.0 59.1
Waste Management 0.3 20.1 1.2 0.0 21.6
Industrial Process 9.9 0.2 0.1 0.3 10.6
Public 19.4 0.5 0.1 0.0 19.9
LULUCF -7.7 0.1 0.7 0.0 -7.0
Exports 13.4 0.5 0.2 0.0 14.0
Total 474.1 50.6 36.0 14.7 575.4

21
Table 6: Breakdown of 2012 UK greenhouse gas emissions by gas and end-user sector % of total UK
emissions, excluding LULUCF (MtCO2e)
Carbon
dioxide Methane
Nitrous
oxide
Fluorinated
gases Total
Transport 22.9% 0.1% 0.2% 0.0% 23.2%
Business 28.0% 0.5% 0.3% 2.2% 31.0%
Residential 24.2% 0.6% 0.1% 0.3% 25.3%
Agriculture 1.1% 3.9% 5.3% 0.0% 10.3%
Waste Management 0.0% 3.5% 0.2% 0.0% 3.8%
Industrial Process 1.7% 0.0% 0.0% 0.1% 1.8%
Public 3.4% 0.1% 0.0% 0.0% 3.5%
Exports 2.3% 0.1% 0.0% 0.0% 2.4%
Total 82.4% 8.8% 6.3% 2.6% 100.0%
Note: This Table does not include emissions from the LULUCF sector, since in 2012 this sector acted as a net sink, and emissions were therefore effectively negative. Sector values may sum to more than gas totals due to exclusion of LULUCF emissions.
A summary of the changes in the end-user breakdown for each gas between 2011 and 2012 can be found in Table 17 towards the end of this statistical release. This also shows a comparable summary of the breakdown of emissions by source, which was published in February 2014.
The data tables for full end-user breakdown by National Communications category, from 1990 to 2012, can be found on the Final Greenhouse Gas Emissions Statistics page of the Gov.uk website. These tables were originally published on 4th February 2014 showing emissions by source only, but were updated with the end-user and fuel type breakdowns on 27th March 2014.

22
Table 7: Greenhouse gas emissions by end-user, 1990-2012 (MtCO2e)
1990 1995 2000 2005 2010 2011 2012
Transport 139.4 143.1 146.6 149.6 136.9 134.9 133.6
Business 248.5 215.5 215.4 210.5 181.4 171.6 178.2
Residential 169.7 156.5 158.5 163.3 157.0 129.8 145.3
Agriculture 74.9 73.2 69.5 64.7 60.1 59.7 59.1
Waste Management 47.3 47.9 38.8 29.8 23.2 22.7 21.6
Industrial Process 57.3 47.3 26.6 19.7 12.6 11.0 10.6
Public 30.9 28.2 23.6 22.2 20.1 18.7 19.9
LULUCF 1.9 1.5 -2.1 -5.7 -7.3 -7.5 -7.0
Exports 9.1 13.3 13.0 16.4 15.9 15.7 14.0
Total 778.9 726.6 689.8 670.5 599.8 556.7 575.4
Note: All figures are for the UK and Crown Dependencies only, and exclude Overseas Territories.
Figure 9: Greenhouse gas emissions by end-user, 1990-2012 (MtCO2e)
Details of changes over time for each sector are set out in the following sections of this statistical release. In each case, information about the trend between 1990 and 2011 provides some context, alongside details of the changes since 2011 now seen in the 2012 estimates.
0
100
200
300
400
500
600
700
800
900
19
90
19
91
19
92
19
93
19
94
19
95
19
96
19
97
19
98
19
99
20
00
20
01
20
02
20
03
20
04
20
05
20
06
20
07
20
08
20
09
20
10
20
11
20
12
Other
Agriculture
Residential
Business
Transport

23
Transport
The transport sector was responsible for around 23 per cent of UK greenhouse gas end-user emissions in 2012, almost entirely through carbon dioxide emissions. Emissions of carbon dioxide are closely related to the amount of fuel used, whilst nitrous oxide and methane emissions are influenced more by the vehicle type and age.
2012 results
Between 2011 and 2012 there was very little change in end-user emissions from the transport sector. In both years, transport end-user emissions were around 16Mt higher than by source emissions.
Context – 1990 to 2011
Between 1990 and 2011, there was relatively little overall change in the level of greenhouse gas end-user emissions from the transport sector (emissions were around 3 per cent lower in 2011 than in 1990), although emissions actually increased slightly up to 2007 and then fell again from 2008 onwards. This is similar to the trend seen for by source emissions from the transport sector.
Road transport is the most significant source of emissions in this sector, in particular passenger cars, and the changes which have been seen over the period were heavily influenced by this category. Although there has been an increase in both the number of passenger vehicles and the vehicle kilometres travelled, emissions from passenger cars have decreased due to lower petrol consumption outweighing an increase in diesel consumption. However, this decrease has been partially offset by an increase in emissions from light duty vehicles.
Table 8: Transport sector end-user emissions by gas, 1990-2012 (MtCO2e)
1990 1995 2000 2005 2010 2011 2012
Carbon dioxide 136.2 139.6 143.8 147.5 135.3 133.1 131.8
Methane 1.7 1.5 1.0 0.7 0.5 0.6 0.6
Nitrous oxide 1.5 2.0 1.8 1.5 1.1 1.2 1.2
F-gases 0.0 0.0 0.0 0.0 0.0 0.0 0.0
Total 139.4 143.1 146.6 149.6 136.9 134.9 133.6
Note: All figures are for the UK and Crown Dependencies only, and exclude Overseas Territories.

24
0
20
40
60
80
100
120
140
160
19
90
19
91
19
92
19
93
19
94
19
95
19
96
19
97
19
98
19
99
20
00
20
01
20
02
20
03
20
04
20
05
20
06
20
07
20
08
20
09
20
10
20
11
20
12
F-gases
Nitrous oxide
Methane
Carbon dioxide
Figure 10: Greenhouse gas end-user emissions from transport, 1990-2012 (MtCO2e)
Business
The business sector was responsible for 31 per cent of UK greenhouse gas end-user emissions in 2012, with carbon dioxide being the most prominent gas. Emissions from this sector primarily relate to fossil fuel combustion in industry and commerce, although emissions of F-gases from the use of fluorinated compounds in certain applications, particularly refrigeration and air-conditioning, are significant. The business sector is responsible for the majority of emissions from F-gases.
2012 results
Between 2011 and 2012 there was an increase in business sector end-user emissions of around 6.6MtCO2e (3.8 per cent). This was mostly due to an increase in emissions from electricity use.
Context – 1990 to 2011
Between 1990 and 2011, there was a general downward trend in greenhouse gas end-user emissions from the business sector, resulting in an overall decrease of around 31 per cent. This has been largely due to a reduction in emissions from industrial combustion (including iron and steel) meaning emissions of carbon dioxide have reduced over the period by 33 per cent. However, emissions from F-gases have increased significantly, mainly due to an increase in emissions from refrigeration and air-conditioning as between 1993 and 2002,

25
0
50
100
150
200
250
300
19
90
19
91
19
92
19
93
19
94
19
95
19
96
19
97
19
98
19
99
20
00
20
01
20
02
20
03
20
04
20
05
20
06
20
07
20
08
20
09
20
10
20
11
20
12
F-gases
Nitrous oxide
Methane
Carbon dioxide
hydrofluorocarbons (HFCs) were used to replace other, ozone depleting (not shown in emissions data below), substances which were previously used as refrigerants. This increasing trend has since slowed, as tighter controls on emissions leakages have been introduced.
The overall downward trend for end-user emissions is similar to the trend for by source emissions, though end-user emissions are much higher due to the inclusion of emissions from electricity generation.
Table 9: Business sector end-user emissions by gas, 1990-2012 (MtCO2e)
1990 1995 2000 2005 2010 2011 2012
Carbon dioxide 232.1 201.7 201.8 195.1 164.8 154.9 161.3
Methane 13.2 9.9 6.3 4.1 3.1 3.1 2.9
Nitrous oxide 2.5 2.1 1.9 2.0 1.5 1.4 1.6
F-gases 0.6 1.8 5.4 9.4 12.0 12.2 12.4
Total 248.5 215.5 215.4 210.5 181.4 171.6 178.2
Note: All figures are for the UK and Crown Dependencies only, and exclude Overseas Territories.
Figure 11: Greenhouse gas end-user emissions from business, 1990-2012 (MtCO2e)

26
Residential
The residential sector was responsible for around 25 per cent of UK greenhouse gas end-user emissions in 2012, with carbon dioxide being the most prominent gas for this sector.
It should be noted that, unlike emissions by source, which only cover activities related to residential fossil fuel use, emissions reported by end-user also include residential electricity use which have been re-allocated from the energy supply sector.
2012 results
Between 2011 and 2012 there was an increase of around 11.9 per cent (15.5MtCO2e) in end-user emissions from this sector, due to an increase in emissions from gas and electricity consumption. The increase in gas consumption was due to increased use of gas for space heating (as 2012 was a colder year on average than 2011), and was also seen in the by source emissions. However, the emissions from electricity use were included in the energy supply sector for the by source emissions.
Context – 1990 to 2011
Between 1990 and 2011, there was considerable variation in greenhouse gas end-user emissions from year to year in the residential sector. Both the end-user and by source emissions from this sector are heavily influenced by external temperatures. End-user emissions have seen a bigger overall decrease since 1990 than by source emissions, due to a decrease in emissions from electricity consumption which are included in the residential end-user emissions but are in the energy supply sector for the by source emissions.
Table 10: Residential sector end-user emissions by gas, 1990-2012 (MtCO2e)
1990 1995 2000 2005 2010 2011 2012
Carbon dioxide 156.5 146.5 150.5 156.5 151.0 124.2 139.2
Methane 12.2 8.9 5.5 4.0 3.6 3.1 3.5
Nitrous oxide 1.0 0.7 0.6 0.6 0.6 0.5 0.6
F-gases 0.0 0.4 1.8 2.2 1.9 1.9 2.0
Total 169.7 156.5 158.5 163.3 157.0 129.8 145.3
Note: All figures are for the UK and Crown Dependencies only, and exclude Overseas Territories.

27
0
20
40
60
80
100
120
140
160
180
200
19
90
19
91
19
92
19
93
19
94
19
95
19
96
19
97
19
98
19
99
20
00
20
01
20
02
20
03
20
04
20
05
20
06
20
07
20
08
20
09
20
10
20
11
20
12
F-gases
Nitrous oxide
Methane
Carbon dioxide
Figure 12: Greenhouse gas end-user emissions from the residential sector, 1990-2012 (MtCO2e)

28
Agriculture
The agriculture sector was responsible for 10 per cent of UK greenhouse gas end-user emissions in 2012. Emissions of nitrous oxide (51 per cent) and methane (38 per cent) dominate this sector. End-user and by source emissions are very similar for this sector, with the most significant sources being emissions of methane due to enteric fermentation from livestock, particularly cattle, and nitrous oxide emissions related to the use of fertilisers on agricultural soils.
2012 results
Between 2011 and 2012 there was very little change in end-user emissions from the agriculture sector.
Context – 1990 to 2011
Between 1990 and 2011, greenhouse gas end-user emissions from agriculture decreased by around 20 per cent, due to a general downward trend since the late 1990s. This reduction was driven by a fall in animal numbers over the period, together with a decrease in synthetic fertiliser use. The same trend is seen for by source emissions from this sector.
Table 11: Agriculture sector end-user emissions by gas, 1990-2012 (MtCO2e)
1990 1995 2000 2005 2010 2011 2012
Carbon dioxide 8.7 8.3 7.3 7.2 6.6 6.5 6.6
Methane 28.4 27.6 26.3 23.9 22.5 22.3 22.3
Nitrous oxide 37.8 37.3 35.9 33.5 31.0 30.8 30.3
F-gases 0.0 0.0 0.0 0.0 0.0 0.0 0.0
Total 74.9 73.2 69.5 64.7 60.1 59.7 59.1
Note: All figures are for the UK and Crown Dependencies only, and exclude Overseas Territories.

29
0
10
20
30
40
50
60
70
80
19
90
19
91
19
92
19
93
19
94
19
95
19
96
19
97
19
98
19
99
20
00
20
01
20
02
20
03
20
04
20
05
20
06
20
07
20
08
20
09
20
10
20
11
20
12
F-gases
Nitrous oxide
Methane
Carbon dioxide
Figure 13: Greenhouse gas end-user emissions from agriculture, 1990-2012 (MtCO2e)
Waste management
For the waste management sector, emissions measured by end-user are the same as those measured by source, since no emissions from the energy supply sector are reallocated to waste management. The waste management sector was responsible for around 4 per cent of UK greenhouse gas emissions in 2012, with methane being by far the most prominent gas (93 per cent). The vast majority of these emissions are from landfill sites.
2012 results
Between 2011 and 2012, emissions from waste management fell by just under 5 per cent (1.1MtCO2e), reflecting a continuation of the trend seen in recent years of a decrease in emissions from landfill waste.
Context – 1990 to 2011
Between 1990 and 2011, greenhouse gas emissions from the waste management sector decreased by 52 per cent. This was due to a combination of factors, including improvements in the standards of landfilling, changes to the types of waste going to landfill (such as reducing the

30
0
10
20
30
40
50
60
19
90
19
91
19
92
19
93
19
94
19
95
19
96
19
97
19
98
19
99
20
00
20
01
20
02
20
03
20
04
20
05
20
06
20
07
20
08
20
09
20
10
20
11
20
12
F-gases
Nitrous oxide
Methane
Carbon dioxide
amount of biodegradable waste), and an increase in the amount of landfill gas being used for energy. Emissions of methane alone have reduced by 53 per cent over the period.
Table 12: Waste management sector end-user emissions by gas, 1990-2012 (MtCO2e)
1990 1995 2000 2005 2010 2011 2012
Carbon dioxide 1.3 0.9 0.5 0.4 0.3 0.3 0.3
Methane 44.8 45.8 36.9 28.2 21.7 21.2 20.1
Nitrous oxide 1.2 1.2 1.3 1.2 1.2 1.2 1.2
F-gases 0.0 0.0 0.0 0.0 0.0 0.0 0.0
Total 47.3 47.9 38.8 29.8 23.2 22.7 21.6
Note: All figures are for the UK and Crown Dependencies only, and exclude Overseas Territories.
Figure 14: Greenhouse gas end-user emissions from waste management, 1990-2012 (MtCO2e)

31
Industrial process
The industrial process sector was responsible for 2 per cent of UK greenhouse gas end-user emissions in 2012, with carbon dioxide being the most prominent gas. The main source of emissions is cement production, with other processes such as sinter and lime production also worth mentioning.
2012 results
Between 2011 and 2012, end-user emissions from the industrial process sector fell by around 4 per cent (0.5MtCO2e).
Context – 1990 to 2011
Between 1990 and 2011, there was a large reduction in greenhouse gas end-user emissions from the industrial process sector, with an overall decrease of around 81 per cent. This was most notably due to a large reduction in emissions from adipic acid production and halocarbon production between 1998 and 1999 (combined emissions of which are now almost zero), although there has been a general downward trend in emissions over the period. The end-user emissions are only slightly higher than by source emissions, and follow a very similar trend between 1990 and 2011.
Table 13: Industrial process sector end-user emissions by gas, 1990-2012 (MtCO2e)
1990 1995 2000 2005 2010 2011 2012
Carbon dioxide 17.8 16.3 16.2 15.4 10.5 10.0 9.9
Methane 1.6 1.3 0.9 0.4 0.3 0.3 0.2
Nitrous oxide 24.7 14.9 5.6 3.0 1.4 0.2 0.1
F-gases 13.1 14.7 3.9 0.9 0.5 0.5 0.3
Total 57.3 47.3 26.6 19.7 12.6 11.0 10.6
Note: All figures are for the UK and Crown Dependencies only, and exclude Overseas Territories.

32
0
10
20
30
40
50
60
70
19
90
19
91
19
92
19
93
19
94
19
95
19
96
19
97
19
98
19
99
20
00
20
01
20
02
20
03
20
04
20
05
20
06
20
07
20
08
20
09
20
10
20
11
20
12
F-gases
Nitrous oxide
Methane
Carbon dioxide
Figure 15: Greenhouse gas end-user emissions from industrial processes, 1990-2012 (MtCO2e)
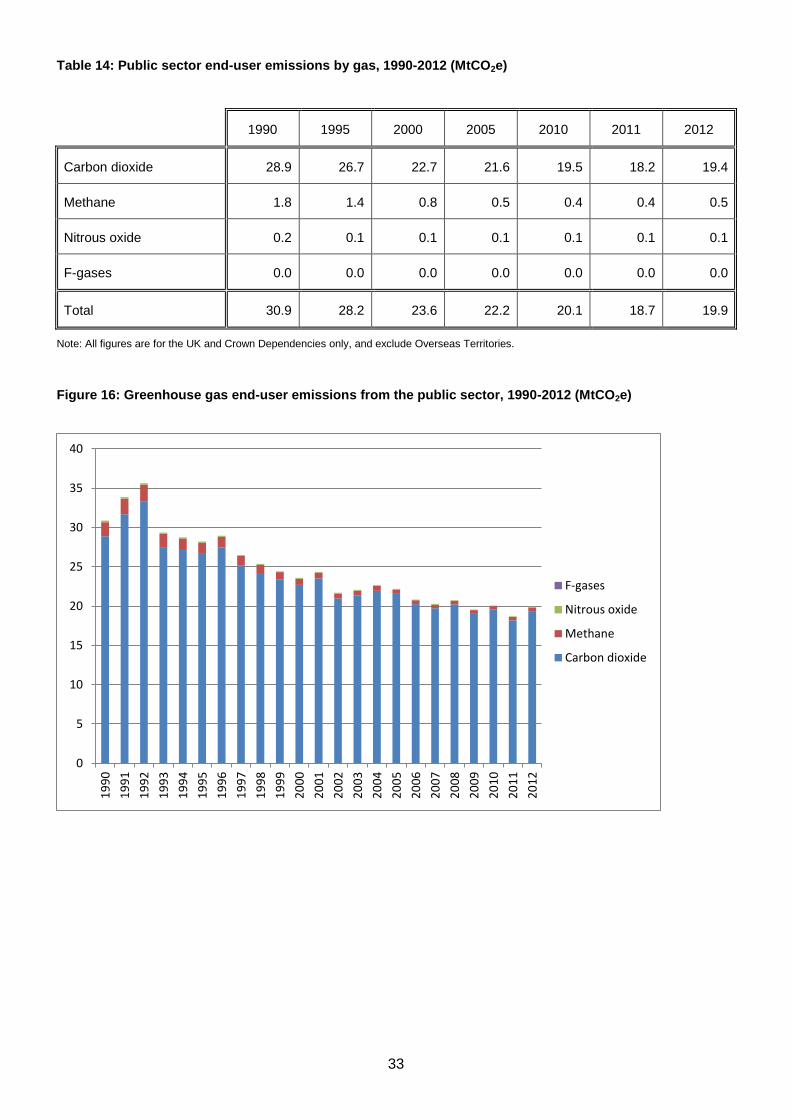
Public sector
The public sector was responsible for 3 per cent of UK greenhouse gas end-user emissions in 2012, with carbon dioxide making up almost all of these emissions.
2012 results
Between 2011 and 2012 end-user emissions from the public sector increased by 6.5 per cent (1.2MtCO2e). This is a bigger increase than was seen for by source emissions, due to increased emissions from electricity consumption.
Context – 1990 to 2011
Between 1990 and 2011, there was a general downward trend in greenhouse gas end-user emissions from the public sector, with an overall decrease of around 39 per cent. This has been largely driven by a reduction in the use of oil and coal in this sector. Public sector end-user emissions are roughly double by source emissions from the sector.
33
0
5
10
15
20
25
30
35
40
19
90
19
91
19
92
19
93
19
94
19
95
19
96
19
97
19
98
19
99
20
00
20
01
20
02
20
03
20
04
20
05
20
06
20
07
20
08
20
09
20
10
20
11
20
12
F-gases
Nitrous oxide
Methane
Carbon dioxide
Table 14: Public sector end-user emissions by gas, 1990-2012 (MtCO2e)
1990 1995 2000 2005 2010 2011 2012
Carbon dioxide 28.9 26.7 22.7 21.6 19.5 18.2 19.4
Methane 1.8 1.4 0.8 0.5 0.4 0.4 0.5
Nitrous oxide 0.2 0.1 0.1 0.1 0.1 0.1 0.1
F-gases 0.0 0.0 0.0 0.0 0.0 0.0 0.0
Total 30.9 28.2 23.6 22.2 20.1 18.7 19.9
Note: All figures are for the UK and Crown Dependencies only, and exclude Overseas Territories.
Figure 16: Greenhouse gas end-user emissions from the public sector, 1990-2012 (MtCO2e)

34
Land Use, Land Use Change and Forestry (LULUCF)
For the LULUCF sector, emissions measured by end-user are the same as those measured by source, since no emissions from the energy supply sector are reallocated to LULUCF.
The LULUCF sector acted as a net sink of UK greenhouse gas emissions in 2012, dominated by carbon dioxide. In general, land being converted to cropland is the dominant source of carbon dioxide emissions, and forest land which remains as forest land is the dominant sink.
2012 results
Between 2011 and 2012, net emissions from the LULUCF sector increased slightly, by around 0.5MtCO2e, largely due to increases in emissions from biomass burning.
Context – 1990 to 2011
Between 1990 and 2011, the UK went from being a net source of LULUCF emissions to a net sink. This was largely due to changes in land use over the period. The downward trend in net emissions over the period has largely been driven by land converted to cropland and forest land, with an increasing uptake of carbon dioxide by trees as they reach maturity, in line with the historical planting pattern. There has also been some reduction in emissions since 1990 due to less intensive agricultural practices.
Table 15: LULUCF sector end-user emissions by gas, 1990-2012 (MtCO2e)
1990 1995 2000 2005 2010 2011 2012
Carbon dioxide 1.0 0.6 -3.0 -6.5 -8.0 -8.2 -7.7
Methane 0.0 0.0 0.0 0.0 0.0 0.0 0.1
Nitrous oxide 0.8 0.9 0.9 0.8 0.7 0.7 0.7
F-gases 0.0 0.0 0.0 0.0 0.0 0.0 0.0
Total 1.9 1.5 -2.1 -5.7 -7.3 -7.5 -7.0
Note: All figures are for the UK and Crown Dependencies only, and exclude Overseas Territories.

35
-10
-8
-6
-4
-2
0
2
4
19
90
19
91
19
92
19
93
19
94
19
95
19
96
19
97
19
98
19
99
20
00
20
01
20
02
20
03
20
04
20
05
20
06
20
07
20
08
20
09
20
10
20
11
20
12
F-gases
Nitrous oxide
Methane
Carbon dioxide
Figure 17: Greenhouse gas end-user emissions from the LULUCF sector, 1990-2012 (MtCO2e)
Exports
The exports sector represents emissions associated with the production of fuels within the UK (for example, from a refinery or a coal mine) which are subsequently exported or sent to bunkers for use outside the UK. Since these fuels are ultimately used for activities which occur outside the UK, it would not be appropriate to allocate the emissions from their production to any of the National Communication sectors, so they are reported under a separate, additional sector.
The exports sector was responsible for around 2 per cent of UK greenhouse gas emissions in 2012, with carbon dioxide representing almost the entirety of these emissions.
2012 results
Between 2011 and 2012 emissions from the exports sector decreased by 1.7Mt (11 per cent).
Context – 1990 to 2011
Between 1990 and 2011, there was a general upward trend in greenhouse gas emissions from exports, with an overall increase of around 72 per cent. This has largely been driven by

36
0
2
4
6
8
10
12
14
16
18
19
90
19
91
19
92
19
93
19
94
19
95
19
96
19
97
19
98
19
99
20
00
20
01
20
02
20
03
20
04
20
05
20
06
20
07
20
08
20
09
20
10
20
11
20
12
F-gases
Nitrous oxide
Methane
Carbon dioxide
changes in throughput at refineries, which have fed through to increased exports rather than increased deliveries to the domestic market.
Table 16: Exports sector emissions by gas, 1990-2011 (MtCO2e)
1990 1995 2000 2005 2010 2011 2012
Carbon dioxide 8.5 12.5 12.3 15.8 15.3 15.0 13.4
Methane 0.6 0.7 0.5 0.4 0.5 0.6 0.5
Nitrous oxide 0.1 0.1 0.2 0.2 0.2 0.2 0.2
F-gases 0.0 0.0 0.0 0.0 0.0 0.0 0.0
Total 9.1 13.3 13.0 16.4 15.9 15.7 14.0
Figure 18: Greenhouse gas end-user emissions from the exports sector, 1990-2012 (MtCO2e)

37
Revisions to the estimates of end-user emissions
It should be noted that the historical time series of emissions by end-user is revised each year to reflect any revisions made to either the estimates of emissions by source or the other energy consumption data used in the end-user emissions calculation. In this publication, this has resulted in revisions to some end-user emissions figures for all years up to and including 2011. Further details of these revisions can be found in the National Statistics release of 4th February 2014, which covered 2012 UK greenhouse gas emissions by source.
Embedded Emissions
End-user emissions do not take account of the emissions “embedded” within the manufactured goods and services which the UK imports and exports. Embedded emissions capture what is sometimes referred to as the UK’s “carbon footprint”. This calculation of emissions on a “consumption” basis, reporting on emissions embedded in goods and services across international borders, is considerably more challenging.
Department of Environment, Food and Rural Affairs (Defra) provide the lead in this area. They publish annual statistics on the UK’s Carbon Footprint that investigates the impact the UK consumption has on carbon dioxide emissions. These are published in December of each year and are reported 23 months in arrears.

38
Table 17: UK emissions of all greenhouse gases, carbon dioxide, methane and nitrous oxide, 2011-12, by
source and end-user, National Communication categories
Source End User
Greenhouse Gas NC Category 2011 2012 % change 2011 2012 % change
All Greenhouse gases (million tonnes carbon dioxide
equivalent)
Energy supply 190.8 202.0 5.9% - - -
Transport 118.5 118.0 -0.4% 134.9 133.6 -0.9%
Business 85.9 86.7 0.9% 171.6 178.2 3.8%
Residential 69.0 77.5 12.3% 129.8 145.3 11.9%
Agriculture 57.2 56.6 -1.1% 59.7 59.1 -0.9%
Waste management 22.7 21.6 -4.8% 22.7 21.6 -4.8%
Industrial process 10.3 9.8 -4.5% 11.0 10.6 -4.3%
Public sector 9.7 10.1 4.2% 18.7 19.9 6.5%
Land use change -7.5 -7.0 -6.8% -7.5 -7.0 -6.8%
Exports - - - 15.7 14.0 -10.8%
Total 556.7 575.4 3.4% 556.7 575.4 3.4%
Carbon dioxide (million tonnes)
Energy supply 182.0 192.9 6.0% - - -
Transport 117.4 116.9 -0.5% 133.1 131.8 -0.9%
Business 72.7 73.3 0.8% 154.9 161.3 4.1%
Residential 66.5 74.9 12.7% 124.2 139.2 12.1%
Agriculture 4.2 4.1 -1.2% 6.5 6.6 0.8%
Waste management 0.3 0.3 -6.3% 0.3 0.3 -6.3%
Industrial process 9.5 9.3 -2.0% 10.0 9.9 -1.7%
Public sector 9.7 10.1 4.2% 18.2 19.4 6.5%
Land use change -8.2 -7.7 -6.0% -8.2 -7.7 -6.0%
Exports - - - 15.0 13.4 -10.8%
Total 454.0 474.1 4.4% 454.0 474.1 4.4%
Methane (thousand tonnes)
Energy supply 350.8 353.1 0.7% - - -
Transport 3.4 3.0 -11.5% 29.9 27.1 -9.5%
Business 6.3 6.3 -0.8% 145.3 139.4 -4.1%
Residential 22.2 22.9 3.1% 149.4 164.9 10.4%
Agriculture 1060.0 1057.8 -0.2% 1063.1 1060.6 -0.2%
Waste management 1011.2 959.1 -5.2% 1011.2 959.1 -5.2%
Industrial process 4.3 4.7 8.9% 12.7 11.7 -7.7%
Public sector 0.9 1.0 4.3% 21.0 22.2 5.7%
Land use change 2.1 3.1 49.7% 2.1 3.1 49.7%
Exports - - - 26.7 22.9 -14.1%
Total 2461.3 2410.9 -2.0% 2461.3 2410.9 -2.0%
Nitrous oxide (thousand tonnes)
Energy supply 4.6 5.4 17.7% - - -
Transport 3.2 3.3 3.9% 3.8 3.9 3.3%
Business 2.6 2.9 8.4% 4.5 5.1 14.6%
Residential 0.4 0.4 3.9% 1.7 2.1 22.1%
Agriculture 99.4 97.6 -1.8% 99.5 97.7 -1.8%
Waste management 3.9 3.9 2.2% 3.9 3.9 2.2%
Industrial process 0.8 0.3 -59.2% 0.8 0.3 -58.8%
Public sector 0.0 0.0 -3.7% 0.2 0.3 19.6%
Land use change 2.2 2.2 -0.7% 2.2 2.2 -0.7%
Exports - - - 0.6 0.6 -5.4%
Total 117.1 116.1 -0.8% 117.1 116.1 -0.8%

39
Uncertainties around the 2012 estimates
We are now also able to publish the uncertainty ranges associated with the final 2012 emissions estimates by source, which were published on 4th February 2014.
For details of how the uncertainty estimates are calculated, see the Uncertainties Annex of the UK’s National Inventory Report.
The uncertainty estimates vary a lot for different sectors and gases. For gases, carbon dioxide estimates have the least uncertainty associated with them while nitrous oxide estimates are the most uncertain. At sector level, the land use change, agriculture and waste management sectors are the most uncertain. The overall uncertainty around total GHG emissions for 2012 is estimated to be 5 per cent.
Uncertainty estimates for nitrous oxide and the agriculture sector were not published last year due to a highly skewed distribution. There has since been a review of the way that uncertainty estimates for emissions from agricultural soils are calculated, which has allowed us to publish uncertainty estimates this year. This is also the main cause of a decrease in overall uncertainty for emissions from all greenhouse gases weighted by GWP, which is estimated to be 5 per cent for 2012 emissions compared to the 2013 estimate of 17 per cent for 2011 emissions.
Table 18: Uncertainty in estimates of 2012 UK greenhouse gas emissions by gas (MtCO2e)
2012 emissions
Uncertainty around 2012 estimate, expressed as a 95% confidence interval
Lower bound Upper bound
Carbon dioxide 475.7 466.5 484.9
Methane 50.8 42.4 62.8
Nitrous Oxide 36.1 20.9 70.7
Hydrofluorocarbons 14.1 13.3 15.0
Perfluorocarbons 0.2 0.2 0.3
Sulphur hexafluoride 0.5 0.5 0.6
Total 577.5 556.1 614.0

40
Table 19: Uncertainty in estimates of 2012 UK greenhouse gas emissions by sector (MtCO2e)
2012 emissions
Uncertainty around 2012 estimate, expressed as a 95% confidence interval
Lower bound Upper bound
Energy Supply 203.1 199.6 207.0
Transport 118.5 115.8 121.2
Residential 77.6 76.0 79.5
Business 86.8 84.1 90.7
Public 10.1 8.0 12.3
Industrial Process 9.8 9.4 10.2
Agriculture 56.8 41.7 91.2
Land Use Change -7.0 -14.8 0.9
Waste Management 21.7 13.3 34.3
Total 577.5 555.7 614.1

41
UK performance against emissions reduction targets
The UK has both international and domestic targets for reducing greenhouse gas emissions. Internationally the UK has a target for the first commitment period of the Kyoto Protocol to reduce its emissions by an average 12.5 per cent below base year levels over the five-year period 2008-12; and domestically it has the Carbon Budgets set out under the UK Climate Change Act, which set legally-binding limits on the total amount of GHG can emit for a given five-year period.
In reporting emissions reductions against these targets, the UK is required to take account of emissions trading through the various flexible mechanisms which have been established, including the European Union Emissions Trading System (EU ETS).
DECC reported on performance against these targets in detail in the National Statistics release of 4th February 2014, which covered 2012 UK greenhouse gas emissions final figures. Performance was reported so as to take account of the latest available EU ETS data, also covering the 2012 calendar year. Since these are still the latest available data from the EU ETS, it is not possible to produce a further update showing performance against targets based on the provisional 2013 emissions estimates. DECC will report in the summer on progress towards targets once 2013 EU ETS data have become available.

42
Future updates to emissions estimates
Final estimates of UK greenhouse gas emissions for 2013 will be published as National Statistics on 3rd February 2015. These estimates will be based on the UK’s National Atmospheric Emissions Inventory for 2013.
Further information and feedback
Further information on UK greenhouse gas emissions statistics, including Excel tables with additional data on UK emissions, can be found on the Gov.uk website at:
https://www.gov.uk/government/organisations/department-of-energy-climate-change/series/uk-greenhouse-gas-emissions

43
Notes for editors
A full set of data tables can be accessed via the UK greenhouse gas emissions pages of the Gov.uk website.
1. The figures for 1990 to 2012 in this statistical release are from the National Atmospheric Emissions
Inventory (NAEI), produced for DECC and the Devolved Administrations by Ricardo-AEA. Additional results will be released as they become available, including a full report to be published later in the year. For further information on the UK Greenhouse Gas Inventory, see the NAEI web site.
2. Further information about the Kyoto Protocol can be found on the UNFCCC’s website. 3. Further details of the European Union Emissions Trading System can be found at the EU ETS
section of the Gov.uk website.
4. There are uncertainties associated with all estimates of greenhouse gas emissions. Although for any
given year considerable uncertainties may surround the emissions estimates for a pollutant, it is important to note that trends over time are likely to be much more reliable. It is also important to note that the provisional 2013 estimates are subject to a greater range of uncertainty than the final figures for earlier years. For more information on these uncertainties see the page on the UK greenhouse gas inventory on the Gov.uk website.
5. The latest UK energy statistics, including revisions to earlier years’ data, can be found in the 2013 Digest of UK Energy Statistics.
6. Detailed UK temperature data can be found on both the Met Office website and the Energy Statistics
section of the Gov.uk website. 7. When emissions are measured on this basis, UK emissions account for less than 2 per cent of the
global total, based on a range of estimates produced by the UN, the IEA, the World Resources Institute and the EIA, amongst others.
A National Statistics publication
National Statistics are produced to high professional standards set out in the Official Statistics Code of Practice. They undergo regular quality assurance reviews to ensure they meet customer needs.
© Crown copyright 2014
Department of Energy & Climate Change
3 Whitehall Place
London SW1A 2AW
www.gov.uk/decc