microstructure, mineralogy and physical properties of ground fly ash ...
Alt, J.C., Kinoshita, H., Stokking, L.B., and Michael, P.J. (Eds.), 1996Proceedings of the Ocean Drilling Program, Scientific Results, Vol. 148
28. MICROSTRUCTURE AND PHYSICAL PROPERTIES OF SAMPLES FROM HOLE 896A1
R.H. Wilkens2 and M.H. Salisbury3
ABSTRACT
A set of 24 basaltic samples from Hole 896A was imaged using a backscatter electron detector on a scanning electronmicroscope. Laboratory compressional-wave velocities were measured at elevated confining pressure for 28 minicores fromHole 896A core. Digital image analysis was used to distinguish total areas of plagioclase, olivine, and pyroxene as well aspores + alteration. Results of image processing qualitatively explain why samples with similar total porosity have markedly dif-ferent compressional-wave velocity. Velocities and densities of Hole 896A samples were compared with laboratory resultsfrom the upper part of Hole 504B. Hole 896A samples tend to have lower velocities for a given bulk density than Hole 504Bsamples, probably a result of different pore structures of rocks from the two sites.
INTRODUCTION
Studies of the velocity structure of the oceanic crust have longformed a principal oceanic geophysical data set. The division of thecrust into Layers 1, 2, and 3, as well as later subdivisions of Layer 2,were based entirely on remotely measured seismic velocities (Raitt,1963; Christensen and Salisbury, 1975). This concept has formed thebasis of our understanding of ocean crustal structure and, to the extentthat velocity structure has been interpreted as geologic structure, hashad great influence upon our thinking about crustal evolution andgrowth (e.g., Salisbury and Christensen, 1978). Recently there hasbeen increased interest in the evolution of the seismic structure of theuppermost igneous crust (see Jacobson, 1992, for a review). It hasbeen realized that much of the variation in the velocity structure ofthe ocean crust lies within the upper 500 m or so. Critical factors suchas eruptive record, pore structure, and alteration history influenceseismic velocity in the seafloor (Wilkens et al., 1991; Moos and Mar-ion, 1994). In this study we examine laboratory velocity measure-ments of a set of basaltic samples from Ocean Drilling Program(ODP) Hole 896A. Variations in velocity-density-porosity systemat-ics are discussed in the light of quantitative information from digitalimages of sample microstructure. Finally, we make qualitative obser-vations about possible differences between these samples and othersfrom nearby Hole 504B.
SAMPLE DESCRIPTIONS AND EXPERIMENTALTECHNIQUES
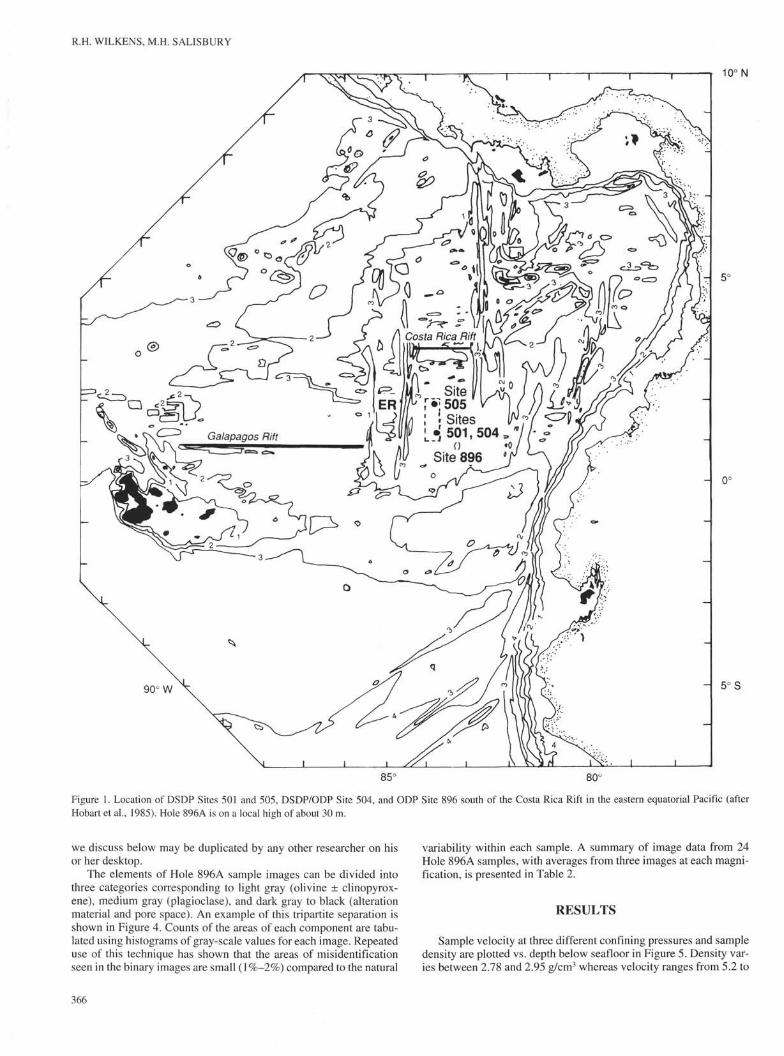
During the course of ODP Leg 148, Hole 896A was drilled ap-proximately 1 km southeast of the well-known Hole 504B (Fig. 1).Located on a local topographic high, Hole 896A is the locus of crustalpore-water upwelling (Mottl, 1989). It provides a contrast to neigh-boring Hole 504B, where ocean bottom water percolates through thesedimentary layer into the crust. Approximately 290 m of basementwas drilled beneath 179 m of pelagic sediments. Most of the base-
1 Alt, J.C., Kinoshita, H., Stokking, L.B., and Michael, P.J. (Eds.), 1996. Proc. ODP,Sci. Results, 148: College Station, TX (Ocean Drilling Program).
2 Hawaii Institute of Geophysics and Planetology, School of Ocean and Earth Sci-ence and Technology, University of Hawaii, 2525 Correa Road, Honolulu, HI 96822,U.S.A. [email protected]
'Geological Survey of Canada Atlantic, Bedford Institute of Oceanography, P.O.Box 1006, Dartmouth, Nova Scotia B2Y 4A2, Canada. [email protected]
ment section (95%) consists of either pillow or massive basalts thatare olivine and plagioclase ± clinopyroxene phyric. Low-temperaturealteration is present throughout the section, but not pervasive, withreplacement of olivine by clay minerals the most common effect.
Twenty-eight samples were collected from the core for measure-ment of laboratory compressional-wave velocity. Velocities weremeasured to 600 MPa confining pressure in 2.5-cm-diameter, right-circular cylinders with an average length of approximately 2.0 cm,using the pulse transmission technique (Birch, 1960). Velocities wererecorded at room temperature using water-saturated samples. Wet-bulk densities of the samples were measured and porosities calculat-ed using grain densities from the same core pieces calculated aboardthe JOIDES Resolution during Leg 148. Data are given in Table 1 andillustrated in Figure 2.
Image analysis of microstructure has been employed for at leasttwo decades in the geological sciences (e.g., Hadley, 1976; Ehrlich,1984; Berryman, 1985; Wilkens et al., 1984). Most of the work hashad application in the oil industry—examination of pore systems inreservoirs, the role of clays in sandstone systems—but virtually noth-ing has been done with ocean crustal rocks. We think that image anal-ysis is a powerful tool that will yield large dividends in future studies.Ehrlich et al. (1991) summarize the arguments well. Microfabric ele-ments need quantitative analysis because the current system of thinsection description is time consuming, requires years of training, andvaries among individuals. Using digital image analysis techniques,quantification can be separated from classification. Data are repeat-able results of well-defined techniques. Interpretations may change,but basic observations remain.
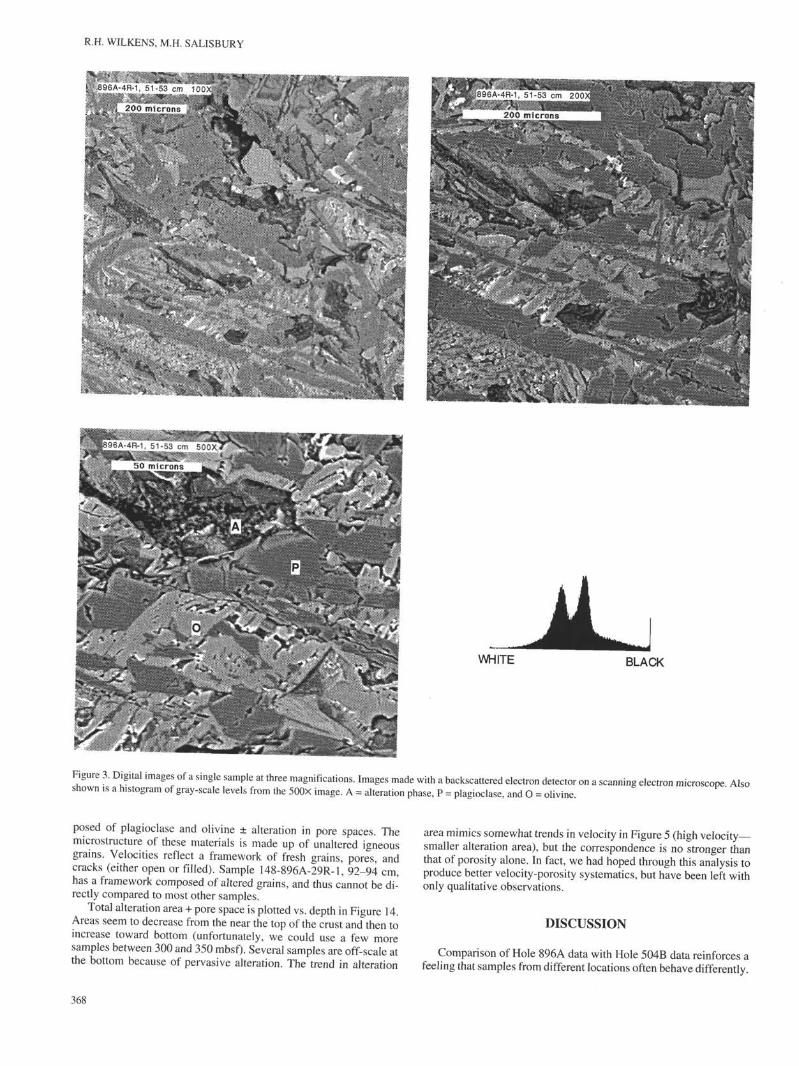
Eighteen of the velocity samples were among 24 core ends usedfor scanning electron microscope (SEM) examination of microstruc-ture. Samples were polished to a flat surface and finished with 0.25-µm grit. Digital images (256 gray-scale levels) were recorded forthree areas of each sample at three different magnifications (lOO×,200×, and 500×) using a backscattered electron detector (Fig. 3).Backscattered electron intensity is directly proportional to the bulkdensity of the material under the electron beam (Caruso and Sim-mons, 1984; Pye and Krinsley, 1984). Dense objects appear brightwhereas less dense material is increasingly gray. In our illustration(Fig. 3) we show three magnifications of a single spot on Sample148-896A-4R-1, 51-53 cm, as well as a histogram of gray-scale lev-els from the 500× image.
For image analysis we have chosen the NIH IMAGE program,available at no cost over the internet from the National Institutes ofHealth. IMAGE offers a range of analytical tools on a UNIX or Mac-intosh system. Its cost (nothing) and ease of use assure that the results
365
R.H. WILKENS, M.H. SALISBURY
90° W
10° N
— 5°
- 0c
- 5 ° S
80c
Figure 1. Location of DSDP Sites 501 and 505, DSDP/ODP Site 504, and ODP Site 896 south of the Costa Rica Rift in the eastern equatorial Pacific (afterHobart et al., 1985). Hole 896A is on a local high of about 30 m.
we discuss below may be duplicated by any other researcher on hisor her desktop.
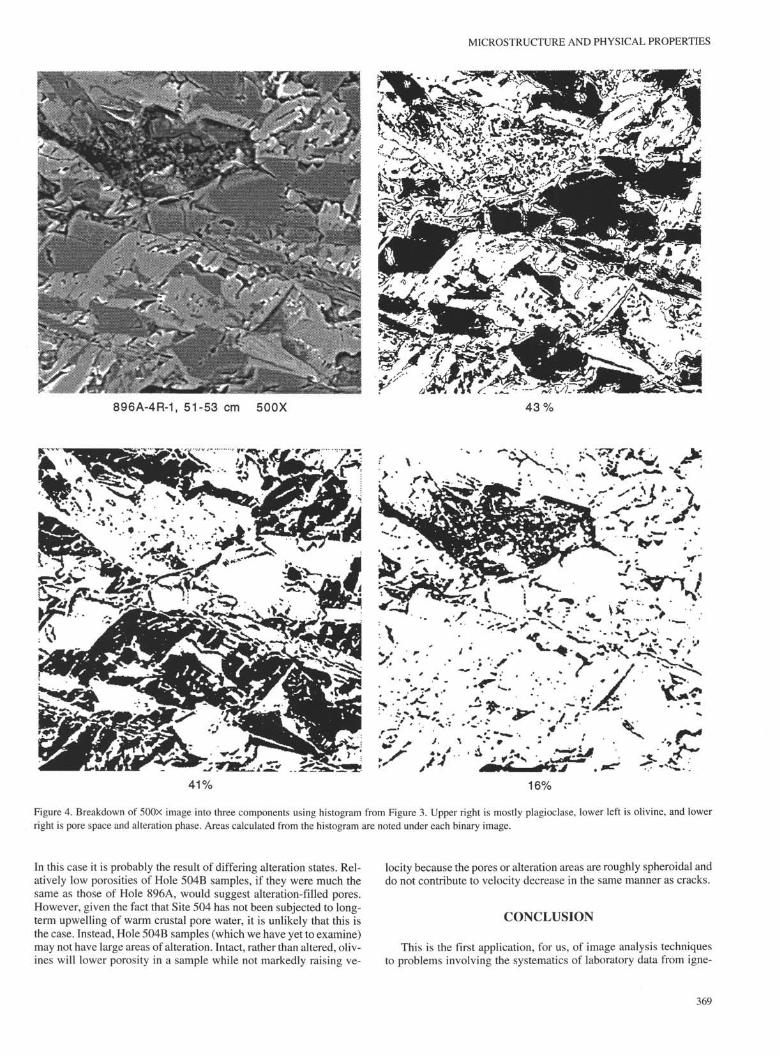
The elements of Hole 896A sample images can be divided intothree categories corresponding to light gray (olivine ± clinopyrox-ene), medium gray (plagioclase), and dark gray to black (alterationmaterial and pore space). An example of this tripartite separation isshown in Figure 4. Counts of the areas of each component are tabu-lated using histograms of gray-scale values for each image. Repeateduse of this technique has shown that the areas of misidentificationseen in the binary images are small (l%-2%) compared to the natural
variability within each sample. A summary of image data from 24Hole 896A samples, with averages from three images at each magni-fication, is presented in Table 2.
RESULTS
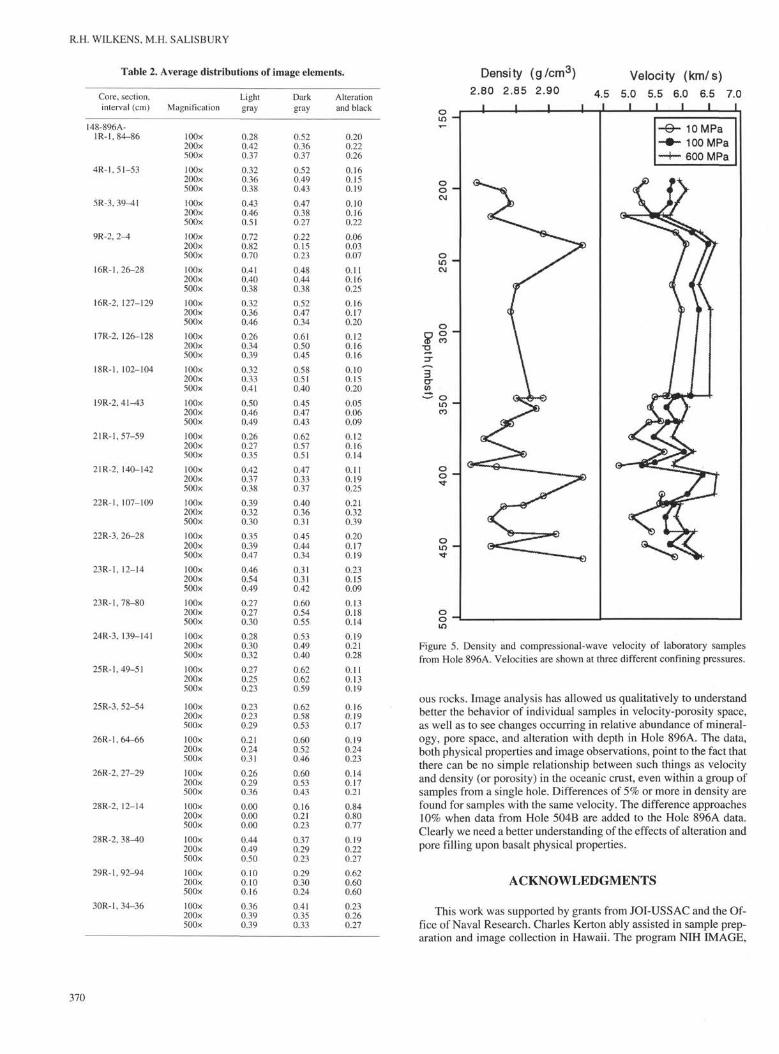
Sample velocity at three different confining pressures and sampledensity are plotted vs. depth below seafloor in Figure 5. Density var-ies between 2.78 and 2.95 g/cm3 whereas velocity ranges from 5.2 to
366
MICROSTRUCTURE AND PHYSICAL PROPERTIES
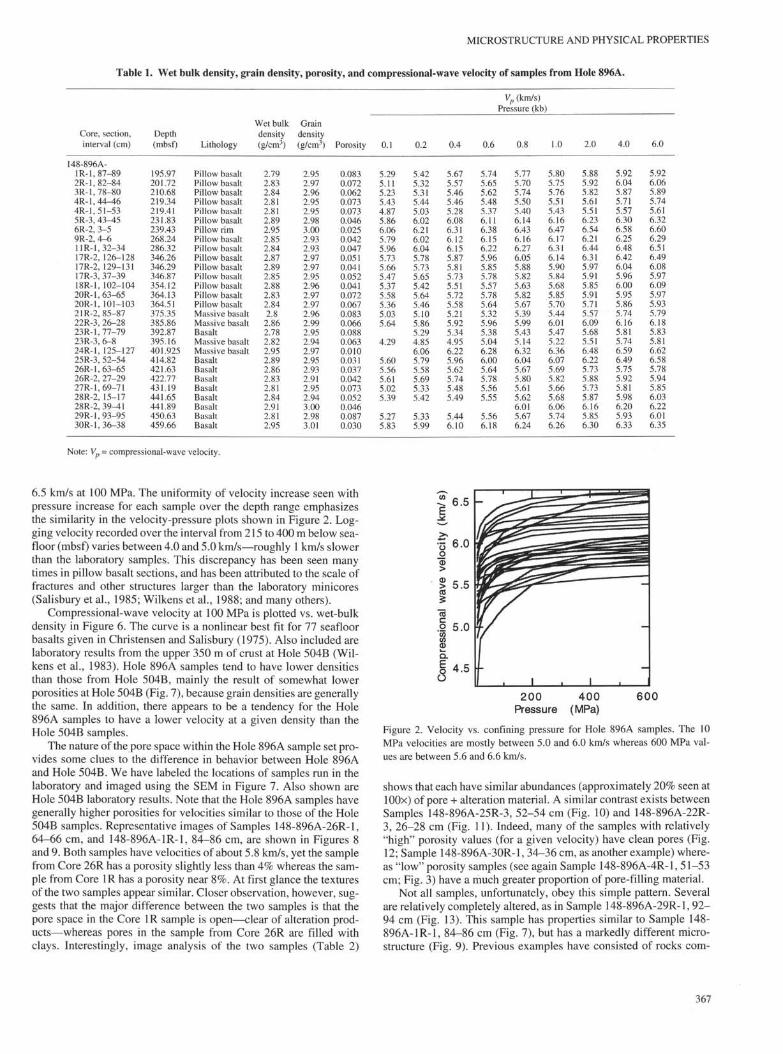
Table 1. Wet bulk density, grain density, porosity, and compressional-wave velocity of samples from Hole 896A.
Core, section,interval (cm)
148-896A-1R-1,87-892R-1,82-843R-1,78-804R. 1,44-464R-1, 51-535R-3, 43-456R-2, 3-59R-2, 4-611R-1,32-3417R-2, 126-12817R-2, 129-13117R-3, 37-3918R-1, 102-10420R-1,63-6520R-1, 101-10321R-2, 85-8722R-3, 26-2823 R-1,77-7923R-3, 6-824R-1, 125-12725R-3, 52-5426R-1,63-6526R-2, 27-2927R-1,69-7128R-2, 15-1728R-2, 39-4129R-1,93-9530R-1,36-38
Depth(mbsf)
195.97201.72210.68219.34219.41231.83239.43268.24286.32346.26346.29346.87354.12364.13364.51375.35385.86392.87395.16401.925414.82421.63422.77431.19441.65441.89450.63459.66
Lithology
Pillow basaltPillow basaltPillow basaltPillow basaltPillow basaltPillow basaltPillow rimPillow basaltPillow basaltPillow basaltPillow basaltPillow basaltPillow basaltPillow basaltPillow basaltMassive basaltMassive basaltBasaltMassive basaltMassive basaltBasaltBasaltBasaltBasaltBasaltBasaltBasaltBasalt
Wet bulkdensity(g/cm3)
2.792.832.842.812.812.892.952.852.842.872.892.852.882.832.842.8
2.862.782.822.952.892.862.832.812.842.912.812.95
Graindensity(g/cm3)
2.952.972.962.952.952.983.002.932.932.972.972.952 . %2.972.972.962.992.952.942.972.952.932.912.952.943.002.983.01
Porosity
0.0830.0720.0620.0730.0730.0460.0250.0420.0470.0510.0410.0520.0410.0720.0670.0830.0660.0880.0630.0100.0310.0370.0420.0730.0520.0460.0870.030
0.1
5.295.115.235.434.875.866.065.795.965.735.665.475.375.585.365.035.64
4.29
5.605.565.615.025.39
5.275.83
0.2
5.425.325.315.445.03
6.216.026.045.785.735.655.425.645.465.105.865.294.856.065.795.585.695.335.42
5.335.99
0.4
5.675.575.465.465.286.086.316.126.155.875.815.735.515.725.585.215.925.344.956.225.965.625.745.485.49
5.446.10
0.6
5.745.655.625.485.376.116.386.156.225.965.855.785.575.785.645.325.965.385.046.286.005.645.785.565.55
5.566.18
Vp (km/s)Pressure (kb)
0.8
5.775.705.745.505.406.146.436.166.276.055.885.825.635.825.675.395.995.435.146.326.045.675.805.615.626.015.676.24
1.0
5.805.755.765.515.436.166.476.176.316.145.905.845.685.855.705.446.015.475.226.366.075.695.825.665.686.065.746.26
2.0
5.885.925.825.615.516.236.546.216.446.315.975.915.855.915.715.576.095.685.516.486.225.735.885.735.876.165.856.30
4.0
5.926.045.875.715.576.306.586.256.486.426.045.966.005.955.865.746.165.815.746.596.495.755.925.815.986.205.936.33
6.0
5.926.065.895.745.616.326.606.296.516.496.085.976.095.975.935.796.185.835.816.626.585.785.945.856.036.226.016.35
Note: Vp = compressional-wave velocity.
6.5 km/s at 100 MPa. The uniformity of velocity increase seen withpressure increase for each sample over the depth range emphasizesthe similarity in the velocity-pressure plots shown in Figure 2. Log-ging velocity recorded over the interval from 215 to 400 m below sea-floor (mbsf) varies between 4.0 and 5.0 km/s—roughly 1 km/s slowerthan the laboratory samples. This discrepancy has been seen manytimes in pillow basalt sections, and has been attributed to the scale offractures and other structures larger than the laboratory minicores(Salisbury et al., 1985; Wilkens et al., 1988; and many others).
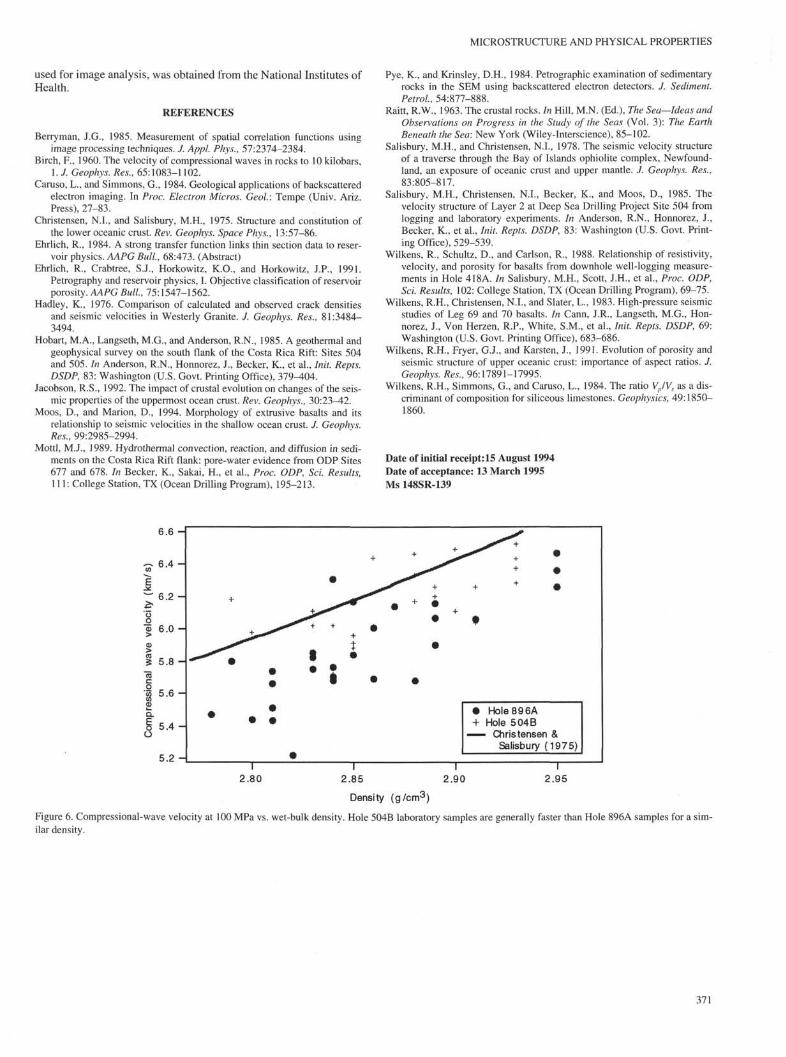
Compressional-wave velocity at 100 MPa is plotted vs. wet-bulkdensity in Figure 6. The curve is a nonlinear best fit for 77 seafloorbasalts given in Christensen and Salisbury (1975). Also included arelaboratory results from the upper 350 m of crust at Hole 504B (Wil-kens et al., 1983). Hole 896A samples tend to have lower densitiesthan those from Hole 504B, mainly the result of somewhat lowerporosities at Hole 504B (Fig. 7), because grain densities are generallythe same. In addition, there appears to be a tendency for the Hole896A samples to have a lower velocity at a given density than theHole 504B samples.
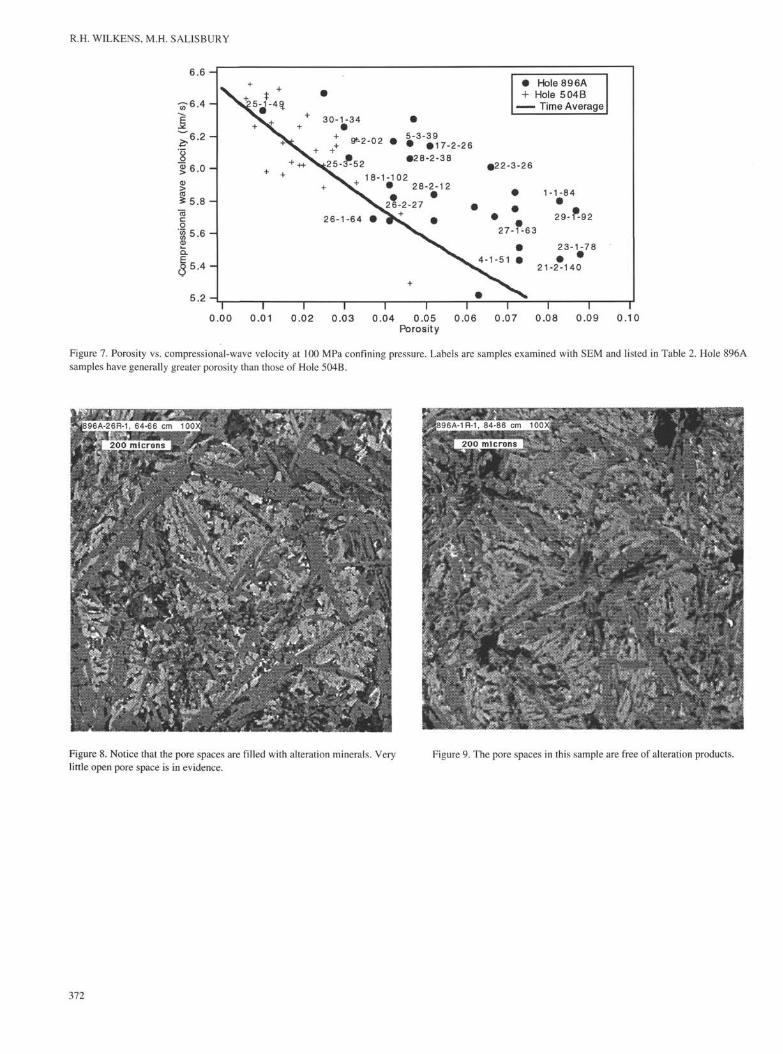
The nature of the pore space within the Hole 896A sample set pro-vides some clues to the difference in behavior between Hole 896Aand Hole 504B. We have labeled the locations of samples run in thelaboratory and imaged using the SEM in Figure 7. Also shown areHole 504B laboratory results. Note that the Hole 896A samples havegenerally higher porosities for velocities similar to those of the Hole504B samples. Representative images of Samples 148-896A-26R-1,64-66 cm, and 148-896A-1R-1, 84-86 cm, are shown in Figures 8and 9. Both samples have velocities of about 5.8 km/s, yet the samplefrom Core 26R has a porosity slightly less than 4% whereas the sam-ple from Core 1R has a porosity near 8%. At first glance the texturesof the two samples appear similar. Closer observation, however, sug-gests that the major difference between the two samples is that thepore space in the Core 1R sample is open—clear of alteration prod-ucts—whereas pores in the sample from Core 26R are filled withclays. Interestingly, image analysis of the two samples (Table 2)
200Pressure
400(MPa)
600
Figure 2. Velocity vs. confining pressure for Hole 896A samples. The 10MPa velocities are mostly between 5.0 and 6.0 km/s whereas 600 MPa val-ues are between 5.6 and 6.6 km/s.
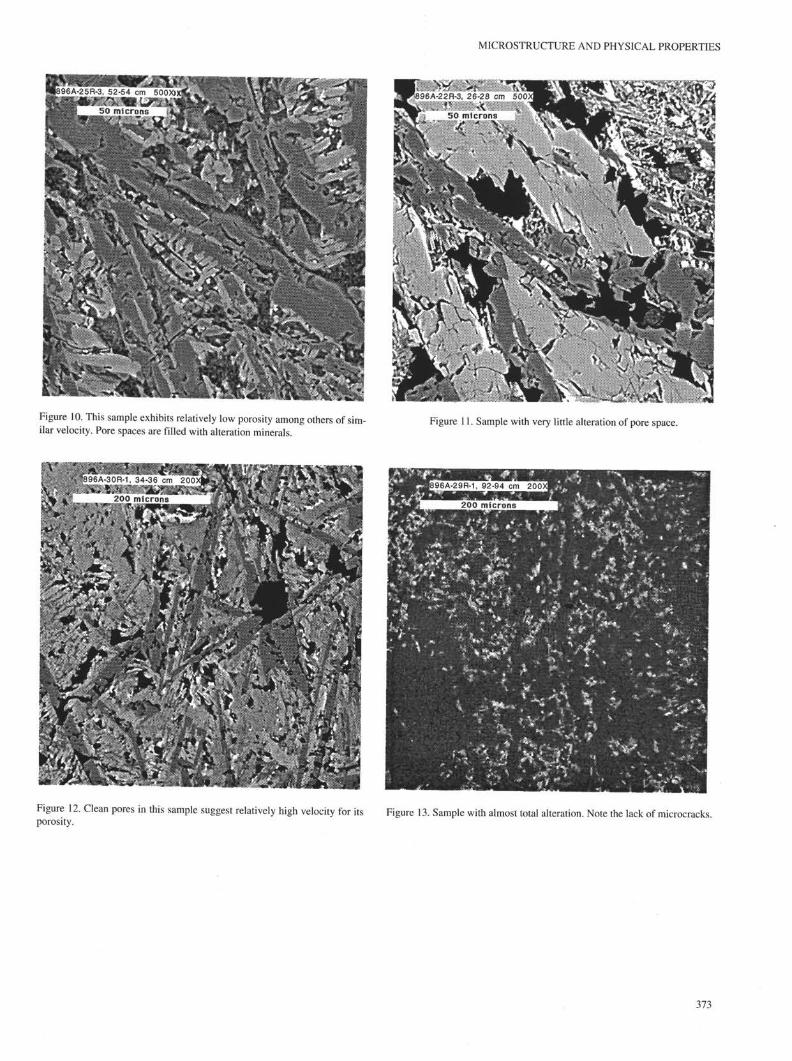
shows that each have similar abundances (approximately 20% seen atlOO×) of pore + alteration material. A similar contrast exists betweenSamples 148-896A-25R-3, 52-54 cm (Fig. 10) and 148-896A-22R-3, 26-28 cm (Fig. 11). Indeed, many of the samples with relatively"high" porosity values (for a given velocity) have clean pores (Fig.12; Sample 148-896A-30R-1,34-36 cm, as another example) where-as "low" porosity samples (see again Sample 148-896A-4R-1, 51-53cm; Fig. 3) have a much greater proportion of pore-filling material.
Not all samples, unfortunately, obey this simple pattern. Severalare relatively completely altered, as in Sample 148-896A-29R-1,92-94 cm (Fig. 13). This sample has properties similar to Sample 148-896A-1R-1, 84-86 cm (Fig. 7), but has a markedly different micro-structure (Fig. 9). Previous examples have consisted of rocks com-
367
R.H. WILKENS, M.H. SALISBURY
|896A-4R-1, 51-53 cm
riiiMK 200 microns Λ - «
5: SilllililSSJlB.! ^
["•'-'\•r•/
^ASSESS'
i
W i ^Si ̂ ^i
_s_β896A-4R-1, 51-53 cm 200>
200 microns
• . . . ' . : • • • : : : : . • • • . • • • •• . . '
J p M ^ • 5 1•5 3 c m 500)0
50 microns fc,^ $ ‰
^V&Mß
:j}:t||SSSlij(:;: I • ^β^MWi^l^!
•[ W^^^^^^^^^M?ffi: /1
WHITE BLACK
Figure 3. Digital images of a single sample at three magnifications. Images made with a backscattered electron detector on a scanning electron microscope Alsoshown is a histogram of gray-scale levels from the 500× image. A = alteration phase, P = plagioclase, and O = olivine.
posed of plagioclase and olivine ± alteration in pore spaces. Themicrostructure of these materials is made up of unaltered igneousgrains. Velocities reflect a framework of fresh grains, pores, andcracks (either open or filled). Sample 148-896A-29R-1, 92-94 cm,has a framework composed of altered grains, and thus cannot be di-rectly compared to most other samples.
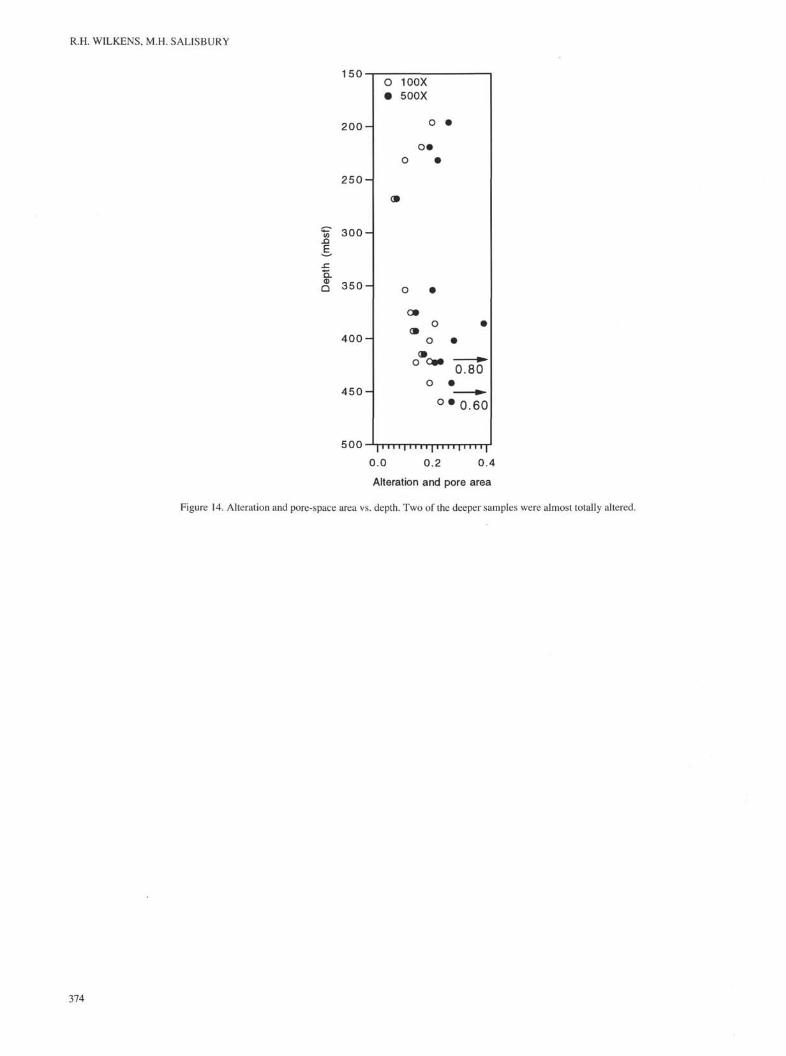
Total alteration area + pore space is plotted vs. depth in Figure 14.Areas seem to decrease from the near the top of the crust and then toincrease toward bottom (unfortunately, we could use a few moresamples between 300 and 350 mbsf). Several samples are off-scale atthe bottom because of pervasive alteration. The trend in alteration
area mimics somewhat trends in velocity in Figure 5 (high velocitysmaller alteration area), but the correspondence is no stronger thanthat of porosity alone. In fact, we had hoped through this analysis toproduce better velocity-porosity systematics, but have been left withonly qualitative observations.
DISCUSSION
Comparison of Hole 896A data with Hole 504B data reinforces afeeling that samples from different locations often behave differently.
368
MICROSTRUCTURE AND PHYSICAL PROPERTIES
* • • • . ^ • •
Wt§iS]^;•,•ß••. ::::';:ISS5üWi^Sε•':j""••• . : . • • : . •• : . • • •• • : • . . •• . . •• : • : : . . • . : • . : . • . . . . : : . • • •• : . • ; • • . : • " • • : • : : • • : : . • : : . • • . : • • : .
896A-4R-1, 51-53 cm 500X 4 3 %
4 1 % 16%
Figure 4. Breakdown of 500× image into three components using histogram from Figure 3. Upper right is mostly plagioclase, lower left is olivine, and lowerright is pore space and alteration phase. Areas calculated from the histogram are noted under each binary image.
In this case it is probably the result of differing alteration states. Rel-atively low porosities of Hole 504B samples, if they were much thesame as those of Hole 896A, would suggest alteration-filled pores.However, given the fact that Site 504 has not been subjected to long-term upwelling of warm crustal pore water, it is unlikely that this isthe case. Instead, Hole 504B samples (which we have yet to examine)may not have large areas of alteration. Intact, rather than altered, oliv-ines will lower porosity in a sample while not markedly raising ve-
locity because the pores or alteration areas are roughly spheroidal anddo not contribute to velocity decrease in the same manner as cracks.
CONCLUSION
This is the first application, for us, of image analysis techniquesto problems involving the systematics of laboratory data from igne-
R.H. WILKENS, M.H. SALISBURY
Table 2. Average distributions of image elements.
Core, section,interval (cm)
148-896A-1R-1,84-86
4R-1, 51-53
5R-3, 39^1
9R-2, 2-4
16R-1,26-28
16R-2, 127-129
17R-2, 126-128
18R-1, 102-104
19R-2, 41-43
21R-1,57-59
21R-2, 140-142
22R-1, 107-109
22R-3, 26-28
23R-1, 12-14
23R-1,78-80
24R-3, 139-141
25R-1,49-51
25R-3, 52-54
26R-1,64-66
26R-2, 27-29
28R-2, 12-14
28R-2, 38-*O
29R-1,92-94
30R-1,34-36
Magnification
lOO×200×500×
lOO×200×500×
lOO×200×500×
lOO×200×500×
lOO×200×500×
lOO×200×500×
lOO×200×500×
lOO×200×500×
lOO×200×500×
lOO×200×500×
lOO×200×500×
lOO×200×500×
lOO×200×500×
lOO×200×500×
lOOx200×500×
lOO×200×500×
lOO×200×500x
lOO×200×500×
lOO×200×500×
lOO×200×500×
lOO×200×500×
lOO×200×500×
lOO×200×500×
lOO×200×500×
Lightgray
0.280.420.37
0.320.360.38
0.430.460.51
0.720.820.70
0.410.400.38
0.320.360.46
0.260.340.39
0.320.330.41
0.500.460.49
0.260.270.35
0.420.370.38
0.390.320.30
0.350.390.47
0.460.540.49
0.270.270.30
0.280.300.32
0.270.250.23
0.230.230.29
0.210.240.31
0.260.290.36
0.000.000.00
0.440.490.50
0.100.100.16
0.360.390.39
Darkgray
0.520.360.37
0.520.490.43
0.470.380.27
0.220.150.23
0.480.440.38
0.520.470.34
0.610.500.45
0.580.510.40
0.450.470.43
0.620.570.51
0.470.330.37
0.400.360.31
0.450.440.34
0.310.310.42
0.600.540.55
0.530.490.40
0.620.620.59
0.620.580.53
0.600.520.46
0.600.530.43
0.160.210.23
0.370.290.23
0.290.300.24
0.410.350.33
Alterationand black
0.200.220.26
0.160.150.19
0.100.160.22
0.060.030.07
0.110.160.25
0.160.170.20
0.120.160.16
0.100.150.20
0.050.060.09
0.120.160.14
0.110.190.25
0.210.320.39
0.200.170.19
0.230.150.09
0.130.180.14
0.190.210.28
0.110.130.19
0.160.190.17
0.190.240.23
0.140.170.21
0.840.800.77
0.190.220.27
0.620.600.60
0.230.260.27
Density (g/cm3)2.80 2.85 2.90 4.5
I
Velocity (km/s)5.0 5.5 6.0 6.5
I I I I
- θ - 10MPa- • - 100 MPa
600 MPa
Figure 5. Density and compressional-wave velocity of laboratory samples
from Hole 896A. Velocities are shown at three different confining pressures.
ous rocks. Image analysis has allowed us qualitatively to understandbetter the behavior of individual samples in velocity-porosity space,as well as to see changes occurring in relative abundance of mineral-ogy, pore space, and alteration with depth in Hole 896A. The data,both physical properties and image observations, point to the fact thatthere can be no simple relationship between such things as velocityand density (or porosity) in the oceanic crust, even within a group ofsamples from a single hole. Differences of 5% or more in density arefound for samples with the same velocity. The difference approaches10% when data from Hole 504B are added to the Hole 896A data.Clearly we need a better understanding of the effects of alteration andpore filling upon basalt physical properties.
ACKNOWLEDGMENTS
This work was supported by grants from JOI-USSAC and the Of-fice of Naval Research. Charles Kerton ably assisted in sample prep-aration and image collection in Hawaii. The program NIH IMAGE,
370
MICROSTRUCTURE AND PHYSICAL PROPERTIES
used for image analysis, was obtained from the National Institutes ofHealth.
REFERENCES
Berryman, J.G., 1985. Measurement of spatial correlation functions usingimage processing techniques. J. Appl. Phys., 57:2374-2384.
Birch, F., 1960. The velocity of compressional waves in rocks to 10 kilobars,\.J. Geophys. Res., 65:1083-1102.
Caruso, L., and Simmons, G., 1984. Geological applications of backscatteredelectron imaging. In Proc. Electron Micros. Geol.: Tempe (Univ. Ariz.Press), 27-83.
Christensen, N.I., and Salisbury, M.H., 1975. Structure and constitution ofthe lower oceanic crust. Rev. Geophys. Space Phys., 13:57-86.
Ehrlich, R., 1984. A strong transfer function links thin section data to reser-voir physics. AAPG Bull, 68:473. (Abstract)
Ehrlich, R., Crabtree, S.J., Horkowitz, K.O., and Horkowitz, J.P., 1991.Petrography and reservoir physics, I. Objective classification of reservoirporosity. AAPG Bull, 75:1547-1562.
Hadley, K., 1976. Comparison of calculated and observed crack densitiesand seismic velocities in Westerly Granite. J. Geophys. Res., 81:3484-3494.
Hobart, M.A., Langseth, M.G., and Anderson, R.N., 1985. A geothermal andgeophysical survey on the south flank of the Costa Rica Rift: Sites 504and 505. In Anderson, R.N., Honnorez, J., Becker, K., et al., Init. Repts.DSDP, 83: Washington (U.S. Govt. Printing Office), 379-404.
Jacobson, R.S., 1992. The impact of crustal evolution on changes of the seis-mic properties of the uppermost ocean crust. Rev. Geophys., 30:23^42.
Moos, D., and Marion, D., 1994. Morphology of extrusive basalts and itsrelationship to seismic velocities in the shallow ocean crust. J. Geophys.Res., 99:2985-2994.
Mottl, M.J., 1989. Hydrothermal convection, reaction, and diffusion in sedi-ments on the Costa Rica Rift flank: pore-water evidence from ODP Sites677 and 678. In Becker, K., Sakai, H., et al., Proc. ODP, Sci. Results,111: College Station, TX (Ocean Drilling Program), 195-213.
Pye, K., and Krinsley, D.H., 1984. Petrographic examination of sedimentaryrocks in the SEM using backscattered electron detectors. J. Sediment.Petrol., 54:877-888.
Raitt, R.W., 1963. The crustal rocks. In Hill, M.N. (Ed.), The Sea—Ideas andObservations on Progress in the Study of the Seas (Vol. 3): The EarthBeneath the Sea: New York (Wiley-Interscience), 85-102.
Salisbury, M.H., and Christensen, N.I., 1978. The seismic velocity structureof a traverse through the Bay of Islands ophiolite complex, Newfound-land, an exposure of oceanic crust and upper mantle. J. Geophys. Res.,83:805-817.
Salisbury, M.H., Christensen, N.I., Becker, K., and Moos, D., 1985. Thevelocity structure of Layer 2 at Deep Sea Drilling Project Site 504 fromlogging and laboratory experiments. In Anderson, R.N., Honnorez, J.,Becker, K., et al., Init. Repts. DSDP, 83: Washington (U.S. Govt. Print-ing Office), 529-539.
Wilkens, R., Schultz, D., and Carlson, R., 1988. Relationship of resistivity,velocity, and porosity for basalts from downhole well-logging measure-ments in Hole 418A. In Salisbury, M.H., Scott, J.H., et al., Proc. ODP,Sci. Results, 102: College Station, TX (Ocean Drilling Program), 69-75.
Wilkens, R.H., Christensen, N.I., and Slater, L., 1983. High-pressure seismicstudies of Leg 69 and 70 basalts. In Cann, J.R., Langseth, M.G., Hon-norez, J., Von Herzen, R.P., White, S.M., et al., Init. Repts. DSDP, 69:Washington (U.S. Govt. Printing Qffice), 683-686.
Wilkens, R.H., Fryer, G.J., and Karsten, J., 1991. Evolution of porosity andseismic structure of upper oceanic crust: importance of aspect ratios. J.Geophys. Res., 96:17891-17995.
Wilkens, R.H., Simmons, G., and Caruso, L., 1984. The ratio VpIVs as a dis-criminant of composition for siliceous limestones. Geophysics, 49:1850-1860.
Date of initial receipt: 15 August 1994Date of acceptance: 13 March 1995Ms 148SR-139
6.6 -
6.4 -
6.2 -
_ocu 6.0 -
δ 5.8 H
I 5.6Φ
I 5.4 -
5.2 -
^< i: 5 .
•
+
•
• Hole 89 6A+ Hole 504B
^ ― Christensen &Salisbury (1975)
2.80T
2.85
Density
2.90 2.95
Figure 6. Compressional-wave velocity at 100 MPa vs. wet-bulk density. Hole 504B laboratory samples are generally faster than Hole 896A samples for a sim-ilar density.
371
R.H. WILKENS, M.H. SALISBURY
6.6 -
6.4 -
6.2 -
6.0 -
5.8 -
5.6 -
5.4 -
5.? -
•
+ 30-1-34
* y-2-02
V + ÷
26-1-64
•5-3-39
• #17-2-26•28-2-38
-102• 28-2-12
26-2-27 <
K.
• Hole896A+ Hole 504B
— Time Average
•22-3-26
• 1-1-84
• 29-f-9227-1-63
• 23-1-78
4-1-51 *w 21-2-140
I I I I I 1 I I I I I0.00 0.01 0.02 0.03 0.04 0.05 0.06 0.07 0.08 0.09 0.10
PorosityFigure 7. Porosity vs. compressional-wave velocity at 100 MPa confining pressure. Labels are samples examined with SEM and listed in Table 2. Hole 896Asamples have generally greater porosity than those of Hole 504B.
r,•:,.,•r•&
Figure 8. Notice that the pore spaces are filled with alteration minerals. Verylittle open pore space is in evidence.
Figure 9. The pore spaces in this sample are free of alteration products.
372
MICROSTRUCTURE AND PHYSICAL PROPERTIES
96A-25R-3, 52-54 cm 500X>
Figure 10. This sample exhibits relatively low porosity among others of sim-ilar velocity. Pore spaces are filled with alteration minerals.
Figure 11. Sample with very little alteration of pore space.
96A-30R-1, 34-36 cm 200
200 micronsS896A-29R-1, 92-94 cm 200)
jSPgfFliii••liiiiliilffii Will • l • •M.^jP 200 microns
jj « ? « * ' " < i ' * , * • , '
; * • \ • • ' ' " • * " ;
y+ '' & ' • if- '• <• • •'-- ~•'•'
y'ß sAw • • • á S s
><* i* t 9
• ••. ' * » '
: . - . • " • • . • • • • , 5 : : A , .
. • • $ • . . - - , . • ; - ^ 1 , ; • * " • : • • : • • '
g / < " > * * l v - ^ Λ " : -
• i ' ** ^ % %\y: •M• ."' M i > Λ -*-> "• • *-
# s if: >
. *S* * * * * , % *
4* *"* ^ ** *-• , . * ' - • "•*
J ' * '/ r l •• ^ •* •'
* •'|* I « 3 * ^ * * * ?
> ' 1. δ < % - * i*a,| # < », !?**•» V
Figure 12. Clean pores in this sample suggest relatively high velocity for its Figure 13. Sample with almost total alteration. Note the lack of microcracks.porosity.
R.H. WILKENS, M.H. SALISBURY
150
2 0 0 -
2 5 0 -
4 5 0 -
500
O 100X• 500X
o
o
(mbs
f)
.cQ.
Q
300-
350-
400-
OO
om
om
O CM 0.80
0.60
0.0 0.2 0.4
Alteration and pore area
Figure 14. Alteration and pore-space area vs. depth. Two of the deeper samples were almost totally altered.
374