28 - iped development. Yesu Persaud – Chairman Mr. Komal Samaroo Mr. James Morgan Mr. Laurence...
60
28 years of helping people to help themselves! CONTENTS FINANCIAL CONTENT Notice of Meeting Corporate Information Board of Directors Mission Statement Guiding Principle Goals Vision Culture & Values Corporate Profile Awards Chairman’s Report Staff Awards Management Team Clients Awards Loan Statistics Report of the Directors Auditors' Report Statement of Profit or Loss and other Comprehensive Income Statement of Changes in Equity Statement of Financial Position Statement of Cash Flows Notes to the Financial Statements 2 3 3 4 4 4 4 4 5 6 8 12 12 14 15 16 17 18 19 20 21 22
Transcript of 28 - iped development. Yesu Persaud – Chairman Mr. Komal Samaroo Mr. James Morgan Mr. Laurence...

28 years of helping people to help
themselves!
CONTENTS
FINANCIALCONTENT
Notice of MeetingCorporate InformationBoard of DirectorsMission StatementGuiding PrincipleGoals VisionCulture & ValuesCorporate ProfileAwardsChairman’s ReportStaff AwardsManagement TeamClients Awards Loan StatisticsReport of the Directors
Auditors' ReportStatement of Profit or Loss and other Comprehensive IncomeStatement of Changes in EquityStatement of Financial PositionStatement of Cash FlowsNotes to the Financial Statements
2
3
3
4
4
4
4
4
5
6
8
12
12
14
15
16
17
18
19
20
21
22

ANNUAL REPORT 2013
INSTITUTE OF PRIVATE ENTERPRISE DEVELOPMENT LTD.
2
The twenty-eight Annual General Meeting of the Institute of Private Enterprise Development Limited will be held on Monday, 23rd June, 2014 at the Institute's Head Office, 253 South Road, Bourda, Georgetown, commencing 2.00 pm.
AGENDA
1. Chairman’s review of the Institute for the year 2013.
2. Receive and consider the Institute’s Accounts and Reports of the Directors and Auditors for the year 2013. 3. Elect Directors in the place of those retiring by rotation.
4. Appoint Auditors and authorize the Directors to fix their remuneration.
5. Presentation of Client’s Awards.
6. Presentation of Staff Awards.
7. Any other business of an Annual General Meeting.
BY ORDER OF THE BOARD
…………………………............Hemant S. Indar SinghAdmin Manager/Company Secretary
Registered Office253 South RoadBourdaGeorgetown
8th February, 2014
NOTICE OF MEETING

ANNUAL REPORT 2013
INSTITUTE OF PRIVATE ENTERPRISE DEVELOPMENT LTD.
3
CORPORATE INFORMATION
BOARD OF DIRECTORS
DIRECTORSDr. Yesu Persaud – ChairmanMr. Komal SamarooMr. James MorganMr. Laurence FarleyDr. Ian McDonaldMrs. Amanda RichardsDr. Gem FletcherMr. Ramsay AliDr. Leslie Chin
REGISTERED OFFICEIPED Building253 South Road,Bourda, Georgetown, GuyanaTel: 592-226-4675Fax: 592-223-7834Email: [email protected]: www.ipedgy.com
BANKERSDemerara Bank Ltd.Republic Bank Ltd.Guyana Bank for Trade and Industry Ltd.Citizens Bank Guyana Ltd.
AUDITORSTSD LAL & COChartered Accountants 77 Brickdam, StabroekGeorgetown, Guyana
ATTORNEYS AT LAWMr. Vidyanand Persaud & AssociatesDemeraraMr. Murseline BacchusBerbiceMr. Lachmi N. DindyalEssequibo
BRANCHESRegion 1MabarumaPort Kaituma
Region 254 Cotton FieldEssequibo CoastTel: 592-771-4298
CharityEssequibo Coast
Region 3278 Pet Shop StreetParika East Bank EssequiboTel: 592-260-4399
Lot RF 1 Vreed-en-HoopWest Coast DemeraraTel: 592-264-3592
Region 4IPED Building 253 South RoadBourda, GeorgetownTel: 592-226-4675
Region 5Lot 55 B Rosignol VillageWest Bank BerbiceTel: 592-327-5367
Region 61 Port MourantCorentyneTel: 592-336-6171
CorrivertonCorentyne, BerbiceTel: 335-3928
Region 9Lethem RupununiTel: 592-772-2229
Region 10Hand-in-Hand BuildingRepublic AvenueLindenTel: 592-444-3001
1ST ROW, LEFT TO RIGHT
Dr. Yesu Persaud CCH, FCCA, FRSA, FBIM
Mr. Komal Samaroo AA, FCCA, ACIS
Mr. James Morgan FLMI, ACS
Dr. Leslie Chin AA, Bsc, Ph.D
2ND ROW, LEFT TO RIGHT
Mrs. Amanda Richards AICB
Dr. Gem Fletcher Ph.D
Dr. Ian McDonald AA, MA (Cantab), FRSL
Mr. Laurence Farley FBSC, ACEA
Mr. Ramsay Ali BBA

MISSIONSTATEMENT We exist to facilitate enterprise development for wealth creation and poverty reduction whilst being financially viable.
GUIDINGPRINCIPLE We believe that a good loan takes a family out of poverty and creates wealth but a bad loan sinks them deeper into hopelessness. Therefore, we will do only good loans since we care about our clients.
GOALS To develop a culture of entrepreneurship amongst our clients and to inspire and empower them to achieve excellence.To provide timely financing to Micro, Small and Medium Enterprises to enhance their production potential and capacity to supply both local and foreign markets.To provide technical and managerial support services through training and counseling to all loan beneficiaries.To promote sustainable environmental practices and technologies and mitigation of any pollution of the environment by our clients. To network with organizations providing complementary support services to communities in order to effectively develop entrepreneurs.To provide a work environment where all employees are treated fairly, are adequately compensated, trained and highly motivated.
4
CULTURE & VALUESDynamic Customer Service
Teamwork
Quality and Excellence
Innovation
Strong Governance
VISION To be of service to 7,500 active enterprises by 2015 and more than 15,000 active enterprises by 2020 using world class management systems and methodologies focused on full customer and employee satisfaction whilst being financially sustainable.

5
CORPORATE PROFILE The Institute of Private Enterprise Development is a company limited by guarantee and registered as a not-for profit Company under the Companies Act. In the 1970’s and up to 1985, the State progressively involved itself in business with the intention of owning and controlling the economy. This process tended to exclude those who could not fit into entities or who desired to do their own business. As a result, unemployment and under-employment grew with grave social and economic consequences.
Dr. Yesu Persaud a very able and concerned businessman recognized the absolute necessity for the culture of Free Enterprise to be re-created after being under attack for a generation. One of the surest way of re-creating this culture was by stimulating the emergence of small businesses and self employment. The idea of the Institute then emerged.
The Pan American Development Foundation (PADF) was approached for funding and they threw out the challenge that they would fund ½ Million Guyana Dollars if the Guyanese could match that sum. At the same time, also, Foundation for International Training (F.I.T) was approached and they offered to finance two Counsellors who were duly installed soon after the institution was established.On 1st April, 1986, the Institute of Small Enterprise Development, as it was then called opened its doors for business at 240 Camp Street, Georgetown with a staff of one – Mr. Jeff Adiken, who performed the jobs of Manager, Accountant, Counsellor, Project Officer and Messenger all rolled into one. Soon, however, further help was provided with staff numbering a total of five in its first year.
With the help and support of the Government of Guyana, United States of America, Canada and the United Kingdom, the Institute expanded rapidly to be the principal provider of finance and technical assistance to the small and micro enterprise sector in Guyana today.
To reflect its expanded role, the name of the Institute was changed on 10th September, 1991 to Institute of Private Enterprise Development Limited. Since then, the Institute has been moving from strength to strength, increasing the ambit of its loans and providing training in Management, Accounting, Marketing and Technical Services to both staff and clients as attested to by its performance.

ANNUAL REPORT 2013
INSTITUTE OF PRIVATE ENTERPRISE DEVELOPMENT LTD.
6
AWARDS

ANNUAL REPORT 2013
INSTITUTE OF PRIVATE ENTERPRISE DEVELOPMENT LTD.
7
AWARDS

ANNUAL REPORT 2013
INSTITUTE OF PRIVATE ENTERPRISE DEVELOPMENT LTD.
8
CHAIRMANS' REPORT
INTRODUCTIONIPED is indeed a shining example of what can be done with limited resources. It is one of the success stories of the Caribbean and is heralded as such by the USAID. From a staff of one and a rented office, it now employs in excess of eighty five persons and has twelve offices spread across the country.
I am very happy to be able to present to you our stakeholders, clients, associates, friends and members of the public the achievement of IPED in its 28th year of operation. I am very pleased to see that the vision and idea of myself and founding members more than 28 years ago of providing an opportunity to small entrepreneurs to start and grow their businesses is being achieved with such marvelous results today. IPED is a very good example of how much can be achieved with very little once good governance and sound business ethos are followed.
Today IPED is serving more than 4,400 micro, small and medium entrepreneurs involved in economic activities that are sustaining more than 10,000 jobs. The jobs sustained by IPED’s clients are approximately 4% of persons participating in the labour force of Guyana. Such an achievement and its impact on an economy as small as ours cannot be underrated. All of this is being done with only USD12.5M or 3% of the value all loans provided to the private sector as at Dec 2013.
SOCIAL PERFORMANCEThe Institute processed 5,107 loan applications for a value of $2.66B during the year 2013 compared to 4,814 with a value of $2.716B in 2012. This is an increase of 293 or 6% in number of applications and a reduction in value of $56M or 2% over the prior year.
8
ANNUAL REPORT 2013
INSTITUTE OF PRIVATE ENTERPRISE DEVELOPMENT LTD.

ANNUAL REPORT 2013
INSTITUTE OF PRIVATE ENTERPRISE DEVELOPMENT LTD.
9
CHAIRMANS' REPORT
The total number of borrowers on the portfolio at the end of December 2013 was 4,417, an increase of 529 or 13.6% from the prior year. Of the total borrowers approximately 1,453 borrowed for the first time in 2013. This means that 924 borrowers dropped off from the portfolio in 2013. This is mainly because many of their business ventures or economic activities were not successful , whilst some were successful to the extent of becoming independent of loans and few moved up to qualify for facilities at commercial banks.
Of the application processed in 2013, 63% were for principal borrowers that are males and 37% for females. Based on data provided by the borrowers at the application stage, male borrowers had an average net-worth of $9.5M while female borrowers had an average net-worth of $4.5M. In 2013, 54% of the applicants had net-worth of less than $5M whilst 22% of applicants had a net-worth of less $1M. In 2012 51.8% of applicants had a net worth of less than $5M whilst 9% had a net worth of less than $1M.
The average loan sizes accessed by males were $670K and females were $317K. The number of loans accessed by women in 2013 increased by 425 or 29% whilst the number of loans accessed by males declined by 132 or 4%. This is a positive sign towards the achievement of our goals of ensuring that our products are designed to provide equal opportunities for both males and females. Of the applicants who accessed loans in 2013- 16% had un-secured or non-collateral facilities and 52% accessed loans with moveable or household assets as collateral. This means that 7 out of 10 applicants accessed a business loan without the use of real estate collateral. This is an indication of our commitment to serve those persons with minimal or no collateral.
9
ANNUAL REPORT 2013
INSTITUTE OF PRIVATE ENTERPRISE DEVELOPMENT LTD.
In 2013, 37% of applicants were 40 years and less with 11% being less than 30 years and 4% being less than 25 years. In 2012 34% of applicants were 40 years and less. Youths are an important segment for us to continue to serve.
The clientele of IPED in 2013 based on applications processed are 17% urban and 83% rural. This was 16% and 84% in 2012. IPED’s services are provided in all 10 administrative regions with 13 branch or sub branch locations countrywide.
In addition to our loan services, during 2013 IPED’s Entrepreneurial Development Centre had (69) sixty nine staffers of small and medium business entities trained at Customer Service Workshops facilitated. We also provided training to (73) seventy three persons in Small Business Management & Entrepreneurship. About fifteen percent of the participants were already business owners whilst the remaining eighty five percent were coached into becoming entrepreneurs. More than 200 students were provided with tuition for Business Management, Marketing, Human Resource Management and Project Management Courses examined by the Institute of Commercial Management (ICM) UK. The pass rate for the exams written was 77% in 2013.
IPED has been contracted by the Ministry of Agriculture (MoA) to manage the Enterprise Development Fund (EDF) for the Rural Enterprise and Agricultural Development Project (READ). The Project has three components – Enterprise Development Grant Fund (EDGF) - G$120.6 M, Credit Fund (CF) G$37.9 M and Productive and Social Investment Fund (PSIF) G$83.2 M. The Project is jointly funded by the Government of Guyana (GOG) and the International Fund for Agricultural Development (IFAD). The main goal of this Project is to improve the living conditions of poor rural households, especially small scale

ANNUAL REPORT 2013
INSTITUTE OF PRIVATE ENTERPRISE DEVELOPMENT LTD.
10
producers and vulnerable groups by increasing their human, social, organizational and financial assets. In 2013, G$77.9M or 85.9% EDGF was disbursed against budget target of G$90.7M. Of the five project proposals to the value of G$9M for the PSIF which were expected to be approved and disbursed in 2013; all five were approved and one to the value of G$1.8M or 20% was disbursed. The Credit Fund Portfolio was G$13M at December 31, 2013 against a budget target of G$21M. The number of persons benefited was 612; comprising of 527 for the EDGF and PSIF whilst 85 persons benefited from the Credit Fund.
The above social performance achievements highlight that the management of the Institute is well focused on fulfilling its mission of enterprises development for wealth creation and poverty reduction.
FINANCIAL PERFORMANCE AND POSITION IPED is a not for profit, non-government, non-political organisation that is managed using all the principles of a private company in a market economy but without shareholders to satisfy, focusing on a social mission of enterprise development for wealth creation and poverty reduction of its clients whilst being financially viable. To achieve our social goals, sound financial management and responsible practices are required to ensure that our institution is sustainable so that we can continue to serve society and achieve our mission. As such, IPED had another sterling performance in 2013 with the surplus for the year ended December 31, 2013 being $230.8M compared to $215.9M in 2012 an increase of $14.9M or 6.9%. All surpluses are retained within the Institute and used mainly to increase service to the borrowers.
CHAIRMANS' REPORT
ANNUAL REPORT 2013
INSTITUTE OF PRIVATE ENTERPRISE DEVELOPMENT LTD.
10
The total asset of IPED at December 31, 2013 was $3.343B compared to $2.906B at the end of December 2012 an increase of $437M funded mainly from retained earnings of $230.8M, increase in bank loan by $88M and increase in Collateral Improvement Schme by $22M. The current operating cash is $101M. Of the total assets 79% are funded by equity and 21% by Liabilities compared to 83% and 17% respectively at the end of December 2012. The amount of $404M outstanding as borrowings represents 12% of total assets at December 31, 2013 and was 9% in December 2012.
It must be noted that IPED retained all its surpluses over the years since inception but such retention alone was not sufficient to meet the demands of our clients as can be seen in the growth of the net loans portfolio over the last four years from $1.292B at the end of 2009 to $2.527B at December 2013. This is an increase of $1.235B or 95%. As such, IPED was required to borrow over $450M on commercial terms to meet this demand. Such a growth would have been impossible if our clients were not satisfied with the products and services we offer.
Over the last financial year alone the gross loans portfolio increased by $335M or 15% to $2.573B at December 31, 2013 from the previous year balance of $2.238B. Of this, the portfolio at risk (PAR) more than 30 days at the end of the year was 12%. This deteriorated from the previous year position of 11%. This was 28% at the end of 2009.
The total principal balance of impaired loans, which are loans in arrears for more than 180 days was $155.5M at December 31, 2013 compared to $124.4M at December 2012. This represents 6% and 5.5% of gross portfolio for 2013 and 2012 respectively. The net exposure from these loans

ANNUAL REPORT 2013
INSTITUTE OF PRIVATE ENTERPRISE DEVELOPMENT LTD.
11
CHAIRMANS' REPORT
ANNUAL REPORT 2013
INSTITUTE OF PRIVATE ENTERPRISE DEVELOPMENT LTD.
11
after deducting the value of collateral held was $48.6M in 2013 and $46M in 2012. This resulted in the provision for loan losses of $46.1M and $45.9M respectively. The loan loss provision for 2013 represents 30% of the value of impaired loans as 70% are covered with substantial collateral.
We will continue to evolve a business model that will be reflective of responsible practices towards our clients and our future viability so that we maintain a strong financial position that will support our continued existence.
OTHER ACHIEVEMENTSIPED as a member of the Caribbean Microfinance Alliance benefitted from support of the Caribbean Microfinance Capacity Building Project Phase 2 that contributed to us creating a new product and having significant improvements in the efficiency and effectiveness of our systems. We would like to thank the IDB/MIF, CDB, EU and Citi Foundation for funding this project.
IPED during 2013 reported for the first time its data for the year ended December 31, 2012 to the Microfinance Information Exchange known as the MIX Market (mixmarket.org). The MIX is the premier source for objective, qualified and relevant microfinance performance data and analysis. As a result of our participation we were awarded a Certificate of Transparency for achieving four diamonds out of a maximum of 5 diamonds on the MIX Market for improving the transparency, quality and reliability of microfinance information.
IPED was also a finalist in the Citi Foundation Caribbean Microfinance Awards in the areas of Microfinance Transparency and Product Innovation in Microfinance in 2013.
We have also endorsed the Principles of the SMART Campaign – “keeping clients first in microfinance”. The Smart Campaign is a global campaign committed to embedding client protection practices into the institutional culture and operations of the microfinance industry. We are working towards achieving certification as a responsible practitioner. We have completed the assessment phase already and we are in the process of updating our policies and procedures to comply with these standards, then we will proceed with independent verification for the Certification.
IPED is also proud to be a subscriber and information provider to Credit Info (Guyana) Inc., Guyana’s first licensed credit bureau. This is a welcome development in the financial ecosystem and will greatly enhance the services of providing access to finance.
IPED’s Entrepreneurial Development Centre was also successful in maintaining its accreditation with the Institute of Commercial Management (ICM) as an Approved Teaching and Examining Centre due to its high quality of service.
CONCLUSIONThe success of IPED over the years was made possible through the practice of good governance by the members of the Board, high quality leadership from the executive management team and committed and motivated human resources. We are all driven by the mission of the organization to serve our society and contribute to making it a better place for all to live.
I am extremely thankful to my fellow directors and the team at IPED for their achievements in 2013 and for their continued efforts to improve the quality of service we provide to meet the needs of the people we serve.

ANNUAL REPORT 2013
INSTITUTE OF PRIVATE ENTERPRISE DEVELOPMENT LTD.
12
Helping people to help
themselves!
GARRETT WARD BRANCH MANAGERNEELA RAMESH SENIOR LEGAL CLERK
ANDREW SINGH SECURITY OFFICER
HAYLA HAYNES SENIOR BUSINESS COUNSELLOR/FIELD OFFICER
NIAIOL PAUL OFFICER IN CHARGE – DEBT RECOVERY PAULA KING BUSINESS COUNSELLOR/FIELD OFFICER IIKEYSHAWN PHILANDER SENIOR AUDIT CLERKANDREW MILTON SECURITY OFFICER
Hilton Lord (R), Snr. Business Counsellor/Field Officer, Linden Branch
Prasanna Kumar Muthu (R),Internal Auditor
Yogieraj Das (L), Credit Manager
Ramesh Persaud (L),Chief Executive Officer
STAFF AWARDSFOR 20YRS OF SERVICE
FOR 15YRS OF SERVICE
FOR 10YRS OF SERVICE
FOR 5YRS OF SERVICE
12

ANNUAL REPORT 2013
INSTITUTE OF PRIVATE ENTERPRISE DEVELOPMENT LTD.
13
Niaiol PaulOfficer in Charge - Debt Recovery
Dhanpal Birbal (L), Branch Manager,ParikaHemant S. Indar Singh (L), Admin Manager/Company Secretary
Jagdesh Haripershad (L),Finance Manager
Elvis Rose (L), Branch Manager, Berbice
Vishnu Harpaul (L),Branch Manager, Essequibo
Robert Williams (L), Officer in Charge - Rosignol
Garrett Ward (R), Branch Manager, E.C.D.
Shaun Persaud (L), Officer in Charge - Region 9
Gordon Trim (R), Branch Manager E.B.D.
Henry Smith (L), Snr. Business Counsellor/Field Officer, Region 1
13
ANNUAL REPORT 2013
INSTITUTE OF PRIVATE ENTERPRISE DEVELOPMENT LTD.

BEST MICRO ENTERPRISE PROJECT
Ray Boyce - RICE CULTIVATION12 Sand Pit Road, Onderneeming, Essequibo Coast
BEST SMALL ENTERPRISE PROJECT
Yamona - DISTRIBUTION SERVICESLot 22 Ruby, East Bank Essequibo
BEST MEDIUM ENTERPRISE PROJECT
Imran Mohamed - DISTRIBUTION SERVICESNo. 78 Village, Corentyne, Berbice
BEST MANAGED PROJECT
Brian Morrison - OTHER CROPSLot 3 Kuru Kururu, Soesdyke, Linden Highway
BEST AGRICULTURAL PROJECT
Veer Singh - RICE CULTIVATIONCape Clair, Mahaicony, East Coast Demerara
BEST MANUFACTURING PROJECT
Mahendra Nauth Leildhari - MANUFACTURING (JEWELLERY)Lot 127 Daisy Street, Springlands, Corentyne
BEST WOMAN ENTREPRENEUR
Bhagwandai Ram - MANUFACTURING (GARMENT)11 Kersaint Park, LBI, East Coast Demerara
ENTERPRISING MICRO ENTREPRENEURS
Seerujnie Ramanand - POULTRY REARINGLot 13 West Field, Queenstown, Essequibo Coast
Donnette Henry - VENDINGTuschen North, East Bank Essequibo
Allison Duguid - DISTRIBUTION SERVICES391 Self Help Square, East Ruimveldt, Georgetown
Clifford Fordyce - RICE CULTIVATION6 Weldaad Village, West Coast Berbice
Yvette Dodds - CATERINGLot 32 Tucber Park, New Amsterdam, Berbice
Mark Carlos Tacoordeen - VENDINGLot 76 Windmill Road, Lethem, Rupununi
Diana Andries - DISTRIBUTION SERVICESLot 2084 Central Amelia’s Ward, Linden
The Best of 2013
14

LOAN STATISTICS
ADMINISTRATIVE ANALYSIS
2007-2013
2001-2013
ECONOMIC
SECTOR 2013 2012 2011 2010 2009 2008 2007
Rice 1,353 1482 1,481 1,432 1,279 1,172 1,167
Sugarcane 6 5 8 11 17 11 15
Other Crops 434 361 381 383 339 371 424
Livestock 727 785 903 1,154 1,259 1,075 1,131
Fishing 53 70 76 91 82 84 84
Forestry 27 30 34 38 36 38 32
Mining 5 9 6 5 9 6 7
Manufacturing 165 164 212 204 226 202 226
Construction 31 26 29 2 8 11 9
Distribution Services 1456 1490 1,516 1889 2,106 1,839 2,202
Transportation Services 144 104 114 96 85 75 107
Rental of Buildings 3 3 6 1 2 1 5
Other Services 703 285 236 143 275 199 359
TOTAL 5,107 4,814 5,002 5,449 5,723 5,084 5,768
SUMMARY RESULT OF ACTIVITIES 2013 2012 2011 2010 2009 2008 2007 2006 2001-2005
No. of Loans Granted 5,107 4,814 5,002 5,449 5,723 5,084 5,768 5,520 25,034
Value of Loansapproved (G$000) 2,660,777 2,716,448 2,399,068 1,936,890 1,746,899 1,482,602 1,427,687 1,084,924 4,234,848
No. of Jobs Created/Sustained 9,489 9,628 9,974 10,140 10,127 8,984 9,926 9,636 39,912
Average Loan Size (G$000) 521.0 564.3 479.6 355 305.2 291.6 247.5 196.5 169.2
Administrative Cost Per Loan 69,303 63,725 58,051 48,675 43,960 41,278 35,206 32,523 25,289
Average No. of Jobs Per Loan 1.8 2.0 2.0 1.9 1.8 1.8 1.7 1.7 1.6
Loan Value Per Job (G$000) 280 282 240 191 173 165 144 113 106
CLASSIFICATION OF LOAN RECIPIENTS 2001-2013
CUMMULATIVE 2013 2012 2011 2010 2009 2008 2007 2006 2001-2005
Men 1,872 1,876 1,807 1,704 1,545 1,349 1,758 1,653 8,787
Women 3,235 1,139 1,217 1,399 1,259 1,103 1,592 1,540 8,590
Joint - Men & Women - 1,799 1,978 2,346 2,919 2,632 2,418 5,327 7,657
TOTAL 5,107 4,814 5,002 5,449 5,723 5,084 5,768 5,520 25,034
15
ANNUAL REPORT 2013
INSTITUTE OF PRIVATE ENTERPRISE DEVELOPMENT LTD.
16
The Directors have pleasure in submitting this Report and Audited Financial Statements for the year ended 31st December, 2013.
PRINCIPAL ACTIVITIES
The Institute of Small Enterprise Development Limited was incorporated on 2nd October, 1985 as a Company limited by guarantee. It is a non-profit and tax exempt Organization formed to promote and to encourage the development and growth of industry through the provision of business guidance, technical assistance, non-traditional credit facilities to small entrepreneurs or to groups and generally to promote and encourage the development and growth of all other economic activities designed to improve the social and economic welfare of the people of Guyana.With effect from 10th September, 1991 the entity’s name was changed to Institute of Private Enterprise Development Limited.The Institute was granted Certificate of Continuance as set out in the Articles of Continuance, under Section 339 of the Companies Act. On the 14th August, 1986, the Institute of Private Enterprise Development Ltd. was prescribed as an Organisation of National Character in Guyana under Section 35(1) of the Income Tax Act Chapter 81:01.
PERFORMANCE FOR THE YEAR
In the year 2013, the Institute financed a total of 5,107 loans valued G$2,660.8 million. The 5,107 loans created/sustained 9,489 jobs.Income totaled $590.261 million and expenditure $359.419 million resulting in a surplus of $230.842 million for the year compared with $215.974 million in the year 2012.
APPLICATION OF SURPLUS
Net surplus for the year 2013 was $230.842 million and this was transferred to the accumulated surplus which totaled $2.387 billion at the end of 2013.
CREDIT PROGRAMMES
In the year 2013, the Institute operated two Credit Windows:-
1. Main Credit Window, which is geared to meet the needs of the small and medium business sectors.2. Micro Credit Window, which is geared to meet the needs of the micro business sector. In April 2013, the Institute launched a new product called the Micro Boost Loans.
ENTREPRENEURIAL DEVELOPMENT
The Entrepreneurial Development Centre continued to pursue its mission of enhancing the chances of business success through training, education and development. Its partnership with the Institute of Commercial Management in the United Kingdom proved to be very critical to career and professional development. A total of two hundred and eleven students benefited from this level of training in Diploma programmes in Business Administration, Project Management, Introduction to Business Law, International Business Communication, Economics for Business and Marketing Principles.
BOARD OF DIRECTORS
During the year 2013, there were nine (9) Directors on the Board.
1. Dr. Yesu Persaud2. Mr Komal Samaroo3. Dr Ian Mc Donald4. Mr Laurence Farley5. Mr James Morgan
Pursuant to the Company’s Articles of Association, the following Directors retire by rotation and are eligible for re-election:
1. Dr. Yesu Persaud2. Mr. Komal Samaroo3. Dr. Leslie Chin
AUDITORS
The retiring Auditors, Messrs TSD LAL & CO. have intimated their willingness to be re-appointed.
REPORT OF THE DIRECTORS
6. Mrs Amanda Richards7. Dr. Gem Fletcher8. Dr. Leslie Chin9. Mr Ramsay Ali

ANNUAL REPORT 2013
INSTITUTE OF PRIVATE ENTERPRISE DEVELOPMENT LTD.
17
INDEPENDENT AUDITORS’ REPORT
TO THE MEMBERS OFINSTITUTE OF PRIVATE ENTERPRISE DEVELOPMENT LIMITED
ON THE FINANCIAL STATEMENTS
FOR THE YEAR ENDED DECEMBER 31, 2013
Report on the Financial Statements
We have audited the accompanying financial statements of Institute of Private Enterprise Development Limited which comprise the statement of financial position as at 31 December 2013 and the statement of profit or loss and other comprehensive income, statement of changes in equity and statement of cash flows for the year then ended, and a summary of significant accounting policies and other explanatory notes as set out on pages 18 to 56.
Directors’/Management’s Responsibility for the Financial Statements
The Directors/ Management are responsible for the preparation and fair presentation of these financial statements in accordance with International Financial Reporting Standards. This responsibility includes: designing, implementing and maintaining internal control relevant to the preparation and fair presentation of financial statements that are free from material misstatement, whether due to fraud or error; selecting and applying appropriate accounting policies; and making accounting estimates that are reasonable in the circumstances.
Auditors’ Responsibility
Our responsibility is to express an opinion on these financial statements based on our audit. We conducted our audit in accordance with International Standards on Auditing. Those standards require that we comply with ethical requirements and plan and perform the audit to obtain reasonable assurance whether the financial statements are free from material misstatement.
An audit involves performing procedures to obtain audit evidence about the amounts and disclosures in the financial statements. The procedures selected depend on the auditors’ judgement, including the assessment of the risks of material misstatement of the financial statements, whether due to fraud or error. In making those risk assessments, the auditor considers internal control relevant to the entity’s preparation and fair presentation of the financial statements in order to design audit procedures that are appropriate in the circumstances, but not for the purpose of expressing an opinion on the effectiveness of the entity’s internal control. An audit also includes evaluating the appropriateness of accounting policies used and the reasonableness of accounting estimates made by management, as well as evaluating the overall presentation of the financial statements.
We believe that the audit evidence we have obtained is sufficient and appropriate to provide a basis for our audit opinion.
Opinion
In our opinion, the financial statements give a true and fair view, in all material respects of the financial position of Institute of Private Enterprise Development Limited as at 31 December 2013 and of its financial performance and its cash flows for the year then ended in accordance with International Financial Reporting Standards.
Report on Other Legal and Regulatory Requirements
The financial statements comply with the requirements of the Companies Act 1991.
TSD LAL & CO.CHARTERED ACCOUNTANTS
January 27, 2014
77 BrickdamStabroek, GeorgetownGuyana

ANNUAL REPORT 2013
INSTITUTE OF PRIVATE ENTERPRISE DEVELOPMENT LTD.
18
STATEMENT OF PROFIT OR LOSS AND OTHER COMPREHENSIVE INCOMEFor the year ended 31 December 2013 2013 2012 Notes G$ G$ (Restated) Interest income 545,696,833 474,393,463 Interest expense 17,751,682 7,461,771 Net interest income 527,945,151 466,931,692 Investment income 5 18,539,907 18,798,935 Other income 6 43,775,958 38,274,545 Net interest and other income 590,261,016 524,005,172 Employment cost 7 (a) 193,079,220 168,267,306 Loan impairment 5,486,077 - Premises and equipment 35,884,620 29,830,589 Other operating costs 124,969,378 109,933,076 359,419,295 308,030,971 Surplus of revenue over expenditure 7 230,841,721 215,974,201
Other comprehensive Income: Items that will not be reclassified subsequently to profit or loss: Remeasurement of provision for employee benefits (1,279,000) 53,883,000
Other comprehensive income / (loss) (1,279,000) 53,883,000 Total comprehensive Income for the year 229,562,721 269,857,201
"The accompanying notes form an integral part of these financial statements."

ANNUAL REPORT 2013
INSTITUTE OF PRIVATE ENTERPRISE DEVELOPMENT LTD.
19
Members' Capital Accumulated subscriptions donations surplus Total Notes G$ G$ G$ G$ Balance at 1 January 2012 (as previously reported) 32,500 256,465,233 1,880,889,082 2,137,386,815 Adjustment 24 - - 6,755,000 6,755,000
Balance at 1 January 2012 (restated) 32,500 256,465,233 1,887,644,082 2,144,141,815 Surplus for the year (restated) - - 215,974,201 215,974,201
Other comprehensive Income (restated) 24 - - 53,883,000 53,883,000 Balance at 31 December 2012 (restated) 32,500 256,465,233 2,157,501,283 2,413,999,016
Surplus for the year - - 230,841,721 230,841,721 Other comprehensive loss - - (1,279,000) (1,279,000)
Total Recognised income for the year - - 229,562,721 229,562,721
Balance at 31 December 2013 32,500 256,465,233 2,387,064,004 2,643,561,737
"The accompanying notes form an integral part of these financial statements."
STATEMENT OF CHANGES IN EQUITYFor the year ended 31 December 2013

ANNUAL REPORT 2013
INSTITUTE OF PRIVATE ENTERPRISE DEVELOPMENT LTD.
20
......……...........……………………Dr Yesu Persaud
Chairman
......……...........……………………Mr James Morgan
Director
2013 2012 2011 G$ G$ G$ASSETS Notes (Restated) (Restated)
Non Current assets Property, plant and equipment 9 145,978,728 126,366,379 126,838,688 Intangible asset 10 531,855 357,840 913,340 Investments 13 351,727,029 341,105,810 497,445,397 Defined benefit asset 8 74,721,000 71,970,000 16,873,000 Loans receivable 11 2,527,857,812 2,192,870,091 1,745,852,886 3,100,816,424 2,732,670,120 2,387,923,311 Current assets Inventory 369,310 1,230,532 1,859,878 Other receivables and prepayments 12 54,268,471 23,808,603 18,730,726 Cash resources 14 187,919,947 147,975,566 23,879,117 242,557,728 173,014,701 44,469,721 TOTAL ASSETS 3,343,374,152 2,905,684,821 2,432,393,032 EQUITY AND LIABILITIES EQUITY Members' subscriptions 15 32,500 32,500 32,500 Capital donations 16 256,465,233 256,465,233 256,465,233 Accumulated surplus 2,387,064,004 2,157,501,283 1,887,644,082 2,643,561,737 2,413,999,016 2,144,141,815 Non Current liabilities Loans payable 17 290,245,363 203,715,726 35,570,530 Current liabilities Other payables and accruals 18 295,213,830 252,143,486 177,937,442 Loans payable 17 37,383,365 35,826,593 8,107,002 Bank Overdraft(Unsecured) 76,969,857 - 66,636,243 409,567,052 287,970,079 252,680,687
TOTAL EQUITY AND LIABILITIES 3,343,374,152 2,905,684,821 2,432,393,032
These financial statements were approved by the Board of Directors on 27 January 2014.
On behalf of the Board:
STATEMENT OF FINANCIAL POSITIONas at 31 December 2013
"The accompanying notes form an integral part of these financial statements."

ANNUAL REPORT 2013
INSTITUTE OF PRIVATE ENTERPRISE DEVELOPMENT LTD.
21
STATEMENT OF CASH FLOWSFor the year ended 31 December 2013
2013 2012 G$ G$ (Restated)OPERATING ACTIVITIES Surplus of revenue over expenditure 230,841,721 215,974,201 Adjustments for: Depreciation net of adjustment 19,502,958 16,331,031 Amortisation 393,297 555,500 Profit on sale of motor vehicles and office machinery - (2,550,000) Operating surplus before working capital changes 250,737,976 230,310,732 Movements in: Loans receivable (334,987,721) (447,017,205)Other receivables and prepayments (30,459,868) (5,077,877)Inventory 861,222 629,346 Other payables and accruals 43,070,344 74,206,044 Defined benefit asset (4,030,000) (1,214,000) Net cash used in operating activities (74,808,047) (148,162,960) INVESTING ACTIVITIES (Increase) / decrease in investments (10,621,219) 156,339,587 Purchase of property, plant and equipment net of adjustment (39,115,307) (15,858,722)Purchase of intangible asset (567,312) - Proceeds on sale of motor vehicles and office machinery - 2,550,000 Net cash provided by / (used in) by investing activities (50,303,838) 143,030,865 FINANCING ACTIVITIES Loan drawn down 125,000,000 210,000,000 Loan repayments (36,913,591) (14,135,213) Net cash provided by financing activities 88,086,409 195,864,787 Net increase / (decrease) / in cash and cash equivalents (37,025,476) 190,732,692 Cash and cash equivalents at beginning of period 147,975,566 (42,757,126) Cash and cash equivalents at end of period 110,950,090 147,975,566 Comprising Bank overdraft (76,969,857) - Cash resources 187,919,947 147,975,566
110,950,090 147,975,566
"The accompanying notes form an integral part of these financial statements."

ANNUAL REPORT 2013
INSTITUTE OF PRIVATE ENTERPRISE DEVELOPMENT LTD.
22
1. INCORPORATION AND ACTIVITIES
The Institute of Small Enterprise Development Limited was incorporated in Guyana on October 02, 1985 as a company limited by guarantee. It is a not-for-profit and tax exempt organization formed to promote and encourage the development and growth of industry through the provision of business guidance, technical assistance, non- traditional credit facilities to small entrepreneurs or to groups and generally to promote and encourage the development and growth of all other economic activities designed to improve the social and economic welfare of the people of Guyana.
With effect from September 10, 1991 the entity's name was changed to the Institute of Private Enterprise Development Limited.
2. NEW AND REVISED STANDARDS AND INTERPRETATIONS
Effective for the current year end Effective for annual
periods beginning on or after New and Amended Standards
IFRS 10 Consolidated Financial Statements 1 January 2013 IFRS 11 Joint Arrangements 1 January 2013 IFRS 12 Disclosure of Interests in Other Entities 1 January 2013 IFRS 13 Fair Value Measurement 1 January 2013 IAS 19 Amendments to IAS 19 – Employee Benefits 1 January 2013 IAS 27(2011) Separate Financial Statements 1 January 2013 IAS 28(2011) Investments in Associates and Joint Ventures 1 January 2013 IAS 1(2011) Amendments to IAS 1 – Presentation of Other Comprehensive Income 1 July 2012 IFRS 7 Financial Instruments - Offsetting Financial Assets and Financial Liabilities 1 January 2013 IFRS 1 First-time Adoption of International Financial Reporting Standards (Government loans) 1 January 2013 IFRS 1 Amendments as part of improvements to IFRSs 2011 1 January 2013 IAS 1 Amendments as part of improvements to IFRSs 2011 1 January 2013 IAS 16 Amendments as part of improvements to IFRSs 2011 1 January 2013 IAS 32 Amendments as part of improvements to IFRSs 2011 1 January 2013 IAS 34 Amendments as part of improvements to IFRSs 2011 1 January 2013 IFRS 10 Consolidated Financial Statements (Transitional arrangements) 1 January 2013 IFRS 11 Joint Arrangements (Transitional arrangements) 1 January 2013 IFRS 12 Disclosure of Interests in Other Entities (Transitional arrangements) 1 January 2013
New Interpretation
IFRIC 20 Stripping Costs in the Production Phase of a Surface Mine 1 January 2013
NOTES TO THE FINANCIAL STATEMENTS

ANNUAL REPORT 2013
INSTITUTE OF PRIVATE ENTERPRISE DEVELOPMENT LTD.
23
2. NEW AND REVISED STANDARDS AND INTERPRETATIONS (CONT'D)
Available for early adoption for the current year end Effective for annual
periods beginning on or after New and Amended Standards
IFRS 7 Financial Instruments: Disclosures 1 January 2017 IFRS 9 Financial Instruments: Classification and Measurement 1 January 2017 IFRS 9 Additions for Financial Liability Accounting 1 January 2017 IFRS 10 Consolidated Financial Statements (Exemptions) 1 January 2014 IFRS 12 Disclosure of Interests in Other Entities (Exemptions) 1 January 2014 IAS 19 Employee Benefits 1 July 2014 IAS 27 Separate Financial Statements (Exemptions) 1 January 2014 IAS 32 Financial Instruments - Offsetting Financial Assets and Financial Liabilities 1 January 2014 IAS 36 Impairment of Assets 1 January 2014 IAS 39 Financial Instruments: Recognition and Measurement 1 January 2014
New interpretation IFRIC 21 Levies 1 January 2014 The Company has not opted for early adoption. The standards and amendments that are expected to have a material impact on the Company’s accounting policies
when adopted are explained below.
IFRS 7 This standard is closely linked to IFRS 9. In December 2011, the IASB issued an amendment which modifies the
relief from restating comparative periods and the associated disclosures.
IFRS 9 IFRS 9 was issued in November 2009 and was initially required to be applied from 1 January 2013. However,
new requirements were added in November 2010 and the revised date for adoption was set for 1 January 2015. However, in November 2013, consequential amendments were issued which removed the mandatory effective date. At a meeting the IASB tentatively decided that the mandatory effective date will be no earlier than annual periods beginning on or after 1 January 2017.
This standard specifies how an entity should classify and measure its financial assets. The application of IFRS 9 may have significant impact on amounts reported in respect of the Company's financial
assets and financial liabilities However, it is not practicable to provide a reasonable estimate of that effect until a detailed review has been completed.
When adopted, the standard will be applied retrospectively in accordance with IAS 8
IAS 19 The amendments to IAS 19 sets out that contributions from employees or third parties that are linked to service
should be attributed to periods of service. It also permits a practical expedient if the amount of contributions is independent of the number of years of service.
The application of the amendments to IAS 19 may have impact on amounts reported in respect of the Company’s defined benefit plans. However, the directors have not yet performed a detailed analysis of the impact of the application of the amendments and hence have not yet quantified the extent of the impact.
NOTES TO THE FINANCIAL STATEMENTS

ANNUAL REPORT 2013
INSTITUTE OF PRIVATE ENTERPRISE DEVELOPMENT LTD.
24
2. NEW AND REVISED STANDARDS AND INTERPRETATIONS (CONT'D)
New interpretation (cont'd) IAS 32 Amends the disclosure requirements in IFRS 7 Financial Instruments, to require information about all recognised
financial instruments that are set off. The amendments also require disclosure of information about recognised financial instruments subject to
enforceable master netting arrangements. The directors do not anticipate that the application of these amendments to IAS 32 and IFRS 7 will have a significant
impact on the Company’s financial statements as the Company does not have any financial assets and financial liabilities that qualify for offset.
IAS 36 This amendment reduces the circumstances in which the recoverable amount of assets or cash-generating units
is required to be disclosed. It clarifies the disclosures required and introduces an explicit requirement to disclose the discount rate used in determining impairment or reversals where recoverable amount is determined using a present value technique.
The directors anticipate that the application of this amendment may have a significant impact on amounts reported in respect of the Company’s financial assets and financial liabilities. However, it is not practicable to provide a reasonable estimate of the effect until a detailed review has been completed.
AS 39 This amendment relates to Hedge accounting. The directors anticipate that this amendment will have no effect on the Company’s financial statements as the
Company does not engage in such activities.
IFRIC 21 This provides guidance on when to recognise a liability for a levy imposed by a government. The directors anticipate that this interpretation will have no effect on the Company’s financial statements as the
Company is not subject to this.
NOTES TO THE FINANCIAL STATEMENTS

ANNUAL REPORT 2013
INSTITUTE OF PRIVATE ENTERPRISE DEVELOPMENT LTD.
25
3. SUMMARY OF SIGNIFICANT ACCOUNTING POLICIES
(a) Statement of compliance The financial statements have been prepared in accordance with International Financial Reporting Standards and the requirements of the Companies Act 1991.
(b) Basis of preparation The financial statements have been prepared on the historical cost basis except for certain financial instruments
that are measured at revalued amounts or fair value, as explained in the accounting policies below.
(c) Revenue and expense recognition Interest income on fixed return securities is recognized as it is earned. Income on loans is taken up on an
accrual basis except for non-performing loans. Non-Performing loans are those loan accounts where both principal and interest are due and unpaid for three months or more and interest charge have been capitalized, refinanced or rolled over.
(d) Foreign currencies Transactions in currencies other than Guyana dollars are recorded at the rates of exchange prevailing on the
dates of the transactions.
At the end of each reporting period, monetary assets and liabilities denominated in foreign currencies are retranslated to Guyana dollars at the Cambio rates prevailing on that date or at rates agreed by the Bank of Guyana. Non-monetary assets and liabilities carried at fair value that are denominated in foreign currencies are retranslated at rates prevailing on the date when the fair value was determined. Gains or losses arising on retranslation are included in the profit or loss for the period, except for exchange differences arising on non-monetary assets and liabilities where changes in fair value are recognized in the statement of comprehensive income.
(e) Borrowing costs The Institute borrowings are for working capital purposes. For this purpose all borrowing costs are recognised in profit and loss in the period in which they are incurred.
(f) Defined benefits The Institute participates in a multi employer defined benefit plan (Demerara Distillers Limited Pension Plan) for its employees. The cost of providing benefits is determined using the Projected Unit Credit Method, with actuarial valuations being carried out at the end of each reporting period (stated in note 8). The future payments of employee benefits may differ from the estimated amounts due to deviations from the assumptions used.
(g) Taxation The Institute being recognised as an organisation of national character in Guyana has been granted tax exempt
status under the Income Tax Act. This was passed via regulation no 7 of 1986 of the Income Tax Act on August 14, 1986 by the Minister of Finance. As such taxation and deferred tax are not considered in the preparation of these financial statements.
(h) Property, plant and equipment Freehold land and buildings are held for use in the supply of services and for administrative purposes and are stated in the statement of financial position at cost less any subsequent accumulated depreciation and subsequent accumulated impairment losses.
Office furniture, fixtures and fittings, office machinery and equipment, motor vehicles and computer software are held for the use in the supply of services and for administrative purposes and are stated in the statement of financial position at cost less any subsequent accumulated depreciation and subsequent accumulated impairment losses.
Depreciation of property, plant and equipment is calculated on the straight line method at rates sufficient to write off the cost or valuation of these assets to their residual values over their estimated useful lives as follows:
NOTES TO THE FINANCIAL STATEMENTS

ANNUAL REPORT 2013
INSTITUTE OF PRIVATE ENTERPRISE DEVELOPMENT LTD.
26
3. SUMMARY OF SIGNIFICANT ACCOUNTING POLICIES (CONT'D)
(h) Property, plant and equipment (cont'd)
Building - 2% Office furniture - 15% Fixtures and fittings - 15% Office machinery and equipment - 20% Motor vehicles - 25%
Computers and Software - 25%
Assets are reviewed for impairment whenever there is objective evidence to indicate that the carrying amount of an asset is greater than its estimated recoverable amount. The excess of the carrying amount above the recoverable amount is written off to the profit or loss.
The gain or loss arising on the disposal or retirement of an item of fixed assets is determined as the difference
between the sales proceeds and the carrying amount of the asset and is recognized in profit or loss.
(i) Intangible asset Intangible assets acquired separately are carried at cost less accumulated amortisation and accumulated
impairment losses. Amortisation is recognised over a straight line basis over their useful lives. The estimated useful lives and amortization method are reviewed at the end of each annual reporting period.
(j) Inventories Inventories are valued at the lower of cost and net realizable value based on the first-in-first-out method. (k) Provisions Provisions are recognised when the Institute has a present obligation (legal or constructive) as a result of a past
event, it is probable that the Institute will be required to settle the obligation, and a reliable estimate can be made of the amount of the obligation.
The amount recognised as provision is the best estimate of the consideration required to settle the present obligation at the reporting date, taking into account the risks and uncertainties surrounding the obligation. Where a provision is measured using the cash flow estimated to settle the present obligation, its carrying amount is the present value of those cash flows.
When some or all of the economic benefits required to settle a provision are expected to be recovered from a third party, the receivable is recognised as an asset if it is virtually certain that the reimbursement will be received and the amount of the receivable can be measured reliably.
(l) Financial assets Investments are recognized and derecognized on trade date where the purchase or sale of an investment is under a contract whose terms require delivery of the investment within the timeframe established by the market concerned, and are initially measured at fair value, plus transaction costs.
Financial assets held by the Institute are classified into the following specified categories 'held to maturity investments; ‘cash resources’; and 'loans and receivables' and are stated at amortised cost. The classification depends on the nature and purpose of the financial assets and is determined at the time of initial recognition.
(m) Effective interest method The effective interest method is a method of calculating the amortised cost of a financial asset and allocating interest income over the relevant period. The effective interest rate is the rate that exactly discounts the estimated future cash receipts (including all fees on points paid or received that form an integral part of the effective interest rate, transaction costs and other premiums or discounts) through the expected life of the financial asset, or, where appropriate, a shorter period.
Income is recognised on an effective interest basis for 'held to maturity' investment only.
NOTES TO THE FINANCIAL STATEMENTS

ANNUAL REPORT 2013
INSTITUTE OF PRIVATE ENTERPRISE DEVELOPMENT LTD.
27
3. SUMMARY OF SIGNIFICANT ACCOUNTING POLICIES (CONT'D)
(n) Investments Investments are recognised in the financial statements to comply with International Accounting Standards. The company investments have been classified as "Investments held to maturity"
"Investments held to maturity" are carried at amortised cost. Any gain or loss on these investments is recognised in the profit and loss when the asset is de-recognised or impaired.
(o) Loans receivable Loans to customers that have fixed or determinable payments and which are not quoted in active market, are classified as loans and receivables. Loans and receivables are measured at amortised cost using the effective interest method, less any impairment. Interest income is recognised when installments are paid.
Loans receivable are recognized when cash is advanced to borrowers and are derecognized when borrowers repay their obligations or when written off.
Classification The Institute does not fall under the prescriptions of the Financial Institutions Act of 1995 but follows closely the principles as set out therein and as such has classified its loans into the following categories;
Grade 1 – Loans demonstrating financial condition, risk factors and capacity to repay that are good to excellent. This generally reflect accounts which are not impaired and are up to date in repayments or operating within approved limits as per the Institute’s policy guidelines.
Grade 2 – Represents satisfactory risk and includes credit facilities which require closer monitoring or which operate outside product guidelines, or which require various degrees of special attention, where the collateral is not fully in place; where current market conditions are affecting a sector or industry; and that are progressively between 30 and 90 days past due.
Grade 3 – Represents loans for which principal and interest is due and unpaid between 90 and 179 days or, where interest charges for three to five months have been capitalized for reasons such as primary source of repayment has become insufficient, and where appropriate, mortgages in arrears by greater than 90 days where the value of the collateral is sufficient to repay both principal and interest in the event the account is identified for recovery action.
Grade 4 – Represents loans accounts which are considered uncollectible between 180-365 days or for which the collection of the full debt is improbable; accounts which have shown little or no improvement over the twelve months period prior to its present classification; principal or interest is due and unpaid for twelve months or more; or an account which may have some recovery value but is not considered practical nor desirable to defer write-off, for example: where litigation becomes protracted.
Non-performing loans For individually assessed accounts, loans are required to be designated as non-performing as soon as there is objective evidence that an impairment loss has been incurred. Objective evidence of impairment includes observable data such as when contractual payments of principal or interest are 365 days overdue.
Loan amounts reported as past due are reclassified and reported as non performing when: (i) Loans Principal or interest is due and unpaid for twelve months or more, or
(ii) Interest charges for twelve months or more have been capitalised, refinanced or rolled over.
NOTES TO THE FINANCIAL STATEMENTS

ANNUAL REPORT 2013
INSTITUTE OF PRIVATE ENTERPRISE DEVELOPMENT LTD.
28
3. SUMMARY OF SIGNIFICANT ACCOUNTING POLICIES (CONT'D)
(o) Loans receivable (cont'd)
Loan LossesA loan is classified as loss where one or more of the following conditions apply.
(i) An account is considered uncollectible (ii) An account classified as doubtful with little or no improvement over the twelve month period. (iii) The unsecured portion of a loan with fixed repayment dates when:-
1) Principal or interest is due and unpaid for twelve months or more, or 2) Interest charges for twelve months or more have been capitalized, refinanced or rolled over.
Collateral It is the Institute’s policy that all facilities are fully and tangibly secured. However, under the Micro Loan scheme, loans are issued against Bills of Sale over moveable assets, which are not considered as tangible collateral; hence these facilities can be considered as unsecured.
Loan Provisioning It is the Institute’s policy to provide for impaired loans in accordance with Institute’s past experience with delinquent loans.
Appropriate allowances for estimated unrecoverable amounts are recognised in the profit and loss when there is objective evidence that the loan is impaired. The allowance is recognised based on management’s evaluation of the collectability of each individual or collectively assessed loan.
Upon classification of a loan to a non-accrual status, interest is not taken up in income on an accrual basis. In subsequent periods, interest is only recognised to the extent payments are received.
Provisioning for each classification category is made based on the following minimum level:
Classification Level of Provision Grade 1 0% Grade 2 0% Grade 3 0-20% Grade 4 50% Non Performing 100%
Renegotiated loans A renegotiated facility may be a facility which has been refinanced, rescheduled, hived off, rolled over, or
otherwise modified because of weaknesses in the borrower’s financial position or the non servicing of the debt as arranged, where it has been determined by the institute that the terms of the renegotiated loan are such as to remedy the specific difficulties faced by the borrower.
A credit facility may also be renegotiated upon the request by the client, followed by a subsequent analysis
and approval by the Institute's approving committee; which may be due to the occurrence of one or both of the following conditions:
- The merging of total credit liabilities into one credit facility.
- The refinancing of a loan to facilitate the accessing of additional finance.
NOTES TO THE FINANCIAL STATEMENTS

ANNUAL REPORT 2013
INSTITUTE OF PRIVATE ENTERPRISE DEVELOPMENT LTD.
29
3. SUMMARY OF SIGNIFICANT ACCOUNTING POLICIES (CONT'D)
(o) Loans receivable (cont'd)
Renegotiated loans (cont'd) Renegotiated credit facilities are permitted subject to the following condition:
- The existing financial position of the borrower can service the debt under the new conditions.
- An account classified as doubtful or loss shall not be renegotiated unless upfront cash payment is made to cover, at-least, unpaid interest or there is an improvement in the collateral taken which will make the renegotiated account, including unpaid interest, a well secured account.
- A commercial facility shall not be renegotiated more than twice over the life of the original facility
and mortgage or personal loans not more than twice in a five year period.
- A renegotiated facility shall not be classified upward for a minimum of one year following the new arrangements.
(p) Impairment of financial assets Financial assets are assessed for indicators of impairment at the end of each reporting period. Financial assets
are impaired where there is objective evidence that, as a result of one or more events that occurred after initial recognition of the financial asset, the estimated future cash flows of the investment have been impacted.
For financial assets, objective evidence of impairment could include:
- default or delinquency in interest or principal payments; or - it is becoming probable that the borrower will enter bankruptcy or financial re-organisation. - Cash flow difficulties experienced by the borrower. - Breach of loan covenants or condition - Deterioration of the borrower's competitive position - Deterioration in the value of the collateral - Downgrading of the asset
For certain categories of financial asset, such as loan receivables, assets that are assessed not to be impaired individually are subsequently assessed for impairment on a collective basis. Objective evidence of impairment for a portfolio of receivables could include the Institute's past experience of collecting payments, an increase in the number of delayed payments in the portfolio past the average credit period of 180 days, as well as observable changes in national or local economic conditions that correlate with default on receivables.
For financial assets carried at amortised cost, the amount of the impairment is the difference between the assets carrying amount and the present value of the estimated future cash flows, discounted at the financial asset's original effective interest rate.
The carrying amount of the financial asset is reduced by the impairment loss directly for all financial assets with the exception of loans receivables, where the carrying amount is reduced through the use of an allowance account. When a loan receivable is considered uncollectible, it is written off against the allowance account. Subsequent recoveries of amounts previously written off are credited against the allowance account. Changes in the carrying amount of the allowance account are recognized in statement of income.
In a subsequent period, if the amount of impairment loss decreases and the decrease can be related objectively to an event occurring after the impairment was recognised, the previously recognised impairment loss is reversed through profit or loss to the extent that the carrying amount of the investment at the date the impairment is reversed does not exceed what the amortised cost would have been had the impairment not been recognised.
NOTES TO THE FINANCIAL STATEMENTS

ANNUAL REPORT 2013
INSTITUTE OF PRIVATE ENTERPRISE DEVELOPMENT LTD.
30
3. SUMMARY OF SIGNIFICANT ACCOUNTING POLICIES (CONT'D)
(q) Impairment of tangible assets At the end of each reporting period, the Institute reviews the carrying amounts of its tangible assets to
determine whether there is any indication that those assets have suffered an impairment loss. If any such indication exists, the recoverable amount of the asset is estimated in order to determine the extent of the impairment loss (if any). Where it is not possible to estimate the recoverable amount of an individual asset, the Institute estimates the recoverable amount of the cash-generating unit to which the asset belongs.
Recoverable amount is the higher of fair value less costs to sell and value in use. If the recoverable amount of an asset is estimated to be less than its carrying amount, the carrying amount of the asset is reduced to its recoverable amount. An impairment loss is recognized immediately in statement of income, unless the relevant asset is carried at a revalued amount, in which case the impairment loss is treated as a revaluation decrease.
(r) Derecognition of Financial assets The Institute derecognises a financial asset only when the contractual rights to the cash flows from the asset expire; or it transfers the financial asset and substantially all the risks and rewards of ownership of the asset to another entity. If the Institute neither transfers nor retains substantially all the risks and rewards of ownership and continues to control the transferred asset, the Institute recognises its retained interest in the asset and an associated liability for amounts it may have to pay. If the Institute retains substantially all the risks and rewards of ownership of a transferred financial asset, the Institute continues to recognise the financial asset and also recognises a collateralised borrowing for the proceeds received.
(s) Financial liabilities The Institute financial liabilities are classified as other financial liabilities.
(t) Classification as debt or equity Debt and equity instruments are classified as either financial liabilities or as equity in accordance with the
substance of the contractual arrangement.
Other financial liabilities, including borrowings, are initially measured at fair value, net of transaction costs. Other financial liabilities are subsequently measured at amortised cost using the effective interest method, interest expense recognised on an effective yield basis.
The effective interest method is a method of calculating the amortised cost of a financial liability and of
allocating interest expense over the relevant period. The effective interest rate is the rate that exactly discounts estimated future cash payments through the expected life of the financial liability, or where appropriate, a shorter period.
The Institute derecognizes financial liabilities when the Institute obligations are discharged, cancelled or they expire.
(u) Cash and cash equivalents Cash and cash equivalents are held for the purpose of meeting short-term cash commitments rather than investments or other purposes. These are readily convertible to known amounts of cash, with maturity dates three (3) months or less.
(v) Business reporting divisions A business segment is a component of an entity that is engaged in providing products or services that are
subject to risks and returns that are different from those of other business segments. A geographical segment is engaged in providing products or a service within a particular economic environment that are subject to risks and returns that are different from those of segments operating in other economic environments.
The Institute’s operations are considered a single business unit with certain activities segmented.
NOTES TO THE FINANCIAL STATEMENTS

ANNUAL REPORT 2013
INSTITUTE OF PRIVATE ENTERPRISE DEVELOPMENT LTD.
31
4. CRITICAL ACCOUNTING JUDGEMENTS AND KEY SOURCES OF ESTIMATION UNCERTAINTY
In the application of the Institute’s accounting policies, which are described in note 3, the directors are required to make judgements, estimates and assumptions about the carrying amounts of assets and liabilities that are not readily apparent from other sources. The estimates and associated assumptions are based on historical experience and other factors that are considered to be relevant. Actual results may differ from these estimates.
The estimates and underlying assumptions are reviewed on an ongoing basis. Revisions to accounting estimates are recognised in the period in which the estimate is revised if the revision affects only that period or in the period of the revision and future periods if the revision affects both current and future periods.
Key sources of estimation uncertainty
The following are the key assumptions concerning the future, and other key sources of estimation uncertainty at the reporting date, that have a significant risk of causing a material adjustment to the carrying amounts of assets and liabilities in the financial statements:
i) Impairment losses on loan receivables On a regular basis, management reviews receivables to assess impairment. Based on information available certain judgments are made that reflects the Institute’s assessment of several critical factors that can influence future cash flows.
ii) Useful lives of property and equipment and intangible assets
Management reviews the estimated useful lives of property, plant and equipment and intangible assets at the end of each year to determine whether the useful lives of property, plant and equipment and intangible assets should remain the same.
iii) Defined benefit asset The provisions for defined benefit asset are determined by the actuary based on data provided by management. The computation of the provisions by the actuary assumes that the data provided is not materially misstated.
2013 2012 G$ G$ 5. INVESTMENT INCOME
Cash resources 1,453,351 4,768,712
Held to maturity investments 17,086,556 14,030,223
18,539,907 18,798,935 6. OTHER INCOME
Recoveries on loans previously written off 15,710,954 14,597,580 Fees- ICM courses 15,187,485 17,534,310 Others 12,877,519 6,142,655
43,775,958 38,274,545
NOTES TO THE FINANCIAL STATEMENTS

ANNUAL REPORT 2013
INSTITUTE OF PRIVATE ENTERPRISE DEVELOPMENT LTD.
32
2013 2012 G$ G$
7. SURPLUS OF REVENUE OVER EXPENDITURE 230,841,721 215,974,201
After charging: Loan impairment 5,486,077 -
Depreciation and amortisation 19,896,255 16,886,531 Employment cost (a) 193,079,220 168,267,306 Auditors' remuneration (b) 745,500 710,000
(a) Employment cost: Salaries and wages 168,070,724 144,300,903
Other staff costs 13,754,262 14,384,835 Pension 11,254,234 9,581,568
193,079,220 168,267,306
(b) Auditors' remuneration Audit services 745,500 710,000
No directors' emoluments were paid
8. DEFINED BENEFIT ASSET
The Institute participates in a defined benefit plan (Demerara Distillers Limited Pension Plan) for its employees. The contributions are held in trustee administered funds which are separate from the Institute's resources. Eighty three (2012- sixty seven) employees participate in the plan.
During the year, the Institute's contribution to the scheme was G$11,424,000 (2012 -G$9,825,000).
The most recent actuarial valuation of the plan assets and the present value of the defined benefit obligation were carried out as at 31 December 2011 by Bacon Woodrow & de Souza Limited. The present valuation of the defined
benefit obligation and the related current service cost were measured at 31 December 2013 using the Projected Unit Credit Method.
2013 2012 G$ G$ Amounts in the statement of financial position:
Defined benefit obligation 148,036,000 118,335,000
Fair value of plan assets (222,757,000) (190,305,000)
(74,721,000) (71,970,000) Effect of asset ceiling - -
Net Defined benefit asset (74,721,000) (71,970,000)
NOTES TO THE FINANCIAL STATEMENTS

ANNUAL REPORT 2013
INSTITUTE OF PRIVATE ENTERPRISE DEVELOPMENT LTD.
33
8. DEFINED BENEFIT ASSET (CONT'D) 2013 2012 G$ G$ Reconciliation of amount recognised in the statement of financial position:
Movement in Present Value of defined benefit obligation Defined benefit obligation at start 118,335,000 102,763,000
Service cost 11,378,000 9,786,000 Interest cost 5,915,000 5,117,000 Members' contributions 4,199,000 3,612,000 Re-measurements
Experience adjustments 8,283,000 (2,074,000) Benefits paid (74,000) (869,000)
148,036,000 118,335,000
Change in Plan assets Plan assets at start of year 190,305,000 119,636,000
Expected return on plan assets 9,899,000 6,292,000 Return on Plan assets, excluding interest income 7,004,000 51,809,000 Company contributions 11,424,000 9,825,000 Members' contributions 4,199,000 3,612,000 Benefits paid (74,000) (869,000)
222,757,000 190,305,000
Asset allocation as at 31 December: Guyanese and Regionally listed equities 101,274,000 85,401,000
Overseas equities (developed markets) 15,008,000 11,689,000 Regional bonds 21,318,000 26,360,000 Developed Market bonds 14,258,000 17,059,000 Emerging Market bonds 35,182,000 24,322,000 Cash and cash equivalents 25,039,000 25,474,000 Mortgage mutual fund 10,678,000 - Total 222,757,000 190,305,000
NOTES TO THE FINANCIAL STATEMENTS

ANNUAL REPORT 2013
INSTITUTE OF PRIVATE ENTERPRISE DEVELOPMENT LTD.
34
2013 2012 2011 2010 2009 G$ G$ G$ G$ G$Experience History Defined benefit obligation 148,036,000 118,335,000 102,763,000 88,116,000 68,318,000 Fair value of plan asset (222,757,000) (190,305,000) (119,636,000) (99,597,000) (83,194,000) Surplus (74,721,000) (71,970,000) (16,873,000) (11,481,000) (14,876,000) Experience adjustment on plan liabilities 8,283,000 (2,074,000) (1,674,000) 4,816,000 (1,393,000) Experience adjustment on plan assets 7,004,000 51,809,000 2,569,000 91,000 2,353,000
NOTES TO THE FINANCIAL STATEMENTS
8. DEFINED BENEFIT ASSET (CONT'D) 2013 2012 G$ G$ Expense Recognised in Statement of Income
Current service cost 11,378,000 9,786,000 Net interest on net defined benefit liability/(asset) (3,984,000) (1,175,000)
Net Pension Cost 7,394,000 8,611,000
Re-measurements recognised in other comprehensive income Experience (gains/losses 1,279,000 (53,883,000)
Total amount recognised in other comprehensive income 1,279,000 (53,883,000)
Reconciliation of opening and closing Statement of Financial Position Defined benefit asset at prior year end (71,970,000) (10,118,000)
Unrecognised Gain charged to retained earnings - (6,755,000) Opening defined benefit asset (71,970,000) (16,873,000) Net Pension Cost 7,394,000 8,611,000 Re-measurements recognised in Other Comprehensive Income 1,279,000 (53,883,000) Contributions Paid (11,424,000) (9,825,000) Closing Defined Benefit Asset
(74,721,000) (71,970,000)

ANNUAL REPORT 2013
INSTITUTE OF PRIVATE ENTERPRISE DEVELOPMENT LTD.
35
8. DEFINED BENEFIT ASSET (CONT'D)
NOTES TO THE FINANCIAL STATEMENTS
2013 2012 Per Per annum annum Principal actuarial assumptions used: % %Discount rate 5 5Rate of salary increases 5 5Future pension increases 2 2 The pension scheme does not directly hold any of the assets of the company. Life expentancy at age 60 for current pensioner in years Male 18 18 Female 22.5 22.5 Life expentancy at age 60 for current members age 40 in years Male 18.7 18.7 Female 23.4 23.4 Sensitivity Analysis 1% pa increase 1% pa increase The impact on profit of changes in the assumptions used $ million $ millionDiscount rateFuture salary increases 37,978,000 (28,088,000) (13,083,000) 13,083,000
An increase of 1 year in the assumed life expectancies shown above would increase the defined benefit obligation at 31 December 2013 by $2,947,000. The pension scheme does not directly hold any of the assets of the company.

ANNUAL REPORT 2013
INSTITUTE OF PRIVATE ENTERPRISE DEVELOPMENT LTD.
36
9. PROPERTY, PLANT AND EQUIPMENT
Furniture, Land and Motor fixtures and Office Computer Work in buildings vehicles fittings machinery equipment Progress Total
G$ G$ G$ G$ G$ G$ G$Cost
At 1 January 2013 119,257,224 50,905,721 18,289,469 48,697,882 52,950,268 - 290,100,564 Additions - 791,002 4,752,345 3,072,930 28,124,720 2,614,590 39,355,587 Reclassification - - 644,138 (971,937) 327,799 - - Adjustment - - (130,280) (110,000) - - (240,280) At 31 December 2013 119,257,224 51,696,723 23,555,672 50,688,875 81,402,787 2,614,590 329,215,871 Depreciation
At 1 January 2013 28,008,182 31,116,751 14,020,250 41,757,425 48,831,577 - 163,734,185 Charge for the year 2,157,736 7,383,801 1,415,308 3,259,585 5,338,278 - 19,554,708 Reclassification - - 644,138 (871,389) 227,251 - - Adjustment - - (14,657) (13,750) (23,343) - (51,750)
At 31 December 2013 30,165,918 38,500,552 16,065,039 44,131,871 54,373,763 - 183,237,143
Net book values:
At 31 December 2013 89,091,306 13,196,171 7,490,633 6,557,004 27,029,024 2,614,590 145,978,728
At 31 December 2012 91,249,042 19,788,970 4,269,219 6,940,457 4,118,691 - 126,366,379
Certain land and buildings are held as security for loan from Demerara Bank Limited.
NOTES TO THE FINANCIAL STATEMENTS
10. INTANGIBLE ASSET 2013 2012 G$ G$ Cost At 1 January 30,002,298 30,002,298 Additions 567,312 -
At 31 December 30,569,610 30,002,298
Amortisation At 1 January 29,644,458 29,088,958
Charge for the year 393,297 555,500
At 31 December 30,037,755 29,644,458
Net book value: At 31 December 531,855 357,840
The intangible asset represents a payment for the development and implementation of the Institute's MIS system and is being amortised over a period of four years.

ANNUAL REPORT 2013
INSTITUTE OF PRIVATE ENTERPRISE DEVELOPMENT LTD.
37
11. LOANS RECEIVABLE 2013 2012 G$ G$ Gross loans 2,573,975,299 2,238,847,997 Less impairment allowance (a) (46,117,487) (45,977,907)
2,527,857,812 2,192,870,091 Non- current loans receivable 826,019,536 548,826,897 Current loans receivable 1,701,838,276 1,644,043,193
2,527,857,812 2,192,870,091
Non-performing loans receivable 46,117,487 45,977,907 Performing loans receivable 2,481,740,325 2,146,892,184
2,527,857,812 2,192,870,091 (a) Impairment allowances
Individually assessed impairment At 1 January 45,977,907 48,874,851
Provision for the year 5,486,077 - Bad debts written off (5,346,497) (2,896,945)
46,117,487 45,977,907
Loans are carried at amortised cost subject to a test for impairment. Interest rates ranged from 5% to 41.6% and terms of repayments from 3 months to 5 years.
The undiscounted fair value of collateral that the Institute holds relating to loans individually determined to be impaired at December 31, 2013 amounted to $46m (2012: $46m). The collateral consists of cash, securities and properties.
Collateral realised During the year, the Institute realised collateral amounting to $5,151,528,000 (2012: $903,000)
12. OTHER RECEIVABLES AND PREPAYMENTS 2013 2012 G$ G$ Debtors 34,025,866 5,035,104 Prepayments 7,928,638 11,757,658 Others 12,313,967 7,015,841
54,268,471 23,808,603 13. INVESTMENTS
(a) Bonds 161,882,619 251,166,502 These are made up as follows:
Held to maturity investments
Government bonds 93,459,279 86,893,373 Private entity bonds (unsecured) 68,423,340 164,273,129
161,882,619 251,166,502 (b) Cash resources 189,844,410 89,939,308 Total investments 351,727,029 341,105,810
The bonds are held as security for Demerara Bank Limited loan.
NOTES TO THE FINANCIAL STATEMENTS

ANNUAL REPORT 2013
INSTITUTE OF PRIVATE ENTERPRISE DEVELOPMENT LTD.
38
14. CASH RESOURCES 2013 2012 G$ G$ Cash 751,000 557,000
At banks 117,323,829 83,868,146 Government of Guyana IFAD project (i) 69,845,118 63,550,420
187,919,947 147,975,566
(i) This represents money received from the Government of Guyana to be disbursed to poor rural households especially small- scale producers and vulnerable groups to improve their living conditions and their human, social and financial assets.
15. MEMBERS' SUBSCRIPTIONS 2013 2012 G$ G$
At 1 January and 31 December 32,500 32,500
Members' subscriptions represent contributions by members towards the capital of the company. Only the original subscribers and trustees appointed on their behalf have voting rights. No dividend is paid to any member due to the non profit nature of the Institute.
16. CAPITAL DONATIONS 2013 2012
G$ G$ At 1 January and 31 December 256,465,233 256,465,233
Capital donations received are used to extend credit to micro enterprises for the purpose of providing support
to increase the productivity and employment generation of the micro enterprise sector. These donations are not repayable to the donor agencies.
17. LOANS PAYABLE 2013 2012 Amount G$ G$ Committed
(i) IADB 12,186,556 13,027,098 SFR 375,000 (ii) EIB 15,695,841 23,348,555 ECU 698,090 (iii) DBL 299,746,331 203,166,666 GYD 335,000,000
327,628,728 239,542,319
Repayments due within one year 37,383,365 35,826,593
Repayments due within two to five years 219,240,661 128,391,356 Repayments due after five years 71,004,702 75,324,370
290,245,363 203,715,726
327,628,728 239,542,319
NOTES TO THE FINANCIAL STATEMENTS

ANNUAL REPORT 2013
INSTITUTE OF PRIVATE ENTERPRISE DEVELOPMENT LTD.
39
17. LOANS PAYABLE (CONT'D)
(i) Inter-American Development Bank loan of 375,000 Swiss Francs was fully drawn down as at 31 December 1993. The loan is repayable not later than 16 January 2028 by 60 semi-annual consecutive, and as far as possible equal installments beginning on 16 July 1998.
Commission of 1% is payable semi annually on 16 January and 16 July each year beginning 6 months after the disbursements of the loan. The term of the IADB/IPED agreement require that this loan is repayable in Guyana dollars at the rate of exchange agreed by the Bank of Guyana at the date of disbursement.
(ii) European Investment Bank loan of 500,000 ECU was fully drawn down at 31 December 2000. The loan is repayable in 10 equal annual installments commencing 31 March 2001. A further loan was approved on November 22, 2000 for 500,000 Euro for which only 174,771 Euro was drawn down. This loan is repayable in ten annual installments commencing December 2006. Interest is payable annually in arrears at the rate of 2% per annum.
(iii) Demerara Bank Limited Term Loan of G$410,000,000 and to be disbursed in three phases, two in 2012 (September and December ) for a total of GYD 210,000,000 and the balance of GYD 200,000,000 to be disbursed in the year 2013. This loan is repayable over fifteen (15) years in equal monthly installments of GYD 3,460,000.00, commencing 30th October, 2012 and 30th monthly thereafter, in full by 30th September, 2027.
This loan is secured by bonds, money market account and certain properties in the name of the Institute of Private Enterprise Development Limited.
18. OTHER PAYABLES AND ACCRUALS 2013 2012 G$ G$
EIB loan interest 128,639 57,200 Accruals 21,512,006 19,489,402 Collateral Improvement scheme (i) 172,237,088 150,647,568 Internal Indemnity Fund (ii) 13,455,415 15,243,146 Miscellaneous 2,869,937 3,147,570 Government of Guyana IFAD project (iii) 85,010,746 63,558,600
295,213,831 252,143,486 (i) This represents cash collateral held for loans issued and will be refunded when customers repay their loan. Interest rate of 2%.
At 1 January 150,647,568 144,479,919 Increase during the year 21,589,520 6,167,649
At 31 December 172,237,088 150,647,568 (ii) This represents provision for contingencies.
(iii) This represents monies received from the Government of Guyana for consultancy services for the management of the Enterprise Development Fund for the Rural Enterprise and Agricultural Development Project.
NOTES TO THE FINANCIAL STATEMENTS

ANNUAL REPORT 2013
INSTITUTE OF PRIVATE ENTERPRISE DEVELOPMENT LTD.
40
19. RELATED PARTY
Parties are considered to be related if one party has the ability to control the other party or exercise significant influence over the other party in making financial or operational decisions.
Listed below are transactions and balances with related parties: (i) Compensation for key management personnel
The company's key management personnel is 5 (2012 - 6) and comprises its Chief Executive Officer, Credit
Manager, Finance Manager, Administrative Manager/Company Secretary and the EDC Manager.
2013 2012 G$ G$ The remuneration paid to key management personnel during the year were as follows:
Short term employee benefits 40,020,452 38,822,649 Post-employment benefits 3,544,890 2,838,856
43,565,342 41,661,505 No directors' emoluments were paid during the year.
(ii) The following balances were held with entities which share common chairmanship and some directors.
Trust Company Guyana Limited Investment account 351,727,029 341,105,810
Investments fees paid 1,081,893 15,400
Demerara Bank Limited Deposit accounts 71,384,007 64,967,306
Overdraft 76,969,857 -
Loan 299,746,331 203,166,666 Guyana Youth Business Trust. Receivables 34,025,866 5,035,104
NOTES TO THE FINANCIAL STATEMENTS

ANNUAL REPORT 2013
INSTITUTE OF PRIVATE ENTERPRISE DEVELOPMENT LTD.
41
20. ANALYSIS OF FINANCIAL ASSETS AND LIABILITIES BY MEASUREMENT BASIS
Other Financial Assets and Loans and Liabilities at Held to Maturity Receivables Amortised cost Total 2013 G$ G$ G$ G$ ASSETS
Investment 161,882,619 - 189,844,410 351,727,029 Loan receivables - 2,527,857,812 - 2,527,857,812 Other receivables and prepayments - 54,268,471 - 54,268,471 Cash resources - - 187,919,947 187,919,947
Total Assets 161,882,619 2,582,126,283 377,764,357 3,121,773,259
LIABILITIES
Loans payables - - 327,628,728 327,628,728 Other payables - - 273,701,824 273,701,824 Accruals - - 21,512,006 21,512,006 Bank overdraft - - 76,969,857 76,969,857
Total Liabilities - - 699,812,415 699,812,415
2012 ASSETS
Investment 251,166,502 - 89,939,308 341,105,810 Loan receivables - 2,192,870,091 - 2,192,870,091 Other receivables and prepayments - 23,808,603 - 23,808,603 Cash resources - - 147,975,566 147,975,566
Total Assets 251,166,502 2,216,678,694 237,914,874 2,705,760,070
LIABILITIES
Loans payables - - 239,542,319 239,542,319 Other payables - - 232,654,084 232,654,084 Accruals - - 19,489,402 19,489,402
Total Liabilities - - 491,685,805 491,685,805
NOTES TO THE FINANCIAL STATEMENTS

ANNUAL REPORT 2013
INSTITUTE OF PRIVATE ENTERPRISE DEVELOPMENT LTD.
42
21. FINANCIAL RISK MANAGEMENT Objectives Risk is inherent in the Institute's activities but is managed through a process of ongoing identification, measurement and monitoring subject to risk limits and other controls. The process of risk management is critical to the Institute's continued growth and performance. The Institute is exposed to liquidity risk, credit risk, operating risk and market
risk. Risk management structure The Board of Directors is ultimately responsible for identifying and controlling risks; however, there are separate
independent bodies responsible for managing and monitoring risk.
Board credit and investment committee This committee is comprised of six (6) Non Executive Directors. The committee is responsible for the approval of all credits and investments over limits delegated to management. The committee also reviews the amount, nature, risk characteristics and concentration of the Institute's credit and investment portfolio and ensures appropriate responses to changing conditions.
Internal audit Risk management processes throughout the Institute are audited by the internal audit function that examines
both the adequacy of the procedures and the Institute's compliance with the procedures. Internal Audit discusses the results of all Assessments with management, and reports its findings and recommendations to the Board Audit Committee.
Risk measurement and reporting systems
The Institute's risks are measured using methods which reflect the expected loss likely to arise in normal circumstances.
Monitoring and controlling risks is primarily performed based on limits established by the Board. These limits
reflect the business strategy and market environment of the Institute as well as the level of risk that the Company is willing to accept, with additional emphasis on selected industries and geographies.
Information compiled from all the business units is examined and processed in order to analyze, control and identify risks early. This information which consists of several reports is presented and explained to the Board of Directors and Board Committees on a monthly basis.
(a) Market risk The Institute's activities expose it to the financial risks of changes in foreign currency exchange rates and
interest rates. The Institute uses interest rate sensitivity and exposure limits to financial instruments to manage its exposure to interest rate and foreign currency risk.
There has been no change in the Institute's exposure to market risks or the manner in which it manages these risks.
(i) Interest rate sensitivity analysis. The sensitivity analyses below have been determined based on the exposure to interest rates for all
financial instruments at the end of the reporting period.The analysis is prepared assuming the amounts of the financial instruments at the end of the reporting period was in existence throughout the whole year. A 50 basis point increase or decrease is used when reporting interest rate risk internally to key management personnel and represents management's assessment of the reasonably possible change in interest rates.
If interest rates had been 50 basis points higher/lower and all other variables were held constant, the
Institute's profit for the year ended 31 December 2013 would increase/decrease by G$7,141,703 (2012: G$6,824,613). This is mainly attributable to the Institute's exposure to interest rates on its variable rate borrowings and balances at banks.
NOTES TO THE FINANCIAL STATEMENTS

ANNUAL REPORT 2013
INSTITUTE OF PRIVATE ENTERPRISE DEVELOPMENT LTD.
43
21. FINANCIAL RISK MANAGEMENT (CONT'D)
(a) Market risk (cont'd)
(i) Interest rate sensitivity analysis. (cont'd) The Institute's sensitivity to interest rates has increased during the current period mainly due to the
increase in cash at bank and reduction in variable debts instruments. The institute's investments are not subject to interest rate sensitivity since they are held to maturity at a
fixed rate of interest.
(ii) Interest rate risk
Interest rate risk is the risk that the value of financial instruments will fluctuate due to changes in market interest rates. The Institute is exposed to various risks that are associated with the effects in interest rates. This impacts directly on its cash flows. The Institute's management continually monitors and manages these risks through the use of appropriate tools and implements relevant strategies to hedge against any adverse effects.
Interest Over Non-interest rate range On Demand Due in 3 mths Due 3 - 12 mths 2 to 5 years 5 years bearing Total % G$ G$ G$ G$ G$ G$ G$ Assets Investments 3%-10% 189,844,410 - - 51,287,340 110,595,279 - 351,727,029 Loans receivable 8%-40% 103,460,055 412,914,044 1,185,464,178 790,769,421 35,250,114 - 2,527,857,812 Other receivables and prepayments - - - - - 54,268,471 54,268,471 Cash resources 0%-2% 187,919,947 - - - - - 187,919,947 481,224,412 412,914,044 1,185,464,178 842,056,761 145,845,393 54,268,471 3,121,773,259 Liabilities Loans 1%-6% 8,493,258 - 28,890,107 219,240,661 71,004,702 - 327,628,728 Other payables and accruals - - - - - 295,213,830 295,213,830 Bank overdraft 7.5%-18% - - 76,969,857 - - - 76,969,857 8,493,258 - 105,859,964 219,240,661 71,004,702 295,213,830 699,812,415
Interest sensitivity gap 472,731,154 412,914,044 1,079,604,214 622,816,100 74,840,691 (240,945,359) 2,421,960,844
Maturing31-12-2013
Within 1 year
NOTES TO THE FINANCIAL STATEMENTS

ANNUAL REPORT 2013
INSTITUTE OF PRIVATE ENTERPRISE DEVELOPMENT LTD.
44
21. FINANCIAL RISK MANAGEMENT (CONT'D)
(a) Market risk (cont'd)
(ii) Interest rate risk (cont'd)
(iii) Foreign currency risk
The Institute is exposed to foreign currency risk due to fluctuations in exchange rates on balances that are denominated in foreign currencies.
The financial statements at 31 December include the following assets and liabilities denominated in
foreign currencies stated in the Guyana Dollar equivalent
2013 United States Dollars Euro G$ G$
Assets 285,668,109 - Liabilities - 15,695,841 Net assets / (liabilities) 285,668,109 (15,695,841)
2012
Assets 211,432,473 61,552,064 Liabilities - 23,348,555
Net assets 211,432,473 38,203,509
Interest Over Non-interest rate range On Demand Due in 3 mths Due 3 - 12 mths 2 to 5 years 5 years bearing Total % G$ G$ G$ G$ G$ G$ G$ Assets Investments 3%-10% 84,353,034 - - 112,839,404 143,913,372 - 341,105,810 Loans receivable 8%-40% 74,265,239 392,749,699 1,177,028,256 511,874,512 36,952,385 - 2,192,870,091 Other receivables and prepayments - - - - - - 23,808,603 23,808,603 Cash resources 0%-2% 147,975,566 - - - - - 147,975,566 306,593,839 392,749,699 1,177,028,256 624,713,916 180,865,757 23,808,603 2,705,760,070 Liabilities Loans 1%-6% 35,826,593 - - 128,391,356 75,324,370 - 239,542,319 Other payables and accruals - - - - - - 252,143,486 252,143,486 35,826,593 - - 128,391,356 75,324,370 252,143,486 491,685,805 Interest sensitivity gap 270,767,246 392,749,699 1,177,028,256 496,322,560 105,541,387 (228,334,883) 2,214,074,265
Maturing31-12-2012
Within 1 year
NOTES TO THE FINANCIAL STATEMENTS

ANNUAL REPORT 2013
INSTITUTE OF PRIVATE ENTERPRISE DEVELOPMENT LTD.
45
21. FINANCIAL RISK MANAGEMENT (CONT'D)
(a) Market risk (cont'd)
(iii) Foreign currency risk (cont'd) The following table details the company's sensitivity to a 2.5% increase and decrease in the Guyana dollar
against balances denominated in foreign currencies. The sensitivity analysis includes only outstanding foreign currency denominated monetary items and
adjusts their translation at the period end for a 2.5% change in foreign currency rates. A positive number indicates an increase in profit where foreign currencies strengthens 2.5% against the G$ for a 2.5% weakening of the foreign currencies against G$ there would be an equal and opposite impact on the profit, and the balances below would be negative.
2013 2012 G$ G$
Profit/(loss): Euro (392,396) 955,088
United States Dollars 7,141,703 5,285,812
(iv) Price risk Price risk is the risk that the value of financial instruments will fluctuate as a result of changes in market
prices whether those changes are caused by factors specific to the individual security of its issuer or factors affecting all securities traded in the market. Management continually identifies the risk and diversifies the portfolio in order to minimize the risk.
Other price risks The Institute is exposed to equity price risks arising from equity investments. Equity investments are held for strategic rather than for trading purposes. The Institute does not actively trade these investments.
Equity price sensitivity analysis The Institute is not exposed to price sensitivity anlaysis arising from its investments, since they are held
to maturity investments at fixed rates of interest.
NOTES TO THE FINANCIAL STATEMENTS

ANNUAL REPORT 2013
INSTITUTE OF PRIVATE ENTERPRISE DEVELOPMENT LTD.
46
21. FINANCIAL RISK MANAGEMENT (CONT'D) (b) Liquidity risk
Liquidity risk is the risk that the institute will encounter difficulty in raising funds to meet its commitments associated with financial instruments.
The Institute manages its liquidity risk by maintaining an appropriate level of resources in liquid or near liquid form. The following table shows the distribution of assets and liabilities by maturity:
Over On Demand Due in 3 mths Due 3 - 12 mths 2 to 5 years 5 years Total G$ G$ G$ G$ G$ G$ Assets Investments 189,844,410 - - 51,287,340 110,595,279 351,727,029 Loans receivable 103,460,055 412,914,044 1,185,464,178 790,769,421 35,250,114 2,527,857,812 Other receivables and prepayments - - 54,268,471 - - 54,268,471 Cash resources 187,919,947 - - - - 187,919,947 481,224,412 412,914,044 1,239,732,649 842,056,761 145,845,393 3,121,773,259 Liabilities Loans 8,493,258 - 28,890,107 219,240,661 71,004,702 327,628,728 Other payables and accruals - - 295,213,830 - - 295,213,830 Bank overdraft - - 76,969,857 - - 76,969,857 8,493,258 - 401,073,794 219,240,661 71,004,702 699,812,415 Net assets 472,731,154 412,914,044 838,658,855 622,816,100 74,840,691 2,421,960,844
Over On Demand Due in 3 mths Due 3 - 12 mths 2 to 5 years 5 years Total G$ G$ G$ G$ G$ G$ Assets Investments 84,353,034 - - 112,839,404 143,913,372 341,105,810 Loans receivable 74,265,239 392,749,699 1,177,028,256 511,874,512 36,952,385 2,192,870,091 Other receivables and prepayments - - 23,808,603 - - 23,808,603Cash resources 147,975,566 - - - - 147,975,566 306,593,840 392,749,699 1,200,836,859 624,713,916 180,865,757 2,705,760,070 Liabilities Loans 35,826,593 - - 128,391,356 75,324,370 239,542,319 Other payables and accruals - - 252,143,486 - - 252,143,486
35,826,593 - 252,143,486 128,391,356 75,324,370 491,685,805
Net assets 270,767,247 392,749,699 948,693,373 496,322,560 105,541,387 2,214,074,265
Maturing31-12-2013
Maturing31-12-2012
Within 1 year
Within 1 year
NOTES TO THE FINANCIAL STATEMENTS

ANNUAL REPORT 2013
INSTITUTE OF PRIVATE ENTERPRISE DEVELOPMENT LTD.
47
21. FINANCIAL RISK MANAGEMENT (CONT'D) (c) Credit risk Credit risk is the risk that financial loss arises from failure of customers or counter party to meet its obligations
under a contract. It arises principally from lending, and lesser extent from investment and cash resources. Risk associated with investments are managed by a sub committee of the Board as mentioned above.
IPED is a financial institution that offers non traditional credit facilities such as Micro and Small loans to entrepreneurs. Its focus is mainly on the poor and disadvantage groups. These types of loans, have a greater risk of default than those offered in the formal banking sector, since the factors that contribute to defaults are much more.
The Board is responsible for identifying, measuring and managing credit risk. The Board and its Credit Sub
Committee has approved standard policies and procedures necessary for adequate credit risk management. Since the core activity of the business is loans, credit risk management is always a top priority of Management and Staff. Compliance with credit policies and exposure limits is reviewed by the internal auditors on a continuous basis. These policies include but are not limited to:
Interviews are conducted for each client to obtain an overall impression of the applicant's ability to manage its finances and service the credit facility.
An appraisal or credit analysis is carried out for each client to assess the quality of the following
charactertics:
Character - Willingness and determination to meet obligations, integrity, stability, honesty, quality of past dealings, background and community standing.
Capacity - Project cash generating capabilities, applicants education, experience and ability to manage
cash /project.
Capital - Equity commitment by the borrower, leverage and use of total capital, emergency reserves of the owners.
Conditions - State of the economy, type of industry, political climate and prospects and social stability of the environment.
Collateral - Pledge by the borrower to complement the other characteristics. This is the secondary source
of paying of the loan. Collateral accepted are mortgages, bill of sales, guarantees, assignment of insurance policies,
assignment of proceeds, cash and promissory notes.
Further, every project is appraised for its viability and success by examining factors such as Product, Price, Place and Promotion. It is believed that once a project meets sound business standards, the risk of default will be low.
Prior to the processing of the client's application a field visit is made to the site of every project to correlate
information provided by the borrowers and other parties. During the visit, business counselors spend time in getting to know the client better and make assessments on the quality and value of the collateral being offered.
Once officers are satisfied that the business or project is viable the loan application will be prepared. All loans
are approved at two levels of management, whilst those above certain levels are approved by the Credit Committee or the Board.
The functions of disbursement and approval of loans are adequately segregated.
Generally, funds are not disbursed unless mortgages and bill of sales are duly executed in the High Court.
Prior to the disbursement of the loan a training session is held for each client on the full policies of the Institute and to help them appreciate the full content of their loan agreements.
NOTES TO THE FINANCIAL STATEMENTS
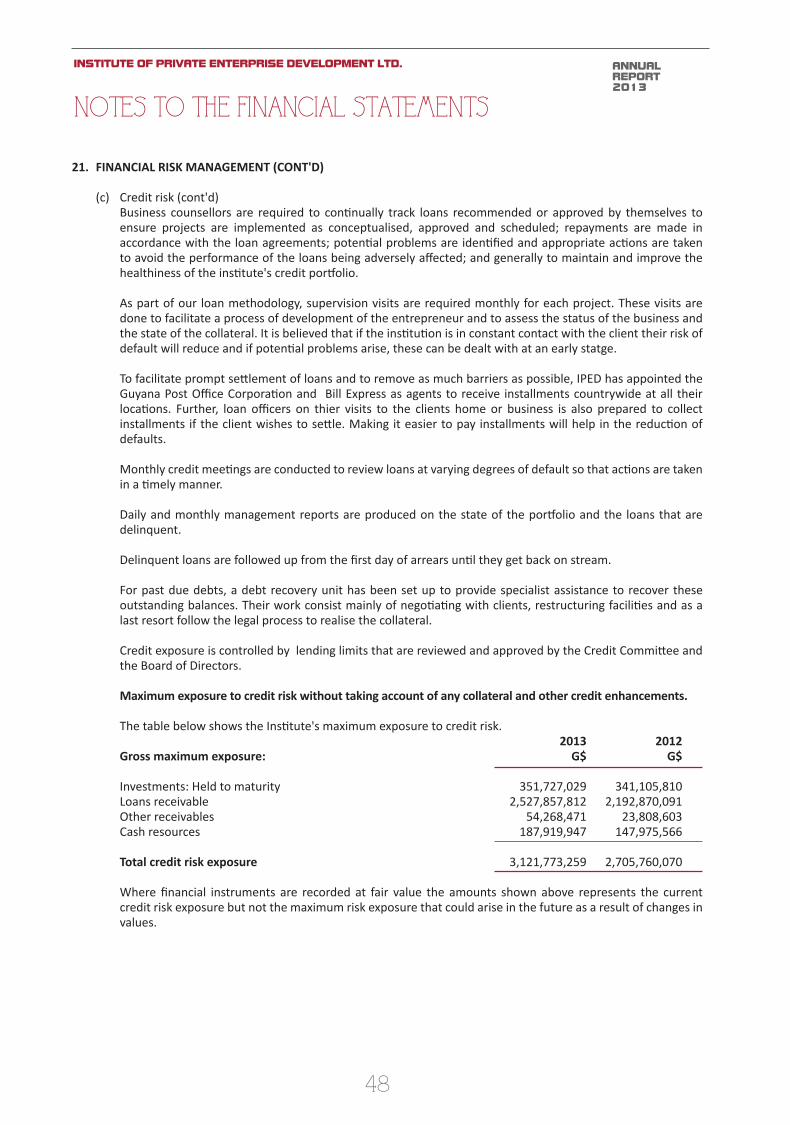
ANNUAL REPORT 2013
INSTITUTE OF PRIVATE ENTERPRISE DEVELOPMENT LTD.
48
21. FINANCIAL RISK MANAGEMENT (CONT'D) (c) Credit risk (cont'd) Business counsellors are required to continually track loans recommended or approved by themselves to
ensure projects are implemented as conceptualised, approved and scheduled; repayments are made in accordance with the loan agreements; potential problems are identified and appropriate actions are taken to avoid the performance of the loans being adversely affected; and generally to maintain and improve the healthiness of the institute's credit portfolio.
As part of our loan methodology, supervision visits are required monthly for each project. These visits are done to facilitate a process of development of the entrepreneur and to assess the status of the business and the state of the collateral. It is believed that if the institution is in constant contact with the client their risk of default will reduce and if potential problems arise, these can be dealt with at an early statge.
To facilitate prompt settlement of loans and to remove as much barriers as possible, IPED has appointed the Guyana Post Office Corporation and Bill Express as agents to receive installments countrywide at all their locations. Further, loan officers on thier visits to the clients home or business is also prepared to collect installments if the client wishes to settle. Making it easier to pay installments will help in the reduction of defaults.
Monthly credit meetings are conducted to review loans at varying degrees of default so that actions are taken
in a timely manner. Daily and monthly management reports are produced on the state of the portfolio and the loans that are
delinquent. Delinquent loans are followed up from the first day of arrears until they get back on stream.
For past due debts, a debt recovery unit has been set up to provide specialist assistance to recover these
outstanding balances. Their work consist mainly of negotiating with clients, restructuring facilities and as a last resort follow the legal process to realise the collateral.
Credit exposure is controlled by lending limits that are reviewed and approved by the Credit Committee and the Board of Directors.
Maximum exposure to credit risk without taking account of any collateral and other credit enhancements. The table below shows the Institute's maximum exposure to credit risk.
2013 2012 Gross maximum exposure: G$ G$
Investments: Held to maturity 351,727,029 341,105,810 Loans receivable 2,527,857,812 2,192,870,091 Other receivables 54,268,471 23,808,603 Cash resources 187,919,947 147,975,566 Total credit risk exposure 3,121,773,259 2,705,760,070
Where financial instruments are recorded at fair value the amounts shown above represents the current
credit risk exposure but not the maximum risk exposure that could arise in the future as a result of changes in values.
NOTES TO THE FINANCIAL STATEMENTS

ANNUAL REPORT 2013
INSTITUTE OF PRIVATE ENTERPRISE DEVELOPMENT LTD.
49
21. FINANCIAL RISK MANAGEMENT (CONT'D) (c) Credit risk (cont'd) Collateral and other enhancements
The Institute maintains credit risk exposure within acceptable parameters through the use of collateral as a risk- mitigation tool.
The amounts and type of collateral required depends on an assessment of the credit risk of the counterparty.
Guidelines are implemented regarding the acceptability of types of collateral and valuation parameters.
The main types of collateral obtained are cash or securities, charges over real estate properties, inventory and trade receivables and mortgages over residential properties.
Management monitors the market value of collateral, request additional collateral in accordance with the underlying agreement, and monitors the market value of collateral obtained during its review of the adequacy of the allowance for impairment losses.
It is the Institute's policy to dispose of repossessed properties in an orderly fashion. The proceeds are used to repay the outstanding claim.
In general, the institute does not occupy repossessed properties for business use. Concentration of risk is managed by client/counterparty, by geographical region and by industry sector as
detailed in the following:
(a) Geographical sectors
The Institute's maximum credit exposure, after taking account of credit loss provisions established but before taking into account any collateral held and other credit enhancements, can be analysed by the following geographical sectors based on the country of domicile of our counterparties:
2013 2012
G$ G$ Guyana 2,836,105,149 2,383,943,955 Jamaica - 66,563,452 Barbados 19,289,740 61,552,064 Trinidad and Tobago 56,579,918 53,207,156 Other countries 209,798,451 140,493,443
3,121,773,259 2,705,760,070
NOTES TO THE FINANCIAL STATEMENTS

ANNUAL REPORT 2013
INSTITUTE OF PRIVATE ENTERPRISE DEVELOPMENT LTD.
50
21. FINANCIAL RISK MANAGEMENT (CONT'D) (c) Credit risk (cont'd)
(b) Industry sectors' The following table breaks down the Institute's maximum credit exposure as categorised by the industry
sectors of our counterparties: 2013 2012 G$ G$ Government and government bodies 434,397,247 299,061,327 Financial sector 159,518,199 208,242,333 Fishing 41,152,996 48,812,312 Rice 822,572,658 759,812,900 Dairy 6,742,788 3,285,953 Pigs 21,108,106 15,259,836 Poultry 97,945,695 96,782,898 Fish dehydration 3,388,582 6,435,965 Crops 130,797,527 107,824,777 Garment 6,405,985 3,412,589 Food processing 17,360,197 16,695,195 Workshop 23,674,982 25,503,996 Furniture 27,654,109 31,076,988 Craft 8,757,509 5,097,282 Trading 764,560,813 719,127,701 Miscellaneous 601,853,354 405,305,924
3,167,890,746 2,751,737,976
Less: Allowance for impairment (46,117,487) (45,977,907)
3,121,773,259 2,705,760,070
NOTES TO THE FINANCIAL STATEMENTS

ANNUAL REPORT 2013
INSTITUTE OF PRIVATE ENTERPRISE DEVELOPMENT LTD.
51
21. FINANCIAL RISK MANAGEMENT (CONT'D) (c) Credit risk (cont'd)
Credit quality per category of financial assets The Institute has determined that credit risk exposure arises from the following statement of financial position lines:
Investments- Held to maturity Loans receivable Other receivables Cash resources
Investments - Held to maturity
The debt securities within the Institute's investments security portfolio are exposed to credit risk. The credit quality of each individual security is internally assessed based on the financial strength, reputation and market position of the issuing company and the ability of that company to service the debt. The level of credit risk thus assessed and associated with the security is assigned to a risk premium. These premiums are defined as follows:
Superior: Government and Government Guaranteed securities and securities secured by a letter
of comfort from the Government. These securities are considered risk free.
Desirable: Corporate securities that are current and being serviced in accordance with the terms and conditions of the underlying agreements. Issuing company has good financial strength and reputation.
Acceptable: Corporate securities that are current and being serviced in accordance with the terms
and conditions of the underlying agreements. Issuing company has fair financial strength and reputation.
Sub-standard: These securities are either more than 90 days in arrears but are not considered impaired,
or have been restructured in the past financial year.
The table below illustrates the credit quality of debt security investments as at December 31:
Superior Desirable Acceptable Sub-standard Total G$ G$ G$ G$ G$
Financial Investments: Held to maturity 2013 93,459,279 258,267,750 - - 351,727,029
2012 66,563,452 274,542,358 - - 341,105,810
NOTES TO THE FINANCIAL STATEMENTS

ANNUAL REPORT 2013
INSTITUTE OF PRIVATE ENTERPRISE DEVELOPMENT LTD.
52
21. FINANCIAL RISK MANAGEMENT (CONT'D) (c) Credit risk (cont'd)
Loans receivable
The credit quality of loans receivable and advances is internally determined from an assessment of the counterparty based on a combination of factors. These include the level and strength of experience of management, the track record and level of supervision required for the existing facilities of the company, the financial and leverage position of the borrowing company, the estimated continued profitability of the company and the ability of that company to service its debts, the stability of the industry within which the company operates and the competitive advantage held by the company in the market. The overall level of risk thus assessed is assigned a credit score which indicates the overall quality of the Commercial/ Corporate borrowings account.
The related scores for commercial and corporate advances that are neither past due nor impaired are defined as follows: Superior: These counterparties have strong financial position. Facilities are well secured, and business
has proven track record. Desirable: These counterparties have good financial position. Facilities are reasonably secured, and
underlying business is performing well. Acceptable: These counterparties are of average risk with a fair financial position. Business may be new
or industry may be subject to more volatility, and facilities typically have lower levels of security.
Sub-standard: Past due or individually impaired. The table below illustrates the credit quality of debt security investments as at December 31: Impaired Superior Desirable Acceptable Sub-standard Total G$ G$ G$ G$ G$ 2013 2,073,469,518 356,328,591 51,942,216 46,117,487 2,527,857,812 2012 1,837,885,955 274,391,153 34,615,076 45,977,907 2,192,870,091
Loan receivables 2013 2012 G$ G$ Current 2,027,352,031 1,628,367,633 Past due but not impaired 344,992,558 440,042,890 Impaired 155,513,223 124,459,568 2,527,857,812 2,192,870,091
Neither past due nor impaired
NOTES TO THE FINANCIAL STATEMENTS

ANNUAL REPORT 2013
INSTITUTE OF PRIVATE ENTERPRISE DEVELOPMENT LTD.
53
21. FINANCIAL RISK MANAGEMENT (CONT'D) (c) Credit risk (cont'd)
Loans receivable (cont'd) Ageing of receivables that are past due but not impaired
2013 2012 G$ G$
1-30 days 188,445,311 153,090,136 31-90 days 81,792,556 104,789,680 91-180 days 74,754,691 182,163,074
Total 344,992,558 440,042,890
While the foregoing is past due they are still considered to be collectible in full.
Ageing of impaired receivables
Principal Exposure Provision2013 G$ G$ G$ 180-365 days 57,453,519 9,766,808 9,076,254 over 365 days 98,059,704 38,864,474 37,041,233
155,513,223 48,631,282 46,117,487 2012
180-365 days 38,790,606 9,147,036 9,054,261 over 365 days 85,668,962 36,912,090 36,923,646
124,459,568 46,059,126 45,977,907
NOTES TO THE FINANCIAL STATEMENTS

ANNUAL REPORT 2013
INSTITUTE OF PRIVATE ENTERPRISE DEVELOPMENT LTD.
54
21. FINANCIAL RISK MANAGEMENT (CONT'D) (c) Credit risk (cont'd)
Cash resources The credit quality of balances due from other banks is assessed by the bank according to the level of credit
worthiness of the institution in relation to the other institutions in the region. The credit quality of these balances has been analysed into the following categories: Superior: These institutions have been accorded the highest rating, indicating that the institution's
capacity to meet its financial commitment on the obligation is extremely strong.
Desirable: These institutions have been accorded the second-highest rating, indicating that the institution's capacity to meet its financial commitment on the obligation is very strong.
Acceptable: These institutions have been accorded the third-highest rating, indicating that the institution's capacity to meet its financial commitment on the obligation is adequate.
The table below illustrates the credit quality of cash resources due from banks as at December 31:
Superior Desirable Acceptable Total G$ G$ G$ G$
2013 - 187,919,947 - 187,919,947
2012 - 147,975,566 - 147,975,566
(d) Operational risk
The growing sophistication of the financial sector and the impact of the Global Financial Crisis has made the Institute's operational risk profile more complex. Operational risk is inherent to all business activities and is the potential for financial or reputational loss arising from inadequate or failed internal controls, operational processes or the systems that support them. It includes errors, omission, disasters and deliberate acts such as fraud.
The Institute recognises that such risk can never be entirely eliminated and manages the risk through a combination of systems and procedures to monitor and document transactions. The Institute's operational risk committee oversees this and where appropriate, risk is transferred by the placement of adequate insurance coverage.
The Institute has developed contingency arrangements and established facilities to support operations in the event of disasters. Independent checks on operational risk issues are also undertaken by the internal audit department and the audit committee.
NOTES TO THE FINANCIAL STATEMENTS

ANNUAL REPORT 2013
INSTITUTE OF PRIVATE ENTERPRISE DEVELOPMENT LTD.
55
22. FAIR VALUE OF FINANCIAL INSTRUMENTS
Fair values have been determined as follows:
Carrying value Market value Carrying value Market value G$ G$ G$ G$ Assets
Investments 351,727,029 358,807,267 341,105,810 361,245,242 Loans receivables 2,527,857,812 2,527,857,812 2,192,870,091 2,192,870,091 Other receivables (net of prepayments) 46,339,833 46,339,833 12,050,945 12,050,945 Cash resources 187,919,947 187,919,947 147,975,566 147,975,566
3,113,844,621 3,120,924,859 2,694,002,412 2,714,141,844 Liabilities Loans 327,628,728 327,628,728 239,542,319 239,542,319 Other payables and accruals 295,213,830 295,213,830 252,143,486 252,143,486 Bank overdraft 76,969,857 76,969,857 - -
699,812,415 699,812,415 491,685,805 491,685,805
Valuation techniques and assumptions applied for the purposes of measuring fair value:
The fair value of financial assets and financial liabilities were determined as follows:
(a) The fair values of financial assets and financial liabilities with standard terms and conditions and traded on
active liquid markets were determined with reference to quoted market prices. Quoted market prices were obtained from independent market valuators.
(b) The fair value of other financial assets and financial liabilities were determined in accordance with generally accepted pricing models based on discounted cash flows analysis using prices from observable current market transactions and the institute's past experience.
(c) The fair value of loans receivables were determined in accordance with generally accepted pricing models based on discounted cash flows analysis using prices from observable current market transactions and the Institute's past experience with delinquent loans and have taken into account probability of defaults.
Fair value measurements recognised in the statement of financial position
The following is an analysis of financial instruments that are measured subsequent to initial recognition at fair value, grouped into level 1 based on the degree to which the fair value is observable. Level 1 fair value measurements are those derived from quoted prices (unadjusted) in active markets for idential assets or liabilities.
2013 2012
G$ G$
Investments- Held to maturity 161,882,619 251,166,502
2013 2012
NOTES TO THE FINANCIAL STATEMENTS

ANNUAL REPORT 2013
INSTITUTE OF PRIVATE ENTERPRISE DEVELOPMENT LTD.
56
23. PENDING LITIGATION There are several litigations pending, the outcomes of which are uncertain at this stage.
24. RESTATEMENT In the current year the company's accounting policies were changed in respect of the adoption of the revised IAS
19 - Employee benefits applicable to the provision for employee benefits. The financial statements were restated retrospectively to reflect these changes.
The effect of the restatement was as follows: 2012 2011 G$ G$ Accumulated funds at 1 January 2012 increased by 6,755,000
Defined benefit asset increased by 6,755,000 Other comprehensive income increased by 53,883,000 Defined benefit asset increased by 53,883,000
NOTES TO THE FINANCIAL STATEMENTS

NOTES

NOTES

NOTES

Produced by KRITI ([email protected])Photographs supplied by IPED