
27816805d01
8
1077-2618/01 /$10.00©200 1 IEEE IEEE Industry Applications Magazine I March/April 2001 I n a wor ld of cha nge , newtechnolo gie sreplac e old ones ever-more quickly. In the early years, change was slow as the evolutionary process transitioned from electromechanical voltage regulators with motor-driven rheostats to high-gain rotating exciters. These exciters in- cluded such systems as the Amplidyne, Regulex, andRotot rol , whi ch impr oved per for man ce to con- trol the generator output. In the past 30 years, however, change has progressed from magnetic technology to analog control. Analog excitation represented the multiple component module as- sembly with interlooping wire interconnections (see Fig. 1). Toda y, we see ano the r majo r tec hnol ogy cha nge , a movement away from analog control to digital control. An excitation system is now reduced to a single integrated assembly that includes the auto- mat ic volt age reg ulat or (AVR), fieldcurre nt reg ula- tor (manual control), excitation limiters, and even pro tec tion [3] -[6 ]. Reli abil ity is enhancedas mult i- ple de vic es ar e imp lemente d int o the sin gle co mpo - nen t with multitas king micr opr oce ssors. Fig. 2 highlights a classic digital excitation system inter- connected in a generator system. A singlecompon ent for ms the pri mar y element of the exc itation sys tem. Inputs inc lude the instru- ment transformer for voltage sensing, current transformer signal from a line CT, and bus voltage tra nsf ormer use d for vol tag e mat chi ng. Theoutput of the controller is an analog signal designed to work directly into a separate firing circuit that generates pulses for a three-phase, fullwave recti - fier bridge to control the field (see Fig. 2). In digital systems, the guidelines for selecting the power potential transformer and rectifier bridge are similar to methods utilized for analog systems. Input signals for raise/lower or start/stop canbe con tro lledby a var iet yof met hods. These in- clude contact inputs, an RS485 serial communica- ti on port , or a PCus ingASCI I langua ge connecte d into an RS232 serial communication port. Flexi- bili ty in digita l sys tems off ers mor e effi cient met h- ods to accomplish automation, which lowers installation cost. Analog versus Digital Controller In the past, shaping the generator response using an ana log exc ita tio n sys tem was a mat ter of adj ust- ing potentiometers or adding or deleting capaci- torsand resist or sinthe co nt ro l loops of the voltage regulator stability circuit. Adjustments could be ver y timeconsuming bec aus e cha nge s would often involve turning the excitation system on and off Richard C. Schaefer and Kiyong Kim Richard C. Schaefer and Kiyong Kim are with Basler Electric of Highland, Illinois. Both Schaefer and Kim are Members of IEEE. This article appeared in its origi- nal form at the 2000 IEEE/IAS Pulp and Paper Con- ference. © T e x t u r e : 1 9 9 8 C o r b i s Fig. 1. A comparison of an analog-controlled excitation system (left) and an integrated, digitally controlled excitation system (right). 37
-
Upload
ibrahim-faisal -
Category
Documents
-
view
217 -
download
0
Transcript of 27816805d01

8/7/2019 27816805d01
http://slidepdf.com/reader/full/27816805d01 1/7
1077-2618/01/$10.00©2001 IEEE IEEE Industry Applications Magazine I March/April 2001
In a world of change, newtechnologies replaceold ones ever-more quickly. In the earlyyears, change was slow as the evolutionaryprocess transitioned from electromechanical
voltage regulators with motor-driven rheostats tohigh-gain rotating exciters. These exciters in-cluded such systems as the Amplidyne, Regulex,andRototrol, which improved performance to con-trol the generator output. In the past 30 years,however, change has progressed from magnetictechnology to analog control. Analog excitationrepresented the multiple component module as-sembly with interlooping wire interconnections(see Fig. 1).
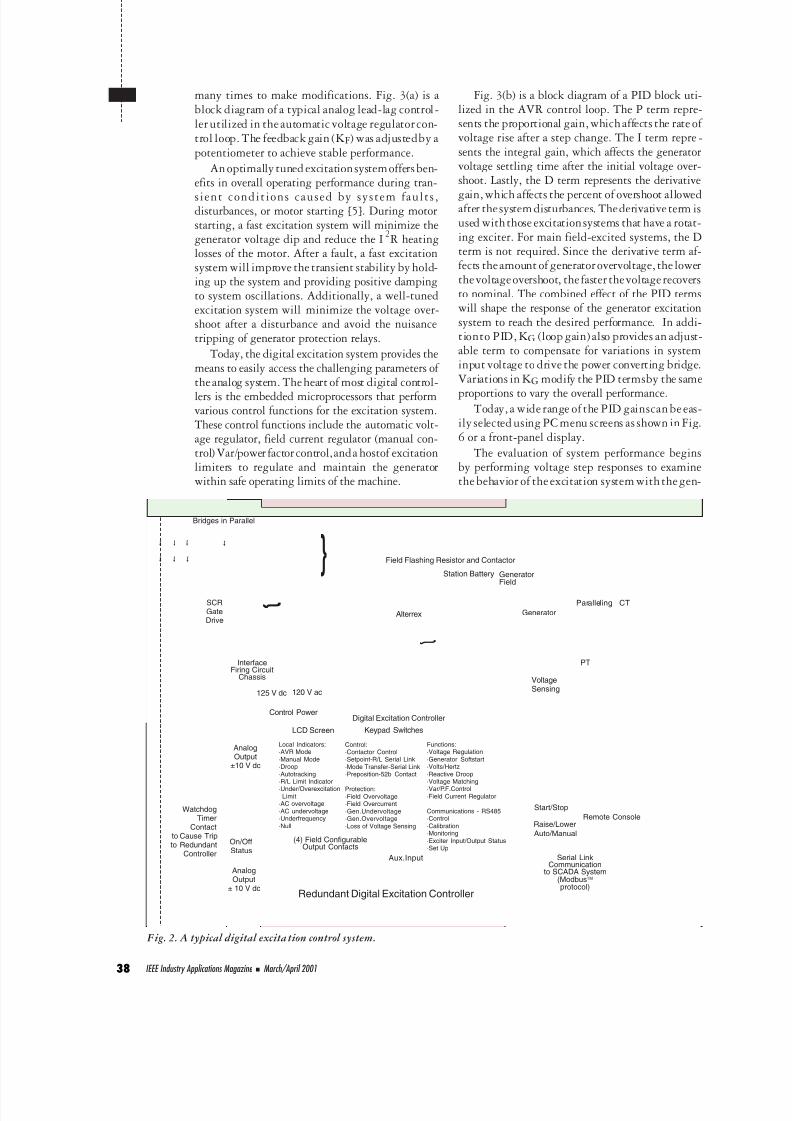
Today, we see another major technology change,a movement away from analog control to digitalcontrol. An excitation system is now reduced to asingle integrated assembly that includes the auto-matic voltageregulator (AVR), fieldcurrent regula-tor (manual control), excitation limiters, and evenprotection [3]-[6]. Reliability is enhanced as multi-pledevices are implemented into the singlecompo-nent with multitasking microprocessors. Fig. 2highlights a classic digital excitation system inter-connected in a generator system.
A single component forms the primary elementof the excitation system. Inputs include the instru-ment transformer for voltage sensing, currenttransformer signal from a line CT, and bus voltagetransformer used forvoltage matching.Theoutput
of the controller is an analog signal designed towork directly into a separate firing circuit thatgenerates pulses for a three-phase, fullwave recti -fier bridge to control the field (see Fig. 2).
In digital systems, the guidelines for selectingthe power potential transformer and rectifier
bridge are similar to methods utilized for analogsystems. Input signals for raise/lower or start/stopcanbe controlledby a variety of methods. These in-clude contact inputs, an RS485 serial communica-tion port, or a PC usingASCII language connectedinto an RS232 serial communication port. Flexi-bility in digital systems offersmore efficient meth-ods to accomplish automation, which lowersinstallation cost.
Analog versus Digital Controller In the past, shaping the generator response usingan analog excitation system was a matterof adjust-ing potentiometers or adding or deleting capaci-tors and resistors in the control loops of the voltageregulator stability circuit. Adjustments could bevery time consuming because changes would ofteninvolve turning the excitation system on and off
Richard C. Schaefer and Kiyong Kim
Richard C. Schaefer and Kiyong Kim are with Basler Electric of Highland, Illinois. Both Schaefer and Kimare Members of IEEE. This article appeared in its origi-nal form at the 2000 IEEE/IAS Pulp and Paper Con-ference.
©Texture:1998Corbis
Fig. 1. A comparison of an analog-controlled excitation system (left) and an integrated, digitallycontrolled excitation system (right).
37
8/7/2019 27816805d01
http://slidepdf.com/reader/full/27816805d01 2/7
many times to make modifications. Fig. 3(a) is ablock diagram of a typical analog lead-lag control -ler utilized in the automatic voltage regulatorcon-trol loop. The feedback gain (K F) was adjustedby apotentiometer to achieve stable performance.
An optimally tuned excitationsystemoffersben-efits in overall operating performance during tran-
sient conditions caused by system faults,disturbances, or motor starting [5]. During motorstarting, a fast excitation system will minimize thegenerator voltage dip and reduce the I 2R heatinglosses of the motor. After a fault, a fast excitationsystem will improve the transient stability by hold-ing up the system and providing positive dampingto system oscillations. Additionally, a well-tunedexcitation system will minimize the voltage over-shoot after a disturbance and avoid the nuisancetripping of generator protection relays.
Today, the digital excitation system provides themeans to easily access the challenging parameters of theanalog system. Theheart of most digital control-lers is the embedded microprocessors that performvarious control functions for the excitation system.These control functions include the automatic volt-age regulator, field current regulator (manual con-trol) Var/power factorcontrol,anda hostof excitationlimiters to regulate and maintain the generatorwithin safe operating limits of the machine.
Fig. 3(b) is a block diagram of a PID block uti-lized in the AVR control loop. The P term repre-sents the proportional gain, whichaffects the rate of voltage rise after a step change. The I term repre -sents the integral gain, which affects the generatorvoltage settling time after the initial voltage over-shoot. Lastly, the D term represents the derivative
gain, which affects the percent of overshoot allowedafter thesystemdisturbances. Thederivative term isused withthose excitationsystems that have a rotat-ing exciter. For main field-excited systems, the Dterm is not required. Since the derivative term af-fects theamount of generatorovervoltage, the lowerthevoltageovershoot, the faster thevoltage recoversto nominal. The combined effect of the PID termswill shape the response of the generator excitationsystem to reach the desired performance. In addi-tionto PID, K G (loop gain) also provides an adjust-able term to compensate for variations in systeminput voltage to drive the power converting bridge.Variations in K G modify the PID termsby the same
proportions to vary the overall performance.Today, a wide range of the PID gainscan be eas-
ily selected using PC menu screens asshown in Fig.6 or a front-panel display.
The evaluation of system performance beginsby performing voltage step responses to examinethe behavior of the excitation system with thegen-
IEEE Industry Applications Magazine I March/April 200138
MM t
t t t
ttt
IsolationTransducer
Power Input
3-PhasePower PT
from Alterrex
Alterrex Generator
GeneratorField
PT
Paralleling CT
VoltageSensing
Bridges in Parallel
WatchdogTimer
Contactto Cause Tripto Redundant
Controller
On/OffStatus
AnalogOutput
± 10 V dc
(4) Field ConfigurableOutput Contacts
InterfaceFiring Circuit
Chassis
AnalogOutput
±10 V dc
SCRGateDrive
Serial LinkCommunication
to SCADA System(Modbusprotocol)
Start/StopRemote Console
Raise/LowerAuto/Manual
}
}
} Field Flashing Resistor and Contactor
Station Battery
Control Power
LCD Screen Keypad SwitchesDigital Excitation Controller
Redundant Digital Excitation Controller
Aux.Input
125 V dc 120 V ac
Local Indicators:·AVR Mode·Manual Mode·Droop·Autotracking·R/L Limit Indicator·Under/Overexcitation
Limit·AC overvoltage·AC undervoltage·Underfrequency·Null
Control:
Protection:
·Contactor Control·Setpoint-R/L Serial Link·Mode Transfer-Serial Link·Preposition-52b Contact
·Field Overvoltage·Field Overcurrent·Gen.Undervoltage·Gen.Overvoltage·Loss of Voltage Sensing
Functions:
Communications - RS485
·Voltage Regulation·Generator Softstart·Volts/Hertz·Reactive Droop·Voltage Matching·Var/P.F.Control·Field Current Regulator
·Control·Calibration·Monitoring·Exciter Input/Output Status·Set Up
t
t t t
ttt
Fig. 2. A typical digital excita tion control system.
8/7/2019 27816805d01
http://slidepdf.com/reader/full/27816805d01 3/7
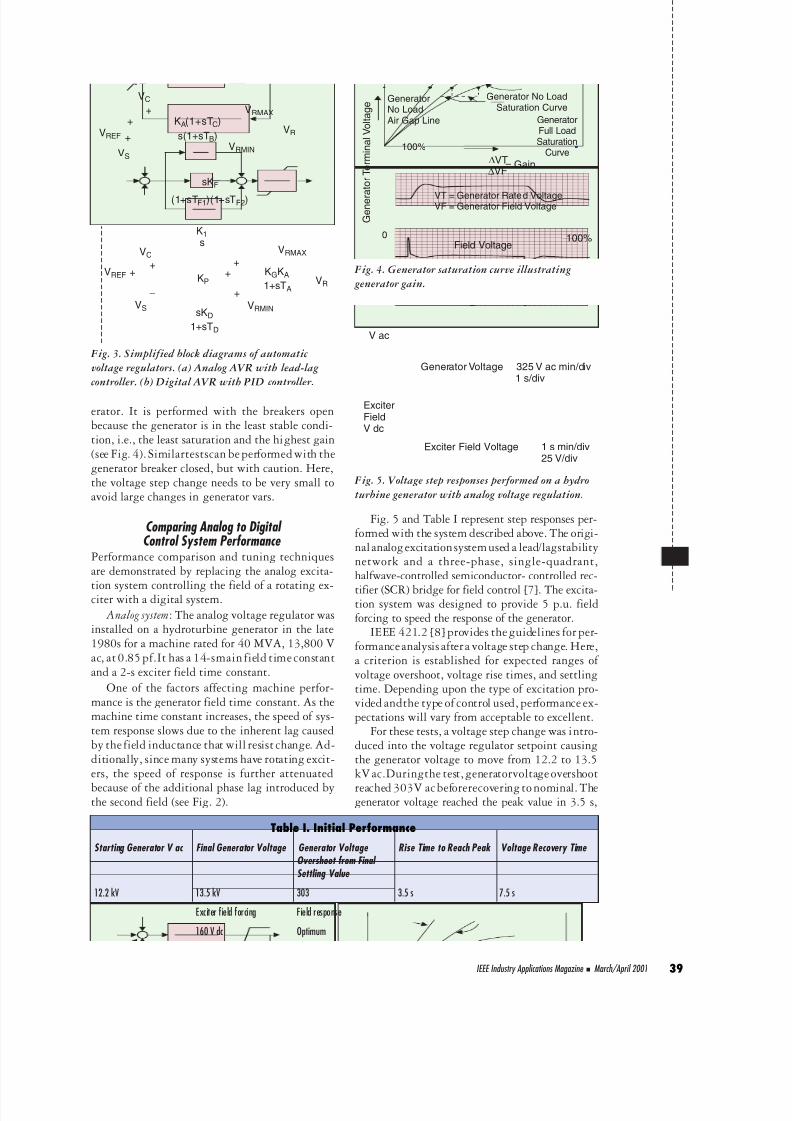
erator. It is performed with the breakers openbecause the generator is in the least stable condi-tion, i.e., the least saturation and the highest gain(see Fig. 4). Similartestscan be performedwith thegenerator breaker closed, but with caution. Here,the voltage step change needs to be very small toavoid large changes in generator vars.
Comparing Analog to Digital Control System Performance
Performance comparison and tuning techniquesare demonstrated by replacing the analog excita-
tion system controlling the field of a rotating ex-citer with a digital system.Analog system: The analog voltage regulator was
installed on a hydroturbine generator in the late1980s for a machine rated for 40 MVA, 13,800 Vac, at 0.85 pf.It has a 14-smain field time constantand a 2-s exciter field time constant.
One of the factors affecting machine perfor-mance is the generator field time constant. As themachine time constant increases, the speed of sys-tem response slows due to the inherent lag causedby the field inductance that will resist change. Ad-ditionally, since many systems have rotating excit-ers, the speed of response is further attenuatedbecause of the additional phase lag introduced bythe second field (see Fig. 2).
Fig. 5 and Table I represent step responses per-formed with the system described above. The origi-nalanalogexcitationsystemused a lead/lagstabilitynetwork and a three-phase, single-quadrant,halfwave-controlled semiconductor- controlled rec-
tifier (SCR) bridge for field control [7]. The excita-tion system was designed to provide 5 p.u. fieldforcing to speed the response of the generator.
IEEE 421.2 [8] provides the guidelines for per-formanceanalysis aftera voltage step change. Here,a criterion is established for expected ranges of voltage overshoot, voltage rise times, and settlingtime. Depending upon the type of excitation pro-vided andthe type of control used, performance ex-pectations will vary from acceptable to excellent.
For these tests, a voltage step change was intro-duced into the voltage regulator setpoint causingthe generator voltage to move from 12.2 to 13.5kV ac.Duringthe test, generatorvoltage overshootreached 303V acbeforerecovering to nominal. Thegenerator voltage reached the peak value in 3.5 s,
IEEE Industry Applications Magazine I March/April 2001 39
GeneratorNo LoadAir Gap Line
Generator No LoadSaturation Curve
GeneratorFull LoadSaturation
Curve
VT = Generator Rated VoltageVF = Generator Field Voltage
0 100%
100%
Field Voltage
Generator Terminal Voltage
= Gain∆ VT∆ VF
Fig. 4. Generator saturation curve illustratinggenerator gain.
Exciter Field Voltage
Generator Voltage 325 V ac min/div1 s/div
1 s min/div25 V/div
V ac
ExciterFieldV dc
Fig. 5. Voltage step responses performed on a hydroturbine generator with analog voltage regulation.
Table I. Initial PerformanceStarting Generator V ac Final Generator Voltage Generator Voltage
Overshoot from Final Settling Value
Rise Time to Reach Peak Voltage Recovery Time
12.2 kV 13.5 kV 303 3.5 s 7.5 s
Exciter field forcing Field response
160 V dc Optimum
VC
VC
VREF
VREF
VS
VS
++
+
VRMAX
VRMAX
VRMIN
VRMIN
VR
VR
K (1+sT )A C
s(1+sT )B
sKF
(1+sT )(1+sT )F1 F2
K1s
KP
sKD
1+sT D
K KG A
1+sT A
++
+
++
−
Fig. 3. Simplified block diagrams of automatic voltage regulators. (a) Analog AVR with lead-lagcontroller. (b) Digital AVR with PID controller.
8/7/2019 27816805d01
http://slidepdf.com/reader/full/27816805d01 4/7
with total recovery in 7.5 s. Note the generatorvoltage swing prior to the generator voltage set-tling to the steady state value. During the initialtuning of the analog excitation system, differentphase lead andlag compensationwas implementedto determine best settings for performance. Thiswas accomplished by adding external capacitors to
optimize unit performance.
Digital system: After testing was completed us-ing the analog system, the digital controller wasinstalled. The new excitation system included atwo-quadrant power SCR bridge that could pro-vide both positive and negative field forcing, com-bined with a digital controller to hasten fluxchanges in the field winding and quicken system
voltage recovery.With the use of digital control, the ingredients
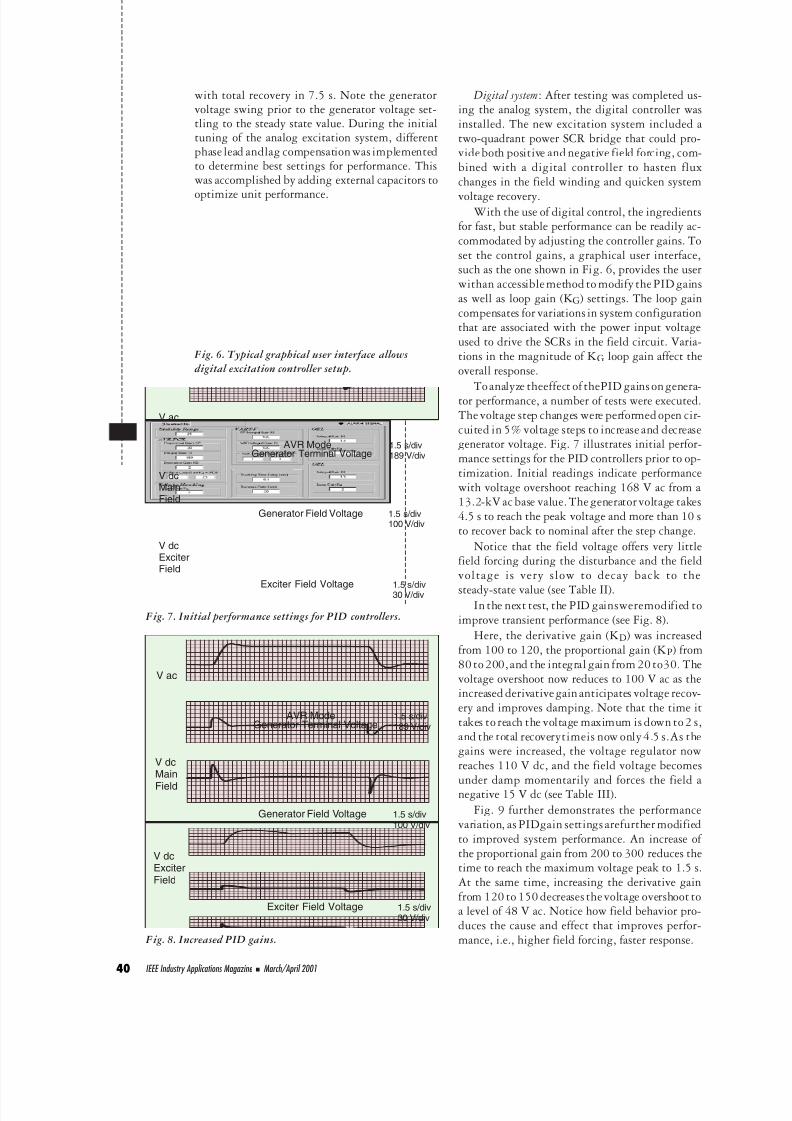
for fast, but stable performance can be readily ac-commodated by adjusting the controller gains. Toset the control gains, a graphical user interface,such as the one shown in Fig. 6, provides the userwithan accessiblemethod to modify thePID gainsas well as loop gain (K G) settings. The loop gaincompensates for variations in system configurationthat are associated with the power input voltageused to drive the SCRs in the field circuit. Varia-tions in the magnitude of K G loop gain affect theoverall response.
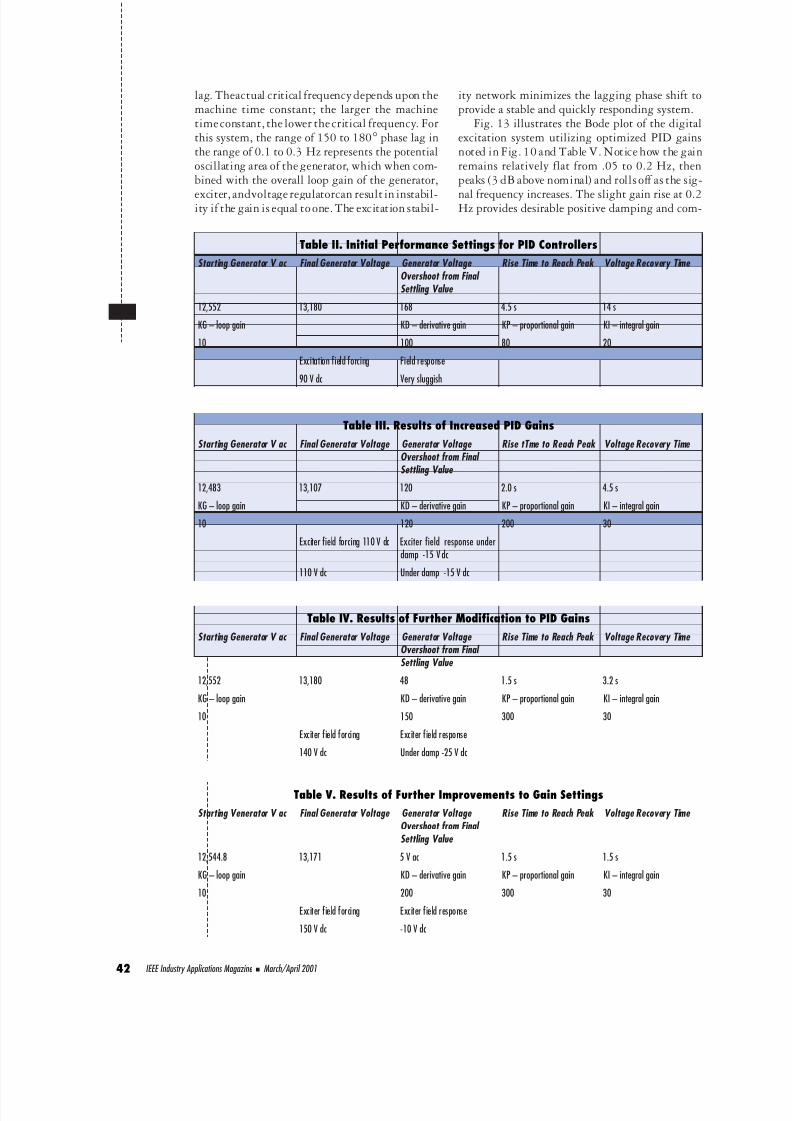
To analyze theeffect of thePID gains ongenera-tor performance, a number of tests were executed.The voltage step changes were performed open cir-cuited in 5% voltage steps to increase and decreasegenerator voltage. Fig. 7 illustrates initial perfor-mance settings for the PID controllers prior to op-timization. Initial readings indicate performancewith voltage overshoot reaching 168 V ac from a13.2-kV ac base value. The generator voltage takes4.5 s to reach the peak voltage and more than 10 sto recover back to nominal after the step change.
Notice that the field voltage offers very littlefield forcing during the disturbance and the fieldvoltage is very slow to decay back to the
steady-state value (see Table II).In the next test, the PID gainsweremodified to
improve transient performance (see Fig. 8).Here, the derivative gain (K D) was increased
from 100 to 120, the proportional gain (K P) from80 to 200, and the integral gain from 20 to30. Thevoltage overshoot now reduces to 100 V ac as theincreased derivativegain anticipates voltage recov-ery and improves damping. Note that the time ittakes to reach the voltage maximum is down to 2 s,and the total recoverytimeis now only 4.5 s.As thegains were increased, the voltage regulator nowreaches 110 V dc, and the field voltage becomes
under damp momentarily and forces the field anegative 15 V dc (see Table III).Fig. 9 further demonstrates the performance
variation, as PIDgain settings arefurther modifiedto improved system performance. An increase of the proportional gain from 200 to 300 reduces thetime to reach the maximum voltage peak to 1.5 s.At the same time, increasing the derivative gainfrom 120 to 150 decreases the voltage overshoot toa level of 48 V ac. Notice how field behavior pro-duces the cause and effect that improves perfor-mance, i.e., higher field forcing, faster response.
IEEE Industry Applications Magazine I March/April 200140
V ac
1.5 s/div189 V/div
1.5 s/div100 V/div
1.5 s/div30 V/div
V dcMainField
V dcExciterField
AVR Mode
Exciter Field Voltage
Generator Terminal Voltage
Generator Field Voltage
Fig. 7. Initial performance settings for PID controllers.
V ac
1.5 s/div189 V/div
1.5 s/div100 V/div
1.5 s/div30 V/div
V dcMainField
V dcExciterField
AVR Mode
Exciter Field Voltage
Generator Terminal Voltage
Generator Field Voltage
Fig. 8. Increased PID gains.
Fig. 6. Typical graphical user interface allowsdigital excitation controller setup.
8/7/2019 27816805d01
http://slidepdf.com/reader/full/27816805d01 5/7
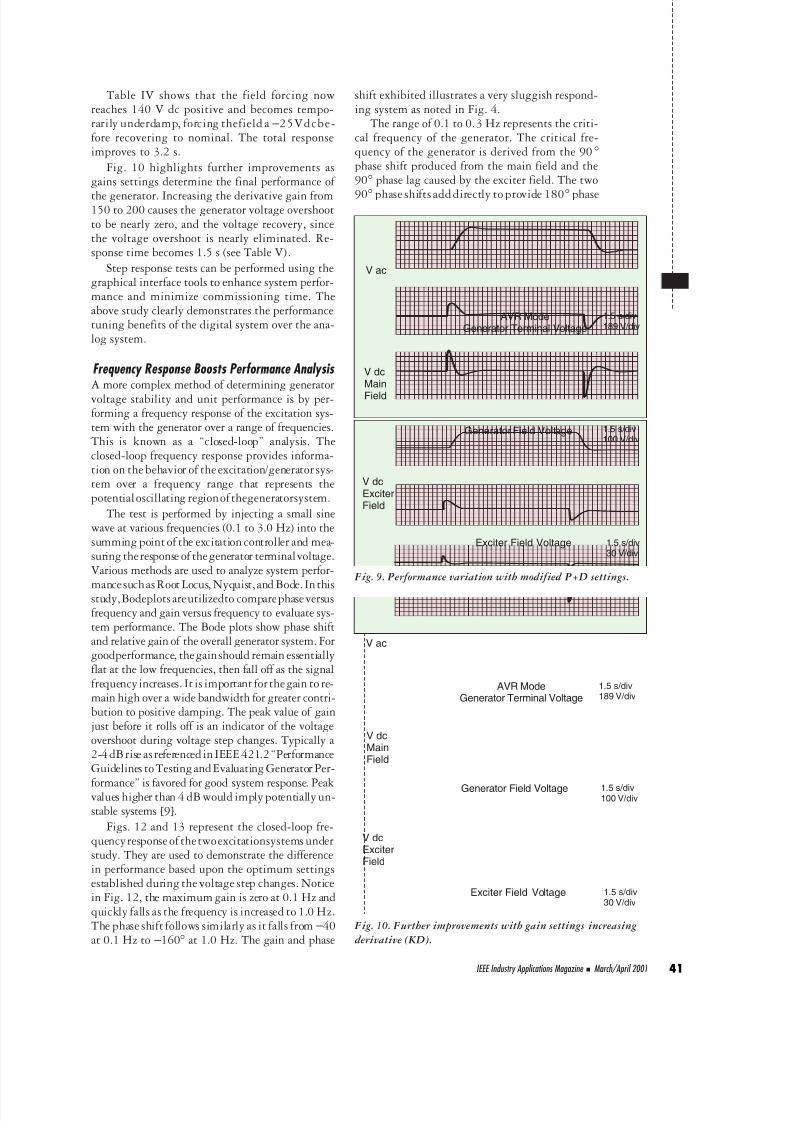
Table IV shows that the field forcing nowreaches 140 V dc positive and becomes tempo-rarily underdamp, forcing thefield a - 25Vdcbe-fore recovering to nominal. The total responseimproves to 3.2 s.
Fig. 10 highlights further improvements asgains settings determine the final performance of
the generator. Increasing the derivative gain from150 to 200 causes the generator voltage overshootto be nearly zero, and the voltage recovery, sincethe voltage overshoot is nearly eliminated. Re-sponse time becomes 1.5 s (see Table V).
Step response tests can be performed using thegraphical interface tools to enhance system perfor-mance and minimize commissioning time. Theabove study clearly demonstrates the performancetuning benefits of the digital system over the ana-log system.
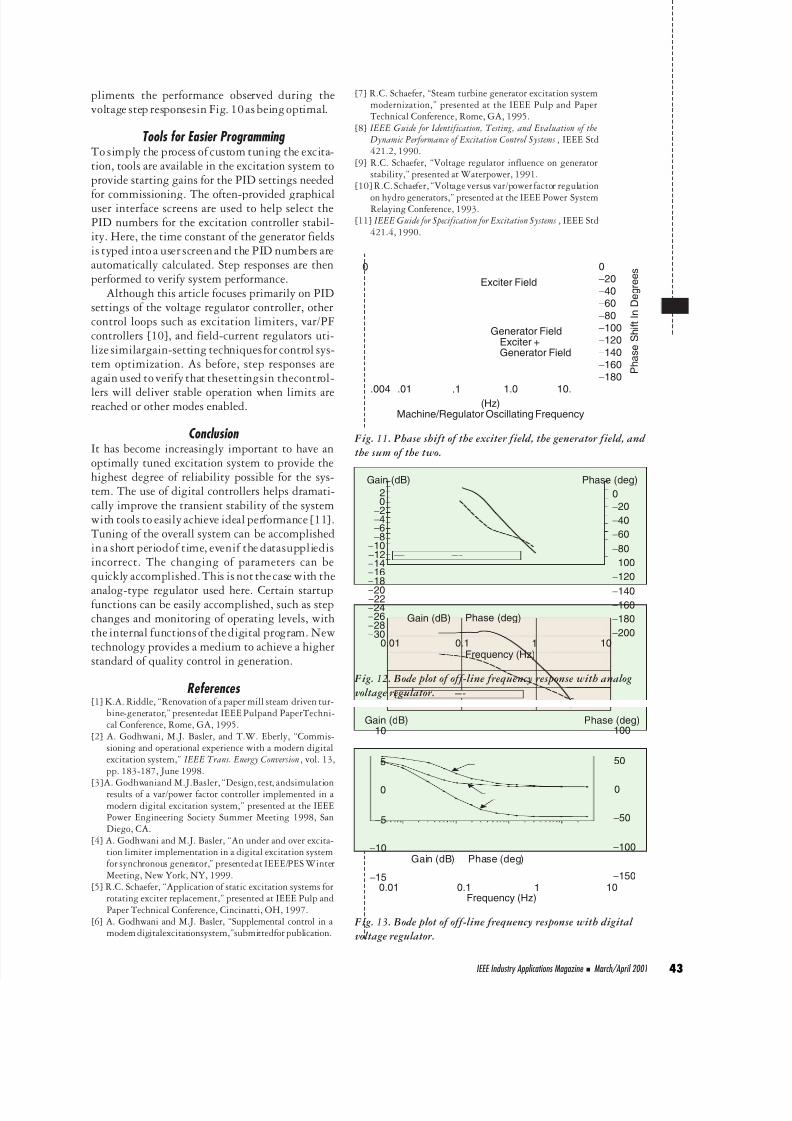
Frequency Response Boosts Performance Analysis A more complex method of determining generatorvoltage stability and unit performance is by per-forming a frequency response of the excitation sys-tem with the generator over a range of frequencies.This is known as a “closed-loop” analysis. Theclosed-loop frequency response provides informa-tion on the behavior of the excitation/generator sys-tem over a frequency range that represents thepotentialoscillating regionof thegeneratorsystem.
The test is performed by injecting a small sinewave at various frequencies (0.1 to 3.0 Hz) into thesumming point of the excitation controller and mea-suring theresponse of thegenerator terminalvoltage.Various methods are used to analyze system perfor-
mancesuchasRoot Locus, Nyquist, and Bode. Inthisstudy,Bodeplotsareutilizedto comparephaseversusfrequency and gain versus frequency to evaluate sys-tem performance. The Bode plots show phase shiftand relative gain of the overall generator system. Forgoodperformance, thegainshould remain essentiallyflat at the low frequencies, then fall off as the signalfrequencyincreases. It is important for thegain to re-main high over a wide bandwidth for greater contri-bution to positive damping. The peak value of gainjust before it rolls off is an indicator of the voltageovershoot during voltage step changes. Typically a2-4 dBrise asreferencedin IEEE421.2“PerformanceGuidelines to TestingandEvaluating Generator Per-
formance” is favored for good system response. Peakvalues higher than 4 dB would imply potentially un-stable systems [9].
Figs. 12 and 13 represent the closed-loop fre-quencyresponse of thetwoexcitationsystems understudy. They are used to demonstrate the differencein performance based upon the optimum settingsestablished during the voltage step changes. Noticein Fig. 12, the maximum gain is zero at 0.1 Hz andquickly falls as the frequency is increased to 1.0 Hz.The phase shift follows similarly as it falls from - 40at 0.1 Hz to - 160 ° at 1.0 Hz. The gain and phase
shift exhibited illustrates a very sluggish respond-ing system as noted in Fig. 4.
The range of 0.1 to 0.3 Hz represents the criti-cal frequency of the generator. The critical fre-quency of the generator is derived from the 90 °
phase shift produced from the main field and the90 ° phase lag caused by the exciter field. The two
90 ° phase shifts adddirectly to provide 180 ° phase
IEEE Industry Applications Magazine I March/April 2001 41
V ac
1.5 s/div189 V/div
1.5 s/div100 V/div
1.5 s/div30 V/div
V dcMainField
V dcExciterField
AVR ModeGenerator Terminal Voltage
Exciter Field Voltage
Generator Field Voltage
Fig. 9. Performance variation with modified P+D settings.
V ac
1.5 s/div189 V/div
1.5 s/div100 V/div
1.5 s/div30 V/div
V dcMainField
V dcExciterField
AVR ModeGenerator Terminal Voltage
Exciter Field Voltage
Generator Field Voltage
Fig. 10. Further improvements with gain settings increasingderivative (KD).
8/7/2019 27816805d01
http://slidepdf.com/reader/full/27816805d01 6/7
lag. Theactual critical frequencydepends upon themachine time constant; the larger the machinetimeconstant, the lower thecritical frequency. Forthis system, the range of 150 to 180 ° phase lag inthe range of 0.1 to 0.3 Hz represents the potentialoscillating area of the generator, which when com-bined with the overall loop gain of the generator,
exciter, andvoltage regulatorcan result in instabil-ity if the gain is equal to one. The excitation stabil-
ity network minimizes the lagging phase shift toprovide a stable and quickly responding system.
Fig. 13 illustrates the Bode plot of the digitalexcitation system utilizing optimized PID gainsnoted in Fig. 10 and Table V. Notice how the gainremains relatively flat from .05 to 0.2 Hz, thenpeaks (3 dB above nominal) and rolls off as the sig-
nal frequency increases. The slight gain rise at 0.2Hz provides desirable positive damping and com-
IEEE Industry Applications Magazine I March/April 200142
Table III. Results of Increased PID GainsStarting Generator V ac Final Generator Voltage Generator Voltage
Overshoot from Final Settling Value
Rise tTme to Reach Peak Voltage Recovery Time
12,483 13,107 120 2.0 s 4.5 s
KG – loop gain KD – derivative gain KP – proportional gain KI – integral g
10 120 200 30
Exciter field forcing 110 V dc Exciter field response underdamp -15 V dc
110 V dc Under damp -15 V dc
Table IV. Results of Further Modification to PID GainsStarting Generator V ac Final Generator Voltage Generator Voltage
Overshoot from Final Settling Value
Rise Time to Reach Peak Voltage Recovery Time
12,552 13,180 48 1.5 s 3.2 s
KG – loop gain KD – derivative gain KP – proportional gain KI – integral g
10 150 300 30
Exciter field forcing Exciter field response
140 V dc Under damp -25 V dc
Table V. Results of Further Improvements to Gain SettingsStarting Venerator V ac Final Generator Voltage Generator Voltage
Overshoot from Final Settling Value
Rise Time to Reach Peak Voltage Recovery Time
12,544.8 13,171 5 V ac 1.5 s 1.5 s
KG – loop gain KD – derivative gain KP – proportional gain KI – integral g
10 200 300 30
Exciter field forcing Exciter field response
150 V dc -10 V dc
Table II. Initial Performance Settings for PID ControllersStarting Generator V ac Final Generator Voltage Generator Voltage
Overshoot from Final Settling Value
Rise Time to Reach Peak Voltage Recovery Time
12,552 13,180 168 4.5 s 14 s
KG – loop gain KD – derivative gain KP – proportional gain KI – integral g
10 100 80 20
Excitation field forcing Field response
90 V dc Very sluggish
8/7/2019 27816805d01
http://slidepdf.com/reader/full/27816805d01 7/7
pliments the performance observed during thevoltage step responsesin Fig. 10as beingoptimal.
Tools for Easier Programming To simply the process of custom tuning the excita-tion, tools are available in the excitation system toprovide starting gains for the PID settings needed
for commissioning. The often-provided graphicaluser interface screens are used to help select thePID numbers for the excitation controller stabil-ity. Here, the time constant of the generator fieldsis typed into a user screen and the PID numbers areautomatically calculated. Step responses are thenperformed to verify system performance.
Although this article focuses primarily on PIDsettings of the voltage regulator controller, othercontrol loops such as excitation limiters, var/PFcontrollers [10], and field-current regulators uti-lize similargain-setting techniquesfor control sys-tem optimization. As before, step responses areagain used to verify that thesettingsin thecontrol-
lers will deliver stable operation when limits arereached or other modes enabled.
Conclusion It has become increasingly important to have anoptimally tuned excitation system to provide thehighest degree of reliability possible for the sys-tem. The use of digital controllers helps dramati-cally improve the transient stability of the systemwith tools to easily achieve ideal performance [11].Tuning of the overall system can be accomplishedin a short periodof time, evenif the datasuppliedisincorrect. The changing of parameters can bequickly accomplished.This is not thecase with theanalog-type regulator used here. Certain startupfunctions can be easily accomplished, such as stepchanges and monitoring of operating levels, withthe internal functions of the digital program. Newtechnology provides a medium to achieve a higherstandard of quality control in generation.
References [1] K.A. Riddle, “Renovation of a paper mill steam driven tur-
bine-generator,” presentedat IEEE Pulpand PaperTechni-cal Conference, Rome, GA, 1995.
[2] A. Godhwani, M.J. Basler, and T.W. Eberly, “Commis-sioning and operational experience with a modern digitalexcitation system,” IEEE Trans. Energy Conversion, vol. 13,pp. 183-187, June 1998.
[3]A. Godhwaniand M.J.Basler, “Design, test, andsimulationresults of a var/power factor controller implemented in amodern digital excitation system,” presented at the IEEEPower Engineering Society Summer Meeting 1998, SanDiego, CA.
[4] A. Godhwani and M.J. Basler, “An under and over excita-tion limiter implementation in a digital excitation systemfor synchronous generator,” presented at IEEE/PES WinterMeeting, New York, NY, 1999.
[5] R.C. Schaefer, “Application of static excitation systems forrotating exciter replacement,” presented at IEEE Pulp andPaper Technical Conference, Cincinatti, OH, 1997.
[6] A. Godhwani and M.J. Basler, “Supplemental control in amodern digitalexcitationsystem,”submittedfor publication.
[7] R.C. Schaefer, “Steam turbine generator excitation systemmodernization,” presented at the IEEE Pulp and PaperTechnical Conference, Rome, GA, 1995.
[8] IEEE Guide for Identification, Testing, and Evaluation of theDynamic Performance of Excitation Control Systems, IEEE Std421.2, 1990.
[9] R.C. Schaefer, “Voltage regulator influence on generatorstability,” presented at Waterpower, 1991.
[10] R.C. Schaefer, “Voltage versus var/power factor regulationon hydro generators,” presented at the IEEE Power SystemRelaying Conference, 1993.
[11] IEEE Guide for Specification for Excitation Systems, IEEE Std421.4, 1990.
IEEE Industry Applications Magazine I March/April 2001 43
0 0− 20− 40− 60− 80− 100− 120− 140− 160− 180
.1 1.0 10..01(Hz)
Machine/Regulator Oscillating Frequency
Phase Shift In De grees
.004
Exciter Field
Generator FieldExciter +Generator Field
Fig. 11. Phase shift of the exciter field, the generator field, and the sum of the two.
Gain (dB) Phase (deg)20
− 2
− 10− 12− 14− 16− 18− 20− 22− 24− 26− 28− 30
− 6− 4
− 8
0− 20− 40− 60− 80− 100− 120− 140− 160− 180− 200
1010.10.01
Gain (dB) Phase (deg)
Frequency (Hz)
Fig. 12. Bode plot of off-line frequency response with analogvoltage regulator.
Gain (dB) Phase (deg)100
50
0
− 50
− 100
− 150− 15
− 10
− 5
0
5
10
Gain (dB) Phase (deg)
0.01 0.1 1 10Frequency (Hz)
Fig. 13. Bode plot of off-line frequency response with digital voltage regulator.


