
27051720.pdf
36
INFO 0549 CA9600120 VOL 11 Ne 1 5 1*1 Atomic Energy Commission de contrôle Control Board de l'énergie atomique Canada
-
Upload
anonymous-pe8vwrewq -
Category
Documents
-
view
212 -
download
0
Transcript of 27051720.pdf

INFO 0549
CA9600120
VOL 11 Ne 1 5
1*1 Atomic Energy Commission de contrôleControl Board de l'énergie atomique Canada

INFO-0549
Seismic Response of thePickering Pressure Relief
Duct to the 1985Nahanni Earthquake
by
Dr. A. Ghobarah
Prepared forthe Atomic Energy Control Board
under its Regulatory Researchand Support Program
Ottawa, Canada
AECB Project No. 2.248.4
May 1995
Atomic Energy Commission de contrôleControl Board de l'énergie atomique Canad'â

- I l l
SEISMIC RESPONSE OF THE PICKERING PRESSURERELIEF DUCT TO THE 1985 NAHANNI EARTHQUAKE
A report prepared by Dr. A. Ghobarah under contract to the Atomic Energy Control Board.
ABSTRACT
The objective of this study is to examine the structural response of the Pickering PressureRelief Duct when subjected to the ground motion records of the 1985 Nahanni earthquake(December 23, 05:16 GMT, Site 1 - Iverson, N.W.T.). It also includes an estimate of thepossible impact on the nuclear safety function of the duct.
The structural models developed in an earlier study (AECB project 2.248.1, INFO-0548)were used in this analysis. The response to the earthquake ground motion was determined onthe basis of the estimated capacities of various structural components of the duct. The abilityof the structure to fulfil its nuclear safety function is discussed.
RÉSUMÉ
Cette étude vise à examiner la réaction structurale de la conduite de sûreté contre lasurpression de la centrale de Pickering soumise aux mouvements du sol enregistrés lors dutremblement de terre de la Nahanni en 1985 (23 décembre, 05:16 TU, site 1 - Iverson(T.N.-O.). L'étude comprend aussi une estimation de l'impact possible sur le rôle duconduit sur le plan de la sûreté nucléaire.
Pour cette analyse, on a utilisé les modèles structuraux mis au point dans le cadre d'uneétude antérieure (projet 2.248.1 de la CCEA, INFO-0548). La réaction aux mouvements dusol causés par le tremblement de terre a été établie en fonction des capacités estimées desdivers éléments structuraux de la conduite. On discute de la capacité de la structure de jouerson rôle sur le plan de la sûreté nucléaire.
DISCLAIMER
The Atomic Energy Control Board is not responsible for the accuracy of the statements madeor opinions expressed in this publication and neither the Board nor the author assumesliability with respect to any damage or loss incurred as a result of the use made of theinformation contained in this publication.

IV
EXECUTIVE SUMMARY
The objective of this study was to examine the dynamic structural response of the PickeringPressure Relief Duct (PRD) when subjected to the recorded components of the December 23,1985, Nahanni, Northwest Territories earthquake, and to evaluate the seismic effect on itsnuclear safety function. An earlier study of the seismic assessment of the PRD (AECBproject 2.248.1) developed computer models that were used to provide a detailed picture ofthe structural performance of the PRD during an earthquake.
The Nahanni analysis suggests that the PRD would undergo large inelastic deformations.The resulting displacements are beyond the deformation capabilities of the seals at thePRD /Reactor Building (PRD/RB) connections. A failure mechanism is predicted to occur inthe two-legged Centre Pier. While a collapse mechanism is not expected to form in thelongitudinal or the transverse directions of the other PRD support frames, there are largedisplacements and high rotational ductility demands where plastic hinges are formed. Themaximum dynamic displacements were calculated to be about 5.6 inches in the longitudinaldirection, and 5.8 inches and 6.4 inches in the transverse directions of the frames and CentrePier, respectively. Prior estimates of the dynamic withstand capacity of the PRD (AECBproject 2.248.1) suggest collapse could occur with displacements of 10 inches, 7.35 inchesand 4.3 inches in the corresponding longitudinal and transverse directions of the frames andCentre Pier.
It is expected that the collapse of the Centre Pier and the excessive inelastic deformation ofthe PRD supporting frames could cause collapse of the PRD by progressive failure of theframe components. Sudden shear failure of the frame beams could occur if the highrotational ductility demands at the moment hinges cause degradation of the concrete shearstrength.

V
TABLE OF CONTENTS
Page
ABSTRACT iii
EXECUTIVE SUMMARY iv
LIST OF ACRONYMS vi
1. OBJECTIVES 1
2. INTRODUCTION 1
3. INPUT GROUND MOTION 2
4. DYNAMIC ANALYSIS 17
4.1 Longitudinal direction 174.2 Transverse direction 184.3 Vertical direction 19
4.4 PRD/RB connection stub seal 19
5. PRD RESPONSE 26
6. CONCLUSIONS 28
REFERENCES 30

VI
LIST OF ACRONYMS
A/V Ratio of peak ground acceleration in g to peak ground velocity in m/s
AECB Atomic Energy Control Board
CP Centre Pier
Fl & F2 PRD supporting frames 1 and 2
GMT Greenwich Mean Time
GS Generating Station
Hz Hertz (cycles per second)
Ms Magnitude of earthquake
PGA Peak ground acceleration
PGV Peak ground velocity
PRD Pressure Relief Duct
PI & P2 PRD supporting piers 1 & 2
R Epicentral distance
RB Reactor Building
RBI,2 Reactor Buildings 1 & 2
2-D Two dimensional
3-D Three dimensional

1. OBJECTIVES
The objectives of this study were:
1. to examine the structural response of Pickering Pressure Relief Duct when subjected to the
ground motion records of the 1985 Nahanni earthquake of December 23,05:16 GMT,
(recording station: Site 1 - Iverson, N. W. T.).
2. to estimate the possible impact of the duct's structural response on its nuclear safety
function.
2 . INTRODUCTION
In an earlier study, Ghobarah (1993) conducted comprehensive investigations to evaluate the
seismic withstand capacity of various components of the structural system of the Pressure Relief
Duct (PRD) of the Pickering GS. A representative section of the structure was modelled.
Analytical 3-D simulations were used to determine the dynamic characteristics and linear elastic
response of the structure. Additional 2-D inelastic nonlinear dynamic analysis provided the duct's
response to severe levels of gTound motion. An increasing level of ground motion, in the form of
a generated time history, was input. The capacity of various duct components were established on
the basis of performance criteria consistent with its safety function. The PRD/Reactor Building
(RB) connections and seals (expansion-joints) were identified as critical areas that are vulnerable to
large relative displacements.
The task for this project phase was to investigate the structural response of the PRD when
subjected to ground-motion time-history records of the 1985 Nahanni earthquake. This is
considered to be a reasonable ground motion input in comparison to the severe, worst-case seismic
condition scenario assumed in the earlier study (AECB Project no. 2.248.1). The analytical
simulations are carried out using the dynamic models for the PRD developed by Ghobarah (1993)
in the AECB Project no. 2.248.1.

In the following sections of the this report, the 1985 Nahanni earthquake is described. The
recorded ground motion and its 5% damped response spectra are presented. The response
spectrum of the Nahanni records was compared with the envelope spectrum developed by
Ghobarah (1993) that was used to determine the withstand capacity of the PRD, The dynamic
response of the PRD to the selected components of the Nahanni records was determined and the
status of potential damage to the structure that might affect its safety function was analyzed.
3 . INPUT GROUND MOTION
On October 5,1985, an earthquake occurred near the North Nahanni River in the northeast
Cordillera, Northwest Territories. The earthquake measured a magnitude Ms 6.6. Unfortunately,
there were no instruments in the area. To record the aftershocks, three Kinemetrics SMA-1 type
accelerographs were installed near the centre of activities. The instruments were bolted to bedrock.
On December 23, at 05:16 GMT, an event of magnitude Ms 6.9 occurred at about the same
location as the October 5 shock. The focal depth of the December 23 earthquake was estimated at 6
km. The earthquakes were the largest ever recorded in this region of the Cordillera and were felt at
distances of over 1500 km.
The three installed stations recorded the December 23,05:16 GMT event, as summarized in Table I
with the strong motion lasting 10 to 12 seconds. The records were discussed by Weichert et al.
(1986a and b) and Wetmiller et al. (1988). The Iverson (Site 1) records show quick buiid up with
distinct subevents near 3, 6, 8 and 9 seconds. They exhibited several horizontal acceleration cycles
about 0.60 to 1.20 g and a large vertical peak. Unfortunately, the recording range of the
accelerographs was set at 1.0 g full scale. Several peaks including the principal peak estimated to
be about 2.3 g were truncated. The longitudinal, transverse and vertical records from Site 1
(plotted as figures 1,2 and 3) show the recorded ground acceleration time histories. The
corresponding ground velocity and ground displacement plots were obtained by integration.
Although a number of peaks exceeded the 1.0 g recording range specification of the instrument, all
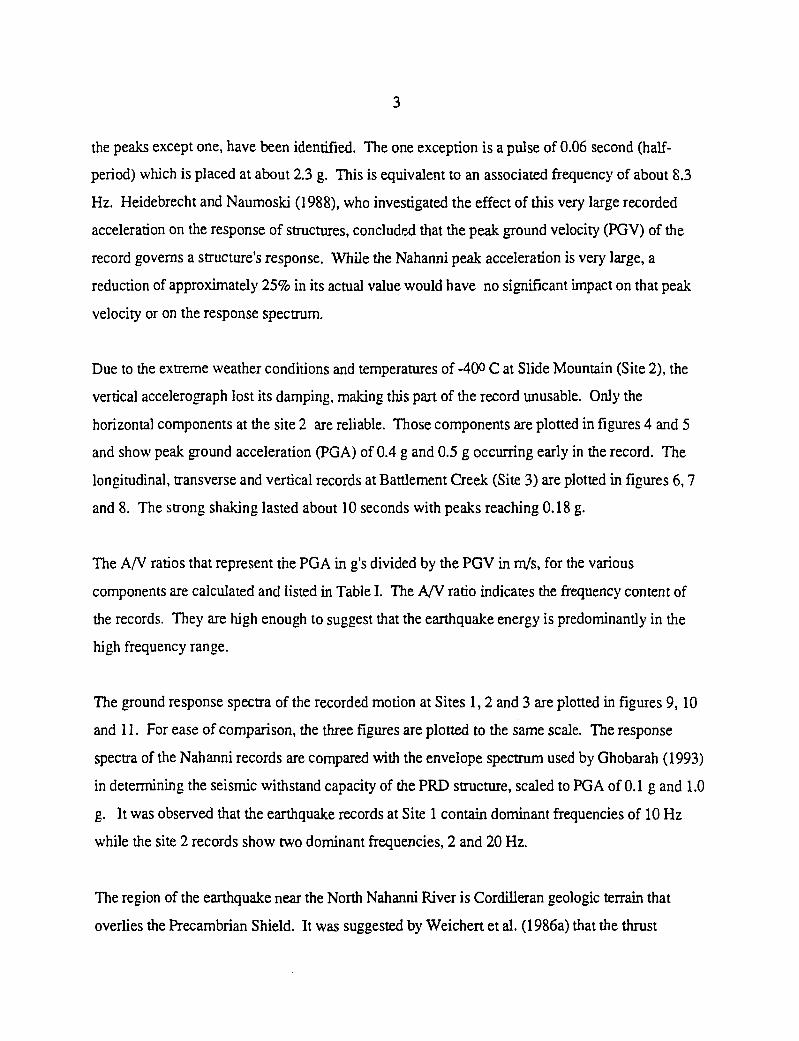
the peaks except one, have been identified. The one exception is a pulse of 0.06 second (half-
period) which is placed at about 2.3 g. This is equivalent to an associated frequency of about 8.3
Hz. Heidebrecht and Naumoski (1988), who investigated the effect of this very large recorded
acceleration on the response of structures, concluded that the peak ground velocity (PGV) of the
record governs a structure's response. While the Nahanni peak acceleration is very large, a
reduction of approximately 25% in its actual value would have no significant impact on that peak
velocity or on the response spectrum.
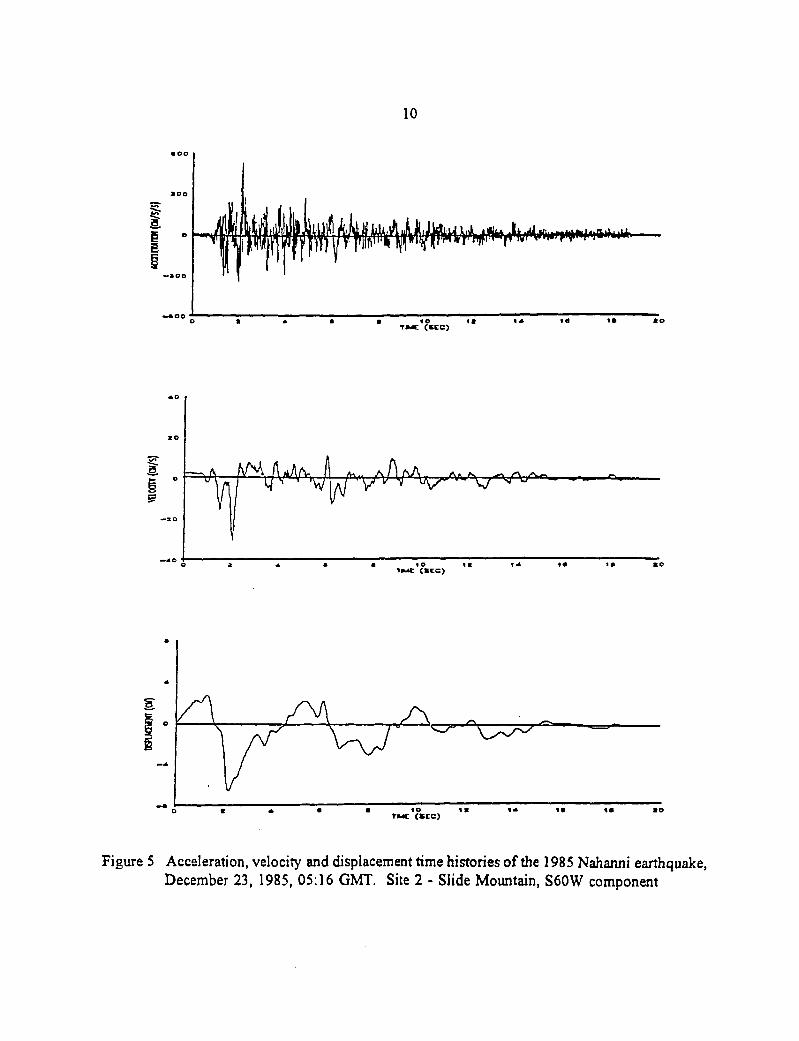
Due to the extreme weather conditions and temperatures of -400 C at Slide Mountain (Site 2), the
vertical accelerograph lost its damping, making this part of the record unusable. Only the
horizontal components at the site 2 are reliable. Those components are plotted in figures 4 and 5
and show peak ground acceleration (PGA) of 0.4 g and 0.5 g occurring early in the record. The
longitudinal, transverse and vertical records at Battlement Creek (Site 3) are plotted in figures 6,7
and 8. The strong shaking lasted about 10 seconds with peaks reaching 0.18 g.
The A/V ratios that represent the PGA in g's divided by the PGV in m/s, for the various
components are calculated and listed in Table I. The A/V ratio indicates the frequency content of
the records. They are high enough to suggest that the earthquake energy is predominantly in the
high frequency range.
The ground response spectra of the recorded motion at Sites 1,2 and 3 are plotted in figures 9,10
and 11. For ease of comparison, the three figures are plotted to the same scale. The response
spectra of the Nahanni records are compared with the envelope spectrum used by Ghobarah (1993)
in determining the seismic withstand capacity of the PRD structure, scaled to PGA of 0.1 g and 1.0
g. It was observed that the earthquake records at Site 1 contain dominant frequencies of 10 Hz
while the site 2 records show two dominant frequencies, 2 and 20 Hz.
The region of the earthquake near the North Nahanni River is Cordilleran geologic terrain that
overlies the Precambrian Shield. It was suggested by Weichert et al. (1986a) that the thrust

mechanism, regional stress regime, shallow focal depth and high velocity sedimentary rocks in the
focal region and particularly the near field strong ground motion recorded for the December 23
event is ideal engineering design data for critical facilities in Eastern North America. Weichert
considered the earthquakes to be typical of those that are expected to occur in the active zones of
Eastern Canada. Implications of the Nahanni event for Eastern Canada were also discussed by
Wetmilleretal.(1987).
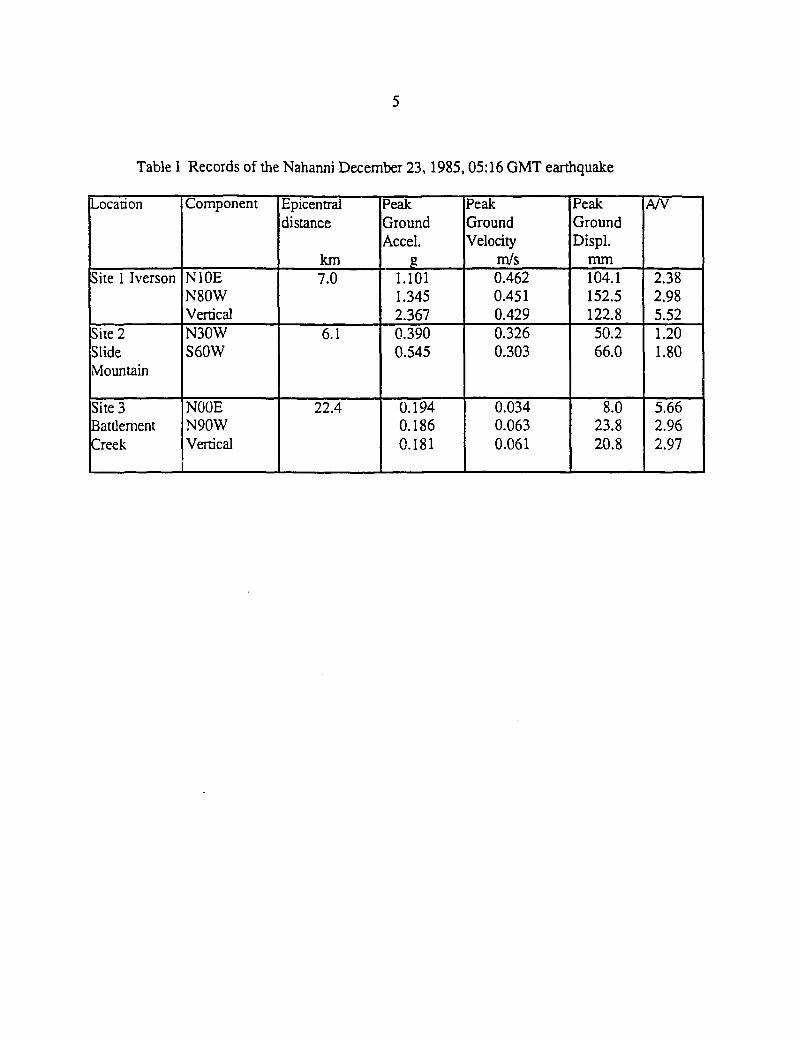
Table I Records of the Nahanni December 23,1985,05:16 GMT earthquake
Location
Site 1 Iverson
Site 2SlideMountain
Site 3BattlementCreek
Component
N10EN80WVerticalN30WS60W
N00EN90WVertical
Epicentraldistance
km7.0
6.1
22.4
PeakGroundAccel,
g1.1011.3452.3670.3900.545
0.1940.1860.181
PeakGroundVelocity
m/s0.4620.4510.4290.3260.303
0.0340.0630.061
PeakGroundDispl.
mm104.1152.5122.850.266.0
8.023.820.8
A/V
2.382.985.521.201.80
5.662.962.97

I
ID IS
Taxe (scc>
ÏÏ i/-V V
«• to
Figure 1 Acceleration, velocity and displacement time histories of the 1985 Nahanni earthquake,December 23, 1985, 05:16 GMT. Site 1 - Iverson, N10E component

I
1 0
10 it u
(mcc)
Figure 2 Acceleration, velocity and displacement time histories of the 1985 Nahanni earthquake,December 23, 1985, 05:16 GMT. Site 1 - Iverson, N80W component

m «oTIMC (SCC)
1O IX1IMC (SCC)
IO 11TfcC (SCC)
Figure 3 Acceleration, velocity and displacement time histories of the 1985 Nahanni earthquake,December 23, 1985, 05:16 GMT. Site 1 - Iverson, vertical component

S
A
1O IBTIMC (SCC)
\y
• ID IIT»*C («tc>
<• so
Figure 4 Acceleration, velocity and displacement time histories of the 1985 Nahanni earthquake,December 23, 1985, 05:16 GMT. Site 2 - Slide Mountain, N30W component
10
in <• * o
,A/\A" W A V V
o a
Figure 5 Acceleration, velocity and displacement time histories of the 1985 Nahanni earthquake,December 23, 1985, 05:16 GMT. Site 2 - Slide Mountain, S60W component

11
Ii
1» «O
I
<o «aTIMG (SCC)
\s \J \7
C'(°.CC)
Figure 6 Acceleration, velocity and displacement time histories of the 1985 Nahanni earthquake,December 23, 1985, 05:16 GMT. Site 3 - Battlement Creek, NOOE component

12
i
>f \A M Al if
g
10 ItC (CCC)
• • «• «0
Figure 7 Acceleration, velocity and displacement time histories of the 1985 Nahanni earthquake,December 23, 1985, 05:16 GMT. Site 3 - Battlement Creek, N90E component

13
1O IST « (SCC)
A. .yv
T»*C (scc>
• • to it «*TM (SCC)
Figure 8 Acceleration, velocity and displacement time histories of the 1985 Nahanni earthquake,December 23, 1985, 05:16 GMT. Site 3 - Battlement Creek, vertical component

ENVELOPE (1.0 g)
ENVELOPE" (0.T g)
100.0
FREQUENCY (Hz)
Figure 9 Response spectra of the records from Site 1 - December 23, 1985 Nahanni earthquakeand the Envelope spectrum (Ghobarah 1993) - 5% damping

5-
3
LU
IIIOo< 2
ENVELOPE (1;0 g)
N30W
ENVELOPE (ÔTg)
S60W
100.0FREQUENCY (Hz)
Figure 10 Response spectra of the records from Site 2 - December 23, 1985 Nahanni earthquakeand the Envelope spectrum (Ghobarah 1993) - 5% damping

5-
4-
O
3-
OO< 2-\
1-
ENVELOPE (1.0 g)
,<• i
ENVELOPE (Q:
NORTH
VERTICAL
0.1 1.0FREQUENCY (Hz)
Figure 11 Response spectra of the records from Site 3 - December 23, 1985 Nahanni earthquakeand the Envelope spectrum (Ghobarah 1993) - 5% damping
100.0

17
4 . DYNAMIC ANALYSIS
The dynamic response of the PRD was evaluated with the duct being subjected to two horizontal
and one vertical ground motion time histories that were assumed to be applied simultaneously. In
each of the duct's longitudinal and transverse directions, two horizontal records (NIOE and
N80W) from Site 1 of the December 23,1985, Nahanni earthquake, are used. The records are
characterized by a large number of strong motion cycles. The number of excursions into the
inelastic range that correspond to the number of strong motion peaks, affects structural damage.
The PRD responses were computed using the probable strength models.
4.1 Longitudinal Direction
The displacement time history in the longitudinal direction of the PRD due to the two horizontal
components of the December 23,1985, Nahanni earthquake (Site 1) is shown in figures 12 and
13. The structural response in the longitudinal direction indicates that the shear strength capacity of
the anchor rods between the PRD and the RB is exceeded in the first few seconds of the
earthquake. Progressive hinging in the longitudinal model is also predicted in figures 12 and 13.
The analysis predicts a nonlinear structural response (the shift in oscillations away from the zero
baseline)although the nonlinearity appears to be rather weak. The peak longitudinal displacement
of 5.6 inches occurs at approximately the 10 second time mark for the case of the NIOE
component. At the end of the earthquake, a permanent displacement of about 1.0 inch is shown.
The response to the NIOE component indicates that eight inelastic hinges form in the beams of the
supporting frames Fl and F2 at the Reactor Buildings 1 and 2 (RBI & RB2). The locations of
these hinges when the duct is subjected to the N80W component are similar to the NIOE
component case, but only seven hinges instead of eight are expected to form. In addition, the
sequence of hinging is predicted to be slightly different. The results of the analysis suggests that a
collapse mechanism is unlikely in the longitudinal direction.

18
4.2 Transverse Direction
The longitudinal analysis suggests that the anchor rods at the PRD/RB connection are sheared in
the first few seconds of this earthquake, thus, the transverse motions of the frames and Centre Pier
(CP) are unconstrained. Predictions of the transverse displacement response of frames Fl and F2
(when no anchor rods are acting in tension) are shown in figures 14 and 15 for the two horizontal
components of the recorded ground motion.
The computer model predicts nonlinear responses in both frames. The one-sided response occurs
because the PRD strikes the RB stub. The first and third hinges are predicted to form at both ends
of the top beam when the PRD and its underlying frame strike the RB connection stub. The top
beam of the frame could be subjected to its full plastic moment capacity and associated shear
stresses relatively early in the earthquake. Additional hinges formed in the column and lower beam
as well. The maximum displacement could be as large as 5.8 inches. The analysis suggests there
would be a noticeable shift in the zero baseline as the structure undergoes inelastic or plastic
deformation. The permanent offset displacement of the frame at the end of the response plot was
estimated to be about 3 inches. When the PRD structure was subjected to the Nahanni earthquake,
a collapse mechanism was not predicted in frames Fl and F2. However, the rotational ductility
demands at the hinges are very high. There is concern that shear strength degradation is possible
which could cause shear failure at the plastic hinges.
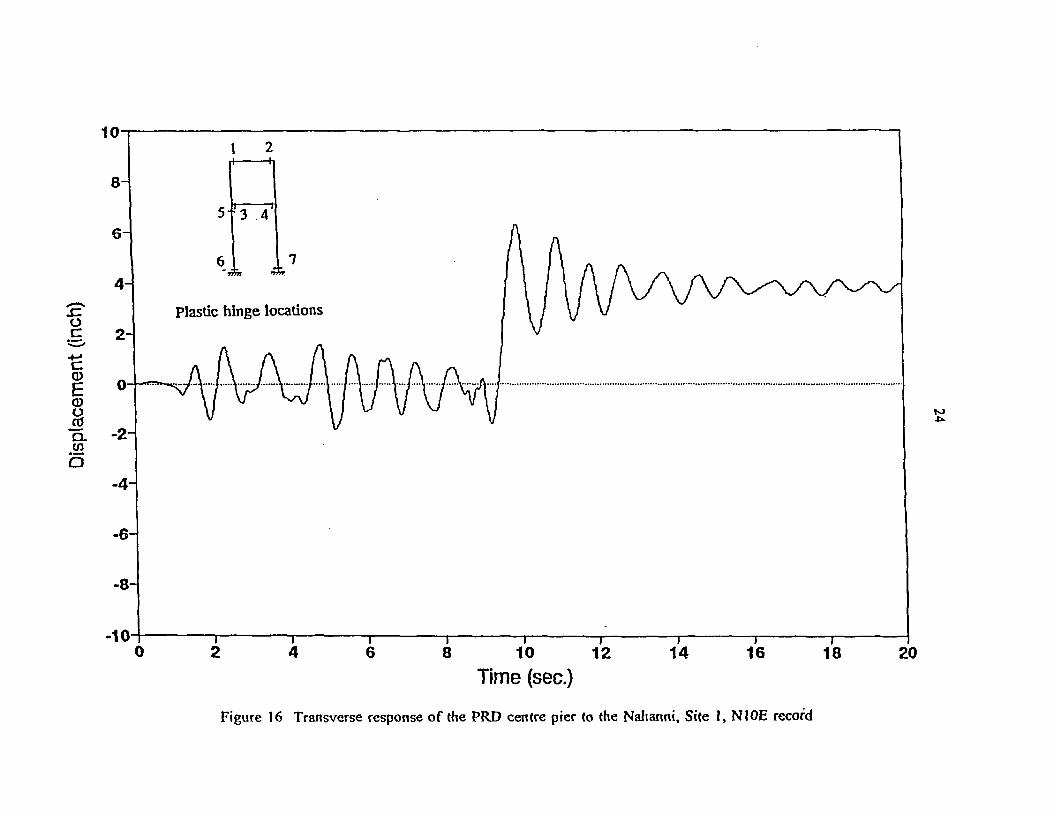
The predicted responses of the CP when the structure is subjected to the N10E and to the N80W
Nahanni earthquake records are shown in figures 16 and 17. In both cases, a failure mechanism
was predicted to form in the CP beams and columns, although the sequence of hinging was
slightly different in each case. The predicted response to the N10E component shows a strong
nonlinear behaviour. A maximum displacement of approximately 6.4 inches indicates that a
potential failure mechanism could occur about 9.75 seconds from the start of the record. Although
the analysis indicates limited displacement, it is unlikely that the CP structure would remain stable.
There are large rotational ductility demands and displacements that exceed the 4.3 inch dynamic

19
failure displacement obtained from the nonlinear analysis in AECB Project no. 2.248.1.
4.3 Vertical direction
The vertical ground motion record from the 1985 Nahanni earthquake (December 23, Site 1 -
Iverson) was applied to the duct. The response of the PRD to the vertical input time history was
found to remain in the elastic range well beyond the events of interest resulting from the horizontal
ground motion. The levels of generated displacements are also found to be within the ±1 inch
tolerance at the PRD/RB connection. The effect of the vertical component of ground motion was
judged to have negligible influence on the nonlinear dynamic response of the PRD system.
However, the high frequency of the vertical response may be significant in the design of equipment
and secondary systems attached to the PRD.
4.4 PRD/RB Connection Stub Seal
The maximum relative displacements between the PRD and RB connection stub, in both
longitudinal and transverse directions, were calculated to be 5.6 and 5.8 inches, respectively. To
ensure containment remains functional, these displacements should not exceed the maximum
tolerable displacements for the PRD/RB connection stub seal. The geometry of the seal (drawing
reference NA44-DG-25200-1002) was used to compute maximum tolerable limits of relative
movement across the seal. For longitudinal motion of the PRD, in which the seal is extended
diagonally, the maximum tolerable differential movement across the seal is 3 inches. For
transverse motion of the PRD, in which the seal is extended into a flat position across the gap, the
allowable extension is 3/4 inches.
The calculated maximum relative displacements exceed the maximum tolerable differential
movement across the seal. These limits consider only movements to extend the seal to a flattened
position, and do not consider elastic stretching of the seal material.

10
8-
6-
t *J
3 .7
J 3
O» P2 F2 PI ri
Plastichinge locations
-100
Time (sec.)
Figure 12 Longitudinal response of the PRD to the Nahanni, Site 1, N10E record
too

£2Oc
cCDCDO
JSQ.tn
a
Plastic hinge locations
-10
Time (sec.)
Figure 13 Longitudinal response of the PRD to the Nahanni, Site 1, N80W record
t-o

10
szoc
CD
CD
Q .CO
8-
6-
4-
2-
0-
-2-
-4-
-6-
-8-
-10-
North1 3
Plastic hinge locations
~r2 6 8 10 12
Time (sec.)
T14
J16
T18 20
Figure 14 Transverse response of the PRD frames to the Nahanni, Site I, NIOE record

SIoc
CD
Jb
10
8-
6-
4-
2-
0-
-2-
-4-
-6-
-8-
-10
North
i 3
Plastic hinge locations
i
2i
418
i10
Time (sec.)
i12
i14
i16
i18 20
Figure 15 Transverse response of the PRD frames to the Nahanni, Site 1, N80W record
SIoc
cQ)
EQ)sD.
Plastic hinge locations
-10
K»
Time (sec.)
Figure 16 Transverse response of (he PRD centre pier to the Nahanni, Site I, N10E record

o
CD
CD
ovaQ.GO
b
Plastic hinge locations
Time (sec.)
Figure 17 Transverse response of the PRD centre pier to the Nahanni, Site 1, N80W record
K>

26
5 . PRD RESPONSE
The fundamental frequencies of the PRD in the longitudinal and transverse directions, as assessed
by Ghobarah (1993), are in the range of 0.8 -1.0 Hz when the PRD is allowed to move freely
within the ±1 inch expansion gap at the PRD/RB connections or after the anchor rods have failed.
Thus the dynamic response is dominated by low frequency behaviour. In the vertical direction, the
fundamental PRD frequency is greater than 7 Hz. Seismic response in the vertical direction should
not cause concern for the PRD structure. However, equipment and other components contained in
or attached to the PRD may be susceptible to these high frequency responses.
Dynamic analyses indicate that the expansion gap at the PRD/RB connection (assumed to be ±1
inch) will close under relative longitudinal motion between the PRD and the RB, causing the
anchor rods to begin to be loaded in shear. The anchor rods will also be stressed in tension due to
the transverse response of the PRD. The shear capacity of the anchor rods between the PRD and
the RB will be exceeded. The analysis predicts that the first hinges will form in the upper
transverse (north-south) beams of the piers and frames. The maximum dynamic displacements are
determined to be 5.6 inch in the longitudinal direction, and 5.8 inch and 6.4 inch for the transverse
directions of the frames and CP, respectively. Collapse mechanisms should not form in the
longitudinal or the transverse directions of the frames.
At this stage, the maximum dynamic displacements of the PRD should be less than that needed to
cause collapse mechanisms in the longitudinal and transverse frame directions, or approximately
10 inches and 7.35 inches, respectively. However, a failure mechanism could form in the
transverse direction of the CP. The transverse displacement of the CP is larger than the ultimate
displacement of 4.3 inches. It is expected that the PRD frame supports could suffer damage and
collapse by progressive failure of the frame components. Large inelastic deformations,
accompanied by rotational ductility demands on the plastic hinges of the frame beams may be too
great for the hinges to sustain. Shear strength degradation accompanied by premature shear failure
may be expected.

27
The response of the duct as assessed in this investigation is consistent with the results obtained
from the earlier study (AECB project 2.248.1). The link is the comparison between the response
spectra of the earthquake records with the envelope spectrum scaled to give comparable values at
the frequencies of free vibration of the structure. For example, the transverse fundamental
frequency of the piers is assessed to be 1.43 Hz when the duct is assumed fixed at the RB. At this
frequency, the spectral acceleration of the N80W record of the Nahanni earthquake is 0.48 g, as
shown in figure 9. The spectral acceleration of the envelope spectrum scaled to 1.0 g at 1.43 Hz is
2.77 g. In other words, scaling the envelope spectrum by PGA of 0.24 g will produce spectral
acceleration of 0.48 g at 1.43 Hz which coincides with that of the N80W record spectrum at the
same frequency. Although the degree of damage depends on the characteristics of the actual time
history, the results obtained from the 1985 Nahanni earthquake are surprisingly close to the
damage picture obtained by using the artificial earthquakes in the previous study.

28
6. CONCLUSIONS
The analyses of the PRD response to the selected records from the December 23,1985, Nahanni
earthquake (Site 1 - Iverson), led to the following conclusions:
1. The displacement limit on the PRD/RB seal is exceeded in both the longitudinal (east-west)
and transverse (north-south) directions. The containment function of the PRD (e.g., at the
PRD/RB seal) would be impaired if those large displacements rip the seal membranes.
2. The connecting anchor rods at the PRD/RB connection are expected to fail when they
reach their shear capacity in the longitudinal direction early in the earthquake. Then the
transverse displacement mode becomes critical. Either a shear failure of the beams or the
development of flexural hinging in the frames and CP could occur. Several hinges are
expected to form in the beams and columns of the piers and frames supporting the PRD.
3. The maximum dynamic displacements of the duct were calculated to be 5.6 inches in the
longitudinal direction and 5.8 and 6.4 inches in the transverse directions for the frames
and centre pier respectively.
4. The analyses indicate that collapse mechanisms are not reached in either the longitudinal or
the transverse directions in the frames. However, evaluations of the frame section
capacities indicate that the rotational ductility demands are too large to sustain. Concrete
shear strength degradation accompanied by premature shear failure could be expected at
the hinges.
5. The possibility of the formation of a failure mechanism in the transverse direction of CP is
confirmed by comparing the maximum displacement of 6.4 inches with the ultimate
dynamic displacement at collapse of 4.3 inches (Ghobarah 1993).

29
5. The possibility of the formation of a failure mechanism in the transverse direction of CP is
confirmed by comparing the maximum displacement of 6.4 inches with the ultimate
dynamic displacement at collapse of 4.3 inches (Ghobarah 1993).
6. If the Centre Pier collapses, the failure of the anchor rods and the predicted shear failure of
the frame beams will allow the PRD to collapse by the progressive failure of the frame
components.

30
REFERENCES
Ghobarah, A., 1993. Assessment of the Pickering Pressure Relief Duct.
Atomic Energy Control Board Project No. 2.248.1. Ottawa, Canada. INFO-0548.
Heidebrecht, A. C. and Naumoski, N., 1988. Engineering implications of the 1985 Nahanni
earthquakes. Earthquake Engineering and Structural Dynamics, Vol. 16, No. 5, pages 675-690.
Weichert, D. H., Wetmiller, R. J., Homer, R. B., Munro P. S., and Mork, P. N., 1986a.
Strong motion records from the 23 December 1985, Ms 6.9 Nahanni NWT and some associated
earthquakes. Open File report 86-1-PGC, Pacific Geoscience Centre, Geological Survey of
Canada, Sidney, B. C.
Weichert, D. H., Wetmiller, R. J., and Munro P. S., 1986b. Vertical earthquake acceleration
exceeding 2g? The case of the missing peak. Bulletin of the Seismological Society of America
Vol. 76, pages 1473-1478.
Wetmiller, R. J., Basham, P. W., Weichert, D. H. and Evans, S. G., 1987. The 1985 Nahanni
earthquakes: problems for seismic hazard estimates in the northeast Canadian Cordillera.
Proceedings of the Fifth Canadian Conference on Earthquake Engineering, Ottawa, Canada.
A. A. Balkema Rotterdam, The Netherlands, pages 695-703.
Wetmiller, R. J., Homer, R. B., Hasegawa, H. S., North, R. G., Lamontagne, M., Weichert, D.
H. and Evans, S. G., 1988. An analysis of the 1985 Nahanni earthquakes. Bulletin of the
Seismological Society of America, Vol. 78, No. 2, pages 590-616.


