Let’s Visit Georgia’s Coast: Tybee Island. The coast is where Georgia touches the Atlantic Ocean.

2/6/14 CONVERGE
1
Ocean Convergence: Let’s Get Together
Overview Surface waters move in multiple complex patterns. Convergence and divergence zones occur across multiple scales, from as large as the subtropical/subpolar gyres or the Intertropical Convergence Zone north of the equator to as small as within a bay or stream. Convergence and divergence zones can be seen in rivers, estuaries, lakes, coastal ocean areas, and the open ocean. Convergence zones can occur when water builds up against a landmass, as in along a coastline, or when two currents meet (linear convergence). In a linear convergence zone, also known as a front, the properties of the water (e.g., temperature, salinity, productivity) are significantly different on either side on the convergence zone and there is often a large collection of surface debris, seaweed, and foam. These fronts are often regions of elevated nutrient concentrations and sites of high biological production. Therefore, convergence zones could greatly influence the surrounding ecology by concentrating phytoplankton, which results in a zooplankton boom, which attracts top predators to preferentially forage in the area. Motivating Questions:
• What and where are convergent zones? • How could convergent zones impact the ecology of an
area? Take Home Message Ocean convergent zones occur when water builds up (converges) in a specific area due to the meeting of two ocean currents or when the water meets the coastline. Anything floating in the water column or at the surface collects in a convergence zone. Structure The students will participate in a hands-on activity to explore how convergent zones collect particles in the water. Students will then look at Surface Current maps from Antarctica to find patterns in where convergent zones occur in the Palmer Deep area. Time Required One 45-minute class period Activity Outline Engage: Students will explore how convergent zones collect particles in the water column to specific areas.
10 minutes
Explore: Students will be presented a Surface Velocity map from the West 25 minutes
Materials For the leader: Projector
Computer
Chesapeake Bay Area Map
Dry erase pens (or something to draw on the Chesapeake Bay Area Map)
For the activity: Pie pans (clear if possible)
Play-doh
Confetti (hole punches)
Straws
Surface Current Maps
“Ocean Convergence: Let’s Get Together – Student Worksheets”

2/6/14 CONVERGE
2
Antarctic Peninsula to determine where convergent zones occur. Make Sense: Through a class discussion students hypothesize the impact that convergent zones would have on the ecology of the area.
10 minutes
Total: 45 minutes Audience Middle and early high school students (6th-9th grade).
• Earth Systems Science: Biogeochemical Cycles o o o 5.4.8.G.2 – Investigations of environmental issues address underlying scientific
causes and may inform possible solutions. New Jersey Core Curriculum Content Standards - Science
Content Area Content Statement CPI# Science Practices: Understand Scientific Explanations
Results of observation and measurement can be used to build conceptual-base models and to search for core explanations. 5.1.8.A.2
Evidence is generated and evaluated as part of building and refining models and explanations. 5.1.8.B.1
Carefully collected evidence is used to construct and defend arguments. 5.1.8.B.3
Science Practices: Generate Scientific Evidence Through Active Investigations Scientific reasoning is used to support scientific conclusions. 5.1.8.B.4 Science Practices: Reflect on Scientific Knowledge
Science is a practice in which an established body of knowledge is continually revised, refined, and extended. 5.1.8.C.3
Science involves practicing productive social interactions with peers, such as partner talk, whole-group discussions, and small-group work. 5.1.8.D.1
Science Practices: Participate Productively in Science
In order to determine which arguments and explanations are most persuasive, communities of learners work collaboratively to pose, refine, and evaluate questions, investigations, models, and theories (e.g., argumentation, representation, visualization, etc.).
5.1.8.D.2
Circulation of water in marine environments is dependent on factors such as the composition of water masses and energy from the Sun or wind.
5.4.6.G.1 Earth Systems Science: Biogeochemical Cycles An ecosystem includes all of the plant and animal populations and
nonliving resources in a given area. Organisms interact with each other and with other components of an ecosystem.
5.4.6.G.2
Preparation (30 minutes)
1. Collect enough pie pans for each partner group to have one and enough straws for each
student to use during the demonstration.
2. Prepare the play-doh “coastline” for each pie pan.
3. Add the confetti to the pan and spread it out around the entire area.
4. Make color copies of the Surface Current maps for the groups.

2/6/14 CONVERGE
3
5. Make a copy of the “Ocean Convergence: Let’s Get Together – Student Worksheets”for each student.
6. Write the motivating questions on the board:
Q. What and where are ocean convergent zones?
Q. How could convergent zones impact the ecology of an area?
7. Set up the computer and projector to be able to project the sample HF radar image and the Palmer Deep Area Map.
Engage (10 minutes) 1. As the students come into class have them sit with a partner at each of the pie pans filled with
confetti and the play-doh. Explain to the students that you are about to pass out straws to each person. The students need to sit across from one another, so that they line up on two sides. The students will gently blow through the straw and observe the movement of the confetti. The students then need to draw on their worksheet what happened to the confetti.
2. Ask if there are any clarifying questions about what the students should do. After taking their questions, have one member from each partner group come forward for their straws and “Ocean Convergence: Let’s Get Together – Student Worksheets.” Once they have their straws and have drawn the BEFORE image of the pattern in the confetti they can begin the demonstration.
3. After a minute or so and they have completed their drawings, have the students talk with the partner group next to them about what observations they made about the motion of the confetti.
4. After two minutes, or when the conversations slow down, bring the whole class back together and have volunteers share with the class what observations they made about the confetti. As the students are describing their observations write them down on the board (in their exact words).
* NOTE – The purpose of this activity is to have students explain the phenomenon that they observed in their own words before learning the definitions that oceanographers use to explain convergence zones.
Explore (25 minutes) 1. After the students have completed sharing their observations, lead the students in a reflection
and brainstorm activity to review what they just observed and how it applies to what happens in the ocean. Ask the students the following questions:
a. Could something similar happen to what we observed with water and things floating in the water in the ocean?
b. Where would something like this happen on the Earth?
c. How could we, or scientists in general, know that this is happening in the ocean? What kind of data could we collect?

2/6/14 CONVERGE
4
* NOTE – Be accepting of all answers as this is a brainstorming activity.
2. At the end of the discussion make sure the students understand that:
a. The students demonstrated convergence zones with their demonstrations. Convergence zones occur where currents meet (come against one another) or where wind drives water against a coastline (which the students may have seen if confetti was stuck up against the play-doh). These are areas where the water is collected into one specific area (aka it converges).
3. Continue to lead the discussion to make sure the students understand that scientists can use satellite data of water conditions or chlorophyll (to see phytoplankton) to look at large scale patterns in the ocean. Show the students the satellite images below of sea surface temperature and chlorophyll and point out areas of convergence zones in the maps.

2/6/14 CONVERGE
5
4. However, convergence zones occur on smaller scales, so scientists use High Frequency (HF)
radar to look at surface currents at a much smaller and more localized scale and in near real time. HF radar measures the speed and direction of ocean surface currents. As you are discussing HF radar with the students project the image below (http://blog.marinexplore.com/new-ocean-data-surface-currents-high-frequency-radars/) and talk through the components with them. On the left, the white lines represent surface currents measured using HF Radar in Monterey Bay, CA. The colors on the map show the speed of the surface currents in meters per second (red is fast and blue is slow). On the right, the black lines represent the surface currents. The maroon/red areas indicate convergence zones (where the water is coming together) and the navy/blue areas indicate divergence zones (where the water is moving away).
5. To check that your students understand how to read a convergence/divergence current map, have the students tell you how their demonstrations with confetti relate to the projected map.
a. Where would the confetti be collecting in the map?
6. Explain to the students that they will now be working in small groups to interpret the surface current maps from the Chesapeake Bay area. Each group will be given a different map. The

2/6/14 CONVERGE
6
students need to work together to understand and interpret their map and determine where, and if, the convergence zone is in the map (they should draw on the map the location of the convergence zone). The students will present their map to the class at the end of their five minutes.
7. Pass out the Surface Current Maps to each small group.
* NOTE – Files have been provided for a month-long comparison from December 7, 2013 to January 7, 2014 or a 24-hour comparison from January 1, 2014. It is up to you which comparison you would like to do.
8. Project the prompting questions to guide the students conversations:
a. When was their map created (date and time)?
b. Where was the convergence zone on the map?
9. As the students are talking through their maps, circulate and answer questions as needed.
10. After five minutes have passed (or the students begin to wrap-up their work), have each group report to the class what they were interpreting and their responses to the prompting questions:
a. When was their map created (date and time)?
b. Where was the convergence zone on the map?
11. As the students are presenting their maps, draw on outline of the group’s convergence zone labeled with the date and time on the projection of the Chesapeake Bay area. At the end of the share-out, you will have an image of the Chesapeake Bay area with the different convergence zones outlined either across a month or across a 24-hour day.

2/6/14 CONVERGE
7
Make Sense (10 minutes) 1. Have the students talk with their partner about what patterns or observations they see in the
convergence zone data map of the Chesapeake Bay.
2. After a minute or so, bring the students back together and have volunteers share what they were talking about with respect to convergence zones over time.
3. Once the discussion slows down, point to the first motivating question and review with the students:
Q. What and where are ocean convergent zones?
4. Then ask the students:
a. In terms of the ocean, what kind of things would concentrate in convergence zones (like the pepper did in their demonstrations)? – Convergence zones collect plankton, nutrients,
2/6/14 CONVERGE
8
natural and man-made pollution, or anything else in the water into the specific area (aka they converge).
5. Once the discussion slows down, point to the second motivating question and ask:
Q. How could convergent zones impact the ecology of an area?
6. Ask students to think to themselves about the question. After a minute, ask volunteers to share the ideas with the entire class. Be accepting of all responses from the students as this is a brainstorming activity of how the information they learned in today’s activity will apply forward to the next activity. The students may bring up something like:
a. Many items that collect in the convergence zone are at the base of the food web. If their location moves over time, with the movement of the convergence zone, then the location of where the predators of the items in the convergence zone forage for food also would move.
7. Ask if the students have any final questions about the activities and presentations of the day.

2/6/14 CONVERGE
9
Ocean Convergence: Let’s Get Together – Student Worksheet Name: ________________________ Date: ________________________
1. Draw the pattern of the confetti before and after your group blew “wind” across the “ocean.”
BEFORE AFTER
2. When was your map created (date and time)? ______________________________________________________________________________________________________________________________________________________
3. Did you observe any convergence zones on your map? ________________________ 4. Describe how the convergence zones, or other current patterns, on your map looked in comparison to the patterns in the confetti demonstration.

2/6/14 CONVERGE
10
5. Draw the convergence zones from all of the maps on the map below.
6. What pattern do you observe in the convergence zones over time in the Chesapeake Bay area?
2/6/14 CONVERGE
11
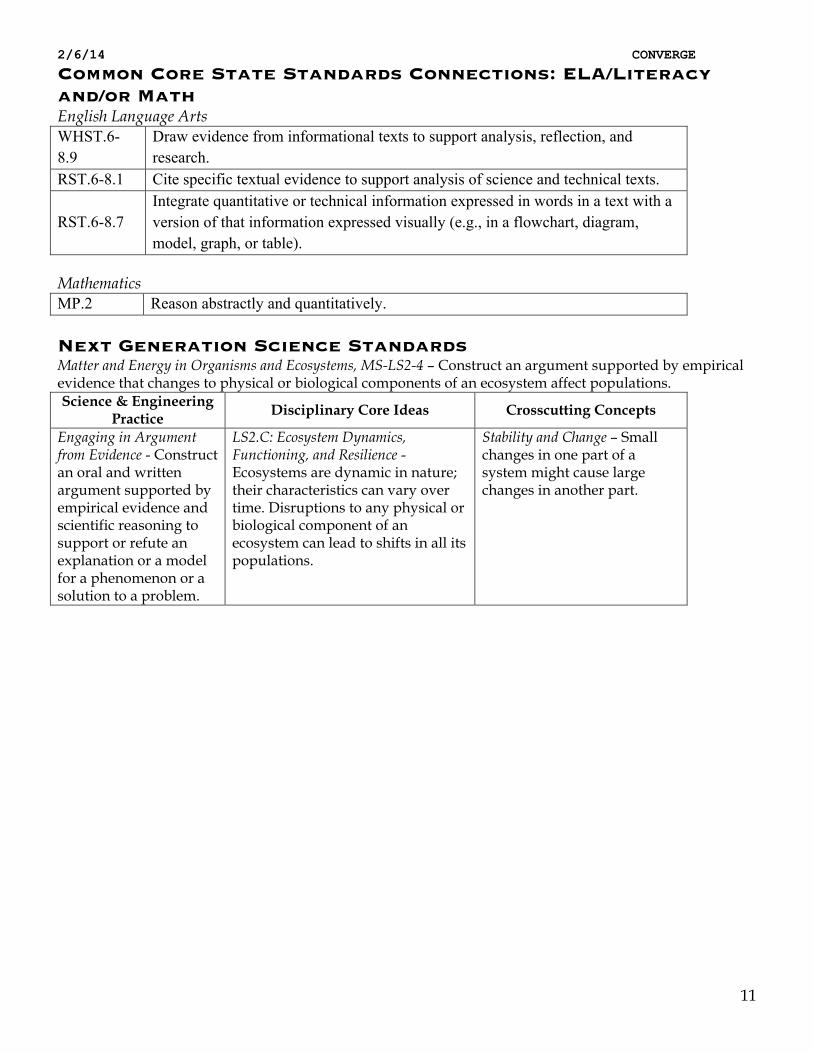
Common Core State Standards Connections: ELA/Literacy and/or Math English Language Arts WHST.6-8.9
Draw evidence from informational texts to support analysis, reflection, and research.
RST.6-8.1 Cite specific textual evidence to support analysis of science and technical texts.
RST.6-8.7 Integrate quantitative or technical information expressed in words in a text with a version of that information expressed visually (e.g., in a flowchart, diagram, model, graph, or table).
Mathematics MP.2 Reason abstractly and quantitatively.
Next Generation Science Standards Matter and Energy in Organisms and Ecosystems, MS-LS2-4 – Construct an argument supported by empirical evidence that changes to physical or biological components of an ecosystem affect populations. Science & Engineering
Practice Disciplinary Core Ideas Crosscutting Concepts
Engaging in Argument from Evidence - Construct an oral and written argument supported by empirical evidence and scientific reasoning to support or refute an explanation or a model for a phenomenon or a solution to a problem.
LS2.C: Ecosystem Dynamics, Functioning, and Resilience - Ecosystems are dynamic in nature; their characteristics can vary over time. Disruptions to any physical or biological component of an ecosystem can lead to shifts in all its populations.
Stability and Change – Small changes in one part of a system might cause large changes in another part.