25696_CNY_Part 1 - NYC Office of the Comptroller - NYC.gov
325
THE CITY OF NEW YORK NEW YORK COMPREHENSIVE ANNUAL FINANCIAL REPORT OF THE COMPTROLLER FOR THE FISCAL YEAR ENDED JUNE 30, 2002 WILLIAM C. THOMPSON, JR. Comptroller
Transcript of 25696_CNY_Part 1 - NYC Office of the Comptroller - NYC.gov

THE CITY
OF
NEW YORKNEW YORK
COMPREHENSIVE
ANNUAL FINANCIAL REPORT
OF THE
COMPTROLLERFOR THE
FISCAL YEAR ENDED JUNE 30, 2002
WILLIAM C. THOMPSON, JR.Comptroller

Compliments of
WILLIAM C. THOMPSON, JR.
Comptroller

RE
PO
RT
OF
TH
E C
OM
PT
RO
LL
ER
FO
R F
ISC
AL
200
2

The City
of
New York
ComprehensiveAnnual Financial Report
of the
Comptrollerfor the
Fiscal Year Ended June 30, 2002
WILLIAM C. THOMPSON, JR.Comptroller
GREG BROOKS
Deputy Comptroller
WARREN RUPPEL
Assistant Comptroller for Accounting
MICHAEL SPITZER
Chief Accountant

William C. Thompson, Jr.Comptroller

Fiscal Year_____________________________________________________________________________2002 2001 2000 1999 1998_______ _______ _______ _______ _______
Revenues (in millions):Real estate taxes . . . . . . . . . . . . . . . . . . . . . . . . . . . . . . . $ 8,761 $ 8,246 $ 7,850 $ 7,631 $ 7,239Sales and use taxes . . . . . . . . . . . . . . . . . . . . . . . . . . . . . 3,957 4,196 4,160 3,826 3,523Personal income tax . . . . . . . . . . . . . . . . . . . . . . . . . . . . 4,555 5,757 5,365 5,389 5,137Income taxes, other . . . . . . . . . . . . . . . . . . . . . . . . . . . . . 3,192 3,685 3,589 3,218 3,394Other taxes . . . . . . . . . . . . . . . . . . . . . . . . . . . . . . . . . . . 1,231 1,294 1,266 1,194 1,086Federal, State, and other categorical aid . . . . . . . . . . . . . 14,646 12,764 11,906 11,229 11,062Unrestricted Federal and State aid . . . . . . . . . . . . . . . . . 666 634 631 653 622Charges for services . . . . . . . . . . . . . . . . . . . . . . . . . . . . 1,458 1,461 1,401 1,353 1,421Other revenues . . . . . . . . . . . . . . . . . . . . . . . . . . . . . . . . 2,399 2,195 1,717 1,371 1,445_______ _______ _______ _______ _______
Total revenues . . . . . . . . . . . . . . . . . . . . . . . . . . . . . . . 40,865 40,232 37,885 35,864 34,929_______ _______ _______ _______ _______Expenditures (in millions):
Personal services . . . . . . . . . . . . . . . . . . . . . . . . . . . . . . . 17,055 16,127 14,791 13,672 12,978Pensions . . . . . . . . . . . . . . . . . . . . . . . . . . . . . . . . . . . . . 1,492 1,217 695 1,412 1,472Fringe benefits . . . . . . . . . . . . . . . . . . . . . . . . . . . . . . . . 4,209 3,838 3,699 3,451 3,192Other than personal services . . . . . . . . . . . . . . . . . . . . . . 11,441 11,071 10,071 8,933 8,811Medicaid and welfare . . . . . . . . . . . . . . . . . . . . . . . . . . . 5,301 5,012 4,852 4,651 4,795Debt service . . . . . . . . . . . . . . . . . . . . . . . . . . . . . . . . . . 1,362 2,962 3,772 3,740 3,676_______ _______ _______ _______ _______
Total expenditures . . . . . . . . . . . . . . . . . . . . . . . . . . . . 40,860 40,227 37,880 35,859 34,924_______ _______ _______ _______ _______Surplus . . . . . . . . . . . . . . . . . . . . . . . . . . . . . . . . . . . . . . $ 5 $ 5 $ 5 $ 5 $ 5_______ _______ _______ _______ ______________ _______ _______ _______ _______
Debt:Per capita net debt . . . . . . . . . . . . . . . . . . . . . . . . . . . . . . $ 5,083 $ 4,628 $ 4,502 $ 4,662 $ 4,363Net debt as a percentage of full value of taxable
real estate . . . . . . . . . . . . . . . . . . . . . . . . . . . . . . . . . . 10.0% 10.2% 10.6% 10.4% 9.0%Net debt as a percentage of assessed value of taxable
real estate . . . . . . . . . . . . . . . . . . . . . . . . . . . . . . . . . . 41.8% 40.9% 42.0% 42.2% 41.0%Debt service as a percentage of total expenditures . . . . . 3.3% 7.4% 10.0% 10.4% 10.5%Debt service as a percentage of revenues other than
categorical aid . . . . . . . . . . . . . . . . . . . . . . . . . . . . . . . 5.2% 10.8% 14.5% 15.2% 15.4%Real Estate Taxes:
Taxable assessed value (in millions) . . . . . . . . . . . . . . . . $97,486 $90,570 $85,868 $82,155 $78,772Tax rate per $100 assessed value . . . . . . . . . . . . . . . . . . $ 10.17 $ 10.18 $ 10.31 $ 10.31 $ 10.29Tax rate per $100 full value . . . . . . . . . . . . . . . . . . . . . . $ 2.42 $ 2.55 $ 2.61 $ 2.55 $ 2.26Percentage of tax levy collected in year levied . . . . . . . . 92.40% 92.70% 92.45% 92.45% 93.18%Delinquency rate in year of tax levy . . . . . . . . . . . . . . . . 2.7% 2.9% 3.1% 3.4% 3.5%
City Employees:Total full-time . . . . . . . . . . . . . . . . . . . . . . . . . . . . . . . . . 247,681 249,824 250,856 246,754 242,710Full-time employees per 1,000 population . . . . . . . . . . . 30.9 31.2 33.8 33.2 32.9
Sources: Annual Reports of the Comptroller.
iii
THE CITY OF NEW YORKGENERAL FUND AND OTHER INFORMATION
FIVE YEAR SELECTED STATISTICAL SUMMARY

iv
Comprehensive Annual Financial Report of the Comptroller of The City of New Yorkfor the Fiscal Years Ended June 30, 2002 and 2001
________________
Table of Contents
INTRODUCTORY SECTION—PART I
Comptroller’s Letter of Transmittal . . . . . . . . . . . . . . . . . . . . . . . . . . . . . . . . . . . . . . . . . . . . . . . . . . . . . . . . . . . . . . . xiCertificate of Achievement for Excellence in Financial Reporting . . . . . . . . . . . . . . . . . . . . . . . . . . . . . . . . . . . . . . . xxxiiiThe Government of The City of New York . . . . . . . . . . . . . . . . . . . . . . . . . . . . . . . . . . . . . . . . . . . . . . . . . . . . . . . . . xxxivPrincipal Officials of The City of New York . . . . . . . . . . . . . . . . . . . . . . . . . . . . . . . . . . . . . . . . . . . . . . . . . . . . . . . . xxxv
FINANCIAL SECTION—PART II
Independent Auditors’ Report . . . . . . . . . . . . . . . . . . . . . . . . . . . . . . . . . . . . . . . . . . . . . . . . . . . . . . . . . . . . . . . . . . . 3
BASIC FINANCIAL STATEMENTS—PART II-A
Management’s Discussion and Analysis . . . . . . . . . . . . . . . . . . . . . . . . . . . . . . . . . . . . . . . . . . . . . . . . . . . . . . . . . . . 7Government-wide Financial Statements:
Statement of Net Assets—June 30, 2002 . . . . . . . . . . . . . . . . . . . . . . . . . . . . . . . . . . . . . . . . . . . . . . . . . . . . . . . 26Statement of Net Assets—June 30, 2001 . . . . . . . . . . . . . . . . . . . . . . . . . . . . . . . . . . . . . . . . . . . . . . . . . . . . . . . 27Statement of Activities—for the year ended June 30, 2002 . . . . . . . . . . . . . . . . . . . . . . . . . . . . . . . . . . . . . . . . . 28Statement of Activities—for the year ended June 30, 2001 . . . . . . . . . . . . . . . . . . . . . . . . . . . . . . . . . . . . . . . . . 29
Fund Financial Statements:Governmental Funds—Balance Sheet—June 30, 2002 . . . . . . . . . . . . . . . . . . . . . . . . . . . . . . . . . . . . . . . . . . . . 30Governmental Funds—Balance Sheet—June 30, 2001 . . . . . . . . . . . . . . . . . . . . . . . . . . . . . . . . . . . . . . . . . . . . 31Reconciliation of the Balance Sheet of Governmental Funds to the Statement of Net Assets—
June 30, 2002 . . . . . . . . . . . . . . . . . . . . . . . . . . . . . . . . . . . . . . . . . . . . . . . . . . . . . . . . . . . . . . . . . . . . . . . . . . 32Reconciliation of the Balance Sheet of Governmental Funds to the Statement of Net Assets—
June 30, 2001 . . . . . . . . . . . . . . . . . . . . . . . . . . . . . . . . . . . . . . . . . . . . . . . . . . . . . . . . . . . . . . . . . . . . . . . . . . 33Governmental Funds—Statement of Revenues, Expenditures and Changes in Fund Balances—
for the year ended June 30, 2002 . . . . . . . . . . . . . . . . . . . . . . . . . . . . . . . . . . . . . . . . . . . . . . . . . . . . . . . . . . . 34Governmental Funds—Statement of Revenues, Expenditures and Changes in Fund Balances—
for the year ended June 30, 2001 . . . . . . . . . . . . . . . . . . . . . . . . . . . . . . . . . . . . . . . . . . . . . . . . . . . . . . . . . . . 35Reconciliation of the Statement of Revenues, Expenditures and Changes in Fund Balances of
Governmental Funds to the Statement of Activities—for the year ended June 30, 2002 . . . . . . . . . . . . . . . . . 36Reconciliation of the Statement of Revenues, Expenditures and Changes in Fund Balances of
Governmental Funds to the Statement of Activities—for the year ended June 30, 2001 . . . . . . . . . . . . . . . . . 37General Fund—Statement of Revenues, Expenditures and Changes in Fund Balances—Budget
and Actual—for the years ended June 30, 2002 and 2001 . . . . . . . . . . . . . . . . . . . . . . . . . . . . . . . . . . . . . . . . 39Fiduciary Funds—Statement of Fiduciary Net Assets—June 30, 2002 . . . . . . . . . . . . . . . . . . . . . . . . . . . . . . . . 40Fiduciary Funds—Statement of Fiduciary Net Assets—June 30, 2001 . . . . . . . . . . . . . . . . . . . . . . . . . . . . . . . . 41Fiduciary Funds—Statement of Changes in Fiduciary Net Assets—for the year ended June 30, 2002 . . . . . . . 42Fiduciary Funds—Statement of Changes in Fiduciary Net Assets—for the year ended June 30, 2001 . . . . . . . 43Component Units—Statement of Net Assets—June 30, 2002 . . . . . . . . . . . . . . . . . . . . . . . . . . . . . . . . . . . . . . . 44Component Units—Statement of Net Assets—June 30, 2001 . . . . . . . . . . . . . . . . . . . . . . . . . . . . . . . . . . . . . . . 45Component Units—Statement of Activities—for the year ended June 30, 2002 . . . . . . . . . . . . . . . . . . . . . . . . 46Component Units—Statement of Activities—for the year ended June 30, 2001 . . . . . . . . . . . . . . . . . . . . . . . . 47
Notes to Financial StatementsA. Summary of Significant Accounting Policies . . . . . . . . . . . . . . . . . . . . . . . . . . . . . . . . . . . . . . . . . . . . . . . 48B. Reconciliation of Government-wide and Fund Financial Statements . . . . . . . . . . . . . . . . . . . . . . . . . . . . . 59

C. Stewardship, Compliance, and Accountability . . . . . . . . . . . . . . . . . . . . . . . . . . . . . . . . . . . . . . . . . . . . . . . 59D. Detailed Notes on All Funds . . . . . . . . . . . . . . . . . . . . . . . . . . . . . . . . . . . . . . . . . . . . . . . . . . . . . . . . . . . . 60E. Other Information . . . . . . . . . . . . . . . . . . . . . . . . . . . . . . . . . . . . . . . . . . . . . . . . . . . . . . . . . . . . . . . . . . . . . 73
COMBINING FINANCIAL INFORMATION—GOVERNMENTAL FUNDS—PART II-B
Nonmajor Governmental Funds—Combining Balance Sheet—June 30, 2002 . . . . . . . . . . . . . . . . . . . . . . . . . . 88Nonmajor Governmental Funds—Combining Balance Sheet—June 30, 2001 . . . . . . . . . . . . . . . . . . . . . . . . . . 89Nonmajor Governmental Funds—Combining Statement of Revenues, Expenditures
and Changes in Fund Balances—for the year ended June 30, 2002 . . . . . . . . . . . . . . . . . . . . . . . . . . . . . . . . 90Nonmajor Governmental Funds—Combining Statement of Revenues, Expenditures
and Changes in Fund Balances—for the year ended June 30, 2001 . . . . . . . . . . . . . . . . . . . . . . . . . . . . . . . . 91Schedule NGFl—City Guaranteed Debt Service Funds—Combining Balance Sheet Schedule—
June 30, 2002 . . . . . . . . . . . . . . . . . . . . . . . . . . . . . . . . . . . . . . . . . . . . . . . . . . . . . . . . . . . . . . . . . . . . . . . . . . 92Schedule NGF2—City Guaranteed Debt Service Funds—Combining Balance Sheet Schedule—
June 30, 2001 . . . . . . . . . . . . . . . . . . . . . . . . . . . . . . . . . . . . . . . . . . . . . . . . . . . . . . . . . . . . . . . . . . . . . . . . . . 93Schedule NGF3—City Guaranteed Debt Service Funds—Combining Schedule of Revenues,
Expenditures and Changes in Fund Balances—for the year ended June 30, 2002 . . . . . . . . . . . . . . . . . . . . . 94Schedule NGF4—City Guaranteed Debt Service Funds—Combining Schedule of Revenues,
Expenditures and Changes in Fund Balances—for the year ended June 30, 2001 . . . . . . . . . . . . . . . . . . . . . 95
COMBINING FINANCIAL INFORMATION—FIDUCIARY FUNDS—PART II-C
Pension and Other Employee Benefit Trust Funds—Combining Statement of FiduciaryNet Assets—June 30, 2002 . . . . . . . . . . . . . . . . . . . . . . . . . . . . . . . . . . . . . . . . . . . . . . . . . . . . . . . . . . . . . . . . 100
Pension and Other Employee Benefit Trust Funds—Combining Statement of FiduciaryNet Assets—June 30, 2001 . . . . . . . . . . . . . . . . . . . . . . . . . . . . . . . . . . . . . . . . . . . . . . . . . . . . . . . . . . . . . . . . 101
Pension and Other Employee Benefit Trust Funds—Combining Statement of Changesin Fiduciary Net Assets—for the year ended June 30, 2002 . . . . . . . . . . . . . . . . . . . . . . . . . . . . . . . . . . . . . . 102
Pension and Other Employee Benefit Trust Funds—Combining Statement of Changesin Fiduciary Net Assets—for the year ended June 30, 2001 . . . . . . . . . . . . . . . . . . . . . . . . . . . . . . . . . . . . . . 103
Agency Funds—Statement of Changes in Assets and Liabilities—for the year ended June 30, 2002 . . . . . . . . 104Agency Funds—Statement of Changes in Assets and Liabilities—for the year ended June 30, 2001 . . . . . . . . 105Schedule F1—Pension Trust Funds—Combining Schedule of Fiduciary Net Assets—June 30, 2002 . . . . . . . 106Schedule F2—Pension Trust Funds—Combining Schedule of Fiduciary Net Assets—June 30, 2001 . . . . . . . 107Schedule F3—Variable Supplements Funds—Combining Schedule of Fiduciary Net Assets—June 30, 2002 . . . 108Schedule F4—Variable Supplements Funds—Combining Schedule of Fiduciary Net Assets—June 30, 2001 . . 109Schedule F5—Pension Trust Funds—Combining Schedule of Changes in Fiduciary Net Assets—
for the year ended June 30, 2002 . . . . . . . . . . . . . . . . . . . . . . . . . . . . . . . . . . . . . . . . . . . . . . . . . . . . . . . . . . . 110Schedule F6—Pension Trust Funds—Combining Schedule of Changes in Fiduciary Net Assets—
for the year ended June 30, 2001 . . . . . . . . . . . . . . . . . . . . . . . . . . . . . . . . . . . . . . . . . . . . . . . . . . . . . . . . . . . 111Schedule F7—Variable Supplements Funds—Combining Schedule of Changes in Fiduciary Net Assets—
for the year ended June 30, 2002 . . . . . . . . . . . . . . . . . . . . . . . . . . . . . . . . . . . . . . . . . . . . . . . . . . . . . . . . . . . 112Schedule F8—Variable Supplements Funds—Combining Schedule of Changes in Fiduciary Net Assets—
for the year ended June 30, 2001 . . . . . . . . . . . . . . . . . . . . . . . . . . . . . . . . . . . . . . . . . . . . . . . . . . . . . . . . . . . 113
v

vi
COMBINING FINANCIAL INFORMATION—COMPONENT UNITS—PART II-D
Nonmajor Component Units—Combining Statement of Net Assets—June 30, 2002 . . . . . . . . . . . . . . . . . . . . 118Nonmajor Component Units—Combining Statement of Net Assets—June 30, 2001 . . . . . . . . . . . . . . . . . . . . 119Nonmajor Component Units—Combining Statement of Activities—for the year ended June 30, 2002 . . . . . . 120Nonmajor Component Units—Combining Statement of Activities—for the year ended June 30, 2001 . . . . . . 121
OTHER SUPPLEMENTARY INFORMATION—PART II-E
General FundSchedule G1—Summary of Federal, State and Other Aid Receivables . . . . . . . . . . . . . . . . . . . . . . . . . . . . . . . 126Schedule G2—Revenues vs. Budget by Category . . . . . . . . . . . . . . . . . . . . . . . . . . . . . . . . . . . . . . . . . . . . . . . . 127Schedule G3—Revenues vs. Budget by Agency . . . . . . . . . . . . . . . . . . . . . . . . . . . . . . . . . . . . . . . . . . . . . . . . . 130Schedule G4—Expenditures and Transfers vs. Budget by Agency . . . . . . . . . . . . . . . . . . . . . . . . . . . . . . . . . . . 170Schedule G5—Expenditures and Transfers vs. Budget by Unit of Appropriation Within Agency . . . . . . . . . . . 175Schedule G6—Expenditures and Transfers by Object . . . . . . . . . . . . . . . . . . . . . . . . . . . . . . . . . . . . . . . . . . . . . 211
New York City Capital Projects FundSchedule CP1—New York City Capital Projects Fund Aid Revenues by Agency . . . . . . . . . . . . . . . . . . . . . . . 220Schedule CP2—New York City Capital Projects Fund Expenditures by Agency . . . . . . . . . . . . . . . . . . . . . . . . 221Schedule CP3—New York City Capital Projects Fund Expenditures and Commitments vs.
Authorizations by Agency Through Fiscal Year 2002 . . . . . . . . . . . . . . . . . . . . . . . . . . . . . . . . . . . . . . . . . . . 222Schedule CP4—New York City Capital Projects Fund Expenditures by Purpose . . . . . . . . . . . . . . . . . . . . . . . . 224
Capital Assets Used in the Operation of Governmental FundsSchedule CA1—Capital Assets Used in the Operation of Governmental Funds by Source . . . . . . . . . . . . . . . . 228Schedule CA2—Capital Assets Used in the Operation of Governmental Funds by Function . . . . . . . . . . . . . . 229Schedule CA3—Schedule of Changes by Function . . . . . . . . . . . . . . . . . . . . . . . . . . . . . . . . . . . . . . . . . . . . . . 229
STATISTICAL SECTION—PART III
Government-wide Expenses by Function—Three Year Trend . . . . . . . . . . . . . . . . . . . . . . . . . . . . . . . . . . . . . . . 233Government-wide Revenues—Three Year Trend . . . . . . . . . . . . . . . . . . . . . . . . . . . . . . . . . . . . . . . . . . . . . . . . . 234General Fund Revenues and Other Financing Sources—Ten Year Trend . . . . . . . . . . . . . . . . . . . . . . . . . . . . . . 235Personal Income Tax Revenues—Ten Year Trend . . . . . . . . . . . . . . . . . . . . . . . . . . . . . . . . . . . . . . . . . . . . . . . . 240General Fund Expenditures and Other Financing Uses—Ten Year Trend . . . . . . . . . . . . . . . . . . . . . . . . . . . . . . 241Real Estate Tax Collections . . . . . . . . . . . . . . . . . . . . . . . . . . . . . . . . . . . . . . . . . . . . . . . . . . . . . . . . . . . . . . . . . 252Real Estate Assessments . . . . . . . . . . . . . . . . . . . . . . . . . . . . . . . . . . . . . . . . . . . . . . . . . . . . . . . . . . . . . . . . . . . 252Real Estate Tax Collections, Cancellations, Abatements and Other Credits
as a Percent of Tax Levy . . . . . . . . . . . . . . . . . . . . . . . . . . . . . . . . . . . . . . . . . . . . . . . . . . . . . . . . . . . . . . . . . . 253Assessed Valuation of Taxable Real Estate by Components . . . . . . . . . . . . . . . . . . . . . . . . . . . . . . . . . . . . . . . . 253Largest Real Estate Taxpayers . . . . . . . . . . . . . . . . . . . . . . . . . . . . . . . . . . . . . . . . . . . . . . . . . . . . . . . . . . . . . . . 254New York City Capital Projects Fund Aid Revenues by Agency—Ten Year Trend . . . . . . . . . . . . . . . . . . . . . . . 255New York City Capital Projects Fund Expenditures—Ten Year Trend . . . . . . . . . . . . . . . . . . . . . . . . . . . . . . . . 257Capital Assets—Depreciation/Amortization and Replacement Cost Data . . . . . . . . . . . . . . . . . . . . . . . . . . . . . 259Short-term Debt . . . . . . . . . . . . . . . . . . . . . . . . . . . . . . . . . . . . . . . . . . . . . . . . . . . . . . . . . . . . . . . . . . . . . . . . . . 260Trends in Short-term Debt . . . . . . . . . . . . . . . . . . . . . . . . . . . . . . . . . . . . . . . . . . . . . . . . . . . . . . . . . . . . . . . . . . 260Status of Debt-Incurring Margin . . . . . . . . . . . . . . . . . . . . . . . . . . . . . . . . . . . . . . . . . . . . . . . . . . . . . . . . . . . . . 261Debt Ratios . . . . . . . . . . . . . . . . . . . . . . . . . . . . . . . . . . . . . . . . . . . . . . . . . . . . . . . . . . . . . . . . . . . . . . . . . . . . . . 261Gross City Debt Outstanding at Fiscal Year-End . . . . . . . . . . . . . . . . . . . . . . . . . . . . . . . . . . . . . . . . . . . . . . . . . 262Revenue Bond Coverage . . . . . . . . . . . . . . . . . . . . . . . . . . . . . . . . . . . . . . . . . . . . . . . . . . . . . . . . . . . . . . . . . . . 263
Capital Leases . . . . . . . . . . . . . . . . . . . . . . . . . . . . . . . . . . . . . . . . . . . . . . . . . . . . . . . . . . . . . . . . . . . . . . . . . . . . . . . 264Leased City-Owned Property . . . . . . . . . . . . . . . . . . . . . . . . . . . . . . . . . . . . . . . . . . . . . . . . . . . . . . . . . . . . . . . . . . . 265Selected Service Delivery Statistics . . . . . . . . . . . . . . . . . . . . . . . . . . . . . . . . . . . . . . . . . . . . . . . . . . . . . . . . . . . . . . 266Demographic, Financial & Other Trends—
Population . . . . . . . . . . . . . . . . . . . . . . . . . . . . . . . . . . . . . . . . . . . . . . . . . . . . . . . . . . . . . . . . . . . . . . . . . . . . . . . . 272

Population of New York City by Borough . . . . . . . . . . . . . . . . . . . . . . . . . . . . . . . . . . . . . . . . . . . . . . . . . . . . . . . . 272Distribution of Population by Age . . . . . . . . . . . . . . . . . . . . . . . . . . . . . . . . . . . . . . . . . . . . . . . . . . . . . . . . . . . . . . 273Personal Income . . . . . . . . . . . . . . . . . . . . . . . . . . . . . . . . . . . . . . . . . . . . . . . . . . . . . . . . . . . . . . . . . . . . . . . . . . . . 274Persons Receiving Public Assistance . . . . . . . . . . . . . . . . . . . . . . . . . . . . . . . . . . . . . . . . . . . . . . . . . . . . . . . . . . . . 275Employment Status of the Resident Population . . . . . . . . . . . . . . . . . . . . . . . . . . . . . . . . . . . . . . . . . . . . . . . . . . . 276Nonagricultural Wage and Salary Employment . . . . . . . . . . . . . . . . . . . . . . . . . . . . . . . . . . . . . . . . . . . . . . . . . . . 277Number of City Employees . . . . . . . . . . . . . . . . . . . . . . . . . . . . . . . . . . . . . . . . . . . . . . . . . . . . . . . . . . . . . . . . . . . 278Corporate Headquarters . . . . . . . . . . . . . . . . . . . . . . . . . . . . . . . . . . . . . . . . . . . . . . . . . . . . . . . . . . . . . . . . . . . . . . 279Construction Activity . . . . . . . . . . . . . . . . . . . . . . . . . . . . . . . . . . . . . . . . . . . . . . . . . . . . . . . . . . . . . . . . . . . . . . . . 280Bank Deposits and Loans . . . . . . . . . . . . . . . . . . . . . . . . . . . . . . . . . . . . . . . . . . . . . . . . . . . . . . . . . . . . . . . . . . . . 281
Average Daily Collected Balances in City Treasury, Pool and Agency Bank Accounts—Ten Year Trend . . . . . . . . . . . . . . . . . . . . . . . . . . . . . . . . . . . . . . . . . . . . . . . . . . . . . . . . . . . . . . . . . . . . . . . . . . . . . 282
Uncollected Parking Violation Fines—Ten Year Trend . . . . . . . . . . . . . . . . . . . . . . . . . . . . . . . . . . . . . . . . . . . . . . . . 283General Fund and New York City Capital Projects Fund—Sources and Uses of Cash—
Ten Year Trend . . . . . . . . . . . . . . . . . . . . . . . . . . . . . . . . . . . . . . . . . . . . . . . . . . . . . . . . . . . . . . . . . . . . . . . . . . . . . 284Acknowledgements . . . . . . . . . . . . . . . . . . . . . . . . . . . . . . . . . . . . . . . . . . . . . . . . . . . . . . . . . . . . . . . . . . . . . . . . . . . 285
vii

[This page intentionally left blank.]

The City of New York
ComprehensiveAnnual Financial Report
of theComptroller
INTRODUCTORY SECTION
Part I
Fiscal Year Ended June 30, 2002


THE CITY OF NEW YORKOFFICE OF THE COMPTROLLER
WILLIAM C. THOMPSON, JR.COMPTROLLER
October 31, 2002
TO THE PEOPLE OF THE CITY OF NEW YORK
I am pleased to present the City of New York’s Comprehensive Annual Financial Reportfor the fiscal year which ended June 30, 2002. This report, the first issued under myadministration, illustrates that the City of New York completed its fiscal year with a GeneralFund surplus, as determined by Generally Accepted Accounting Principles (GAAP), for the22nd consecutive year.
This is the second year in which the City’s financial statements are presented using anentirely new financial reporting model promulgated by the Governmental AccountingStandards Board. Having implemented the changes last year, the City was one of the first largegovernments to report under these new standards, which was one year earlier than required.The changes required are described extensively in the financial statements.
Within the new financial reporting model, the General Fund remains a primary indicatorof the financial activity and legal compliance for the City. The General Fund had revenuesand other financing sources in fiscal year 2002 of $40.865 billion and expenditures and otherfinancing uses of $40.860 billion, resulting in a surplus of $5 million. These expenditures andother financing uses include transfer and subsidy payments of $681 million to help eliminatethe projected budget gap for fiscal year 2003. Fiscal year expenditures and other financinguses were $633 million more than fiscal year 2001, an increase of 1.6 percent. City funds,which are total revenues and transfers less State and Federal Categorical Aid decreased by$1.176 billion, or 4.2 percent. Total expenditures and City funds were $1.479 billion and $2.903billion, respectively, above appropriations in the fiscal year 2002 Adopted Budget.
The loss to the City from the events of 9/11 is truly incalculable. The tragedy killedthousands, shattered the lives of hundreds of thousands more and left an indelible scar on ourlandscape. A year after the attacks, I issued a report entitled “One Year Later, The Fiscal Impactof 9/11 on New York City,” which provided a comprehensive examination and analysis of thefinancial toll on the City’s economy, budget and cash flow, exacted by the World Trade Centerattack. The report also presented an overview of the level of Federal support earmarked forthe City. Among the report’s findings were:
• The economic cost to the City from the 9/11 attacks will total between $83 billionand $95 billion. The final figure will depend, in part, on the number of jobs thateventually relocate out of the City.
• It will cost $21.8 billion to replace the buildings, infrastructure and tenant assets lostas a result of 9/11. The attack destroyed 13 million square feet of prime officespace—equivalent to the total office space inventory in the central business districtsof Atlanta or Miami.
SEPTEMBER 11th—ONE YEAR LATER
xi

• Job losses attributable to 9/11 have already cost the city more than $17 billion in lostwages. The City has suffered a loss of 146,000 jobs as a result of the attacks. Thisloss includes the fact that there are 83,000 fewer jobs than there were before 9/11,and the City has not gained a projected 63,000 jobs that would have otherwiseresulted from its recovery from a recession.
• The attacks have cost the City nearly $3 billion in lost taxes and nearly $500 millionin unreimbursed expenses. Roughly half of the $6 billion budget gap that had to beclosed to balance fiscal year 2003 was attributable to 9/11.
• Although Federal officials have pledged $21.4 billion in total Federal assistance tothe City, only $2.7 billion has been released to date.
In the immediate aftermath of the World Trade Center disaster the City faced immense clean-up and recovery costs in addition to unknown revenue losses that could have seriously impactedits cash balances. In spite of tremendous uncertainty the City was able to maintain a strong cashposition and avoid a crisis by issuing debt through authorizing legislation. The City receivedState authority to issue New York City Transitional Finance Authority (TFA) Recovery Notesbeyond prior authorizations, without limit, payable solely from State or Federal aid receivedas a result of the disaster. In addition, other law notwithstanding, the TFA was authorized to haveoutstanding up to $2.5 billion of bonds or notes the proceeds of which are to be used to pay costsrelated to the 9/11 attack. This provision essentially freed the City from the Financial EmergencyAct requirements that prohibited the use of borrowed funds for operating purposes. In October2001, the City sold $1 billion of Recovery Notes and $1.5 billion of Revenue Anticipation Notes(RANs) backed by State education aid revenue. These actions provided the City with the cashnecessary to pay the immediate extraordinary costs associated with the attacks.
To help with the clean-up and rebuilding efforts at the World Trade Center site and lowerManhattan area, President George W. Bush pledged $21.4 billion to New York as part of anational emergency aid proposal estimated at more than $40 billion. Under this package, a totalof $9.1 billion has been allocated through the Federal Emergency Management Agency(FEMA) to reimburse the City and State for recovery and clean-up costs related to the WorldTrade Center attack. The Federal government also earmarked about $5 billion in expected taxincentives to serve as an economic stimulus to businesses in the lower Manhattan area and anadditional $3.5 billion for the redevelopment of the World Trade Center site and vicinity throughthe Lower Manhattan Development Corporation and the Empire State Development Corporation.The Federal relief package also includes $3.8 billion in funding for a wide range of initiatives,such as the upgrade and reconstruction of mass transit infrastructure, roadway and tunnel repairs,and costs associated with the offering of small business loans and health monitoring.
The U.S. economy began calendar year 2002 on a strong note by showing signs ofrecovery from the recession that had started in 2001. Real Gross Domestic Product (GDP)rose five percent in the first quarter of 2002, and the rate of job losses began to decline. However,since April 2002 the nation has felt the effects of bad economic news. Corporate scandals,threat of war with Iraq, and the decline in the stock market have threatened the economy witha renewed recession.
The latest economic data show the extent of the recent slowdown. GDP was up only 1.3percent in the second quarter of 2002 after increasing five percent in the first quarter. Payrolljobs, which grew consistently from May to August of 2002, were down by 43,000 in September.
The decline in jobs, the threat of war, and the loss of stock market values have diminishedconsumer confidence for the fourth consecutive month to 93.3 in September. Lower consumerconfidence is going to impact consumer spending. Consumer spending, which has been themain contributor to the economic growth for the last two years, rose 0.3 percent in Augustcompared with a one percent increase in July. The recent economic data indicate consumerspending will remain low.
ECONOMIC CONDITION AND OUTLOOKThe National Economy
xii
The recent economic data have also affected private investment. Interest rates, profits,technology, and the demand for goods and services drive investment. The weak stock marketand the flight for quality have driven investors to buy conservative investments, such as Treasurysecurities, thereby driving down yields. For example, the yield on 10-year Treasury bondsis at its lowest level in over 40 years. As a result, quality spread, the difference between theyields on BAA corporate bonds and 10-year Treasuries, has widened making it more difficultfor companies to raise cash.
In addition, profits have faced downward pressure because companies lack pricingpower. Global competition and the increase in the number of inexpensive imports combinedwith the rise in labor costs have lowered profit margins.
On the positive side, the underlying U.S. economic fundamentals appear solid. Thebanking system is healthy, productivity is up, consumer saving is up, and corporate debt ismanageable. There is also an expectation that the Federal Reserve will cut its target interestrates before the end of the year.
It is expected that the economy will continue to be sluggish until the corporate scandalsand war issues are resolved. However, both a decline in consumer spending before a rise incorporate investment and the possibility of a surge in oil prices as a result of war increase thechances of another national recession.
The City’s economy has been in recession for six consecutive quarters through the secondquarter of 2002. Real Gross City Product (GCP) fell 1.3 percent in the second quarter of 2002.However, the rate of decline eased as the second quarter decline of 1.3 percent was smallerthan the 3.3 percent loss in the first quarter.
As of August 2002, the City’s payroll jobs are 82,000 below the September 2001 level.Private sector jobs have fallen by 84,400, while government jobs are up by 2,400. Finance,insurance and real estate (FIRE) jobs are down by 33,700, of which 20,000 are in thesecurities industry. Transportation and public utilities are down by 13,600 jobs and theservices industry is down by 11,700 with the biggest decline in business services of 19,900jobs. Manufacturing lost 11,500 jobs, wholesale and retail trade lost 11,100 jobs, andconstruction lost 2,800 jobs.
However, since December 2001 the economy has been improving. Between December2001 and August 2002, total jobs are up by 500 because the addition of 1,800 governmentjobs has offset the loss of 1,300 private-sector jobs. Within the private-sector, wholesale andretail trade is up by 8,100 jobs, and the services industry is up by 7,900 jobs. However,manufacturing is down by 6,800 jobs, the FIRE sector is down by 6,000 jobs, transportationand public utility are down by 2,700 jobs, and construction is down by 1,800 jobs.
The number of City residents with jobs has improved since December 2001. Seasonallyadjusted civilian employment, the number of City residents with jobs, rose by 61,000between December 2001 and August 2002. Unfortunately, this rise in employment wasmore than offset by an increase in the labor force of 77,700 in the same period. Thus, the City’saverage unemployment rate rose to 7.6 percent for the first eight months of 2002 comparedwith 5.6 percent in the first eight months of 2001.
There are also signs of a significant decline in personal income. Changes in the personalincome tax (PIT) are used as a proxy for income, which is reported with a three-quarters lag.On a year-over-year basis, total PIT for the first nine months of 2002 declined 20.8 percent,estimated taxes dropped 35.9 percent, and withholding taxes fell 4.6 percent. Estimated taxesreflect the income from capital gains and dividends and withholding reflects basic wages.However, looking only at the third quarter of 2002 over the third quarter of 2001, PIT wasup 2.8 percent and withholding was up 4.7 percent. But estimated taxes were down 3.6 percent.
The City Economy
xiii
The inflation rate in the New York City metropolitan area was 2.3 percent in the first eightmonths of 2002. The core inflation rate, which includes all items less food and energy, was3.7 percent. Energy prices fell 11.6 percent while the price of food and beverages rose 1.6percent. Also, transportation prices fell 2.1 percent followed by apparel and upkeep, whichfell 2.0 percent. The cost of services and medical care rose the most, 4.3 percent each,followed by a 3.7 percent increase in housing.
The Manhattan commercial real estate market remains soft. The commercial vacancyrate in Manhattan was 11.3 percent in the second quarter of 2002, almost double the 6.7 percentin the second quarter of 2001. The vacancy rate in Downtown was 13.4 percent, in MidtownSouth 13.3 percent, and in Midtown 9.9 percent.
The City’s hotel industry has also been impacted by the economic climate. The hotel-occupancy rate averaged 74 percent during the first eight months of 2002 compared with theaverage of 75.4 percent during the first eight months of 2001.
Finally, leading indicators remain mixed. The help-wanted-advertising index averaged21.8 during the first eight months of 2002, more than 36 percent below the average of 34.1for the first eight months of 2001. However, the total number of building permits authorizedwas 67,262 during the first nine months of 2002, reflecting a 5.1 percent increase over the63,978 permits issued for the first nine months of 2001.
My Office of Fiscal and Budget Studies monitors the City’s finances, debt-incurring powerand economy, and informs the public and the City Council of the results of that monitoring.
The annual budget review process begins in November when the Mayor presents amodification to the current year budget and a Financial Plan for the following three years.In January, the Mayor presents a preliminary budget for the following year and a modificationto the current four year plan. In April, the Mayor presents the Executive Budget for the nextfiscal year. The City Council reviews and amends the plan and adopts the budget in June. Myoffice conducts an in-depth analysis of the documents and issues a detailed report after eachstep in the process.
In addition to these reports, my office also issues quarterly Economic Notes and CashReports to provide information about major issues related to the City’s economy and financesand a number of other financial reports that are required by the City Charter:
• An annual report on the state of the City’s economy and finances, including evaluationsof the City’s Financial Plan, which is due on December 15.
• An annual report on the City’s capital debt and obligations, including the maximumamount of debt the City may soundly incur in subsequent fiscal years and theindebtedness against the general obligation debt limit in the current and subsequentthree fiscal years as stipulated in the State Constitution.
• A certified statement of debt service submitted to the Mayor and to the City Councilby March 1. The statement, which is published in the City Record, contains aschedule of the appropriations for debt service for the subsequent fiscal year.
• An analysis necessary for my certification of the adopted budget, in collaboration withthe Mayor and the City Clerk.
In addition, a representative of my office sits on the comprehensive monitoring task forcesfor the New York City Board of Education (BOE), the New York City Health and HospitalsCorporation (HHC), and the City-wide task force to monitor the Program to Eliminate theGap (PEG).
THE NEW YORK CITY BUDGET
xiv

Claims against the City arise out of the vast undertakings of the various City agencies.The City is self-insured with respect to risks including, but not limited to, property damage,personal injury, and workers’ compensation. Generally, the cost of claims is paid out of theCity’s General Fund.
Under the City Charter the Comptroller is responsible for adjusting claims for and againstthe City. In fiscal year 2001 the City paid out $580 million dollars in settlements andjudgments (tort and non-tort). These cases ranged from trip and fall cases to medicalmalpractice, police actions, property damage and contract claims. The amount paid representeda 26 percent increase from the prior year, and a 157 percent increase from 1992.
The HHC, the New York City Police Department (NYPD) and the New York CityDepartment of Transportation (DOT) are the three agencies routinely responsible for the highestjudgments and claims. In fact, nine agencies, including those listed above, account forapproximately 95 percent of the total claims paid out.
Recognizing the significance of claims on the City’s budget, I will be making thefollowing additions to the Comptroller’s Office and will seek the cooperation of City agenciesto reduce the number of claims that are filed.
This newly created division will focus on a City-wide basis, providing risk managementadvocacy, litigation support, and training initiatives/programs. By reviewing the notice of claimsfiled with the Comptroller’s Office, the division will identify patterns of claims early, ratherthan just looking at the judgments and settlements, which do not provide a current picture.The mission of this division will be to provide agencies with the tools and the properframework to begin to take action to reduce the number of claims filed.
These specialized units, comprised of Comptroller and Corporation Counsel staff,focus on two of the costliest claim types. The units carefully select appropriate cases in thosetwo categories and strive to negotiate reasonable and fair settlements prior to extensivediscovery and other costly legal expenses accrue.
In fiscal year 2002 my office collected over $500,000 in affirmative claims, mainly fordamages caused to NYPD vehicles. Other City agencies generate and process their ownaffirmative claims. However, because the City Charter requires that the Comptroller’s Officeadjust these claims, City agencies routinely contact this Office for approval prior to settlement.
Price Waterhouse, in its 1997 New York City Claims and Litigation Practices Study,conservatively estimated that 10 percent of all claims filed against the City were fraudulent.Price Waterhouse further indicated that, in 1997 dollars, identification of 20 percent of thefraudulent claims could lead to savings of over $11 million.
My office has created a Fraud Unit within the Claims and Adjudications Department,with a new Fraud Hotline number (212 669-4747). The department will focus on usingsophisticated technology to identify possible fraudulent claims. It will interact with theCity’s District Attorneys and the New York City Department of Investigation (DOI) toprosecute instances of fraud. Finally, through the education and promotion of an anti-fraudcampaign, my office expects to reduce the amount of money paid on fraudulent claims.
The New York City Pension Funds, along with the California Public Employees’Retirement System and the New York State Common Retirement Fund, as lead plaintiffs,successfully negotiated a $3.1 billion settlement—the largest settlement ever in a securitiesfraud litigation—against Cendant Corporation and Ernst & Young, LLP. (Cendant’s externalauditor at the time of the fraud). The New York City Pension Funds allege losses of more than$32 million as a result of accounting irregularities. The settlements have been fully fundedby Cendant Corporation and Ernst & Young, LLP. and claims are being processed andreviewed. The Pension Funds, along with other claimants, are awaiting an order of distributionfrom the court.
PENSION LITIGATIONSCendant Corporation SecuritiesFraud Litigation
Fraud
Affirmative Claims
Early Intervention Units forMedical Malpractice and PoliceAction Cases
Creation of a Risk Management Division
CLAIMS
xv

The New York City Pension Funds, led by the New York State Common Retirement Fund,continued their shareholder derivative litigation, filed in October 1997, against Columbia/HCAHealthcare Corporation, which operates hospitals and health care sites in 36 states. The lawsuitalleges that the company engaged in illegal overbilling of Medicaid and Medicare; illegal referralof Medicaid and Medicare patients to clinical laboratories or other services in which thecompany’s physicians had financial relationships; and insider trading. The Pension Fundssuccessfully appealed a 1999 order of dismissal and are currently conducting discovery.
On June 14, 2002, the New York City Pension Funds filed an individual action againstAdelphia Communications Corporation, the nation’s sixth largest cable television company,certain of its officers and other third parties, including Adelphia’s external auditors andcertain of its securities underwriters. The complaint alleges various securities law violationsas well as state law claims of fraud and negligent misrepresentation as a result of certainundisclosed co-borrowing arrangements, false financial statements and other self-dealingtransactions between the named officers and Adelphia. On September 26, 2002, a Federal districtcourt judge issued an order staying the Adelphia securities actions before him, including theNew York City Pension Funds action, pending resolution of the bankruptcy and criminalproceedings against Adelphia.
Section 93 of the New York City Charter grants the Comptroller broad powers forestablishing the accounting and internal control policies and procedures for the City. One ofthe primary mechanisms used to establish these policies and procedures is the issuance ofComptroller’s Internal Control and Accountability Directives. I plan to expand and modernizethese Directives to provide improved guidance accounting and internal guidance to Cityagencies. I also intend to prepare a codification of the Directives that will both enable usersto utilize the Directives more easily and enable more timely updates to be issued.
The Bureau of Information Systems (BIS) produces monthly pension payments for the260,000 City retirees. This past year BIS improved service by installing newer and fastermainframe printers and consolidating all pension payroll accounts to be paid from onecommercial bank.
The official website for the New York City Comptroller’s Office (www.comptroller.nyc.gov)continues to provide the public with important information to make it easier for citizens toget help with problems. The website has been redesigned and contains important informationabout City government, including the City’s annual financial statements, audits of agencies,reports on the budget and economy, data on bond and note sales, and policy reports issuedby the Comptroller’s Office. The public can instantly contact the Comptroller’s CitizenAction Center to obtain assistance. There are also dozens of useful links to connect users withother government agencies. One can also obtain information on how to buy City bonds, reportCity-related fraud, find job openings at the Comptroller’s Office or get copies of forms to fileclaims against the City. Each department in the Comptroller’s Office is included on theWebsite with descriptions and contact information.
The Omnibus Automated Image Storage and Information System (OAISIS) is a missioncritical imaging system that processes claims, contracts and labor law investigations for theCity. In fiscal year 2002, OAISIS was upgraded to provide better information collection andto permit expanded capabilities. These improvements include an enhancement of the ClaimsAttorney table to allow entries for attorney of record and attorney of counsel e-mail addresses;the enhancement of the Claims Physician table to allow entry for the physician fax number,profession and e-mail address; the modification of Claimant Info/Edit screen to enlarge theclaimant first name field; the enhancement of the table for District and School informationto track injuries of school students and personnel by borough, school district and school name;and the creation a new Office of Contract Administration (OCA) Vendor File library toimage the existing paper documentation OCA was storing in file cabinets and to provideenhanced search capabilities for this information.
OMNIBUS AUTOMATEDIMAGE STORAGE ANDINFORMATION SYSTEM
The Comptroller’s Website
INFORMATION SYSTEMSPension Payroll
ACCOUNTING DIRECTIVES
Adelphia CommunicationsCorporation
Columbia/HCA ShareholderDerivative Litigation
xvi

BIS has created an electronic Purchasing System for its Purchasing Department. Thissystem permits electronic-based documentation and accounting, which was formerly conductedin ledger books. The system also provides for better real time tracking of expenditures andreconciliation. Additionally BIS completed an Audit Information System that gives the AuditBureau better capabilities to track its audits and assignments.
The New York City Charter requires that before a contract between the City and a vendorcan be legally implemented, it must first be registered by the Comptroller’s Office. As partof the review of these contracts, my office has placed an increased emphasis on a contractor’srecord of performance and the provision of tight contractual language to help ensure that thecontract work will be successful. Below are examples of contracts that have failed to deliverthe required results and/or contracts where a vendor’s poor performance history called intoquestion their ability to satisfactorily complete the contract.
• On August 8, 2001, the Comptroller’s Office found that the New York City Departmentof Health (DOH) had paid as much as $10.3 million for the development of anElectronic Death Registration System (EDRS) which does not work. EDRS wasintended to automate the issuance of death certificates. In addition, DOH was foundto have improperly contracted with IBM and failed to contractually require IBM toproduce a workable system at an agreed upon price. My office objected to theagency’s inappropriate use of New York State contracts that circumvented thecompetitive procedures required by the City Charter and Procurement Policy Board(PPB) rules.
• On December 27, 2001, the Comptroller’s Office sent the first of two letters toDOH regarding a failed computer project called the Person Registry InformationManagement Environment (PRIME). PRIME was supposed to enhance the abilityof the City to track and report on infectious/communicable diseases. At least $1.3million was expended on the development of PRIME. My office objected to theagency’s inappropriate use of New York State contracts that circumvented thecompetitive procedures required by the City Charter and PPB rules and failed toproduce a viable system.
• Insisting that contractors be held accountable for funds received from City agencies,my office refused to register a contract between the New York City Department ofYouth and Community Development (DYCD) and the After School Corporation(ASC). The contract was for afternoon youth programs at various New York City publicschools. The contract was subsequently withdrawn by DYCD because it had failedto recoup nearly $650,000 in questioned ASC billings under a previous contract withDYCD. Further, DYCD had failed to acknowledge both ASC’s debt and poor recordkeeping, as required, in the registration documents. The ASC repayments were thenmade, and the contract was registered on July 24, 2002.
• HHC submitted for registration a $164 million contract for medical and mentalhealth care at Riker’s Island and other City prison facilities. In keeping with theComptroller’s Office initiative, that high quality performance be a key element forreceiving contract funding, an agreement was made that prior to registration HHCmust report on: 1) the vendor’s compliance with performance standards; and 2) thecorrective action plan previously negotiated with the Comptroller’s Office for prisonhealth care contracts.
• The New York City Department of Juvenile Justice (DJJ) administered a contract withEMSA Correctional Health Services, Inc. (EMSA) for the health care of children inDJJ facilities. My office’s review found that DJJ’s monitoring reports were inaccurateand failed to correctly measure important indicators, such as medications andattempted suicides. In addition, the review found that EMSA was a shell corporationand the work was actually being performed by a different corporate entity, PrisonHealth Services (PHS). PHS presently contracts with HHC for the provision of
CONTRACTS
Application Systems
xvii

health care to inmates in the City’s correctional institutions. PHS also has a recordof performance problems in other localities throughout the country. As a pre-condition to registration, DJJ revamped its monitoring process, rebid the contractutilizing a wider pool of potential bidders and increased funds for counseling.
• A $15 million agreement between the New York City Department of InformationTechnology and Telecommunications (DOITT) and Plangraphics, Inc. was rejectedbecause DOITT failed to negotiate a contract containing language that defined thework to be completed at an agreed upon price. Instead, the agreement would haveallowed Plangraphics, Inc. to be paid on an hourly basis without a requirement thata finished product be delivered to the City.
• The Human Resources Administration (HRA) awarded a contract, without seekingcompetitive bids, to the QCSinet Acquisition Corporation for scanning documents.This contract was rejected because HRA proposed paying QCSinet a per page ratehigher than that paid by QCSinet’s State customer. If HRA had been allowed to enterinto this agreement, it would have wasted $1.2 million of taxpayers’ dollars.
Since January 1, 2002, when I took office, the Labor Law Bureau has won a total of $1million in back pay and interest for workers on City-funded projects. Since January 2002, about$173,000 in penalties, liens and unclaimed back wages has been collected and transferred tothe City treasury. My office has reduced the open caseload from 248 on January 1, 2002 to233 on June 30, 2002. During that period 73 new cases were filed and 88 were resolved. Forthe total fiscal year 2002, 137 cases were filed and 144 were settled.
In fiscal year 2002 my office won a total of $3 million in back pay and interest. We alsocollected $76,000 in liens and $134,000 in civil penalties during the fiscal year. During thesame period, my office debarred nine contractors for either filing false payrolls or committingtwo willful violations of the labor law in a six-year period. Debarment prohibits contractorsfrom bidding on or being awarded all public work in New York State for five years.
Since January 1, 2002, I have initiated several programs to enhance the enforcement ofprevailing wage laws. These initiatives include:
• Deploying investigators to numerous job sites for further examinations;
• Establishing an immigrant outreach program, supervised by a full-time constituentoutreach coordinator, the purpose of which includes assisting leaders of immigrantadvocacy groups and explaining prevailing wage laws to immigrant workers;
• Creating a program for all investigators to receive direct training in various trades’practices by attending union training facilities. This training will enable an investigatorto identify the appropriate trades being deployed at construction sites;
• Training new contractors and agency construction personnel on prevailing wages;
• Initiating administrative reforms, within the bureau, to realize efficiencies in preparingcases.
In addition, working closely with the King’s County District Attorney’s Office, my officeparticipated in two investigations which resulted in approximately $350,000 in restitution to79 workers, $36,000 in civil penalties and two five year debarments.
As the City’s chief financial officer, I am responsible for implementing, monitoring andenforcing myriad Federal, State and local laws affecting the financial condition of the Cityof New York. As a Citywide elected official, I also initiate or support many legislativeinitiatives that impact the City.
OFFICE OFINTERGOVERNMENTALRELATIONS
LABOR LAW
xviii

xix
The Office of Intergovernmental Relations (OIR) monitors, reviews, analyzes, comments,and helps draft legislative proposals in areas such as municipal finance, asset management,contracts, claims, and labor law.
During the past calendar year, OIR has been actively engaged in the following legislativeactivities:
• The tremendous growth in sub-prime lending resulted in numerous complaints ofabusive and predatory lending practices, particularly among elderly homeowners. Myoffice advocated for legislation at both the State and local level to curb such predatorypractices. Both the State Legislature and the City Council enacted anti-predatorylending laws this calendar year.
• I helped develop a Living Wage Bill currently pending before the City Council. Thelegislation would require City contractors that provide home care, day care, building,food or temporary services to pay their employees a “living wage” plus a health benefitsupplement. As I stated in my testimony in support of this legislation, “far too manyhardworking people depend on low-wage jobs that do not pay enough to afford themost basic necessities.”
• As the pension fund advisor for the New York City employees pension funds, I carefullymonitored and strongly advocated for reforms in corporate governance on the Federallevel, in particular, the Sarbanes-Oxley Act of 2002.
• As the City’s chief financial officer, I continue to advocate strongly on behalf of thebusinesses and residents of Lower Manhattan in the wake of 9/11. My office ismonitoring and I am supporting Federal legislation, such as the Terrorist RiskProtection Act of 2002, and the Community Disaster Loan Equity Act of 2002.
• I have also supported the Equal Benefits bill and the NYC Childhood Lead PoisoningPrevention Act of 2002.
• Analysis of the Mayor’s Management Report—The Comptroller’s Office ofPolicy Management (OPM) issued “How Are We Doing? Enhancing AccountabilityThrough the Mayor’s Management Report.” This report marked the 25th Anniversaryof the Mayor’s Management Report (MMR), published twice annually by theMayor’s Office of Operations, by making a series of recommendations to improveits structure and content. These recommendations included creating appropriateperformance measures, such as cost per unit of service measures for all City agencies;restructuring the volumes for improved readability; and enhancing linkages to web-based sources of additional information. A majority of the report’s recommendationswere incorporated into the September 2002 edition of the MMR.
• Filtration Avoidance—On June 24, 2002, I submitted extensive written commentsto the United States Environmental Protection Agency (EPA) on its draft for the secondNew York City Filtration Avoidance Determination (FAD). The first FAD, issued bythe EPA in 1997, provided the City with a five-year waiver from a federal mandatethat requires the filtration of all drinking water supplies in the United States. Onlya handful of water supply systems have been granted such waivers.
The 2002 draft FAD renewal requires an array of actions, similar to the 1997 FAD,to protect the Catskill/Delaware watershed. The June 24th letter focused on thefollowing watershed protection programs: improvements in land acquisition, betterreview of watershed land use and development proposals, improved environmentalcontrols, and a closer consideration of costs for certain mandated programs, such asSeptic Rehabilitation and Replacement. Finally, my office recommended the publicationof an annual report to disclose current estimates of program-specific costs incurredby the City for implementing the new FAD.
POLICY

xx
• Voluntary Ambulance Response to 911 Calls—The Comptroller’s Office releaseda report, “Where Do 911 System Ambulances Take Their Patients?” Based on ananalysis of 330,000 ambulance transports, the report showed that ambulancesoperated by voluntary hospitals often violate State and New York City Fire Department(NYFD) regulations, by steering patients to their own hospitals, rather than to thenearest appropriate hospital. Overall, a voluntary hospital ambulance is half as likelyas a NYFD ambulance to bring a patient picked up near a HHC hospital to that hospital,even if the voluntary ambulance has to pass the HHC hospital. This costs the Cityan estimated $86 million in hospital reimbursements annually. Voluntary ambulancesalso ignore other, closer voluntary hospitals to take patients to their own hospitals.Patients are most likely to be steered if they are insured. This may potentially harmpatients, due to ambulances taking longer to get to the hospital, and not always goingto the hospital that is medically most appropriate.
In a follow-up to the report, I shared relevant data with the State Health Department,which confirmed the major findings. I also wrote the NYFD recommending againsta budget proposal for reducing Emergency Medical Services (EMS) ambulances andreplacing them with additional voluntary hospital ambulances, without these problemshaving been corrected.
• Vision Care—On August 14, 2001 the Comptroller’s Office launched the NewYork Children’s Vision Coalition fall campaign informing parents of the need to havetheir children’s vision checked before school starts. One in four children have visionproblems that can affect their ability to read and learn. Some visual impairments arenot always apparent and are very difficult to correct if discovered after age four andfive. If left untreated, these conditions can lead to functional blindness in one eye.As an Honorary Co-Chair and one of the forces behind the creation of the New YorkChildren’s Vision Coalition, I support State legislation mandating eye exams by aneye care professional for all children as they enter school.
The Children’s Vision Coalition is an advocacy organization representing more than100 organizations, public officials, professionals, and individuals providing visioncare for children in New York. The Coalition was established in 1999 following thepublication of the Comptroller’s report, “Healthy Kids, Healthy Schools,” which foundthat children with vision, hearing or chronic disease problems did not receive the carethey needed, even when the school was aware of their problem.
• Adolescent Pregnancy, Parenting and Prevention Task Force—In November2001, the Comptroller’s Task Force on Adolescent Pregnancy, Parenting and Preventionwas honored with the 2001 Local Coalition Award, presented annually by theNational Organization on Adolescent Pregnancy, Parenting and Prevention (NOAPPP)for outstanding and unique work in the field. Based in Washington, DC, NOAPPPis the national organization for professionals dedicated to adolescent pregnancyprevention and parenting services.
The Comptroller is chair of the Task Force, founded in 1981 and consisting of over100 government and private agencies serving New York City youth. The mission ofthe task force is to reduce the number of adolescent pregnancies in the City of NewYork. In addition, the Task Force coordinates and improves service delivery topregnant and parenting adolescents, their families and children at risk
• Accountable Schools, Accountable Public Community Roundtable—TheComptroller’s Office participated in the Accountable Schools, Accountable Publicschool reform project, sponsored by The League of Women Voters and The Campaignfor Fiscal Equity, Inc. Meeting with parents, advocates and community membersrepresenting Community School District 2, the project took the form of a series ofroundtable discussions in spring 2002. The discussions culminated in recommendationsto the State of New York intended to improve its public schools.

• Comptroller’s Staff Community Volunteerism—For the second year, staffrepresenting a variety of bureaus of the Comptroller’s Office volunteered for the PowerLunch program, sponsored by the Everybody Wins! Foundation. Power Lunchassigns volunteers as once-a-week reading partners to a particular child in a publicschool; the Comptroller’s Office is paired with PS 130, located nearby on Baxter Street.Nineteen staff were regular volunteers during the 2001-02 school year.
• In fiscal year 2002, Moody’s Investors Service (Moody’s), Standard & Poor’s (S&P)and Fitch Ratings maintained their ratings at A2, A and A+ respectively. On November15, 2001, Moody’s issued a negative outlook on New York City General ObligationBonds. The negative outlook reflected the disruptive economic effects of the WorldTrade Center tragedy, the national economic recession, and projections of revenuelosses and spending increases.
• During fiscal year 2002, the City issued approximately $3.657 billion of generalobligation bonds of which approximately $1.007 billion were issued to refundcertain outstanding bonds and $2.65 billion were issued for capital purposes. Theproceeds of the refunding issues were placed in irrevocable escrow accounts inamounts sufficient to pay when due all principal, interest, and applicable redemptionpremium, if any, on the refunded bonds. The refunding will provide the City withapproximately $204 million in debt service savings in fiscal year 2003.
• On October 23, 2001, the City sold a total of $1.5 billion of RANs for its seasonalborrowing requirements on a competitive basis. The RANs matured on April 12, 2002.
• During fiscal year 2002, the New York City variable rate traded at the following interestrates:
Tax-Exempt Taxable___________ _______
Dailies . . . . . . . . . . . . . . . 1.60% —Weeklies . . . . . . . . . . . . . . 1.54% —Auction Rate Securities . . 1.65% 2.42%Commercial Paper . . . . . . 1.45% 2.62%
• As of June 30, 2002, the City’s General Obligation bonds outstanding variable andfixed rate debt was approximately $3.42 billion and $24.92 billion respectively.
• In 1997, the New York State Legislature created the New York City Transitional FinanceAuthority (TFA), a separate legal entity, in order to ease the constraints imposed bythe City’s debt limit. The TFA was initially authorized to issue up to $7.5 billion ofdebt secured by the City’s collections of personal income tax and, if necessary,sales tax. In fiscal year 2000, this authorization was increased by $4 billion, allowingthe TFA a total debt incurring capacity of $11.5 billion. The uses of TFA bond proceedshave enabled the City to continue its planned capital improvement program.
• In September 2001, the New York State Legislature approved a special TFAauthorization of $2.5 billion to fund capital and operating costs relating to or arisingfrom the events of September 11, 2001. The Legislature also authorized the TFA toissue debt, without limit as to principal amount, that is secured solely by State orFederal aid received on account of the disaster. In October 2001, the TFA issued $1billion of TFA New York City Recovery Notes. These notes were redeemed inOctober 2002 with the issuance of $1 billion of TFA Recovery Bonds.
• In fiscal year 2002, Moody’s, S&P and Fitch maintained their ratings for TFA’s seniorbonds at Aa2, AA+ and AA+ respectively. The bond anticipation notes and recoverynotes were rated at MIG-1, SP-1+ and F1+ by Moody’s, S&P and Fitch respectively.Recovery Bonds and Recovery Notes, though secured by a lien junior to that of theTFA’s senior bonds, received ratings identical to those of senior lien bonds and
New York City TransitionalFinance Authority
DEBT MANAGEMENTGeneral Obligation
xxi

notes. As a result of such strong ratings, TFA issuances were able to achieve low interestcosts.
• During fiscal year 2002, the TFA’s tax-exempt dailies and tax-exempt weekliestraded at 1.61 percent and 1.55 percent respectively. As of June 30, 2002, the TFA’soutstanding variable rate debt was approximately $1.25 billion.
• During fiscal year 2002, TFA sold $250 million of bonds through competitivebidding for capital purposes.
• As of June 30, 2002, long-term outstanding TFA debt was approximately $8.29 billion.
• TSASC, Inc. (TSASC), a local development corporation that is an instrumentalityof, but separate from the City of New York, entered into a loan agreement onDecember 1, 2001 with the U.S. Department of Transportation (USDOT) and the Citypursuant to the Transportation Infrastructure Finance and Innovation Act. The loanis for $159,225,300 and is secured by tobacco revenues to be received pursuant to aMaster Settlement Agreement entered into between participating tobacco productmanufacturers and 46 states in settlement of certain smoking-related litigation.Under the agreement, TSASC can issue bonds on parity with outstanding debt to bepurchased by the USDOT. Pursuant to the loan, TSASC issued approximately $45million of Senior Bonds during fiscal year 2002. The monies were applied by the Citytowards the Staten Island Ferries and Ferry Terminal Projects. TSASC hasapproximately $114 million in remaining capacity from the loan.
• As of June 30, 2002, TSASC had approximately $694 million bonds outstanding.
• The New York City Municipal Water Finance Authority (Water Authority), a separatelegal entity established in fiscal year 1986, has the power to issue bonds to financethe renovation and improvement of the City’s water and sewer facilities.
• The Water Authority issued approximately $1 billion of revenue bonds during fiscalyear 2002 of which approximately $579 million were issued to refund certainoutstanding bonds and $432 million were issued for capital purposes. The proceedsof the refunding issues were placed in irrevocable escrow accounts in amountssufficient to pay when due all principal, interest, and applicable redemption premium,if any, on the refunded bonds. The refunding will provide approximately $30.5million in debt service savings throughout the life of the bonds.
• The Water Authority also maintained its tax-exempt commercial paper programenabling it to access the short-term market at more aggressive rates; at the end of fiscalyear 2002, $628 million of commercial paper was outstanding.
• In fiscal year 2002, Moody’s, S&P and Fitch maintained their ratings for the WaterAuthority’s bonds at Aa2, AA and AA respectively.
• During fiscal year 2002, the Water Authority’s tax-exempt dailies and tax-exemptweeklies traded at 1.63 percent and 1.57 percent respectively. As of June 30, 2002,outstanding variable rate debt was approximately $1.62 billion.
• As of June 30, 2002, long-term outstanding Water Authority debt was approximately$12.15 billion
The City’s policy is to invest all funds in excess of compensatory balance requirements.Funds so invested that are not Federal Deposit Insurance Corporation (FDIC) insured arecollaterized.
CITY TREASURY FUNDS
New York City Municipal WaterFinance Authority
TSASC, INC.
xxii

Funds in excess of compensatory balance requirements are invested by the Comptroller’sOffice in short-term securities, including U.S. treasuries and high-grade commercial paper.The average yield for such investments during fiscal year 2002 was 2.63 percent, whichcompares with the average yield of 2.63 percent on three month treasury bills and 2.24 percentfor a representative institutional money market fund. Interest income totaled $214 million forthe year.
The City Charter requires that the Comptroller’s audit activities be conducted inaccordance with Government Auditing Standards, issued by the Comptroller General of theUnited States. Among other criteria, these standards require that the audit bureaus undergoan external quality assurance review every three years. The Institute of Internal Auditorscompleted such a review in November 2001 and concluded that the Comptroller’s Officegenerally conforms to the government auditing standards. This is the Institute’s highestrating for such reviews. In addition, the Charter mandates that every City agency be auditedat least once every four years. The Comptroller’s Office successfully met this mandate forthe third four-year cycle, which ended December 31, 2001.
New York City is expected to experience increasing budget shortfalls. Consequently,agencies may be required to make reductions in administrative personnel that could weakenbasic internal controls over agency resources and expenditures. The auditors, therefore, willdedicate a portion of their efforts to both evaluating controls over agency assets and resourcesand illustrating how they can be strengthened. Regardless of the City’s financial condition,the public will expect its government to deliver high-quality services. The Comptroller’s auditspresent an opportunity to meet the public’s expectations. Providing a quality education to ourchildren, ensuring the availability of affordable housing for City residents, and delivering socialservices to people in need are among my highest priorities. Therefore, the audit bureaus willendeavor to find ways of improving the delivery of these and other essential City services.
The audit bureaus have issued audits that have uncovered: millions of dollars in revenuesowed to the City; unsafe conditions at various City-funded programs, including senior citizencenters and emergency housing facilities; and tens of millions of dollars spent on electronicdata processing systems that simply fail to meet all the needs of the City agencies.
In fiscal year 2002, the audit bureaus issued 126 audit and special reports. Many of thesereports focused on program effectiveness and service quality. Others identified approximately$10.7 million in actual revenues and savings, and $46.1 million in potential revenue and savings.Another $27.8 million in cost avoidance was identified by audits of claims filed against theCity. In the coming years, the bureaus will continue their efforts at identifying ways tomaximize City revenue, strengthen agencies’ internal controls over their operations, and reduceCity costs through more efficient service delivery. Below is a brief synopsis of audits thatrevealed major findings concerning revenues owed to the City, public health and safety,information technology and other governmental services.
• Audits of Time Warner Cable of New York City found that it owed the City $7,677,521.Under its seven franchise agreements, Time Warner is obligated to pay the City fivepercent of its gross revenue. Audits of these agreements identified approximately $134million in revenue that was not reported to the City. Consequently, Time Warner owedthe City $6,725,829 in franchise fees and $951,692 in interest. Time Warner paid thefull audit assessment.
• A follow-up audit of the NYPD revealed that the City could save $15.2 million annuallyby civilianizing 831 non-enforcement positions in the Department’s administrativeunits.
• An audit of the New York City Department of Finance (DOF) found that it could havecollected at least $26 million if it had made a greater effort to collect EnvironmentalControl Board penalties resulting from Notices of Violations issued by various City
Revenue/Cost Savings
AUDITS
xxiii

agencies. The City’s Finance Commissioner agreed with the main conclusion of theaudit and has agreed to take steps to increase collections.
• An audit of water and sewer charges owed by 86 organizations that have concessionagreements with the City found that 77 were not properly billed for water and seweruse or had balances outstanding. Collectively, these organizations owed the New YorkCity Water Board more than $2 million. As a result of the audit, the New York CityDepartment of Parks and Recreation (DPR), the oversight agency for these agreements,worked with the New York City Department of Environmental Protection (DEP) toensure that concessionaires are being properly billed for water services and assistedDEP in collecting delinquent accounts.
• An audit of Shellbank Restaurant Corp. revealed that it and TAM Restaurants Inc.(TAM), its parent company, owed the City $615,586 in license fees, late charges, waterand sewer fees, and commercial rent tax. DPR, the oversight agency for Shellbank’sagreement, issued a “Notice to Cure” requiring that Shellbank pay the full auditassessment, including the amount owed by TAM.
• An audit of Toto’s South Shore Country Club, Ltd. revealed that this licensee failedto report an estimated $1,829,320 in revenues on its gross receipts statements to DPRand that it owed the City at least $256,872. The licensee agreed to pay the full auditassessment and ensure that all revenue is reported to the City.
• An audit of the New York Yankees’ lease agreement with the City found that theYankees generally adhered to the provisions of their 30-year lease agreement and hadadequate internal controls over their revenue collection and reporting functions.Although the Yankees reported gross revenues of $416.7 million and paid the City$18.8 million, the audit determined that the Yankees overstated payments to MajorLeague Baseball by $2,285,727, overstated Insurance Credits by $176,390, deductedundocumented concession credits totaling $40,851, and failed to report “rain-check”revenue—accumulated when patrons did not redeem tickets for rained-out or canceledgames—amounting to $1,519,149. As a result, the Yankees owed the City $367,321.The Yankees agreed with the audit’s findings and paid the additional fees owed.
• An audit of Stringmaster, Inc., a tennis concessionaire, found that it had significantinternal control weaknesses that prevented the verification of its operating incomeand reported gross receipts. In addition, Stringmaster had no separate water orelectric meter for the premises, and consequently, from the inception of the licenseagreement, did not pay for its water and sewer or electric use. Moreover, the auditfound that the City did not receive credit for $240,281 (including $16,750 receivedfrom Stringmaster) that was deposited by DPR in the City’s Treasury account. Afterthe auditors brought this matter to the attention of DPR officials, DPR obtainedreplacement checks from the concessionaires and deposited them in the City’saccount. In addition, DPR collected $15,213 from Stringmaster for the utility costsrelated to the operation of the concession.
• An audit of East Broadway Mall, Inc., found that it owed the City $221,683—$120,965 in additional rent and related interest, and $100,718, in unpaid water andsewer charges. East Broadway reported gross operating revenue totaling $2,390,175and $2,408,789, respectively, for the fiscal years ending August 31, 2000, andAugust 31, 2001. However, the audit revealed that East Broadway did not accuratelyreport gross operating revenue and common area maintenance charges, and, therefore,it did not pay all percentage rent due the City. In addition, the audit revealed that DOTwas erroneously billed $100,718 for water and sewer charges that should have beenbilled to East Broadway. The New York City Department of Citywide AdministrativeServices (DCAS), the oversight agency for East Broadway’s agreement, agreedwith the audit’s findings and has taken steps to collect the amounts due.
xxiv

• During fiscal year 2002, the Bureau issued four audits of foster care providers thatuncovered $283,844 in net overpayments made by the City to foster care agencies.These audits sought to determine whether the providers: maintained adequate internalcontrols over the recording and reporting of expenses, revenues, and days of care;complied with certain State and City regulations; and were paid based on theappropriate rates as established by State regulations.
• An audit of senior centers overseen by the New York City Department for the Aging(DFTA) revealed that more than half of the centers inspected by the auditors hadnumerous fire safety problems, including blocked exit doors, no smoke detectors, andinadequate evacuation plans. DFTA generally agreed with the audit’s recommendationsand will seek to correct the problems identified by the auditors.
• An audit of the Amboy Neighborhood Center, Inc., found unsafe and unsanitaryconditions at the temporary housing facility that it operated under contract with theNew York City Department of Housing Preservation and Development (HPD). Theseconditions included roach and fly infestation, clogged and leaking sinks and bathtubs,and water damage to ceilings and walls. In addition, many of the residents complainedthat their apartments were infested with mice and rats. Furthermore, the auditdisclosed that Amboy owes the City $417,571 for its water and sewer use. After theresults of the audit were released, HPD did not renew Amboy’s contract.
• An audit of DOH’s Lead Poisoning Prevention Program found that program staffmonitor children with elevated blood levels by making initial and follow-up calls andvisits to the families of these children and providing information about lead poisoningto the parents. However, the audit disclosed that in some cases families of childrenwith elevated blood lead levels were not contacted and visited within required timeframes and mandatory reminder letters were not sent to parents of children whorequired follow-up blood tests. DOH agreed with most of the audit’s recommendations.
• An audit of the licensing and monitoring of summer day camps by DOH found thatat the beginning of the 2001 summer season 280 of 727 day camps operated withouta valid permit. Moreover, 71 camps opened for business in the summer of 2001 eventhough they did not correct violations that were found during the previous summer.
• An audit of HHC found that it did not always comply with medical research approvalregulations. This audit focused on the approval process for medical research conductedat the Bellevue Hospital Center (Bellevue) through its affiliation with the New YorkUniversity Medical Center (NYU). The audit found that in certain cases principalinvestigators did not inform the NYU Institutional Review Board of serious drug-study-related adverse events. Federal regulations and guidelines require that such eventsbe reported to the Institutional Review Board. The audit also noted that manyconsent forms lacked elements required by Federal regulations, and some Bellevuepatients were enrolled and treated before Bellevue and the Corporation reviewed andapproved protocols and consent forms. In addition, there was no evidence thatsigned consent forms were obtained for 13 of 295 Bellevue patients who participatedin certain protocols.
• An audit of DYCD’s Citizenship New York City Program found that DYCD is doinga good job implementing the program. The number of applications completed andsubmitted to the U.S. Immigration and Naturalization Service (INS) has steadilyincreased from 5,607 in fiscal year 1998 to 10,273 in fiscal year 2001. The numberof appointments made and applicants served has also increased each year. However,the audit noted that DYCD does not track whether the applicants it assisted ultimatelybecame U.S. citizens, and whether applicants who fail to become citizens are at riskof losing Federal benefits. Finally, the supervisory review and forwarding ofapplications to INS were not always completed in a timely fashion.
Health and Human Services
xxv
• A follow-up audit of the Metropolitan Transportation Authority New York CityTransit Access-A-Ride program found that even though improvements were madein the administration of the program, the number of complaints against the programhas increased. The Carriers contracted through the program attributed the increasein complaints to NYC Transit: not taking rush hour and traffic conditions intoaccount when scheduling trips; not assigning the most efficient routes; and, notallowing sufficient travel time between passenger pick-ups. To address some ofthese issues, NYC Transit officials stated that they were implementing a newcomputer system to assist in scheduling trips.
• A follow-up audit of the New York Police Department (NYPD) implementation ofthe Enhanced 911 System found that the Computer-Aided Dispatch (CAD) supportsystem has still not been completed. Consequently, wireless interfaces to police carMobile Data Terminals, which require that the CAD system be operational, were notinstalled. CAD, which was to be completed in late 1997, was to provide dataprocessing and distribution capability to 175 workstations as well as to externalagencies, mobile data terminals, and handheld radios. As a result of CAD not beingimplemented, the NYPD is still relying on the old 911-dispatch system known asSPRINT. This follow-up audit was concerned with the continued delays in thedevelopment of CAD and recommended that the NYPD ensure that SPRINT ismaintained as an integral part of its Enhanced 911 System until the CAD System isinstalled and tested.
• An audit of the NYPD found that its upgraded AutoPound system met user needs andthat users were generally satisfied with the system. In addition, the upgraded systemallows for future enhancements and further periodic upgrades. However, themethodology used by the NYPD for the upgrade did not ensure that all needed aspectsof the system were developed. Moreover, users had problems accessing the systemand entering data and complained about the system’s slow response time. Finally, theNYPD did not remove inactive users from the system and it did not have a complete,formally approved Disaster Recovery Plan for the system. The Property ClerkDivision, which uses the system, accepts, catalogs, safeguards, stores, and producesfor the court property that is in the custody of the NYPD. The NYPD stores vehicles,parts, motorcycles, and marine craft at three-vehicle storage sites. Such vehicle-relateditems, when received, are inspected and entered into the AutoPound system. Theupgraded system allows the NYPD to monitor the three vehicle storage sites fromOne Police Plaza by linking the sites into one network.
• An audit of the Center for Animal Care and Control (CACC) revealed that CACCfailed to provide humane treatment to all of its animals and allowed dogs and catsto be accidentally and needlessly euthanized. The audit found evidence of mistreatmentof animals, such as leaving them in soiled cages or without water, housing sick andcontagious animals with healthy ones, and providing poor veterinary care. The auditalso noted that the full extent of CACC’s problems could not be determined becauseof CACC’s obstructive tactics and resistance to sharing its records with the auditors.CACC management and staff members refused or delayed access to many documents,such as personnel files, logbooks, disciplinary action notices, and prohibited interviewswith employees unless management was present. Moreover, the audit concluded thatCACC’s current contract with DOH does not include specific and measurableperformance requirements or standards. In response to the audit, DOH stated that itwould include specific performance measures in the CACC’s new contract.
Other Governmental Services
Information Technology
xxvi

• Two audits of Metropolitan Transportation Authority (MTA) railroad stations operatedby the Long Island Rail Road (LIRR) in Queens and Brooklyn, and by the Metro-North Railroad in the Bronx, found unsafe conditions at eight stations. Theseconditions included: exposed electrical third rails; uneven, cracked, and crumblingcement; damaged staircases; and loose metal plates and rusted metal rods on stationplatforms. Of particular concern was the fact that some of these same conditions wereobserved during previous audits conducted by the Comptroller’s Office. In responseto the current audits, Metro-North and the LIRR described the corrective actions theyhave taken or plan to take to remedy the noted conditions.
• A follow-up audit of the Civilian Complaint Review Board (CCRB) found that theCCRB has shown marked improvement in its ability to manage its caseload in a timelyand efficient manner. The earlier audit report concluded that too many cases exceededthe 18-month statute of limitations. Moreover, many cases were at risk becausethey were sent to the NYPD too late for it to complete its investigations and takedisciplinary actions. The CCRB should refer substantiated cases to the NYPD withno less than three months remaining on the statute to ensure that there is sufficienttime to review the cases and act upon the CCRB’s recommendations. This follow-up audit compared case data from July 1998 to June 2001 with the data compiledduring the previous audit. This analysis disclosed that only 17.3 percent of cases werereferred to the NYPD beyond 15 months as compared to 56.8 percent found duringthe prior audit.
The Comprehensive Annual Financial Report is required by Section 93.1 of the NewYork City Charter. The Comprehensive Annual Financial Report is presented in three sections.This transmittal letter serves as an introduction and summary. The financial section includesthe basic financial statements, combining fund financial statements and schedules and othersupplementary information. The statistical section includes selected financial and demographicinformation, generally presented on a multi-year basis.
The City is responsible for both the accuracy of the data and the completeness and fairnessof the presentation, including all disclosures. To the best of our knowledge and belief, theenclosed data is accurate in all material respects and is reported in a manner designed to presentfairly the financial position and results of operations of the City and its various funds. Alldisclosures necessary to enable the reader to gain an understanding of the City’s financialactivities have been included.
The City is required to undergo an annual Single Audit in conformity with the provisionsof the Single Audit Act Amendments of 1996 and the United States Office of Managementand Budget Circular A-133, “Audits of States, Local Governments and Non-ProfitOrganizations.” Information related to the Single Audit, including the Schedule of ExpendituresFederal Awards, findings and recommendations, and auditors’ reports on internal controls andcompliance with applicable laws and regulations, are issued as a separate report.
The City is responsible for establishing and maintaining internal controls designed toensure that municipal assets are protected from loss, theft, or misuse and to ensure that adequateaccounting data are compiled to allow for the preparation of financial statements in conformitywith GAAP. Internal controls are designed to provide reasonable, but not absolute, assurancethat these objectives are met. The concept of reasonable assurance recognizes that: (1) thecost of a control should not exceed the benefits likely to be derived; and (2) the valuation ofcosts and benefits requires estimates and judgments by management. These internal controlsare subject to continuous evaluation by the City.
Budgetary and FinancialControls
THE COMPTROLLER’SCOMPREHENSIVE ANNUALFINANCIAL REPORT
xxvii

The City maintains budgetary controls to ensure compliance with legal provisionsembodied in the Annual Appropriated Budget approved by the City’s governing body. Activitiesof the General Fund are included in the Annual Appropriated Budget. The City also makesappropriations in the Capital Budget to authorize the expenditure of funds for various capitalprojects. A level of budgetary control, i.e., the level at which expenditures cannot legallyexceed the appropriated amount, is established within each individual fund. As reported in theschedules to the financial statements, several agencies have expended more than legallyappropriated amounts. The City also maintains an encumbrance accounting system as anothertechnique of accomplishing budgetary control. Encumbrances lapse at the end of each fiscal year.
The City maintains financial controls through the use of an integrated accounting andbudgeting system. The City’s Financial Management System (FMS) maintains the City’scentralized accounting and budgetary controls. FMS is a state-of-the-art, integrated accountingand budgeting financial management system. FMS also is used by the City to maintaininformation on City contracts as well as capital projects. FMS provides the ability for theComptroller’s, Mayor’s and individual agencies’ financial managers to access, analyze, andutilize the City’s financial data. These capabilities are continuously improved to meet newinformation needs.
To ensure the adequacy of the City’s internal controls, directives and memoranda thatoutline appropriate policies and procedures for all City agencies and component units are issuedand periodically updated. These directives and memoranda establish internal controls andaccountability which safeguard City assets. The Comptroller’s Office and agency auditorsperiodically check City agencies’ and component units’ adherence to internal control policiesand procedures.
Each year, in accordance with the “City Manager Financial Integrity Directive,” everyCity agency is required to prepare a report on its internal control. Each agency’s report mustinclude an “Agency Financial Integrity Compliance Statement” signed by the agency head.The statement must include the agency head’s opinion as to whether the agency’s internal controlprovides reasonable assurance that internal control objectives were achieved during thefiscal year and can continue to achieve those objectives in the future.
Should a control weakness prevent any significant control objective from being achieved,the agency head must describe management’s plans for correcting it. Agencies must also explainand describe planned corrective action for any outstanding weakness described in auditreports prepared by the City Comptroller’s Office auditors, the City’s independent auditors,the State Comptroller, or other oversight or audit bodies.
The Comptroller’s Office auditors administer the “City Manager Financial IntegrityDirective” and collect agency responses. In addition, the auditors collate these responses anduse the results as part of our risk assessment to identify future audits. This approach helpsto ensure that agencies genuinely assess their internal control, rather than just examine themperfunctorily. The Comptroller’s Office also asks agencies to assess the adequacy of theirinternal audit functions.
The City Charter requires an annual audit by independent certified public accountants.In addition to meeting the requirements set forth in the City Charter, the audit also is designedto meet the requirements of the Federal Single Audit Amendments Act of 1996 and relatedOMB Circular A-133. The auditors’ report on the basic financial statements and combiningand individual fund statements is included in the financial section of this report. The auditors’report which relates specifically to the single audit is included in a separately issued report.
Independent Audit
Financial Controls
Budgetary Controls
xxviii
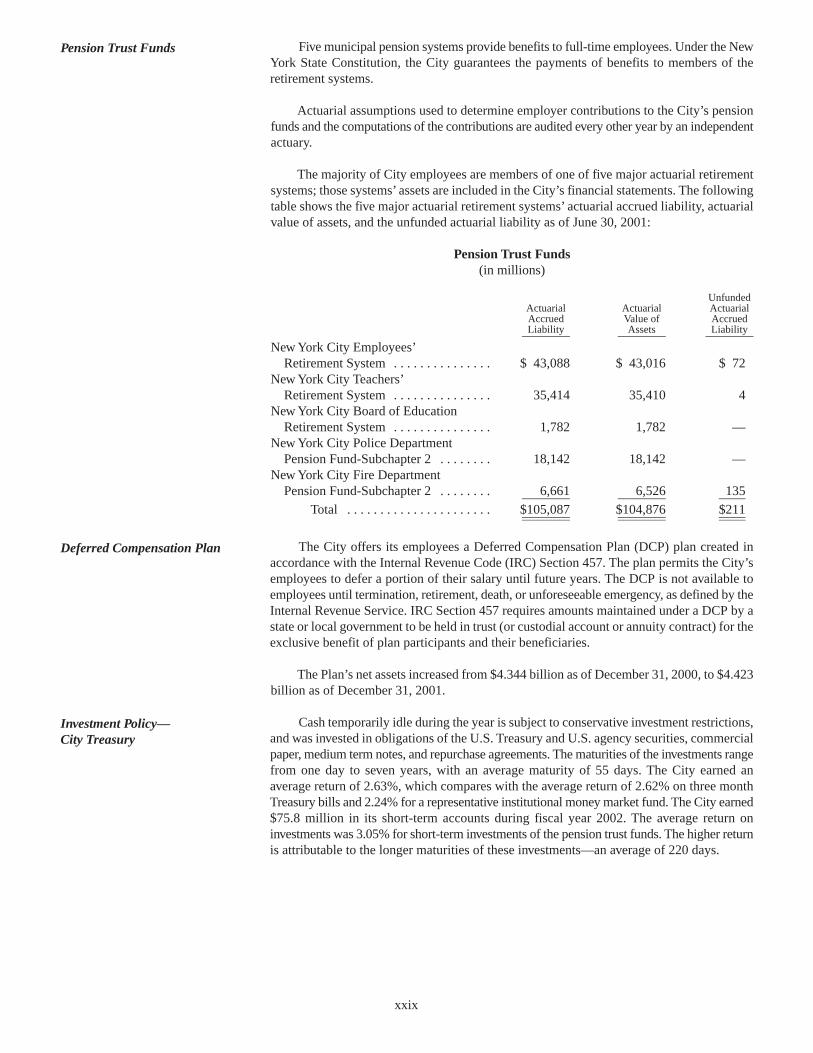
Five municipal pension systems provide benefits to full-time employees. Under the NewYork State Constitution, the City guarantees the payments of benefits to members of theretirement systems.
Actuarial assumptions used to determine employer contributions to the City’s pensionfunds and the computations of the contributions are audited every other year by an independentactuary.
The majority of City employees are members of one of five major actuarial retirementsystems; those systems’ assets are included in the City’s financial statements. The followingtable shows the five major actuarial retirement systems’ actuarial accrued liability, actuarialvalue of assets, and the unfunded actuarial liability as of June 30, 2001:
Pension Trust Funds(in millions)
UnfundedActuarial Actuarial ActuarialAccrued Value of Accrued Liability Assets Liability_________ _________ _________
New York City Employees’Retirement System . . . . . . . . . . . . . . . $ 43,088 $ 43,016 $ 72
New York City Teachers’Retirement System . . . . . . . . . . . . . . . 35,414 35,410 4
New York City Board of EducationRetirement System . . . . . . . . . . . . . . . 1,782 1,782 —
New York City Police DepartmentPension Fund-Subchapter 2 . . . . . . . . 18,142 18,142 —
New York City Fire DepartmentPension Fund-Subchapter 2 . . . . . . . . 6,661 6,526 135_________ _________ _____
Total . . . . . . . . . . . . . . . . . . . . . . $105,087 $104,876 $211_________ _________ ______________ _________ _____
The City offers its employees a Deferred Compensation Plan (DCP) plan created inaccordance with the Internal Revenue Code (IRC) Section 457. The plan permits the City’semployees to defer a portion of their salary until future years. The DCP is not available toemployees until termination, retirement, death, or unforeseeable emergency, as defined by theInternal Revenue Service. IRC Section 457 requires amounts maintained under a DCP by astate or local government to be held in trust (or custodial account or annuity contract) for theexclusive benefit of plan participants and their beneficiaries.
The Plan’s net assets increased from $4.344 billion as of December 31, 2000, to $4.423billion as of December 31, 2001.
Cash temporarily idle during the year is subject to conservative investment restrictions,and was invested in obligations of the U.S. Treasury and U.S. agency securities, commercialpaper, medium term notes, and repurchase agreements. The maturities of the investments rangefrom one day to seven years, with an average maturity of 55 days. The City earned anaverage return of 2.63%, which compares with the average return of 2.62% on three monthTreasury bills and 2.24% for a representative institutional money market fund. The City earned$75.8 million in its short-term accounts during fiscal year 2002. The average return oninvestments was 3.05% for short-term investments of the pension trust funds. The higher returnis attributable to the longer maturities of these investments—an average of 220 days.
Investment Policy—City Treasury
Deferred Compensation Plan
Pension Trust Funds
xxix

Pension Systems Pension assets are invested long-term for the benefit of the planparticipants and their beneficiaries. All funds are managed by registered investment advisors,pursuant to applicable law and to guidelines issued by the Comptroller.
Collectively the pension funds utilize 30 domestic equity managers, 17 domestic fixedincome managers, 15 international equity managers and 12 private equity partnerships.Assets are managed in accordance with asset allocation policies adopted periodically by eachplan’s board of trustees. The percentage in each category is determined based on a studyindicating the probable rates of return and levels of risk for various asset allocations. The actualallocation may vary from this policy mix as market values shift and as investments areadded or terminated. The chart below shows the actual allocation as of June 30, 2002.
CITY OF NEW YORKPENSION SYSTEMS — ASSET ALLOCATION
As of June 30, 2002Summary (in Millions)
U.S. Equity . . . . . . . . . . . . . . . . . . . . . . . . . . . . . . . . . . . . . . . . . . . . . . . . . . . . . $38,474U.S. Fixed Income . . . . . . . . . . . . . . . . . . . . . . . . . . . . . . . . . . . . . . . . . . . . . . . 23,712International Equity . . . . . . . . . . . . . . . . . . . . . . . . . . . . . . . . . . . . . . . . . . . . . . 11,958Cash . . . . . . . . . . . . . . . . . . . . . . . . . . . . . . . . . . . . . . . . . . . . . . . . . . . . . . . . . . . 994_______
Total . . . . . . . . . . . . . . . . . . . . . . . . . . . . . . . . . . . . . . . . . . . . . . . . . . . . . . $75,138______________
Due to the long-term nature of their liabilities pension fund assets are invested with along-term investment horizon. Assets are invested in a diversified portfolio of capital marketsecurities. For the ten-year period ending June 30, 2002 the plans had annualized returns of9.4 percent. Investments in assets that are expected to produce higher returns are also subjectto greater volatility—i.e., large deviations from average returns—and may also producenegative returns. That was the case in fiscal year 2002, which was a difficult one for investors.Investments in stock markets within and outside the United States have generally lost value.For example, the Russell 3000 Index, a broad measure of the U.S. stock market, declined 17.25percent during this period, and the Europe, Australia and Far East (EAFE) Index, the mostcommonly used measure of performance in developed international markets, declined 9.48percent. Less developed international markets increased 1.31 percent. Bonds were thebrightest spot in the broad investment universe. The index used by the NYC pension fundsfor these fixed income investments returned 8.65 percent for the year, while lower-rated bondsdeclined in value.
The returns of the pension funds have been consistent with these broad market trends,and as a result, the asset allocation followed by the pension funds produced a combined returnof negative 8.3 percent. For the three-year period ending June 30, 2002 the combined returnwas -2.7 percent and for the five-year period it was 4.7 percent. Our above-average allocationto US stocks has also meant that in the short-run our pension fund return has been lower thanmany public funds, which lost an average of 5.8 percent for the past year. Our investment costsremain lower than those of other large public funds.
U.S. Equity51%
U.S. Fixed32%
Int’l Equity16%
Cash1%
Investment Policy—Pension Systems
xxx

The markets continued to be difficult in the first quarter of fiscal year 2003. The Russell3000 Index lost 17.2 percent during the September quarter, and the EAFE internationalindex lost 19.7 percent. The NYC bond index gained 4.9 percent. No prediction can be madeas to the returns that will be achieved during the next fiscal year.
Additional pension fund activities include economically targeted investments within NewYork City, such as low- and moderate-income housing. The current programs have beenallocated over $1 billion. New investments or commitments this year totaled about $42.3 million,bringing the aggregate to over $810 million. The ten-year performance of this program was9.01 percent as of June 30, 2002.
For the twenty-second consecutive year, the City of New York was awarded theprestigious Certificate of Achievement for Excellence in Financial Reporting by the GovernmentFinance Officers Association (GFOA). The Certificate signifies that the City’s financialreporting meets the highest standards of governmental financial reporting. Approximately only2,260 of some 87,000 local governmental units received the Certificate; the City is one of aselect group of 146 to have received the award for twenty two or more consecutive years. Tobe awarded a Certificate of Achievement for Excellence in Financial Reporting, a governmentmust publish an easily readable and efficiently organized Comprehensive Annual FinancialReport. The report for fiscal year 2001, again satisfied these requirements.
A Certificate of Achievement for Excellence in Financial Reporting is valid for a periodof one year only. I believe that this fiscal year 2002 Comprehensive Annual Financial Reportcontinues to meet the Certificate of Achievement for Excellence in Financial ReportingProgram’s requirements. I am submitting it to the GFOA to be considered for anothercertificate.
I want to thank the hundreds of accounting and financial personnel throughout the Citywho have cooperated with my office this past year. I appreciate your efforts on behalf of thepeople of the City of New York. I also want to thank my staff who have worked so tirelesslyin the preparation of these financial statements. Special thanks to Deputy Comptroller GregBrooks, Assistant Comptroller Warren Ruppel and Chief Accountant Michael Spitzer. Theywere ably supported by Deputy Chief Accountant Eileen Moran, Division Chief MariaTavares and Special Assistant to the Deputy Comptroller Martha Kiamos. I also want toacknowledge the Mayor and the Office of Management and Budget and the FinancialInformation Services Agency. Finally, I want to thank the City’s new independent auditors,Deloitte & Touche LLP, for their efforts throughout this audit engagement.
ACKNOWLEDGEMENTS
AWARDS
xxxi

[This page intentionally left blank.]

xxxiii
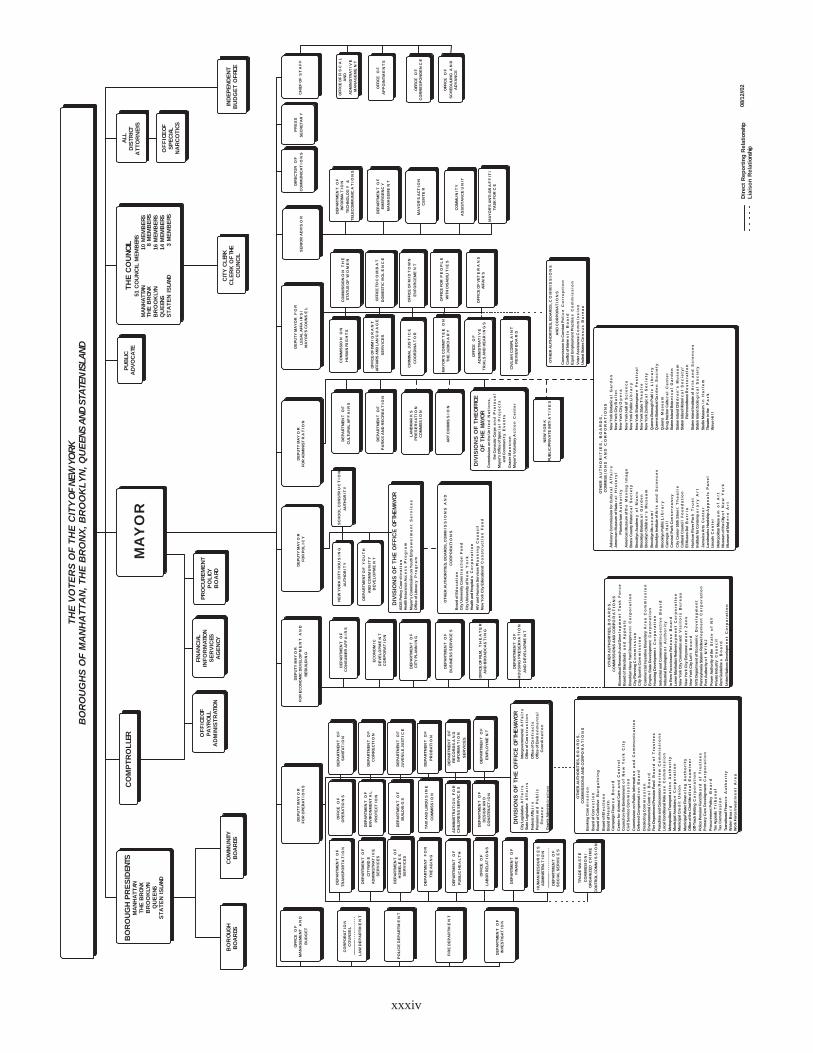
xxxiv
TH
E V
OT
ER
S O
F T
HE
CIT
Y O
F N
EW
YO
RK
BO
RO
UG
HS
OF
MA
NH
AT
TA
N,
TH
E B
RO
NX
, B
RO
OK
LY
N,
QU
EE
NS
AN
D S
TA
TE
N IS
LA
ND
BO
RO
UG
H P
RE
SID
EN
TS
MA
NH
AT
TAN
TH
E B
RO
NX
BR
OO
KLY
NQ
UE
ENS
ST
AT
EN
IS
LAND
CO
MP
TR
OL
LER
PU
BLIC
AD
VO
CA
TE
TH
E C
OU
NC
IL51 C
OU
NC
IL M
EM
BERS
M
AN
HA
TTA
N10 M
EM
BE
RS
T
HE
BR
ONX
8 M
EM
BE
RS
B
RO
OK
LYN
16 M
EM
BE
RS
Q
UE
ENS
14 M
EM
BE
RS
S
TA
TE
N I
SLA
ND
3 M
EM
BE
RS
ALL
DIS
TR
ICT
AT
TO
RN
EYS
BO
RO
UG
HB
OA
RDS
CO
MM
UN
ITY
BO
AR
DS
FIN
AN
CIA
LIN
FO
RM
ATIO
NS
ER
VIC
ES
AG
EN
CY
PR
OC
UR
EM
EN
TP
OL
ICY
BO
ARD
CIT
Y C
LER
KC
LE
RK
OF
THE
CO
UN
CIL
DIR
EC
TO
R O
F
CO
MM
UN
ICA
TIO
NS
CH
IEF
OF
S
TA
FF
OF
FIC
E O
F
MA
NA
GE
ME
NT
A
ND
BU
DG
ET
DE
PA
RT
ME
NT
O
F
TR
AN
SP
OR
TA
TIO
N
DE
PA
RT
ME
NT
O
F
SA
NIT
AT
IO
N
DE
PA
RT
ME
NT
O
F
CIT
YW
IDE
AD
MIN
IST
RA
TIV
E
SE
RV
ICE
S
DE
PA
RT
ME
NT
O
F
EN
VIR
ON
ME
NT
AL
PR
OT
EC
TIO
N
DE
PA
RT
ME
NT
O
F
CO
RR
EC
TIO
N
DE
PA
RT
ME
NT
O
F
JU
VE
NIL
E J
US
TIC
E
DE
PA
RT
ME
NT
F
OR
TH
E A
GIN
G
DE
PA
RT
ME
NT
O
F
BU
ILD
ING
S
DE
PA
RT
ME
NT
O
F
PR
OB
AT
IO
N
DE
PA
RT
ME
NT
O
F
PU
BL
IC H
EA
LT
H
DIV
ISIO
NS
OF
TH
E O
FF
ICE
OF
THE M
AYO
RC
ity L
eg
isla
tive A
ff
air
sIn
terg
overn
men
tal
Af
fa
ir
s
Sta
te L
eg
isla
tive
A
ff
air
sO
ffic
e o
f C
on
str
uc
tio
n
Fed
era
l A
ffa
ir
sO
ffic
e o
f C
on
tr
ac
ts
Pensio
ns a
nd
P
ub
lic
Off
ice o
f E
nvir
on
me
nta
l
Fin
an
ce
C
oo
rdin
atio
n
Gra
nts
Ad
min
istr
atio
n
Dir
ect
Rep
ort
ing
Rela
tionsh
ipL
iais
on
Re
lati
onsh
ipOF
FIC
E O
FS
PE
CIA
LN
AR
CO
TIC
S
DE
PU
TY
MA
YO
R
FO
R O
PE
RA
TIO
NS
08/1
2//02
OF
FIC
E O
FP
AY
RO
LL
AD
MIN
IST
RA
TIO
N
DE
PA
RT
ME
NT
O
F
HO
ME
LE
SS
SE
RV
ICE
S
DE
PA
RT
ME
NT
O
F
RE
CO
RD
S A
ND
INF
OR
MA
TIO
N
SE
RV
ICE
S
CO
RP
OR
AT
IO
N
CO
UN
SE
L
----------------
------------
LA
W D
EP
AR
TM
EN
T
DE
PU
TY
MA
YO
R
FO
R E
CO
NO
MIC
DE
VE
LO
PM
EN
T A
ND
RE
BU
ILD
IN
G
PO
LIC
E D
EP
AR
TM
EN
T
FIR
E D
EP
AR
TM
EN
T
DE
PA
RT
ME
NT
O
F
INV
ES
TIG
AT
IO
N
OF
FIC
E O
F
AP
PO
INT
ME
NT
S
IND
EP
EN
DE
NT
BU
DG
ET
OF
FIC
E
OF
FIC
E O
F F
IS
CA
L
AN
D
AD
MIN
IST
RA
TIV
E
MA
NA
GE
ME
NT
OF
FIC
E O
F
CO
RR
ES
PO
ND
EN
CE
PR
ES
S
SE
CR
ET
AR
Y
OF
FIC
E T
O C
OM
BA
T
DO
ME
ST
IC V
IOL
EN
CE
CO
MM
ISS
ION
O
N
HU
MA
N R
IGH
TS
OF
FIC
E O
F
LA
BO
R R
EL
AT
IO
NS
DE
PA
RT
ME
NT
O
F
FIN
AN
CE
OF
FIC
E O
F
OP
ER
AT
ION
S
HU
MA
N R
ES
OU
RC
ES
AD
MIN
IST
RA
TIO
N
----------------
-------------
DE
PA
RT
ME
NT
O
F
SO
CIA
L S
ER
VIC
ES
DE
PA
RT
ME
NT
O
F
CO
NS
UM
ER
AF
FA
IR
S
OF
FIC
E F
OR
P
EO
PL
E
WIT
H D
ISA
BIL
IT
IE
S
TA
XI A
ND
LIM
OU
SI
NE
CO
MM
ISS
IO
N
DE
PA
RT
ME
NT
O
F
EM
PL
OY
ME
NT
OT
HE
R A
UT
HO
RIT
IES
, B
OA
RD
S,
CO
MM
ISS
ION
S A
ND
CO
RP
OR
AT
IO
NS
Bio
med
ical R
esearc
h a
nd
Deve
lo
pm
en
t T
as
k F
or
ce
Bo
ard
of S
tan
dard
s a
nd
A
pp
ea
ls
Bro
okly
n N
avy Y
ard
Develo
pm
en
t C
or
po
ra
tio
n
City P
lan
nin
g C
om
mis
sio
n
Cit
y S
po
rts C
om
mis
sio
n
Co
mm
erc
ial In
cen
tive B
ou
nd
ary
A
re
a C
om
mis
sio
n
Em
pir
e S
tate
Develo
pm
en
t C
or
po
ra
tio
n
Ho
usin
g D
evelo
pm
en
t C
or
po
ra
tio
n
Ind
ustr
ial an
d C
om
merc
ial In
ce
ntiv
e B
oa
rd
Industr
ial D
evelo
pm
en
t A
uth
or
ity
In R
em
Fo
reclo
su
re R
ele
as
e B
oa
rd
Low
er
Manhattan R
edevelo
pm
en
t C
or
po
ra
tio
n
New
Yo
rk C
ity C
on
ven
tio
n a
nd
V
is
ito
rs
B
ur
ea
u
New
Yo
rk C
ity E
mp
ow
er
me
nt Z
on
e
New
Yo
rk C
ity L
of
t B
oa
rd
NY
S D
ep
art
men
t o
f E
co
no
mic
D
ev
elo
pm
en
t
Pen
nsylv
an
ia S
tatio
n R
ed
eve
lo
pm
en
t C
or
po
ra
tio
n
Po
rt A
uth
ori
ty o
f N
Y/N
J
Po
wer
Au
tho
rity
of th
e S
ta
te
o
f N
Y
Pri
vate
In
du
str
y C
ou
nc
il
Rent G
uid
elin
es
B
oa
rd
United N
ations D
evelo
pm
en
t C
or
po
ra
tio
n
O
TH
ER
A
UT
HO
RIT
IE
S, B
OA
RD
S,
C
OM
MIS
SIO
NS
A
ND
C
OR
PO
RA
TIO
NS
Ad
vis
ory
Co
mm
issio
n fo
r C
ultu
ra
l A
ff
air
sN
ew
Yo
rk B
ota
nic
al G
ar
de
n
Am
eri
can
Mu
seu
m o
f N
atu
ra
l H
is
to
ry
/N
ew
Yo
rk C
ity B
alle
t
Pla
neta
riu
m A
uth
or
ity
New
Yo
rk C
ity O
pe
ra
Am
eri
can
Mu
seu
m o
f th
e M
ov
ing
Im
ag
eN
ew
Yo
rk H
all o
f S
cie
nc
e
Bro
nx C
ounty
His
tori
ca
l S
oc
ie
ty
New
Yo
rk P
ub
lic L
ib
ra
ry
Bro
okly
n A
cad
em
y o
f M
us
ic
New
Yo
rk S
hakesp
ear
e F
es
tiv
al
Bro
okly
n B
ota
nic
al G
ar
de
nN
ew
Yo
rk S
tate
Th
ea
tr
e
Bro
okly
n C
hild
re
n's
M
us
eu
mN
ew
Yo
rk Z
oo
log
ica
l S
oc
ie
ty
Bro
okly
n M
us
eu
m/
Queens B
oro
ugh P
ublic
L
ib
ra
ry
Bro
okly
n In
stitu
te o
f A
rts
a
nd
S
cie
nc
es
Queens B
ota
nic
al G
ar
de
n S
oc
ie
ty
Bro
okly
n P
ub
lic L
ib
ra
ry
Queens
M
us
eu
m
Carn
eg
ie H
all
Sn
ug
Harb
or
Cu
ltu
ra
l C
en
te
r
Ce
ntr
al P
ark
Co
ns
er
va
nc
yS
tate
n Isla
nd B
ota
nic
al G
ar
de
n
Cit
y C
en
ter
55th
Str
ee
t T
he
atr
eS
tate
n Isla
nd
Ch
ild
re
n's
M
us
eu
m
Cu
ltu
ral C
ou
ncil
F
ou
nd
atio
nS
tate
n Is
land H
isto
ric
al S
oc
ie
ty
/
El M
useo
Del
Ba
rr
io
Ric
hm
ondto
wn R
es
to
ra
tio
n
Hu
dso
n R
iver
Par
k T
ru
st
Sta
ten Is
land In
stitu
te o
f A
rts
a
nd
S
cie
nc
es
Institu
te for
Conte
mp
or
ar
y A
rt
Sta
ten Is
land Z
oolo
gic
al S
oc
ie
ty
Jam
aic
a A
rts C
en
te
rS
tudio
Museum
in
H
ar
le
m
Lan
dm
ark
s H
ard
sh
ip A
pp
ea
ls
P
an
el
Theatr
e in
the
P
ar
k
Lin
coln
C
en
te
rW
ave H
ill
Metr
opolit
an M
use
um
o
f A
rt
Museum
of th
e C
Ity o
f N
ew
Y
or
k
Museum
of M
od
er
n A
rt
MA
YO
R'S
CO
MM
ITT
EE
O
N
TH
E J
UD
ICIA
RY
OF
FIC
E O
F
AD
MIN
IST
RA
TIV
E
TR
IAL
S A
ND
HE
AR
IN
GS
CO
MM
ISS
ION
ON
T
HE
ST
AT
US
OF
W
OM
EN
DE
PA
RT
ME
NT
O
F
CIT
Y P
LA
NN
IN
G
EC
ON
OM
IC
DE
VE
LO
PM
EN
T
CO
RP
OR
AT
IO
N
DE
PA
RT
ME
NT
O
F
BU
SIN
ES
S S
ER
VIC
ES
OF
FIC
E O
F F
ILM
, T
HE
AT
ER
AN
D B
RO
AD
CA
ST
IN
G
OF
FIC
E O
F IM
MIG
RA
NT
AF
FA
IRS
AN
D L
AN
GU
AG
E
SE
RV
ICE
S
MA
YO
R
DE
PA
RT
ME
NT
O
F
INF
OR
MA
TIO
N
TE
CH
NO
LO
GY
&
TE
LE
CO
MM
UN
ICA
TIO
NS
CO
MM
UN
IT
Y
AS
SIS
TA
NC
E U
NIT
AD
MIN
IST
RA
TIO
N F
OR
CH
ILD
RE
NS
SE
RV
ICE
S
CR
IMIN
AL
JU
ST
IC
E
CO
OR
DIN
AT
OR
OF
FIC
E O
F M
ID
TO
WN
EN
FO
RC
EM
EN
TM
AY
OR
'S A
CT
IO
N
CE
NT
ER
MA
YO
R'S
AN
TI-
GR
AF
FIT
I
TA
SK
FO
RC
E
DE
PA
RT
ME
NT
O
F
EM
ER
GE
NC
Y
MA
NA
GE
ME
NT
OT
HE
R A
UT
HO
RIT
IES
, B
OA
RD
S,
CO
MM
ISS
ION
S A
ND
CO
RP
OR
AT
IO
NS
Ban
kin
g C
om
mis
sio
n
Board
of C
orr
ec
tio
n
Bo
ard
of C
olle
ctive
B
ar
ga
in
in
g
Bo
ard
of E
lec
tio
ns
Bo
ard
of H
ea
lth
Cam
paig
n F
inan
ce
B
oa
rd
Cen
ter
for
An
imal C
are
a
nd
C
on
tr
ol
Co
un
cil
on
th
e E
nvir
on
men
t o
f N
ew
Y
or
k C
ity
Civ
il S
erv
ice C
om
mis
sio
n
Co
mm
issio
n o
n P
ub
lic In
form
ati
on
a
nd
C
om
mu
nic
atio
n
Defe
rred
Co
mp
en
sat
io
n B
oa
rd
Dis
tric
tin
g C
om
mis
sio
n
En
vir
on
men
tal C
on
tro
l B
oa
rd
Fir
e D
ep
art
men
t P
en
sio
n F
und
B
oa
rd
o
f T
ru
ste
es
Fra
nchis
e a
nd C
oncessio
n R
ev
ie
w C
om
mis
sio
ns
Local C
onditio
nal R
ele
as
e C
om
mis
sio
n
Metr
opolit
an T
ransport
atio
n A
uth
or
ity
Munic
ipal A
ssis
tan
ce
C
or
po
ra
tio
n
Mu
nic
ipal C
red
it U
nio
n
Mu
nic
ipal W
ate
r F
inan
cin
g A
uth
or
ity
Offic
e o
f th
e C
hie
f M
ed
ic
al E
xa
min
er
Off-T
rack B
ettin
g C
or
po
ra
tio
n
Polic
e P
ensio
n F
und B
oa
rd
o
f T
ru
ste
es
Pri
mary
Care
Develo
pm
en
t C
or
po
ra
tio
n
Pro
cu
rem
en
t P
olicy
B
oa
rd
Tax A
ppeals
T
rib
un
al
Tax C
om
mis
sio
n
Tra
nsitio
nal F
inan
ce
A
uth
or
ity
Wa
ter
Bo
ar
d
Wo
rk F
orc
e In
vest
me
nt
A
re
a
NE
W Y
OR
K C
ITY
HO
US
IN
G
AU
TH
OR
ITY
SC
HO
OL
CO
NS
TR
UC
TIO
N
AU
TH
OR
ITY
DE
PU
TY
MA
YO
R
FO
R A
DM
INIS
TR
AT
IO
N
DE
PA
RT
ME
NT
O
F
CU
LT
UR
AL
AF
FA
IR
S
DE
PA
RT
ME
NT
O
F
PA
RK
S A
ND
RE
CR
EA
TIO
N
LA
ND
MA
RK
S
PR
ES
ER
VA
TIO
N
CO
MM
ISS
IO
N
DE
PU
TY
MA
YO
R
FO
R P
OL
IC
YS
EN
IOR
AD
VIS
OR
DE
PU
TY
MA
YO
R F
OR
LE
GA
L A
FF
AIR
S/
MA
YO
R'S
CO
UN
SE
L
DE
PA
RT
ME
NT
O
F
HO
US
ING
PR
ES
ER
VA
TIO
N
AN
D D
EV
EL
OP
ME
NT
DE
PA
RT
ME
NT
O
F
DE
SIG
N A
ND
CO
NS
TR
UC
TIO
N
DIV
ISIO
NS
OF
TH
E O
FF
ICE
OF
THE M
AYO
RA
IDS
Po
licy C
oo
rd
ina
tio
n
Health
In
su
ran
ce A
cc
es
s P
ro
gr
am
Mayo
r's C
om
mis
sio
n o
n Y
ou
th E
mp
ow
er
me
nt
S
er
vic
es
Off
ice o
f L
itera
cy
P
ro
gr
am
OT
HE
R A
UT
HO
RIT
IES
, B
OA
RD
S, C
OM
MIS
SIO
NS
A
ND
CO
RP
OR
AT
IO
NS
Bo
ard
of E
du
ca
tio
n
City U
niv
ers
ity C
on
str
uc
tio
n F
un
d
City U
niv
ers
ity o
f N
ew
Y
or
k
Health a
nd H
ospitals
C
or
po
ra
tio
n
HIV
an
d H
um
an
Serv
ices P
lan
nin
g C
ou
nc
il
New
Yo
rk C
ity E
du
catio
nal
Co
ns
tr
uc
tio
n F
un
d
OT
HE
R A
UT
HO
RIT
IES
, B
OA
RD
S, C
OM
MIS
SIO
NS
AN
D C
OR
PO
RA
TIO
NS
Co
mm
issio
n t
o C
om
bat
Po
lic
e C
or
ru
ptio
n
Confli
ct of In
tere
st
s B
oa
rd
Eq
ual E
mp
loym
en
t P
racti
ce
s C
om
mis
sio
n
Vo
ter
Assis
tan
ce C
om
mis
sio
n
Un
ited
Sta
tes C
en
su
s B
ur
ea
uT
RA
DE
WA
ST
E
CO
MM
ISS
IO
N/
OR
GA
NIZ
ED
C
RIM
E
CO
NT
RO
L C
OM
MIS
SIO
N
DIV
ISIO
NS
OF
TH
E O
FFIC
EO
F T
HE
MA
YO
RC
om
mis
sio
n o
n th
e U
nit
ed
N
atio
ns
,
the C
on
su
lar
Co
rps a
nd
P
ro
to
co
l
Mayo
r's O
ffic
e o
f S
pec
ia
l P
ro
je
cts
an
d C
om
mu
nity
E
ve
nts
Gra
cie
Ma
ns
ion
Mayo
r's V
olu
nta
ry A
ctio
n C
en
te
r
NE
W Y
OR
K
PU
BL
IC/P
RIV
AT
E IN
ITIA
TIV
ES
AR
T C
OM
MIS
SIO
N
CIV
ILIA
N C
OM
PL
AIN
T
RE
VIE
W B
OA
RD
OF
FIC
E O
F V
ET
ER
AN
S
AFFA
IR
S
DE
PA
RT
ME
NT
OF
Y
OU
TH
AN
D C
OM
MU
NIT
Y
DE
VE
LO
PM
EN
T
OF
FIC
E O
F
SC
HE
DU
LIN
G A
ND
AD
VA
NC
E

xxxv
Principal Officials
of
The City of New York
Mayor Michael R. Bloomberg
Comptroller William C. Thompson, Jr.
Public Advocate Betsy Gotbaum
The Council:
Speaker A. Gifford Miller
Majority Leader Joel Rivera
Minority Leader James S. Oddo
Borough Presidents:
The Bronx Adolfo Carrion, Jr.
Brooklyn Marty Markowitz
Manhattan C. Virginia Fields
Queens Helen M. Marshall
Staten Island James P. Molinaro

[This page intentionally left blank.]

The City of New York
ComprehensiveAnnual Financial Report
of theComptroller
FINANCIAL SECTION
Part II
Fiscal Year Ended June 30, 2002


3
Independent Auditors’ Report
The People of The City of New York:
We have audited the accompanying financial statements of the governmental activities, the aggregate discretely presented componentunits, each major fund, and the aggregate remaining fund information of the City of New York, New York, (the “City”) as of and forthe year ended June 30, 2002, which collectively comprise the City’s basic financial statements as listed in the table of contents. Wealso have audited the financial statements of each of the City’s nonmajor governmental, nonmajor component units and fiduciary fundspresented as supplementary information in the accompanying combining and individual fund financial statements as of and for theyear ended June 30, 2002, as listed in the table of contents. These financial statements are the responsibility of the City of New York’smanagement. Our responsibility is to express opinions on these financial statements based on our audit. We did not audit thefinancial statements of those entities disclosed in Note E.1 which represent 52 percent and 15 percent, respectively, of the assets andrevenues of the City of New York. Those financial statements were audited by other auditors whose reports thereon have been furnishedto us, and our opinion, insofar as it relates to the amounts included for those entities disclosed in Note E.1. The financial statementsof the governmental activities, the aggregate discretely presented component units, each major fund, and the aggregate remainingfund information of the City for the year ended June 30, 2001 were audited by other auditors whose report, dated October 30, 2001,expressed an unqualified opinion on those statements, expressed reliance on other auditors and included an emphasis of a matter regardingthe adoption of GASB Statement No. 34.
We conducted our audit in accordance with auditing standards generally accepted in the United States of America. Those standardsrequire that we plan and perform the audit to obtain reasonable assurance about whether the financial statements are free of materialmisstatement. An audit includes examining, on a test basis, evidence supporting the amounts and disclosures in the financialstatements. An audit also includes assessing the accounting principles used and significant estimates made by management, as wellas evaluating the overall financial statement presentation. We believe that our audit and the reports of other auditors provide a reasonablebasis for our opinions.
In our opinion, based on our audit and the reports of other auditors, the financial statements referred to above present fairly, in all materialrespects, the respective financial position of the governmental activities, the aggregate discretely presented component units, each majorfund, and the aggregate remaining fund information of the City New York, New York, as of June 30, 2002, and the respective changes infinancial position, where applicable, thereof for the year then ended in conformity with accounting principles generally accepted in theUnited States of America. In addition, in our opinion, based upon our audit and the reports of other auditors, the financial statements referredto above present fairly, in all material respects, the respective financial position of each nonmajor governmental, nonmajor componentunit and fiduciary fund of the City of New York, New York, as of June 30, 2002, and the respective changes in financial position, whereapplicable, thereof for the year then ended in conformity with accounting principles generally accepted in the United States of America.
The Management’s Discussion and Analysis on pages 7 through 25 is not a required part of the basic financial statements but issupplementary information required by the Governmental Accounting Standards Board. We and the other auditors have applied certainlimited procedures, which consisted principally of inquiries of management regarding the methods of measurement and presentationof the required 2002 supplementary information. However, we did not audit the information and express no opinion on it.
Our audit was conducted for the purpose of forming opinions on the financial statements that collectively comprise the City of New York’sbasic financial statements. The accompanying financial information listed as Other Supplementary Information, in the foregoing tableof contents, is presented for purposes of additional analysis and is not a required part of the basic financial statements. This supplementaryinformation is the responsibility of City of New York’s management. The accompanying financial information listed as OtherSupplementary Information, in the foregoing table of contents, has been subjected to the auditing procedures applied by us and the otherauditors in the audit of the basic financial statements and, in our opinion, based on our audit and the report of other auditors, are fairlystated in all material respects in relation to the basic financial statements taken as a whole. The June 30, 2001 information was subjectedto auditing procedures by other auditors whose report dated October 30, 2001, referred to above, stated that the supplementaryinformation was fairly stated in all material respects in relation to the June 30, 2001 financial statements taken as a whole. TheIntroductory Section and Statistical Section, in the foregoing table of contents, has not been subjected to the auditing procedures appliedby us and the other auditors in the audit of the basic financial statements and, accordingly, we express no opinion on them.
October 28, 2002

[This page intentionally left blank.]

The City of New York
ComprehensiveAnnual Financial Report
of theComptroller
BASICFINANCIAL STATEMENTS
Part II-A
Fiscal Year Ended June 30, 2002

MANAGEMENT’S DISCUSSION AND ANALYSIS
The following is a narrative overview and analysis of the financial activities of The Cityof New York (City) for the fiscal years ended June 30, 2002 and 2001. This discussion andanalysis is intended to serve as an introduction to the City’s basic financial statements,which have the following components: (1) management’s discussion and analysis (MD&A),(2) government-wide financial statements, (3) fund financial statements, and (4) notes to thefinancial statements.
The government-wide financial statements are designed to provide readers with a broadoverview of the City’s finances in a manner similar to a private-sector business.
The statement of net assets presents information on all of the City’s assets and liabilities,with the difference between the two reported as net assets. Over time, increases or decreasesin net assets may serve as a useful indicator of whether the financial position of the City isimproving or deteriorating.
The statement of activities presents information showing how the City’s net assetschanged during each fiscal year. All changes in net assets are reported as soon as theunderlying event giving rise to the change occurs, regardless of the timing of related cash flows.Thus, revenues and expenses are reported in the statement for some items that will only resultin cash flows in future fiscal periods (for example, uncollected taxes, and earned, but unusedvacation leave).
The government-wide financial statements present information about the City as aprimary government, which includes the City’s blended component units. All of the activitiesof the primary government are considered to be governmental activities. This information ispresented separately from the City’s discretely presented component units.
A fund is a grouping of related accounts that is used to maintain control over resourcesthat have been segregated for specific activities or objectives. The City uses fund accountingto ensure and demonstrate compliance with finance-related legal requirements, including theFinancial Emergency Act.
Governmental funds are used to account for essentially the same functions reported asgovernmental activities in the government-wide financial statements. Governmental fundfinancial statements focus on near-term inflows and outflows of spendable resources, as wellas on balances of spendable resources available at the end of a fiscal year. Such informationmay be useful in evaluating a government’s near-term financing requirements.
Because the focus of governmental funds is narrower than that of the government widefinancial statements, it is useful to compare the information presented for governmental fundswith similar information presented for governmental activities in the government-widefinancial statements. By doing so, readers may better understand the long-term impact of thegovernment’s near-term financing decisions. Both the governmental fund balance sheet andthe governmental fund statement of revenues, expenditures, and changes in fund balancesprovide a reconciliation to facilitate the comparison between governmental funds andgovernmental activities.
The City adopts an annual appropriated budget for its General Fund. A budgetarycomparison statement has been provided for the General Fund to demonstrate compliance withthis budget.
Fiduciary funds are used to account for resources held for the benefit of parties outsidethe government. Fiduciary funds are not reflected in the government-wide financial statementsbecause the resources of those funds are not available to support the City’s own programs.The fiduciary funds include the Pension and Other Employee Benefit Trust Funds and theAgency Fund.
Fiduciary funds
Governmental funds
Fund financial statements
Government-widefinancial statements
Overview of theFinancial Statements
7

The notes to the financial statements provide additional information that is essential fora full understanding of the information provided in the government-wide and fund financialstatements. The notes also present certain required supplementary information concerning theCity’s progress in funding its obligation to provide pension benefits to its employees.
The financial reporting entity consists of the primary government, including the Boardof Education of The City of New York and the community colleges of the City University ofNew York, other organizations for which the primary government is financially accountable,and other organizations for which the nature and significance of their relationship with theprimary government are such that exclusion would cause the financial statements to bemisleading or incomplete.
The definition of the reporting entity is based on the notion of financial accountability.A primary government is financially accountable for the organizations that make up its legalentity. It is also financially accountable for legally separate organizations if its officialsappoint a voting majority of an organization’s governing body and it is able to either imposeits will on that organization or there is a potential for the organization to provide specificfinancial benefits to, or to impose specific financial burdens on the primary government. Aprimary government may also be financially accountable for governmental organizations thatare fiscally dependent on it.
Certain component units, despite being legally separate from the primary government,are blended with the primary government. These component units all provide servicesexclusively to the City and thus are reported as if they were part of the primary government.The blended component units, which are all reported as nonmajor governmental funds, arethe following:
Municipal Assistance Corporation for the City of New York (MAC)New York City Transitional Finance Authority (TFA)New York City Samurai Funding Corporation (SFC)TSASC, Inc. (TSASC)New York City Educational Construction Fund (ECF)City University Construction Fund (CUCF)New York City School Construction Authority (SCA).
Discretely presented component units are legally separate from the primary governmentand are reported as discretely presented component units because the City appoints a majorityof these organizations’ boards, is able to impose its will on them, or a financial benefit/burdensituation exists.
The following entities are presented discretely in the City’s financial statements asmajor component units:
New York City Health and Hospitals Corporation (HHC)New York City Off-Track Betting Corporation (OTB)New York City Housing Development Corporation (HDC)New York City Housing Authority (HA)New York City Economic Development Corporation (EDC)New York City Water and Sewer System (NYW).
The following entities are presented discretely in the City’s financial statements asnonmajor component units:
New York City Industrial Development Agency (IDA)Business Relocation Assistance Corporation (BRAC)Brooklyn Navy Yard Development Corporation (BNYDC)Jay Street Development Corporation (JSDC).
Discretely Presented Component Units
Blended Component Units
Financial Reporting Entity
Notes to the financial statements
8

In the government-wide financial statements, all of the activities of the City, asidefrom its discretely presented component units, are considered governmental activities.Governmental activities decreased the City’s net assets by $3.852 billion during fiscal year2002, decreased the City’s net assets by $1.148 billion during fiscal year 2001 and increasedthe City’s net assets by $1.455 billion during fiscal year 2000.
As mentioned previously, the basic financial statements include a reconciliationbetween the fiscal year 2002 governmental funds statement of revenues, expenditures, andchanges in fund balance which reports a decrease of $2.849 billion in fund balances and thereported increase in the excess of liabilities over assets reported in the government-widestatement of activities $3.852 billion, a difference of $1.003 billion. A similar reconciliationis provided for fiscal year 2001 amounts.
Key elements of the reconciliation of these two statements are that the government-wide statement of activities report the issuance of debt as a liability, the purchases of capitalassets as assets which are then charged to expense over their useful lives (depreciated) andchanges in long-term liabilities as adjustments of expenses. Conversely the governmentalfunds statements report the issuance of debt as an other financing source of funds, therepayment of debt as an expenditure, the purchase of capital assets as an expenditure anddoes not reflect changes in long-term liabilities.
Key elements of these changes are as follows:Governmental Activities
For the fiscal year ended June 30,_______________________________________________2002 2001 2000_____________ _____________ _____________
(in thousands)
Revenues:Program revenues:
Charges for services . . . . . . . . . . . . . . $ 3,001,330 $ 2,868,605 $ 2,620,702Operating grants and contributions . . . 14,651,155 12,773,015 11,907,550Capital grants and contributions . . . . . 493,798 572,514 378,807
General revenues:Taxes . . . . . . . . . . . . . . . . . . . . . . . . . . 21,939,595 23,712,065 22,157,704Investment income . . . . . . . . . . . . . . . 190,041 391,902 346,857Other Federal and State aid . . . . . . . . 975,281 928,184 920,547Other . . . . . . . . . . . . . . . . . . . . . . . . . . 435,149 633,579 347,937___________ ___________ ___________
Total revenues . . . . . . . . . . . . . . . 41,686,349 41,879,864 38,680,104___________ ___________ ___________
Expenses:General government . . . . . . . . . . . . . . . . 2,070,573 1,881,812 1,578,356Public safety and judicial . . . . . . . . . . . . 9,524,318 8,661,411 7,772,048Education . . . . . . . . . . . . . . . . . . . . . . . . 13,249,344 12,248,775 11,533,688City University . . . . . . . . . . . . . . . . . . . . 807,960 668,954 652,576Social services . . . . . . . . . . . . . . . . . . . . 9,567,970 9,166,149 8,783,221Environmental protection . . . . . . . . . . . . 2,205,704 2,350,867 2,058,606Transportation services . . . . . . . . . . . . . . 1,329,314 1,654,344 1,401,725Parks, recreation and cultural activities . . 719,867 488,865 574,024Housing . . . . . . . . . . . . . . . . . . . . . . . . . . 905,461 1,000,300 847,358Health (including payments to HHC) . . . 2,816,360 2,329,191 1,976,975Libraries . . . . . . . . . . . . . . . . . . . . . . . . . 161,250 362,034 268,931Debt service interest . . . . . . . . . . . . . . . . 2,180,711 2,214,717 2,114,285___________ ___________ ___________
Total expenses . . . . . . . . . . . . . . . 45,538,832 43,027,419 39,561,793___________ ___________ ___________(3,852,483) (1,147,555) (881,689)
Decrease in accrued pension liability . . . . . — — 2,336,230___________ ___________ ___________Change in net assets . . . . . . . . . . . . . . . . . . (3,852,483) (1,147,555) 1,454,541Net Assets—Beginning . . . . . . . . . . . . . . . (19,847,159) (18,699,604) (20,154,145)___________ ___________ ___________Net Assets—Ending . . . . . . . . . . . . . . . . . . $(23,699,642) $(19,847,159) $(18,699,604)___________ ___________ ______________________ ___________ ___________
Financial Analysis of theGovernment-wideFinancial statements
9

In fiscal year 2002, the government-wide revenues decreased from fiscal year 2001 levelsby approximately $194 million, while government-wide expenses grew by approximately $2.5billion.
While government-wide revenue remained fairly consistant, there were major fluctuationswithin:
• A decrease in personal income tax, resulting largely from the after effects ofSeptember 11th and overall job market weakness throughout the fiscal year;
• An increase in real estate tax, resulting from a continuing increase in real propertyvaluations;
• A decrease in investment income, resulting from lower interest rates;
• An increase in federal aid, resulting in large part from the FEMA assistance;
• An increase in State aid for the City’s Board of Education.
The major components of the government-wide expense increases were:
• Significant expenses relating to the recovery and clean-up effort of the September11th attack on the World Trade Center;
• Increases in health and social service spending, resulting in large part from theSeptember 11th aftermath and an increased spending on medicaid;
• Wage and salary increases for City employees relating to collective bargaining; and
• • An increase in education spending.
In fiscal year 2001, the government-wide revenues increased from fiscal year 2000 levelsby approximately $3.2 billion, while the Government-wide expenses grew by approximately$3.5 billion. In addition, a one-time gain from the elimination of a pension liability occurredin fiscal year 2000.
The major components of the government-wide revenue increase were:
• A one-time payment from the Metropolitan Transportation Authority resulting fromthe sale of the New York Coliseum;
• An increase in State aid for the City’s Board of Education; and
• An increase in personal income and property tax revenues, resulting from the strengthof the economy and increased property values which are phased into the property tax levy.
The major components of the government-wide expense increases were:
• A substantial increase in spending by the City’s Board of Education, including a reservefor collective bargaining and the increased State funding as previously mentioned;
• An increase in pension expense, resulting from pension benefit enhancements andthe phase-in of cost of living adjustments, as required by changes in State law;
• An increase in social services spending, primarily related to increased spending onMedicaid and day care.
• Wage and salary increases for City employees related to collective bargaining; and
• Increased expenses for environmental protection, primarily additional costs forwaste exportation and Fresh Kills landfill closure and post-closure care.
The following two charts compare the expenses for each of the City’s programs with therevenues that are derived from each program for fiscal years 2002 and 2001. The excess ofprogram expenses over revenues represents the net cost of each program that must befinanced from the City’s general revenues.
10

11
Genera
l gov
ernmen
t$0
$2,000
$4,000
$6,000
$8,000
$10,000
$12,000
$14,000Expenses
Program Revenues
(in
mill
ions
)
Expenses and Program Revenues — Governmental ActivitiesJune 30, 2002
Functions / Programs
Public
safet
y and
judic
ial
Educa
tion
City U
nivers
ity
Librari
es
Housin
g
Parks,
recrea
tion a
nd cu
ltural
activ
ities
Transp
ortat
ion se
rvice
s
Enviro
nmen
tal pr
otecti
on
Social
serv
ices
Health
Debt s
ervice
inter
est
Genera
l gov
ernmen
t$0
$2,000
$4,000
$6,000
$8,000
$10,000
$12,000
$14,000Expenses
Program Revenues
(in
mill
ions
)
Expenses and Program Revenues — Governmental ActivitiesJune 30, 2001
Public
safet
y and
judic
ial
Educa
tion
City U
nivers
ity
Librari
es
Housin
g
Parks,
recrea
tion a
nd cu
ltural
activ
ities
Transp
ortat
ion se
rvice
s
Enviro
nmen
tal pr
otecti
on
Social
serv
ices
Health
Debt s
ervice
inter
est
Functions / Programs

The following chart compares the amounts of program and general revenues for fiscalyears 2002 and 2001:
As noted earlier, increases and decreases of net assets may serve over time as a usefulindicator of changes in a government’s financial position. In the case of the City, liabilitiesexceeded assets by $23.700 billion at the close of the most recent fiscal year, an increase of$3.852 billion from June 30, 2001, which had increased $1.148 billion from June 30, 2000.
Governmental Activities____________________________________________2002 2001 2000___________ ___________ ___________
(in thousands)
Current and other assets . . . . . . . . . . . $ 17,794,681 $ 17,876,159 $ 19,299,094Capital assets . . . . . . . . . . . . . . . . . . . 26,659,071 24,497,361 22,538,547___________ ___________ ___________
Total assets . . . . . . . . . . . . . . . . . 44,453,752 42,373,520 41,837,641___________ ___________ ___________Long-term liabilities outstanding . . . . 55,080,090 50,065,513 48,839,966Other liabilities . . . . . . . . . . . . . . . . . . 13,073,304 12,155,166 11,697,279___________ ___________ ___________
Total liabilities . . . . . . . . . . . . . . 68,153,394 62,220,679 60,537,245___________ ___________ ___________Net assets:Invested in capital assets,
net of related debt . . . . . . . . . . . . . . (3,968,442) (2,415,545) (4,456,404)Restricted . . . . . . . . . . . . . . . . . . . . . . 1,922,910 3,814,045 4,189,167Unrestricted . . . . . . . . . . . . . . . . . . . . (21,654,110) (21,245,659) (18,432,367)___________ ___________ ___________
Total net assets . . . . . . . . . . . . . . $(23,699,642) $(19,847,159) $(18,699,604)___________ ___________ ______________________ ___________ ___________
Charg
es fo
r serv
ices
0%
5%
10%
15%
20%
25%
30%
35%
40%2002
2001
% o
f To
tal R
even
ues
Revenues by Source — Governmental Activities for the Years Ended June 30, 2002 and 2001
Operat
ing gr
ants
and c
ontri
butio
ns
Capita
l gran
ts an
d con
tribu
tions
Real e
state
taxes
Other
Inve
stmen
t inc
ome
Other t
axes
Inco
me tax
es, o
ther
Person
al inc
ome t
ax
Sales &
use t
axes
Other F
edera
l & S
tate a
id
Functions / Programs
12

The excess of liabilities over assets reported on the government-wide statement of netassets is a result of several factors. The largest component of the net deficit is the result ofthe City having long-term debt with no corresponding capital assets. The following summarizesthe main components of the negative net asset value as of June 30, 2002 and 2001:
Components of Net Asset Deficit 2002 2001____________________________ ________ ________(in billions)
Net Assets Invested in Capital Assets
Some City-owned assets have a depreciable life used for financial reporting that is different from the period over which the related debt principal is being repaid. Schools and related education assets depreciate more quickly than their related debt is paid, and they comprise the largest component of this difference . . . . . . . . . . . . . $ (4.0) $ (2.4)______ ______
Net Assets Restricted for Debt Service
Funds legally restricted for Debt Service . . . . . . . . . . . . . . . . . . . . . . 1.9 3.8______ ______
Unrestricted Net Assets
MAC issued debt during the 1970’s which funded some City operating expenses. This is the remaining MAC debt outstanding as of year end . . . . . . . . . . . . . . . . . . . . . . (2.9) (3.2)
TFA issued debt to finance costs related to the recoveryfrom the September 11, 2001 World Trade Centerdisaster, which are operating expenses of the City . . . . . . . . . . . . (0.5) —
The City has issued debt for the acquistion and construction of public purpose capital assets which are not reported as City-owned assets on the Statement of Net Assets. This includes assets of the New York City Transit Authority, NYW,HHC, and certain public libraries and cultural institutions. This is the debt outstanding for non-Cityowned assets at year end. Bond Issuance costs andoriginal issuance discounts are included here as well . . . . . . . . . . (13.0) (13.0)
Certain long-term obligations do not require current funding:Judgments and claims . . . . . . . . . . . . . . . . . . . . . . . . . . . . . . . . . . (4.3) (4.2)Vacation and sick leave . . . . . . . . . . . . . . . . . . . . . . . . . . . . . . . . . (2.2) (2.1)Pension liability . . . . . . . . . . . . . . . . . . . . . . . . . . . . . . . . . . . . . . . (0.3) (0.2)Landfill closure and postclosure costs . . . . . . . . . . . . . . . . . . . . . . (1.3) (1.4)
All unrestricted non-capital assets exceed the total of the City’s other liabilities by approximately: . . . . . . . . . . . . . . . . . . . . . . . . . 2.9 2.9______ ______
Total Unrestricted Net Assets . . . . . . . . . . . . . . . . . . . . . . . . . . . (21.6) (21.2)______ ______
Total Governmental Net Assets . . . . . . . . . . . . . . . . . . . . . . . . . . . . $(23.7) $(19.8)______ ____________ ______
13

As noted earlier, the City uses fund accounting to ensure and demonstrate compliancewith finance-related legal requirements. The table below summarizes the changes in thefund balances of the City’s governmental funds.
Governmental FundsNew York Nonmajor Total
City Capital General Debt Governmental Adjustment/ GovernmentalGeneral Fund Projects Fund Service Fund Funds Eliminations Funds______________ ______________ ______________ ______________ ______________ ______________
(in thousands)
Fund Balances (deficit), June 30, 2000 . . . . . $ 392,985 $(1,109,325) $ 2,513,482 $ 1,571,746 $ 175,054 $ 3,543,942Revenues . . . . . . . . . . . . . . . . . . . . . . . . . . . . 40,231,872 1,412,906 35,613 2,357,531 (1,443,379) 42,594,543Expenditures . . . . . . . . . . . . . . . . . . . . . . . . . (37,264,424) (5,309,954) (2,819,070) (2,700,519) 1,202,753 (46,891,214)Other financing sources (uses) . . . . . . . . . . . (2,962,553) 2,888,706 2,390,822 602,091 (19,150) 2,899,916____________________ ____________________ ____________________ ____________________ ____________________ ____________________Fund Balances (deficit), June 30, 2001 . . . . . 397,880 (2,117,667) 2,120,847 1,830,849 (84,722) 2,147,187____________________ ____________________ ____________________ ____________________ ____________________ ____________________Revenues . . . . . . . . . . . . . . . . . . . . . . . . . . . . 40,385,721 1,512,184 37,155 2,444,911 (1,489,539) 42,890,432Expenditures . . . . . . . . . . . . . . . . . . . . . . . . . (39,498,314) (6,320,102) (2,732,708) (3,149,808) 1,544,269 (50,156,663)Other financing sources (uses) . . . . . . . . . . . (882,147) 5,459,354 1,272,125 (1,420,341) (11,569) 4,417,422____________________ ____________________ ____________________ ____________________ ____________________ ____________________Fund Balances (deficit), June 30, 2002 . . . . . $ 403,140 $(1,466,231) $ 697,419 $ (294,389) $ (41,561) $ (701,622)____________________ ____________________ ____________________ ____________________ ____________________ ________________________________________ ____________________ ____________________ ____________________ ____________________ ____________________
The City’s General Fund is required to adopt an annual budget prepared on a basisconsistent with generally accepted accounting principles. Surpluses from any fiscal year cannotbe appropriated in future fiscal years.
If the City anticipates that the General Fund will have an operating surplus, the City willmake discretionary transfers to the General Debt Service Fund as well as advance paymentsof certain subsidies that reduce the amount of the General Fund surplus for financial reportingpurposes. As detailed later, the General Fund had operating surpluses of $682 million and $2.949billion before certain expenditures and discretionary and other transfers for fiscal years2002 and 2001, respectively. After these certain expenditures and discretionary and othertransfers, the General Fund reported an operating surplus of $5 million in both fiscal years2002 and 2001, which resulted in an increase in fund balance by this amount.
The General Debt Service Fund receives transfers from the General Fund from which itpays the City’s debt service requirements. Its fund balance at June 30, 2002 can be attributedprincipally to a discretionary transfer and other transfer (as described above) from the GeneralFund totaling $659 million in fiscal year 2002. Similar transfers in fiscal year 2001 of $2.097billion also primarily account for the General Debt Service Fund fund balance at June 30, 2001.
The New York City Capital Projects Fund accounts for the financing of the City’scapital program. The primary resources are obtained from the issuance of City debt as wellas transfers from TFA and TSASC. Capital-related expenditures are first paid from theGeneral Fund, which is then reimbursed for these expenditures by the New York City CapitalProjects Fund. To the extent that capital expenditures exceed proceeds from bond issuances,transfers from TFA and TSASC and other revenues and financing sources, this fund will havea deficit. The deficit fund balances at June 30, 2002 and 2001 are primarily attributed to amountsthat are owed to the General Fund to repay that Fund’s advance of resources for the City’scapital program.
The following information is presented to assist the reader in comparing the original budget(Adopted Budget), and the final amended budget (Modified Budget) and how actual resultscompared with these budgeted amounts. The Modified Budget can be modified subsequentto the end of the fiscal year.
General FundBudgetary Highlights
Financial Analysis of theGovernmental Funds
14
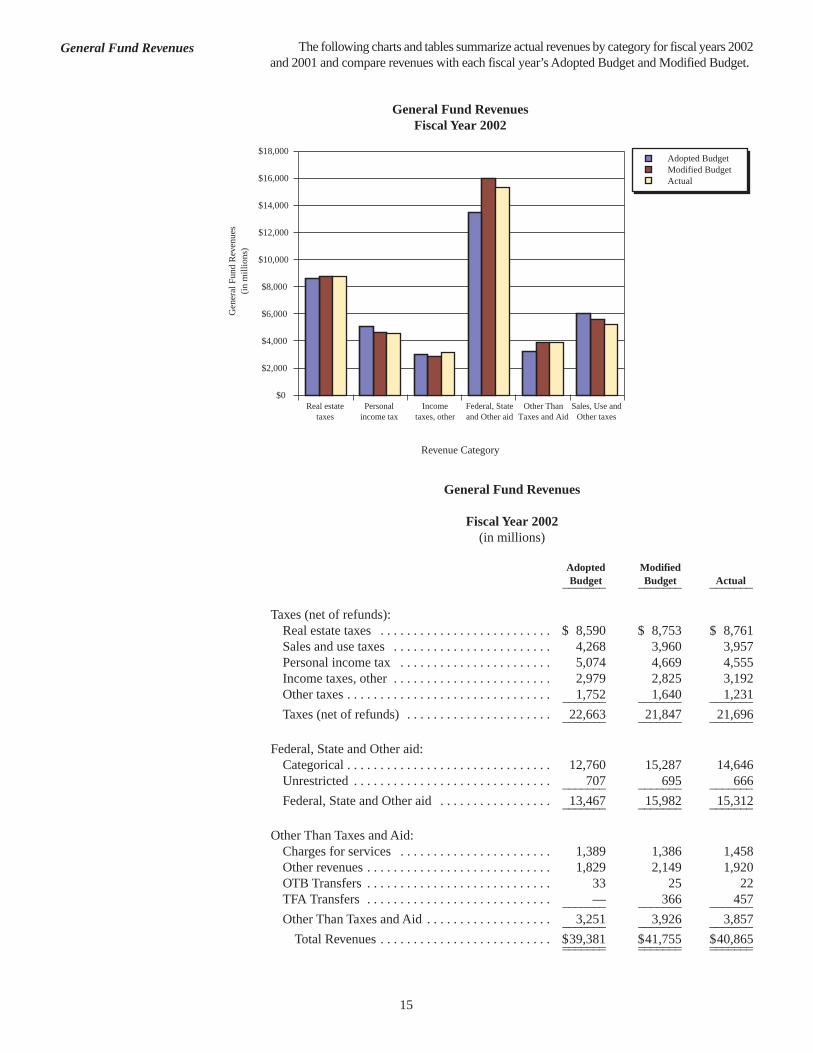
The following charts and tables summarize actual revenues by category for fiscal years 2002and 2001 and compare revenues with each fiscal year’s Adopted Budget and Modified Budget.
General Fund Revenues
Fiscal Year 2002(in millions)
Adopted ModifiedBudget Budget Actual_______ _______ _______
Taxes (net of refunds):Real estate taxes . . . . . . . . . . . . . . . . . . . . . . . . . . $ 8,590 $ 8,753 $ 8,761Sales and use taxes . . . . . . . . . . . . . . . . . . . . . . . . 4,268 3,960 3,957Personal income tax . . . . . . . . . . . . . . . . . . . . . . . 5,074 4,669 4,555Income taxes, other . . . . . . . . . . . . . . . . . . . . . . . . 2,979 2,825 3,192Other taxes . . . . . . . . . . . . . . . . . . . . . . . . . . . . . . . 1,752 1,640 1,231_______ _______ _______Taxes (net of refunds) . . . . . . . . . . . . . . . . . . . . . . 22,663 21,847 21,696_______ _______ _______
Federal, State and Other aid:Categorical . . . . . . . . . . . . . . . . . . . . . . . . . . . . . . . 12,760 15,287 14,646Unrestricted . . . . . . . . . . . . . . . . . . . . . . . . . . . . . . 707 695 666_______ _______ _______Federal, State and Other aid . . . . . . . . . . . . . . . . . 13,467 15,982 15,312_______ _______ _______
Other Than Taxes and Aid:Charges for services . . . . . . . . . . . . . . . . . . . . . . . 1,389 1,386 1,458Other revenues . . . . . . . . . . . . . . . . . . . . . . . . . . . . 1,829 2,149 1,920OTB Transfers . . . . . . . . . . . . . . . . . . . . . . . . . . . . 33 25 22TFA Transfers . . . . . . . . . . . . . . . . . . . . . . . . . . . . — 366 457_______ _______ _______Other Than Taxes and Aid . . . . . . . . . . . . . . . . . . . 3,251 3,926 3,857_______ _______ _______
Total Revenues . . . . . . . . . . . . . . . . . . . . . . . . . . $39,381 $41,755 $40,865_______ _______ ______________ _______ _______
Adopted BudgetModified BudgetActual
Gen
eral
Fun
d R
even
ues
(in
mill
ions
)
General Fund RevenuesFiscal Year 2002
Revenue Category
Real estatetaxes
Personalincome tax
Incometaxes, other
Federal, Stateand Other aid
Other ThanTaxes and Aid
Sales, Use andOther taxes
$0
$2,000
$4,000
$6,000
$8,000
$10,000
$12,000
$14,000
$16,000
$18,000
General Fund Revenues
15

General Fund Revenues
Fiscal Year 2001(in millions)
Adopted ModifiedBudget Budget Actual_______ _______ _______
Taxes (net of refunds):Real estate taxes . . . . . . . . . . . . . . . . . . . . . . . . . . $ 8,111 $ 8,277 $ 8,246Sales and use taxes . . . . . . . . . . . . . . . . . . . . . . . . 3,946 4,265 4,196Personal income tax . . . . . . . . . . . . . . . . . . . . . . . 5,240 5,670 5,757Income taxes, other . . . . . . . . . . . . . . . . . . . . . . . . 3,342 3,672 3,685Other taxes . . . . . . . . . . . . . . . . . . . . . . . . . . . . . . . 1,176 1,238 1,294_______ _______ _______Taxes (net of refunds) . . . . . . . . . . . . . . . . . . . . . . 21,815 23,122 23,178_______ _______ _______
Federal, State and Other aid:Categorical . . . . . . . . . . . . . . . . . . . . . . . . . . . . . . . 12,193 13,264 12,764Unrestricted . . . . . . . . . . . . . . . . . . . . . . . . . . . . . . 564 593 634_______ _______ _______Federal, State and Other aid . . . . . . . . . . . . . . . . . 12,757 13,857 13,398_______ _______ _______
Other Than Taxes and Aid:Charges for services . . . . . . . . . . . . . . . . . . . . . . . 1,375 1,434 1,461Other revenues . . . . . . . . . . . . . . . . . . . . . . . . . . . . 1,343 2,390 2,162OTB Transfers . . . . . . . . . . . . . . . . . . . . . . . . . . . . 34 34 33_______ _______ _______Other Than Taxes and Aid . . . . . . . . . . . . . . . . . . . 2,752 3,858 3,656_______ _______ _______
Total Revenues . . . . . . . . . . . . . . . . . . . . . . . . . . $37,324 $40,837 $40,232_______ _______ ______________ _______ _______
Adopted BudgetModified Budget Actual
Gen
eral
Fun
d R
even
ues
(in
mill
ions
)
General Fund Revenues Fiscal Year 2001
Revenue Category
Real estatetaxes
Personal incometax
Income taxes,other
Federal, Stateand Other aid
Other ThanTaxes and Aid
Sales, Use andOther taxes
$0
$2,000
$4,000
$6,000
$8,000
$10,000
$12,000
$14,000
16

The following charts and tables summarize actual expenditures by function/program forfiscal years 2002 and 2001 and compare expenditures with each fiscal year’s Adopted Budgetand Modified Budget.
General Fund Expenditures
Fiscal Year 2002(in millions)
Adopted ModifiedBudget Budget Actual_______ _______ _______
General Government . . . . . . . . . . . . . . . . . . . . . . . . . $ 1,222 $ 1,964 $ 1,810Public Safety and Judicial . . . . . . . . . . . . . . . . . . . . . 5,885 6,558 6,462Education . . . . . . . . . . . . . . . . . . . . . . . . . . . . . . . . . 11,522 11,862 11,715City University . . . . . . . . . . . . . . . . . . . . . . . . . . . . . 445 457 418Social Services . . . . . . . . . . . . . . . . . . . . . . . . . . . . . 8,927 9,275 9,098Environmental Protection . . . . . . . . . . . . . . . . . . . . . 1,637 1,649 1,602Transportation Services . . . . . . . . . . . . . . . . . . . . . . . 605 692 679Parks, Recreation, and Cultural Activities . . . . . . . . 315 308 305Housing . . . . . . . . . . . . . . . . . . . . . . . . . . . . . . . . . . . 454 464 440Health (including HHC) . . . . . . . . . . . . . . . . . . . . . . 2,033 2,208 2,131Libraries . . . . . . . . . . . . . . . . . . . . . . . . . . . . . . . . . . 131 124 124Pensions . . . . . . . . . . . . . . . . . . . . . . . . . . . . . . . . . . 1,364 1,398 1,392Judgments and Claims . . . . . . . . . . . . . . . . . . . . . . . 310 390 522Fringe Benefits and Other Benefit Payments . . . . . . 2,289 2,428 2,426Other . . . . . . . . . . . . . . . . . . . . . . . . . . . . . . . . . . . . . 1,027 565 374Transfers and Other Payments for Debt Service . . . . 1,215 1,413 1,362_______ _______ _______
Total Expenditures . . . . . . . . . . . . . . . . . . . . . . . $39,381 $41,755 $40,860_______ _______ ______________ _______ _______
Adopted BudgetModified BudgetActual
Gen
eral
Fun
d E
xpen
ditu
res
(in
mill
ions
)
General Fund ExpendituresFiscal Year 2002
$0
$2,000
$4,000
$6,000
$8,000
$10,000
$12,000
$14,000
SocialServices
Education PublicSafety
Pensions DebtServices
Health Other
Function / Program
General Fund Expenditures
17

General Fund Expenditures
Fiscal Year 2001(in millions)
Adopted ModifiedBudget Budget Actual_______ _______ _______
General Government . . . . . . . . . . . . . . . . . . . . . . . . . $ 1,054 $ 1,109 $ 1,078Public Safety and Judicial . . . . . . . . . . . . . . . . . . . . . 5,659 5,915 5,875Education . . . . . . . . . . . . . . . . . . . . . . . . . . . . . . . . . 10,973 11,594 11,545City University . . . . . . . . . . . . . . . . . . . . . . . . . . . . . 426 428 393Social Services . . . . . . . . . . . . . . . . . . . . . . . . . . . . . 8,459 8,829 8,717Environmental Protection . . . . . . . . . . . . . . . . . . . . . 1,599 1,552 1,528Transportation Services . . . . . . . . . . . . . . . . . . . . . . . 617 791 750Parks, Recreation, and Cultural Activities . . . . . . . . 287 318 317Housing . . . . . . . . . . . . . . . . . . . . . . . . . . . . . . . . . . . 461 517 478Health (including HHC) . . . . . . . . . . . . . . . . . . . . . . 1,843 2,039 1,959Libraries . . . . . . . . . . . . . . . . . . . . . . . . . . . . . . . . . . 242 383 383Pensions . . . . . . . . . . . . . . . . . . . . . . . . . . . . . . . . . . 1,132 1,209 1,127Judgments and Claims . . . . . . . . . . . . . . . . . . . . . . . 442 498 595Fringe Benefits and Other Benefit Payments . . . . . . 2,161 2,172 2,200Other . . . . . . . . . . . . . . . . . . . . . . . . . . . . . . . . . . . . . 715 510 315Transfers and Other Payments for Debt Service . . . . 1,254 2,973 2,967_______ _______ _______
Total Expenditures . . . . . . . . . . . . . . . . . . . . . . . $37,324 $40,837 $40,227_______ _______ ______________ _______ _______
Adopted BudgetModified Budget Actual
Gen
eral
Fun
d E
xpen
ditu
res
(in
mill
ions
)
General Fund Expenditures Fiscal Year 2001
Public Safety
Education Social Services
HealthPensions DebtServices
Other$0
$2,000
$4,000
$6,000
$8,000
$10,000
$12,000
$14,000
Function / Program
18

The City had General Fund operating surpluses of $686 million, $2.949 billion and $3.192billion before certain expenditures and transfers (discretionary and other) for fiscal years 2002,2001 and 2000, respectively. For the fiscal years 2002, 2001 and 2000, the General Fund surpluswas $5 million after expenditures and discretionary transfers.
The expenditures and transfers (discretionary and other) made by the City after theadoption of its fiscal years 2002, 2001 and 2000 budgets follow:
2002 2001 2000_______ _______ _______(in millions)
Transfer, as required by law, to the General Debt Service Fund of real estate taxes collected in excess of the amount needed to finance debt service . . . . . . . . . . . . . . . . . . . . . . . . . . . . . . $ 509 $ 917 $ 414
Discretionary transfers to the General Debt Service Fund . . . . . . . . . . . . . . . . . . . . . . . . . . . . . 154 1,180 2,095
Net equity contribution in bond refunding thataccrued to future years debt service savings . . . . . 4 46 17
Debt service prepayments for lease purchase debt service due in the fiscal year . . . . . . . . . . . . . — 56 73
Prepayment of debt service for the Municipal Assistance Corporation . . . . . . . . . . . . . . . . . . . . . — 458 451
Advance cash subsidies to the Public Library system . . — 131 —Advance cash subsidies to the Transit Authority . . . 14 151 137Advance cash subsidies to the Housing Authority . . — 5 —_______ _______ _______
Total expenditures and transfers (discretionary and other) . . . . . . . . . . . . . . . . 681 2,944 3,187
Reported Operating Surplus . . . . . . . . . . . . . . . . . . . 5 5 5_______ _______ _______Total Operating Surplus . . . . . . . . . . . . . . . . . . . $ 686 $ 2,949 $ 3,192_______ _______ ______________ _______ _______
General Fund Surplus
19

Final results for any given fiscal year may differ greatly from that year’s Adopted Budget.The following tables show the variance between actuals and fiscal year 2002 AdoptedBudget:
2002_______Additional Resources: (in millions)
Federal categorical aid (including FEMA reimbursement) . . . . . . . . . . . . . . . . $ 1,654State categorical aid . . . . . . . . . . . . . . . . . . . . . . . . . . . . . . . . . . . . . . . . . . . . . . 89Lower than expected debt service and interest on Short-term Notes . . . . . . . . . 193Other miscellaneous revenues . . . . . . . . . . . . . . . . . . . . . . . . . . . . . . . . . . . . . . 465Non-grant revenue . . . . . . . . . . . . . . . . . . . . . . . . . . . . . . . . . . . . . . . . . . . . . . . 223Collections for general government services . . . . . . . . . . . . . . . . . . . . . . . . . . . 46Licenses, permits and privileges . . . . . . . . . . . . . . . . . . . . . . . . . . . . . . . . . . . . 36Rental income—other . . . . . . . . . . . . . . . . . . . . . . . . . . . . . . . . . . . . . . . . . . . . 9Net savings from administrative costs for supplies, equipment
and other than personnel services (including WTC costs) . . . . . . . . . . . . . . . 174Lower than expected costs for heat, light, power and fuel . . . . . . . . . . . . . . . . 114Public assistance . . . . . . . . . . . . . . . . . . . . . . . . . . . . . . . . . . . . . . . . . . . . . . . . 70Social Services, excluding public assistance and Medicaid . . . . . . . . . . . . . . . 66Decreased funding to the Health and Hospitals Corporation . . . . . . . . . . . . . . 62Fines and Forfeitures . . . . . . . . . . . . . . . . . . . . . . . . . . . . . . . . . . . . . . . . . . . . . 6Lower than expected provision for Disallowance Reserve of Federal
and State Aid . . . . . . . . . . . . . . . . . . . . . . . . . . . . . . . . . . . . . . . . . . . . . . . . . 15General Reserve . . . . . . . . . . . . . . . . . . . . . . . . . . . . . . . . . . . . . . . . . . . . . . . . . 200_______
Total . . . . . . . . . . . . . . . . . . . . . . . . . . . . . . . . . . . . . . . . . . . . . . . . . . . . . . . . 3,422_______
Enabled the City to provide for:Lower than expected net tax revenue collections excluding tax lien sales and
stock transfer tax . . . . . . . . . . . . . . . . . . . . . . . . . . . . . . . . . . . . . . . . . . . . . . 721Lower than expected Off-Track Betting Surtax and other revenues . . . . . . . . . 11Lower than expected net State and other revenue sharing . . . . . . . . . . . . . . . . . 41Higher than anticipated judgment and claims . . . . . . . . . . . . . . . . . . . . . . . . . . 148Future General Obligation debt-service costs net of appropriations
in the FY 2003 Adopted Budget . . . . . . . . . . . . . . . . . . . . . . . . . . . . . . . . . . 318Equity contributions in conjunction with bond refundings . . . . . . . . . . . . . . . . 4Lower than expected tax liens sales . . . . . . . . . . . . . . . . . . . . . . . . . . . . . . . . . . 32Lower than expected FICA refunds . . . . . . . . . . . . . . . . . . . . . . . . . . . . . . . . . . 8Lower than expected sale of City-owned assets . . . . . . . . . . . . . . . . . . . . . . . . 73Lower than expected interest income . . . . . . . . . . . . . . . . . . . . . . . . . . . . . . . . 74Lower than expected income from JFK and LaGuardia Airports . . . . . . . . . . . 5Higher than anticipated overtime costs (including WTC-related overtime) . . . 616Increased pension costs . . . . . . . . . . . . . . . . . . . . . . . . . . . . . . . . . . . . . . . . . . . 38Higher than anticipated personal-service costs excluding pensions and overtime 163Higher than anticipated Medicaid costs . . . . . . . . . . . . . . . . . . . . . . . . . . . . . . . 315Increased contractual services costs . . . . . . . . . . . . . . . . . . . . . . . . . . . . . . . . . 588Prepayment of certain fiscal year 2003 subsidy payments to the
Transit Authority . . . . . . . . . . . . . . . . . . . . . . . . . . . . . . . . . . . . . . . . . . . . . . 14Loss of State appropriations for the stock transfer tax . . . . . . . . . . . . . . . . . . . 114Withstand all other net overspending and revenues below budget . . . . . . . . . . 134_______
Total . . . . . . . . . . . . . . . . . . . . . . . . . . . . . . . . . . . . . . . . . . . . . . . . . . . . . . . . 3,417_______Reported Surplus . . . . . . . . . . . . . . . . . . . . . . . . . . . . . . . . . . . . . . . . . . . . . . . . . . $ 5______________
Fiscal Year 2002
20

The following table shows the variance between actuals and fiscal year 2001 AdoptedBudget:
2001_______(in millions)
Additional Resources:Federal categorical aid . . . . . . . . . . . . . . . . . . . . . . . . . . . . . . . . . . . . . . . . . . . . $ 228State categorical aid . . . . . . . . . . . . . . . . . . . . . . . . . . . . . . . . . . . . . . . . . . . . . . 236Net State and other revenue sharing . . . . . . . . . . . . . . . . . . . . . . . . . . . . . . . . . 71Net tax-revenue collections excluding tax lien sales
and stock transfer tax . . . . . . . . . . . . . . . . . . . . . . . . . . . . . . . . . . . . . . . . . . . 1,785Sale of tax liens . . . . . . . . . . . . . . . . . . . . . . . . . . . . . . . . . . . . . . . . . . . . . . . . . 106Interest income . . . . . . . . . . . . . . . . . . . . . . . . . . . . . . . . . . . . . . . . . . . . . . . . . . 78Tobacco settlement revenue from lower TSASC debt service . . . . . . . . . . . . . . 15Surplus from the City’s Health Insurance Stabilization Fund . . . . . . . . . . . . . . 120FICA refunds . . . . . . . . . . . . . . . . . . . . . . . . . . . . . . . . . . . . . . . . . . . . . . . . . . . 51Sale of City-owned assets . . . . . . . . . . . . . . . . . . . . . . . . . . . . . . . . . . . . . . . . . 68Other miscellaneous revenues . . . . . . . . . . . . . . . . . . . . . . . . . . . . . . . . . . . . . . 61Non-grant revenue . . . . . . . . . . . . . . . . . . . . . . . . . . . . . . . . . . . . . . . . . . . . . . . 138Collections for general government services . . . . . . . . . . . . . . . . . . . . . . . . . . . 23Collections from charges for housing . . . . . . . . . . . . . . . . . . . . . . . . . . . . . . . . 25Licenses, permits and privileges . . . . . . . . . . . . . . . . . . . . . . . . . . . . . . . . . . . . 43Rental income for JFK and LaGuardia Airports . . . . . . . . . . . . . . . . . . . . . . . . 10Rental income—other . . . . . . . . . . . . . . . . . . . . . . . . . . . . . . . . . . . . . . . . . . . . 28Net savings from administrative costs for supplies,
equipment and other than personal services . . . . . . . . . . . . . . . . . . . . . . . . . . 656Savings from fixed and miscellaneous charges . . . . . . . . . . . . . . . . . . . . . . . . . 99Public assistance . . . . . . . . . . . . . . . . . . . . . . . . . . . . . . . . . . . . . . . . . . . . . . . . 47Debt Service and interest on Short-term Notes . . . . . . . . . . . . . . . . . . . . . . . . . 45Social Services, excluding public assistance and medicaid . . . . . . . . . . . . . . . . 9Fines and Forfeitures . . . . . . . . . . . . . . . . . . . . . . . . . . . . . . . . . . . . . . . . . . . . . 4General Reserve . . . . . . . . . . . . . . . . . . . . . . . . . . . . . . . . . . . . . . . . . . . . . . . . . 200_______
Total . . . . . . . . . . . . . . . . . . . . . . . . . . . . . . . . . . . . . . . . . . . . . . . . . . . . . . . . 4,146_______
Enabled the City to provide for:Future General Obligation debt-service costs
net of appropriations in the FY 2002 Adopted Budget . . . . . . . . . . . . . . . . . 1,192Equity contributions in conjunction with bond refundings . . . . . . . . . . . . . . . . 46Lease purchase debt service due in FY 2002 . . . . . . . . . . . . . . . . . . . . . . . . . . . 56Future debt-service costs for the Municipal Assistance Corporation . . . . . . . . 458Funding of the library system for future years . . . . . . . . . . . . . . . . . . . . . . . . . 131Higher than anticipated overtime costs . . . . . . . . . . . . . . . . . . . . . . . . . . . . . . . 260Higher than anticipated judgment and claims costs . . . . . . . . . . . . . . . . . . . . . 151Increased pension costs . . . . . . . . . . . . . . . . . . . . . . . . . . . . . . . . . . . . . . . . . . . 1Increased personal-services costs, excluding pensions and overtime . . . . . . . . 681Increased contractual-services costs . . . . . . . . . . . . . . . . . . . . . . . . . . . . . . . . . 293Prepayment of certain fiscal year 2002 subsidy payments
to the Transit Authority . . . . . . . . . . . . . . . . . . . . . . . . . . . . . . . . . . . . . . . . . 153Prepayment of certain fiscal year 2002 subsidy payments
to the Housing Authority . . . . . . . . . . . . . . . . . . . . . . . . . . . . . . . . . . . . . . . . 5Increased Disallowance Reserve of Federal and State Aid . . . . . . . . . . . . . . . . 31Increased costs for heat, light, power and fuel . . . . . . . . . . . . . . . . . . . . . . . . . 48Increased funding to the Health and Hospitals Corporation . . . . . . . . . . . . . . . 111Loss of State appropriations for the stock transfer tax . . . . . . . . . . . . . . . . . . . 114Withstand increased Medical-Assistance costs . . . . . . . . . . . . . . . . . . . . . . . . . 259Withstand all other net overspending and revenues below budget . . . . . . . . . . 151_______
Total . . . . . . . . . . . . . . . . . . . . . . . . . . . . . . . . . . . . . . . . . . . . . . . . . . . . . . . . 4,141_______Reported Surplus . . . . . . . . . . . . . . . . . . . . . . . . . . . . . . . . . . . . . . . . . . . . . . . . . . $ 5______________
Fiscal Year 2001
21

The City’s investment in capital assets includes land, buildings, equipment, highways,bridges, traffic signals, street reconstruction, and parks, which are detailed as follows (net ofaccumulated depreciation):
Governmental Activities_______________________________________June 30,
2002 2001 2000_______ _______ _______(in millions)
Land . . . . . . . . . . . . . . . . . . . . . . . . . . . . . . . . . . . . $ 737 $ 734 $ 707Buildings . . . . . . . . . . . . . . . . . . . . . . . . . . . . . . . . . 11,253 9,710 7,890Equipment . . . . . . . . . . . . . . . . . . . . . . . . . . . . . . . . 1,522 1,599 1,646Infrastructure . . . . . . . . . . . . . . . . . . . . . . . . . . . . . 5,950 5,594 5,311Construction work-in-progress . . . . . . . . . . . . . . . . 7,197 6,860 6,985_______ _______ _______Total . . . . . . . . . . . . . . . . . . . . . . . . . . . . . . . . . . . . $26,659 $24,497 $22,539_______ _______ ______________ _______ _______
The net increase in the City’s capital assets during fiscal year 2002 was $2.162 billion,an 8.8% increase. Capital assets additions in fiscal year 2002 were $6.646 billion, an increaseof $681 million from fiscal year 2001. Capital assets additions in the Education program totaling$1.468 billion and total new construction work-in-progress (the majority of which are alsoEducation programs) totaling $2.421 billion accounted for 64.0% of the capital assets additionsin fiscal year 2002.
Additional information on the City’s capital assets can be found in the notes to the financialstatements.
The Comptroller’s Office of Public Finance, in conjunction with the Mayor’s Office ofManagement and Budget, is charged with issuing debt to finance the implementation of theCity’s capital program. During the 2nd quarter of 2002 a new syndicate of underwriters wasselected, through an RFP process, for the City’s General Obligation program (GO), andseveral of its related issuers, including the New York City Transitional Finance Authority (TFA),the New York City Municipal Water Finance Authority, (NYW), and the TSASC, Inc. The teamsselected for each credit demonstrated an exemplary level of expertise and understanding of theCity’s needs. Additionally, there were “special bracket” managers selected for the GO, TFAand NYW programs. This extra tier will give several smaller firms an opportunity to serve assenior manager on some of the City’s major credits.
The economic conditions that existed during fiscal year 2002, and the impact of the eventsof 9/11, have led the City to be more flexible in its approach to refundings while still maintainingprudent fiscal guidelines. The City has also increased its exposure to variable rate debt, and continuesto examine alternative financing techniques designed to lower the City’s overall cost of borrowing.
The following table summarizes the debt outstanding for New York City and City-relatedissuing entities at the end of fiscal year 2002, 2001 and 2000.
New York City andCity-related Debt_______________________________________
2002 2001 2000_______ _______ _______(in millions)
General Obligation bonds . . . . . . . . . . . . . . . . . . . . $28,465 $26,836 $26,892Future tax secured bonds (TFA) . . . . . . . . . . . . . . . 8,289 7,386 5,923TSASC, Inc. . . . . . . . . . . . . . . . . . . . . . . . . . . . . . . 740 703 7091991 general resolution bonds (MAC) . . . . . . . . . . 2,880 3,217 3,531Japanese Yen bonds . . . . . . . . . . . . . . . . . . . . . . . . 40 80 120Revenue bonds . . . . . . . . . . . . . . . . . . . . . . . . . . . . 521 543 571Bond Anticipation Notes (TFA) . . . . . . . . . . . . . . . 1,200 — 515Recovery Notes (TFA) . . . . . . . . . . . . . . . . . . . . . . 1,000 — —_______ _______ _______
Total bonds and notes payable . . . . . . . . . . . . . 43,135 38,765 38,261Less treasury obligations . . . . . . . . . . . . . . . . . . . . 116 168 230_______ _______ _______
Net outstanding debt . . . . . . . . . . . . . . . . . . . . $43,019 $38,597 $38,031_______ _______ ______________ _______ _______
Debt Administration
Capital Assets
22
On June 30, 2002, New York City’s outstanding general obligation debt totaled $32.7billion, including capital contract liabilities. The State Constitution provides that the City maynot contract indebtedness in an amount greater than 10% of the average full value of taxable realestate in the City for the most recent five years. As of June 30, 2002, the City’s net general obligationdebt limit was $36.0 billion (compared with $32.9 billion as of June 30, 2001) and remainingGO debt incurring power totaled $3.3 billion, after providing for capital contract liabilities.
During fiscal year 2002, the City issued approximately $3.657 billion of generalobligation bonds of which approximately $1.007 billion were issued to refund certainoutstanding bonds and $2.65 billion were issued for capital purposes. The proceeds of therefunding issues were placed in irrevocable escrow accounts in amounts sufficient to pay whendue all principal, interest, and applicable redemption premium, if any, on the refundedbonds. The refunding will provide the City with approximately $204 million in debt servicesavings in fiscal year 2003.
In fiscal year 2002, Moody’s Investors Service Inc. (Moody’s), Standard & Poor’s (S&P)and Fitch Ratings maintained their ratings at A2, A and A+ respectively. On November 15, 2001,Moody’s issued a negative outlook on New York City General Obligation bonds. The negativeoutlook reflected the disruptive economic effects of the World Trade Center tragedy, thenational economic recession, and projections of revenue losses and spending increases.
The City satisfied all of its seasonal needs in the public credit market with a competitivesale on October 23, 2001 of $1.5 billion of short-term Revenue Anticipation Notes (RANs)that were secured by State aid. The RANs matured on April 12, 2002 and carried the highestratings from Moody’s (MIG-1), Fitch (F-1+), and S&P (SP-1+). These ratings together withfavorable market conditions enabled the City to achieve a true interest cost of borrowing of2.032% on the RANs.
In addition to the City’s General Obligation credit, several related issuers have beenestablished including the TFA and TSASC, Inc. The debt issued by these entities is not subjectto the City’s consititutional debt limit.
In 1997, the New York State Legislature created the TFA, a separate legal entity, in orderto ease the constraints imposed by the City’s debt limit. The TFA was authorized to issue upto $7.5 billion of debt. In fiscal year 2000, this authorization was increased by $4 billion,allowing the TFA a total debt incurring capacity of $11.5 billion. The TFA bond proceeds enablethe City to continue its planned capital improvement program.
During fiscal year 2002, the TFA issued approximately $1.02 billion of bonds forcapital purposes and $1.8 billion of BANs (Bond Anticipation Notes). A portion of theBANs ($600 million) was taken out by the 2002 Series B bonds.
In September 2001, the New York State Legislature approved a special TFA authorizationof $2.5 billion to fund capital and operating costs related to or arising from the events of September11, 2001. The Legislature also authorized the TFA to issue debt without limit, as to principalamount that is payable solely from State or Federal aid received, on account of the disaster. InOctober 2001, the TFA issued $1 billion of TFA New York City recovery notes. These noteswere redeemed in October 2002 with the issuance of $1 billion in TFA Recovery Bonds.
In fiscal year 2002, Moody’s, S&P and Fitch maintained their ratings for TFA’s seniorbonds at Aa2, AA+ and AA+ respectively. The bond anticipation notes and recovery noteswere rated at MIG-1, SP-1+ and F1+ by Moody’s, S&P and Fitch. TFA’s Recovery Bondsand Recovery Notes, though secured by a lien junior to that of the TFA’s senior bonds, receivedidentical ratings to those of senior lien bonds and notes.
TSASC entered into a loan agreement on December 1, 2001 with the U.S. Departmentof Transportation (USDOT) and the City pursuant to the Transportation Infrastructure Financeand Innovation Act. The loan is for $159.2 million secured by tobacco revenues. Under theagreement, TSASC can issue bonds, on parity with outstanding debt, to be purchased by theUSDOT. Pursuant to the loan, TSASC issued approximately $45 million of Senior Bonds during
TSASC
Transitional Finance Authority
Short-term financing
General Obligation
23

fiscal year 2002. The monies were applied by the City towards the Staten Island Ferries and FerryTerminal Projects. TSASC has approximately $114 million in remaining capacity from the loan.
On August 15, 2002, TSASC issued $500 million (Series 2002-1), of which $120million was used to reimburse the City for closure of the Fresh Kills Landfill. The remainderis being used to fund the City’s on-going capital needs.
Subsequent to June 30, 2002, the City GO, TFA and TSASC completed the followingfinancings:
On July 02, 2002, the TFA sold $1.239 billion of bonds for refunding.
On July 11, 2002, the TFA sold $480 million of Recovery bonds to pay operating andcapital costs incurred by the City of New York related to the events of September 11, 2001.
On July 11, 2002, the TFA sold $322.5 million of 1999 conversion bonds to convertvariable rate debt to fixed rate debt.
On August 01, 2002, the City sold $1.005 billion of bonds for refunding purposes.
On August 15, 2002, TSASAC sold $500 million of bonds for capital purposes.
On August 28, 2002, the TFA sold $750 million of bonds for refunding purposes.
On September 10, 2002, the TFA sold $520 million of Recovery bonds to pay operatingand capital costs incurred by the City of New York related to the events of September 11, 2001.
On October 1, 2002, the TFA sold $1.026 billion of Recovery bonds to take out TFA’sfiscal year 2003 Series A recovery notes, which were used to provide funds to pay recovery,operating and capital costs related to September 11, 2001.
On, October 29, 2002, the City sold $1.150 billion of bonds for refunding purposes.
At June 30, 2002, the outstanding commitments relating to projects of the New York CityCapital Projects Fund amounted to approximately $10.4 billion.
To address the need for significant infrastructure and public facility capital investments,the City has prepared a ten-year capital spending program which contemplates expendituresof $48.1 billion over the remaining fiscal years 2003 through 2011. To help meet its capitalspending program, the City, TFA, and TSASC borrowed $4.8 billion in the public credit marketin fiscal year 2002.
On September 11, 2001, two hijacked passenger jetliners flew into the World TradeCenter, resulting in a substantial loss of life, destruction of the World Trade Center and damageto other buildings in the vicinity. Continuing recovery, clean up and repair efforts will result insubstantial expenditures. The Federal government has committed over $21 billion for disasterassistance in New York, including disaster recovery and related activities, increased security andreconstruction of infrastructure and public facilities. This amount includes approximately $15.5billion of appropriations for costs such as cleanup, economic development, job training, transitimprovements, road reconstruction and grants to residents and businesses in lower Manhattan.It also includes approximately $5.5 billion for economic stimulus programs directed primarilyat businesses located in the Liberty Zone, the area surrounding the World Trade Center site. Theseprograms include expanding tax credits, increasing depreciation deductions, authorizing theissuance of tax-exempt private activity bonds and expanding authority to advance refund somebonds issued to finance facilities in the City. In addition, the State authorized the TFA to haveoutstanding $2.5 billion of bonds (“Recovery Bonds”) and notes (“Recovery Notes”) to pay costsrelated to or arising from the September 11 attack (“Recovery Costs”).
The City is also seeking to be reimbursed by the Federal government for all of its directcosts for response and remediation of the World Trade Center site. These costs are now expectedto be substantially below previous estimates. The City also expects to receive Federal fundsfor costs of economic revitalization and other needs, not directly payable through the Citybudget, relating to the September 11 attack.
Economic Factors and theWorld Trade Center Attack
Commitments
24
Prior to September 11, the national and local economies had been weakening, reflectinglower business investment, increased unemployment and, recently, a decline in consumerconfidence. Since September 11, the further decline in jobs, the threat of war, and the lossof stock market values has lessened consumer confidence even more. It is not possible toquantify at present with any certainty the long-term impact of the September 11 attack on theCity and its economy, any offsetting economic benefits which may result from recovery andrebuilding activities and the amount of additional resources from Federal, State, City and othersources which will be required.
This financial report is designed to provide a general overview of the City’s financesfor all those with an interest in its finances. Questions concerning any of the informationprovided in this report or requests for additional financial information should be addressedto The City of New York, Office of the Comptroller, Bureau of Accountancy, 1 Centre Street,Room 800, New York, New York 10007-2341.
Request for Information
25

26
Primary Government___________Governmental Component
Activities Units___________ _________ASSETS:
Cash and cash equivalents . . . . . . . . . . . . . . . . . . . . . . . . . . . . . . . . . . . . . . . . . . . . . . . . $ 1,172,279 $ 1,244,275Investments, including accrued interest . . . . . . . . . . . . . . . . . . . . . . . . . . . . . . . . . . . . . 5,338,583 574,117Receivables:
Real estate taxes (less allowance for uncollectible amounts of $343,412) . . . . . . . . . 582,498 —Federal, State and other aid . . . . . . . . . . . . . . . . . . . . . . . . . . . . . . . . . . . . . . . . . . . . . 5,400,029 —Taxes other than real estate . . . . . . . . . . . . . . . . . . . . . . . . . . . . . . . . . . . . . . . . . . . . . 2,599,687 —Other . . . . . . . . . . . . . . . . . . . . . . . . . . . . . . . . . . . . . . . . . . . . . . . . . . . . . . . . . . . . . . 434,382 1,698,915
Mortgage loans and interest receivable, net . . . . . . . . . . . . . . . . . . . . . . . . . . . . . . . . . . 1,721 2,663,015Inventories . . . . . . . . . . . . . . . . . . . . . . . . . . . . . . . . . . . . . . . . . . . . . . . . . . . . . . . . . . . . 210,072 46,635Due from Primary Government . . . . . . . . . . . . . . . . . . . . . . . . . . . . . . . . . . . . . . . . . . . — 243Due from Component Units . . . . . . . . . . . . . . . . . . . . . . . . . . . . . . . . . . . . . . . . . . . . . . 513,131 —Restricted cash and investments . . . . . . . . . . . . . . . . . . . . . . . . . . . . . . . . . . . . . . . . . . . 1,169,834 3,182,512Deferred Charges—Issuance Costs . . . . . . . . . . . . . . . . . . . . . . . . . . . . . . . . . . . . . . . . . 266,439 —Capital assets:
Land and construction work-in-progress . . . . . . . . . . . . . . . . . . . . . . . . . . . . . . . . . . . 7,933,642 4,245,032Other Capital assets (net of depreciation):
Property, plant and equipment . . . . . . . . . . . . . . . . . . . . . . . . . . . . . . . . . . . . . . . . . 12,775,243 16,252,735Infrastructure . . . . . . . . . . . . . . . . . . . . . . . . . . . . . . . . . . . . . . . . . . . . . . . . . . . . . . 5,950,186 —
Other . . . . . . . . . . . . . . . . . . . . . . . . . . . . . . . . . . . . . . . . . . . . . . . . . . . . . . . . . . . . . . . . 106,026 332,463_____________________ ____________________Total assets . . . . . . . . . . . . . . . . . . . . . . . . . . . . . . . . . . . . . . . . . . . . . . . . . . . . . . 44,453,752 30,239,942_____________________ ____________________
LIABILITIES:Accounts payable and accrued liabilities . . . . . . . . . . . . . . . . . . . . . . . . . . . . . . . . . . . . 9,444,923 1,802,685Accrued interest payable . . . . . . . . . . . . . . . . . . . . . . . . . . . . . . . . . . . . . . . . . . . . . . . . . 626,572 71,601Deferred revenues:
Prepaid real estate taxes . . . . . . . . . . . . . . . . . . . . . . . . . . . . . . . . . . . . . . . . . . . . . . . 1,373,884 —Other . . . . . . . . . . . . . . . . . . . . . . . . . . . . . . . . . . . . . . . . . . . . . . . . . . . . . . . . . . . . . . 1,175,731 144,392
Due to Primary Government . . . . . . . . . . . . . . . . . . . . . . . . . . . . . . . . . . . . . . . . . . . . . . — 513,131Due to Component Units . . . . . . . . . . . . . . . . . . . . . . . . . . . . . . . . . . . . . . . . . . . . . . . . 243 —Estimated disallowance of Federal, State and other aid . . . . . . . . . . . . . . . . . . . . . . . . . 202,560 —Payable for investment securities purchased . . . . . . . . . . . . . . . . . . . . . . . . . . . . . . . . . . 249,391 —Other . . . . . . . . . . . . . . . . . . . . . . . . . . . . . . . . . . . . . . . . . . . . . . . . . . . . . . . . . . . . . . . . — 80,028Noncurrent Liabilities:
Due within one year . . . . . . . . . . . . . . . . . . . . . . . . . . . . . . . . . . . . . . . . . . . . . . . . . . 5,470,811 969,281Due in more than one year . . . . . . . . . . . . . . . . . . . . . . . . . . . . . . . . . . . . . . . . . . . . . 49,609,279 14,792,921_____________________ ____________________
Total liabilities . . . . . . . . . . . . . . . . . . . . . . . . . . . . . . . . . . . . . . . . . . . . . . . . . . . 68,153,394 18,374,039_____________________ ____________________NET ASSETS:
Invested in capital assets, net of related debt . . . . . . . . . . . . . . . . . . . . . . . . . . . . . . . . . (3,968,442) 9,527,069Restricted for:
Capital projects . . . . . . . . . . . . . . . . . . . . . . . . . . . . . . . . . . . . . . . . . . . . . . . . . . . . . . — 62,990Debt service . . . . . . . . . . . . . . . . . . . . . . . . . . . . . . . . . . . . . . . . . . . . . . . . . . . . . . . . . 1,922,910 583,407Operations . . . . . . . . . . . . . . . . . . . . . . . . . . . . . . . . . . . . . . . . . . . . . . . . . . . . . . . . . . — 118,848Loans/Security Deposits . . . . . . . . . . . . . . . . . . . . . . . . . . . . . . . . . . . . . . . . . . . . . . . — 83,773Donor restrictions . . . . . . . . . . . . . . . . . . . . . . . . . . . . . . . . . . . . . . . . . . . . . . . . . . . . — 13,413
Unrestricted (deficit) . . . . . . . . . . . . . . . . . . . . . . . . . . . . . . . . . . . . . . . . . . . . . . . . . . . . (21,654,110) 1,476,403_____________________ ____________________Total net assets (deficit) . . . . . . . . . . . . . . . . . . . . . . . . . . . . . . . . . . . . . . . . . . . . $(23,699,642) $11,865,903_____________________ _________________________________________ ____________________
See accompanying notes to financial statements.
THE CITY OF NEW YORKSTATEMENT OF NET ASSETS
JUNE 30, 2002(in thousands)

27
Primary Government___________Governmental Component
Activities Units___________ _________ASSETS:
Cash and cash equivalents . . . . . . . . . . . . . . . . . . . . . . . . . . . . . . . . . . . . . . . . . . . . . . . . $ 1,012,881 $ 529,192Investments, including accrued interest . . . . . . . . . . . . . . . . . . . . . . . . . . . . . . . . . . . . . 6,573,340 1,464,607Receivables:
Real estate taxes (less allowance for uncollectible amounts of $362,704) . . . . . . . . . 616,473 —Federal, State and other aid . . . . . . . . . . . . . . . . . . . . . . . . . . . . . . . . . . . . . . . . . . . . . 5,293,312 —Taxes other than real estate . . . . . . . . . . . . . . . . . . . . . . . . . . . . . . . . . . . . . . . . . . . . . 2,550,670 —Other . . . . . . . . . . . . . . . . . . . . . . . . . . . . . . . . . . . . . . . . . . . . . . . . . . . . . . . . . . . . . . 507,052 1,491,907
Mortgage loans and interest receivable, net . . . . . . . . . . . . . . . . . . . . . . . . . . . . . . . . . . 33,437 2,739,923Inventories . . . . . . . . . . . . . . . . . . . . . . . . . . . . . . . . . . . . . . . . . . . . . . . . . . . . . . . . . . . . 197,593 45,017Due from Primary Government . . . . . . . . . . . . . . . . . . . . . . . . . . . . . . . . . . . . . . . . . . . — 23,458Due from Component Units . . . . . . . . . . . . . . . . . . . . . . . . . . . . . . . . . . . . . . . . . . . . . . 420,138 —Restricted cash and investments . . . . . . . . . . . . . . . . . . . . . . . . . . . . . . . . . . . . . . . . . . . 251,222 2,403,317Deferred Charges—Issuance Costs . . . . . . . . . . . . . . . . . . . . . . . . . . . . . . . . . . . . . . . . . 246,621 —Capital assets:
Land and construction work-in-progress . . . . . . . . . . . . . . . . . . . . . . . . . . . . . . . . . . . 7,594,474 3,947,804Other Capital assets (net of depreciation):
Property, plant and equipment . . . . . . . . . . . . . . . . . . . . . . . . . . . . . . . . . . . . . . . . . 11,309,118 15,406,089Infrastructure . . . . . . . . . . . . . . . . . . . . . . . . . . . . . . . . . . . . . . . . . . . . . . . . . . . . . . 5,593,769 —
Other . . . . . . . . . . . . . . . . . . . . . . . . . . . . . . . . . . . . . . . . . . . . . . . . . . . . . . . . . . . . . . . . 173,420 323,375_____________________ ____________________Total assets . . . . . . . . . . . . . . . . . . . . . . . . . . . . . . . . . . . . . . . . . . . . . . . . . . . . . . 42,373,520 28,374,689_____________________ ____________________
LIABILITIES:Accounts payable and accrued liabilities . . . . . . . . . . . . . . . . . . . . . . . . . . . . . . . . . . . . 8,826,929 1,653,646Accrued interest payable . . . . . . . . . . . . . . . . . . . . . . . . . . . . . . . . . . . . . . . . . . . . . . . . . 612,507 71,942Deferred revenues:
Prepaid real estate taxes . . . . . . . . . . . . . . . . . . . . . . . . . . . . . . . . . . . . . . . . . . . . . . . 1,451,774 —Other . . . . . . . . . . . . . . . . . . . . . . . . . . . . . . . . . . . . . . . . . . . . . . . . . . . . . . . . . . . . . . 850,368 190,931
Due to Primary Government . . . . . . . . . . . . . . . . . . . . . . . . . . . . . . . . . . . . . . . . . . . . . . — 420,138Due to Component Units . . . . . . . . . . . . . . . . . . . . . . . . . . . . . . . . . . . . . . . . . . . . . . . . 23,458 —Estimated disallowance of Federal, State and other aid . . . . . . . . . . . . . . . . . . . . . . . . . 210,268 —Payable for investment securities purchased . . . . . . . . . . . . . . . . . . . . . . . . . . . . . . . . . . 179,862 —Other . . . . . . . . . . . . . . . . . . . . . . . . . . . . . . . . . . . . . . . . . . . . . . . . . . . . . . . . . . . . . . . . — 121,134Noncurrent Liabilities:
Due within one year . . . . . . . . . . . . . . . . . . . . . . . . . . . . . . . . . . . . . . . . . . . . . . . . . . 3,257,834 750,159Due in more than one year . . . . . . . . . . . . . . . . . . . . . . . . . . . . . . . . . . . . . . . . . . . . . 46,807,679 13,307,560_____________________ ____________________
Total liabilities . . . . . . . . . . . . . . . . . . . . . . . . . . . . . . . . . . . . . . . . . . . . . . . . . . . 62,220,679 16,515,510_____________________ ____________________NET ASSETS:
Invested in capital assets, net of related debt (restated) . . . . . . . . . . . . . . . . . . . . . . . . . (2,415,545) 9,514,343Restricted for:
Capital projects . . . . . . . . . . . . . . . . . . . . . . . . . . . . . . . . . . . . . . . . . . . . . . . . . . . . . . — 67,539Debt service . . . . . . . . . . . . . . . . . . . . . . . . . . . . . . . . . . . . . . . . . . . . . . . . . . . . . . . . . 3,814,045 430,479Operations . . . . . . . . . . . . . . . . . . . . . . . . . . . . . . . . . . . . . . . . . . . . . . . . . . . . . . . . . . — 120,084Loans/Security Deposits . . . . . . . . . . . . . . . . . . . . . . . . . . . . . . . . . . . . . . . . . . . . . . . — 92,329Donor restrictions . . . . . . . . . . . . . . . . . . . . . . . . . . . . . . . . . . . . . . . . . . . . . . . . . . . . — 13,293
Unrestricted (deficit) (restated) . . . . . . . . . . . . . . . . . . . . . . . . . . . . . . . . . . . . . . . . . . . . (21,245,659) 1,621,112_____________________ ____________________Total net assets (deficit) . . . . . . . . . . . . . . . . . . . . . . . . . . . . . . . . . . . . . . . . . . . . $(19,847,159) $11,859,179_____________________ _________________________________________ ____________________
See accompanying notes to financial statements.
THE CITY OF NEW YORKSTATEMENT OF NET ASSETS
JUNE 30, 2001(in thousands)

28
Net (Expense) Revenue and Program Revenues Changes in Net Assets_____________________________ _____________________________
Primary Government_____________
Operating Capital GrantsCharges for Grants and and Governmental Component
Functions/Programs Expenses Services Contributions Contributions Activities Units__________________ _________ ___________ _____________ _____________ ___________ ___________
Primary government:General government . . . . . . . . . . . . . . $ 2,070,573 $ 998,465 $ 598,886 $ 73,355 $ (399,867) $ — Public safety and judicial . . . . . . . . . . 9,524,318 159,646 974,285 (5,039) (8,395,426) — Education . . . . . . . . . . . . . . . . . . . . . . 13,249,344 63,159 7,008,306 77,638 (6,100,241) — City University . . . . . . . . . . . . . . . . . . 807,960 140,396 547,385 — (120,179) — Social services . . . . . . . . . . . . . . . . . . 9,567,970 48,605 4,312,055 11,353 (5,195,957) — Environmental protection . . . . . . . . . . 2,205,704 809,536 83,971 3,103 (1,309,094) — Transportation services . . . . . . . . . . . 1,329,314 513,104 153,243 183,320 (479,647) — Parks, recreation and
cultural activities . . . . . . . . . . . . . . . 719,867 61,924 3,736 909 (653,298) — Housing . . . . . . . . . . . . . . . . . . . . . . . 905,461 166,291 270,359 107,334 (361,477) — Health (including
payments to HHC) . . . . . . . . . . . . . 2,816,360 40,204 698,929 41,825 (2,035,402) — Libraries . . . . . . . . . . . . . . . . . . . . . . . 161,250 — — — (161,250) — Debt service interest . . . . . . . . . . . . . . 2,180,711 — — — (2,180,711) — __________ __________ __________ __________ ___________ __________
Total Primarygovernment . . . . . . . . . . . . . . . $45,538,832 $ 3,001,330 $14,651,155 $ 493,798 (27,392,549) — __________ __________ __________ __________ _____________________ __________ __________ __________
Component Units . . . . . . . . . . . . . . . . . $ 9,782,454 $ 6,522,530 $ 1,819,735 $ 878,972 — (561,217)__________ __________ __________ __________ ____________________ __________ __________ __________
General revenues:Taxes (Net of Refunds):
Real estate taxes . . . . . . . . . . . . . . . . . . . . . . . . . . . 8,698,352 — Sales and use taxes . . . . . . . . . . . . . . . . . . . . . . . . . 3,957,386 — Personal income tax . . . . . . . . . . . . . . . . . . . . . . . . 4,920,606 — Income taxes, other . . . . . . . . . . . . . . . . . . . . . . . . 3,126,670 — Other taxes . . . . . . . . . . . . . . . . . . . . . . . . . . . . . . . 1,236,581 —
Investment income . . . . . . . . . . . . . . . . . . . . . . . . . . . . . 190,041 217,115Other Federal and State aid . . . . . . . . . . . . . . . . . . . . . . 975,281 1,898Other . . . . . . . . . . . . . . . . . . . . . . . . . . . . . . . . . . . . . . . 435,149 348,928___________ __________
Total General revenues . . . . . . . . . . . . . . . . . . . . . . 23,540,066 567,941___________ __________Change in net assets . . . . . . . . . . . . . . . . . . . . . . (3,852,483) 6,724
Net Assets — Beginning . . . . . . . . . . . . . . . . . . . . . . . . . . (19,847,159) 11,859,179___________ __________Net Assets — Ending . . . . . . . . . . . . . . . . . . . . . . . . . . . . $(23,699,642) $11,865,903___________ _____________________ __________
See accompanying notes to financial statements.
THE CITY OF NEW YORKSTATEMENT OF ACTIVITIES
FOR THE YEAR ENDED JUNE 30, 2002(in thousands)

29
THE CITY OF NEW YORKSTATEMENT OF ACTIVITIES
FOR THE YEAR ENDED JUNE 30, 2001(in thousands)
Net (Expense) Revenue and Program Revenues Changes in Net Assets_____________________________ _____________________________
Primary Government_____________
Operating Capital GrantsCharges for Grants and and Governmental Component
Functions/Programs Expenses Services Contributions Contributions Activities Units__________________ _________ ___________ _____________ _____________ ___________ ___________
Primary government:General government . . . . . . . . . . . . . . $ 1,881,812 $ 881,322 $ 82,914 $179,487 $ (738,089) $ —Public safety and judicial . . . . . . . . . . 8,661,411 158,925 537,248 16,034 (7,949,204) —Education . . . . . . . . . . . . . . . . . . . . . . 12,248,775 69,594 6,666,089 2,742 (5,510,350) —City University . . . . . . . . . . . . . . . . . . 668,954 135,307 433,781 — (99,866) —Social services . . . . . . . . . . . . . . . . . . 9,166,149 41,909 4,064,614 6,771 (5,052,855) —Environmental protection . . . . . . . . . . 2,350,867 765,781 607 9,669 (1,574,810) —Transportation services . . . . . . . . . . . 1,654,344 569,341 151,269 113,621 (820,113) —Parks, recreation and
cultural activities . . . . . . . . . . . . . . . 488,865 55,385 7,075 5,652 (420,753) —Housing . . . . . . . . . . . . . . . . . . . . . . . 1,000,300 150,153 148,396 203,646 (498,105) —Health (including
payments to HHC) . . . . . . . . . . . . . 2,329,191 40,888 681,022 34,892 (1,572,389) —Libraries . . . . . . . . . . . . . . . . . . . . . . . 362,034 — — — (362,034) —Debt service interest . . . . . . . . . . . . . . 2,214,717 — — — (2,214,717) —___________________ _________________ ___________________ ______________ ____________________ ___________________
Total Primarygovernment . . . . . . . . . . . . . . . $43,027,419 $2,868,605 $12,773,015 $572,514 (26,813,285) —___________________ _________________ ___________________ ______________ ____________________
Component Units . . . . . . . . . . . . . . . . . $ 9,377,130 $6,422,033 $ 1,834,287 $998,227 — (122,583)___________________ _________________ ___________________ ______________ _________________________________ _________________ ___________________ ______________
General revenues:Taxes (Net of Refunds):
Real estate taxes . . . . . . . . . . . . . . . . . . . . . . . . . . . . . 8,273,172 —Sales and use taxes . . . . . . . . . . . . . . . . . . . . . . . . . . . 4,199,594 —Personal income tax . . . . . . . . . . . . . . . . . . . . . . . . . . 6,128,516 —Income taxes, other . . . . . . . . . . . . . . . . . . . . . . . . . . 3,826,312 —Other taxes . . . . . . . . . . . . . . . . . . . . . . . . . . . . . . . . . 1,284,471 —
Investment income . . . . . . . . . . . . . . . . . . . . . . . . . . . . . 391,902 221,339Other Federal and State aid . . . . . . . . . . . . . . . . . . . . . . 928,184 1,800Other . . . . . . . . . . . . . . . . . . . . . . . . . . . . . . . . . . . . . . . 633,579 271,398____________________ ___________________
Total General revenues . . . . . . . . . . . . . . . . . . . . . . 25,665,730 494,537____________________ ___________________Change in net assets . . . . . . . . . . . . . . . . . . . . . . . . (1,147,555) 371,954
Net Assets — Beginning . . . . . . . . . . . . . . . . . . . . . . . . . . (18,699,604) 11,487,225____________________ ___________________Net Assets — Ending . . . . . . . . . . . . . . . . . . . . . . . . . . . . $(19,847,159) $11,859,179____________________ _______________________________________ ___________________
See accompanying notes to financial statements.
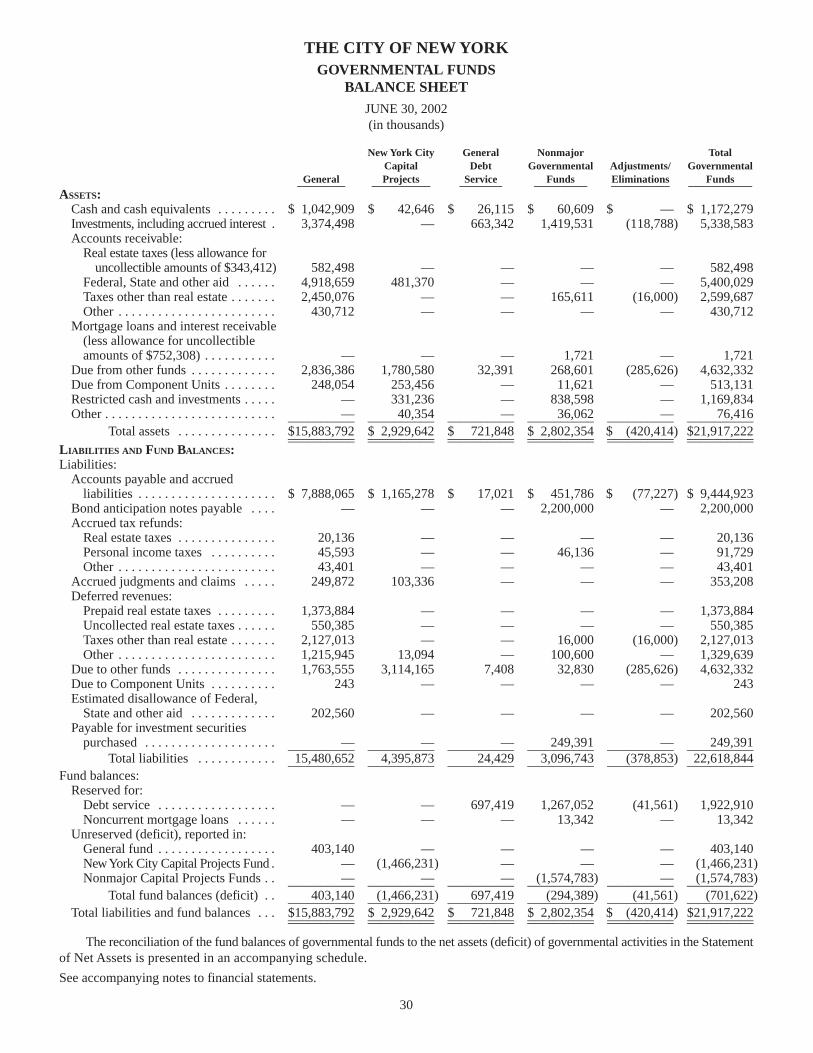
30
THE CITY OF NEW YORKGOVERNMENTAL FUNDS
BALANCE SHEET
JUNE 30, 2002(in thousands)
New York City General Nonmajor TotalCapital Debt Governmental Adjustments/ Governmental
General Projects Service Funds Eliminations Funds_________ ___________ ________ __________ ___________ ____________ASSETS:
Cash and cash equivalents . . . . . . . . . $ 1,042,909 $ 42,646 $ 26,115 $ 60,609 $ — $ 1,172,279Investments, including accrued interest . 3,374,498 — 663,342 1,419,531 (118,788) 5,338,583Accounts receivable:
Real estate taxes (less allowance foruncollectible amounts of $343,412) 582,498 — — — — 582,498
Federal, State and other aid . . . . . . 4,918,659 481,370 — — — 5,400,029Taxes other than real estate . . . . . . . 2,450,076 — — 165,611 (16,000) 2,599,687Other . . . . . . . . . . . . . . . . . . . . . . . . 430,712 — — — — 430,712
Mortgage loans and interest receivable(less allowance for uncollectibleamounts of $752,308) . . . . . . . . . . . — — — 1,721 — 1,721
Due from other funds . . . . . . . . . . . . . 2,836,386 1,780,580 32,391 268,601 (285,626) 4,632,332Due from Component Units . . . . . . . . 248,054 253,456 — 11,621 — 513,131Restricted cash and investments . . . . . — 331,236 — 838,598 — 1,169,834Other . . . . . . . . . . . . . . . . . . . . . . . . . . — 40,354 — 36,062 — 76,416__________ __________ __________ __________ __________ __________
Total assets . . . . . . . . . . . . . . . $15,883,792 $ 2,929,642 $ 721,848 $ 2,802,354 $ (420,414) $21,917,222__________ __________ __________ __________ __________ ____________________ __________ __________ __________ __________ __________LIABILITIES AND FUND BALANCES:Liabilities:
Accounts payable and accrued liabilities . . . . . . . . . . . . . . . . . . . . . $ 7,888,065 $ 1,165,278 $ 17,021 $ 451,786 $ (77,227) $ 9,444,923
Bond anticipation notes payable . . . . — — — 2,200,000 — 2,200,000Accrued tax refunds:
Real estate taxes . . . . . . . . . . . . . . . 20,136 — — — — 20,136Personal income taxes . . . . . . . . . . 45,593 — — 46,136 — 91,729Other . . . . . . . . . . . . . . . . . . . . . . . . 43,401 — — — — 43,401
Accrued judgments and claims . . . . . 249,872 103,336 — — — 353,208Deferred revenues:
Prepaid real estate taxes . . . . . . . . . 1,373,884 — — — — 1,373,884Uncollected real estate taxes . . . . . . 550,385 — — — — 550,385Taxes other than real estate . . . . . . . 2,127,013 — — 16,000 (16,000) 2,127,013Other . . . . . . . . . . . . . . . . . . . . . . . . 1,215,945 13,094 — 100,600 — 1,329,639
Due to other funds . . . . . . . . . . . . . . . 1,763,555 3,114,165 7,408 32,830 (285,626) 4,632,332Due to Component Units . . . . . . . . . . 243 — — — — 243Estimated disallowance of Federal,
State and other aid . . . . . . . . . . . . . 202,560 — — — — 202,560Payable for investment securities
purchased . . . . . . . . . . . . . . . . . . . . — — — 249,391 — 249,391__________ __________ __________ __________ __________ __________Total liabilities . . . . . . . . . . . . 15,480,652 4,395,873 24,429 3,096,743 (378,853) 22,618,844__________ __________ __________ __________ __________ __________
Fund balances:Reserved for:
Debt service . . . . . . . . . . . . . . . . . . — — 697,419 1,267,052 (41,561) 1,922,910Noncurrent mortgage loans . . . . . . — — — 13,342 — 13,342
Unreserved (deficit), reported in:General fund . . . . . . . . . . . . . . . . . . 403,140 — — — — 403,140New York City Capital Projects Fund . — (1,466,231) — — — (1,466,231)Nonmajor Capital Projects Funds . . — — — (1,574,783) — (1,574,783)__________ __________ __________ __________ __________ __________
Total fund balances (deficit) . . 403,140 (1,466,231) 697,419 (294,389) (41,561) (701,622)__________ __________ __________ __________ __________ __________Total liabilities and fund balances . . . $15,883,792 $ 2,929,642 $ 721,848 $ 2,802,354 $ (420,414) $21,917,222__________ __________ __________ __________ __________ ____________________ __________ __________ __________ __________ __________
The reconciliation of the fund balances of governmental funds to the net assets (deficit) of governmental activities in the Statementof Net Assets is presented in an accompanying schedule.
See accompanying notes to financial statements.

New York City General Nonmajor TotalCapital Debt Governmental Adjustments/ Governmental
General Projects Service Funds Eliminations Funds_________ ___________ ________ __________ ___________ ____________ASSETS:
Cash and cash equivalents . . . . . . . . . $ 765,428 $ 27,031 $ 26,970 $ 193,452 $ — $ 1,012,881Investments, including accrued interest 2,739,399 — 2,118,373 1,887,158 (171,590) 6,573,340Accounts receivable:
Real estate taxes (less allowance foruncollectible amounts of $362,704) 616,473 — — — — 616,473
Federal, State and other aid . . . . . . 4,726,781 566,531 — — — 5,293,312Taxes other than real estate . . . . . . . 2,550,670 — — — — 2,550,670Other . . . . . . . . . . . . . . . . . . . . . . . . 505,284 — — — — 505,284
Mortgage loans and interest receivable(less allowance for uncollectibleamounts of $750,148) . . . . . . . . . . . — — — 33,437 — 33,437
Due from other funds . . . . . . . . . . . . . 2,840,419 1,154,105 — 252,073 (266,048) 3,980,549Due from Component Units . . . . . . . . 203,619 205,456 — 11,063 — 420,138Restricted cash and investments . . . . . — 209,080 — 42,142 — 251,222Other . . . . . . . . . . . . . . . . . . . . . . . . . . — 44,596 — 29,824 — 74,420__________ __________ _________ _________ _________ __________
Total assets . . . . . . . . . . . . . . . . . $14,948,073 $ 2,206,799 $2,145,343 $2,449,149 $(437,638) $21,311,726__________ __________ _________ _________ _________ ____________________ __________ _________ _________ _________ __________LIABILITIES AND FUND BALANCES:Liabilities:
Accounts payable and accrued liabilities . . . . . . . . . . . . . . . . . . . . . $ 7,391,448 $ 1,100,636 $ 17,088 $ 404,625 $ (86,868) $ 8,826,929
Accrued tax refunds:Real estate taxes . . . . . . . . . . . . . . . 48,979 — — — — 48,979Personal income taxes . . . . . . . . . . 43,884 — — — — 43,884Other . . . . . . . . . . . . . . . . . . . . . . . . 77,575 — — — — 77,575
Accrued judgments and claims . . . . . 309,007 105,474 — — — 414,481Deferred revenues:
Prepaid real estate taxes . . . . . . . . . 1,451,774 — — — — 1,451,774Uncollected real estate taxes . . . . . . 586,737 — — — — 586,737Taxes other than real estate . . . . . . . 2,246,675 — — — — 2,246,675Other . . . . . . . . . . . . . . . . . . . . . . . . 1,020,258 53,110 — — — 1,073,368
Due to other funds . . . . . . . . . . . . . . . 1,140,130 3,065,246 7,408 33,813 (266,048) 3,980,549Due to Component Units . . . . . . . . . . 23,458 — — — — 23,458Estimated disallowance of Federal,
State and other aid . . . . . . . . . . . . . 210,268 — — — — 210,268Payable for investment securities
purchased . . . . . . . . . . . . . . . . . . . . . . — — — 179,862 — 179,862__________ __________ _________ _________ _________ __________Total liabilities . . . . . . . . . . . . . . 14,550,193 4,324,466 24,496 618,300 (352,916) 19,164,539__________ __________ _________ _________ _________ __________
Fund balances:Reserved for:
Debt service . . . . . . . . . . . . . . . . . . — — 2,120,847 1,777,920 (84,722) 3,814,045Noncurrent mortgage loans . . . . . . — — — 30,996 — 30,996
Unreserved (deficit), reported in:General fund . . . . . . . . . . . . . . . . . . 397,880 — — — — 397,880New York City Capital Projects Fund . — (2,117,667) — — — (2,117,667)Nonmajor Capital Projects Funds . . — — — 21,933 — 21,933__________ __________ _________ _________ _________ __________
Total fund balances . . . . . . . . . 397,880 (2,117,667) 2,120,847 1,830,849 (84,722) 2,147,187__________ __________ _________ _________ _________ __________Total liabilities and fund balances . . . $14,948,073 $ 2,206,799 $2,145,343 $2,449,149 $(437,638) $21,311,726__________ __________ _________ _________ _________ ____________________ __________ _________ _________ _________ __________
The reconciliation of the fund balances of governmental funds to the net assets of governmental activities in the Statementof Net Assets is presented in an accompanying schedule.
See accompanying notes to financial statements.
31
THE CITY OF NEW YORKGOVERNMENTAL FUNDS
BALANCE SHEET
JUNE 30, 2001(in thousands)

Amounts reported for governmental activities in the Statement of Net Assets are different because:
Total fund balances—governmental funds . . . . . . . . . . . . . . . . . . . . . . . . . . . . . . . . . . . . . . . . . . . . . . . . . . . . . . $ (701,622)
Inventories recorded in the Statement of Net assets arerecorded as expenditures in the governmental funds . . . . . . . . . . . . . . . . . . . . . . . . . . . . . . . . . . . . . . . . . . . . 210,072
Capital assets used in governmental activities are not financialresources and therefore are not reported in the funds . . . . . . . . . . . . . . . . . . . . . . . . . . . . . . . . . . . . . . . . . . . . 26,659,071
Other long-term assets are not available to pay for current-periodexpenditures and, therefore, are deferred in the funds . . . . . . . . . . . . . . . . . . . . . . . . . . . . . . . . . . . . . . . . . . . 3,131,025
Long-term liabilities are not due and payable in the current periodand accordingly are not reported in the funds:Bonds and notes payable . . . . . . . . . . . . . . . . . . . . . . . . . . . . . . . . . . . . . . . . . . . . . . . . . . . . . . . . . . . . . . . . . (40,471,671)Accrued interest payable . . . . . . . . . . . . . . . . . . . . . . . . . . . . . . . . . . . . . . . . . . . . . . . . . . . . . . . . . . . . . . . . . (626,572)Other Long-term liabilities . . . . . . . . . . . . . . . . . . . . . . . . . . . . . . . . . . . . . . . . . . . . . . . . . . . . . . . . . . . . . . . . (11,899,945)___________
Net assets (deficit) of governmental activities . . . . . . . . . . . . . . . . . . . . . . . . . . . . . . . . . . . . . . . . . . . . . . . . . . . $(23,699,642)______________________
See accompanying notes to financial statements.
32
THE CITY OF NEW YORKRECONCILIATION OF THE BALANCE SHEET OF GOVERNMENTAL
FUNDS TO THE STATEMENT OF NET ASSETS
JUNE 30, 2002(in thousands)

Amounts reported for governmental activities in the Statement of Net Assets are different because:
Total fund balances—governmental funds . . . . . . . . . . . . . . . . . . . . . . . . . . . . . . . . . . . . . . . . . . . . . . . . . . . . . . $ 2,147,187
Inventories recorded in the Statement of Net assets arerecorded as expenditures in the governmental funds . . . . . . . . . . . . . . . . . . . . . . . . . . . . . . . . . . . . . . . . . . . . 197,593
Capital assets used in governmental activities are not financialresources and therefore are not reported in the funds . . . . . . . . . . . . . . . . . . . . . . . . . . . . . . . . . . . . . . . . . . . . 24,497,361
Other long-term assets are not available to pay for current-periodexpenditures and, therefore, are deferred in the funds . . . . . . . . . . . . . . . . . . . . . . . . . . . . . . . . . . . . . . . . . . . 3,403,801
Long-term liabilities are not due and payable in the current periodand accordingly are not reported in the funds:Bonds and notes payable . . . . . . . . . . . . . . . . . . . . . . . . . . . . . . . . . . . . . . . . . . . . . . . . . . . . . . . . . . . . . . . . . (38,429,756)Accrued interest payable . . . . . . . . . . . . . . . . . . . . . . . . . . . . . . . . . . . . . . . . . . . . . . . . . . . . . . . . . . . . . . . . . (612,507)Other Long-term liabilities . . . . . . . . . . . . . . . . . . . . . . . . . . . . . . . . . . . . . . . . . . . . . . . . . . . . . . . . . . . . . . . . (11,050,838)___________
Net assets (deficit) of governmental activities . . . . . . . . . . . . . . . . . . . . . . . . . . . . . . . . . . . . . . . . . . . . . . . . . . . $(19,847,159)______________________
See accompanying notes to financial statements.
33
THE CITY OF NEW YORKRECONCILIATION OF THE BALANCE SHEET OF GOVERNMENTAL
FUNDS TO THE STATEMENT OF NET ASSETS
JUNE 30, 2001(in thousands)
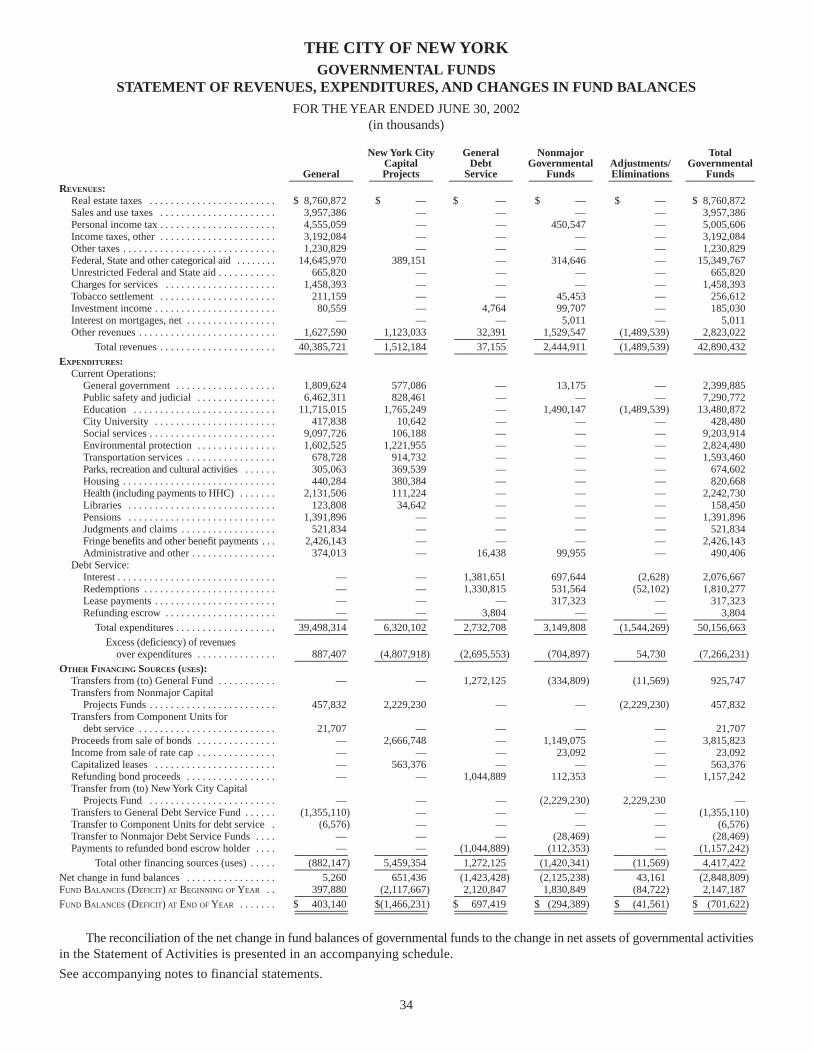
34
THE CITY OF NEW YORKGOVERNMENTAL FUNDS
STATEMENT OF REVENUES, EXPENDITURES, AND CHANGES IN FUND BALANCES
FOR THE YEAR ENDED JUNE 30, 2002(in thousands)
New York City General Nonmajor TotalCapital Debt Governmental Adjustments/ Governmental
General Projects Service Funds Eliminations Funds____________ ____________ ____________ ____________ ____________ _____________REVENUES:
Real estate taxes . . . . . . . . . . . . . . . . . . . . . . . . $ 8,760,872 $ — $ — $ — $ — $ 8,760,872Sales and use taxes . . . . . . . . . . . . . . . . . . . . . . 3,957,386 — — — — 3,957,386Personal income tax . . . . . . . . . . . . . . . . . . . . . . 4,555,059 — — 450,547 — 5,005,606Income taxes, other . . . . . . . . . . . . . . . . . . . . . . 3,192,084 — — — — 3,192,084Other taxes . . . . . . . . . . . . . . . . . . . . . . . . . . . . . 1,230,829 — — — — 1,230,829Federal, State and other categorical aid . . . . . . . . 14,645,970 389,151 — 314,646 — 15,349,767Unrestricted Federal and State aid . . . . . . . . . . . 665,820 — — — — 665,820Charges for services . . . . . . . . . . . . . . . . . . . . . 1,458,393 — — — — 1,458,393Tobacco settlement . . . . . . . . . . . . . . . . . . . . . . 211,159 — — 45,453 — 256,612Investment income . . . . . . . . . . . . . . . . . . . . . . . 80,559 — 4,764 99,707 — 185,030Interest on mortgages, net . . . . . . . . . . . . . . . . . — — — 5,011 — 5,011Other revenues . . . . . . . . . . . . . . . . . . . . . . . . . . 1,627,590 1,123,033 32,391 1,529,547 (1,489,539) 2,823,022__________ __________ __________ __________ __________ __________
Total revenues . . . . . . . . . . . . . . . . . . . . . . 40,385,721 1,512,184 37,155 2,444,911 (1,489,539) 42,890,432__________ __________ __________ __________ __________ __________EXPENDITURES:
Current Operations:General government . . . . . . . . . . . . . . . . . . . 1,809,624 577,086 — 13,175 — 2,399,885Public safety and judicial . . . . . . . . . . . . . . . 6,462,311 828,461 — — — 7,290,772Education . . . . . . . . . . . . . . . . . . . . . . . . . . . 11,715,015 1,765,249 — 1,490,147 (1,489,539) 13,480,872City University . . . . . . . . . . . . . . . . . . . . . . . 417,838 10,642 — — — 428,480Social services . . . . . . . . . . . . . . . . . . . . . . . . 9,097,726 106,188 — — — 9,203,914Environmental protection . . . . . . . . . . . . . . . 1,602,525 1,221,955 — — — 2,824,480Transportation services . . . . . . . . . . . . . . . . . 678,728 914,732 — — — 1,593,460Parks, recreation and cultural activities . . . . . . 305,063 369,539 — — — 674,602Housing . . . . . . . . . . . . . . . . . . . . . . . . . . . . . 440,284 380,384 — — — 820,668Health (including payments to HHC) . . . . . . . 2,131,506 111,224 — — — 2,242,730Libraries . . . . . . . . . . . . . . . . . . . . . . . . . . . . 123,808 34,642 — — — 158,450Pensions . . . . . . . . . . . . . . . . . . . . . . . . . . . . 1,391,896 — — — — 1,391,896Judgments and claims . . . . . . . . . . . . . . . . . . 521,834 — — — — 521,834Fringe benefits and other benefit payments . . . 2,426,143 — — — — 2,426,143Administrative and other . . . . . . . . . . . . . . . . 374,013 — 16,438 99,955 — 490,406
Debt Service:Interest . . . . . . . . . . . . . . . . . . . . . . . . . . . . . . — — 1,381,651 697,644 (2,628) 2,076,667Redemptions . . . . . . . . . . . . . . . . . . . . . . . . . — — 1,330,815 531,564 (52,102) 1,810,277Lease payments . . . . . . . . . . . . . . . . . . . . . . . — — — 317,323 — 317,323Refunding escrow . . . . . . . . . . . . . . . . . . . . . — — 3,804 — — 3,804__________ __________ __________ __________ __________ __________
Total expenditures . . . . . . . . . . . . . . . . . . . 39,498,314 6,320,102 2,732,708 3,149,808 (1,544,269) 50,156,663__________ __________ __________ __________ __________ __________Excess (deficiency) of revenues
over expenditures . . . . . . . . . . . . . . . 887,407 (4,807,918) (2,695,553) (704,897) 54,730 (7,266,231)__________ __________ __________ __________ __________ __________OTHER FINANCING SOURCES (USES):
Transfers from (to) General Fund . . . . . . . . . . . — — 1,272,125 (334,809) (11,569) 925,747Transfers from Nonmajor Capital
Projects Funds . . . . . . . . . . . . . . . . . . . . . . . . 457,832 2,229,230 — — (2,229,230) 457,832Transfers from Component Units for
debt service . . . . . . . . . . . . . . . . . . . . . . . . . . 21,707 — — — — 21,707Proceeds from sale of bonds . . . . . . . . . . . . . . . — 2,666,748 — 1,149,075 — 3,815,823Income from sale of rate cap . . . . . . . . . . . . . . . — — — 23,092 — 23,092Capitalized leases . . . . . . . . . . . . . . . . . . . . . . . — 563,376 — — — 563,376Refunding bond proceeds . . . . . . . . . . . . . . . . . — — 1,044,889 112,353 — 1,157,242Transfer from (to) New York City Capital
Projects Fund . . . . . . . . . . . . . . . . . . . . . . . . — — — (2,229,230) 2,229,230 —Transfers to General Debt Service Fund . . . . . . (1,355,110) — — — — (1,355,110)Transfer to Component Units for debt service . (6,576) — — — — (6,576)Transfer to Nonmajor Debt Service Funds . . . . — — — (28,469) — (28,469)Payments to refunded bond escrow holder . . . . — — (1,044,889) (112,353) — (1,157,242)__________ __________ __________ __________ __________ __________
Total other financing sources (uses) . . . . . (882,147) 5,459,354 1,272,125 (1,420,341) (11,569) 4,417,422__________ __________ __________ __________ __________ __________Net change in fund balances . . . . . . . . . . . . . . . . . 5,260 651,436 (1,423,428) (2,125,238) 43,161 (2,848,809)FUND BALANCES (DEFICIT) AT BEGINNING OF YEAR . . 397,880 (2,117,667) 2,120,847 1,830,849 (84,722) 2,147,187__________ __________ __________ __________ __________ __________FUND BALANCES (DEFICIT) AT END OF YEAR . . . . . . . $ 403,140 $(1,466,231) $ 697,419 $ (294,389) $ (41,561) $ (701,622)__________ __________ __________ __________ __________ ____________________ __________ __________ __________ __________ __________
The reconciliation of the net change in fund balances of governmental funds to the change in net assets of governmental activitiesin the Statement of Activities is presented in an accompanying schedule.
See accompanying notes to financial statements.

35
THE CITY OF NEW YORKGOVERNMENTAL FUNDS
STATEMENT OF REVENUES, EXPENDITURES, AND CHANGES IN FUND BALANCES
FOR THE YEAR ENDED JUNE 30, 2001(in thousands)
New York City General Nonmajor TotalCapital Debt Governmental Adjustments/ Governmental
General Projects Service Funds Eliminations Funds____________ ____________ ____________ ____________ ____________ _____________REVENUES:
Real estate taxes . . . . . . . . . . . . . . . . . . . . . . . . $ 8,245,585 $ — $ — $ — $ — $ 8,245,585Sales and use taxes . . . . . . . . . . . . . . . . . . . . . . 4,195,594 — — — — 4,195,594Personal income tax . . . . . . . . . . . . . . . . . . . . . . 5,757,074 — — 407,442 — 6,164,516Income taxes, other . . . . . . . . . . . . . . . . . . . . . . 3,685,224 — — — — 3,685,224Other taxes . . . . . . . . . . . . . . . . . . . . . . . . . . . . . 1,293,657 — — — — 1,293,657Federal, State and other categorical aid . . . . . . . . 12,763,683 355,359 — 303,136 — 13,422,178Unrestricted Federal and State aid . . . . . . . . . . . 634,380 — — — — 634,380Charges for services . . . . . . . . . . . . . . . . . . . . . 1,460,891 — — — — 1,460,891Tobacco settlement . . . . . . . . . . . . . . . . . . . . . . 154,340 — — 49,988 — 204,328Investment income . . . . . . . . . . . . . . . . . . . . . . . 245,353 — 35,611 104,609 — 385,573Interest on mortgages, net . . . . . . . . . . . . . . . . . — — — 6,329 — 6,329Other revenues . . . . . . . . . . . . . . . . . . . . . . . . . . 1,762,690 1,057,547 2 1,486,027 (1,443,379) 2,862,887___________ __________ __________ __________ __________ __________
Total revenues . . . . . . . . . . . . . . . . . . . . . . 40,198,471 1,412,906 35,613 2,357,531 (1,443,379) 42,561,142___________ __________ __________ __________ __________ __________EXPENDITURES:
Current Operations:General government . . . . . . . . . . . . . . . . . . . 1,078,423 583,998 — 12,604 — 1,675,025Public safety and judicial . . . . . . . . . . . . . . . 5,874,881 236,331 — — — 6,111,212Education . . . . . . . . . . . . . . . . . . . . . . . . . . . 11,545,119 1,707,614 — 1,439,057 (1,443,379) 13,248,411City University . . . . . . . . . . . . . . . . . . . . . . . 392,936 9,038 — — — 401,974Social services . . . . . . . . . . . . . . . . . . . . . . . . 8,716,971 161,991 — — — 8,878,962Environmental protection . . . . . . . . . . . . . . . 1,528,271 1,008,236 — — — 2,536,507Transportation services . . . . . . . . . . . . . . . . . 749,682 855,677 — — — 1,605,359Parks, recreation and cultural activities . . . . . . 317,150 255,908 — — — 573,058Housing . . . . . . . . . . . . . . . . . . . . . . . . . . . . . 477,636 413,896 — — — 891,532Health (including payments to HHC) . . . . . . . 1,959,084 60,426 — — — 2,019,510Libraries . . . . . . . . . . . . . . . . . . . . . . . . . . . . 382,776 16,839 — — — 399,615Pensions . . . . . . . . . . . . . . . . . . . . . . . . . . . . 1,127,129 — — — — 1,127,129Judgments and claims . . . . . . . . . . . . . . . . . . 594,846 — — — — 594,846Fringe benefits and other benefit
payments . . . . . . . . . . . . . . . . . . . . . . . . . . . . 2,200,117 — — — — 2,200,117Administrative and other . . . . . . . . . . . . . . . . 315,282 — 13,447 62,930 — 391,659
Debt Service:Interest . . . . . . . . . . . . . . . . . . . . . . . . . . . . . . — — 1,449,178 703,377 (11,809) 2,140,746Redemptions . . . . . . . . . . . . . . . . . . . . . . . . . — — 1,310,263 214,339 252,435 1,777,037Lease payments . . . . . . . . . . . . . . . . . . . . . . . — — — 268,212 — 268,212Refunding escrow . . . . . . . . . . . . . . . . . . . . . — — 46,182 — — 46,182___________ __________ __________ __________ __________ __________
Total expenditures . . . . . . . . . . . . . . . . . . . 37,260,303 5,309,954 2,819,070 2,700,519 (1,202,753) 46,887,093___________ __________ __________ __________ __________ __________Excess (deficiency) of revenues
over expenditures . . . . . . . . . . . . . . . 2,938,168 (3,897,048) (2,783,457) (342,988) (240,626) (4,325,951)___________ __________ __________ __________ __________ __________OTHER FINANCING SOURCES (USES):
Transfers from General Fund . . . . . . . . . . . . . . — — 2,390,822 571,400 (19,150) 2,943,072Transfers from Nonmajor Capital
Projects Funds . . . . . . . . . . . . . . . . . . . . . . . . 1,576,954 — 56,847 (1,576,954) 56,847Transfers from Component Units . . . . . . . . . . . 33,401 — — — — 33,401Proceeds from sale of bonds . . . . . . . . . . . . . . . — 1,256,501 — 1,588,164 — 2,844,665Capitalized leases . . . . . . . . . . . . . . . . . . . . . . . — 55,251 — — — 55,251Refunding bond proceeds . . . . . . . . . . . . . . . . . — — 1,147,335 — — 1,147,335Transfer to New York City Capital Projects
Fund . . . . . . . . . . . . . . . . . . . . . . . . . . . . . . . — — — (1,576,954) 1,576,954 —Transfers to General Debt Service Fund . . . . . . (2,962,553) — — — — (2,962,553)Transfer to Component Units
for debt service . . . . . . . . . . . . . . . . . . . . . . . (4,121) — — — — (4,121)Transfer to Nonmajor Debt Service Funds . . . . — — — (37,366) — (37,366)Payments to refunded bond escrow holder . . . . — — (1,147,335) — — (1,147,335)___________ __________ __________ __________ __________ __________
Total other financing sources (uses) . . . . . (2,933,273) 2,888,706 2,390,822 602,091 (19,150) 2,929,196___________ __________ __________ __________ __________ __________Net change in fund balances . . . . . . . . . . . . . . . . . 4,895 (1,008,342) (392,635) 259,103 (259,776) (1,396,755)FUND BALANCES (DEFICIT) AT BEGINNING OF YEAR . . 392,985 (1,109,325) 2,513,482 1,571,746 175,054 3,543,942___________ __________ __________ __________ __________ __________FUND BALANCES (DEFICIT) AT END OF YEAR . . . . . . . $ 397,880 $ (2,117,667) $ 2,120,847 $ 1,830,849 $ (84,722) $ 2,147,187___________ __________ __________ __________ __________ _____________________ __________ __________ __________ __________ __________
The reconciliation of the net change in fund balances of governmental funds to the change in net assets of governmental activitiesin the Statement of Activities is presented in an accompanying schedule.
See accompanying notes to financial statements.

36
Amounts reported for governmental activities in the Statement of Activities are different because:
Net change in fund balances—total governmental funds . . . . . . . . . . . . . . . . . . . . . . . . . . . . $ (2,848,809)
Governmental funds report capital outlays as expenditures. However, in thestatement of activities the cost of those assets is allocated over theirestimated useful lives and reported as depreciation expense. This is theamount by which capital outlays exceeded depreciation in the current period.
Purchases of fixed assets . . . . . . . . . . . . . . . . . . . . . . . . . . . . . . . . . . . . . . . . . . . . . . . . . $ 4,561,073Depreciation expense . . . . . . . . . . . . . . . . . . . . . . . . . . . . . . . . . . . . . . . . . . . . . . . . . . . . (1,153,844) 3,407,229___________
The net effect of various miscellaneous transactions involving capital assets andother (i.e., sales, trade-ins, and donations) is to decrease net assets . . . . . . . . . . . . . . . . . . (1,749,694)
The issuance of long-term debt (e.g., bonds, leases) provides current financial resources to governmental funds, while the repayment of the principalof long-term debt consumes the current financial resources ofgovernmental funds. Neither transaction, however, has any effect onnet assets. Also, governmental funds report the effect of issuance costs,premiums, discounts, and similar items when debt is first issued,whereas these amounts are deferred and amortized in the statement ofactivities. This amount is the net effect of these differences in thetreatment of long-term debt and related items.
Proceeds from sales of bonds . . . . . . . . . . . . . . . . . . . . . . . . . . . . . . . . . . . . . . . . . . . . . . (3,815,823)Principal payments of bonds . . . . . . . . . . . . . . . . . . . . . . . . . . . . . . . . . . . . . . . . . . . . . . 1,810,277Other . . . . . . . . . . . . . . . . . . . . . . . . . . . . . . . . . . . . . . . . . . . . . . . . . . . . . . . . . . . . . . . . . (30,616) (2,036,162)___________
Some expenses reported in the statement of activities do not require the use of current financialresource and therefore, are not reported as expenditures in governmental funds . . . . . . . . (302,475)
Revenues in the statement of activities that do not provide current financialresources are not reported as revenues in the funds . . . . . . . . . . . . . . . . . . . . . . . . . . . . . . . (322,572)___________
Change in net assets—governmental activities . . . . . . . . . . . . . . . . . . . . . . . . . . . . . . . . . . . . $ (3,852,483)______________________
See accompanying notes to financial statements.
THE CITY OF NEW YORKRECONCILIATION OF THE STATEMENT OF REVENUES, EXPENDITURES AND CHANGES IN FUND
BALANCES OF GOVERNMENTAL FUNDS TO THE STATEMENT OF ACTIVITIES
FOR THE YEAR ENDED JUNE 30, 2002(in thousands)
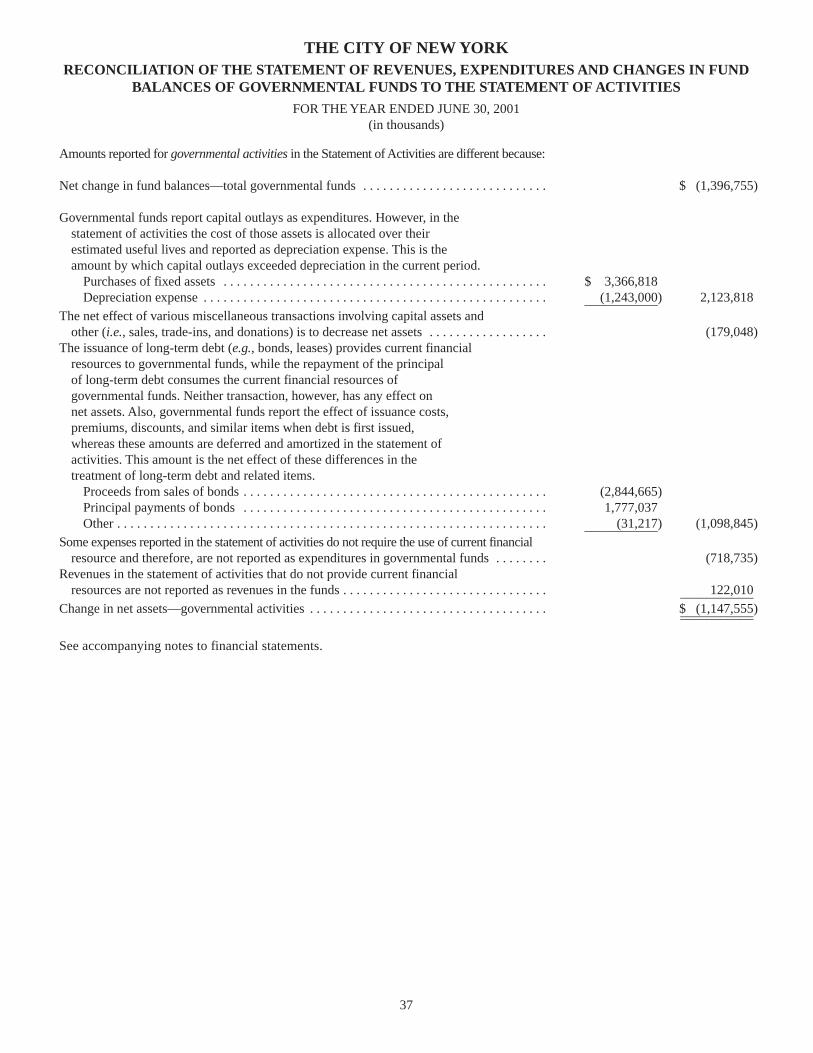
37
THE CITY OF NEW YORKRECONCILIATION OF THE STATEMENT OF REVENUES, EXPENDITURES AND CHANGES IN FUND
BALANCES OF GOVERNMENTAL FUNDS TO THE STATEMENT OF ACTIVITIES
FOR THE YEAR ENDED JUNE 30, 2001(in thousands)
Amounts reported for governmental activities in the Statement of Activities are different because:
Net change in fund balances—total governmental funds . . . . . . . . . . . . . . . . . . . . . . . . . . . . $ (1,396,755)
Governmental funds report capital outlays as expenditures. However, in thestatement of activities the cost of those assets is allocated over theirestimated useful lives and reported as depreciation expense. This is theamount by which capital outlays exceeded depreciation in the current period.
Purchases of fixed assets . . . . . . . . . . . . . . . . . . . . . . . . . . . . . . . . . . . . . . . . . . . . . . . . . $ 3,366,818Depreciation expense . . . . . . . . . . . . . . . . . . . . . . . . . . . . . . . . . . . . . . . . . . . . . . . . . . . . (1,243,000) 2,123,818___________
The net effect of various miscellaneous transactions involving capital assets andother (i.e., sales, trade-ins, and donations) is to decrease net assets . . . . . . . . . . . . . . . . . . (179,048)
The issuance of long-term debt (e.g., bonds, leases) provides current financial resources to governmental funds, while the repayment of the principalof long-term debt consumes the current financial resources ofgovernmental funds. Neither transaction, however, has any effect onnet assets. Also, governmental funds report the effect of issuance costs,premiums, discounts, and similar items when debt is first issued,whereas these amounts are deferred and amortized in the statement ofactivities. This amount is the net effect of these differences in thetreatment of long-term debt and related items.
Proceeds from sales of bonds . . . . . . . . . . . . . . . . . . . . . . . . . . . . . . . . . . . . . . . . . . . . . . (2,844,665)Principal payments of bonds . . . . . . . . . . . . . . . . . . . . . . . . . . . . . . . . . . . . . . . . . . . . . . 1,777,037Other . . . . . . . . . . . . . . . . . . . . . . . . . . . . . . . . . . . . . . . . . . . . . . . . . . . . . . . . . . . . . . . . . (31,217) (1,098,845)___________
Some expenses reported in the statement of activities do not require the use of current financialresource and therefore, are not reported as expenditures in governmental funds . . . . . . . . (718,735)
Revenues in the statement of activities that do not provide current financialresources are not reported as revenues in the funds . . . . . . . . . . . . . . . . . . . . . . . . . . . . . . . 122,010___________
Change in net assets—governmental activities . . . . . . . . . . . . . . . . . . . . . . . . . . . . . . . . . . . . $ (1,147,555)______________________
See accompanying notes to financial statements.

[This page intentionally left blank.]

39
THE CITY OF NEW YORKGENERAL FUND
STATEMENTS OF REVENUES, EXPENDITURESAND CHANGES IN FUND BALANCES
BUDGET AND ACTUALFOR THE YEARS ENDED JUNE 30, 2002 and 2001
(in thousands)2002 2001__________________________________________ __________________________________________
Budget Budget___________________________ ___________________________Adopted Modified Actual Adopted Modified Actual____________ ____________ ____________ ____________ ____________ ____________
REVENUES:Real estate taxes . . . . . . . . . . . . . . . . . $ 8,590,371 $ 8,753,021 $ 8,760,872 $ 8,111,268 $ 8,277,436 $ 8,245,585Sales and use taxes . . . . . . . . . . . . . . . 4,267,900 3,960,300 3,957,386 3,945,900 4,265,021 4,195,594Personal income tax . . . . . . . . . . . . . . 5,074,441 4,669,139 4,555,059 5,239,728 5,669,565 5,757,074Income taxes, other . . . . . . . . . . . . . . 2,979,300 2,824,800 3,192,084 3,341,535 3,671,535 3,685,224Other taxes . . . . . . . . . . . . . . . . . . . . . 1,751,474 1,639,774 1,230,829 1,176,400 1,237,848 1,293,657Federal, State and other categorical aid . 12,760,412 15,286,643 14,645,970 12,193,170 13,263,962 12,763,683Unrestricted Federal and State aid . . . 706,419 694,776 665,820 564,323 592,643 634,380Charges for services . . . . . . . . . . . . . . 1,388,898 1,386,371 1,458,393 1,374,949 1,434,424 1,460,891Tobacco settlement . . . . . . . . . . . . . . . 220,259 211,159 211,159 139,142 153,142 154,340Interest income . . . . . . . . . . . . . . . . . . 154,540 80,170 80,559 170,910 250,305 245,353Other revenues . . . . . . . . . . . . . . . . . . 1,453,977 1,858,142 1,627,590 1,032,462 1,987,123 1,762,690____________ ____________ ____________ ____________ ____________ ____________
Total revenues . . . . . . . . . . . . . . . 39,347,991 41,364,295 40,385,721 37,289,787 40,803,004 40,198,471____________ ____________ ____________ ____________ ____________ ____________EXPENDITURES:Current Operations:
General government . . . . . . . . . . . . . . 1,221,977 1,964,034 1,809,624 1,054,043 1,109,173 1,078,423Public safety and judicial . . . . . . . . . . 5,885,091 6,557,898 6,462,311 5,659,045 5,914,604 5,874,881Education . . . . . . . . . . . . . . . . . . . . . . 11,521,485 11,862,492 11,715,015 10,972,518 11,594,255 11,545,119City University . . . . . . . . . . . . . . . . . . 444,978 456,903 417,838 426,182 427,967 392,936Social services . . . . . . . . . . . . . . . . . . 8,927,220 9,275,281 9,097,726 8,458,562 8,829,394 8,716,971Environmental protection . . . . . . . . . . 1,637,330 1,649,043 1,602,525 1,599,362 1,552,029 1,528,271Transportation services . . . . . . . . . . . 605,262 691,841 678,728 616,997 790,519 749,682Parks, recreation and cultural activities . 315,341 307,959 305,063 287,070 317,508 317,150Housing . . . . . . . . . . . . . . . . . . . . . . . 453,916 464,155 440,284 460,983 517,382 477,636Health (including payments to HHC) 2,033,080 2,207,726 2,131,506 1,842,472 2,039,011 1,959,084Libraries . . . . . . . . . . . . . . . . . . . . . . . 131,433 124,030 123,808 242,392 382,999 382,776Pensions . . . . . . . . . . . . . . . . . . . . . . . 1,363,845 1,397,525 1,391,896 1,132,414 1,209,043 1,127,129Judgments and claims . . . . . . . . . . . . 309,527 389,527 521,834 442,273 498,273 594,846Fringe benefits and other benefit
payments . . . . . . . . . . . . . . . . . . . . . 2,288,857 2,427,737 2,426,143 2,160,700 2,172,215 2,200,117Other . . . . . . . . . . . . . . . . . . . . . . . . . . 1,026,560 565,416 374,013 714,950 509,622 315,282____________ ____________ ____________ ____________ ____________ ____________
Total expenditures . . . . . . . . . . . . 38,165,902 40,341,567 39,498,314 36,069,963 37,863,994 37,260,303____________ ____________ ____________ ____________ ____________ ____________Excess of revenues over
expenditures . . . . . . . . . . . . 1,182,089 1,022,728 887,407 1,219,824 2,939,010 2,938,168____________ ____________ ____________ ____________ ____________ ____________OTHER FINANCING SOURCES (USES):
Transfers from Component Units . . . . 33,000 24,700 21,707 34,400 34,200 33,401Transfer from Nonmajor
Capital Projects Fund . . . . . . . . . . . — 365,927 457,832 — — —Transfers and other payments for
debt service . . . . . . . . . . . . . . . . . . . (1,215,089) (1,413,355) (1,361,686) (1,254,224) (2,973,210) (2,966,674)____________ ____________ ____________ ____________ ____________ ____________Total other financing
sources (uses) . . . . . . . . . . . . . (1,182,089) (1,022,728) (882,147) (1,219,824) (2,939,010) (2,933,273)____________ ____________ ____________ ____________ ____________ ____________EXCESS OF REVENUES OVER EXPENDITURES
AND OTHER FINANCING SOURCES (USES) . $ — $ — 5,260 $ — $ — 4,895____________ ____________ ____________ ________________________ ____________ ____________ ____________FUND BALANCES AT BEGINNING OF YEAR . . 397,880 392,985____________ ____________FUND BALANCES AT END OF YEAR . . . . . . . $ 403,140 $ 397,880____________ ________________________ ____________
See accompanying notes to financial statements.
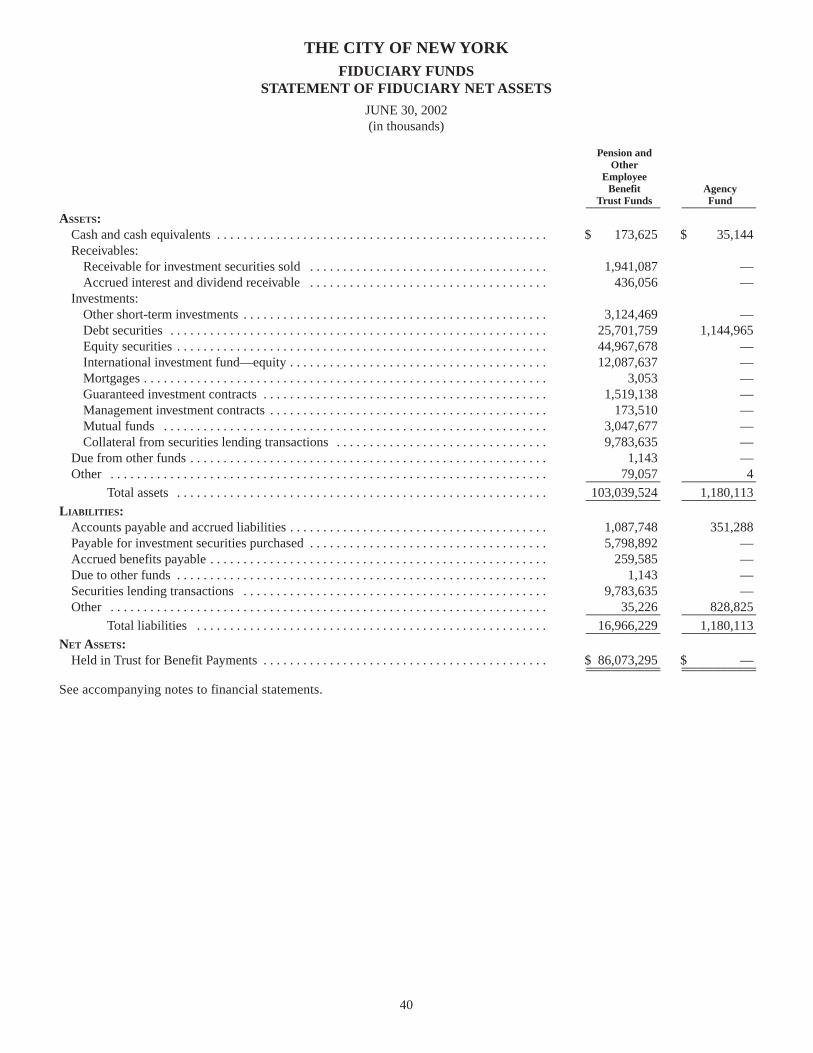
40
Pension andOther
EmployeeBenefit Agency
Trust Funds Fund______________ ______________
ASSETS:Cash and cash equivalents . . . . . . . . . . . . . . . . . . . . . . . . . . . . . . . . . . . . . . . . . . . . . . . . . . $ 173,625 $ 35,144Receivables:
Receivable for investment securities sold . . . . . . . . . . . . . . . . . . . . . . . . . . . . . . . . . . . . 1,941,087 —Accrued interest and dividend receivable . . . . . . . . . . . . . . . . . . . . . . . . . . . . . . . . . . . . 436,056 —
Investments:Other short-term investments . . . . . . . . . . . . . . . . . . . . . . . . . . . . . . . . . . . . . . . . . . . . . . 3,124,469 —Debt securities . . . . . . . . . . . . . . . . . . . . . . . . . . . . . . . . . . . . . . . . . . . . . . . . . . . . . . . . . 25,701,759 1,144,965Equity securities . . . . . . . . . . . . . . . . . . . . . . . . . . . . . . . . . . . . . . . . . . . . . . . . . . . . . . . . 44,967,678 — International investment fund—equity . . . . . . . . . . . . . . . . . . . . . . . . . . . . . . . . . . . . . . . 12,087,637 —Mortgages . . . . . . . . . . . . . . . . . . . . . . . . . . . . . . . . . . . . . . . . . . . . . . . . . . . . . . . . . . . . . 3,053 —Guaranteed investment contracts . . . . . . . . . . . . . . . . . . . . . . . . . . . . . . . . . . . . . . . . . . . 1,519,138 —Management investment contracts . . . . . . . . . . . . . . . . . . . . . . . . . . . . . . . . . . . . . . . . . . 173,510 —Mutual funds . . . . . . . . . . . . . . . . . . . . . . . . . . . . . . . . . . . . . . . . . . . . . . . . . . . . . . . . . . 3,047,677 —Collateral from securities lending transactions . . . . . . . . . . . . . . . . . . . . . . . . . . . . . . . . 9,783,635 —
Due from other funds . . . . . . . . . . . . . . . . . . . . . . . . . . . . . . . . . . . . . . . . . . . . . . . . . . . . . . 1,143 —Other . . . . . . . . . . . . . . . . . . . . . . . . . . . . . . . . . . . . . . . . . . . . . . . . . . . . . . . . . . . . . . . . . . 79,057 4______________ ______________
Total assets . . . . . . . . . . . . . . . . . . . . . . . . . . . . . . . . . . . . . . . . . . . . . . . . . . . . . . . . 103,039,524 1,180,113______________ ______________
LIABILITIES:Accounts payable and accrued liabilities . . . . . . . . . . . . . . . . . . . . . . . . . . . . . . . . . . . . . . . 1,087,748 351,288 Payable for investment securities purchased . . . . . . . . . . . . . . . . . . . . . . . . . . . . . . . . . . . . 5,798,892 —Accrued benefits payable . . . . . . . . . . . . . . . . . . . . . . . . . . . . . . . . . . . . . . . . . . . . . . . . . . . 259,585 —Due to other funds . . . . . . . . . . . . . . . . . . . . . . . . . . . . . . . . . . . . . . . . . . . . . . . . . . . . . . . . 1,143 —Securities lending transactions . . . . . . . . . . . . . . . . . . . . . . . . . . . . . . . . . . . . . . . . . . . . . . 9,783,635 —Other . . . . . . . . . . . . . . . . . . . . . . . . . . . . . . . . . . . . . . . . . . . . . . . . . . . . . . . . . . . . . . . . . . 35,226 828,825______________ ______________
Total liabilities . . . . . . . . . . . . . . . . . . . . . . . . . . . . . . . . . . . . . . . . . . . . . . . . . . . . . 16,966,229 1,180,113______________ ______________
NET ASSETS:Held in Trust for Benefit Payments . . . . . . . . . . . . . . . . . . . . . . . . . . . . . . . . . . . . . . . . . . . $ 86,073,295 $ —______________ ____________________________ ______________
See accompanying notes to financial statements.
THE CITY OF NEW YORKFIDUCIARY FUNDS
STATEMENT OF FIDUCIARY NET ASSETS
JUNE 30, 2002(in thousands)

41
THE CITY OF NEW YORKFIDUCIARY FUNDS
STATEMENT OF FIDUCIARY NET ASSETS
JUNE 30, 2001(in thousands)
Pension andOther
EmployeeBenefit Agency
Trust Funds Funds______________ ______________
ASSETS:Cash and cash equivalents . . . . . . . . . . . . . . . . . . . . . . . . . . . . . . . . . . . . . . . . . . . . . . . . . . $ 485,396 $ 77,339Receivables:
Receivable for investment securities sold . . . . . . . . . . . . . . . . . . . . . . . . . . . . . . . . . . . . 1,717,906 —Accrued interest and dividend receivable . . . . . . . . . . . . . . . . . . . . . . . . . . . . . . . . . . . . 466,266 —
Investments:Other short-term investments . . . . . . . . . . . . . . . . . . . . . . . . . . . . . . . . . . . . . . . . . . . . . . 3,694,342 —Debt securities . . . . . . . . . . . . . . . . . . . . . . . . . . . . . . . . . . . . . . . . . . . . . . . . . . . . . . . . . 29,369,366 1,168,699Equity securities . . . . . . . . . . . . . . . . . . . . . . . . . . . . . . . . . . . . . . . . . . . . . . . . . . . . . . . . 53,082,431 —International investment fund—equity . . . . . . . . . . . . . . . . . . . . . . . . . . . . . . . . . . . . . . . 12,972,165 —Mortgages . . . . . . . . . . . . . . . . . . . . . . . . . . . . . . . . . . . . . . . . . . . . . . . . . . . . . . . . . . . . . 9,359 —Guaranteed investment contracts . . . . . . . . . . . . . . . . . . . . . . . . . . . . . . . . . . . . . . . . . . . 1,043,069 —Management investment contracts . . . . . . . . . . . . . . . . . . . . . . . . . . . . . . . . . . . . . . . . . . 97,518 —Mutual funds . . . . . . . . . . . . . . . . . . . . . . . . . . . . . . . . . . . . . . . . . . . . . . . . . . . . . . . . . . 3,238,919 —Collateral from securities lending transactions . . . . . . . . . . . . . . . . . . . . . . . . . . . . . . . . 10,882,901 —
Due from other funds . . . . . . . . . . . . . . . . . . . . . . . . . . . . . . . . . . . . . . . . . . . . . . . . . . . . . . 750 —Other . . . . . . . . . . . . . . . . . . . . . . . . . . . . . . . . . . . . . . . . . . . . . . . . . . . . . . . . . . . . . . . . . . 55,760 —______________ ______________
Total assets . . . . . . . . . . . . . . . . . . . . . . . . . . . . . . . . . . . . . . . . . . . . . . . . . . . . . . . . 117,116,148 1,246,038______________ ______________
LIABILITIES:Accounts payable and accrued liabilities . . . . . . . . . . . . . . . . . . . . . . . . . . . . . . . . . . . . . . . 510,336 311,005Payable for investment securities purchased . . . . . . . . . . . . . . . . . . . . . . . . . . . . . . . . . . . . 5,957,262 —Accrued benefits payable . . . . . . . . . . . . . . . . . . . . . . . . . . . . . . . . . . . . . . . . . . . . . . . . . . . 306,123 —Due to other funds . . . . . . . . . . . . . . . . . . . . . . . . . . . . . . . . . . . . . . . . . . . . . . . . . . . . . . . . 750 —Securities lending transactions . . . . . . . . . . . . . . . . . . . . . . . . . . . . . . . . . . . . . . . . . . . . . . 10,882,901 —Other . . . . . . . . . . . . . . . . . . . . . . . . . . . . . . . . . . . . . . . . . . . . . . . . . . . . . . . . . . . . . . . . . . 21,752 935,033______________ ______________
Total liabilities . . . . . . . . . . . . . . . . . . . . . . . . . . . . . . . . . . . . . . . . . . . . . . . . . . . . . 17,679,124 1,246,038______________ ______________
NET ASSETS:Held in Trust for Benefit Payments . . . . . . . . . . . . . . . . . . . . . . . . . . . . . . . . . . . . . . . . . . . $ 99,437,024 $ —______________ ____________________________ ______________
See accompanying notes to financial statements.

42
Pension andOther Employee
Benefit TrustFunds_______________
ADDITIONS:Contributions:
Member contributions (net of loans to members) . . . . . . . . . . . . . . . . . . . . . . . . . . . . . . . . . . . . . . . . . . . . . $ 859,273Employer contributions . . . . . . . . . . . . . . . . . . . . . . . . . . . . . . . . . . . . . . . . . . . . . . . . . . . . . . . . . . . . . . . . . 1,508,934Other employer contributions . . . . . . . . . . . . . . . . . . . . . . . . . . . . . . . . . . . . . . . . . . . . . . . . . . . . . . . . . . . . 22,020_______________
Total contributions . . . . . . . . . . . . . . . . . . . . . . . . . . . . . . . . . . . . . . . . . . . . . . . . . . . . . . . . . . . . . . . . . 2,390,227_______________
Investment income:Interest income . . . . . . . . . . . . . . . . . . . . . . . . . . . . . . . . . . . . . . . . . . . . . . . . . . . . . . . . . . . . . . . . . . . . . . . 2,236,765Dividend income . . . . . . . . . . . . . . . . . . . . . . . . . . . . . . . . . . . . . . . . . . . . . . . . . . . . . . . . . . . . . . . . . . . . . . 772,792Net depreciation in fair value of investments . . . . . . . . . . . . . . . . . . . . . . . . . . . . . . . . . . . . . . . . . . . . . . . . (11,550,620)Less investment expenses . . . . . . . . . . . . . . . . . . . . . . . . . . . . . . . . . . . . . . . . . . . . . . . . . . . . . . . . . . . . . . . 337,700_______________
Investment loss, net . . . . . . . . . . . . . . . . . . . . . . . . . . . . . . . . . . . . . . . . . . . . . . . . . . . . . . . . . . . . . . . . (8,878,763)_______________
Payments from other funds . . . . . . . . . . . . . . . . . . . . . . . . . . . . . . . . . . . . . . . . . . . . . . . . . . . . . . . . . . . . . . . . 2,099Other . . . . . . . . . . . . . . . . . . . . . . . . . . . . . . . . . . . . . . . . . . . . . . . . . . . . . . . . . . . . . . . . . . . . . . . . . . . . . . . . . 28,222_______________
Total additions . . . . . . . . . . . . . . . . . . . . . . . . . . . . . . . . . . . . . . . . . . . . . . . . . . . . . . . . . . . . . . . . . . . . (6,458,215)_______________
DEDUCTIONS:Benefit payments and withdrawals . . . . . . . . . . . . . . . . . . . . . . . . . . . . . . . . . . . . . . . . . . . . . . . . . . . . . . . . 6,783,682Payments to other funds . . . . . . . . . . . . . . . . . . . . . . . . . . . . . . . . . . . . . . . . . . . . . . . . . . . . . . . . . . . . . . . . 2,099Other . . . . . . . . . . . . . . . . . . . . . . . . . . . . . . . . . . . . . . . . . . . . . . . . . . . . . . . . . . . . . . . . . . . . . . . . . . . . . . . 41,884Administrative expenses . . . . . . . . . . . . . . . . . . . . . . . . . . . . . . . . . . . . . . . . . . . . . . . . . . . . . . . . . . . . . . . . 77,849_______________
Total deductions . . . . . . . . . . . . . . . . . . . . . . . . . . . . . . . . . . . . . . . . . . . . . . . . . . . . . . . . . . . . . . . . . . 6,905,514_______________
Decrease in plan net assets . . . . . . . . . . . . . . . . . . . . . . . . . . . . . . . . . . . . . . . . . . . . . . . . . . . . . . . . . . (13,363,729)NET ASSETS:
Held in Trust for Benefit Payments:Beginning of Year . . . . . . . . . . . . . . . . . . . . . . . . . . . . . . . . . . . . . . . . . . . . . . . . . . . . . . . . . . . . . . . . . . . . . 99,437,024_______________
End of Year . . . . . . . . . . . . . . . . . . . . . . . . . . . . . . . . . . . . . . . . . . . . . . . . . . . . . . . . . . . . . . . . . . . . . . . . . . $ 86,073,295______________________________
See accompanying notes to financial statements.
THE CITY OF NEW YORKFIDUCIARY FUNDS
STATEMENT OF CHANGES IN FIDUCIARY NET ASSETS
FOR THE YEAR ENDED JUNE 30, 2002(in thousands)
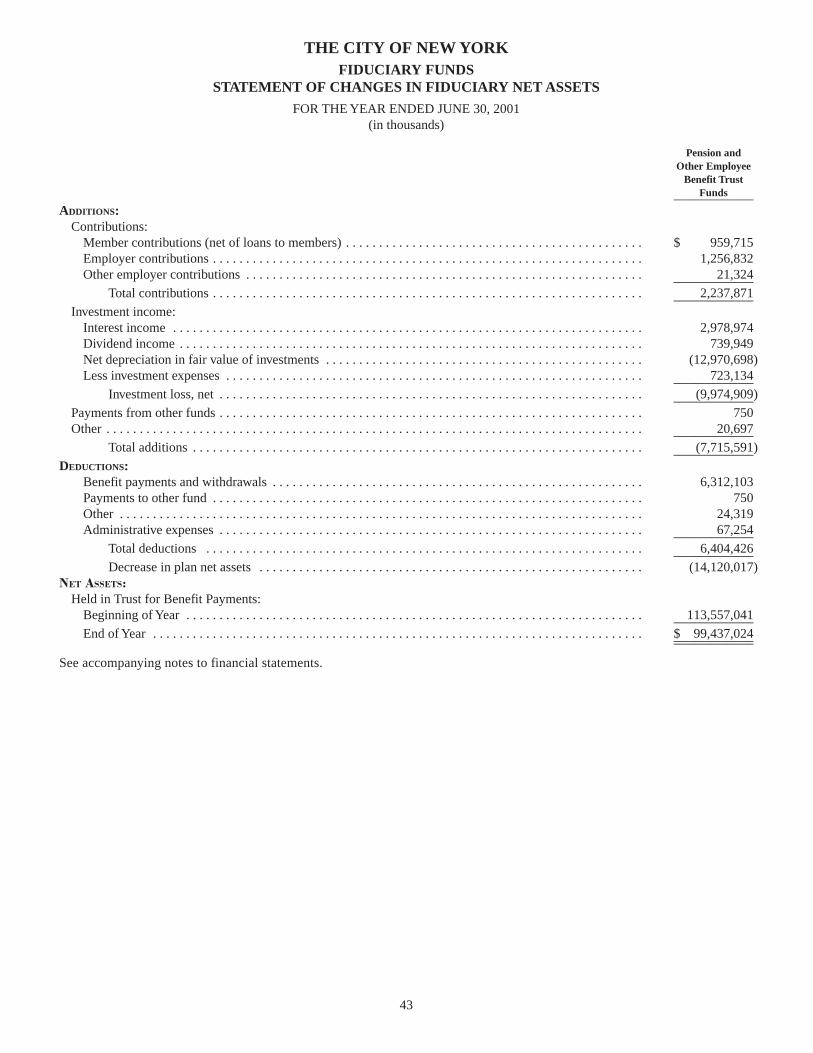
Pension andOther Employee
Benefit TrustFunds_______________
ADDITIONS:Contributions:
Member contributions (net of loans to members) . . . . . . . . . . . . . . . . . . . . . . . . . . . . . . . . . . . . . . . . . . . . . $ 959,715Employer contributions . . . . . . . . . . . . . . . . . . . . . . . . . . . . . . . . . . . . . . . . . . . . . . . . . . . . . . . . . . . . . . . . . 1,256,832Other employer contributions . . . . . . . . . . . . . . . . . . . . . . . . . . . . . . . . . . . . . . . . . . . . . . . . . . . . . . . . . . . . 21,324_______________
Total contributions . . . . . . . . . . . . . . . . . . . . . . . . . . . . . . . . . . . . . . . . . . . . . . . . . . . . . . . . . . . . . . . . . 2,237,871_______________
Investment income:Interest income . . . . . . . . . . . . . . . . . . . . . . . . . . . . . . . . . . . . . . . . . . . . . . . . . . . . . . . . . . . . . . . . . . . . . . . 2,978,974Dividend income . . . . . . . . . . . . . . . . . . . . . . . . . . . . . . . . . . . . . . . . . . . . . . . . . . . . . . . . . . . . . . . . . . . . . . 739,949Net depreciation in fair value of investments . . . . . . . . . . . . . . . . . . . . . . . . . . . . . . . . . . . . . . . . . . . . . . . . (12,970,698)Less investment expenses . . . . . . . . . . . . . . . . . . . . . . . . . . . . . . . . . . . . . . . . . . . . . . . . . . . . . . . . . . . . . . . 723,134_______________
Investment loss, net . . . . . . . . . . . . . . . . . . . . . . . . . . . . . . . . . . . . . . . . . . . . . . . . . . . . . . . . . . . . . . . . (9,974,909)_______________
Payments from other funds . . . . . . . . . . . . . . . . . . . . . . . . . . . . . . . . . . . . . . . . . . . . . . . . . . . . . . . . . . . . . . . . 750Other . . . . . . . . . . . . . . . . . . . . . . . . . . . . . . . . . . . . . . . . . . . . . . . . . . . . . . . . . . . . . . . . . . . . . . . . . . . . . . . . . 20,697_______________
Total additions . . . . . . . . . . . . . . . . . . . . . . . . . . . . . . . . . . . . . . . . . . . . . . . . . . . . . . . . . . . . . . . . . . . . (7,715,591)_______________
DEDUCTIONS:Benefit payments and withdrawals . . . . . . . . . . . . . . . . . . . . . . . . . . . . . . . . . . . . . . . . . . . . . . . . . . . . . . . . 6,312,103Payments to other fund . . . . . . . . . . . . . . . . . . . . . . . . . . . . . . . . . . . . . . . . . . . . . . . . . . . . . . . . . . . . . . . . . 750Other . . . . . . . . . . . . . . . . . . . . . . . . . . . . . . . . . . . . . . . . . . . . . . . . . . . . . . . . . . . . . . . . . . . . . . . . . . . . . . . 24,319Administrative expenses . . . . . . . . . . . . . . . . . . . . . . . . . . . . . . . . . . . . . . . . . . . . . . . . . . . . . . . . . . . . . . . . 67,254_______________
Total deductions . . . . . . . . . . . . . . . . . . . . . . . . . . . . . . . . . . . . . . . . . . . . . . . . . . . . . . . . . . . . . . . . . . 6,404,426_______________
Decrease in plan net assets . . . . . . . . . . . . . . . . . . . . . . . . . . . . . . . . . . . . . . . . . . . . . . . . . . . . . . . . . . (14,120,017)NET ASSETS:
Held in Trust for Benefit Payments:Beginning of Year . . . . . . . . . . . . . . . . . . . . . . . . . . . . . . . . . . . . . . . . . . . . . . . . . . . . . . . . . . . . . . . . . . . . . 113,557,041_______________
End of Year . . . . . . . . . . . . . . . . . . . . . . . . . . . . . . . . . . . . . . . . . . . . . . . . . . . . . . . . . . . . . . . . . . . . . . . . . . $ 99,437,024______________________________
See accompanying notes to financial statements.
43
THE CITY OF NEW YORKFIDUCIARY FUNDS
STATEMENT OF CHANGES IN FIDUCIARY NET ASSETS
FOR THE YEAR ENDED JUNE 30, 2001(in thousands)
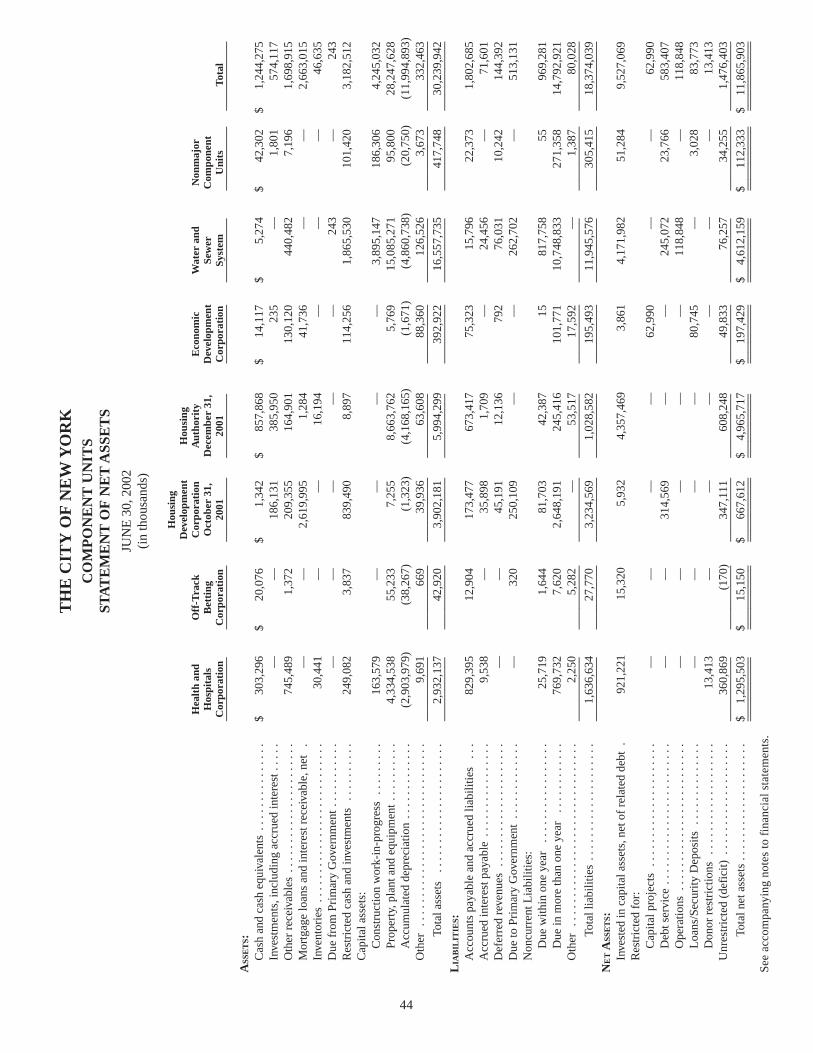
44
Hou
sing
Dev
elop
men
tH
ousi
ngH
ealt
h an
dO
ff-T
rack
Cor
pora
tion
Aut
hori
tyE
cono
mic
Wat
er a
ndN
onm
ajor
Hos
pita
lsB
etti
ngO
ctob
er 3
1,D
ecem
ber
31,
Dev
elop
men
tSe
wer
Com
pone
ntC
orpo
rati
onC
orpo
rati
on20
0120
01C
orpo
rati
onSy
stem
Uni
tsTo
tal
____
____
____
____
____
____
____
____
____
____
____
____
____
____
___
____
____
____
____
____
____
____
____
____
_
ASS
ET
S:C
ash
and
cash
equ
ival
ents
. . .
. . .
. . .
. . .
. . .
$30
3,29
6$
20,0
76$
1,34
2$
857,
868
$14
,117
$5,
274
$42
,302
$1,
244,
275
Inve
stm
ents
,inc
ludi
ng a
ccru
ed in
tere
st .
. . .
.—
—18
6,13
138
5,95
023
5—
1,80
157
4,11
7O
ther
rec
eiva
bles
. . .
. . .
. . .
. . .
. . .
. . .
. . .
.74
5,48
91,
372
209,
355
164,
901
130,
120
440,
482
7,19
61,
698,
915
Mor
tgag
e lo
ans
and
inte
rest
rec
eiva
ble,
net
.—
—2,
619,
995
1,28
441
,736
——
2,66
3,01
5In
vent
orie
s . .
. . .
. . .
. . .
. . .
. . .
. . .
. . .
. . .
.30
,441
——
16,1
94—
——
46,6
35D
ue f
rom
Pri
mar
y G
over
nmen
t . .
. . .
. . .
. . .
——
——
—24
3—
243
Res
tric
ted
cash
and
inve
stm
ents
. . .
. . .
. . .
.24
9,08
23,
837
839,
490
8,89
711
4,25
61,
865,
530
101,
420
3,18
2,51
2C
apita
l ass
ets:
Con
stru
ctio
n w
ork-
in-p
rogr
ess
. . .
. . .
. . .
163,
579
——
——
3,89
5,14
718
6,30
64,
245,
032
Prop
erty
,pla
nt a
nd e
quip
men
t . .
. . .
. . .
. .
4,33
4,53
855
,233
7,25
58,
663,
762
5,76
915
,085
,271
95,8
0028
,247
,628
Acc
umul
ated
dep
reci
atio
n .
. . .
. . .
. . .
. . .
(2,9
03,9
79)
(38,
267)
(1,3
23)
(4,1
68,1
65)
(1,6
71)
(4,8
60,7
38)
(20,
750)
(11,
994,
893)
Oth
er .
. . .
. . .
. . .
. . .
. . .
. . .
. . .
. . .
. . .
. . .
9,69
166
939
,936
63,6
0888
,360
126,
526
3,67
333
2,46
3__
____
____
____
____
____
____
____
____
____
____
____
____
____
____
___
____
____
____
____
____
____
____
____
___
Tota
l ass
ets
. . .
. . .
. . .
. . .
. . .
. . .
. . .
.2,
932,
137
42,9
203,
902,
181
5,99
4,29
939
2,92
216
,557
,735
417,
748
30,2
39,9
42__
____
____
____
____
____
____
____
____
____
____
____
____
____
____
___
____
____
____
____
____
____
____
____
___
LIA
BIL
ITIE
S:A
ccou
nts
paya
ble
and
accr
ued
liabi
litie
s .
. .82
9,39
512
,904
173,
477
673,
417
75,3
2315
,796
22,3
731,
802,
685
Acc
rued
inte
rest
pay
able
. . .
. . .
. . .
. . .
. . .
.9,
538
—35
,898
1,70
9—
24,4
56—
71,6
01D
efer
red
reve
nues
. . .
. . .
. . .
. . .
. . .
. . .
. . .
——
45,1
9112
,136
792
76,0
3110
,242
144,
392
Due
to P
rim
ary
Gov
ernm
ent
. . .
. . .
. . .
. . .
.—
320
250,
109
——
262,
702
—51
3,13
1N
oncu
rren
t Lia
bilit
ies:
Due
with
in o
ne y
ear
. . .
. . .
. . .
. . .
. . .
. .
25,7
191,
644
81,7
0342
,387
1581
7,75
855
969,
281
Due
in m
ore
than
one
yea
r .
. . .
. . .
. . .
. .76
9,73
27,
620
2,64
8,19
124
5,41
610
1,77
110
,748
,833
271,
358
14,7
92,9
21O
ther
. . .
. . .
. . .
. . .
. . .
. . .
. . .
. . .
. . .
. . .
.2,
250
5,28
2—
53,5
1717
,592
—1,
387
80,0
28__
____
____
____
____
____
____
____
____
____
____
____
____
____
____
___
____
____
____
____
____
____
____
____
___
Tota
l lia
bilit
ies
. . .
. . .
. . .
. . .
. . .
. . .
. .1,
636,
634
27,7
703,
234,
569
1,02
8,58
219
5,49
311
,945
,576
305,
415
18,3
74,0
39__
____
____
____
____
____
____
____
____
____
____
____
____
____
____
___
____
____
____
____
____
____
____
____
___
NE
TA
SSE
TS:
Inve
sted
in c
apita
l ass
ets,
net o
f re
late
d de
bt .
921,
221
15,3
205,
932
4,35
7,46
93,
861
4,17
1,98
251
,284
9,52
7,06
9R
estr
icte
d fo
r:C
apita
l pro
ject
s .
. . .
. . .
. . .
. . .
. . .
. . .
. .—
——
—62
,990
——
62,9
90D
ebt s
ervi
ce .
. . .
. . .
. . .
. . .
. . .
. . .
. . .
. .—
—31
4,56
9—
—24
5,07
223
,766
583,
407
Ope
ratio
ns .
. . .
. . .
. . .
. . .
. . .
. . .
. . .
. . .
——
——
—11
8,84
8—
118,
848
Loa
ns/S
ecur
ity D
epos
its .
. . .
. . .
. . .
. . .
.—
——
—80
,745
—3,
028
83,7
73D
onor
res
tric
tions
. . .
. . .
. . .
. . .
. . .
. . .
.13
,413
——
——
——
13,4
13U
nres
tric
ted
(def
icit)
. . .
. . .
. . .
. . .
. . .
. . .
.36
0,86
9(1
70)
347,
111
608,
248
49,8
3376
,257
34,2
551,
476,
403
____
____
____
____
____
____
____
____
____
____
____
____
____
____
___
____
____
____
____
____
____
____
____
____
_To
tal n
et a
sset
s . .
. . .
. . .
. . .
. . .
. . .
. . .
$1,
295,
503
$15
,150
$66
7,61
2$
4,96
5,71
7$
197,
429
$4,
612,
159
$11
2,33
3$
11,8
65,9
03__
____
____
____
____
____
____
____
____
____
____
____
____
____
____
___
____
____
____
____
____
____
____
____
___
____
____
____
____
____
____
____
____
____
____
____
____
____
____
___
____
____
____
____
____
____
____
____
____
_
See
acc
ompa
nyin
g no
tes
to f
inan
cial
sta
tem
ents
.
TH
E C
ITY
OF
NE
W Y
OR
KC
OM
PO
NE
NT
UN
ITS
STA
TE
ME
NT
OF
NE
T A
SSE
TS
JUN
E 3
0,20
02(i
n th
ousa
nds)

45
Hou
sing
Dev
elop
men
tH
ousi
ngH
ealt
h an
dO
ff-T
rack
Cor
pora
tion
Aut
hori
tyE
cono
mic
Wat
er a
ndN
onm
ajor
Hos
pita
lsB
etti
ngO
ctob
er 3
1,D
ecem
ber
31,
Dev
elop
men
tSe
wer
Com
pone
ntC
orpo
rati
onC
orpo
rati
on20
0020
00C
orpo
rati
onSy
stem
Uni
tsTo
tal
____
____
____
____
____
____
____
____
____
____
____
____
____
____
___
____
____
____
____
____
____
____
____
____
_A
SSE
TS:
Cas
h an
d ca
sh e
quiv
alen
ts .
. . .
. . .
. . .
. . .
. .$
314,
043
$25
,123
$96
6$
120,
927
$22
,516
$7,
423
$38
,194
$52
9,19
2In
vest
men
ts,i
nclu
ding
acc
rued
inte
rest
. . .
. .
——
255,
364
1,20
6,67
813
8—
2,42
71,
464,
607
Oth
er r
ecei
vabl
es .
. . .
. . .
. . .
. . .
. . .
. . .
. . .
775,
146
1,43
9—
42,7
2921
9,84
144
8,01
74,
735
1,49
1,90
7M
ortg
age
loan
s an
d in
tere
stre
ceiv
able
,net
. . .
. . .
. . .
. . .
. . .
. . .
. . .
.—
—2,
696,
121
1,55
642
,246
——
2,73
9,92
3In
vent
orie
s . .
. . .
. . .
. . .
. . .
. . .
. . .
. . .
. . .
.33
,007
——
12,0
10—
——
45,0
17D
ue f
rom
Pri
mar
y G
over
nmen
t . .
. . .
. . .
. . .
——
——
—23
,458
—23
,458
Res
tric
ted
cash
and
inve
stm
ents
. . .
. . .
. . .
.31
6,13
91,
595
720,
027
9,09
511
7,51
01,
017,
852
221,
099
2,40
3,31
7C
apita
l ass
ets:
Con
stru
ctio
n w
ork-
in-p
rogr
ess
. . .
. . .
. . .
312,
196
——
——
3,58
0,39
655
,212
3,94
7,80
4Pr
oper
ty,p
lant
and
equ
ipm
ent
. . .
. . .
. . .
.3,
883,
889
51,6
206,
683
8,25
0,65
44,
463
14,3
69,0
9578
,178
26,6
44,5
82A
ccum
ulat
ed d
epre
ciat
ion
. . .
. . .
. . .
. . .
.(2
,738
,498
)(3
2,98
5)(8
05)
(3,8
75,3
23)
(510
)(4
,573
,701
)(1
6,67
1)(1
1,23
8,49
3)O
ther
. . .
. . .
. . .
. . .
. . .
. . .
. . .
. . .
. . .
. . .
.10
,640
—41
,093
67,3
4358
,377
142,
284
3,63
832
3,37
5__
____
____
____
____
____
____
____
____
____
____
____
____
____
____
___
____
____
____
____
____
____
____
____
___
Tota
l ass
ets
. . .
. . .
. . .
. . .
. . .
. . .
. . .
.2,
906,
562
46,7
923,
719,
449
5,83
5,66
946
4,58
115
,014
,824
386,
812
28,3
74,6
89__
____
____
____
____
____
____
____
____
____
____
____
____
____
____
___
____
____
____
____
____
____
____
____
___
LIA
BIL
ITIE
S:A
ccou
nts
paya
ble
and
accr
ued
liabi
litie
s .
. .64
3,30
827
,512
159,
593
739,
923
54,4
0518
,033
10,8
721,
653,
646
Acc
rued
inte
rest
pay
able
. . .
. . .
. . .
. . .
. . .
.10
,416
—37
,061
1,86
9—
22,5
96—
71,9
42D
efer
red
reve
nues
. . .
. . .
. . .
. . .
. . .
. . .
. . .
——
45,6
5658
,506
674
76,5
629,
533
190,
931
Due
to P
rim
ary
Gov
ernm
ent
. . .
. . .
. . .
. . .
.—
311
214,
371
——
205,
456
—42
0,13
8N
oncu
rren
t Lia
bilit
ies:
Due
with
in o
ne y
ear
. . .
. . .
. . .
. . .
. . .
. .
24,9
89—
38,8
0011
,864
—67
4,48
917
750,
159
Due
in m
ore
than
one
yea
r .
. . .
. . .
. . .
. .78
9,85
03,
743
2,61
5,10
313
8,12
814
4,77
39,
345,
805
270,
158
13,3
07,5
60O
ther
. . .
. . .
. . .
. . .
. . .
. . .
. . .
. . .
. . .
. . .
.23
,632
——
48,6
8847
,337
—1,
477
121,
134
____
____
____
____
____
____
____
____
____
____
____
____
____
____
___
____
____
____
____
____
____
____
____
____
_To
tal l
iabi
litie
s . .
. . .
. . .
. . .
. . .
. . .
. . .
1,49
2,19
531
,566
3,11
0,58
499
8,97
824
7,18
910
,342
,941
292,
057
16,5
15,5
10__
____
____
____
____
____
____
____
____
____
____
____
____
____
____
___
____
____
____
____
____
____
____
____
___
NE
TA
SSE
TS:
Inve
sted
in c
apita
l ass
ets,
net o
fre
late
d de
bt .
. . .
. . .
. . .
. . .
. . .
. . .
. . .
. .82
6,66
816
,321
5,78
74,
391,
023
3,95
34,
232,
648
37,9
439,
514,
343
Res
tric
ted
for:
Cap
ital p
roje
cts
. . .
. . .
. . .
. . .
. . .
. . .
. . .
——
——
67,5
39—
—67
,539
Deb
t ser
vice
. . .
. . .
. . .
. . .
. . .
. . .
. . .
. . .
——
248,
086
——
158,
829
23,5
6443
0,47
9O
pera
tions
. . .
. . .
. . .
. . .
. . .
. . .
. . .
. . .
.—
——
——
120,
084
—12
0,08
4L
oans
/Sec
urity
Dep
osits
. . .
. . .
. . .
. . .
. .
——
——
88,9
38—
3,39
192
,329
Don
or r
estr
ictio
ns .
. . .
. . .
. . .
. . .
. . .
. . .
13,2
93—
——
——
—13
,293
Unr
estr
icte
d (d
efic
it) .
. . .
. . .
. . .
. . .
. . .
. . .
574,
406
(1,0
95)
354,
992
445,
668
56,9
6216
0,32
229
,857
1,62
1,11
2__
____
____
____
____
____
____
____
____
____
____
____
____
____
____
___
____
____
____
____
____
____
____
____
___
Tota
l net
ass
ets
. . .
. . .
. . .
. . .
. . .
. . .
. .$
1,41
4,36
7$
15,2
26$
608,
865
$4,
836,
691
$21
7,39
2$
4,67
1,88
3$
94,7
55$
11,8
59,1
79__
____
____
____
____
____
____
____
____
____
____
____
____
____
____
___
____
____
____
____
____
____
____
____
___
____
____
____
____
____
____
____
____
____
____
____
____
____
____
___
____
____
____
____
____
____
____
____
____
_
See
acc
ompa
nyin
g no
tes
to f
inan
cial
sta
tem
ents
.
TH
E C
ITY
OF
NE
W Y
OR
KC
OM
PO
NE
NT
UN
ITS
STA
TE
ME
NT
OF
NE
T A
SSE
TS
JUN
E 3
0,20
01(i
n th
ousa
nds)
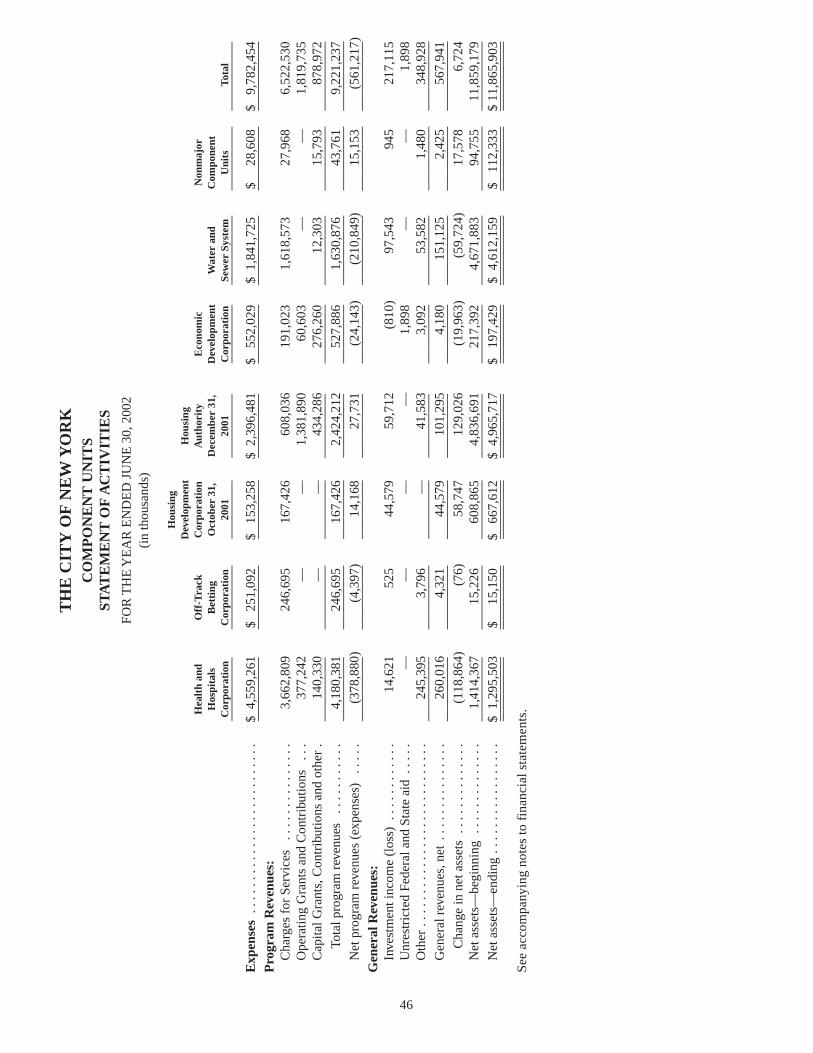
46
Hou
sing
Dev
elop
men
tH
ousi
ngH
ealt
h an
dO
ff-T
rack
Cor
pora
tion
Aut
hori
tyE
cono
mic
Non
maj
orH
ospi
tals
Bet
ting
Oct
ober
31,
Dec
embe
r 31
,D
evel
opm
ent
Wat
er a
ndC
ompo
nent
Cor
pora
tion
Cor
pora
tion
2001
2001
Cor
pora
tion
Sew
er S
yste
mU
nits
Tota
l__
____
____
____
____
____
____
____
____
___
____
____
____
____
____
___
____
____
___
____
____
____
____
____
____
_
Exp
ense
s .
. . .
. . .
. . .
. . .
. . .
. . .
. . .
. . .
.$
4,55
9,26
1$
251,
092
$15
3,25
8$
2,39
6,48
1$
552,
029
$1,
841,
725
$28
,608
$9,
782,
454
____
____
____
____
____
____
____
____
___
____
____
____
____
____
___
____
____
____
___
____
____
____
____
____
___
Pro
gram
Rev
enue
s:C
harg
es f
or S
ervi
ces
. . .
. . .
. . .
. . .
. . .
3,66
2,80
924
6,69
516
7,42
660
8,03
619
1,02
31,
618,
573
27,9
686,
522,
530
Ope
ratin
g G
rant
s an
d C
ontr
ibut
ions
. . .
377,
242
——
1,38
1,89
060
,603
——
1,81
9,73
5C
apita
l Gra
nts,
Con
trib
utio
ns a
nd o
ther
.14
0,33
0—
—43
4,28
627
6,26
012
,303
15,7
9387
8,97
2__
____
____
____
____
____
____
____
____
___
____
____
____
____
____
___
____
____
___
____
____
____
____
____
____
_
Tota
l pro
gram
rev
enue
s .
. . .
. . .
. . .
.4,
180,
381
246,
695
167,
426
2,42
4,21
252
7,88
61,
630,
876
43,7
619,
221,
237
____
____
____
____
____
____
____
____
___
____
____
____
____
____
___
____
____
____
___
____
____
____
____
____
___
Net
pro
gram
rev
enue
s (e
xpen
ses)
. . .
. .
(378
,880
)(4
,397
)14
,168
27,7
31(2
4,14
3)(2
10,8
49)
15,1
53(5
61,2
17)
____
____
____
____
____
____
____
____
___
____
____
____
____
____
___
____
____
____
___
____
____
____
____
____
___
Gen
eral
Rev
enue
s:In
vest
men
t inc
ome
(los
s) .
. . .
. . .
. . .
. .14
,621
525
44,5
7959
,712
(810
)97
,543
945
217,
115
Unr
estr
icte
d Fe
dera
l and
Sta
te a
id .
. . .
.—
——
—1,
898
——
1,89
8O
ther
. . .
. . .
. . .
. . .
. . .
. . .
. . .
. . .
. . .
.24
5,39
53,
796
—41
,583
3,09
253
,582
1,48
034
8,92
8__
____
____
____
____
____
____
____
____
___
____
____
____
____
____
___
____
____
___
____
____
____
____
____
____
_
Gen
eral
rev
enue
s,ne
t . .
. . .
. . .
. . .
. . .
.26
0,01
64,
321
44,5
7910
1,29
54,
180
151,
125
2,42
556
7,94
1__
____
____
____
____
____
____
____
____
___
____
____
____
____
____
___
____
____
___
____
____
____
____
____
____
_
Cha
nge
in n
et a
sset
s .
. . .
. . .
. . .
. . .
.(1
18,8
64)
(76)
58,7
4712
9,02
6(1
9,96
3)(5
9,72
4)17
,578
6,72
4N
et a
sset
s—be
ginn
ing
. . .
. . .
. . .
. . .
. .
1,41
4,36
715
,226
608,
865
4,83
6,69
121
7,39
24,
671,
883
94,7
5511
,859
,179
____
____
____
____
____
____
____
____
___
____
____
____
____
____
___
____
____
____
___
____
____
____
____
____
___
Net
ass
ets—
endi
ng .
. . .
. . .
. . .
. . .
. . .
.$
1,29
5,50
3$
15,1
50$
667,
612
$4,
965,
717
$19
7,42
9$
4,61
2,15
9$
112,
333
$ 11
,865
,903
____
____
____
____
____
____
____
____
___
____
____
____
____
____
___
____
____
____
___
____
____
____
____
____
___
____
____
____
____
____
____
____
____
___
____
____
____
____
____
___
____
____
____
___
____
____
____
____
____
___
See
acc
ompa
nyin
g no
tes
to f
inan
cial
sta
tem
ents
.
TH
E C
ITY
OF
NE
W Y
OR
KC
OM
PO
NE
NT
UN
ITS
STA
TE
ME
NT
OF
AC
TIV
ITIE
S
FOR
TH
E Y
EA
R E
ND
ED
JU
NE
30,
2002
(in
thou
sand
s)

47
Hou
sing
Dev
elop
men
tH
ousi
ngH
ealt
h an
dO
ff-T
rack
Cor
pora
tion
Aut
hori
tyE
cono
mic
Non
maj
orH
ospi
tals
Bet
ting
Oct
ober
31,
Dec
embe
r 31
,D
evel
opm
ent
Wat
er a
ndC
ompo
nent
Cor
pora
tion
Cor
pora
tion
2000
2000
Cor
pora
tion
Sew
er S
yste
mU
nits
Tota
l__
____
____
____
____
____
____
____
____
___
____
____
____
____
____
___
____
____
___
____
____
____
____
____
____
_
Exp
ense
s .
. . .
. . .
. . .
. . .
. . .
. . .
. . .
. . .
.$
4,39
2,78
9$
260,
868
$16
1,48
4$
2,23
5,94
1$
478,
113
$1,
823,
024
$24
,911
$9,
377,
130
____
____
____
____
____
____
____
____
___
____
____
____
____
____
___
____
____
____
___
____
____
____
____
____
___
Pro
gram
Rev
enue
s:C
harg
es f
or S
ervi
ces
. . .
. . .
. . .
. . .
. . .
3,62
2,05
024
9,50
716
5,08
560
7,65
417
8,59
71,
576,
884
22,2
566,
422,
033
Ope
ratin
g G
rant
s an
d C
ontr
ibut
ions
. . .
454,
370
——
1,33
9,06
040
,857
——
1,83
4,28
7C
apita
l Gra
nts,
Con
trib
utio
ns a
nd o
ther
.16
3,63
0—
—53
4,41
929
2,39
71,
748
6,03
399
8,22
7__
____
____
____
____
____
____
____
____
___
____
____
____
____
____
___
____
____
___
____
____
____
____
____
____
_
Tota
l pro
gram
rev
enue
s .
. . .
. . .
. . .
.4,
240,
050
249,
507
165,
085
2,48
1,13
351
1,85
11,
578,
632
28,2
899,
254,
547
____
____
____
____
____
____
____
____
___
____
____
____
____
____
___
____
____
____
___
____
____
____
____
____
___
Net
pro
gram
rev
enue
s (e
xpen
ses)
. . .
. .
(152
,739
)(1
1,36
1)3,
601
245,
192
33,7
38(2
44,3
92)
3,37
8(1
22,5
83)
____
____
____
____
____
____
____
____
___
____
____
____
____
____
___
____
____
____
___
____
____
____
____
____
___
Gen
eral
Rev
enue
s:In
vest
men
t inc
ome
(los
s) .
. . .
. . .
. . .
. .32
,953
1,84
435
,479
93,1
41(2
8,92
8)84
,534
2,31
622
1,33
9U
nres
tric
ted
Fede
ral a
nd S
tate
aid
. . .
. .
——
——
1,80
0—
—1,
800
Oth
er .
. . .
. . .
. . .
. . .
. . .
. . .
. . .
. . .
. . .
212,
247
3,01
5(1
1)—
1,82
545
,039
9,28
327
1,39
8__
____
____
____
____
____
____
____
____
___
____
____
____
____
____
___
____
____
___
____
____
____
____
____
____
_
Gen
eral
rev
enue
s,ne
t . .
. . .
. . .
. . .
. . .
.24
5,20
04,
859
35,4
6893
,141
(25,
303)
129,
573
11,5
9949
4,53
7__
____
____
____
____
____
____
____
____
___
____
____
____
____
____
___
____
____
___
____
____
____
____
____
____
_
Cha
nge
in n
et a
sset
s .
. . .
. . .
. . .
. . .
.92
,461
(6,5
02)
39,0
6933
8,33
38,
435
(114
,819
)14
,977
371,
954
Net
ass
ets—
begi
nnin
g .
. . .
. . .
. . .
. . .
.1,
321,
906
21,7
2856
9,79
64,
498,
358
208,
957
4,78
6,70
279
,778
11,4
87,2
25__
____
____
____
____
____
____
____
____
___
____
____
____
____
____
___
____
____
___
____
____
____
____
____
____
_
Net
ass
ets—
endi
ng .
. . .
. . .
. . .
. . .
. . .
.$
1,41
4,36
7$
15,2
26$
608,
865
$4,
836,
691
$21
7,39
2$
4,67
1,88
3$
94,7
55$
11,8
59,1
79__
____
____
____
____
____
____
____
____
___
____
____
____
____
____
___
____
____
___
____
____
____
____
____
____
___
____
____
____
____
____
____
____
____
___
____
____
____
____
____
___
____
____
___
____
____
____
____
____
____
_
See
acc
ompa
nyin
g no
tes
to f
inan
cial
sta
tem
ents
.
TH
E C
ITY
OF
NE
W Y
OR
KC
OM
PO
NE
NT
UN
ITS
STA
TE
ME
NT
OF
AC
TIV
ITIE
S
FOR
TH
E Y
EA
R E
ND
ED
JU
NE
30,
2001
(in
thou
sand
s)
48
A. SUMMARY OF SIGNIFICANT ACCOUNTING POLICIES
The accompanying basic financial statements of The City of New York (City or primary government) are presented in conformitywith generally accepted accounting principles (GAAP) for governments in the United States of America as prescribed by theGovernmental Accounting Standards Board (GASB). The amounts shown in the “Primary Government” and “Component Units”columns of the accompanying government-wide financial statements are only presented to facilitate financial analysis and are notthe equivalent of consolidated financial statements.
The following is a summary of the significant accounting policies and reporting practices of the City:
1. Reporting Entity
The City of New York is a municipal corporation governed by the Mayor and the City Council. The City’s operations alsoinclude those normally performed at the county level and, accordingly, transactions applicable to the operations of the fivecounties which comprise the City are included in these financial statements.
The financial reporting entity consists of the primary government including the Board of Education and the community collegesof the City University of New York, other organizations for which the primary government is financially accountable, and otherorganizations for which the nature and significance of their relationship with the primary government are such that exclusion wouldcause the reporting entity’s financial statements to be misleading or incomplete.
The definition of the reporting entity is based primarily on the notion of financial accountability. A primary government isfinancially accountable for the organizations that make up its legal entity. It is also financially accountable for legally separateorganizations if its officials appoint a voting majority of an organization’s governing body and either it is able to impose its willon that organization or there is a potential for the organization to provide specific financial benefits to, or to impose specific financialburdens on, the primary government. A primary government may also be financially accountable for governmental organizationsthat are fiscally dependent on it.
Most component units are included in the financial reporting entity by discrete presentation. Some component units, despitebeing legally separate from the primary government, are so integrated with the primary government, that they are in substancepart of the primary government. These component units are blended with the primary government.
The New York City Transit Authority is an affiliated agency of the Metropolitan Transportation Authority of the State of NewYork which is a component unit of New York State and is excluded from the City’s financial reporting entity.
Blended Component Units
These component units, although legally separate, all provide services exclusively to the City and thus are reported as if theywere part of the primary government. They include the following:
Municipal Assistance Corporation for The City Of New York (MAC). MAC is a corporate governmental agency andinstrumentality of the State constituting a public benefit corporation. MAC was created in 1975 by the Municipal AssistanceCorporation For The City of New York Act (Act) to assist the City in providing essential services to its inhabitants without interruptionand in reestablishing investor confidence in the soundness of City obligations. Pursuant to the Act, MAC is empowered to issueand sell bonds and notes, pay or loan to the City funds received from such sales, and exchange its obligations for those of the City.Also pursuant to the Act, MAC provides certain oversight of the City’s financial activities.
MAC has no taxing power. All outstanding bonds issued by MAC are general obligations of MAC and do not constitute anenforceable obligation or a debt of either the City or the State and neither the City nor the State is liable thereon. Neither the Citynor a creditor of the City has any claim to MAC’s revenues and assets. Debt service requirements and operating expenses are fundedby allocations from the State’s collection of certain sales and compensating use taxes (imposed by the State within the City at ratesformerly imposed by the City), the stock transfer tax, and certain per capita aid subject in each case to appropriation by the StateLegislature. Net collections of taxes and per capita aid are returned to the City by the State after MAC debt service requirementsare met. The MAC bond resolutions provide for liens by bondholders on certain monies received by MAC from the State.
THE CITY OF NEW YORKNOTES TO FINANCIAL STATEMENTS
JUNE 30, 2002 and 2001
49
NOTES TO FINANCIAL STATEMENTS, Continued
New York City Transitional Finance Authority (TFA). TFA is a corporate governmental agency constituting a public benefitcorporation and instrumentality of the State. TFA was created in 1997 by the New York City Financial Authority Act to assist theCity in funding its capital program, the purpose of which is to maintain, rebuild, and expand the infrastructure of the City.
TFA has no taxing power. All outstanding bonds issued by TFA are general obligations of TFA and do not constitute anenforceable obligation or a debt of either the City or the State and neither the City nor the State is liable thereon. Neither the Citynor a creditor of the City has any claim to TFA’s revenues and assets. Debt service requirements and operating expenses are fundedby allocations from the State’s collection of personal income taxes (imposed by the City and collected by the State) and, undercertain circumstances, sales taxes. Sales taxes are only available to TFA after such amounts required by MAC are deducted andif the amounts of personal income tax revenues fall below statutorily specified coverage levels. Net collections of taxes not requiredby TFA are paid to the City by TFA.
New York City Samurai Funding Corporation (SFC). The City created SFC in 1992. This is a special-purposegovernmental not-for-profit entity, created to issue Yen-denominated bonds. The members, directors, and officers of SFC are allelected officials or employees of the City.
SFC issued Yen-denominated bonds to investors on May 27, 1993 and simultaneously bought general obligation bonds fromthe City. Such bonds require the City to make floating rate interest and principal payments in U.S. dollars to SFC. SFC enteredinto currency and interest rate exchange agreements to swap the City’s payments into fixed rate Yen which are used to pay SFC’sbondholders. These agreements limit the City’s currency and exchange rate change exposure. The proceeds from the City’s bondssold to SFC were used for housing and economic development projects.
TSASC, Inc. (TSASC). TSASC is a special purpose, local development corporation organized in 1999 under the laws ofthe State of New York. TSASC is an instrumentality of the City, but is a separate legal entity from the City.
Pursuant to a purchase and sale agreement with the City, the City sold to TSASC all of its future right, title, and interest in thetobacco settlement revenues under the Master Settlement Agreement and the Decree and Final Judgment. This settlement agreementresolved cigarette smoking-related litigation between the settling states and participating manufacturers, released the participatingmanufacturers from past and present smoking-related claims, and provides for a continuing release of future smoking-related claims,in exchange for certain payments to be made to the settling states, as well as certain tobacco advertising and marketing restrictions,among other things. The City is allocated a share of the tobacco settlement revenues received by New York State.
The purchase price of the City’s future right, title, and interest in the tobacco settlement revenues has been financed by theissuance of a series of bonds. In addition, the City is entitled to receive all amounts required to be distributed after payment ofdebt service, operating expenses, and certain other costs as set forth in the indenture. These payments are subordinate to paymentson the bonds and payment of certain other costs specified in the indenture.
New York City Educational Construction Fund (ECF). ECF was created in 1967 as a corporate governmental agencyof the State of New York, constituting a public benefit corporation. ECF was established to receive and administer money for theconstruction of the school related portion of combined occupancy structures. ECF was created by the Education Law of the Stateand is authorized to issue bonds, notes, or other obligations to finance the construction and improvement of elementary and secondaryschool buildings within the City.
The Board of Education maintains responsibility for the selection of school sites, and design and construction of schools,but the titles to such sites and schools are vested with ECF.
City University Construction Fund (CUCF). CUCF is a corporate governmental agency constituting a public benefitcorporation. CUCF was created in 1966 by the New York State Education Law. The purpose of CUCF is to provide facilities forboth senior colleges and community colleges of The City University of New York (CUNY) and to support the educationalpurposes of CUNY.
CUCF is administered by seven State and City appointed trustees.
New York City School Construction Authority (SCA). SCA is a public benefit corporation created by the New York StateLegislature in 1988. SCA’s responsibilities as defined in the enabling legislation are the design, construction, reconstruction,improvement, rehabilitation and repair of the City’s public schools. SCA is governed by a three-member Board of Trustees, eachof whom is appointed by the Mayor who serves as the Chairman, the Governor, and the Schools Chancellor of the City, ex officio,respectively.

SCA’s operations are almost entirely funded by appropriations made by the City and are guided by five-year capital plans,developed by the Board of Education of the City.
Discretely Presented Component Units
All discretely presented component units are legally separate from the primary government. These entities are reported asdiscretely presented component units because the City appoints a majority of these organizations’ boards, is able to impose itswill on them, or a financial benefit/burden situation exists.
The component units column in the government-wide financial statements include the financial data of these entities, whichare reported in a separate column to emphasize that they are legally separate from the City. They include the following:
New York City Health and Hospitals Corporation (HHC). HHC, a public benefit corporation, assumed responsibilityfor the operation of the City’s municipal hospital system in 1970. HHC’s financial statements include the accounts of HHC andits wholly-owned subsidiaries, Metroplus Health Plan, Inc. and HHC Capital Corporation.
The City provides funds to HHC for care given to uninsured indigent patients, members of the uniformed services and prisoners,and for other costs not covered by other payors. The City’s Annual Expense Budget determines the support to HHC on a cash-flow basis. In addition, the City has paid HHC’s costs for settlements of claims for medical malpractice, negligence, and othermiscellaneous torts and contracts, as well as other HHC costs including utilities expense, City debt which funded HHC capitalacquisitions, and New York State Housing Finance Agency (HFA) debt on HHC assets acquired through lease purchase agreements.HHC reimburses the City for these debt payments. HHC records both a revenue and an expense in an amount equal to expendituresmade on its behalf by the City.
New York City Off-Track Betting Corporation (OTB). OTB was established in 1970 as a public benefit corporation tooperate a system of off-track betting in the City. OTB earns: (i) revenues on its betting operations ranging between 15% and 31%of wagers handled, depending on the type of wager; (ii) a 5% surcharge and surcharge breakage on pari-mutuel winnings; (iii) a1% surcharge on multiple, exotic, and super exotic wagering pools; and (iv) breakage, the revenue resulting from the roundingdown of winning payoffs. Pursuant to State law, OTB: (i) distributes various portions of the surcharge and surcharge breakage toother localities in the State; (ii) allocates various percentages of wagers handled to the racing industry; (iii) allocates various percentagesof wagers handled and breakage together with all uncashed parimutuel tickets to the State; and (iv) allocates the 1% surchargeon exotic wagering pools for the financing of capital acquisitions. All remaining net revenue is distributable to the City. In addition,OTB acts as a collection agent for the City with respect to surcharge and surcharge breakage due from other community off-trackbetting corporations.
Jay Street Development Corporation. (JSDC). JSDC is a local development corporation organized by the City in 2000under the not-for-profit corporation law of the State of New York. JSDC is an instrumentality of the City, but is a separate legalentity from the City.
JSDC has no taxing power. Bonds issued by JSDC do not constitute debt of the State or the City and neither the State northe City is liable on them. Bond issuances are being used to fund the costs of the design, construction, and furnishing of a courthouse(Courts Facility) in Brooklyn. The City has leased the Courts Facility from JSDC and the rental payments will fund debt servicerequirements, redemption premiums (if any), financing costs, administrative expenses, and certain additional amounts determinedby JSDC as necessary for this project.
New York City Housing Development Corporation (HDC). HDC was established in 1971 to encourage private housingdevelopment by providing low interest mortgage loans. The combined financial statements include the accounts of HDC and itswholly-owned subsidiaries, Housing Assistance Corporation, Housing New York Corporation, and the New York City ResidentialMortgage Insurance Corporation. HDC finances multiple dwelling mortgages substantially through issuance of HDC bonds andnotes, and also acts as an intermediary for the sale and refinancing of certain City multiple dwelling mortgages. HDC has a fiscalyear ending October 31.
HDC is supported by service fees, investment income, and interest charged to mortgagors and has been self-sustaining. Mortgageloans are carried at cost. Mortgage loan interest income, fees, charges, and interest expense are recognized on the accrual basis.HDC maintains separate funds in its financial records to assure compliance with specific restrictions of its various bond and noteresolutions.
50
NOTES TO FINANCIAL STATEMENTS, Continued

New York City Housing Authority (HA). HA is a public benefit corporation chartered in 1934 under the New York StatePublic Housing Law. HA develops, constructs, manages, and maintains low cost housing for eligible low income families in TheCity of New York. HA also maintains a leased housing program which provides housing assistance payments to families.
Substantial operating losses (the difference between operating revenues and expenses) result from the essential services thatHA provides, and such operating losses will continue in the foreseeable future. To meet the funding requirements of theseoperating losses, HA receives subsidies from: (a) the Federal government primarily the U.S. Department of Housing and UrbanDevelopment in the form of annual grants for operating assistance, debt service payments, contributions for capital andreimbursement of expenditures incurred for certain Federal housing programs; (b) New York State in the form of operating assistance,reimbursement of certain expenses, and debt service payments; and (c) New York City in the form of operating assistance,reimbursement of certain housing police costs prior to May 1, 1995, and debt service payments. Subsidies are established throughbudgetary procedures which establish amounts to be funded by the grantor agencies. Projected operating income or loss amountsare budgeted on an annual basis and approved by the grantor agency. Expected variances from budgeted amounts are communicatedto the agency during periodic budget revisions, as any revisions to previously approved budgets must be agreed to by the grantor.HA has a calendar year-end.
New York City Industrial Development Agency (IDA). IDA is a public benefit corporation established in 1974 toactively promote, retain, attract, encourage and develop an economically sound commerce and industry base to preventunemployment and economic deterioration in the City. IDA is governed by a Board of Directors, which establishes official policiesand reviews and approves requests for financing assistance. Its membership is prescribed by statute and includes public officialsand private business leaders.
New York City Economic Development Corporation (EDC). EDC is a local development corporation organized in 1966according to the not-for-profit corporation law of the State of New York. EDC renders a variety of services and administers certaineconomic development programs on behalf of the City relating to attraction, retention, and expansion of commerce and industryin the City. These services and programs include encouragement of construction, acquisition, rehabilitation and improvement ofcommercial and industrial enterprises within the City, and provide loan guarantees or grants to qualifying business enterprises asa means of helping to create and retain employment therein.
Business Relocation Assistance Corporation (BRAC). BRAC is a not-for-profit corporation incorporated in 1981according to the not-for-profit corporation law of the State of New York for the purpose of implementing and administering theRelocation Incentive Program (RIP) and other related programs. BRAC provides relocation assistance to qualifying commercialand manufacturing firms moving within The City of New York.
The funds for RIP are provided by owners/developers of certain residential projects which cause the relocation of commercialand manufacturing businesses previously located at those sites. These funds consists of conversion contributions or escrowpayments mandated by the City’s zoning resolution for this type of development.
All conversion contributions received by BRAC are restricted for the use of administering industrial retention/relocation programsconsistent with the Zoning Resolution. The program provides grants up to $30,000 to eligible New York City commercial andmanufacturing firms to defray their moving costs. Grants are awarded after a firm completes its relocation. This program will continueto operate only with the current accumulated net assets now available.
Brooklyn Navy Yard Development Corporation (BNYDC). BNYDC was organized in 1966 as a not-for-profit corporationaccording to the not-for-profit corporation law of the State of New York. The primary purpose of BNYDC is to provide economicrehabilitation in Brooklyn to revitalize the economy and create job opportunities. In 1971, BNYDC leased the Brooklyn NavyYard from the City for the purpose of rehabilitating it and attracting new businesses and industry to the area. The Mayor of TheCity of New York appoints the majority of the members of the Board of Directors.
Water And Sewer System:
New York City Water Board (Water Board ) and New York City Municipal Water Finance Authority (Water Authority).The Water and Sewer System (NYW), consisting of two legally separate and independent entities, the Water Board and the WaterAuthority, was established in 1985. NYW provides for water supply and distribution, and sewage collection, treatment, and disposalfor the City. The Water Authority was established to issue debt to finance the cost of capital improvements to the water distributionand sewage collection system. The Water Board was established to lease the water distribution and sewage collection system from
51
NOTES TO FINANCIAL STATEMENTS, Continued

the City and to establish and collect fees, rates, rents, and other service charges for services furnished by the system to produce cashsufficient to pay debt service on the Water Authority’s bonds and to place the Water and Sewer System on a self-sustaining basis.
Note: These organizations publish separate annual financial statements which are available at: Office of the Comptroller, Bureauof Accountancy—Room 800, 1 Centre Street, New York, New York 10007.
2. Basis of Presentation
Government-wide Statements: The government-wide financial statements (i.e., the statement of net assets and the statementof activities), display information about the primary government and its component units. These statements include the financialactivities of the overall government except for fiduciary activities. For the most part, eliminations of internal activity have beenmade in these statements. The primary government is reported separately from certain legally separate component units for whichthe primary government is financially accountable. All of the activities of the City as primary government are governmental activities.
The statement of activities presents a comparison between direct expenses and program revenues for each function of the City’sgovernmental activities. Direct expenses are those that are clearly identifiable with a specific function. Program revenues include:(i) charges for services such as rental revenue from operating leases on markets, ports, and terminals and (ii) grants andcontributions that are restricted to meeting the operational or capital requirements of a particular function or program. Taxes andother revenues not properly included among program revenues are reported as general revenues.
Fund Financial Statements: The fund financial statements provide information about the City’s funds, including fiduciaryfunds and blended component units. Separate statements for the governmental and fiduciary fund categories are presented. Theemphasis of fund financial statements is on major governmental funds, each displayed in a separate column. All remaininggovernmental funds are aggregated and reported as nonmajor funds.
The City uses funds to report on its financial position and the results of its operations. Fund accounting is designed to demonstratelegal compliance and to aid financial management by segregating transactions related to certain government functions or activities.A fund is a separate accounting entity with a self-balancing set of accounts.
Funds are classified into three categories: governmental, fiduciary, and proprietary. Except for proprietary (the onlyorganizations that would be categorized as proprietary funds are reported as component units), each category, in turn, is dividedinto separate “fund types.”
The City reports the following major governmental funds:
General Fund. This is the general operating fund of the City. Substantially all tax revenues, Federal and State aid (exceptaid for capital projects), and other operating revenues are accounted for in the General Fund. This fund also accounts forexpenditures and transfers as appropriated in the Expense Budget, which provides for the City’s day-to-day operations, includingtransfers to Debt Service Funds for payment of long-term liabilities.
New York City Capital Projects Fund. This fund is used to record all revenues, expenditures, assets, and liabilities associatedwith City capital projects. It accounts for resources used to construct or acquire fixed assets and make capital improvements. Resourcesof the New York City Capital Projects Fund are derived principally from proceeds of City, TFA, and TSASC bond issues,payments from the Water Authority, and from Federal, State, and other aid.
General Debt Service Fund. This fund, required by State legislation on January 1, 1979 is administered and maintainedby the State Comptroller into which payments of real estate taxes and other revenues are deposited in advance of debt service paymentdates. Debt service on all City notes and bonds is paid from this fund.
52
NOTES TO FINANCIAL STATEMENTS, Continued

Additionally, the City reports the following fund types:
Fiduciary Funds
The Fiduciary Funds are used to account for assets and activities when a governmental unit is functioning either as a trusteeor an agent for another party. They include the following:
The Pension and Other Employee Benefit Trust Funds account for the operations of:• New York City Employees’ Retirement System (NYCERS)• New York City Teachers’ Retirement System—Qualified Pension Plan (TRS)• New York City Board of Education Retirement System—Qualified Pension Plan (BERS) • New York City Police Department Pension Fund—Subchapter 2 (POLICE)• New York City Fire Department Pension Fund—Subchapter 2 (FIRE)• New York Police Department Police Officers’ Variable Supplements Fund (POVSF)• New York Police Department Police Superior Officers’ Variable Supplements Fund (PSOVSF) • New York Fire Department Firefighters’ Variable Supplements Fund (FFVSF)• New York Fire Department Fire Officers’ Variable Supplements Fund (FOVSF) • Transit Police Officers’ Variable Supplements Fund (TPOVSF)• Transit Police Superior Officers’ Variable Supplements Fund (TPSOVSF) • Housing Police Officers’ Variable Supplements Fund (HPOVSF)• Housing Police Superior Officers’ Variable Supplements Fund (HPSOVSF) • Correction Officers’ Variable Supplements Fund (COVSF)• Deferred Compensation Plan for Employees of The City of New York and Related Agencies and Instrumentalities (DCP)
Note: These organizations publish separate annual financial statements which are available at: Office of the Comptroller, Bureauof Accountancy—Room 800, 1 Centre Street, New York, New York 10007.
These funds use the accrual basis of accounting and a measurement focus on the periodic determination of additions,deductions, and net assets held in trust for benefit payments.
The Agency Funds account for miscellaneous assets held by the City for other funds, governmental units, and individuals.The Agency Funds are custodial in nature and do not involve measurement of results of operations.
Discretely Presented Component Units
The discretely presented component units consist of HHC, OTB, HDC, HA, EDC, NYW and the nonmajor component units.These activities are accounted for in a manner similar to private business enterprises, in which the focus is on the periodic determinationof revenues, expenses, and net income.
New Accounting Standards Adopted
The basic financial statements reflect the City’s adoption in fiscal year 2001, of four new statements of financial accountingstandards issued by the Governmental Accounting Standards Board (GASB):
— Statement No. 33 Accounting and Financial Reporting for Nonexchange Transactions
— Statement No. 34 Basic Financial Statements—and Management’s Discussion and Analysis—for State and LocalGovernments
— Statement No. 37 Basic Financial Statements—and Management’s Discussion and Analysis—for State and LocalGovernments: Omnibus
— Statement No. 38 Certain Financial Statement Disclosures
Statement No. 33 prescribes standards for recording nonexchange transactions on the modified accrual and accrual bases ofaccounting. A significant amount of the City’s revenues are derived from nonexchange transactions, such as real estate, incomeand sales taxes, as well as Federal, State and other categorical aid. The effect of adoption of Statement No. 33 on the nonexchangetransactions recorded as revenue in the City’s governmental funds was insignificant. However, the City recorded in the balance
53
NOTES TO FINANCIAL STATEMENTS, Continued

54
NOTES TO FINANCIAL STATEMENTS, Continued
sheet of its governmental fund financial statements at June 30, 2002 and 2001, $2.831 billion and $3.057 billion, respectively, asreceivables with a corresponding amount reported as deferred revenues. These amounts represent revenues from nonexchangetransactions during the fiscal year which are not available to finance expenditures of the current period. For reporting nonexchangetransactions in the government-wide financial statements on the accrual basis of accounting, the receivables are recorded as describedin the preceding sentence, however, corresponding amounts are reported as revenue instead of deferred revenue. Accordingly, theamounts recognized as revenue in the fund financial statements differs from the amounts recognized as revenue in the government-wide financial statements by the change in deferred revenue in the fund financial statements from the beginning to the end of thefiscal year.
Statement No. 34 (as amended by Statement No. 37) represents a very significant change in the financial reporting modelused by state and local governments.
Statement No. 34 requires government-wide financial statements to be prepared using the accrual basis of accounting andthe economic resources measurement focus. Government-wide financial statements do not provide information by fund oraccount group, but distinguish between the City’s governmental activities and activities of its discretely presented component unitson the statement of net assets and statement of activities. Significantly, the City’s statement of net assets includes both noncurrentassets and noncurrent liabilities of the City, which were previously recorded in the General Fixed Assets Account Group and theGeneral Long-term Obligations Account Group. In addition to the fixed assets previously recorded in the General Fixed AssetsAccount Group, the City retroactively capitalized infrastructure assets that were acquired beginning with fiscal year ended June30, 1981. In addition, the government-wide statement of activities reflects depreciation expense on the City’s fixed assets,including infrastructure.
In addition to the government-wide financial statements, the City has prepared fund financial statements, which continue touse the modified accrual basis of accounting and the current financial resources measurement focus. Accordingly, the accountingand financial reporting for the City’s General Fund, Capital Projects Fund, and Debt Service Funds is similar to that previouslypresented in the City’s financial statements, although the format of financial statements has been modified by Statement No. 34.
Statement No. 34 also requires as required supplementary information Management’s Discussion and Analysis whichincludes an analytical overview of the City’s financial activities. In addition, a budgetary comparison statement is presented thatcompares the adopted and modified General Fund budget with actual results.
Statement No. 38 requires certain disclosures to be made in the notes to the financial statements concurrent with theimplementation of Statement No. 34. While this Statement did not affect amounts reported in the financial statements of the City,certain note disclosures have been added and or amended including descriptions of activities of major funds, violations of legalor contractual provisions, future debt service and lease obligations in five year increments, short-term obligations, interest rates,and interfund balances and transactions.
3. Basis of Accounting
The basis of accounting determines when transactions are reported on the financial statements. The government-widefinancial statements are reported using the economic resources measurement focus and the accrual basis of accounting. Revenuesare recorded when earned and expenses are recorded at the time liabilities are incurred, regardless of when the related cash flowstake place. Nonexchange transactions, in which the City either gives or receives value without directly receiving or giving equalvalue in exchange, include (for example, sales and income taxes, property taxes, grants, entitlements, and donations). On an accrualbasis, revenue from sales and income taxes are recognized when the underlying exchange transaction takes place. Revenue fromproperty taxes is recognized in the fiscal year for which the taxes are levied. Revenue from grants, entitlements, and donations isrecognized in the fiscal year in which all eligibility requirements have been satisfied.
Governmental fund types use the flow of current financial resources measurement focus. This focus is on the determinationof, and changes in financial position, and generally only current assets and current liabilities are included on the balance sheet.These funds use the modified accrual basis of accounting, whereby revenues are recognized in the accounting period in whichthey become both measurable and available to finance expenditures of the fiscal period. Revenues from taxes are generally consideredavailable if received within two months after the fiscal year-end. Revenues from categorical and other grants are generallyconsidered available if received within one year after the fiscal year-end. Expenditures are recorded when the related liability isincurred and payment is due, except for principal and interest on long-term debt and certain estimated liabilities which are recordedonly when payment is due.

55
NOTES TO FINANCIAL STATEMENTS, Continued
The measurement focus of the Pension and Other Employee Benefit Trust Funds is on the flow of economic resources. Thisfocus emphasizes the determination of net income, changes in net assets, and financial position. With this measurement focus,all assets and liabilities associated with the operation of these funds are included on the balance sheet. These funds use the accrualbasis of accounting whereby revenues are recognized in the accounting period in which they are earned, and expenses arerecognized in the period incurred. The Pension Trust Funds’ contributions from members are recorded when the employer makespayroll deductions from Plan members. Employer contributions are recognized when due. Benefits and refunds are recognizedwhen due and payable in accordance with the terms of the Plans.
In accordance with GASB Statement No. 20, Accounting and Financial Reporting for Proprietary Funds and OtherGovernmental Activities That Use Proprietary Fund Accounting, the discretely presented component units have elected not to applyFinancial Accounting Standards Board statements and interpretations issued after November 30, 1989.
The Agency Funds use the modified accrual basis of accounting and do not measure the results of operations.
4. Encumbrances
Encumbrance accounting, under which purchase orders, contracts, and other commitments for expenditures are recorded toreflect the use of the applicable spending appropriations, is used by the General Fund during the fiscal year to control expenditures.The cost of those goods received and services rendered on or before June 30 are recognized as expenditures. Encumbrances notresulting in expenditures by year-end, lapse.
5. Cash and Investments
The City considers all highly liquid investments (including restricted assets) with a maturity of three months or less whenpurchased, to be cash equivalents.
Cash and cash equivalents include compensating balances maintained with certain banks in lieu of payments for services rendered.The average compensating balances maintained during fiscal years 2002 and 2001 were approximately $777 million and $226million, respectively.
Most investments are reported in the balance sheet at fair value. Investment income, including changes in the fair value ofinvestments, is reported in operations.
Investments in fixed income securities are recorded at fair value. Securities purchased pursuant to agreements to resell arecarried at the contract price, exclusive of interest, at which the securities will be resold.
Investments of the Pension and Other Employee Benefit Trust Funds are reported at fair value. Investments are stated at thelast reported sales price on a national securities exchange on the last business day of the fiscal year.
A description of the City’s securities lending activities for the Pension and Other Employee Benefit Trust Funds in fiscal years2002 and 2001 is provided in Deposits and Investments (see Note D.1.).
6. Inventories
Inventories on hand at June 30, 2002 and 2001 (estimated at $210 million and $198 million, respectively, based on averagecost) have been reported on the governmental-wide financial statement of net assets. Inventories are recorded as expenditures ingovernmental funds at the time of purchase and accordingly, have not been reported on the governmental funds balance sheet.
7. Restricted Cash and Investments
Certain proceeds of component unit bonds, as well as certain resources set aside for bond repayment, are classified as restrictedcash and investments on the balance sheet because their use is limited by applicable bond covenants.

8. Capital Assets
Capital assets and improvements include substantially all land, buildings, equipment, water distribution and sewage collectionsystem, and other elements of the City’s infrastructure having a minimum useful life of five years, having a cost of more than $35,000,and having been appropriated in the Capital Budget (see Note C.1.). Capital assets which are used for general governmental purposesand are not available for expenditure are accounted for and reported in the government-wide financial statements. These statementsalso contain the City’s infrastructure elements that are now required to be capitalized under GAAP. Infrastructure elements includethe roads, bridges, curbs and gutters, streets and sidewalks, park land and improvements, and tunnels. The fixed assets of the waterdistribution and sewage collection system are recorded in the Water and Sewer System component unit financial statements undera lease agreement between the City and the Water Board.
Capital assets are generally stated at historical cost, or at estimated historical cost based on appraisals or on other acceptablemethods when historical cost is not available. Donated fixed assets are stated at their fair market value as of the date of the donation.Capital leases are classified as capital assets in amounts equal to the lesser of the fair market value or the present value of net minimumlease payments at the inception of the lease (see Note D.3.).
Accumulated depreciation and amortization are reported as reductions of fixed assets. Depreciation is computed using thestraight-line method based upon estimated useful lives of 40 to 50 years for buildings; 5 to 35 years for equipment; and 15 to 50years for infrastructure. Capital lease assets and leasehold improvements are amortized over the term of the lease or the life ofthe asset, whichever is less.
9. Allowance for Uncollectible Mortgage Loans
Mortgage loans and interest receivable in the Debt Service Funds are net of an allowance for uncollectible amounts of $752.3million and $750.1 million for fiscal years 2002 and 2001, respectively. The allowance is composed of the balance of first mortgagesone or more years in arrears and the balance of refinanced mortgages where payments to the City are not expected to be completedfor approximately 25 to 30 years.
10. Vacation and Sick Leave
Earned vacation and sick leave is recorded as an expenditure in the period when it is payable from current financial resourcesin the fund financial statements. The estimated value of vacation leave earned by employees which may be used in subsequentyears or earned vacation and sick leave paid upon termination or retirement, and therefore payable from future resources, is recordedas a liability in the government-wide financial statements.
11. Treasury Obligations
Bonds payable included in the government-wide financial statements and investments in the Debt Service Funds are reportednet of “treasury obligations.” Treasury obligations represent City bonds held as investments of the Debt Service Funds which areoffset and reported as if these bonds had been redeemed.
12. Judgments and Claims
The City is uninsured with respect to risks including, but not limited to, property damage, personal injury, and workers’compensation. In the fund financial statements, expenditures for judgments and claims (other than workers’ compensation andcondemnation proceedings) are recorded on the basis of settlements reached or judgments entered within the current fiscal year.Expenditures for workers’ compensation are recorded when paid. Settlements relating to condemnation proceedings are reportedwhen the liability is estimable. In the government-wide financial statements, the estimated liability for all judgments and claimsis recorded as a liability.
13. Long-term Liabilities
For long-term liabilities, only that portion expected to be financed from expendable available financial resources is reportedas a fund liability of a governmental fund. All long-term liabilities are reported in the government-wide financial statement of netassets. Long-term liabilities expected to be financed from discretely presented component unit operations are accounted for in thosecomponent unit financial statements.
56
NOTES TO FINANCIAL STATEMENTS, Continued

14. Real Estate Tax
Real estate tax payments for the fiscal year ended June 30, 2002 were due July 1, 2001 and January 1, 2002 except that paymentsby owners of real property assessed at $80,000 or less and cooperatives whose individual units on average are valued at $80,000or less were due in quarterly installments on the first day of each quarter beginning on July 1.
The levy date for fiscal year 2002 taxes was June 7, 2001. The lien date is the date taxes are due.
Real estate tax revenue represents payments received during the year and payments received (against the current fiscal yearand prior years’ levies) within the first two months of the following fiscal year reduced by tax refunds for the fund financial statements.Additionally, the government-wide financial statements recognize real estate tax revenue (net of refunds) which are not availableto the governmental fund type in the fiscal year for which the taxes are levied.
The City offered the usual discount of 2% for the prepayment of real estate taxes for fiscal years 2003 and 2002. Collectionsof these real estate taxes received on or before June 30, 2002 and 2001 were $1,374 million and $1,452 million, respectively. Theseamounts were recorded as deferred revenue.
The City sold approximately $53.5 million of real property tax liens, fully attributable to fiscal year 2002, at various datesin fiscal year 2002. As in prior year’s lien sale agreements, the City will refund the value of liens later determined to be defective,plus interest and a 5% surcharge. It has been again estimated that $8.6 million worth of liens sold in fiscal year 2002 will requirereplacement. The estimated refund accrual amount of $9 million, including the surcharge and interest, results in fiscal year 2002sale proceeds of $44.5 million.
In fiscal year 2002, $12.9 million, including the surcharge and interest, was refunded for defective liens from the fiscal year2001 sale. This resulted in a decrease to fiscal year 2002 revenue of $3.9 million for the refund amount in excess of the fiscal year2001 accrual of $9 million and decreased the proceeds of the fiscal year 2001 sale to $201 million down from the original fiscalyear 2001 proceeds reported last year of $204.9 million.
The City sold approximately $213.9 million of real property tax liens, fully attributable to fiscal year 2001, at various datesin fiscal year 2001. As in prior year’s lien sale agreements, the City will refund the value of liens later determined to be defective,plus interest and a 5% surcharge. It has been estimated that $8.6 million worth of liens sold in fiscal year 2001 will require replacement.The estimated refund accrual amount of $9 million, including the surcharge and interest, results in fiscal year 2001 sale proceedsof $204.9 million.
In fiscal year 2001, $15.1 million, including the surcharge and interest, was refunded for defective liens from the fiscal year2000 sale. This resulted in a decrease to fiscal year 2001 revenue of $9.1 million for the refund amount in excess of the fiscal year2000 accrual of $6 million and decreased the proceeds of the fiscal year 2000 sale to $49.9 million down from the original fiscalyear 2000 proceeds reported last year of $59 million.
In fiscal years 2002 and 2001, $343 million and $363 million, respectively, were provided as allowances for uncollectiblereal estate taxes against the balance of the receivable. Delinquent real estate taxes receivable that are estimated to be collectiblebut which are not collected in the first two months of the next fiscal year are recorded as deferred revenues in the governmentalfunds balance sheet but included in general revenues on the government-wide statement of activities.
The City is permitted to levy real estate taxes for general operating purposes in an amount up to 2.5% of the average full valueof taxable real estate in the City for the last five years and in unlimited amounts for the payment of principal and interest on long-term City debt. Amounts collected for payment of principal and interest on long-term debt in excess of that required for that purposein the year of the levy must be applied towards future years’ debt service. For the fiscal years ended June 30, 2002 and 2001, excessamounts of $509 million and $917 million, respectively, were transferred to the Debt Service Funds.
15. Other Taxes and Other Revenues
Taxpayer-assessed taxes, such as sales and income taxes, net of refunds, are recognized in the accounting period in whichthey become susceptible to accrual for the fund financial statements. Additionally, the government-wide financial statements recognizesales and income taxes (net of refunds) which are not available to the governmental fund type in the accounting period for whichthe taxes are assessed.
57
NOTES TO FINANCIAL STATEMENTS, Continued

58
NOTES TO FINANCIAL STATEMENTS, Continued
16. Federal, State, and Other Aid
For the government-wide and fund financial statements, categorical aid, net of a provision for estimated disallowances, isreported as receivables when the related eligibility requirements are met. Unrestricted aid is reported as revenue in the fiscal yearof entitlement.
17. Bond Discounts/Issuance Costs
In governmental fund types, bond discounts and issuance costs are recognized as expenditures in the period incurred. Bonddiscounts and issuance costs in the government-wide financial statements units are deferred and amortized over the term of thebonds using the bonds-outstanding method, which approximates the effective interest method. Bond discounts are presented asa reduction of the face amount of bonds payable, whereas issuance costs are recorded as deferred charges.
18. Intra-entity Activity
Payments from a fund receiving revenue to a fund through which the revenue is to be expended are reported as operating transfers.Such payments include transfers for debt service and capital construction. In the government-wide financial statements, resourceflows between the primary government and the discretely presented component units are reported as if they were externaltransactions.
19. Subsidies
The City makes various payments to subsidize a number of organizations which provide services to City residents. Thesepayments are recorded as expenditures in the year paid.
20. Pensions
Pension cost is required to be measured and disclosed using the accrual basis of accounting (see Note E.5.), regardless ofthe amount recognized as pension expense on the modified accrual basis of accounting. Annual pension cost should be equal tothe annual required contributions to the pension plan, calculated in accordance with certain parameters.
21. Reclassifications
Reclassifications and adjustments of certain prior year amounts have been made to conform with the current year presentationand separately issued financial statements of reported entities. In addition, the amounts reported as invested in capital assets netof related debt and unrestricted (deficit) net assets for the Primary Government — Governmental Activities on the Statement ofNet Assets as of June 30, 2001 have been restated to conform with the current year’s calculation. Specifically, debt of blendedcomponent units has been allocated between that which relates to capital assets and that which is reported as unrestricted.Invested in capital assets, net of related debt was originally reported as a negative $8.1 billion and has now been reported as a negative$2.4 billion. The unrestricted deficit was originally reported as $15.5 billion and has now been reported as $21.2 billion. The totalnet deficit reported as of June 30, 2001 is unchanged.
22. Estimates and Assumptions
A number of estimates and assumptions relating to the reporting of revenues, expenditures, assets and liabilities, and the disclosureof contingent liabilities were used to prepare these financial statements in conformity with GAAP. Actual results could differ fromthose estimates.
23. Pronouncements Issued But Not Yet Effective
In May, 2002, GASB issued Statement No. 39, Determining Whether Certain Organizations Are Component Units — anamendment of GASB Statement No. 14. The Statement amends Statement No. 14, The Financial Reporting Entity, to provide additionalguidance to determine whether certain organizations for which the primary government is not financially accountable should bereported as component units based on the nature and significance of their relationship with the primary government. Generally,it requires reporting, as a component unit, an organization that raises and holds economic resources for the direct benefit of agovernmental unit.
Organizations that are legally separate, tax-exempt entities and that meet all of the following criteria should be discretelypresented as component units. These criteria are:
• The economic resources received or held by the separate organization are entirely or almost entirely for the direct benefit ofthe primary government, its component units, or its constituents.
• The primary government, or its component units, is entitled to, or has the ability to otherwise access, a majority of the economicresources received or held by the separate organization.
• The economic resources received or held by an individual organization that the specific primary government, or its componentunits, is entitled to, or has the ability to otherwise access, are significant to that primary government.
The Statement continues the requirement in Statement No. 14 to apply professional judgment in determining whether therelationship between a primary government and other organizations for which the primary government is not financiallyaccountable and that do not meet these criteria is such that exclusion of the organization would render the financial statements ofthe reporting entity misleading or incomplete. Those component units should be reported based on the existing blending and discretepresentation display requirements of Statement No. 14.
The provisions of Statement No. 39 are effective for financial statements for periods beginning after June 15, 2003. While earlierapplication is encouraged, the City has not completed the process of evaluating the impact that will result from adopting this statement,and therefore, is unable to disclose the impact that adopting this statement will have on its financial position and results ofoperations when such statement is adopted.
B. RECONCILIATION OF GOVERNMENT-WIDE AND FUND FINANCIAL STATEMENTS
A summary reconciliation of the difference between total fund balances as reflected on the governmental funds balance sheetand total net deficit of governmental activities as shown on the government-wide statement of net assets is presented in anaccompanying schedule to the governmental funds balance sheet. The asset and liability elements which comprise the reconciliationdifference stem from governmental funds using the current financial resources measurement focus and the modified accrual basisof accounting while the government-wide financial statements use the economic resources measurement focus and the accrual basisof accounting.
A summary reconciliation of the difference between net change in fund balances as reflected on the governmental funds statementof revenues, expenditures, and changes in fund balances and change in net assets of governmental activities as shown on the government-wide statement of activities is presented in an accompanying schedule to the governmental funds statement of revenues, expenditures,and changes in fund balances. The revenue and expense elements which comprise the reconciliation difference stem fromgovernmental funds using the current financial resources measurement focus and the modified accrual basis of accounting whilethe government-wide financial statements use the economic resources measurement focus and the accrual basis of accounting.
C. STEWARDSHIP, COMPLIANCE, AND ACCOUNTABILITY
1. Budgets and Financial Plans
Budgets
Annual Expense Budget appropriations, which are prepared on the modified accrual basis, are adopted for the General Fund,and unused appropriations lapse at fiscal year-end. The City uses appropriations in the Capital Budget to authorize the expenditureof funds for various capital projects. Capital appropriations, unless modified or rescinded, remain in effect until the completionof each project.
The City is required by State Law to adopt and adhere to a budget, on a basis consistent with GAAP, that would not haveGeneral Fund expenditures in excess of revenues.
Expenditures made against the Expense Budget are controlled through the use of quarterly spending allotments and units ofappropriation. A unit of appropriation represents a subdivision of an agency’s budget and is the level of control at whichexpenditures may not legally exceed the appropriation. The number of units of appropriation and the span of operating responsibilitywhich each unit represents, differs from agency to agency depending on the size of the agency and the level of control required.
59
NOTES TO FINANCIAL STATEMENTS, Continued

60
NOTES TO FINANCIAL STATEMENTS, Continued
Transfers between units of appropriation and supplementary appropriations may be made by the Mayor subject to the approvalprovisions set forth in the City Charter. Supplementary appropriations increased the Expense Budget by $2,374 million and $3,513million subsequent to its original adoption in fiscal years 2002 and 2001, respectively.
Financial Plans
The New York State Financial Emergency Act for The City of New York, as amended in 1978, requires the City to operateunder a “rolling” Four-Year Financial Plan (Plan). Revenues and expenditures, including operating transfers, of each year of thePlan are required to be balanced on a basis consistent with GAAP. The Plan is broader in scope than the Expense Budget; it comprisesGeneral Fund revenues and expenditures, Capital Projects Fund revenues and expenditures, and all short and long-term financing.
The Expense Budget is generally consistent with the first year of the Plan and operations under the Expense Budget mustreflect the aggregate limitations contained in the approved Plan. The City reviews its Plan periodically during the year and, if necessary,makes modifications to incorporate actual results and revisions to assumptions.
2. Deficit Fund Balance
The New York City Capital Projects Fund has cumulative deficits of $1.5 billion and $2.1 billion at June 30, 2002 and 2001,respectively. These deficits represent the amounts expected to be financed from future bond issues or intergovernmentalreimbursements. To the extent the deficits will not be financed or reimbursed, a transfer from the General Fund will be required.
D. DETAILED NOTES ON ALL FUNDS
1. Deposits and Investments
Deposits
The City’s bank depositories are designated by the Banking Commission, which consists of the Comptroller, the Mayor, andthe Finance Commissioner. Independent bank rating agencies are used to determine the financial soundness of each bank, and theCity’s banking relationships are under periodic operational and credit reviews.
The City Charter limits the amount of deposits at any time in any one bank or trust company to a maximum of one-half ofthe amount of the capital and net surplus of such bank or trust company. The discretely presented component units included inthe City’s reporting entity maintain their own banking relationships which generally conform with the City’s. Bank balances arecurrently insured up to $100,000 in the aggregate by the Federal Deposit Insurance Corporation (FDIC) for each bank for all fundsother than monies of the retirement systems, which are held by well-capitalized banks and are insured by the FDIC up to$100,000 per retirement system member. At June 30, 2002 and 2001, the carrying amount of the City’s cash and cash equivalentswas $1,381 million and $1,576 million, respectively, and the bank balances were $993 million and $1,341 million, respectively.Of the bank balances, $151 million and $571 million, respectively, were covered by Federal depository insurance and $200 millionand $770 million, respectively, were uninsured and collateralized with securities held by the City’s agent in the City’s name. Ofthe bank balances, $642 million was uninsured and uncollateralized for fiscal year 2002. At June 30, 2002 and 2001, the carryingamount of the discretely presented component units’ cash and cash equivalents was $1,244 million and $529 million, respectively,and the bank balances were $112 million and $103 million, respectively. Of the bank balances, $21 million and $4 million, respectively,were covered by Federal depository insurance and $54 million and $90 million, respectively, were uninsured and collateralizedwith securities held by the City’s agent in the City’s name. Of the bank balances, $37 million and $9 million, respectively, wereuninsured and uncollaterized.
The uninsured, collateralized and the uninsured, uncollateralized cash balances carried during the year represent primarilythe compensating balances to be maintained at banks for services provided. It is the policy of the City to invest all funds in excessof compensating balance requirements.
Investments
The City’s investment of cash in its governmental fund types is currently limited to U.S. Government guaranteed securitiesand U.S. Government agency securities purchased directly and through repurchase agreements from primary dealers as well ascommercial paper rated A1 and P1 by Standard & Poor’s Corporation and Moody’s Investors Service, Inc., respectively. The repurchaseagreements must be collateralized by U.S. Government guaranteed securities, U.S. Government agency securities, or eligiblecommercial paper in a range of 100% to 102% of the matured value of the repurchase agreements.

The investment policies of the discretely presented component units included in the City’s reporting entity generally conformto those of the City’s. The criteria for the Pension and Other Employee Benefit Trust Funds’ investments are as follows:
1. Fixed income investments may be made in U.S. Government guaranteed securities or securities of U.S. Government agencies,securities of companies rated BBB or better by both Standard and Poor’s Corporation and Moody’s Investors Service,Inc., and any bond that meets the qualifications of the New York State Retirement and Social Security Law, the New YorkState Banking Law, and the New York City Administrative Code.
2. Equity investments may be made only in those stocks that meet the qualifications of the New York State Retirement andSocial Security Laws, the New York State Banking Law, and the New York City Administrative Code.
3. Short-term investments may be made in the following:
a. U.S. Government guaranteed securities or U.S. Government agency securities.
b. Commercial paper rated A1 or P1 or F1 by Standard & Poor’s Corporation or Moody’s Investors Service, Inc. or Fitch,respectively.
c. Repurchase agreements collateralized in a range of 100% to 102% of matured value, purchased from primary dealersof U.S. Government securities.
d. Investments in bankers’ acceptances, certificates of deposit, and time deposits are limited to banks with worldwideassets in excess of $50 billion that are rated within the highest categories of the leading bank rating services and selectedregional banks also rated within the highest categories.
4. Investments up to 15% of total pension fund assets in instruments not specifically covered by the New York StateRetirement and Social Security Law.
5. No investment in any one corporation can be: (i) more than 2% of the pension plan net assets; or (ii) more than 5% ofthe total outstanding issues of the corporation.
All investments are held by the City’s custodial banks (in bearer or book-entry form) solely as agent of the Comptroller ofThe City of New York on behalf of the various account owners. Payments for purchases are not released until evidence ofownership of the underlying investments are received by the City’s custodial bank.
Investments of the City and its discretely presented component units are categorized by level of credit risk (the risk that acounterparty to an investment transaction will not fulfil its obligations). Category 1, the lowest risk, includes investments that areinsured or registered or for which securities are held by the entity or its agent in the entity’s name. Category 2, includesinvestments that are uninsured and unregistered with securities held by the counterparty’s trust department or agent in the entity’sname. Category 3, the highest risk, includes investments that are uninsured and unregistered with securities held by the counterparty,or by its trust department or agent but not in the entity’s name.
61
NOTES TO FINANCIAL STATEMENTS, Continued

62
NOTES TO FINANCIAL STATEMENTS, Continued
The City’s investments, including those of the discretely presented component units (CU), as of June 30, 2002 and 2001 areclassified as follows:
2002_______________________________________________________________________________________________________
TotalCategory Carrying Fair_________________________________________________________________________________________________________________________
1 2 3 Amount Value________________________ ________________________ ________________________ ________________________ ________________________City CU City CU City CU City CU City CU_________ _________ _________ _________ _________ _________ _________ _________ _________ _________
(in millions)Repurchase agreements . . . $ 595 $ 65 $ — $ — $ — $ — $ 595 $ 65 $ 595 $ 65U.S. Governmentsecurities . . . . . . . . . . . . . . 15,556 46 — — — — 15,556 46 15,558 46
Commercial paper . . . . . . . 4,779 40 — — — — 4,779 40 4,779 40Corporate bonds . . . . . . . . . 12,047 — — — — — 12,047 — 12,047 —Corporate stocks . . . . . . . . . 45,013 — — — — — 45,013 — 45,013 —Agency discount notes . . . . 516 420 — — — — 516 420 517 420Open time deposits . . . . . . . — 3 — — — — — 3 — 3Securities lendinginvestment collateral(categorized):Repurchase agreements . . 396 — — — — — 396 — 396 —U.S. Governmentsecurities . . . . . . . . . . . . 16 — — — — — 16 — 16 —
Commercial paper . . . . . 1,034 — — — — — 1,034 — 1,033 —Corporate bonds . . . . . . . 3,960 — — — — — 3,960 — 3,960 —Certificates of deposit . . . 2,272 — — — — — 2,272 — 2,272 —Money markets . . . . . . . . 124 — — — — — 124 — 124 —Uninvested cash . . . . . . . 1 — — — — — 1 — 1 —Promissory Notes . . . . . . 101 — — — — — 101 — 101 —Agency discount notes . . 1 — — — — — 1 — 1 —Open time deposits . . . . . 1,092 — — — — — 1,092 — 1,092 —Corporate stocks . . . . . . . 37 — — — — — 37 — 37 —______________ ______________ ______________ ______________ ______________ ______________ ______________ ______________ ______________ ______________
$ 87,540 $ 574 $ — $ — $ — $ — 87,540 574 87,542 574______________ ______________ ______________ ______________ ______________ ____________________________ ______________ ______________ ______________ ______________ ______________Mutual funds (1) . . . . . . . . . 3,048 — 3,048 —International investmentfund—equity (1) . . . . . . . . 12,090 — 12,090 —
Guaranteed investmentcontracts (1) . . . . . . . . . . . 1,519 — 1,519 —
Management investmentcontracts (1) . . . . . . . . . . 173 — 173 —
Short-term investmentfund (1) . . . . . . . . . . . . . . . 2,146 — 2,146 —
Tier 3 and 4 loans (1) . . . . . 57 — 57 —Small mortgages (1) . . . . . . 3 — 3 —Securities lendinginvestment collateral(uncategorized):Mutual funds (1) . . . . . . . 691 — 691 —Guaranteed investmentcontracts (1) . . . . . . . . . 18 — 18 —
Short-term investment fund (1) 43 — 43 —______________ ______________ ______________ ______________Total investments . . . . . $107,328 $ 574 $107,330 $ 574)______________ ______________ ______________ ____________________________ ______________ ______________ ______________
(1) These investments are not categorized because they are not evidenced by securities that exist in physical or book entry form.
In fiscal year 2002, the restricted cash and cash equivalents applicable to the governmental funds was $1,170 million of whichthe repayment of $1,170 million was insured or collateralized and none was uninsured and uncollateralized. There were no restrictedgovernmental funds investments for fiscal year 2002.
In fiscal year 2002, the restricted cash, cash equivalents, and investments applicable to discretely presented component unitsinclude $368 million of cash and cash equivalents, of which the repayment of $296 million was insured or collateralized and $721 million was uninsured and uncollateralized. Restricted investments, principally in U.S. Government securities with a costand approximate fair value of $2,815 million are fully registered with securities held by the City’s agent in the entity’s name ofwhich $1,701 million have maturities of three months or less.

2001_______________________________________________________________________________________________________
TotalCategory Carrying Fair_________________________________________________________________________________________________________________________
1 2 3 Amount Value________________________ ________________________ ________________________ ________________________ ________________________City CU City CU City CU City CU City CU_________ _________ _________ _________ _________ _________ _________ _________ _________ _________
(in millions)Repurchase agreements . . . $ 1,947 $ 62 $ — $ — $ — $ — $ 1,947 $ 62 $ 1,947 $ 62U.S. Governmentsecurities . . . . . . . . . . . . . . 17,958 1,091 — — — — 17,958 1,091 17,959 1,091
Commercial paper . . . . . . . 4,258 — — — — — 4,258 — 4,259 —Corporate bonds . . . . . . . . . 13,744 — — — — — 13,744 — 13,744 —Corporate stocks . . . . . . . . . 53,119 — — — — — 53,119 — 53,119 —Agency discount notes . . . . 535 279 — — — — 535 279 534 279Certificates of deposit . . . . . — 33 — — — — — 33 — 33Securities lending investment collateral (categorized):Repurchase agreements . . 348 — — — — — 348 — 348 —U.S. Governmentsecurities . . . . . . . . . . . . 26 — — — — — 26 — 26 —
Commercial paper . . . . . 3,159 — — — — — 3,159 — 3,159 —Corporate bonds . . . . . . . 2,601 — — — — — 2,601 — 2,601 —Certificates of deposit . . . 2,182 — — — — — 2,182 — 2,182 —Money markets . . . . . . . . 232 — — — — — 232 — 232 —Uninvested cash . . . . . . . 5 — — — — — 5 — 5 —Promissory Notes . . . . . . 430 — — — — — 430 — 430 —Loan Participation . . . . . 4 — — — — — 4 — 4 —Open time deposits . . . . . 381 — — — — — 381 — 381 —Corporate stocks . . . . . . . 203 — — — — — 203 — 203 —______________ __________ __________ __________ __________ ___________ ______________ ____________ ______________ ____________
$101,132 $1,465 $ — $ — $ — $ — 101,132 1,465 101,133 1,465______________ __________ __________ __________ __________ _________________________ __________ __________ __________ __________ ___________Mutual funds (1) . . . . . . . . . 4,552 — 4,552 —International investment fund—equity (1) . . . . . . . . 12,973 — 12,973 —
Guaranteed investmentcontracts (1) . . . . . . . . . . . 1,043 — 1,043 —
Management investmentcontracts (1) . . . . . . . . . . . 98 — 98 —
Short-term investmentfund (1) . . . . . . . . . . . . . . . 2,791 — 2,791 —
Small mortgages (1) . . . . . . 9 — 9 —______________ ____________ ______________ ____________Total investments . . . . $122,598 $ 1,465 $122,599 $ 1,465______________ ____________ ______________ __________________________ ____________ ______________ ____________
(1) These investments are not categorized because they are not evidenced by securities that exist in physical or book entry form.
In fiscal year 2001, the restricted cash and cash equivalents applicable to the governmental funds was $251 million of whichthe repayment of $251 million was insured or collateralized and none was uninsured and uncollateralized. There were norestricted governmental funds investments for fiscal year 2001.
In fiscal year 2001, the restricted cash, cash equivalents, and investments applicable to discretely presented component unitsinclude $404 million of cash and cash equivalents, of which the repayment of $401 million was insured or collateralized and $3million was uninsured and uncollateralized. Restricted investments, principally in U.S. Government securities with a cost andapproximate fair value of $1,999 million are fully registered with securities held by the City’s agent in the entity’s name of which$241 million have maturities of three months or less.
63
NOTES TO FINANCIAL STATEMENTS, Continued

Securities Lending
State statutes and boards of trustees policies permit the Pension and Retirement Systems and certain Variable SupplementsFunds (Systems and Funds) to lend their securities (the underlying securities) to brokers-dealers and other entities with asimultaneous agreement to return the collateral for the same securities in the future. The Systems’ and Funds’ custodians lend thefollowing types of securities: short-term securities, common stock, long-term corporate bonds, U.S. Government and U.S. Government agencies’ bonds, asset-backed securities, and international equities and bonds held in collective investment funds.Securities on loan at year-end are classified as a Category 1 risk in the preceding schedule of custodial credit risk. Internationalsecurities are uncategorized. In return, they receive collateral in the form of cash at 100%-105% of the principal plus accrued interestfor reinvestment. At year-end, the Systems and Funds had no credit risk exposure to borrowers because the amounts the Systemsand Funds owe the borrowers exceed the amounts the borrowers owe the Systems and Funds. The contracts with the Systems’ andFunds’ custodian requires borrowers to indemnify the Systems and Funds if the borrowers fail to return the securities, if the collateralis inadequate, and if the borrowers fail to pay the Systems and Funds for income distributions by the securities’ issuers while thesecurities are on loan.
All securities loans can be terminated on demand within a period specified in each agreement by either the Systems and Fundsor the borrowers. Cash collateral is invested in the lending agents’ short-term investment pools, which have a weighted-averagematurity of 90 days. The underlying securities (fixed income) have an average maturity of 10 years except for the TRS securitieslending program discussed below which has an average maturity of 5 years.
In addition, TRS administers a securities lending program for TRS and BERS Variable A investment program which is comparableto the securities lending program discussed above.
The City reports securities loaned as assets on the Statement of Fiduciary Net Assets. Cash received as collateral on securitieslending transactions and investments made with that cash are also recorded as assets. Liabilities resulting from these transactionsare reported on the Statement of Fiduciary Net Assets. Accordingly, the City records the investments purchased with the cash collateralas Investments, Collateral From Securities Lending Transactions with a corresponding liability as Securities Lending Transactions.
64
NOTES TO FINANCIAL STATEMENTS, Continued

65
NOTES TO FINANCIAL STATEMENTS, Continued
2. Capital Assets
The following is a summary of capital assets activity for the fiscal years ended June 30, 2001 and 2002:
Balance Balance BalanceJune 30, June 30, June 30,
Primary Government 2000 Additions Deletions 2001 Additions Deletions 2002_________________________________ ____________ ___________ __________ _____________ ___________ ____________ ____________(in thousands)
Governmental activities:Capital assets, not being
depreciated:Land . . . . . . . . . . . . . . . . . . . . $ 707,068 $ 30,006 $ 3,220 $ 733,854 $ 3,029 $ — $ 736,883Construction work-in-
progress . . . . . . . . . . . . . . . . 6,984,982 2,474,041 2,598,403 6,860,620 2,420,923 2,084,784 7,196,759___________________ _________________ _________________ ___________________ _________________ _________________ ___________________
Total capital assets, not being depreciated . . . . . . . . 7,692,050 2,504,047 2,601,623 7,594,474 2,423,952 2,084,784 7,933,642___________________ _________________ _________________ ___________________ _________________ _________________ ___________________
Capital assets, being depreciated:Buildings . . . . . . . . . . . . . . . . 15,139,258 2,598,403 52,722 17,684,939 2,633,299 466,077 19,852,161Equipment . . . . . . . . . . . . . . . 5,135,765 404,143 109,062 5,430,846 707,379 571,876 5,566,349Infrastructure . . . . . . . . . . . . . 8,365,006 458,628 — 8,823,634 881,227 207,566 9,497,295___________________ _________________ _________________ ___________________ _________________ _________________ ___________________Total capital assets, being
depreciated . . . . . . . . . . . . . 28,640,029 3,461,174 161,784 31,939,419 4,221,905 1,245,519 34,915,805___________________ _________________ _________________ ___________________ _________________ _________________ ___________________Less accumulated
depreciation:Buildings . . . . . . . . . . . . . . . . 7,249,784 725,207 — 7,974,991 648,096 23,734 8,599,353Equipment . . . . . . . . . . . . . . . 3,489,923 341,753 — 3,831,676 425,973 213,735 4,043,914Infrastructure . . . . . . . . . . . . . 3,053,825 176,040 — 3,229,865 480,400 163,156 3,547,109___________________ _________________ _________________ ___________________ _________________ _________________ ___________________Total accumulated
depreciation . . . . . . . . . . . . 13,793,532 1,243,000(1) — 15,036,532 1,554,469(1) 400,625 16,190,376___________________ _________________ _________________ ___________________ _________________ _________________ ___________________Total capital assets, being
depreciated, net . . . . . . . . . . . 14,846,497 2,218,174 161,784 16,902,887 2,667,436 844,894 18,725,429___________________ _________________ _________________ ___________________ _________________ _________________ ___________________Governmental activities
capital assets, net . . . . . . . . . . $22,538,547 $4,722,221 $2,763,407 $24,497,361 $5,091,388 $2,929,678 $26,659,071___________________ _________________ _________________ ___________________ _________________ _________________ ______________________________________ _________________ _________________ ___________________ _________________ _________________ ___________________
(1) Depreciation expense was charged to functions/programs of the City for the fiscal years ended June 30, 2002 and 2001 asfollows:
2002 2001____________ ____________(in thousands)
Governmental activities:General government . . . . . . . . . . . . . . . . . . . . . . . . . . . . . . . . . . $ 267,908 $ 168,503Public safety and judicial . . . . . . . . . . . . . . . . . . . . . . . . . . . . . . 144,972 119,753Education . . . . . . . . . . . . . . . . . . . . . . . . . . . . . . . . . . . . . . . . . . 297,499 377,447City University . . . . . . . . . . . . . . . . . . . . . . . . . . . . . . . . . . . . . . 10,727 7,878Social services . . . . . . . . . . . . . . . . . . . . . . . . . . . . . . . . . . . . . . 61,140 39,213Environmental protection . . . . . . . . . . . . . . . . . . . . . . . . . . . . . 186,915 193,570Transportation services . . . . . . . . . . . . . . . . . . . . . . . . . . . . . . . 385,748 223,479Parks, recreation and cultural activities . . . . . . . . . . . . . . . . . . . 175,844 86,943Health . . . . . . . . . . . . . . . . . . . . . . . . . . . . . . . . . . . . . . . . . . . . . 12,676 11,815Libraries . . . . . . . . . . . . . . . . . . . . . . . . . . . . . . . . . . . . . . . . . . . 11,040 14,399_________________ _________________Total depreciation expense—governmental activities . . . . . . . . $1,554,469 $1,243,000_________________ __________________________________ _________________

The following are the sources of funding for the governmental activities capital assets for the fiscal years ended June 30, 2002and 2001. Sources of funding for capital assets are not available prior to fiscal year 1987.
2002 2001____________ ___________(in thousands)
Capital Projects Funds:Prior to fiscal year 1987 . . . . . . . . . . . . . . . . . . . . . . . . . . . . . . . $ 6,060,573 $ 6,467,109City bonds . . . . . . . . . . . . . . . . . . . . . . . . . . . . . . . . . . . . . . . . . . 33,605,805 30,466,604Federal grants . . . . . . . . . . . . . . . . . . . . . . . . . . . . . . . . . . . . . . . 374,687 363,774State grants . . . . . . . . . . . . . . . . . . . . . . . . . . . . . . . . . . . . . . . . . 137,272 130,735Private grants . . . . . . . . . . . . . . . . . . . . . . . . . . . . . . . . . . . . . . . . 53,637 51,574Capitalized leases . . . . . . . . . . . . . . . . . . . . . . . . . . . . . . . . . . . . 2,617,473 2,054,097___________________ ___________________
Total funding sources . . . . . . . . . . . . . . . . . . . . . . . . . . . . . . . $42,849,447 $39,533,893___________________ ______________________________________ ___________________
At June 30, 2002 and 2001, governmental activities capital assets include approximately $1.2 billion of City-owned assetsleased for $1 per year to the New York City Transit Authority which operates and maintains the assets. In addition, assets leasedto HHC and to the Water and Sewer System are excluded from governmental activities capital assets and are recorded in the respectivecomponent unit financial statements.
Included in land and buildings at June 30, 2002 and 2001 are leased properties capitalized at $2,617 million and $2,054 million,respectively, with related accumulated amortization of $311 million and $250 million, respectively.
Capital Commitments
At June 30, 2002, the outstanding commitments relating to projects of the New York City Capital Projects Fund amountedto approximately $10.3 billion.
To address the need for significant infrastructure and public facility capital investments, the City has prepared a ten-year capitalspending program which contemplates New York City Capital Projects Fund expenditures of $48.1 billion over the remaining fiscalyears 2003 through 2011. To help meet its capital spending program, the City and TFA borrowed $4.8 billion in the public creditmarket in fiscal year 2002. The City, TFA, and/or TSASC plan to borrow $4.4 billion in the public credit market in fiscal year2003.
3. Leases
The City leases a significant amount of property and equipment from others. Leased property having elements of ownershipis recorded in the government-wide financial statements. The related obligations, in amounts equal to the present value ofminimum lease payments payable during the remaining term of the leases, are also recorded in the government-wide financialstatements. Other leased property not having elements of ownership are classified as operating leases. Both capital and operatinglease payments are recorded as expenditures when payable. Total expenditures on such leases for the fiscal years ended June 30,2002 and 2001 were approximately $500 million and $453 million, respectively.
66
NOTES TO FINANCIAL STATEMENTS, Continued

67
NOTES TO FINANCIAL STATEMENTS, Continued
As of June 30, 2002, the City (excluding discretely presented component units) had future minimum payments under capitaland operating leases with a remaining term in excess of one year as follows:
Capital OperatingLeases Leases Total____________ ____________ ____________
(in thousands)Governmental activities:Fiscal year ending June 30:
2003 . . . . . . . . . . . . . . . . . . . . . . . . . . $ 194,845 $ 292,073 $ 486,9182004 . . . . . . . . . . . . . . . . . . . . . . . . . . 195,799 276,727 472,5262005 . . . . . . . . . . . . . . . . . . . . . . . . . . 207,017 260,078 467,0952006 . . . . . . . . . . . . . . . . . . . . . . . . . . 206,349 251,705 458,0542007 . . . . . . . . . . . . . . . . . . . . . . . . . . 204,857 240,939 445,796
2008-2012 . . . . . . . . . . . . . . . . . . . . . . . . . . 857,001 881,103 1,738,1042013-2017 . . . . . . . . . . . . . . . . . . . . . . . . . . 706,189 559,608 1,265,7972018-2022 . . . . . . . . . . . . . . . . . . . . . . . . . . 571,586 230,390 801,9762023-2027 . . . . . . . . . . . . . . . . . . . . . . . . . . 393,420 77,854 471,2742028-2032 . . . . . . . . . . . . . . . . . . . . . . . . . . 295,510 59,091 354,6012033-2037 . . . . . . . . . . . . . . . . . . . . . . . . . . 95,846 48,616 144,4622038-2042 . . . . . . . . . . . . . . . . . . . . . . . . . . 38,339 30,689 69,028_________________ _________________ _________________
Future minimum payments . . . . . . . . . 3,966,758 $3,208,873 $7,175,631_________________ __________________________________ _________________Less interest . . . . . . . . . . . . . . . . . . . . . . . . 1,668,619_________________
Present value of future minimumpayments . . . . . . . . . . . . . . . . . . . . . $2,298,139__________________________________
The present value of future minimum lease payments includes approximately $1.804 billion for leases with Public BenefitCorporations (PBC) where State law generally provides that in the event the City fails to make any required lease payment, theamount of such payment will be deducted from State aid otherwise payable to the City and paid to PBC.
The City also leases City-owned property to others, primarily for markets, ports, and terminals. Total rental revenue on thesecapital and operating leases for the fiscal years ended June 30, 2002 and 2001 was approximately $115 million and $154 million,respectively. As of June 30, 2002, the following future minimum rentals are provided for by the leases:
Capital OperatingLeases Leases Total______________ ________________________ ________________
(in thousands)Governmental activities:Fiscal year ending June 30:
2003 . . . . . . . . . . . . . . . . . . . . . . . . . . $ 1,541,150 $ 66,418,653 $ 67,959,8032004 . . . . . . . . . . . . . . . . . . . . . . . . . . 1,617,809 57,846,717 59,464,5262005 . . . . . . . . . . . . . . . . . . . . . . . . . . 1,694,468 51,012,491 52,706,9592006 . . . . . . . . . . . . . . . . . . . . . . . . . . 1,767,531 46,066,211 47,833,7422007 . . . . . . . . . . . . . . . . . . . . . . . . . . 1,841,565 44,389,075 46,230,640
2008-2012 . . . . . . . . . . . . . . . . . . . . . . . . . . 9,877,933 193,394,103 203,272,0362013-2017 . . . . . . . . . . . . . . . . . . . . . . . . . . 11,250,992 127,783,185 139,034,1772018-2022 . . . . . . . . . . . . . . . . . . . . . . . . . . 12,313,923 81,223,667 93,537,5902023-2027 . . . . . . . . . . . . . . . . . . . . . . . . . . 12,072,645 52,407,640 64,480,2852028-2032 . . . . . . . . . . . . . . . . . . . . . . . . . . 11,934,565 46,735,592 58,670,1572033-2037 . . . . . . . . . . . . . . . . . . . . . . . . . . 11,936,042 43,083,785 55,019,8272038-2042 . . . . . . . . . . . . . . . . . . . . . . . . . . 11,107,790 36,963,481 48,071,2712043-2047 . . . . . . . . . . . . . . . . . . . . . . . . . . 10,247,528 36,653,944 46,901,4722048-2052 . . . . . . . . . . . . . . . . . . . . . . . . . . 10,088,955 33,107,558 43,196,5132053-2057 . . . . . . . . . . . . . . . . . . . . . . . . . . 10,088,955 29,910,073 39,999,0282058-2062 . . . . . . . . . . . . . . . . . . . . . . . . . . 10,088,955 29,910,070 39,999,0252063-2067 . . . . . . . . . . . . . . . . . . . . . . . . . . 10,088,955 29,910,067 39,999,0222068-2072 . . . . . . . . . . . . . . . . . . . . . . . . . . 10,088,955 28,847,565 38,936,5202073-2077 . . . . . . . . . . . . . . . . . . . . . . . . . . 9,956,634 27,686,136 37,642,7702078-2082 . . . . . . . . . . . . . . . . . . . . . . . . . . 981,507 18,734,180 19,715,6872083-2087 . . . . . . . . . . . . . . . . . . . . . . . . . . — 15,569,118 15,569,1182088-2092 . . . . . . . . . . . . . . . . . . . . . . . . . . — 3 3_____________________ ________________________ ________________________
Future minimum lease rentals . . . . . . 160,586,857 $1,097,653,314 $1,258,240,171________________________ ________________________________________________ ________________________Less interest . . . . . . . . . . . . . . . . . . . . . . . . 130,976,967_____________________
Present value of future minimum leaserentals . . . . . . . . . . . . . . . . . . . . . . . $ 29,609,890__________________________________________

68
NOTES TO FINANCIAL STATEMENTS, Continued
4. Short-Term Liabilities
Changes in Short-term liabilities
In fiscal years 2001 and 2002, the changes in short-term liabilities were as follows:
Balance Balance BalanceJune 30, June 30, June 30,
Primary Government 2000 Additions Deletions 2001 Additions Deletions 2002_____________________________ ________ _________ _________ ______________ _________ _________ _________(in thousands)
Governmental activities:Notes payable:
Revenue anticipation notes (1) . . $ — $ 750,000 $ 750,000 $ — $1,500,000 $1,500,000 $ —Bond anticipation notes (2) . . . . 515,000 515,000 1,030,000 — 2,800,000 600,000 2,200,000________ _________________ _________________ ______________ _________________ _________________ _________
Total notes payable . . . . . . . . . . . . . $515,000 $1,265,000 $1,780,000 $ — $4,300,000 $2,100,000 $2,200,000________ _________________ _________________ ______________ _________________ _________________ _________________ _________________ _________________ ______________ _________________ _________________ _________
(1) Revenue anticipation notes are used by the City to satisfy its seasonal financing needs.(2) Bond anticipation notes are used by TFA to provide financing for the City’s capital expenditures and reimbursement to the
City for costs related to and arising from events on September 11, 2001 at the World Trade Center.
5. Long-Term Liabilities
Changes in Long-term liabilities
In fiscal years 2001 and 2002, the changes in long-term liabilities were as follows:Due
Balance Balance Balance WithinJune 30, June 30, June 30, One
Primary Government 2000 Additions Deletions 2001 Additions Deletions 2002 Year__________________________________ __________ _________ _________ __________ _________ _________ __________ _________(in thousands)
Governmental activities:Bonds payable:
General obligationbonds . . . . . . . . . . . . . . . . . . . . . . . $26,892,106 $2,378,565 $2,434,880 $26,835,791 $3,968,609 $2,338,916 $28,465,484 $1,249,090
1991 general resolutionbonds . . . . . . . . . . . . . . . . . . . . . . . 3,531,565 — 314,530 3,217,035 106,610 444,005 2,879,640 355,040
Future tax securedbonds . . . . . . . . . . . . . . . . . . . . . . . 5,923,155 1,536,825 73,970 7,386,010 1,020,190 117,535 8,288,665 178,185
Bond anticipation notes . . . . . . . . . . . 515,000 — 515,000 — — — — —Tobacco flexible
amortization bonds . . . . . . . . . . . . . 709,280 — 5,620 703,660 45,878 9,430 740,108 8,915Japanese Yen bonds . . . . . . . . . . . . . . 120,000 — 40,000 80,000 — 40,000 40,000 40,000Revenue bonds(1)(2) . . . . . . . . . . . . . 570,651 — 27,711(3) 542,940 — 21,734(3) 521,206 31,448___________________ _________________ _________________ ___________________ _________________ _________________ ___________________ _________________
Total before treasuryobligations and discounts . . . . . . . . . . 38,261,757 3,915,390 3,411,711 38,765,436 5,141,287 2,971,620 40,935,103 1,862,678
Less treasury obligations . . . . . . . . . . . . . 230,468 — 62,095 168,373 — 52,102 116,271 52,275___________________ _________________ _________________ ___________________ _________________ _________________ ___________________ _________________Total before discounts . . . . . . . . . . . . . . . 38,031,289 3,915,390 3,349,616 38,597,063 5,141,287 2,919,518 40,818,832 1,810,403Less discounts (net) . . . . . . . . . . . . . . . . . 234,949 16,230 83,872 167,307 321,172 141,318 347,161 —___________________ _________________ _________________ ___________________ _________________ _________________ ___________________ _________________Total bonds payable . . . . . . . . . . . . . . . . 37,796,340 3,899,160 3,265,744 38,429,756 4,820,115 2,778,200 40,471,671 1,810,403Capital lease obligations . . . . . . . . . . . . . 1,803,050 55,251 53,724 1,804,577 563,376 69,814 2,298,139 58,762Real estate tax refunds . . . . . . . . . . . . . . 590,781 139,689 148,075 582,395 116,152 118,827 579,720 88,804Other tax refunds . . . . . . . . . . . . . . . . . . . 1,468,529 121,459 261,529 1,328,459 160,130 121,459 1,367,130 135,130Judgments and claims . . . . . . . . . . . . . . . 4,013,688 1,206,470 993,650 4,226,508 1,047,127 936,615 4,337,020 972,104Vacation and sick leave . . . . . . . . . . . . . . 2,082,300 148,571 122,169 2,108,702 212,156 104,917 2,215,941 105,020Pension liability . . . . . . . . . . . . . . . . . . . — 188,200 — 188,200 161,000 21,400 327,800 37,300Landfill closure and post-
closure care costs . . . . . . . . . . . . . . . . 1,085,278 363,176 51,538 1,396,916 — 114,247 1,282,669 63,288___________________ _________________ _________________ ___________________ _________________ _________________ ___________________ _________________Total changes in governmental
activities long-termliabilities . . . . . . . . . . . . . . . . . . . . . . . $48,839,966 $6,121,976 $4,896,429 $50,065,513 $7,080,056 $4,265,479 $52,880,090 $3,270,811___________________ _________________ _________________ ___________________ _________________ _________________ ___________________ ____________________________________ _________________ _________________ ___________________ _________________ _________________ ___________________ _________________
(1) The debt of CUCF and ECF are reported as bonds outstanding pursuant to their treatment as component units (see Note A.1.).(2) Excludes $250,121 in 2001 and $255,460 in 2002 for CUCF to be provided by the State.(3) Net adjustment for CUCF portion based on allocation of debt between New York State and New York City.Note: City bonds payable are generally liquidated with resources of the General Debt Service Fund. Other long-term liabilities are generally liquidated with
resources of the General Fund.

The bonds payable, net of treasury obligations, at June 30, 2002 and 2001 summarized by type of issue are as follows:
2002 2001__________________________________________ _________________________________________General General
Primary Government Obligations Revenue Total Obligations Revenue Total_________________________________________ ____________ __________ _____________ ____________ _________ _____________(in thousands)
Governmental activities:Bonds payable:
General obligation bonds . . . . . . . . . . $28,349,213 $ — $28,349,213 $26,667,418 $ — $26,667,4181991 general resolution bonds . . . . . . 2,879,640 — 2,879,640 3,217,035 — 3,217,035Future tax secured bonds . . . . . . . . . . 8,288,665 — 8,288,665 7,386,010 — 7,386,010Tobacco flexible amortization
bonds . . . . . . . . . . . . . . . . . . . . . . . . 740,108 — 740,108 703,660 — 703,660Japanese yen bonds . . . . . . . . . . . . . . 40,000 — 40,000 80,000 — 80,000Revenue bonds . . . . . . . . . . . . . . . . . . — 521,206 521,206 — 542,940 542,940__________ ________ __________ __________ ________ __________
Total bonds payable . . . . . . . . . . . . $40,297,626 $521,206 $40,818,832 $38,054,123 $542,940 $38,597,063__________ ________ __________ __________ ________ ____________________ ________ __________ __________ ________ __________
The following table summarizes future debt service requirements as of June 30, 2002:
Governmental Activities___________________________________________________________________General Obligation Bonds Revenue Bonds________________________________ __________________________
Primary Government Principal Interest(1) Principal Interest_____________________________________________________________________________________________________________________ ____________ ____________ __________ _________(in thousands)
Fiscal year ending June 30:2003 . . . . . . . . . . . . . . . . . . . . . . . . . . . . . . . . . . . . . . . . . $ 1,778,955 $ 1,925,510 $ 31,448 $ 30,9282004 . . . . . . . . . . . . . . . . . . . . . . . . . . . . . . . . . . . . . . . . . 2,078,740 1,851,259 31,892 30,4342005 . . . . . . . . . . . . . . . . . . . . . . . . . . . . . . . . . . . . . . . . . 2,100,001 1,755,834 32,443 28,7742006 . . . . . . . . . . . . . . . . . . . . . . . . . . . . . . . . . . . . . . . . . 2,078,915 1,634,005 34,635 23,9452007 . . . . . . . . . . . . . . . . . . . . . . . . . . . . . . . . . . . . . . . . . 2,129,029 1,519,685 31,035 21,9252008-2012 . . . . . . . . . . . . . . . . . . . . . . . . . . . . . . . . . . . . 9,430,355 6,066,088 141,921 80,2882013-2017 . . . . . . . . . . . . . . . . . . . . . . . . . . . . . . . . . . . . 7,718,510 3,927,450 124,104 42,6402018-2022 . . . . . . . . . . . . . . . . . . . . . . . . . . . . . . . . . . . . 6,618,992 2,172,079 47,665 17,7192023-2027 . . . . . . . . . . . . . . . . . . . . . . . . . . . . . . . . . . . . 4,486,578 939,723 37,462 7,1962028-2032 . . . . . . . . . . . . . . . . . . . . . . . . . . . . . . . . . . . . 1,068,539 169,970 8,601 7842033-2037 . . . . . . . . . . . . . . . . . . . . . . . . . . . . . . . . . . . . 30,213 5,426 — —2038-2042 . . . . . . . . . . . . . . . . . . . . . . . . . . . . . . . . . . . . 5,753 17 — —Thereafter until 2147 . . . . . . . . . . . . . . . . . . . . . . . . . . . . 773,046 140 — —__________ __________ ________ ________
40,297,626 21,967,186 521,206 284,633Less interest component . . . . . . . . . . . . . . . . . . . . . . . . . — 21,967,186 — 284,633__________ __________ ________ ________
Total future debt service requirements . . . . . . . . . . . . $40,297,626 $ — $521,206 $ —__________ __________ ________ __________________ __________ ________ ________
(1) Includes interest for general obligation bonds estimated at 4% rate on tax-exempt adjustable rate bonds and at 6% rate ontaxable adjustable rate bonds which are the rates at the end of the fiscal year; also, includes interest estimated at 7% rate forJapanese yen bonds. Semiannual interest on Japanese yen bonds is based on offering rates for deposits in U.S. dollars on Londoninterbank offerings.
The average (weighted) interest rates for outstanding City general obligation bonds as of June 30, 2002 and 2001 were 5.5%and 5.6%, respectively, and both ranged from 0.0% to 13.55%, and the interest rates on outstanding MAC bonds as of both June30, 2002 and 2001 ranged from 3.5% to 6.25%. The last maturity of the outstanding City debt is in the year 2147.
In fiscal years 2002 and 2001, the City issued $1.008 billion and $1.139 billion, respectively, of general obligation bonds toadvance refund general obligation bonds of $1.003 billion and $1.147 billion, respectively, aggregate principal amounts. The netproceeds from the sales of the refunding bonds, together with other funds of $3.8 million and $46.2 million, respectively, wereirrevocably placed in escrow accounts and invested in United States Government securities. As a result of providing for the paymentof the principal and interest to maturity, and any redemption premium, the advance refunded bonds are considered to be defeased
69
NOTES TO FINANCIAL STATEMENTS, Continued

70
NOTES TO FINANCIAL STATEMENTS, Continued
and, accordingly, the liability is not reported in the government-wide financial statements. In fiscal year 2002, the refundingtransactions will decrease the City’s aggregate debt service payments by $200 thousand and provide an economic gain of $52.3million. In fiscal year 2001, the refunding transactions decreased the City’s aggregate debt service payments by $61.4 million andprovided an economic gain of $56.3 million. At June 30, 2002 and 2001, $5.875 billion and $8.298 billion, respectively, of theCity’s outstanding general obligation bonds were considered defeased.
The State Constitution requires the City to pledge its full faith and credit for the payment of the principal and interest on Cityterm and serial bonds and guaranteed debt. The general debt-incurring power of the City is limited by the Constitution to 10% ofthe average of five years’ full valuations of taxable real estate. Excluded from this debt limitation is certain indebtedness incurredfor water supply, certain obligations for transit, sewage, and other specific obligations which exclusions are based on a relationshipof debt service to net revenue.
As of July 1, 2002, the 10% general limitation was approximately $35.993 billion (compared with $32.867 billion as of July 1, 2001). To provide for the City’s capital program, TFA and TSASC were created, the debt of which is not subject to thegeneral debt limit of the City. The debt-incurring power of TFA and TSASC has permitted the City to continue to enter into newcontractual commitments. As of July 1, 2002, the combined City, TFA, and TSASC remaining debt incurring power totaled $6.750billion, after providing for capital commitments.
Pursuant to State legislation on January 1, 1979, the City established a General Debt Service Fund administered andmaintained by the State Comptroller into which payments of real estate taxes and other revenues are deposited in advance of debtservice payment dates. Debt service on all City notes and bonds is paid from this Fund. In fiscal year 2002, discretionary and othertransfers of $663 million were made from the General Fund to the General Debt Service Fund for fiscal year 2003 debt service.In addition, in fiscal year 2002, no discretionary transfers were made to component units of the Debt Service Funds. In fiscal year2001, discretionary and other transfers of $2.097 billion were made from the General Fund to the General Debt Service Fund forfiscal year 2002 debt service. In addition, in fiscal year 2001, discretionary transfers totaling $514 million were made to certaincomponent units of the Debt Service Funds.
Judgments and Claims
The City is a defendant in lawsuits pertaining to material matters, including claims asserted which are incidental to performingroutine governmental and other functions. This litigation includes but is not limited to: actions commenced and claims assertedagainst the City arising out of alleged torts; alleged breaches of contracts; alleged violations of law; and condemnation proceedings.Claims related to the September 11 attack on the World Trade Center are not described below. The City has received approximately2,000 notices of claims totaling approximately $9 billion relating to the September 11 attack. The ultimate outcome and fiscalimpact, if any, on the City of these claims is not currently predictable. As of June 30, 2002 and 2001, claims in excess of $533billion and $500 billion, respectively, were outstanding against the City for which the City estimates its potential future liabilityto be $4.3 billion and $4.2 billion, respectively.
As explained in Note A.12., the estimate of the liability for unsettled claims has been reported in the government-wide statementof net assets under noncurrent liabilities. The liability was estimated by categorizing the various claims and applying a historicalaverage percentage, based primarily on actual settlements by type of claim during the preceding ten fiscal years, and supplementedby information provided by the New York City Law Department with respect to certain large individual claims and proceedings.The recorded liability is the City’s best estimate based on available information and application of the foregoing procedures.
In February, 1997, a former New York City school principal filed an action in New York State Supreme Court challengingthe investment policies and practices of the Retirement Board of the New York City Teachers’ Retirement System (TRS) with regardto a component of TRS consisting of member contributions and earnings thereon known as the Variable B Fund. Plaintiff allegesthat the trustees of TRS illegally maintained the Variable B Fund as a fixed-income fund and ignored a requirement that asubstantial amount of the Fund’s assets be invested in equity securities. The defendants are TRS and its individual trustees. Plaintiffseeks damages on behalf of all Variable B Fund participants in excess of $250 million. In May, 1999, the Appellate Division, FirstDepartment, affirmed the Supreme Court’s earlier denial of the defendants’ motion for summary judgment. If the plaintiff wereto prevail in this action, it could result in substantial costs to the City.
In addition to the above claims and proceedings, numerous real estate tax certiorari proceedings are presently pending againstthe City on grounds of alleged overvaluation, inequality, and illegality of assessment. In response to these actions, in December,1981, State legislation was enacted which, among other things, authorizes the City to assess real property according to four classes

and makes certain evidentiary changes in real estate tax certiorari proceedings. Based on historical settlement activity, the Cityestimates its potential liability for outstanding certiorari proceedings to be $580 million and $582 million at June 30, 2002 and2001, respectively, as reported in the government-wide financial statements.
Pension Liability
The City’s pension liability as of June 30, 1999 resulted from a statutory change in the timing of the City’s contribution toits pension plans. Prior to fiscal year 1981, the City’s pension contribution reflected pension costs incurred two years earlier anda phase-in of certain actuarial assumptions. The City’s liability was originally amortized over 40 years. Later legislation reducedthe amortization period to 20 years. As of June 30, 1999, the remaining amortization period was 11 years. In accordance with Chapter85 of the New York State Laws of 2000, enacted on June 24, 2000, as part of a number of changes to actuarial assumptions andmethods, this liability is no longer being funded separately as part of actuarially-determined pension contributions and a liabilityon the part of the City separate from its actuarially-determined pension contributions no longer exists. Accordingly, the amountof the recorded liability was decreased to zero as of June 30, 2000. For actuarial purposes, the liability was eliminated for the purposeof calculating fiscal year 2000 pension contributions.
As of June 30, 2002 and 2001, the City’s pension liability resulted from State legislation (Chapter 125 of the Laws of 2000)enacted during their Spring 2000 session, which provides automatic cost-of-living adjustments for eligible retirees and eligiblebeneficiaries beginning September, 2000 and a phase-in schedule for funding the additional actuarial liabilities created by the benefitsprovided by this law (see Note E.5.).
Landfill Closure and Postclosure Care Costs
Heretofore, the City’s only active landfill available for waste disposal was the Fresh Kills landfill which initially ceased landfilloperations in March, 2001. The landfill was reopened per the Governor’s amended Executive Order No. 113, which authorizedthe City to continue the acceptance and disposal of waste materials received from the site of the World Trade Center disaster ofSeptember 11, 2001. The landfill subsequently closed in August, 2002. For government-wide financial statements, the measurementand recognition of the liability for closure and postclosure care is based on total estimated current cost and landfill usage to date.For fund financial statements, expenditures are recognized using the modified accrual basis of accounting where a liability isrecognized only when liquidated with expendable financial resources.
Upon the landfill becoming inactive, the City is required by Federal and State law to close the landfill, including final cover,stormwater management, landfill gas control, and to provide postclosure care for a period of 30 years following closure. The Cityis also required under Consent Order with the New York State Department of Environmental Conservation to conduct certain correctivemeasures associated with the landfill. The corrective measures include construction and operation of a leachate mitigation systemfor the active portions of the landfill as well as closure, postclosure, and groundwater monitoring activities for the sections no longeraccepting solid waste.
The liability for these activities as of June 30, 2002 which equates to the total estimated current cost is $1,059.2 million basedon the maximum cumulative landfill capacity used to date. There are no costs remaining to be recognized. During fiscal year 1996,New York State legislation was enacted which states that no waste will be accepted at the Fresh Kills landfill on or after January 1, 2002. Accordingly, the liability for closure and postclosure care costs is based upon an effective cumulative landfillcapacity used to date of approximately 100%. Cost estimates are based on current data including contracts awarded by the City,contract bids, and engineering studies. These estimates are subject to adjustment for inflation and to account for any changes inlandfill conditions, regulatory requirements, technologies, or cost estimates.
During fiscal year 2002, expenditures for landfill closure and postclosure care costs totaled $37.4 million.
Resource Conservation and Recovery Act Subtitle D Part 258, which became effective April, 1997, requires financial assuranceregarding closure and postclosure care. This assurance was most recently provided, on April 3, 2002, by the City’s Chief FinancialOfficer placing in the Fresh Kills Landfill operating record representations in satisfaction of the Local Government Financial Test.
The City has five inactive hazardous waste sites not covered by the EPA rule. The City has recorded the long-term liabilityfor these postclosure care costs in the government-wide financial statements.
71
NOTES TO FINANCIAL STATEMENTS, Continued

72
NOTES TO FINANCIAL STATEMENTS, Continued
The following represents the City’s total landfill and hazardous waste sites liability which is recorded in the government-widestatement of net assets:
Amount____________(in thousands)
Landfill . . . . . . . . . . . . . . . . . . . . . . . . . . . . . . . . . . . . . . . . . . . . . . . $1,059,232*Hazardous waste sites . . . . . . . . . . . . . . . . . . . . . . . . . . . . . . . . . . . . 223,437_________________
Total landfill and hazardous waste sites liability . . . . . . . . . . . . . . $1,282,669__________________________________
* Since September 11, 2001, the diversion of debris from the World Trade Center’s destruction to Fresh Kills did not have a significantimpact on the closure cost estimates.
6. Interfund Receivables and Payables
At June 30, 2002 and 2001, primary government and discretely presented component unit receivable and payable balances were as follows:
Governmental Activities:
Due from/to other funds:
Receivable Fund Payable Fund 2002 2001_____________________________________________ __________________________________________________ ___________ ___________(in thousands)
General Fund: NYC Capital Projects Fund . . . . . . . . . . . . . . . . . $2,813,173(1) $2,813,173(1)General Debt Service Fund . . . . . . . . . . . . . . . . . . 7,408 7,408CUCF . . . . . . . . . . . . . . . . . . . . . . . . . . . . . . . . . . 15,805 19,838_________ _________
2,836,386 2,840,419_________ _________
NYC Capital Projects Fund General Fund . . . . . . . . . . . . . . . . . . . . . . . . . . . . . 1,763,555(1) 1,140,130(1)_________ _________General Debt Service Fund NYC Capital Projects Fund . . . . . . . . . . . . . . . . . 32,391 —_________ _________
Total due from/to other funds . . . . . . . . . . . . . . . . . . . . . . . . . . . . . . . . . . . . . . . . . . . . . . . . . . . 4,632,332 3,980,549_________ _________
(1) Net of eliminations within the same fund type.Note: During both fiscal years 2002 and 2001, the New York City Capital Projects Fund reimbursed the General Fund for expenditures
made on its behalf.

73
NOTES TO FINANCIAL STATEMENTS, Continued
Component Units:
Due from/to primary government and component units:
Receivable Entity Payable Entity 2002 2001_____________________________________________ __________________________________________________ ___________ ___________(in thousands)
Primary government—General Fund: Component units: HDC . . . . . . . . . . . . . . . . . . . . $ 238,488 $ 203,308OTB . . . . . . . . . . . . . . . . . . . . . 320 311Water Board . . . . . . . . . . . . . . . 9,246 —_________ _________
248,054 203,619_________ _________Primary government—NYC Capital
Projects Fund Component unit—Water Authority . . . . . . . . . . . . 253,456 205,456_________ _________Primary government—Private Housing
Loan Programs Primary government—HDC . . . . . . . . . . . . . . . . . 11,621 11,063_________ _________Total due from component units . . . . . . . . . . . . . . . . . . . . . . . . . . . . . . . . . . . . . . . . . . . . . . . . . 513,131 420,138_________ _________
Component unit—Water Board Primary government—General Fund . . . . . . . . . . 243 23,458_________ _________Total due to component units . . . . . . . . . . . . . . . . . . . . . . . . . . . . . . . . . . . . . . . . . . . . . . . . . . . 243 23,458_________ _________Total due from/to primary government
and component units . . . . . . . . . . . . . . . . . . . . . . . . . . . . . . . . . . . . . . . . . . . . . . . . . . . . . . . . 513,374 443,596_________ _________Total primary government and
component units receivable andpayable balances . . . . . . . . . . . . . . . . . . . . . . . . . . . . . . . . . . . . . . . . . . . . . . . . . . . . . . . . . . . $5,145,706 $4,424,145_________ __________________ _________
E. OTHER INFORMATION
1. Audit Responsibility
In fiscal year 2002, the separately administered organizations included in the financial statements of the City audited by auditorsother than Deloitte & Touche LLP are the Municipal Assistance Corporation for the City of New York, New York City TransitionalFinance Authority, TSASC, Inc., New York City Educational Construction Fund, City University Construction Fund, New York CitySchool Construction Authority, New York City Health and Hospitals Corporation, New York City Off-Track Betting Corporation, JayStreet Development Corporation, New York City Housing Development Corporation, New York City Industrial Development Agency,New York City Economic Development Corporation, Business Relocation Assistance Corporation, Brooklyn Navy Yard DevelopmentCorporation, New York City Water Board and New York City Municipal Water Finance Authority, and Deferred Compensation Planfor Employees of the City of New York and Related Agencies and Instrumentalities.
The following describes the proportion of certain key financial information that is audited by other auditors in fiscal year 2002:
Government-wide Fund-based_____________________________________ ________________________________________________Governmental Component Nonmajor Pension and Other
Activities Units Governmental Funds Employee Benefit Trust Funds_________________ ________________ __________________ __________________________2002 2002 2002 2002______ ______ ______ ______
(percent)
Total assets . . . . . . . . . . . . . . . . . 6 80 99 4Revenues / additions
(deductions) and otherfinancing sources . . . . . . . . . . . 2 74 99 3
74
NOTES TO FINANCIAL STATEMENTS, Continued
In fiscal year 2001, the separately administered organizations included in the financial statements of the City audited by auditorsother than KPMG LLP, are the Municipal Assistance Corporation For The City of New York, New York City Housing Authority,New York City Economic Development Corporation, New York City Educational Construction Fund, New York City IndustrialDevelopment Agency, New York City Off-Track Betting Corporation, New York City School Construction Authority, BrooklynNavy Yard Development Corporation, Business Relocation Assistance Corporation, City University Construction Fund, DeferredCompensation Plan, New York City Transitional Finance Authority, TSASC, Inc., and Jay Street Development Corporation.
The following describes the proportion of certain key financial information that is audited by other auditors in fiscal year 2001:
Government-wide Fund-based_____________________________________ ________________________________________________Governmental Component Nonmajor Pension and Other
Activities Units Governmental Funds Employee Benefit Trust Funds_________________ ________________ __________________ __________________________2001 2001 2001 2001______ ______ ______ ______
(percent)
Total assets . . . . . . . . . . . . . . . . . 5 37 95 4Revenues / additions
(deductions) and otherfinancing sources . . . . . . . . . . . 2 36 99 2
2. Subsequent Events
Long-term Financing
Subsequent to June 30, 2002, the City, TFA, and TSASC completed the following long-term financing:
City Debt: On August 1, 2002, the City sold its Series A and B bonds of $1.005 billion and on October 29, 2002, the Citysold its Series C, D, and E bonds of $1.150 billion for refunding purposes, respectively.
TFA Debt: On July 2, 2002, TFA issued its fiscal 2003 Series A bonds of $1.239 billion for refunding purposes. On July 11,2002, TFA issued Recovery bonds, Series 1, of $480 million to pay operating and capital costs incurred by the City which relatedto the events of September 11, 2001; also, the City had a reoffering of their 1999 A and B Conversion bonds of $322.5 millionto convert variable rate debt to fixed rate debt. On August 28, 2002, TFA issued its fiscal 2003 Series B bonds of $750 millionfor refunding purposes. On September 10, 2002, TFA issued Recovery bonds, Series 2, of $520 million to pay operating and capitalcosts incurred by the City which related to the events of September 11, 2001. On October 1, 2002, TFA issued Recovery bonds,Series 3, of $1.026 billion to take out TFA’s fiscal year 2003 Series A Recovery notes, which were used to refund the $1 billionRecovery note maturing on October 2, 2002.
TSASC Debt: On August 15, 2002, TSASC issued $500 million in bonds to finance various municipal capital purposes.
3. Other Employee Benefit Trust Fund
Deferred Compensation Plan For Employees of The City of New York and Related Agencies and Instrumentalities (DCP)
The City offers its employees a deferred compensation plan created in accordance with Internal Revenue Code Section 457(Section 457). DCP is available to certain employees of The City of New York and related agencies and instrumentalities. It permitsthem to defer a portion of their salary until future years. The compensation deferred is not available to employees until termination,retirement, death, or unforeseen emergency (as defined by the Internal Revenue Service).
Section 457 requires amounts maintained under a deferred compensation plan by a state or local government to be held intrust (or custodial account or annuity contract) for the exclusive benefit of plan participants and their beneficiaries. Consequently,DCP is presented as an Other Employee Benefit Trust Fund in the City’s financial statements.
Investments are managed by DCP’s trustee under one of seven investment options or a combination thereof. The choices ofthe investment options are made by the participants.
The following is a summary of the increases and decreases of the fund for the calendar years ended December 31, 2001 and2000:
2001 2000___________ ___________(in thousands)
Fund assets, December 31 . . . . . . . . . . . . . . . . . . . . . . . . . . . . . . . . . . . $4,343,682 $4,270,632Deferrals of compensation . . . . . . . . . . . . . . . . . . . . . . . . . . . . . . . . . . . 456,688 423,004Earnings and net decrease in investments’ fair value . . . . . . . . . . . . . . . (257,730) (244,905)Payments to eligible participants and beneficiaries . . . . . . . . . . . . . . . . (113,885) (100,746)Administrative expenses . . . . . . . . . . . . . . . . . . . . . . . . . . . . . . . . . . . . (5,449) (4,303)_________________ _________________Fund assets, December 31 . . . . . . . . . . . . . . . . . . . . . . . . . . . . . . . . . . . $4,423,306 $4,343,682_________________ __________________________________ _________________
4. Other Postemployment Benefits
In accordance with collective bargaining agreements, the City provides Other Postemployment Benefits (OPEB) which includebasic medical and hospitalization (health care) benefits to eligible retirees and dependents at no cost to 95.2% of the participants.Basic health care premium costs which are partially paid by the remaining participants vary according to the terms of their electedplans. To qualify, retirees must: (i) have worked for the City with at least five years of credited service as a member of an approvedpension system (requirement does not apply if retirement is as a result of accidental disability); (ii) have been employed by theCity or a City related agency prior to retirement; (iii) have worked regularly for at least twenty hours a week prior to retirement;and (iv) be receiving a pension check from a retirement system maintained by the City or another system approved by the City.The City’s OPEB expense is recorded on a pay-as-you-go basis. The City also provides reimbursement to eligible City retireesand their dependents for the Part B Medicare premium. Retirees and their dependents must be enrolled in the Medicare Part Bprogram in order to receive reimbursement. Each eligible retiree and dependent receives a reimbursement of $50 per month.
The amounts expended for health care benefits for fiscal years 2002 and 2001 are as follows:
2002 2001_____________________ ____________________Active Retired Active Retired___________ ________ ___________ ________
Number of employees . . . . . . . . . . . . . . . . . . . . . . . . . . . . . . 347,237 187,145 347,797 183,020_________________ ______________ _________________ _______________________________ ______________ _________________ ______________
Cost of health care (in thousands)* . . . . . . . . . . . . . . . . . . . . $1,628,206 $574,667 $1,467,718 $495,778_________________ ______________ _________________ _______________________________ ______________ _________________ ______________
* The amounts reflected are based on average headcounts.
In addition, the City sponsors a supplemental (Superimposed Major Medical) benefit plan for City managerial employees torefund medical and hospital bills that are not reimbursed by the regular health insurance carriers.
The amounts expended for supplemental benefits for fiscal years 2002 and 2001 are as follows:
2002 2001___________________ __________________Active Retired Active Retired_________ _______ _________ _______
Number of claims . . . . . . . . . . . . . . . . . . . . . . . . . . . . . . . . . 19,032 4,572 17,905 6,622_______ ______ _______ _____________ ______ _______ ______
Cost of Superimposed Major Medical (in thousands)* . . . . . $ 2,407 $ 741 $ 2,156 $ 822_______ ______ _______ _____________ ______ _______ ______
* Costs are based on reported claims and include a provision for estimated claims incurred but not yet reported.
5. Pension and Other Employee Benefit Trust Funds
Pension Systems
Plan Descriptions
The City sponsors or participates in pension systems providing benefits to its employees. The pension systems function inaccordance with existing State statutes and City laws. Each system combines features of a defined benefit pension plan with thoseof a defined contribution pension plan. Contributions are made by the employers and the members.
75
NOTES TO FINANCIAL STATEMENTS, Continued

76
NOTES TO FINANCIAL STATEMENTS, Continued
The majority of City employees are members of one of the following five major actuarial pension systems:
1. New York City Employees’ Retirement System (NYCERS), a cost-sharing, multiple-employer public employee retirementsystem, for employees of the City not covered by one of the other pension systems and employees of certain componentunits of the City and certain other government units.
2. New York City Teachers’ Retirement System-Qualified Pension Plan (TRS), a cost-sharing, multiple-employer publicemployee retirement system, for teachers in the public schools of the City and Charter Schools and certain other specifiedschool and college employees.
3. New York City Board of Education Retirement System-Qualified Pension Plan (BERS), a cost-sharing, multiple-employerpublic employee retirement system, for nonpedagogical employees of the Board of Education and Charter Schools andcertain employees of the School Construction Authority.
4. New York City Police Department, Subchapter Two Pension Fund (POLICE), a single-employer public employeeretirement system, for full-time uniformed employees of the Police Department.
5. New York City Fire Department, Subchapter Two Pension Fund (FIRE), a single-employer public employee retirementsystem, for full-time uniformed employees of the Fire Department.
The actuarial pension systems provide pension benefits to retired employees based on salary and length of service. Inaddition, the actuarial pension systems provide automatic Cost-of-Living Adjustments (COLA) benefits and other supplementalpension benefits to certain retirees and beneficiaries. In the event of disability during employment, participants may receive retirementallowances based on satisfaction of certain service requirements and other provisions. The actuarial pension systems also providedeath benefits.
Subject to certain conditions, members become fully vested as to benefits upon the completion of 5 years of service. Exceptfor NYCERS, permanent, full-time employees are generally required to become members of the actuarial pension systems uponemployment. Permanent full-time employees who are eligible to participate in NYCERS are required to become members withinsix months of their permanent employment status but may elect to become members earlier. Other employees who are eligible toparticipate in NYCERS may become members at their option. Upon termination of employment before retirement, certainmembers are entitled to refunds of their own contributions including accumulated interest less any loans outstanding.
Plan Membership
At June 30, 2001 and 2000, the membership of the actuarial pension systems consisted of:
2001____________________________________________________________________________________________________________________________________________NYCERS TRS BERS POLICE FIRE TOTAL_______________ _______________ _______________ _______________ _______________ _______________
Retirees and beneficiaries receiving benefits . . . . . . . . . 123,958 51,980 9,838 35,245 16,155 237,176Terminated vested members not yet receiving benefits . 2,980 3,598 172 327 15 7,092Active members . . . . . . . . . . . . . . . . . . . . . . . . . . . . . . . 174,199 95,381 24,651 38,827 11,333 344,391____________ ____________ _____________ ____________ ____________ ____________Total plan membership . . . . . . . . . . . . . . . . . . . . . . . . . . 301,137 150,959 34,661 74,399 27,503 588,659____________ ____________ _____________ ____________ ____________ ________________________ ____________ _____________ ____________ ____________ ____________
2000____________________________________________________________________________________________________________________________________________NYCERS TRS BERS POLICE FIRE TOTAL_______________ _______________ _______________ _______________ _______________ _______________
Retirees and beneficiaries receiving benefits . . . . . . . . . 122,761 50,969 9,407 34,636 16,163 233,936Terminated vested members not yet receiving benefits . 6,034 4,883 717 161 17 11,812Active members . . . . . . . . . . . . . . . . . . . . . . . . . . . . . . . 171,013 91,494 24,720 40,451 11,492 339,170____________ ____________ _____________ ____________ ____________ ____________Total plan membership . . . . . . . . . . . . . . . . . . . . . . . . . . 299,808 147,346 34,844 75,248 27,672 584,918____________ ____________ _____________ ____________ ____________ ________________________ ____________ _____________ ____________ ____________ ____________
Funding Policy
The City’s funding policy for periodic employer contributions to the actuarial pension systems is to contribute percentages ofannualized covered payroll that, together with member contributions, will be sufficient to accumulate assets to pay benefits when due.
Annual contributions, determined in accordance with statute by the systems’Actuary, are generally funded by the employerswithin the appropriate fiscal year.

Member contributions are established by law and vary by Plan. In general, Tiers I and II member contribution rates are dependentupon the employee’s age at membership and retirement plan election. In general, Tier III and Tier IV members make basic contributionsof 3.0% of salary regardless of age at membership. Effective October 1, 2000, in accordance with Chapter 126 of the Laws of 2000,these members, except for certain Transit Authority employees are not required to make contributions after the 10th anniversaryof their membership date or completion of ten years of credited service, whichever is earlier. Effective December, 2000, certainTransit Authority Tier III and Tier IV members make basic contributions of 2.0% of salary in accordance with Chapter 10 of theLaws of 2000 and the election of the Transit Authority. Certain members of NYCERS and BERS also make additional membercontributions.
Annual Pension Costs
The annual pension costs and the City’s pension contributions for fiscal year 2002 were determined as part of the June 30,2001 actuarial valuations on the basis of current actuarial assumptions and methods including the Frozen Initial Liability ActuarialCost Method.
The annual pension costs, for the five major actuarial pension systems, for the fiscal years ended June 30, 2002, 2001, and2000 were as follows:
2002 2001 2000_________________ _________________ _________________(in millions)
NYCERS . . . . . . . . . . . . . . . . . . . . . . . . . . . . . . . . . . . . . . . . . . . . . . . $ 105.7 $ 100.0 $ 68.6TRS . . . . . . . . . . . . . . . . . . . . . . . . . . . . . . . . . . . . . . . . . . . . . . . . . . . . 607.8 572.0 181.8BERS . . . . . . . . . . . . . . . . . . . . . . . . . . . . . . . . . . . . . . . . . . . . . . . . . . 66.7 52.1 9.5POLICE . . . . . . . . . . . . . . . . . . . . . . . . . . . . . . . . . . . . . . . . . . . . . . . . 631.9 543.8 250.0FIRE . . . . . . . . . . . . . . . . . . . . . . . . . . . . . . . . . . . . . . . . . . . . . . . . . . . 344.5 298.9 182.9_____________ _____________ __________
Total annual pension costs . . . . . . . . . . . . . . . . . . . . . . . . . $1,756.6 $1,566.8 $692.8_____________ _____________ _______________________ _____________ __________
For fiscal year 2002, the City’s actual pension contributions for the five major actuarial pension systems, made on a statutorybasis based on the actuarial valuations performed as of June 30, 2001, plus other pension expenditures, were approximately $1,491.1million. These statutory pension contributions were less than the annual pension costs computed in accordance with GovernmentalAccounting Standards Board Statement No. 27 (GASB27).
The annual pension costs, computed in accordance with GASB27 and consistent with generally accepted actuarial principles,are greater than the actual statutory pension contributions primarily because (1) the City is only one of the participating employersin NYCERS, TRS, and BERS and (2) Chapter 125 of the Laws of 2000 (Chapter 125/00), which provides eligible retirees andeligible beneficiaries with automatic COLA benefits beginning September, 2000, also provides for a phase-in schedule forfunding the additional liabilities created by the benefits provided by Chapter 125/00.
Specifically, the Actuary for the five major actuarial pension systems, in calculating the actual statutory contributions in eachof the following fiscal years, includes the following percentage of the increase in actuarial liabilities attributable to the Chapter125/00 COLA benefits:
Phase-In Percent Fiscal Year________________________ ____________________________
20% 200140 200260 200380 2004
100 2005 and later
Note: Chapter 278 of the Laws of 2002 (Chapter 278/02) revised this phase-in schedule for fiscal years 2003 and later (seeSubsequent Event).
77
NOTES TO FINANCIAL STATEMENTS, Continued

The City’s actual statutory pension contributions for the fiscal years ended June 30, 2002, 2001, and 2000 were as follows:
2002 2001 2000_________________ _________________ _________________(in millions)
NYCERS* . . . . . . . . . . . . . . . . . . . . . . . . . . . . . . . . . . . . . . . . . . . . . . $ 50.6 $ 48.2 $ 35.6TRS* . . . . . . . . . . . . . . . . . . . . . . . . . . . . . . . . . . . . . . . . . . . . . . . . . . . 500.8 437.9 178.6BERS* . . . . . . . . . . . . . . . . . . . . . . . . . . . . . . . . . . . . . . . . . . . . . . . . . 54.5 38.0 9.2POLICE . . . . . . . . . . . . . . . . . . . . . . . . . . . . . . . . . . . . . . . . . . . . . . . . 534.5 413.2 250.0FIRE . . . . . . . . . . . . . . . . . . . . . . . . . . . . . . . . . . . . . . . . . . . . . . . . . . . 302.3 241.3 182.9OTHER** . . . . . . . . . . . . . . . . . . . . . . . . . . . . . . . . . . . . . . . . . . . . . . . 49.8 38.3 39.1_____________ _____________ __________
Total actual contributions . . . . . . . . . . . . . . . . . . . . . . . . . $1,492.5 $1,216.9 $695.4_____________ _____________ _______________________ _____________ __________
* NYCERS, TRS, and BERS are cost-sharing, multiple-employer public employee retirement systems. The City’s pensioncontributions as a percentage of the total actual statutory contributions (calculated on a statutory basis reflecting the phase-in of liabilities required under Chapter 125/00) for all employers participating in NYCERS, TRS, and BERS for fiscal yearsended June 30, 2002, 2001, and 2000 were:
2002 2001 2000_______________ _______________ _______________
NYCERS . . . . . . . . . . . . . . . . . . . . . . . . . . . . . . . . . . . . . 47.85% 48.18% 51.95%TRS . . . . . . . . . . . . . . . . . . . . . . . . . . . . . . . . . . . . . . . . . . 98.21 98.42 98.27BERS . . . . . . . . . . . . . . . . . . . . . . . . . . . . . . . . . . . . . . . . 96.44 96.81 96.93
In accordance with GASB27, the City’s obligation for NYCERS, TRS, and BERS is fulfilled by paying its portion of the totalactual statutory contributions determined.
** Other pension expenditures represent contributions to other actuarial and pay-as-you-go pension systems for certainemployees, retirees, and beneficiaries not covered by any of the five major actuarial pension systems. The City alsocontributes per diem amounts into certain union-administered annuity funds.
Net Pension Obligations
NYCERS, TRS, and BERS are cost-sharing, multiple-employer public employee retirement systems and the City has no netpension obligations to these systems.
POLICE and FIRE are single-employer public employee retirement systems and the City’s net pension obligations for fiscalyear 2002 are as follows:
POLICE FIRE TOTAL______________ ______________ ______________(in millions)
(1) Annual Required Contribution . . . . . . . . . . . . . . . . . . . . . . . . . . . . $636.5 $346.2 $982.7(2) Interest on Net Pension Obligation . . . . . . . . . . . . . . . . . . . . . . . . 10.5 4.6 15.1(3) Adjustment to Annual Required Contribution . . . . . . . . . . . . . . . . 15.1 6.3 21.4______ ______ ______(4) Annual Pension Cost=(1)+(2)-(3) . . . . . . . . . . . . . . . . . . . . . . . . . 631.9 344.5 976.4(5) Actual Statutory Contribution . . . . . . . . . . . . . . . . . . . . . . . . . . . . 534.5 302.3 836.8______ ______ ______(6) Increase in Net Pension Obligation=(4)-(5) . . . . . . . . . . . . . . . . . . 97.4 42.2 139.6(7) Net Pension Obligation Beginning of Year . . . . . . . . . . . . . . . . . . 130.6 57.6 188.2______ ______ ______(8) Net Pension Obligation End of Year=(6)+(7) . . . . . . . . . . . . . . . . $228.0 $ 99.8 $327.8______ ______ ____________ ______ ______
78
NOTES TO FINANCIAL STATEMENTS, Continued

79
NOTES TO FINANCIAL STATEMENTS, Continued
The following is three-year trend information for the City’s actuarially-funded, single-employer pension plans:
Fiscal Annual Percentage NetYear Pension Of APC Pension
Ending Cost (APC) Contributed Obligation_______________ ________________ __________________ _________________(in millions)
POLICE . . . . . . . . . . . . . . . . . . . . . . . . . . . . . . . . . . . . . . 6/30/02 $636.5 84% $228.06/30/01 543.8 76 130.66/30/00 250.0 100 0
FIRE . . . . . . . . . . . . . . . . . . . . . . . . . . . . . . . . . . . . . . . . . 6/30/02 346.2 87 99.86/30/01 298.9 81 57.66/30/00 182.9 100 0
Actuarial Assumptions and Methods
The more significant actuarial assumptions and methods used in the calculations of employer contributions to the actuarialpension systems for the fiscal years ending June 30, 2002 and 2001 are as follows:
2002 2001_____________________________________________________________________________________ ______________________________________________________________________________________
Valuation Date June 30, 2001. June 30, 2000.
Actuarial Cost Method(1) Frozen Initial Liability. Frozen Initial Liability.
Amortization Method for Increasing dollar for FIRE(2). Level Increasing dollar for FIRE(2). LevelUnfunded Actuarial Accrued dollar for UAAL attributable to dollar for UAAL attributable to NYCERSLiabilities (UAAL) NYCERS and TRS 1999 Early Retirement and TRS 1999 Early
Incentive (ERI) and NYCERS 2000 ERI(3). Retirement Incentive (ERI)(3).All outstanding components of UAAL All outstanding components of UAALare being amortized over closed periods. are being amortized over closed periods.
Remaining Amortization Period 9 years for FIRE(2), 4 years for 1999 10 years for FIRE(2) and 5 yearsERI, and 5 years for 2000 ERI. for 1999 ERI.
Actuarial Asset Valuation Modified 5-year moving average of Modified 5-year moving average ofMethod Market Value with Market Value Market Value with Market Value
Restart as of June 30, 1999. Restart as of June 30, 1999.
Investment Rate of Return 8.0% per annum(4) (4.0% per annum 8.0% per annum(4) (4.0% per annumfor benefits payable under the variable for benefits payable under the variableannuity programs of TRS and BERS). annuity programs of TRS and BERS).
Post-Retirement Mortality Tables based on recent experience. Tables based on recent experience.
Active Service Withdrawal, Tables based on recent experience. Tables based on recent experience.Death, Disability, ServiceRetirement
Salary Increases In general, Merit and Promotion In general, Merit and PromotionIncreases plus assumed General Wage Increases plus assumed General WageIncreases of 3.0% per year(4). Increases of 3.0% per year(4).
Cost-of-Living Adjustments 1.3% per annum(4). 1.3% per annum(4).
(1) Under the Frozen Initial Liability Actuarial Cost Method, the excess of the actuarial present value of projected benefits ofthe membership as of the valuation date, over the sum of the actuarial value of assets plus present value of UAAL, if any,and present value of future employee contributions is allocated on a level basis over the future earnings of members who areon the payroll as of the valuation date. The Initial Liability has been established by the Entry Age Actuarial Cost Methodbut with the UAAL not less than $0. Actuarial gains and losses are reflected in the employer normal contribution rate.
(2) In conjunction with Chapter 85 of the Laws of 2000 (Chapter 85/00), there is an amortization method. However, the initialUAAL of NYCERS, TRS, BERS, and POLICE equal $0 and no amortization periods are required.
(3) Laws established UAAL for Early Retirement Incentive Programs to be amortized on a level dollar basis over periods of 5years.
(4) Developed assuming a long-term Consumer Price Inflation assumption of 2.5% per year.
80
NOTES TO FINANCIAL STATEMENTS, Continued
Pursuant to Section 96 of the New York City Charter, a study of the actuarial assumptions used to value liabilities of the fiveactuarially-funded New York City Retirement Systems (NYCRS) is conducted by an independent actuarial firm every two years.The most recent such study was completed in October, 1999 and, based upon the results and recommendations of that study, theActuary for NYCRS proposed changes in actuarial assumptions and methods to be used for fiscal years beginning on and afterJuly 1, 1999 (i.e., fiscal year 2000). Where required, the Boards of Trustees of NYCRS adopted those changes to the actuarialassumptions and methods that required Board approval and the New York State Legislature and Governor enacted Chapter 85/00to provide for those changes to the actuarial assumptions and methods that required legislation, including the investment rate ofreturn assumption of 8.0% per annum.
The Actuarial Asset Valuation Method (AAVM) was changed as of June 30, 1999 to reflect a market basis for investmentsheld by the Plan and was made as one component of an overall revision of actuarial assumptions and methods as of June 30, 1999.
Under this AAVM, the Actuarial Asset Value (AAV) was reset to Market Value (i.e., Market Value Restart as of June 30, 1999).Prior to June 30, 1999, this AAVM recognized expected investment returns immediately and phased in investment returns greateror less than expected, (i.e., Unexpected Investment Returns (UIR) over five years at a rate of 10%, 15%, 20%, 25%, and 30% peryear or at a cumulative rate of 10%, 25%, 45%, 70%, and 100% over five years).
Under the AAVM, any UIR for fiscal year 2000 or later will be phased into the AAV beginning the following June 30 at arate of 10%, 15%, 20%, 25%, and 30% per year (or at a cumulative rate of 10%, 25%, 45%, 70%, and 100% over five years).
Chapter 85/00 reestablished a UAAL and eliminated Balance Sheet Liability (BSL) for actuarial purposes as of June 30, 1999.The schedule of payment toward the reestablished UAAL provides that the UAAL, if any, be amortized over a period of 11 yearsbeginning fiscal year 2000, where each annual payment after the first equals 103% of its preceding annual payment.
Chapter 70 of the Laws of 1999 established a UAAL as of June 30, 2000 for an Early Retirement Incentive Program to beamortized on a level basis over a period of 5 years beginning in fiscal year 2001.
Chapter 86 of the Laws of 2000 establishes a UAAL as of June 30, 2001 for an Early Retirement Incentive Program to beamortized on a level basis over a period of 5 years beginning in fiscal year 2002.
Subsequent Events
Chapter 278/02 requires the Actuary to revise the methodology and timing for determining the actual statutory contributionson account of the additional liabilities created by the benefits provided under Chapter 125/00 by extending the phase-in periodfor funding these liabilities from five to ten years.
Chapter 278/02 provides that, for the June 30, 2000 actuarial valuation, the Actuary is required to recognize, on a theoreticalbasis, only 10% of the additional liabilities created by the benefits provided under Chapter 125/00 for determining fiscal year 2001employer contributions.
For each of the next eight June 30 actuarial valuations (i.e., June 30, 2001 to June 30, 2008), the Actuary is required to recognizeprogressively increasing percentages (i.e., 20% to 90%) of the additional Actuarial Present Value of Benefits (APVB) attributableto Chapter 125/00 for determining the fiscal year 2002 to fiscal year 2009 employer contributions.
For the June 30, 2009 and later actuarial valuations, the Actuary is required to recognize the full amount of the additionalAPVB attributable to Chapter 125/00 for determining fiscal year 2010 and later employer contributions.
The impact of the ten year phase-in of Chapter 278/02 is to postpone funding of the additional liabilities attributable to Chapter125/00 resulting in greater employer contributions in later years.
Because the fiscal years 2001 and 2002 accounting periods are closed and Chapter 278/02 has a retroactive effect, the interest-adjusted difference between employer contributions actually paid for fiscal years 2001 and 2002 under current law and the amountsthat would be payable under the ten-year phase-in schedule for such fiscal years is to be deducted from the otherwise requiredemployer contributions for fiscal year 2003.
81
NOTES TO FINANCIAL STATEMENTS, Continued
Other Employee Benefit Trust Funds
Fund Descriptions
Per enabling State legislation, certain retirees of POLICE, FIRE, and NYCERS are eligible to receive scheduled supplementalbenefits from certain Variable Supplements Funds (VSFs).
Under current law, VSFs are not to be construed as constituting pension or retirement system funds. Instead, they providescheduled supplemental payments, other than pension or retirement system allowances, in accordance with applicable statutoryprovisions. While a portion of these payments are guaranteed by the City, the Legislature has reserved to itself and the State ofNew York, the right and power to amend, modify, or repeal the VSFs and the payments they provide.
The New York City Police Department maintains the Police Officers’ Variable Supplements Fund (POVSF) and the PoliceSuperior Officers’ Variable Supplements Fund (PSOVSF). These funds operate pursuant to the provisions of Title 13, Chapter 2of the Administrative Code of The City of New York.
1. POVSF provides supplemental benefits to retirees who retire for service (with 20 or more years) as police officers ofthe New York City Police Department, Subchapter One or Subchapter Two Pension Fund and who retired on or after October1, 1968.
2. PSOVSF provides supplemental benefits to retirees who retire for service (with 20 or more years) holding the rank ofsergeant or higher, or detective, of the New York City Police Department, Subchapter One or Subchapter Two, PensionFund and who retired on or after October 1, 1968.
The New York City Fire Department maintains the Firefighters’ Variable Supplements Fund (FFVSF) and the Fire Officers’Variable Supplements Fund (FOVSF). These funds operate pursuant to the provisions of Title 13, Chapter 3 of the AdministrativeCode of The City of New York.
3. FFVSF provides supplemental benefits to retirees who retire for service (with 20 or more years) as firefighters (or wipers)of the New York City Fire Department, Subchapter One or Subchapter Two Pension Fund and who retired on or afterOctober 1, 1968.
4. FOVSF provides supplemental benefits to retirees who retire for service (with 20 or more years) holding the rank oflieutenant or higher and all pilots and marine engineers (uniformed) of the New York City Fire Department, SubchapterOne or Subchapter Two Pension Fund and who retired on or after October 1, 1968.
The New York City Employees’ Retirement System maintains the Transit Police Officers’ Variable Supplements Fund(TPOVSF), the Transit Police Superior Officers’ Variable Supplements Fund (TPSOVSF), the Housing Police Officers’ VariableSupplements Fund (HPOVSF), the Housing Police Superior Officers’Variable Supplements Fund (HPSOVSF) and the CorrectionOfficers’ Variable Supplements Fund (COVSF). These funds operate pursuant to the provisions of Title 13, Chapter 1 of theAdministrative Code of The City of New York.
5. TPOVSF provides supplemental benefits to retirees who retire for service (with 20 or more years) as Transit Police Officerson or after July 1, 1987. This plan provides for a schedule of defined supplemental benefits that became guaranteed bythe City as a consequence of calculations performed by the Actuary during November, 1993. With the passage ofChapter 255 of the Laws of 2000, NYCERS will be required to transfer assets to the TPOVSF whenever the assets ofTPOVSF are not sufficient to pay benefits.
6. TPSOVSF provides supplemental benefits to retirees who retire for service (with 20 or more years) as Transit Police SuperiorOfficers on or after July 1, 1987. This plan provides for a schedule of defined supplemental benefits that, effective calendaryear 2001, as a result of the enactment of Chapter 255 of the Laws of 2000, became guaranteed by the City. In addition,with the passage of Chapter 255 of the Laws of 2000, NYCERS will be required to transfer assets to the TPSOVSF wheneverthe assets of TPSOVSF are not sufficient to pay benefits.
7. HPOVSF provides supplemental benefits to retirees who retire for service (with 20 or more years) as Housing PoliceOfficers on or after July 1, 1987. This plan provides for a schedule of defined supplemental benefits that becameguaranteed by the City as a consequence of Chapter 719 of the Laws of 1994. With the passage of Chapter 255 of theLaws of 2000, NYCERS will be required to transfer assets to the HPOVSF whenever the assets of HPOVSF are not sufficientto pay benefits.
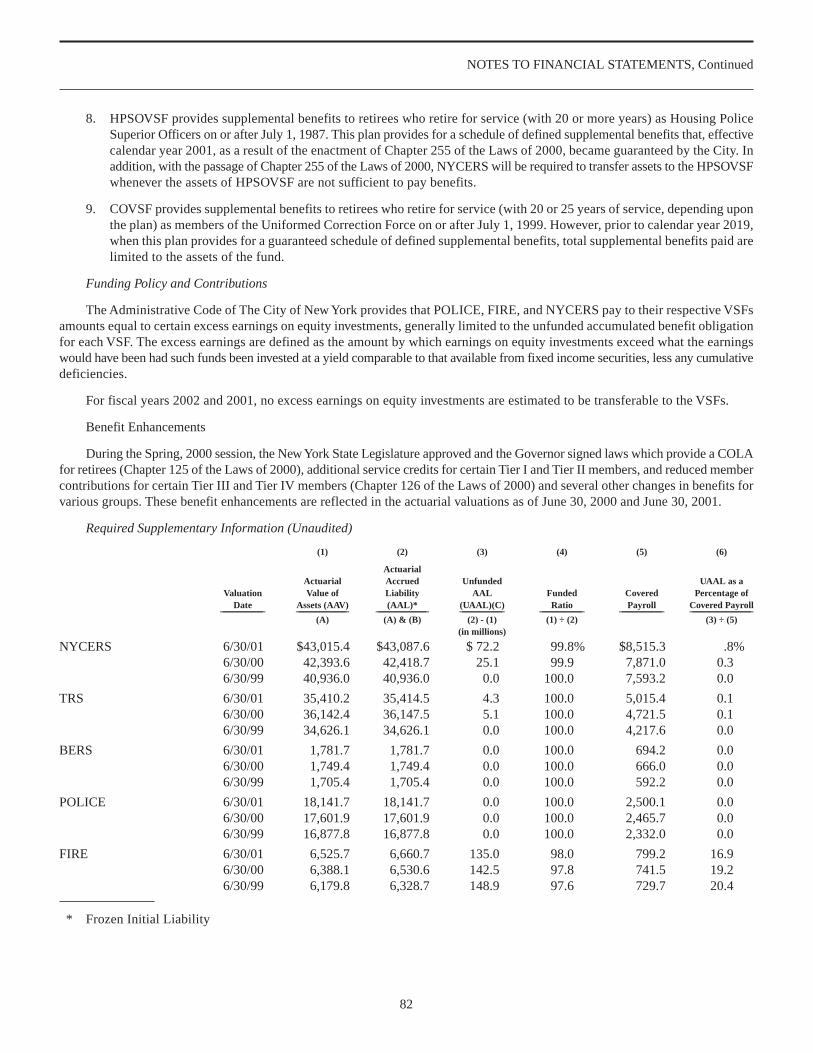
82
NOTES TO FINANCIAL STATEMENTS, Continued
8. HPSOVSF provides supplemental benefits to retirees who retire for service (with 20 or more years) as Housing PoliceSuperior Officers on or after July 1, 1987. This plan provides for a schedule of defined supplemental benefits that, effectivecalendar year 2001, as a result of the enactment of Chapter 255 of the Laws of 2000, became guaranteed by the City. Inaddition, with the passage of Chapter 255 of the Laws of 2000, NYCERS will be required to transfer assets to the HPSOVSFwhenever the assets of HPSOVSF are not sufficient to pay benefits.
9. COVSF provides supplemental benefits to retirees who retire for service (with 20 or 25 years of service, depending uponthe plan) as members of the Uniformed Correction Force on or after July 1, 1999. However, prior to calendar year 2019,when this plan provides for a guaranteed schedule of defined supplemental benefits, total supplemental benefits paid arelimited to the assets of the fund.
Funding Policy and Contributions
The Administrative Code of The City of New York provides that POLICE, FIRE, and NYCERS pay to their respective VSFsamounts equal to certain excess earnings on equity investments, generally limited to the unfunded accumulated benefit obligationfor each VSF. The excess earnings are defined as the amount by which earnings on equity investments exceed what the earningswould have been had such funds been invested at a yield comparable to that available from fixed income securities, less any cumulativedeficiencies.
For fiscal years 2002 and 2001, no excess earnings on equity investments are estimated to be transferable to the VSFs.
Benefit Enhancements
During the Spring, 2000 session, the New York State Legislature approved and the Governor signed laws which provide a COLAfor retirees (Chapter 125 of the Laws of 2000), additional service credits for certain Tier I and Tier II members, and reduced membercontributions for certain Tier III and Tier IV members (Chapter 126 of the Laws of 2000) and several other changes in benefits forvarious groups. These benefit enhancements are reflected in the actuarial valuations as of June 30, 2000 and June 30, 2001.
Required Supplementary Information (Unaudited)
(1) (2) (3) (4) (5) (6)
ActuarialActuarial Accrued Unfunded UAAL as a
Valuation Value of Liability AAL Funded Covered Percentage ofDate Assets (AAV) (AAL)* (UAAL)(C) Ratio Payroll Covered Payroll________________ ___________________ ___________________ ________________ ________________ ________________ _______________________
(A) (A) & (B) (2) - (1) (1) ÷ (2) (3) ÷ (5)(in millions)
NYCERS 6/30/01 $43,015.4 $43,087.6 $ 72.2 99.8% $8,515.3 .8%6/30/00 42,393.6 42,418.7 25.1 99.9 7,871.0 0.36/30/99 40,936.0 40,936.0 0.0 100.0 7,593.2 0.0
TRS 6/30/01 35,410.2 35,414.5 4.3 100.0 5,015.4 0.16/30/00 36,142.4 36,147.5 5.1 100.0 4,721.5 0.16/30/99 34,626.1 34,626.1 0.0 100.0 4,217.6 0.0
BERS 6/30/01 1,781.7 1,781.7 0.0 100.0 694.2 0.06/30/00 1,749.4 1,749.4 0.0 100.0 666.0 0.06/30/99 1,705.4 1,705.4 0.0 100.0 592.2 0.0
POLICE 6/30/01 18,141.7 18,141.7 0.0 100.0 2,500.1 0.06/30/00 17,601.9 17,601.9 0.0 100.0 2,465.7 0.06/30/99 16,877.8 16,877.8 0.0 100.0 2,332.0 0.0
FIRE 6/30/01 6,525.7 6,660.7 135.0 98.0 799.2 16.96/30/00 6,388.1 6,530.6 142.5 97.8 741.5 19.26/30/99 6,179.8 6,328.7 148.9 97.6 729.7 20.4
* Frozen Initial Liability

83
NOTES TO FINANCIAL STATEMENTS, Continued
(A) Revised economic and noneconomic assumptions due to experience review as of June 30, 1999. The Actuarial AssetValuation Method (AAVM) was changed as of June 30, 1999 to reflect a market basis for investments held by the Plan andwas made as one component of an overall revision of actuarial assumptions and methods as of June 30, 1999.
Under the AAVM, any UIR for fiscal year 2000 or later will be phased into the AAV beginning the following June 30 at arate of 10%, 15%, 20%, 25%, and 30% per year (or at a cumulative rate of 10%, 25%, 45%, 70%, and 100% over five years).
(B) To effectively assess the funding progress of a Plan, it is necessary to compare the AAV and the AAL calculated in a mannerconsistent with the Plan’s funding method over a period of time. The AAL is the portion of the actuarial present value of pensionplan benefits and expenses which is not provided for by future employer normal costs and future member contributions.
(C) The UAAL is the excess of the AAL over the AAV. This is the same as unfunded frozen actuarial accrued liability which isnot adjusted from one actuarial valuation to the next to reflect actuarial gains and losses.
6. World Trade Center Attack
On September 11, 2001, two hijacked passenger jetliners flew into the World Trade Center, resulting in a substantial loss oflife, destruction of the World Trade Center, and damage to other buildings in the vicinity. Trading on the major New York stockexchanges was suspended until September 17, 2001, and business in the financial district was interrupted. Recovery, clean up, andrepair efforts will result in substantial expenditures. The Federal government has committed over $21 billion for disaster assistancein New York, including disaster recovery and related activities, increased security, and reconstruction of infrastructure and publicfacilities. This amount includes approximately $15.5 billion of appropriations for costs such as cleanup, economic development,job training, transit improvements, road reconstruction, and grants to residents and businesses in lower Manhattan. It also includesapproximately $5.5 billion for economic stimulus programs directed primarily at businesses located in the Liberty Zone, the areasurrounding the World Trade Center site. These programs include expanding tax credits, increasing depreciation deductions,authorizing the issuance of tax-exempt private activity bonds, and expanding authority to advance refund some bonds issued tofinance facilities in the City. The City is seeking to be reimbursed by the Federal government for all of its direct costs for responseand remediation of the World Trade Center site. These costs are now expected to be substantially below previous estimates. TheCity also expects to receive Federal funds for costs of economic revitalization and other needs, not directly payable through theCity budget, relating to the September 11 attack. In addition, the State authorized TFA to have outstanding $2.5 billion of bonds(Recovery Bonds) and notes (Recovery Notes) to pay costs (Recovery Costs) related to or arising from the September 11 attack.
It is not possible to quantify at present with any certainty the long-term impact of the September 11 attack on the City andits economy, any economic benefits which may result from recovery and rebuilding activities, and the amount of additional resourcesfrom Federal, State, City and other sources which will be required.

[This page intentionally left blank.]

The City of New York
ComprehensiveAnnual Financial Report
of theComptroller
COMBINING FINANCIAL INFORMATION —GOVERNMENTAL FUNDS
Part II-B
Fiscal Year Ended June 30, 2002


[This page intentionally left blank.]

88
Non
maj
or C
apit
al P
roje
cts
Fun
dsN
onm
ajor
Deb
t Se
rvic
e F
unds
____
____
____
____
____
____
____
____
____
____
____
___
____
____
____
____
____
____
____
____
____
____
____
____
____
____
____
____
____
____
____
____
_P
riva
teC
ity
Tota
l Sc
hool
Tra
nsit
iona
lH
ousi
ngG
uara
ntee
dM
unic
ipal
Tra
nsit
iona
lSa
mur
aiN
onm
ajor
Con
stru
ctio
n F
inan
ce
TSA
SC,
Loa
n D
ebt
Serv
ice
Ass
ista
nce
Fin
ance
T
SASC
,F
undi
ng
Gov
ernm
enta
l A
utho
rity
Aut
hori
tyIn
c.P
rogr
ams
Fun
dsC
orpo
rati
onA
utho
rity
Inc.
Cor
pora
tion
Fun
ds__
____
____
___
____
____
____
____
____
___
____
____
____
____
____
____
____
____
____
____
____
____
____
____
___
____
____
____
____
____
___
ASS
ET
S:C
ash
and
cash
equ
ival
ents
. . .
$36
,236
$—
$—
$51
5$
23,8
38$
20$
—$
—$
—$
60,6
09In
vest
men
ts,i
nclu
ding
ac
crue
d in
tere
st .
. . .
. . .
. .—
——
748
306,
054
1,07
2,60
0—
—40
,129
1,41
9,53
1A
ccou
nts
rece
ivab
le—
taxe
sot
her
than
rea
l est
ate
. . .
. .
——
——
——
65,0
1110
0,60
0—
165,
611
Mor
tgag
e lo
ans
and
inte
rest
re
ceiv
able
,net
(le
ss
allo
wan
ce f
or u
ncol
lect
ible
am
ount
s of
$75
2,30
8) .
. . .
——
—1,
721
——
——
—1,
721
Res
tric
ted
asse
ts .
. . .
. . .
. . .
—61
6,83
01,
137
——
—10
8,01
311
2,61
8—
838,
598
Due
fro
m o
ther
fun
ds .
. . .
. .26
8,60
1—
——
——
——
—26
8,60
1D
ue f
rom
Com
pone
nt U
nits
. .
——
—11
,621
——
——
—11
,621
Oth
er .
. . .
. . .
. . .
. . .
. . .
. . .
35,2
93—
——
769
——
——
36,0
62__
____
___
____
____
___
____
___
____
____
___
____
___
____
____
___
____
___
____
____
___
____
___
____
____
_To
tal a
sset
s .
. . .
. . .
. . .
.$
340,
130
$61
6,83
0$
1,13
7$
14,6
05$
330,
661
$1,0
72,6
20$
173,
024
$21
3,21
8$
40,1
29$2
,802
,354
____
____
___
____
___
____
____
___
____
___
____
____
___
____
___
____
____
___
____
___
____
____
___
____
___
____
____
___
____
___
____
____
___
____
___
____
____
___
____
___
____
____
___
____
___
____
____
___
____
___
LIA
BIL
ITIE
SA
ND
FU
ND
BA
LA
NC
ES:
Lia
bilit
ies:
Acc
ount
s pa
yabl
e an
d ac
crue
d lia
bilit
ies
. . .
. . .
. .$
314,
684
$96
3$
208
$—
$48
,024
$87
,778
$—
$—
$12
9$
451,
786
Bon
d an
ticip
atio
n no
tes
paya
ble
. . .
. . .
. . .
. . .
. . .
.—
2,20
0,00
0—
——
——
——
2,20
0,00
0A
ccru
ed ta
x re
fund
s—pe
rson
al in
com
e ta
xes
. . .
.—
——
——
—46
,136
——
46,1
36D
efer
red
reve
nues
:Ta
xes
othe
r tha
n re
al e
stat
e . .
——
——
——
16,0
00—
—16
,000
Oth
er .
. . .
. . .
. . .
. . .
. . .
.—
——
——
——
100,
600
—10
0,60
0D
ue to
oth
er f
unds
. . .
. . .
. . .
—17
,025
——
15,8
05—
——
—32
,830
Paya
ble
for
inve
stm
ent
secu
ritie
s pu
rcha
sed
. . .
. . .
——
——
—24
9,39
1—
——
249,
391
____
____
___
____
___
____
____
___
____
___
____
____
___
____
___
____
____
___
____
___
____
____
___
____
___
Tota
l lia
bilit
ies
. . .
. . .
. .
314,
684
2,21
7,98
820
8—
63,8
2933
7,16
962
,136
100,
600
129
3,09
6,74
3__
____
___
____
____
___
____
___
____
____
___
____
___
____
____
___
____
___
____
____
___
____
___
____
____
_Fu
nd b
alan
ces:
Res
erve
d fo
r:D
ebt s
ervi
ce .
. . .
. . .
. . .
. .—
——
1,26
326
6,83
273
5,45
111
0,88
811
2,61
840
,000
1,26
7,05
2N
oncu
rren
t mor
tgag
e lo
ans
. . .
. . .
. . .
. . .
. . .
.—
——
13,3
42—
——
——
13,3
42U
nres
erve
d (d
efic
it) .
. . .
. .25
,446
(1,6
01,1
58)
929
——
——
——
(1,5
74,7
83)
____
____
___
____
___
____
____
___
____
___
____
____
___
____
___
____
____
___
____
___
____
____
___
____
___
Tota
l fun
d ba
lanc
es .
. . .
25,4
46(1
,601
,158
)92
914
,605
266,
832
735,
451
110,
888
112,
618
40,0
00(2
94,3
89)
____
____
___
____
___
____
____
___
____
___
____
____
___
____
___
____
____
___
____
___
____
____
___
____
___
Tota
l lia
bilit
ies
and
fund
bal
ance
s .
. . .
. . .
. .$
340,
130
$61
6,83
0$
1,13
7$
14,6
05$
330,
661
$1,0
72,6
20$
173,
024
$21
3,21
8$
40,1
29$2
,802
,354
____
____
___
____
___
____
____
___
____
___
____
____
___
____
___
____
____
___
____
___
____
____
___
____
___
____
____
___
____
___
____
____
___
____
___
____
____
___
____
___
____
____
___
____
___
____
____
___
____
___
TH
E C
ITY
OF
NE
W Y
OR
KN
ON
MA
JOR
GO
VE
RN
ME
NT
AL
FU
ND
SC
OM
BIN
ING
BA
LA
NC
E S
HE
ET
JUN
E 3
0,20
02(i
n th
ousa
nds)

89
TH
E C
ITY
OF
NE
W Y
OR
KN
ON
MA
JOR
GO
VE
RN
ME
NT
AL
FU
ND
SC
OM
BIN
ING
BA
LA
NC
E S
HE
ET
JUN
E 3
0,20
01(i
n th
ousa
nds)
Non
maj
or C
apit
al P
roje
cts
Fun
dsN
onm
ajor
Deb
t Se
rvic
e F
unds
____
____
____
____
____
____
____
____
____
____
____
___
____
____
____
____
____
____
____
____
____
____
____
____
____
____
____
____
____
____
____
____
_P
riva
teC
ity
Tota
l Sc
hool
Tra
nsit
iona
lH
ousi
ngG
uara
ntee
dM
unic
ipal
Tra
nsit
iona
lSa
mur
aiN
onm
ajor
Con
stru
ctio
n F
inan
ce
TSA
SC,
Loa
n D
ebt
Serv
ice
Ass
ista
nce
Fin
ance
T
SASC
,F
undi
ng
Gov
ernm
enta
l A
utho
rity
Aut
hori
tyIn
c.P
rogr
ams
Fun
dsC
orpo
rati
onA
utho
rity
Inc.
Cor
pora
tion
Fun
ds__
____
____
___
____
____
____
____
____
___
____
____
____
____
____
____
____
____
____
____
____
____
____
____
___
____
____
____
____
____
___
ASS
ET
S:C
ash
and
cash
eq
uiva
lent
s .
. . .
. . .
. . .
. . .
$2,
573
$—
$—
$51
2$
55,9
47$
2$7
4,95
8$
59,4
60$
—$
193,
452
Inve
stm
ents
,inc
ludi
ng
accr
ued
inte
rest
. . .
. . .
. . .
——
—79
027
5,00
61,
459,
771
17,9
2253
,226
80,4
431,
887,
158
Mor
tgag
e lo
ans
and
inte
rest
rec
eiva
ble,
(les
s al
low
ance
for
un
colle
ctib
le a
mou
nts
of $
750,
148)
. . .
. . .
. . .
. . .
——
—33
,437
——
——
—33
,437
Res
tric
ted
asse
ts .
. . .
. . .
. . .
23,2
9918
,031
812
——
——
——
42,1
42D
ue f
rom
oth
er f
unds
. . .
. . .
252,
073
——
——
——
——
252,
073
Due
fro
m C
ompo
nent
U
nits
. . .
. . .
. . .
. . .
. . .
. . .
——
—11
,063
——
——
—11
,063
Oth
er .
. . .
. . .
. . .
. . .
. . .
. . .
29,2
25—
——
599
——
——
29,8
24__
____
____
____
___
____
____
___
____
____
____
___
____
___
____
____
____
___
____
____
_To
tal a
sset
s .
. . .
. . .
. . .
.$3
07,1
70$1
8,03
1$8
12$4
5,80
2$3
31,5
52$1
,459
,773
$92,
880
$112
,686
$80,
443
$2,4
49,1
49__
____
____
____
___
____
____
___
____
____
____
___
____
___
____
____
____
___
____
____
___
____
____
____
___
____
____
___
____
____
____
___
____
___
____
____
____
___
____
____
_L
IAB
ILIT
IES
AN
DF
UN
DB
AL
AN
CE
S:L
iabi
litie
s:A
ccou
nts
paya
ble
and
accr
ued
liabi
litie
s . .
. . .
. . .
$288
,948
$1,
157
$—
$—
$17
,875
$96
,202
$—
$—
$44
3$
404,
625
Paya
ble
for
inve
stm
ent
secu
ritie
s pu
rcha
sed
. . .
. . .
——
——
—17
9,86
2—
——
179,
862
Due
to o
ther
fun
ds .
. . .
. . .
. .—
13,9
75—
—19
,838
——
——
33,8
13__
____
____
____
___
____
____
___
____
____
____
___
____
___
____
____
____
___
____
____
_To
tal l
iabi
litie
s .
. . .
. . .
.28
8,94
815
,132
——
37,7
1327
6,06
4—
—44
361
8,30
0__
____
____
____
___
____
____
___
____
____
____
___
____
___
____
____
____
___
____
____
_Fu
nd b
alan
ces:
Res
erve
d fo
r:D
ebt s
ervi
ce .
. . .
. . .
. . .
. .—
——
14,8
0629
3,83
91,
183,
709
92,8
8011
2,68
680
,000
1,77
7,92
0N
oncu
rren
t mor
tgag
e lo
ans
. . .
. . .
. . .
. . .
. . .
.—
——
30,9
96—
——
——
30,9
96U
nres
erve
d .
. . .
. . .
. . .
. . .
18,2
222,
899
812
——
——
——
21,9
33__
____
____
____
___
____
____
___
____
____
____
___
____
___
____
____
____
___
____
____
_To
tal f
und
bala
nces
. . .
.18
,222
2,89
981
245
,802
293,
839
1,18
3,70
992
,880
112,
686
80,0
001,
830,
849
____
____
____
___
____
____
___
____
____
____
____
___
____
___
____
____
____
___
____
___
Tota
l lia
bilit
ies
and
fund
bal
ance
s .
. . .
. . .
. .$3
07,1
70$1
8,03
1$8
12$4
5,80
2$3
31,5
52$1
,459
,773
$92,
880
$112
,686
$80,
443
$2,4
49,1
49__
____
____
____
___
____
____
___
____
____
____
___
____
___
____
____
____
___
____
____
___
____
____
____
___
____
____
___
____
____
____
___
____
___
____
____
____
___
____
____
_
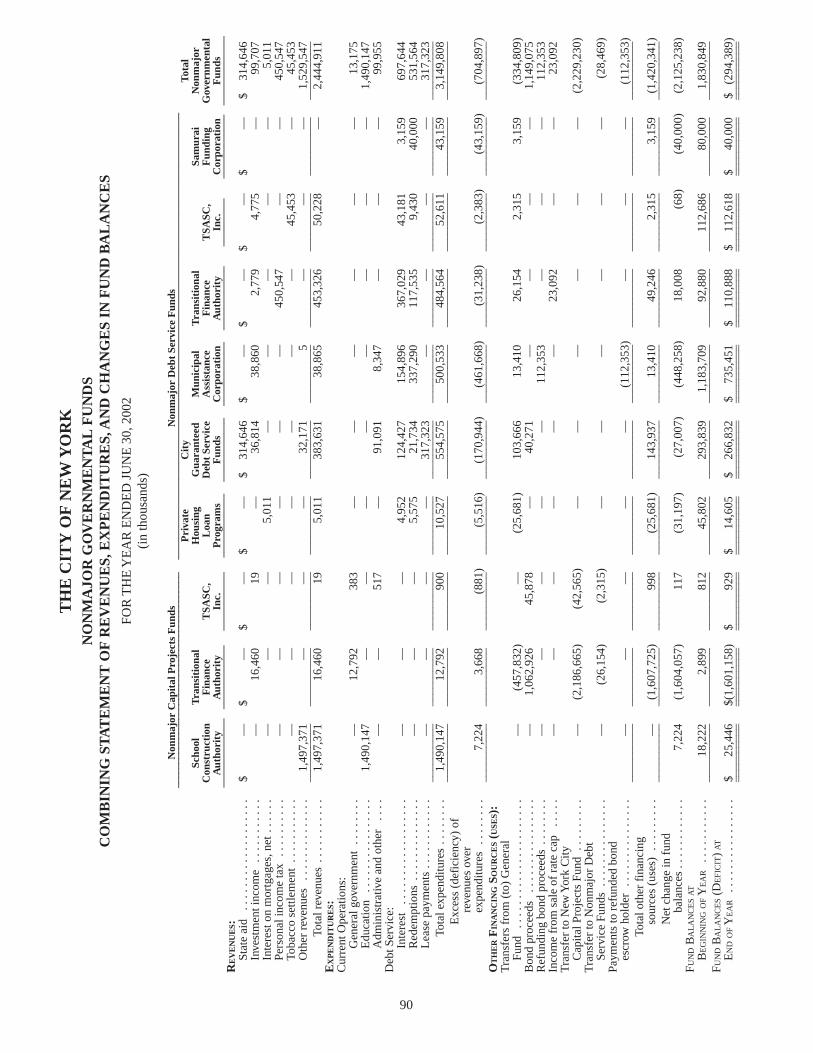
90
Non
maj
or C
apit
al P
roje
cts
Fun
dsN
onm
ajor
Deb
t Se
rvic
e F
unds
____
____
____
____
____
____
____
____
____
____
____
____
____
____
____
____
____
____
____
____
____
____
____
____
____
____
____
____
____
____
____
____
Pri
vate
Cit
yTo
tal
Scho
olT
rans
itio
nal
Hou
sing
Gua
rant
eed
Mun
icip
alT
rans
itio
nal
Sam
urai
Non
maj
orC
onst
ruct
ion
Fin
ance
T
SASC
,L
oan
Deb
t Se
rvic
eA
ssis
tanc
e F
inan
ce
TSA
SC,
Fun
ding
G
over
nmen
tal
Aut
hori
tyA
utho
rity
Inc.
Pro
gram
sF
unds
Cor
pora
tion
Aut
hori
tyIn
c.C
orpo
rati
onF
unds
____
____
____
___
____
____
____
____
____
___
____
____
____
____
____
____
____
____
____
____
____
____
____
___
____
____
____
____
____
____
_R
EV
EN
UE
S:St
ate
aid
. . .
. . .
. . .
. . .
. . .
. . .
.$
—$
—$
—$
—$
314,
646
$—
$—
$—
$—
$31
4,64
6In
vest
men
t inc
ome
. . .
. . .
. . .
. .
—16
,460
19—
36,8
1438
,860
2,77
94,
775
—99
,707
Inte
rest
on
mor
tgag
es,n
et .
. . .
. .—
——
5,01
1—
——
——
5,01
1Pe
rson
al in
com
e ta
x .
. . .
. . .
. . .
——
——
——
450,
547
——
450,
547
Toba
cco
settl
emen
t . .
. . .
. . .
. . .
——
——
——
—45
,453
—45
,453
Oth
er r
even
ues
. . .
. . .
. . .
. . .
. .
1,49
7,37
1—
——
32,1
715
——
—1,
529,
547
____
____
____
____
____
____
____
____
____
____
____
____
____
____
____
____
____
____
____
____
____
____
____
____
____
Tota
l rev
enue
s . .
. . .
. . .
. . .
1,49
7,37
116
,460
195,
011
383,
631
38,8
6545
3,32
650
,228
—2,
444,
911
EX
PE
ND
ITU
RE
S:C
urre
nt O
pera
tions
:G
ener
al g
over
nmen
t .
. . .
. . .
.—
12,7
9238
3—
——
——
—13
,175
Edu
catio
n .
. . .
. . .
. . .
. . .
. . .
1,49
0,14
7—
——
——
——
—1,
490,
147
Adm
inis
trat
ive
and
othe
r .
. . .
——
517
—91
,091
8,34
7—
——
99,9
55D
ebt S
ervi
ce:
Inte
rest
. . .
. . .
. . .
. . .
. . .
. . .
——
—4,
952
124,
427
154,
896
367,
029
43,1
813,
159
697,
644
Red
empt
ions
. . .
. . .
. . .
. . .
. .
——
—5,
575
21,7
3433
7,29
011
7,53
59,
430
40,0
0053
1,56
4L
ease
pay
men
ts .
. . .
. . .
. . .
. .—
——
—31
7,32
3—
——
—31
7,32
3__
____
____
____
____
____
____
____
____
____
____
____
____
____
____
____
____
____
____
____
____
____
____
____
____
__To
tal e
xpen
ditu
res
. . .
. . .
. .1,
490,
147
12,7
9290
010
,527
554,
575
500,
533
484,
564
52,6
1143
,159
3,14
9,80
8__
____
____
____
____
____
____
____
____
____
____
____
____
____
____
____
____
____
____
____
____
____
____
____
____
__E
xces
s (d
efic
ienc
y) o
f re
venu
es o
ver
expe
nditu
res
. . .
. . .
. .
7,22
43,
668
(881
)(5
,516
)(1
70,9
44)
(461
,668
)(3
1,23
8)(2
,383
)(4
3,15
9)(7
04,8
97)
____
____
____
____
____
____
____
____
____
____
____
____
____
____
____
____
____
____
____
____
____
____
____
____
____
OT
HE
RF
INA
NC
ING
SOU
RC
ES
(USE
S):
Tra
nsfe
rs f
rom
(to
) G
ener
al
Fund
. . .
. . .
. . .
. . .
. . .
. . .
. . .
.—
(457
,832
)—
(25,
681)
103,
666
13,4
1026
,154
2,31
53,
159
(334
,809
)B
ond
proc
eeds
. . .
. . .
. . .
. . .
. . .
.—
1,06
2,92
645
,878
—40
,271
——
——
1,14
9,07
5R
efun
ding
bon
d pr
ocee
ds .
. . .
. . .
.—
——
——
112,
353
——
—11
2,35
3In
com
e fr
om s
ale
of r
ate
cap
. . .
. .
——
——
——
23,0
92—
—23
,092
Tra
nsfe
r to
New
Yor
k C
ity
Cap
ital P
roje
cts
Fund
. . .
. . .
. . .
—(2
,186
,665
)(4
2,56
5)—
——
——
—(2
,229
,230
)T
rans
fer
to N
onm
ajor
Deb
t Se
rvic
e Fu
nds
. . .
. . .
. . .
. . .
. . .
—(2
6,15
4)(2
,315
)—
——
——
—(2
8,46
9)Pa
ymen
ts to
ref
unde
d bo
nd
escr
ow h
olde
r .
. . .
. . .
. . .
. . .
. .—
——
——
(112
,353
)—
——
(112
,353
)__
____
____
____
____
____
____
____
____
____
____
____
____
____
____
____
____
____
____
____
____
____
____
____
____
__To
tal o
ther
fin
anci
ng
sour
ces
(use
s) .
. . .
. . .
. .—
(1,6
07,7
25)
998
(25,
681)
143,
937
13,4
1049
,246
2,31
53,
159
(1,4
20,3
41)
____
____
____
____
____
____
____
____
____
____
____
____
____
____
____
____
____
____
____
____
____
____
____
____
____
Net
cha
nge
in f
und
bala
nces
. . .
. . .
. . .
. . .
7,22
4(1
,604
,057
)11
7(3
1,19
7)(2
7,00
7)(4
48,2
58)
18,0
08(6
8)(4
0,00
0)(2
,125
,238
)F U
ND
BA
LA
NC
ES
AT
BE
GIN
NIN
GO
FY
EA
R .
. . .
. . .
. . .
.18
,222
2,89
981
245
,802
293,
839
1,18
3,70
992
,880
112,
686
80,0
001,
830,
849
____
____
____
____
____
____
____
____
____
____
____
____
____
____
____
____
____
____
____
____
____
____
____
____
____
F UN
DB
AL
AN
CE
S(D
EFI
CIT
) AT
EN
DO
FY
EA
R .
. . .
. . .
. . .
. . .
. . .
$25
,446
$(1,
601,
158)
$92
9$
14,6
05$
266,
832
$73
5,45
1$
110,
888
$11
2,61
8$
40,0
00$
(294
,389
)__
____
____
____
____
____
____
____
____
____
____
____
____
____
____
____
____
____
____
____
____
____
____
____
____
____
____
____
____
____
____
____
____
____
____
____
____
____
____
____
____
____
____
____
____
____
____
____
____
____
__
TH
E C
ITY
OF
NE
W Y
OR
KN
ON
MA
JOR
GO
VE
RN
ME
NT
AL
FU
ND
SC
OM
BIN
ING
ST
AT
EM
EN
T O
F R
EV
EN
UE
S,E
XP
EN
DIT
UR
ES,
AN
D C
HA
NG
ES
IN F
UN
D B
AL
AN
CE
S
FOR
TH
E Y
EA
R E
ND
ED
JU
NE
30,
2002
(in
thou
sand
s)

91
TH
E C
ITY
OF
NE
W Y
OR
KN
ON
MA
JOR
GO
VE
RN
ME
NT
AL
FU
ND
SC
OM
BIN
ING
ST
AT
EM
EN
T O
F R
EV
EN
UE
S,E
XP
EN
DIT
UR
ES,
AN
D C
HA
NG
ES
IN F
UN
D B
AL
AN
CE
S
FOR
TH
E Y
EA
R E
ND
ED
JU
NE
30,
2001
(in
thou
sand
s)
Non
maj
or C
apit
al P
roje
cts
Fun
dsN
onm
ajor
Deb
t Se
rvic
e F
unds
____
____
____
____
____
____
____
____
____
____
____
____
____
____
____
____
____
____
____
____
____
____
____
____
____
____
____
____
____
____
____
____
Pri
vate
Cit
yTo
tal
Scho
olT
rans
itio
nal
Hou
sing
Gua
rant
eed
Mun
icip
alT
rans
itio
nal
Sam
urai
Non
maj
orC
onst
ruct
ion
Fin
ance
T
SASC
,L
oan
Deb
t Se
rvic
eA
ssis
tanc
e F
inan
ce
TSA
SC,
Fun
ding
G
over
nmen
tal
Aut
hori
tyA
utho
rity
Inc.
Pro
gram
sF
unds
Cor
pora
tion
Aut
hori
tyIn
c.C
orpo
rati
onF
unds
____
____
____
___
____
____
____
____
____
___
____
____
____
____
____
____
____
____
____
____
____
____
____
___
____
____
____
____
____
____
_R
EV
EN
UE
S:St
ate
aid
. .
. . .
. . .
. . .
. . .
. . .
. .$
—$
—$
—$
—$
303,
136
$—
$—
$—
$—
$30
3,13
6In
vest
men
t inc
ome.
. . .
. . .
. . .
. .
—13
,956
26—
40,8
3637
,495
6,16
46,
132
—10
4,60
9In
tere
st o
n m
ortg
ages
,net
.
. . .
.—
——
6,32
9—
——
——
6,32
9Pe
rson
al in
com
e ta
x .
. . .
. . .
. . .
——
——
——
407,
442
——
407,
442
Toba
cco
settl
emen
t .
. . .
. . .
. . .
——
——
——
—49
,988
—49
,988
Oth
er r
even
ues
. . .
. . .
. . .
. . .
. .
1,44
6,15
5—
—46
539
,399
8—
——
1,48
6,02
7___
______
______
_____
______
______
______
______
____
______
______
____
______
______
______
______
_____
______
______
_____
______
_____
______
______
_____
______
______
___To
tal r
even
ues
. . .
. . .
. . .
. . .
.1,
446,
155
13,9
5626
6,79
438
3,37
137
,503
413,
606
56,1
20—
2,35
7,53
1E
XP
EN
DIT
UR
ES:
Cur
rent
Ope
ratio
ns:
Gen
eral
gov
ernm
ent
. . .
. . .
. . .
.—
12,6
04—
——
——
——
12,6
04E
duca
tion
. . .
. . .
. . .
. . .
. . .
. . .
1,43
9,05
7—
——
——
——
—1,
439,
057
Adm
inis
trat
ive
and
othe
r .
. . .
. .—
—38
1—
55,2
937,
256
——
—62
,930
Deb
t Ser
vice
:In
tere
st .
. . .
. . .
. . .
. . .
. . .
. . .
.—
—50
,227
5,75
412
0,97
117
2,85
034
4,42
8—
9,14
770
3,37
7R
edem
ptio
ns
. . .
. . .
. . .
. . .
. . .
——
5,62
018
,745
76,0
04—
73,9
70—
40,0
0021
4,33
9L
ease
pay
men
ts
. . .
. . .
. . .
. . .
.—
——
—26
8,21
2—
——
—26
8,21
2___
______
______
_____
______
______
______
______
____
______
______
____
______
______
______
______
_____
______
______
_____
______
_____
______
______
_____
______
______
___To
tal e
xpen
ditu
res
. . .
. . .
. . .
1,43
9,05
712
,604
56,2
2824
,499
520,
480
180,
106
418,
398
—49
,147
2,70
0,51
9___
______
______
_____
______
______
______
______
____
______
______
____
______
______
______
______
_____
______
______
_____
______
_____
______
______
_____
______
______
___E
xces
s (d
efic
ienc
y) o
f re
venu
esov
er e
xpen
ditu
res
. . .
. . .
. . .
.7,
098
1,35
2(5
6,20
2)(1
7,70
5)(1
37,1
09)
(142
,603
)(4
,792
)56
,120
(49,
147)
(342
,988
)___
______
______
_____
______
______
______
______
____
______
______
____
______
______
______
______
_____
______
______
_____
______
_____
______
______
_____
______
______
___O
TH
ER
FIN
AN
CIN
GSO
UR
CE
S(U
SES)
:T
rans
fer
from
(to
) G
ener
al F
und
. .
——
—16
,516
97,3
1546
7,90
337
,366
(56,
847)
9,14
757
1,40
0T
rans
fers
fro
m N
onm
ajor
Cap
ital
Proj
ects
Fun
ds
. . .
. . .
. . .
. . .
. .—
—56
,847
——
——
——
56,8
47B
ond
proc
eeds
. . .
. . .
. . .
. . .
. . .
.—
1,58
8,16
4—
——
——
——
1,58
8,16
4T
rans
fer
to N
ew Y
ork
City
Cap
ital P
roje
cts
Fund
. . .
. . .
. . .
—(1
,576
,954
)—
——
——
——
(1,5
76,9
54)
Tra
nsfe
r to
Non
maj
or D
ebt
Serv
ice
Fund
s .
. . .
. . .
. . .
. . .
. .—
(37,
366)
——
——
——
—(3
7,36
6)___
______
______
_____
______
______
______
______
____
______
______
____
______
______
______
______
_____
______
______
_____
______
_____
______
______
_____
______
______
___To
tal o
ther
fin
anci
ng s
ourc
es(u
ses)
. .
. . .
. . .
. . .
. . .
. . .
—(2
6,15
6)56
,847
16,5
1697
,315
467,
903
37,3
66(5
6,84
7)9,
147
602,
091
______
______
_____
______
______
______
______
______
____
______
____
______
______
______
______
______
_____
______
_____
______
______
_____
______
_____
______
______
______
Net
cha
nge
in f
und
bala
nces
. . .
. . .
. . .
. . .
. .
7,09
8(2
4,80
4)64
5(1
,189
)(3
9,79
4)32
5,30
032
,574
(727
)(4
0,00
0)25
9,10
3FU
ND
BA
LA
NC
ES
AT
BE
GIN
NIN
GO
FY
EA
R .
. . .
. . .
. .11
,124
27,7
0316
746
,991
333,
633
858,
409
60,3
0611
3,41
312
0,00
01,
571,
746
______
______
_____
______
______
______
______
______
____
______
____
______
______
______
______
______
_____
______
_____
______
______
_____
______
_____
______
______
______
FUN
DB
AL
AN
CE
SA
TE
ND
OF
YE
AR
. . .
. . .
. . .
. . .
. . .
. . .
.$
18,2
22$
2,89
9$
812
$45
,802
$ 29
3,83
9$1
,183
,709
$92
,880
$112
,686
$80
,000
$1,
830,
849
______
______
_____
______
______
______
______
______
____
______
____
______
______
______
______
______
_____
______
_____
______
______
_____
______
_____
______
______
______
______
______
_____
______
______
______
______
______
____
______
____
______
______
______
______
______
_____
______
_____
______
______
_____
______
_____
______
______
______
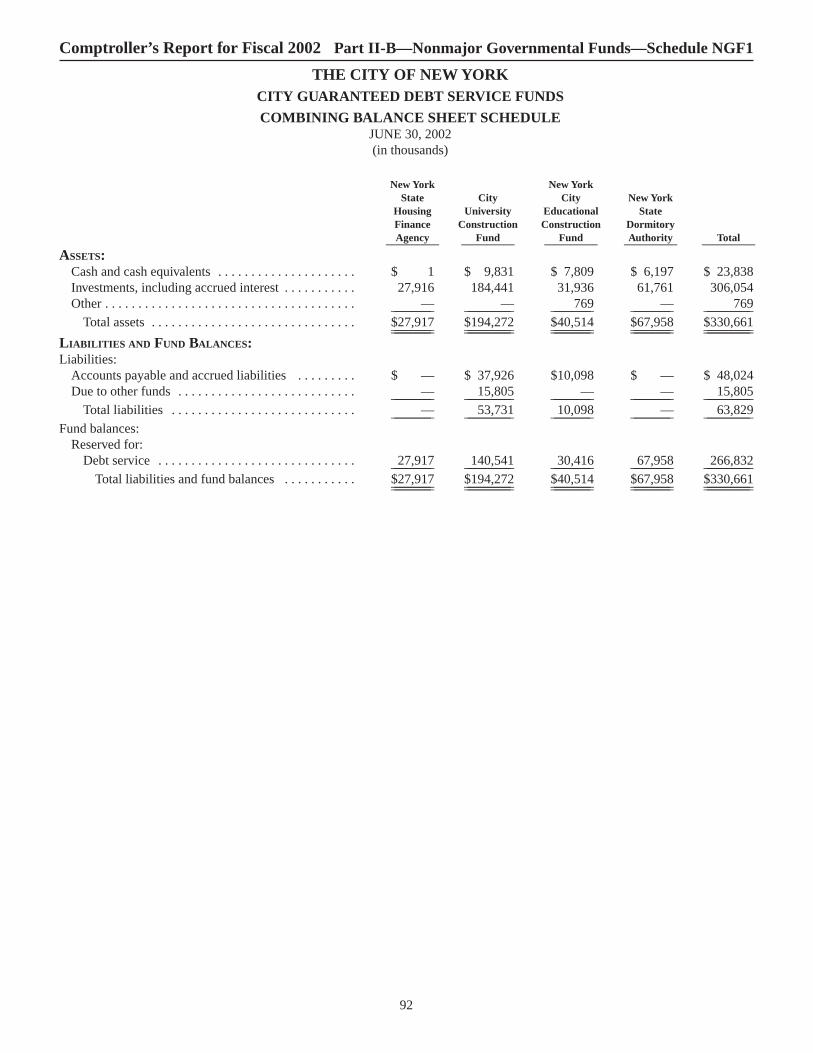
92
Comptroller’s Report for Fiscal 2002 Part II-B—Nonmajor Governmental Funds—Schedule NGF1
THE CITY OF NEW YORKCITY GUARANTEED DEBT SERVICE FUNDS
COMBINING BALANCE SHEET SCHEDULEJUNE 30, 2002(in thousands)
New York New YorkState City City New York
Housing University Educational StateFinance Construction Construction DormitoryAgency Fund Fund Authority Total__________ __________ __________ __________ __________
ASSETS:Cash and cash equivalents . . . . . . . . . . . . . . . . . . . . . $ 1 $ 9,831 $ 7,809 $ 6,197 $ 23,838Investments, including accrued interest . . . . . . . . . . . 27,916 184,441 31,936 61,761 306,054Other . . . . . . . . . . . . . . . . . . . . . . . . . . . . . . . . . . . . . . — — 769 — 769____________ ______________ ____________ ____________ ______________
Total assets . . . . . . . . . . . . . . . . . . . . . . . . . . . . . . . $27,917 $194,272 $40,514 $67,958 $330,661____________ ______________ ____________ ____________ __________________________ ______________ ____________ ____________ ______________LIABILITIES AND FUND BALANCES:Liabilities:
Accounts payable and accrued liabilities . . . . . . . . . $ — $ 37,926 $10,098 $ — $ 48,024Due to other funds . . . . . . . . . . . . . . . . . . . . . . . . . . . — 15,805 — — 15,805____________ ______________ ____________ ____________ ______________
Total liabilities . . . . . . . . . . . . . . . . . . . . . . . . . . . . — 53,731 10,098 — 63,829____________ ______________ ____________ ____________ ______________Fund balances:
Reserved for:Debt service . . . . . . . . . . . . . . . . . . . . . . . . . . . . . . 27,917 140,541 30,416 67,958 266,832____________ ______________ ____________ ____________ ______________
Total liabilities and fund balances . . . . . . . . . . . $27,917 $194,272 $40,514 $67,958 $330,661____________ ______________ ____________ ____________ __________________________ ______________ ____________ ____________ ______________

93
Comptroller’s Report for Fiscal 2002 Part II-B—Nonmajor Governmental Funds—Schedule NGF2
THE CITY OF NEW YORKCITY GUARANTEED DEBT SERVICE FUNDS
COMBINING BALANCE SHEET SCHEDULEJUNE 30, 2001(in thousands)
New York New YorkState City City New York
Housing University Educational StateFinance Construction Construction DormitoryAgency Fund Fund Authority Total__________ __________ __________ __________ __________
ASSETS:Cash and cash equivalents . . . . . . . . . . . . . . . . . . . . . $38,144 $ — $ 52 $17,751 $ 55,947Investments, including accrued interest . . . . . . . . . . . 26,398 189,390 35,125 24,093 275,006Other . . . . . . . . . . . . . . . . . . . . . . . . . . . . . . . . . . . . . . — — 599 — 599____________ ______________ ____________ ____________ ______________
Total assets . . . . . . . . . . . . . . . . . . . . . . . . . . . . . . . $64,542 $189,390 $35,776 $41,844 $331,552____________ ______________ ____________ ____________ __________________________ ______________ ____________ ____________ ______________LIABILITIES AND FUND BALANCES:Liabilities:
Accounts payable and accrued liabilities . . . . . . . . . $ — $ 10,738 $ 7,137 $ — $ 17,875Due to other funds . . . . . . . . . . . . . . . . . . . . . . . . . . . — 19,838 — — 19,838____________ ______________ ____________ ____________ ______________
Total liabilities . . . . . . . . . . . . . . . . . . . . . . . . . . . . — 30,576 7,137 — 37,713____________ ______________ ____________ ____________ ______________Fund balances:
Reserved for:Debt service . . . . . . . . . . . . . . . . . . . . . . . . . . . . . . 64,542 158,814 28,639 41,844 293,839____________ ______________ ____________ ____________ ______________Total liabilities and fund balances . . . . . . . . . . . . . $64,542 $189,390 $35,776 $41,844 $331,552____________ ______________ ____________ ____________ __________________________ ______________ ____________ ____________ ______________

94
Comptroller’s Report for Fiscal 2002 Part II-B—Nonmajor Governmental Funds—Schedule NGF3
THE CITY OF NEW YORKCITY GUARANTEED DEBT SERVICE FUNDS
COMBINING SCHEDULE OF REVENUES, EXPENDITURES, AND CHANGES IN FUND BALANCESFOR THE YEAR ENDED JUNE 30, 2002
(in thousands)
New York New YorkState City City New York New York
Housing University Educational State State UrbanFinance Construction Construction Dormitory DevelopmentAgency Fund Fund Authority Corporation Total__________ __________ __________ __________ __________ __________
REVENUES:State aid . . . . . . . . . . . . . . . . . . . . . . . $ — $314,646 $ — $ — $ — $314,646Investment income . . . . . . . . . . . . . . 1,792 8,233 1,895 24,894 — 36,814Other revenues . . . . . . . . . . . . . . . . . . — 1,082 13,575 17,514 — 32,171_____________ ______________ ____________ _____________ ___________ _______________
Total revenues . . . . . . . . . . . . . . . 1,792 323,961 15,470 42,408 — 383,631_____________ ______________ ____________ _____________ ___________ _______________EXPENDITURES:
Interest . . . . . . . . . . . . . . . . . . . . . . . . 12,945 42,273 7,130 57,857 4,222 124,427Redemptions . . . . . . . . . . . . . . . . . . . . 12,934 8,800 — — 21,734Lease payments . . . . . . . . . . . . . . . . . 24,755 277,932 — 13,430 1,206 317,323Administrative and other . . . . . . . . . . 717 51,060 721 38,593 — 91,091_____________ ______________ ____________ _____________ ___________ _______________
Total expenditures . . . . . . . . . . . . 38,417 384,199 16,651 109,880 5,428 554,575_____________ ______________ ____________ _____________ ___________ _______________Deficiency of revenues over
expenditures . . . . . . . . . . . . . (36,625) (60,238) (1,181) (67,472) (5,428) (170,944)_____________ ______________ ____________ _____________ ___________ _______________OTHER FINANCING SOURCES:Transfer from General Fund . . . . . . . . . — 41,314 2,958 53,966 5,428 103,666Bond proceeds . . . . . . . . . . . . . . . . . . . . — 651 — 39,620 — 40,271_____________ ______________ ____________ _____________ ___________ _______________
Total other financing sources . . . — 41,965 2,958 93,586 5,428 143,937_____________ ______________ ____________ _____________ ___________ _______________Net change in fund balances . . (36,625) (18,273) 1,777 26,114 — (27,007)
FUND BALANCES AT BEGINNING
OF YEAR . . . . . . . . . . . . . . . . . . . . . . 64,542 158,814 28,639 41,844 — 293,839_____________ ______________ ____________ _____________ ___________ _______________FUND BALANCES AT END OF YEAR . . . $ 27,917 $140,541 $30,416 $ 67,958 $ — $266,832_____________ ______________ ____________ _____________ ___________ ____________________________ ______________ ____________ _____________ ___________ _______________
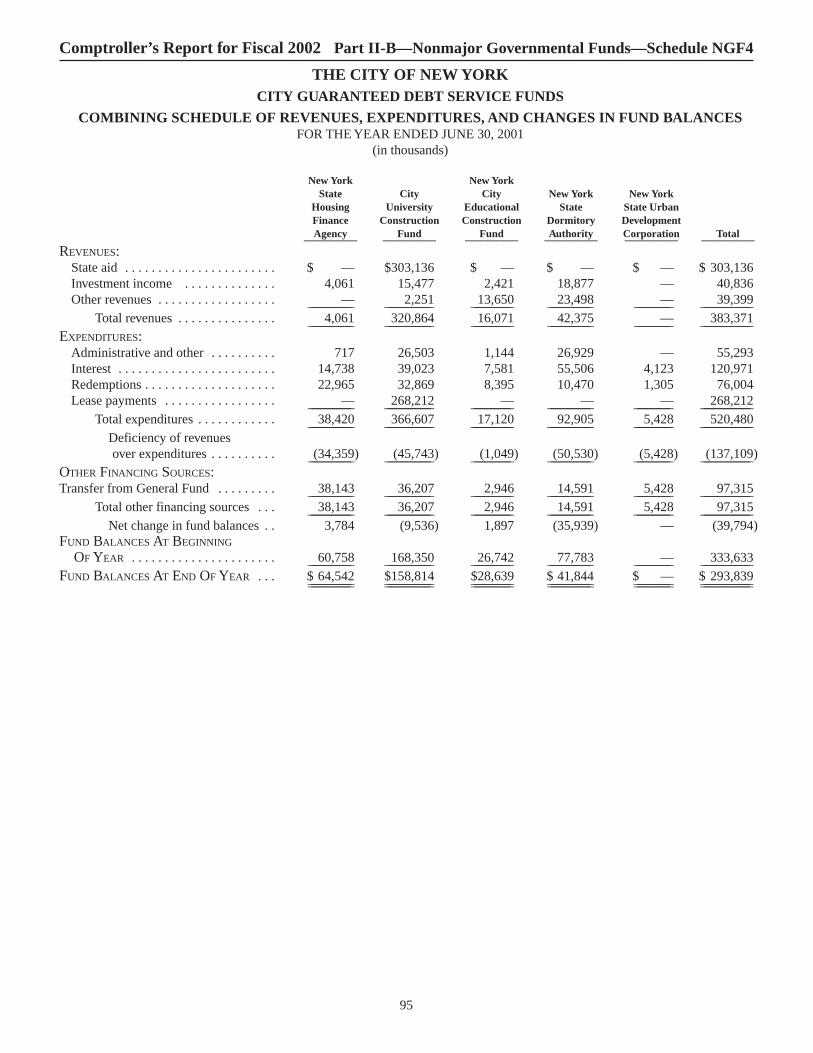
95
Comptroller’s Report for Fiscal 2002 Part II-B—Nonmajor Governmental Funds—Schedule NGF4
THE CITY OF NEW YORKCITY GUARANTEED DEBT SERVICE FUNDS
COMBINING SCHEDULE OF REVENUES, EXPENDITURES, AND CHANGES IN FUND BALANCESFOR THE YEAR ENDED JUNE 30, 2001
(in thousands)
New York New YorkState City City New York New York
Housing University Educational State State UrbanFinance Construction Construction Dormitory DevelopmentAgency Fund Fund Authority Corporation Total__________ __________ __________ __________ __________ __________
REVENUES:State aid . . . . . . . . . . . . . . . . . . . . . . . $ — $303,136 $ — $ — $ — $ 303,136Investment income . . . . . . . . . . . . . . 4,061 15,477 2,421 18,877 — 40,836Other revenues . . . . . . . . . . . . . . . . . . — 2,251 13,650 23,498 — 39,399_____________ ______________ ____________ _____________ ___________ _______________
Total revenues . . . . . . . . . . . . . . . 4,061 320,864 16,071 42,375 — 383,371_____________ ______________ ____________ _____________ ___________ _______________EXPENDITURES:
Administrative and other . . . . . . . . . . 717 26,503 1,144 26,929 — 55,293Interest . . . . . . . . . . . . . . . . . . . . . . . . 14,738 39,023 7,581 55,506 4,123 120,971Redemptions . . . . . . . . . . . . . . . . . . . . 22,965 32,869 8,395 10,470 1,305 76,004Lease payments . . . . . . . . . . . . . . . . . — 268,212 — — — 268,212_____________ ______________ ____________ _____________ ___________ _______________
Total expenditures . . . . . . . . . . . . 38,420 366,607 17,120 92,905 5,428 520,480_____________ ______________ ____________ _____________ ___________ _______________Deficiency of revenues over expenditures . . . . . . . . . . (34,359) (45,743) (1,049) (50,530) (5,428) (137,109)_____________ ______________ ____________ _____________ ___________ _______________
OTHER FINANCING SOURCES:Transfer from General Fund . . . . . . . . . 38,143 36,207 2,946 14,591 5,428 97,315_____________ ______________ ____________ _____________ ___________ _______________
Total other financing sources . . . 38,143 36,207 2,946 14,591 5,428 97,315_____________ ______________ ____________ _____________ ___________ _______________Net change in fund balances . . 3,784 (9,536) 1,897 (35,939) — (39,794)
FUND BALANCES AT BEGINNING
OF YEAR . . . . . . . . . . . . . . . . . . . . . . 60,758 168,350 26,742 77,783 — 333,633_____________ ______________ ____________ _____________ ___________ _______________FUND BALANCES AT END OF YEAR . . . $ 64,542 $158,814 $28,639 $ 41,844 $ — $ 293,839_____________ ______________ ____________ _____________ ___________ ____________________________ ______________ ____________ _____________ ___________ _______________

[This page intentionally left blank.]

The City of New York
ComprehensiveAnnual Financial Report
of theComptroller
COMBINING FINANCIAL INFORMATION —FIDUCIARY FUNDS
Part II-C
Fiscal Year Ended June 30, 2002


[This page intentionally left blank.]
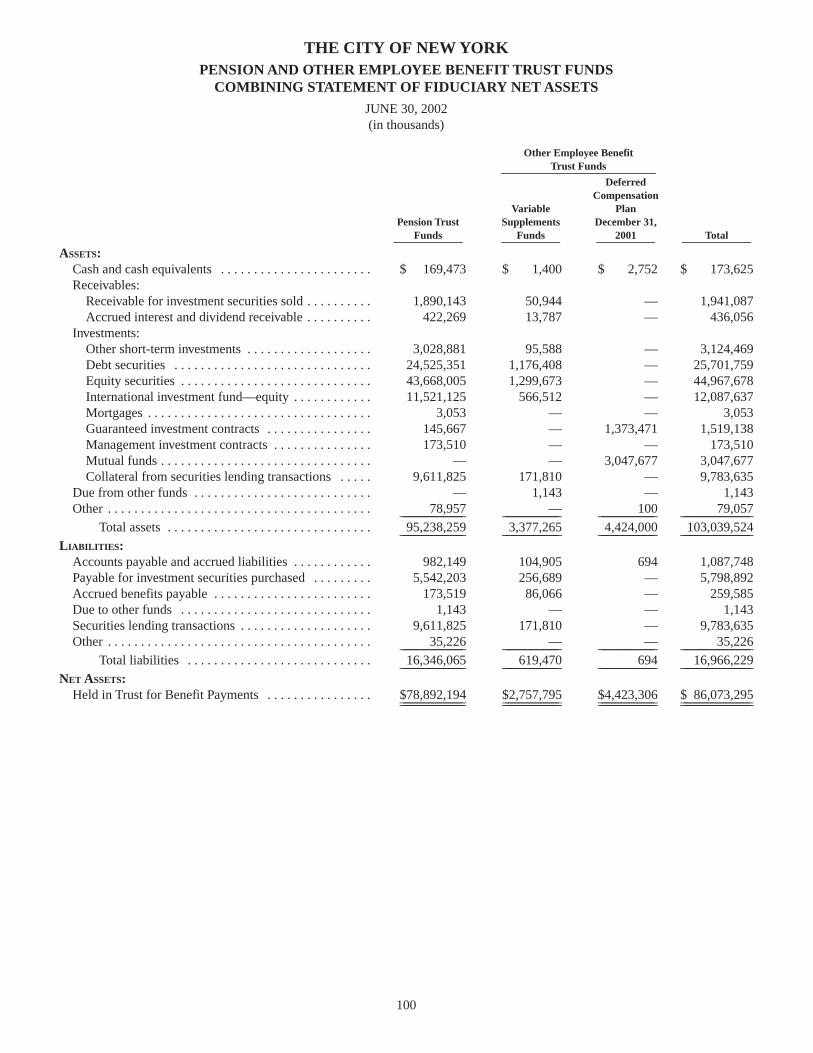
100
Other Employee BenefitTrust Funds_____________________________
DeferredCompensation
Variable PlanPension Trust Supplements December 31,
Funds Funds 2001 Total_____________ ___________ ___________ _____________
ASSETS:Cash and cash equivalents . . . . . . . . . . . . . . . . . . . . . . . $ 169,473 $ 1,400 $ 2,752 $ 173,625 Receivables:
Receivable for investment securities sold . . . . . . . . . . 1,890,143 50,944 — 1,941,087 Accrued interest and dividend receivable . . . . . . . . . . 422,269 13,787 — 436,056
Investments:Other short-term investments . . . . . . . . . . . . . . . . . . . 3,028,881 95,588 — 3,124,469 Debt securities . . . . . . . . . . . . . . . . . . . . . . . . . . . . . . 24,525,351 1,176,408 — 25,701,759 Equity securities . . . . . . . . . . . . . . . . . . . . . . . . . . . . . 43,668,005 1,299,673 — 44,967,678 International investment fund—equity . . . . . . . . . . . . 11,521,125 566,512 — 12,087,637 Mortgages . . . . . . . . . . . . . . . . . . . . . . . . . . . . . . . . . . 3,053 — — 3,053 Guaranteed investment contracts . . . . . . . . . . . . . . . . 145,667 — 1,373,471 1,519,138 Management investment contracts . . . . . . . . . . . . . . . 173,510 — — 173,510 Mutual funds . . . . . . . . . . . . . . . . . . . . . . . . . . . . . . . . — — 3,047,677 3,047,677 Collateral from securities lending transactions . . . . . 9,611,825 171,810 — 9,783,635
Due from other funds . . . . . . . . . . . . . . . . . . . . . . . . . . . — 1,143 — 1,143 Other . . . . . . . . . . . . . . . . . . . . . . . . . . . . . . . . . . . . . . . . 78,957 — 100 79,057 ___________________ _________________ _________________ _____________________
Total assets . . . . . . . . . . . . . . . . . . . . . . . . . . . . . . . 95,238,259 3,377,265 4,424,000 103,039,524 ___________________ _________________ _________________ _____________________LIABILITIES:
Accounts payable and accrued liabilities . . . . . . . . . . . . 982,149 104,905 694 1,087,748 Payable for investment securities purchased . . . . . . . . . 5,542,203 256,689 — 5,798,892 Accrued benefits payable . . . . . . . . . . . . . . . . . . . . . . . . 173,519 86,066 — 259,585 Due to other funds . . . . . . . . . . . . . . . . . . . . . . . . . . . . . 1,143 — — 1,143 Securities lending transactions . . . . . . . . . . . . . . . . . . . . 9,611,825 171,810 — 9,783,635 Other . . . . . . . . . . . . . . . . . . . . . . . . . . . . . . . . . . . . . . . . 35,226 — — 35,226 ___________________ _________________ _________________ _____________________
Total liabilities . . . . . . . . . . . . . . . . . . . . . . . . . . . . 16,346,065 619,470 694 16,966,229 ___________________ _________________ _________________ _____________________NET ASSETS:
Held in Trust for Benefit Payments . . . . . . . . . . . . . . . . $78,892,194 $2,757,795 $4,423,306 $ 86,073,295 ___________________ _________________ _________________ ________________________________________ _________________ _________________ _____________________
THE CITY OF NEW YORKPENSION AND OTHER EMPLOYEE BENEFIT TRUST FUNDS
COMBINING STATEMENT OF FIDUCIARY NET ASSETS
JUNE 30, 2002(in thousands)

101
Other Employee BenefitTrust Funds_____________________________
DeferredCompensation
Variable PlanPension Trust Supplements December 31,
Funds Funds 2000 Total_____________ ___________ ___________ _____________
ASSETS:Cash and cash equivalents . . . . . . . . . . . . . . . . . . . . . . . $ 226,234 $ 2,115 $ 257,047 $ 485,396Receivables:
Receivable for investment securities sold . . . . . . . . . . 1,644,085 73,821 — 1,717,906Accrued interest and dividend receivable . . . . . . . . . . 451,647 14,619 — 466,266
Investments:Other short-term investments . . . . . . . . . . . . . . . . . . . 3,446,182 248,160 — 3,694,342Debt securities . . . . . . . . . . . . . . . . . . . . . . . . . . . . . . 28,289,036 1,080,330 — 29,369,366Equity securities . . . . . . . . . . . . . . . . . . . . . . . . . . . . 51,546,949 1,535,482 — 53,082,431International investment fund—equity . . . . . . . . . . . 12,350,057 622,108 — 12,972,165Mortgages . . . . . . . . . . . . . . . . . . . . . . . . . . . . . . . . . 9,359 — — 9,359Guaranteed investment contracts . . . . . . . . . . . . . . . . 195,000 — 848,069 1,043,069Management investment contracts . . . . . . . . . . . . . . . 97,518 — — 97,518Mutual funds . . . . . . . . . . . . . . . . . . . . . . . . . . . . . . . . — — 3,238,919 3,238,919Collateral from securities lending transactions . . . . . 10,672,622 210,279 — 10,882,901
Due from other funds . . . . . . . . . . . . . . . . . . . . . . . . . . . — 750 — 750Other . . . . . . . . . . . . . . . . . . . . . . . . . . . . . . . . . . . . . . . . 55,753 — 7 55,760_____________________ _________________ _________________ _____________________
Total assets . . . . . . . . . . . . . . . . . . . . . . . . . . . . . . . 108,984,442 3,787,664 4,344,042 117,116,148_____________________ _________________ _________________ _____________________LIABILITIES:
Accounts payable and accrued liabilities . . . . . . . . . . . 507,519 2,457 360 510,336Payable for investment securities purchased . . . . . . . . . 5,713,193 244,069 — 5,957,262Accrued benefits payable . . . . . . . . . . . . . . . . . . . . . . . . 221,282 84,841 — 306,123Due to other funds . . . . . . . . . . . . . . . . . . . . . . . . . . . . . 750 — — 750Securities lending transactions . . . . . . . . . . . . . . . . . . . 10,672,622 210,279 — 10,882,901Other . . . . . . . . . . . . . . . . . . . . . . . . . . . . . . . . . . . . . . . 21,752 — — 21,752_____________________ _________________ _________________ _____________________
Total liabilities . . . . . . . . . . . . . . . . . . . . . . . . . . . . 17,137,118 541,646 360 17,679,124_____________________ _________________ _________________ _____________________NET ASSETS:
Held in Trust for Benefit Payments . . . . . . . . . . . . . . . . $ 91,847,324 $3,246,018 $4,343,682 $ 99,437,024_____________________ _________________ _________________ __________________________________________ _________________ _________________ _____________________
THE CITY OF NEW YORKPENSION AND OTHER EMPLOYEE BENEFIT TRUST FUNDS
COMBINING STATEMENT OF FIDUCIARY NET ASSETS
JUNE 30, 2001(in thousands)

102
Other Employee BenefitTrust Funds_________________________________
DeferredCompensation
Variable PlanPension Trust Supplements December 31,
Funds Funds 2001 Total_______________ ____________ ____________ ________________
ADDITIONS:Contributions:
Member contributions (net of loans to members) . . . . $ 402,585 $ — $ 456,688 $ 859,273 Employer contributions . . . . . . . . . . . . . . . . . . . . . . . . 1,508,934 — — 1,508,934 Other employer contributions . . . . . . . . . . . . . . . . . . . 22,020 — — 22,020 _____________________ _________________ _________________ _____________________
Total contributions . . . . . . . . . . . . . . . . . . . . . . . . . . 1,933,539 — 456,688 2,390,227 _____________________ _________________ _________________ _____________________Investment income:
Interest income . . . . . . . . . . . . . . . . . . . . . . . . . . . . . . 2,064,560 69,963 102,242 2,236,765 Dividend income . . . . . . . . . . . . . . . . . . . . . . . . . . . . . 752,273 20,519 — 772,792 Net depreciation in fair value of investments . . . . . . . (10,753,987) (444,865) (351,768) (11,550,620)Less investment expenses . . . . . . . . . . . . . . . . . . . . . . 325,429 4,067 8,204 337,700 _____________________ _________________ _________________ _____________________Investment loss, net . . . . . . . . . . . . . . . . . . . . . . . . . . . (8,262,583) (358,450) (257,730) (8,878,763)_____________________ _________________ _________________ _____________________
Payments from other funds . . . . . . . . . . . . . . . . . . . . . . . . . — 2,099 — 2,099 Other . . . . . . . . . . . . . . . . . . . . . . . . . . . . . . . . . . . . . . . . . 27,553 — 669 28,222 _____________________ _________________ _________________ _____________________
Total additions . . . . . . . . . . . . . . . . . . . . . . . . . . . . . (6,301,491) (356,351) 199,627 (6,458,215)_____________________ _________________ _________________ _____________________DEDUCTIONS:
Benefit payments and withdrawals . . . . . . . . . . . . . . . . . 6,537,925 131,872 113,885 6,783,682 Payments to other funds . . . . . . . . . . . . . . . . . . . . . . . . . 2,099 — — 2,099 Other . . . . . . . . . . . . . . . . . . . . . . . . . . . . . . . . . . . . . . . . 41,884 — — 41,884 Administrative expenses . . . . . . . . . . . . . . . . . . . . . . . . . 71,731 — 6,118 77,849 _____________________ _________________ _________________ _____________________
Total deductions . . . . . . . . . . . . . . . . . . . . . . . . . . . . 6,653,639 131,872 120,003 6,905,514 _____________________ _________________ _________________ _____________________(Decrease) increase in plan net assets . . . . . . . . . . . (12,955,130) (488,223) 79,624 (13,363,729)
NET ASSETS:Held in Trust for Benefit Payments:
Beginning of Year . . . . . . . . . . . . . . . . . . . . . . . . . . . . 91,847,324 3,246,018 4,343,682 99,437,024 _____________________ _________________ _________________ _____________________End of Year . . . . . . . . . . . . . . . . . . . . . . . . . . . . . . . . . $ 78,892,194 $2,757,795 $4,423,306 $ 86,073,295 _____________________ _________________ _________________ __________________________________________ _________________ _________________ _____________________
THE CITY OF NEW YORKPENSION AND OTHER EMPLOYEE BENEFIT TRUST FUNDS
COMBINING STATEMENT OF CHANGES IN FIDUCIARY NET ASSETS
FOR THE YEAR ENDED JUNE 30, 2002(in thousands)

103
Other Employee BenefitTrust Funds_________________________________
DeferredCompensation
Variable PlanPension Trust Supplements December 31,
Funds Funds 2000 Total_______________ ____________ ____________ ________________
ADDITIONS:Contributions:
Member contributions (net of loans to members) . . . . $ 536,711 $ — $ 423,004 $ 959,715Employer contributions . . . . . . . . . . . . . . . . . . . . . . . . 1,256,832 — — 1,256,832Other employer contributions . . . . . . . . . . . . . . . . . . . 21,324 — — 21,324_____________________ _________________ _________________ _____________________
Total contributions . . . . . . . . . . . . . . . . . . . . . . . . . 1,814,867 — 423,004 2,237,871_____________________ _________________ _________________ _____________________Investment income:
Interest income . . . . . . . . . . . . . . . . . . . . . . . . . . . . . . 2,797,971 91,352 89,651 2,978,974Dividend income . . . . . . . . . . . . . . . . . . . . . . . . . . . . 718,030 21,919 — 739,949Net depreciation in fair value of investments . . . . . . . (12,248,462) (394,998) (327,238) (12,970,698)Less investment expenses . . . . . . . . . . . . . . . . . . . . . . 703,733 12,083 7,318 723,134_____________________ _________________ _________________ _____________________Investment loss, net . . . . . . . . . . . . . . . . . . . . . . . . . . . (9,436,194) (293,810) (244,905) (9,974,909)_____________________ _________________ _________________ _____________________
Payments from other funds . . . . . . . . . . . . . . . . . . . . . . . — 750 — 750Other . . . . . . . . . . . . . . . . . . . . . . . . . . . . . . . . . . . . . . . . 19,905 — 792 20,697_____________________ _________________ _________________ _____________________
Total additions . . . . . . . . . . . . . . . . . . . . . . . . . . . . . (7,601,422) (293,060) 178,891 (7,715,591)_____________________ _________________ _________________ _____________________DEDUCTIONS:
Benefit payments and withdrawals . . . . . . . . . . . . . . . . . 6,046,979 164,378 100,746 6,312,103Payments to other funds . . . . . . . . . . . . . . . . . . . . . . . . . 750 — — 750Other . . . . . . . . . . . . . . . . . . . . . . . . . . . . . . . . . . . . . . . . 21,050 3,269 — 24,319Administrative expenses . . . . . . . . . . . . . . . . . . . . . . . . . 62,159 — 5,095 67,254_____________________ _________________ _________________ _____________________
Total deductions . . . . . . . . . . . . . . . . . . . . . . . . . . . . 6,130,938 167,647 105,841 6,404,426_____________________ _________________ _________________ _____________________Increase (decrease) in plan net assets . . . . . . . . . . . (13,732,360) (460,707) 73,050 (14,120,017)
NET ASSETS:Held in Trust for Benefit Payments:
Beginning of Year . . . . . . . . . . . . . . . . . . . . . . . . . . . . 105,579,684 3,706,725 4,270,632 113,557,041_____________________ _________________ _________________ _____________________End of Year . . . . . . . . . . . . . . . . . . . . . . . . . . . . . . . . . $ 91,847,324 $3,246,018 $4,343,682 $ 99,437,024_____________________ _________________ _________________ __________________________________________ _________________ _________________ _____________________
THE CITY OF NEW YORKPENSION AND OTHER EMPLOYEE BENEFIT TRUST FUNDS
COMBINING STATEMENT OF CHANGES IN FIDUCIARY NET ASSETS
FOR THE YEAR ENDED JUNE 30, 2001(in thousands)

104
Balance BalanceJuly 1, 2001 Additions Deductions June 30, 2002____________ __________ ___________ ____________
ASSETS:Cash and investments . . . . . . . . . . . . . . . . . . . . . . . . . . . . . $1,246,038 $923,841 $ 989,766 $1,180,113__________ ________ __________ ____________________ ________ __________ __________LIABILITIES:Other . . . . . . . . . . . . . . . . . . . . . . . . . . . . . . . . . . . . . . . . . $1,246,038 $936,944 $1,002,869 $1,180,113__________ ________ __________ ____________________ ________ __________ __________
THE CITY OF NEW YORKAGENCY FUNDS
STATEMENT OF CHANGES IN ASSETS AND LIABILITIES
FOR THE YEAR ENDED JUNE 30, 2002(in thousands)

105
Balance BalanceJuly 1, 2000 Additions Deductions June 30, 2001____________ ____________ ____________ _____________
ASSETS:Cash and investments . . . . . . . . . . . . . . . . . . . . . . . . . . . . . $ 1,316,328 $2,010,730 $2,081,020 $ 1,246,038__________ __________ __________ ____________________ __________ __________ __________LIABILITIES:Other . . . . . . . . . . . . . . . . . . . . . . . . . . . . . . . . . . . . . . . . . $ 1,316,328 $2,352,864 $2,423,154 $ 1,246,038__________ __________ __________ ____________________ __________ __________ __________
THE CITY OF NEW YORKAGENCY FUNDS
STATEMENT OF CHANGES IN ASSETS AND LIABILITIES
FOR THE YEAR ENDED JUNE 30, 2001(in thousands)
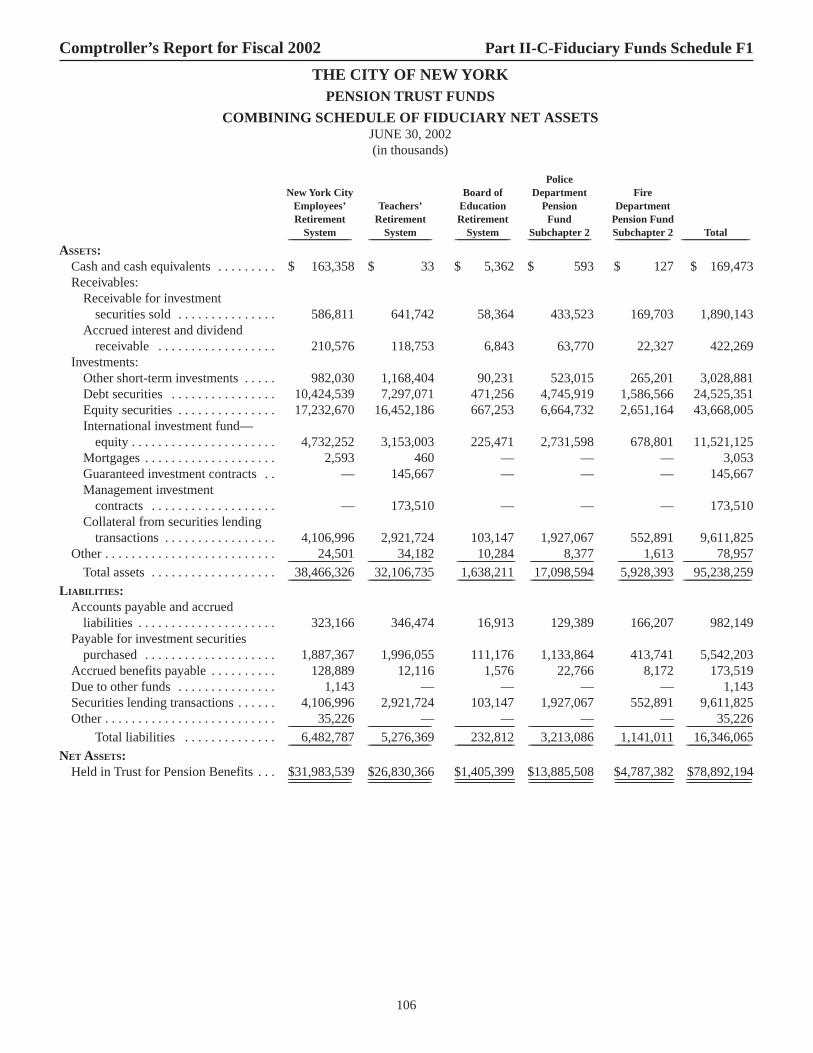
106
PoliceNew York City Board of Department Fire
Employees’ Teachers’ Education Pension DepartmentRetirement Retirement Retirement Fund Pension Fund
System System System Subchapter 2 Subchapter 2 Total_______________________ _______________________ ____________________ _______________________ ____________________ _________________________
ASSETS:Cash and cash equivalents . . . . . . . . . $ 163,358 $ 33 $ 5,362 $ 593 $ 127 $ 169,473 Receivables:
Receivable for investment securities sold . . . . . . . . . . . . . . . 586,811 641,742 58,364 433,523 169,703 1,890,143
Accrued interest and dividend receivable . . . . . . . . . . . . . . . . . . 210,576 118,753 6,843 63,770 22,327 422,269
Investments:Other short-term investments . . . . . 982,030 1,168,404 90,231 523,015 265,201 3,028,881 Debt securities . . . . . . . . . . . . . . . . 10,424,539 7,297,071 471,256 4,745,919 1,586,566 24,525,351 Equity securities . . . . . . . . . . . . . . . 17,232,670 16,452,186 667,253 6,664,732 2,651,164 43,668,005 International investment fund—
equity . . . . . . . . . . . . . . . . . . . . . . 4,732,252 3,153,003 225,471 2,731,598 678,801 11,521,125 Mortgages . . . . . . . . . . . . . . . . . . . . 2,593 460 — — — 3,053 Guaranteed investment contracts . . — 145,667 — — — 145,667 Management investment
contracts . . . . . . . . . . . . . . . . . . . — 173,510 — — — 173,510 Collateral from securities lending
transactions . . . . . . . . . . . . . . . . . 4,106,996 2,921,724 103,147 1,927,067 552,891 9,611,825 Other . . . . . . . . . . . . . . . . . . . . . . . . . . 24,501 34,182 10,284 8,377 1,613 78,957 _______________________ _______________________ _____________________ _______________________ ____________________ _________________________
Total assets . . . . . . . . . . . . . . . . . . . 38,466,326 32,106,735 1,638,211 17,098,594 5,928,393 95,238,259_______________________ _______________________ _____________________ _______________________ ____________________ _________________________
LIABILITIES:Accounts payable and accrued
liabilities . . . . . . . . . . . . . . . . . . . . . 323,166 346,474 16,913 129,389 166,207 982,149 Payable for investment securities
purchased . . . . . . . . . . . . . . . . . . . . 1,887,367 1,996,055 111,176 1,133,864 413,741 5,542,203 Accrued benefits payable . . . . . . . . . . 128,889 12,116 1,576 22,766 8,172 173,519 Due to other funds . . . . . . . . . . . . . . . 1,143 — — — — 1,143 Securities lending transactions . . . . . . 4,106,996 2,921,724 103,147 1,927,067 552,891 9,611,825 Other . . . . . . . . . . . . . . . . . . . . . . . . . . 35,226 — — — — 35,226 _______________________ _______________________ _______________________ _______________________ _______________________ _________________________
Total liabilities . . . . . . . . . . . . . . 6,482,787 5,276,369 232,812 3,213,086 1,141,011 16,346,065 _______________________ _______________________ _______________________ _______________________ _______________________ _________________________
NET ASSETS:Held in Trust for Pension Benefits . . . $31,983,539 $26,830,366 $1,405,399 $13,885,508 $4,787,382 $78,892,194 _______________________ _______________________ _______________________ _______________________ _______________________ ________________________________________________ _______________________ _______________________ _______________________ _______________________ _________________________
Comptroller’s Report for Fiscal 2002 Part II-C-Fiduciary Funds Schedule F1
THE CITY OF NEW YORKPENSION TRUST FUNDS
COMBINING SCHEDULE OF FIDUCIARY NET ASSETSJUNE 30, 2002(in thousands)
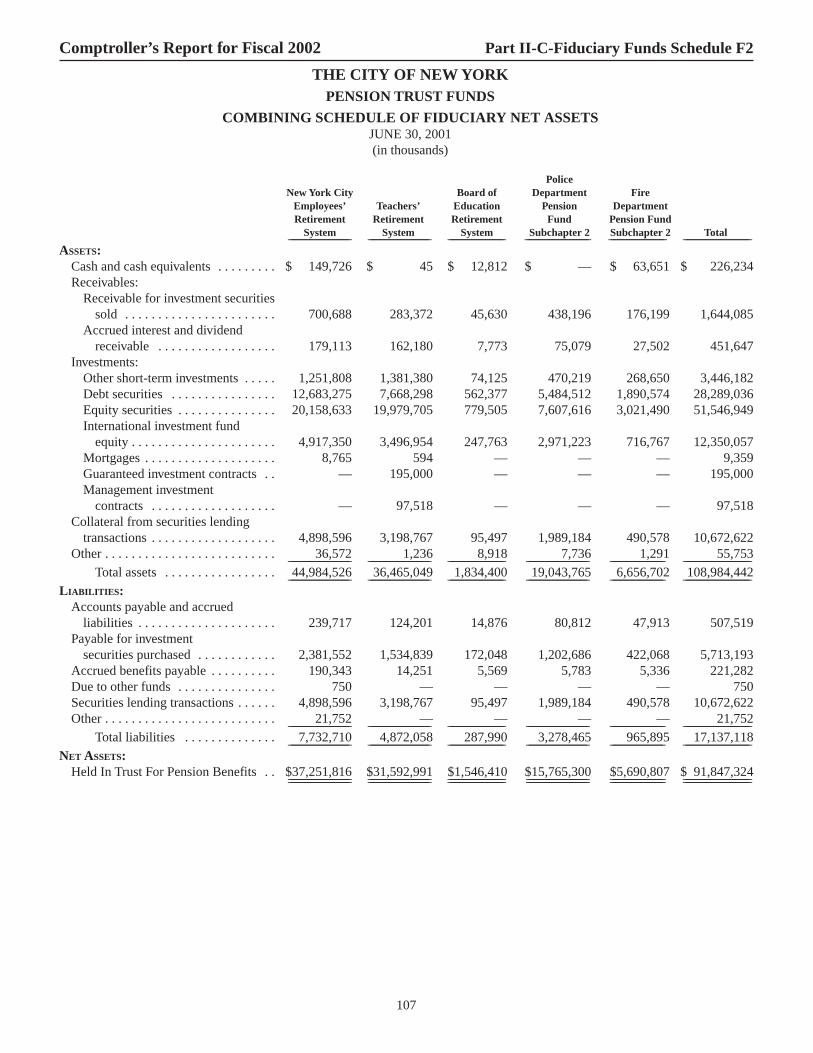
107
PoliceNew York City Board of Department Fire
Employees’ Teachers’ Education Pension DepartmentRetirement Retirement Retirement Fund Pension Fund
System System System Subchapter 2 Subchapter 2 Total_______________________ _______________________ _____________________ ________________________ _____________________ _________________________
ASSETS:Cash and cash equivalents . . . . . . . . . $ 149,726 $ 45 $ 12,812 $ — $ 63,651 $ 226,234Receivables:
Receivable for investment securitiessold . . . . . . . . . . . . . . . . . . . . . . . 700,688 283,372 45,630 438,196 176,199 1,644,085
Accrued interest and dividendreceivable . . . . . . . . . . . . . . . . . . 179,113 162,180 7,773 75,079 27,502 451,647
Investments:Other short-term investments . . . . . 1,251,808 1,381,380 74,125 470,219 268,650 3,446,182Debt securities . . . . . . . . . . . . . . . . 12,683,275 7,668,298 562,377 5,484,512 1,890,574 28,289,036Equity securities . . . . . . . . . . . . . . . 20,158,633 19,979,705 779,505 7,607,616 3,021,490 51,546,949International investment fund
equity . . . . . . . . . . . . . . . . . . . . . . 4,917,350 3,496,954 247,763 2,971,223 716,767 12,350,057Mortgages . . . . . . . . . . . . . . . . . . . . 8,765 594 — — — 9,359Guaranteed investment contracts . . — 195,000 — — — 195,000Management investment
contracts . . . . . . . . . . . . . . . . . . . — 97,518 — — — 97,518Collateral from securities lending
transactions . . . . . . . . . . . . . . . . . . . 4,898,596 3,198,767 95,497 1,989,184 490,578 10,672,622Other . . . . . . . . . . . . . . . . . . . . . . . . . . 36,572 1,236 8,918 7,736 1,291 55,753_______________________ _______________________ _____________________ _______________________ ____________________ _________________________
Total assets . . . . . . . . . . . . . . . . . 44,984,526 36,465,049 1,834,400 19,043,765 6,656,702 108,984,442_______________________ _______________________ _____________________ _______________________ ____________________ _________________________
LIABILITIES:Accounts payable and accrued
liabilities . . . . . . . . . . . . . . . . . . . . . 239,717 124,201 14,876 80,812 47,913 507,519Payable for investment
securities purchased . . . . . . . . . . . . 2,381,552 1,534,839 172,048 1,202,686 422,068 5,713,193Accrued benefits payable . . . . . . . . . . 190,343 14,251 5,569 5,783 5,336 221,282Due to other funds . . . . . . . . . . . . . . . 750 — — — — 750Securities lending transactions . . . . . . 4,898,596 3,198,767 95,497 1,989,184 490,578 10,672,622Other . . . . . . . . . . . . . . . . . . . . . . . . . . 21,752 — — — — 21,752_______________________ _______________________ _____________________ _______________________ ____________________ _________________________
Total liabilities . . . . . . . . . . . . . . 7,732,710 4,872,058 287,990 3,278,465 965,895 17,137,118_______________________ _______________________ _____________________ _______________________ ____________________ _________________________
NET ASSETS:Held In Trust For Pension Benefits . . $37,251,816 $31,592,991 $1,546,410 $15,765,300 $5,690,807 $ 91,847,324_______________________ _______________________ _____________________ _______________________ ____________________ ________________________________________________ _______________________ _____________________ _______________________ ____________________ _________________________
Comptroller’s Report for Fiscal 2002 Part II-C-Fiduciary Funds Schedule F2
THE CITY OF NEW YORKPENSION TRUST FUNDS
COMBINING SCHEDULE OF FIDUCIARY NET ASSETSJUNE 30, 2001(in thousands)

108
Tra
nsit
Hou
sing
Pol
ice
Tra
nsit
Pol
ice
Hou
sing
Pol
ice
Pol
ice
Supe
rior
Pol
ice
Supe
rior
Pol
ice
Supe
rior
Cor
rect
ion
Off
icer
s’O
ffic
ers’
Fir
e F
ight
ers’
Fir
e O
ffic
ers’
Off
icer
s’O
ffic
ers’
Off
icer
s’O
ffic
ers’
Off
icer
s’V
aria
ble
Var
iabl
eV
aria
ble
Var
iabl
eV
aria
ble
Var
iabl
eV
aria
ble
Var
iabl
eV
aria
ble
Supp
lem
ents
Supp
lem
ents
Supp
lem
ents
Supp
lem
ents
Supp
lem
ents
Supp
lem
ents
Supp
lem
ents
Supp
lem
ents
Supp
lem
ents
Fun
dF
und
Fun
dF
und
Fun
dF
und
Fun
dF
und
Fun
dTo
tal
______
______
______
____
______
______
______
____
______
______
______
____
______
______
______
______
______
____
______
______
______
____
______
______
______
____
______
______
______
______
______
______
_____
______
______
______
____
______
______
______
_
ASS
ET
S:C
ash
. . .
. . .
. . .
. . .
. . .
. . .
. .
$16
9$
195
$20
$93
3$
33$
21$
29$
—$
—$
1,40
0 R
ecei
vabl
es:
Rec
eiva
ble
for
inve
stm
ent
secu
ritie
s so
ld .
. . .
. . .
. .
19,0
2621
,269
8,85
31,
796
——
——
—50
,944
A
ccru
ed in
tere
st a
nd
divi
dend
rec
eiva
ble
. . .
. .4,
559
5,19
12,
253
1,38
016
019
16—
209
13,7
87
Inve
stm
ents
:O
ther
sho
rt-t
erm
in
vest
men
ts .
. . .
. . .
. . .
.27
,228
34,4
3113
,284
5,07
28,
619
1,52
44,
729
—70
195
,588
D
ebt s
ecur
ities
. .
. . .
. . .
. .36
0,02
941
4,80
818
9,33
989
,873
17,9
863,
586
1,91
7—
98,8
701,
176,
408
Equ
ity s
ecur
ities
. . .
. . .
. . .
435,
139
489,
575
243,
556
131,
403
——
——
—1,
299,
673
Inte
rnat
iona
l inv
estm
ent
fund
—eq
uity
. .
. . .
. . .
.20
3,74
823
7,24
781
,977
43,5
40—
——
——
566,
512
Col
late
ral f
rom
sec
uriti
esle
ndin
g tr
ansa
ctio
ns .
. . .
92,0
7644
,708
23,2
8111
,745
——
——
—17
1,81
0 D
ue f
rom
oth
er f
unds
. .
. . .
.—
——
——
——
1,14
3—
1,14
3 ___
______
______
_____
______
______
_____
______
_____
______
______
_____
______
______
______
____
______
____
______
____
______
______
______
______
__T
OTA
LA
SSE
TS
. . .
. . .
. . .
.1,
141,
974
1,24
7,42
456
2,56
328
5,74
226
,798
5,15
06,
691
1,14
399
,780
3,37
7,26
5 ___
______
______
_____
______
______
_____
______
_____
______
______
_____
______
______
______
____
______
____
______
____
______
______
______
______
__L
IAB
ILIT
IES:
Acc
ount
s pa
yabl
e an
d ac
crue
d lia
bilit
ies
. . .
. . .
. .
39,0
0043
,840
22,0
59—
——
——
610
4,90
5 Pa
yabl
e fo
r in
vest
men
t se
curi
ties
purc
hase
d .
. . .
. .93
,759
108,
867
48,0
246,
039
——
——
—25
6,68
9 A
ccru
ed b
enef
its p
ayab
le .
. .
21,9
9633
,402
17,7
398,
127
1,55
51,
212
892
1,14
3—
86,0
66
Secu
ritie
s le
ndin
g tr
ansa
ctio
ns .
92,0
7644
,708
23,2
8111
,745
——
——
—17
1,81
0 ___
______
______
_____
______
______
_____
______
_____
______
______
_____
______
______
______
____
______
____
______
____
______
______
______
______
__To
tal l
iabi
litie
s .
. . .
. . .
. . .
. .24
6,83
123
0,81
711
1,10
325
,911
1,55
51,
212
892
1,14
36
619,
470
______
______
_____
______
______
_____
______
______
_____
______
_____
______
______
______
____
______
____
______
____
______
______
______
______
_____
NE
TA
SSE
TS:
Hel
d in
Tru
st f
or S
uppl
emen
tal
Ben
efit
Paym
ents
. . .
. . .
. .
$89
5,14
3$1
,016
,607
$451
,460
$259
,831
$25,
243
$3,9
38$5
,799
$—
$99,
774
$2,7
57,7
95___
______
______
_____
______
______
_____
______
_____
______
______
_____
______
______
______
____
______
____
______
____
______
______
______
______
_____
______
______
_____
______
______
_____
______
_____
______
______
_____
______
______
______
____
______
____
______
____
______
______
______
______
__
Com
ptro
ller’
s R
epor
t fo
r F
isca
l 200
2P
art
II-C
—F
iduc
iary
Fun
ds—
Sche
dule
F3
TH
E C
ITY
OF
NE
W Y
OR
K
VA
RIA
BL
E S
UP
PL
EM
EN
TS
FU
ND
S C
OM
BIN
ING
SC
HE
DU
LE
OF
FID
UC
IAR
Y N
ET
ASS
ET
SJU
NE
30,
2002
(in
thou
sand
s)

109
Tra
nsit
Hou
sing
Pol
ice
Tra
nsit
Pol
ice
Hou
sing
Pol
ice
Pol
ice
Supe
rior
Fir
eP
olic
eSu
peri
orP
olic
eSu
peri
orC
orre
ctio
nO
ffic
ers’
Off
icer
s’F
ight
ers
Fig
hter
s’O
ffic
ers’
Off
icer
s’O
ffic
ers’
Off
icer
s’O
ffic
ers’
Off
icer
s’V
aria
ble
Var
iabl
eV
aria
ble
Var
iabl
eV
aria
ble
Var
iabl
eV
aria
ble
Var
iabl
eV
aria
ble
Supp
lem
ents
Supp
lem
ents
Supp
lem
ents
Supp
lem
ents
Supp
lem
ents
Supp
lem
ents
Supp
lem
ents
Supp
lem
ents
Supp
lem
ents
Fun
dF
und
Fun
dF
und
Fun
dF
und
Fun
dF
und
Fun
dTo
tal
______
______
______
____
______
______
______
____
______
______
______
____
______
______
______
______
______
____
______
______
______
____
______
______
______
____
______
______
______
______
______
______
_____
______
______
______
____
______
______
______
_
ASS
ET
S:C
ash
and
cash
equ
ival
ents
. . .
$29
9$
287
$—
$1,
289
$25
$12
8$
64$
23$
—$
2,11
5R
ecei
vabl
es:
Rec
eiva
ble
for
inve
stm
ent
secu
ritie
s so
ld .
. . .
. . .
. .27
,211
31,5
3911
,268
3,80
3—
——
——
73,8
21A
ccru
ed in
tere
st a
nddi
vide
nd r
ecei
vabl
e .
. . .
. .4,
807
5,54
12,
472
1,37
522
037
461
120
14,6
19In
vest
men
ts:
Oth
er s
hort
-ter
m
inve
stm
ents
. . .
. . .
. . .
. . .
48,2
5758
,474
25,1
956,
907
4,85
51,
909
3,60
241
698
,545
248,
160
Deb
t sec
uriti
es .
. . .
. . .
. . .
. .35
8,62
241
2,75
618
5,01
391
,947
22,6
984,
947
4,34
7—
—1,
080,
330
Equ
ity s
ecur
ities
. . .
. . .
. . .
. .
511,
672
579,
369
288,
578
155,
863
——
——
—1,
535,
482
Inte
rnat
iona
l inv
estm
ent
fund
—eq
uity
. . .
. . .
. . .
. .
225,
986
259,
334
88,8
0947
,979
——
——
—62
2,10
8C
olla
tera
l fro
m s
ecur
ities
lend
ing
tran
sact
ions
. . .
. . .
130,
487
33,0
6834
,020
12,7
04—
——
——
210,
279
Due
fro
m o
ther
fun
ds .
. . .
. .—
——
——
——
750
—75
0___
______
______
_____
______
______
_____
______
_____
______
______
_____
______
______
______
____
______
____
______
____
______
______
______
______
_T
OTA
LA
SSE
TS
. . .
. . .
. . .
.1,
307,
341
1,38
0,36
863
5,35
532
1,86
727
,798
7,02
18,
059
1,19
098
,665
3,78
7,66
4___
______
______
_____
______
______
_____
______
_____
______
______
_____
______
______
______
____
______
____
______
____
______
______
______
______
_L
IAB
ILIT
IES:
Acc
ount
s pa
yabl
e an
dac
crue
d lia
bilit
ies
. . .
. . .
. .—
—2,
457
——
——
——
2,45
7Pa
yabl
e fo
r in
vest
men
tse
curi
ties
purc
hase
d .
. . .
. .91
,424
105,
186
41,3
326,
127
——
——
—24
4,06
9A
ccru
ed b
enef
its p
ayab
le .
. .24
,902
30,5
0116
,688
7,60
01,
685
1,28
499
11,
190
—84
,841
Secu
ritie
s le
ndin
g tr
ansa
ctio
ns
130,
487
33,0
6834
,020
12,7
04—
——
——
210,
279
______
______
_____
______
______
_____
______
______
_____
______
_____
______
______
______
____
______
____
______
____
______
______
______
______
____
Tota
l lia
bilit
ies
. . .
. . .
. .
246,
813
168,
755
94,4
9726
,431
1,68
51,
284
991
1,19
0—
541,
646
______
______
_____
______
______
_____
______
______
_____
______
_____
______
______
______
____
______
____
______
____
______
______
______
______
____
NE
TA
SSE
TS:
Hel
d In
Tru
st F
or S
uppl
emen
tal
Ben
efit
Paym
ents
. . .
. . .
. .
$1,0
60,5
28$1
,211
,613
$540
,858
$295
,436
$26,
113
$5,7
37$7
,068
$—
$98,
665
$3,2
46,0
18___
______
______
_____
______
______
_____
______
_____
______
______
_____
______
______
______
____
______
____
______
____
______
______
______
______
____
______
______
_____
______
______
_____
______
_____
______
______
_____
______
______
______
____
______
____
______
____
______
______
______
______
_
Com
ptro
ller’
s R
epor
t fo
r F
isca
l 200
2P
art
II-C
—F
iduc
iary
Fun
ds—
Sche
dule
F4
TH
E C
ITY
OF
NE
W Y
OR
K
VA
RIA
BL
E S
UP
PL
EM
EN
TS
FU
ND
S C
OM
BIN
ING
SC
HE
DU
LE
OF
FID
UC
IAR
Y N
ET
ASS
ET
SJU
NE
30,
2001
(in
thou
sand
s)

110
New YorkCity Board of Police Fire
Employees’ Teachers’ Education Department DepartmentRetirement Retirement Retirement Pension Fund Pension Fund
System System System Subchapter 2 Subchapter 2 Total________________________ ________________________ _____________________ ________________________ _____________________ ___________________________
ADDITIONS:Contributions:Member contributions (net of
loans to members) . . . . . . . . . . . . . . $ 230,417 $ 107,080 $ 24,107 $ 7,259 $ 33,722 $ 402,585Employer contributions . . . . . . . . . . . 105,660 509,932 56,548 534,476 302,318 1,508,934Other employer contributions . . . . . . . — 22,020 — — — 22,020___________________ ___________________ _________________ ___________________ _________________ _____________________
Total contributions . . . . . . . . . . . 336,077 639,032 80,655 541,735 336,040 1,933,539___________________ ___________________ _________________ ___________________ _________________ _____________________Investment income:
Interest income . . . . . . . . . . . . . . . . 908,038 622,928 24,922 367,195 141,477 2,064,560Dividend income . . . . . . . . . . . . . . . 328,345 254,632 10,230 117,928 41,138 752,273Net depreciation in fair
value of investments . . . . . . . . . . (4,144,320) (3,961,685) (124,241) (1,723,641) (800,100) (10,753,987)Less investment expenses . . . . . . . . 138,258 95,344 4,514 63,719 23,594 325,429___________________ ___________________ _________________ ___________________ _________________ _____________________Investment loss, net . . . . . . . . . . . . (3,046,195) (3,179,469) (93,603) (1,302,237) (641,079) (8,262,583)___________________ ___________________ _________________ ___________________ _________________ _____________________
Other . . . . . . . . . . . . . . . . . . . . . . . . . . 2,758 — 1,669 5,105 18,021 27,553___________________ ___________________ _________________ ___________________ _________________ _____________________Total additions . . . . . . . . . . . . . . . (2,707,360) (2,540,437) (11,279) (755,397) (287,018) (6,301,491)___________________ ___________________ _________________ ___________________ _________________ _____________________
DEDUCTIONS:Benefit payments and withdrawals . . 2,513,374 2,161,677 129,732 1,116,735 616,407 6,537,925Payments to other funds . . . . . . . . . . . 2,099 — — — — 2,099Other . . . . . . . . . . . . . . . . . . . . . . . . . . 13,896 27,988 — — — 41,884Administrative expenses . . . . . . . . . . 31,548 32,523 — 7,660 — 71,731___________________ ___________________ _________________ ___________________ _________________ _____________________
Total deductions . . . . . . . . . . . . . 2,560,917 2,222,188 129,732 1,124,395 616,407 6,653,639___________________ ___________________ _________________ ___________________ _________________ _____________________Decrease in plan net assets . . . . . (5,268,277) (4,762,625) (141,011) (1,879,792) (903,425) (12,955,130)
NET ASSETS:Held in Trust for Pension Benefits:
Beginning of Year . . . . . . . . . . . . . . 37,251,816 31,592,991 1,546,410 15,765,300 5,690,807 91,847,324___________________ ___________________ _________________ ___________________ _________________ _____________________End of Year . . . . . . . . . . . . . . . . . . . $31,983,539 $26,830,366 $1,405,399 $13,885,508 $4,787,382 $ 78,892,194___________________ ___________________ _________________ ___________________ _________________ ________________________________________ ___________________ _________________ ___________________ _________________ _____________________
Comptroller’s Report for Fiscal 2002 Part II-C—Fiduciary Funds—Schedule F5
THE CITY OF NEW YORKPENSION TRUST FUNDS
COMBINING SCHEDULE OF CHANGES IN FIDUCIARY NET ASSETSFOR THE YEAR ENDED JUNE 30, 2002
(in thousands)

111
New YorkCity Board of Police Fire
Employees’ Teachers’ Education Department DepartmentRetirement Retirement Retirement Pension Fund Pension Fund
System System System Subchapter 2 Subchapter 2 Total________________________ ________________________ _____________________ ________________________ _____________________ ___________________________
ADDITIONS:Contributions:Member contributions (net of
loans to members) . . . . . . . . . . . . . $ 324,167 $ 129,783 $ 16,396 $ 37,862 $ 28,503 $ 536,711Employer contributions . . . . . . . . . . . 100,025 444,965 39,294 413,156 259,392 1,256,832Other employer contributions . . . . . . . — 21,324 — — — 21,324___________________ ___________________ _________________ ___________________ _________________ _____________________
Total contributions . . . . . . . . . . . 424,192 596,072 55,690 451,018 287,895 1,814,867___________________ ___________________ _________________ ___________________ _________________ _____________________Investment income:Interest income . . . . . . . . . . . . . . . 1,245,623 852,834 42,095 496,239 161,180 2,797,971Dividend income . . . . . . . . . . . . . . 279,083 282,210 9,868 108,317 38,552 718,030Net depreciation in fair value of
investments . . . . . . . . . . . . . . . . . (4,738,126) (4,729,478) (204,154) (1,951,395) (625,309) (12,248,462)Less investment expenses . . . . . . . . 316,887 210,673 9,113 127,118 39,942 703,733___________________ ___________________ _________________ ___________________ _________________ _____________________Investment loss, net . . . . . . . . . . . . (3,530,307) (3,805,107) (161,304) (1,473,957) (465,519) (9,436,194)___________________ ___________________ _________________ ___________________ _________________ _____________________
Other . . . . . . . . . . . . . . . . . . . . . . . . . 3,269 9,706 947 5,983 — 19,905___________________ ___________________ _________________ ___________________ _________________ _____________________Total additions . . . . . . . . . . . . . . (3,102,846) (3,199,329) (104,667) (1,016,956) (177,624) (7,601,422)___________________ ___________________ _________________ ___________________ _________________ _____________________
DEDUCTIONS:Benefit payments and withdrawals . . 2,415,917 1,928,301 120,416 1,031,162 551,183 6,046,979Payments to other funds . . . . . . . . . . . 750 — — — — 750Other . . . . . . . . . . . . . . . . . . . . . . . . . . 21,050 — — — — 21,050Administrative expenses . . . . . . . . . . 31,584 30,575 — — — 62,159___________________ ___________________ _________________ ___________________ _________________ _____________________
Total deductions . . . . . . . . . . . . . 2,469,301 1,958,876 120,416 1,031,162 551,183 6,130,938___________________ ___________________ _________________ ___________________ _________________ _____________________Decrease in plan net assets . . . . . (5,572,147) (5,158,205) (225,083) (2,048,118) (728,807) (13,732,360)
NET ASSETS:Held in Trust for Pension Benefits:
Beginning of Year . . . . . . . . . . . . . . 42,823,963 36,751,196 1,771,493 17,813,418 6,419,614 105,579,684___________________ ___________________ _________________ ___________________ _________________ _____________________End of Year . . . . . . . . . . . . . . . . . . . $37,251,816 $31,592,991 $1,546,410 $15,765,300 $5,690,807 $ 91,847,324___________________ ___________________ _________________ ___________________ _________________ ________________________________________ ___________________ _________________ ___________________ _________________ _____________________
Comptroller’s Report for Fiscal 2002 Part II-C—Fiduciary Funds—Schedule F6
THE CITY OF NEW YORKPENSION TRUST FUNDS
COMBINING SCHEDULE OF CHANGES IN FIDUCIARY NET ASSETSFOR THE YEAR ENDED JUNE 30, 2001
(in thousands)
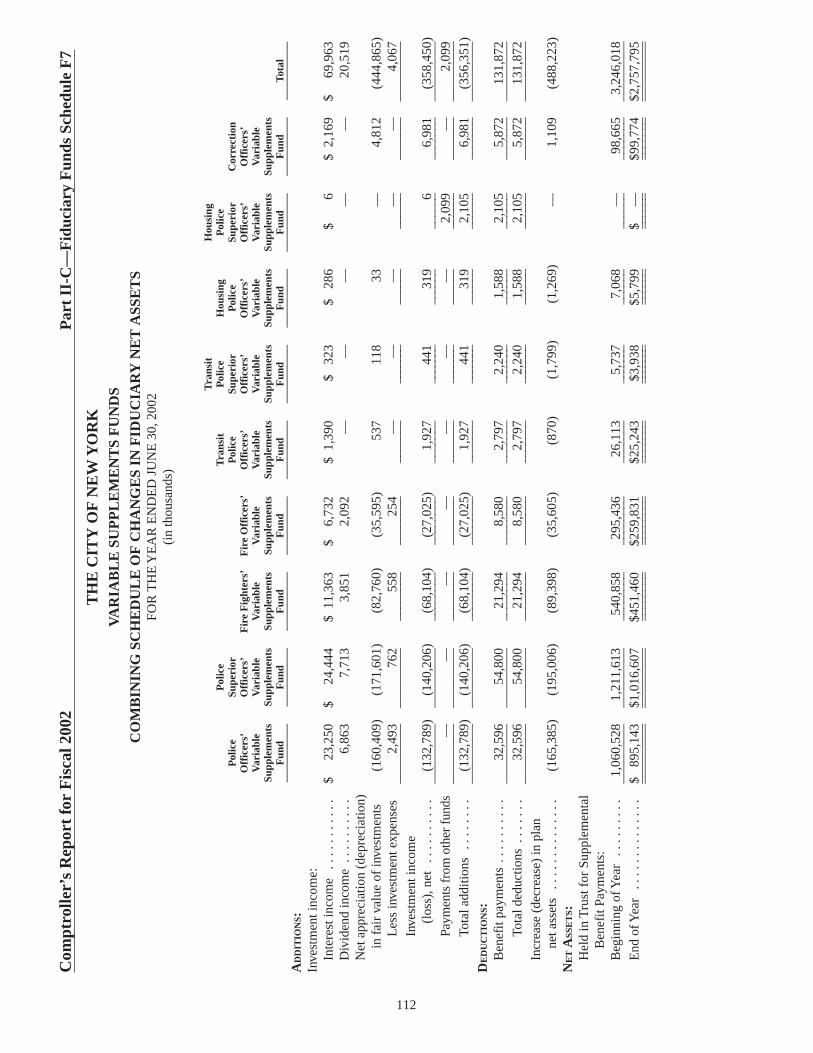
112
Com
ptro
ller’
s R
epor
t fo
r F
isca
l 200
2P
art
II-C
—F
iduc
iary
Fun
ds S
ched
ule
F7
TH
E C
ITY
OF
NE
W Y
OR
KV
AR
IAB
LE
SUP
PL
EM
EN
TS
FU
ND
S
CO
MB
ININ
G S
CH
ED
UL
E O
FC
HA
NG
ES
IN F
IDU
CIA
RY
NE
TA
SSE
TS
FOR
TH
E Y
EA
RE
ND
ED
JU
NE
30,
2002
(in
thou
sand
s)
Tra
nsit
Hou
sing
Pol
ice
Tra
nsit
Pol
ice
Hou
sing
Pol
ice
Pol
ice
Supe
rior
Pol
ice
Supe
rior
Pol
ice
Supe
rior
Cor
rect
ion
Off
icer
s’O
ffic
ers’
Fir
e F
ight
ers’
Fir
e O
ffic
ers’
Off
icer
s’O
ffic
ers’
Off
icer
s’O
ffic
ers’
Off
icer
s’V
aria
ble
Var
iabl
eV
aria
ble
Var
iabl
eV
aria
ble
Var
iabl
eV
aria
ble
Var
iabl
eV
aria
ble
Supp
lem
ents
Supp
lem
ents
Supp
lem
ents
Supp
lem
ents
Supp
lem
ents
Supp
lem
ents
Supp
lem
ents
Supp
lem
ents
Supp
lem
ents
Fun
dF
und
Fun
dF
und
Fun
dF
und
Fun
dF
und
Fun
dTo
tal
____
____
___
____
____
___
____
____
___
____
____
___
____
____
___
____
____
___
____
____
___
____
____
___
____
____
___
____
____
___
AD
DIT
ION
S:In
vest
men
t inc
ome:
Inte
rest
inco
me
. . .
. . .
. . .
. .
$23
,250
$24
,444
$11
,363
$6,
732
$1,
390
$32
3$
286
$6
$2,
169
$69
,963
D
ivid
end
inco
me
. . .
. . .
. . .
.6,
863
7,71
33,
851
2,09
2—
——
——
20,5
19
Net
app
reci
atio
n (d
epre
ciat
ion)
in
fai
r va
lue
of in
vest
men
ts(1
60,4
09)
(171
,601
)(8
2,76
0)(3
5,59
5)53
711
833
—4,
812
(444
,865
)L
ess
inve
stm
ent e
xpen
ses
2,49
376
255
825
4—
——
——
4,06
7__
____
___
____
____
___
____
____
____
____
____
___
____
___
____
____
____
____
___
____
___
Inve
stm
ent i
ncom
e (l
oss)
,net
. . .
. . .
. . .
.(1
32,7
89)
(140
,206
)(6
8,10
4)(2
7,02
5)1,
927
441
319
66,
981
(358
,450
)__
____
___
____
____
___
____
____
____
____
____
___
____
___
____
____
____
____
___
____
___
Paym
ents
fro
m o
ther
fun
ds—
——
——
——
2,09
9—
2,09
9 __
____
___
____
____
___
____
____
____
____
____
___
____
___
____
____
____
____
___
____
___
Tota
l add
ition
s .
. . .
. . .
.(1
32,7
89)
(140
,206
)(6
8,10
4)(2
7,02
5)1,
927
441
319
2,10
56,
981
(356
,351
)__
____
___
____
____
___
____
____
____
____
____
___
____
___
____
____
____
____
___
____
___
DE
DU
CT
ION
S:B
enef
it pa
ymen
ts .
. . .
. . .
. . .
32,5
9654
,800
21,2
948,
580
2,79
72,
240
1,58
82,
105
5,87
213
1,87
2 __
____
___
____
____
___
____
____
____
____
____
___
____
___
____
____
____
____
___
____
___
Tota
l ded
uctio
ns .
. . .
. . .
32,5
9654
,800
21,2
948,
580
2,79
72,
240
1,58
82,
105
5,87
213
1,87
2 __
____
___
____
____
___
____
____
____
____
____
___
____
___
____
____
____
____
___
____
___
Incr
ease
(de
crea
se)
in p
lan
net a
sset
s .
. . .
. . .
. . .
. . .
.(1
65,3
85)
(195
,006
)(8
9,39
8)(3
5,60
5)(8
70)
(1,7
99)
(1,2
69)
—1,
109
(488
,223
)N
ET
ASS
ET
S:H
eld
in T
rust
for
Sup
plem
enta
l B
enef
it Pa
ymen
ts:
Beg
inni
ng o
f Yea
r .
. . .
. . .
. .1,
060,
528
1,21
1,61
354
0,85
829
5,43
626
,113
5,73
77,
068
—98
,665
3,24
6,01
8 __
____
___
____
____
___
____
____
____
____
____
___
____
___
____
____
____
____
___
____
___
End
of Y
ear
. . .
. . .
. . .
. . .
. .
$89
5,14
3$1
,016
,607
$451
,460
$259
,831
$25,
243
$3,9
38$5
,799
$—
$99,
774
$2,7
57,7
95__
____
___
____
____
___
____
____
____
____
____
___
____
___
____
____
____
____
___
____
___
____
____
___
____
___
____
____
____
____
____
___
____
___
____
____
____
____
___
____
____
_

113
Com
ptro
ller’
s R
epor
t fo
r F
isca
l 200
2P
art
II-C
—F
iduc
iary
Fun
ds S
ched
ule
F8
TH
E C
ITY
OF
NE
W Y
OR
KV
AR
IAB
LE
SUP
PL
EM
EN
TS
FU
ND
S
CO
MB
ININ
G S
CH
ED
UL
E O
FC
HA
NG
ES
IN F
IDU
CIA
RY
NE
TA
SSE
TS
FOR
TH
E Y
EA
RE
ND
ED
JU
NE
30,
2001
(in
thou
sand
s)
Tra
nsit
Hou
sing
Pol
ice
Tra
nsit
Pol
ice
Hou
sing
Pol
ice
Pol
ice
Supe
rior
Pol
ice
Supe
rior
Pol
ice
Supe
rior
Cor
rect
ion
Off
icer
s’O
ffic
ers’
Fir
efig
hter
s’F
ire
Off
icer
s’O
ffic
ers’
Off
icer
s’O
ffic
ers’
Off
icer
s’O
ffic
ers’
Var
iabl
eV
aria
ble
Var
iabl
eV
aria
ble
Var
iabl
eV
aria
ble
Var
iabl
eV
aria
ble
Var
iabl
eSu
pple
men
tsSu
pple
men
tsSu
pple
men
tsSu
pple
men
tsSu
pple
men
tsSu
pple
men
tsSu
pple
men
tsSu
pple
men
tsSu
pple
men
tsF
und
Fun
dF
und
Fun
dF
und
Fun
dF
und
Fun
dF
und
Tota
l__
____
____
___
____
____
___
____
____
___
____
____
___
____
____
___
____
____
___
____
____
___
____
____
___
____
____
___
____
____
_A
DD
ITIO
NS:
Inve
stm
ent i
ncom
e:In
tere
st in
com
e .
. . .
. . .
. . .
.$
31,0
32$
30,1
25$
16,0
02$
7,42
5$
1,75
2$
49
2$
526
$91
$3,
907
$91
,352
Div
iden
d in
com
e .
. . .
. . .
. . .
7,74
38,
364
3,73
72,
075
——
——
—21
,919
Net
app
reci
atio
n (d
epre
ciat
ion)
in
fai
r va
lue
of
inve
stm
ents
. . .
. . .
. . .
. . .
(137
,841
)(1
55,3
93)
(68,
108)
(35,
453)
1,11
430
034
934
—(3
94,9
98)
Les
s in
vest
men
t exp
ense
s6,
862
3,13
31,
449
639
——
——
—12
,083
____
____
___
____
___
____
____
____
____
____
___
____
___
____
____
____
____
___
____
____
_In
vest
men
t inc
ome
(los
s),n
et .
. . .
. . .
. . .
(105
,928
)(1
20,0
37)
(49,
818)
(26,
592)
2,86
679
287
512
53,
907
(293
,810
)__
____
___
____
____
___
____
____
____
____
____
___
____
___
____
____
____
____
___
____
___
Paym
ents
fro
m
othe
r fu
nds
. . .
. . .
. . .
——
——
——
—75
0—
750
____
____
___
____
___
____
____
____
____
____
___
____
___
____
____
____
____
___
____
____
_To
tal a
dditi
ons
. . .
. . .
. .
(105
,928
)(1
20,0
37)
(49,
818)
(26,
592)
2,86
679
287
587
53,
907
(293
,060
)__
____
___
____
____
___
____
____
____
____
____
___
____
___
____
____
____
____
___
____
___
DE
DU
CT
ION
S:B
enef
it pa
ymen
ts .
. . .
. . .
. . .
50,0
2362
,224
27,4
7811
,131
3,18
33,
714
1,86
13,
441
1,32
316
4,37
8O
ther
. . .
. . .
. . .
. . .
. . .
. . .
.—
——
——
——
—3,
269
3,26
9__
____
___
____
____
___
____
____
____
____
____
___
____
___
____
____
____
____
___
____
___
Tota
l ded
uctio
ns .
. . .
. . .
50,0
2362
,224
27,4
7811
,131
3,18
33,
714
1,86
13,
441
4,59
216
7,64
7__
____
___
____
____
___
____
____
____
____
____
___
____
___
____
____
____
____
___
____
___
Dec
reas
e in
pla
n ne
t ass
ets
. . .
. . .
. . .
.(1
55,9
51)
(182
,261
)(7
7,29
6)(3
7,72
3)(3
17)
(2,9
22)
(986
)(2
,566
)(6
85)
(460
,707
)N
ET
ASS
ET
S:H
eld
in T
rust
for
Sup
plem
enta
l B
enef
it Pa
ymen
ts:
Beg
inni
ng o
f Yea
r . .
. . .
.1,
216,
479
1,39
3,87
461
8,15
433
3,15
926
,430
8,65
98,
054
2,56
699
,350
3,70
6,72
5__
____
___
____
____
___
____
____
____
____
____
___
____
___
____
____
____
____
___
____
___
End
of Y
ear
. . .
. . .
. . .
. .$1
,060
,528
$1,2
11,6
13$5
40,8
58$2
95,4
36$2
6,11
3$
5,73
7$7
,068
$—
$98,
665
$3,2
46,0
18__
____
___
____
____
___
____
____
____
____
____
___
____
___
____
____
____
____
___
____
___
____
____
___
____
___
____
____
____
____
____
___
____
___
____
____
____
____
___
____
____
_

[This page intentionally left blank.]

The City of New York
ComprehensiveAnnual Financial Report
of the Comptroller
COMBINING FINANCIAL INFORMATION —COMPONENT UNITS
Part II-D
Fiscal Year Ended June 30, 2002


[This page intentionally left blank.]
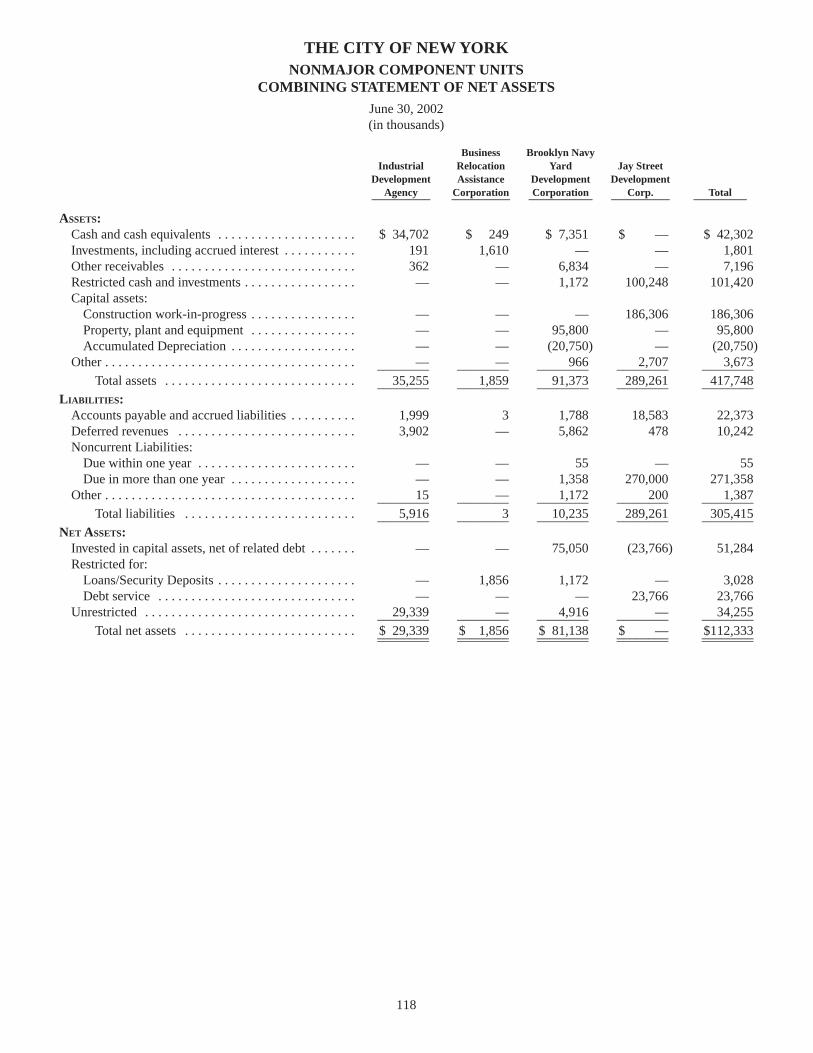
Business Brooklyn NavyIndustrial Relocation Yard Jay Street
Development Assistance Development DevelopmentAgency Corporation Corporation Corp. Total___________ ___________ ____________ ___________ __________
ASSETS:Cash and cash equivalents . . . . . . . . . . . . . . . . . . . . . $ 34,702 $ 249 $ 7,351 $ — $ 42,302Investments, including accrued interest . . . . . . . . . . . 191 1,610 — — 1,801Other receivables . . . . . . . . . . . . . . . . . . . . . . . . . . . . 362 — 6,834 — 7,196Restricted cash and investments . . . . . . . . . . . . . . . . . — — 1,172 100,248 101,420Capital assets:
Construction work-in-progress . . . . . . . . . . . . . . . . — — — 186,306 186,306Property, plant and equipment . . . . . . . . . . . . . . . . — — 95,800 — 95,800Accumulated Depreciation . . . . . . . . . . . . . . . . . . . — — (20,750) — (20,750)
Other . . . . . . . . . . . . . . . . . . . . . . . . . . . . . . . . . . . . . . — — 966 2,707 3,673________ ________ ________ ________ ________Total assets . . . . . . . . . . . . . . . . . . . . . . . . . . . . . 35,255 1,859 91,373 289,261 417,748________ ________ ________ ________ ________
LIABILITIES:Accounts payable and accrued liabilities . . . . . . . . . . 1,999 3 1,788 18,583 22,373Deferred revenues . . . . . . . . . . . . . . . . . . . . . . . . . . . 3,902 — 5,862 478 10,242Noncurrent Liabilities:
Due within one year . . . . . . . . . . . . . . . . . . . . . . . . — — 55 — 55Due in more than one year . . . . . . . . . . . . . . . . . . . — — 1,358 270,000 271,358
Other . . . . . . . . . . . . . . . . . . . . . . . . . . . . . . . . . . . . . . 15 — 1,172 200 1,387________ ________ ________ ________ ________Total liabilities . . . . . . . . . . . . . . . . . . . . . . . . . . 5,916 3 10,235 289,261 305,415________ ________ ________ ________ ________
NET ASSETS:Invested in capital assets, net of related debt . . . . . . . — — 75,050 (23,766) 51,284Restricted for:
Loans/Security Deposits . . . . . . . . . . . . . . . . . . . . . — 1,856 1,172 — 3,028Debt service . . . . . . . . . . . . . . . . . . . . . . . . . . . . . . — — — 23,766 23,766
Unrestricted . . . . . . . . . . . . . . . . . . . . . . . . . . . . . . . . 29,339 — 4,916 — 34,255________ ________ ________ ________ ________Total net assets . . . . . . . . . . . . . . . . . . . . . . . . . . $ 29,339 $ 1,856 $ 81,138 $ — $112,333________ ________ ________ ________ ________________ ________ ________ ________ ________
118
THE CITY OF NEW YORKNONMAJOR COMPONENT UNITS
COMBINING STATEMENT OF NET ASSETS
June 30, 2002(in thousands)

Business Brooklyn NavyIndustrial Relocation Yard Jay Street
Development Assistance Development DevelopmentAgency Corporation Corporation Corp. Total___________ ___________ ____________ ___________ __________
ASSETS:Cash and cash equivalents . . . . . . . . . . . . . . . . . . . . . $ 29,978 $ 221 $ 7,995 $ — $ 38,194Investments, including accrued interest . . . . . . . . . . . 289 2,138 — — 2,427Other receivables . . . . . . . . . . . . . . . . . . . . . . . . . . . . 915 — 3,820 — 4,735Restricted cash and investments . . . . . . . . . . . . . . . . . — — 1,035 220,064 221,099Capital assets:
Construction work-in-progress . . . . . . . . . . . . . . . . — — — 55,212 55,212Property, plant and equipment . . . . . . . . . . . . . . . . — — 78,178 — 78,178Accumulated depreciation . . . . . . . . . . . . . . . . . . . — — (16,671) — (16,671)
Other . . . . . . . . . . . . . . . . . . . . . . . . . . . . . . . . . . . . . . — — 808 2,830 3,638________ ________ ________ ________ ________Total assets . . . . . . . . . . . . . . . . . . . . . . . . . . . . . 31,182 2,359 75,165 278,106 386,812________ ________ ________ ________ ________
LIABILITIES:Accounts payable and accrued liabilities . . . . . . . . . . 1,029 3 1,287 8,553 10,872Deferred revenues . . . . . . . . . . . . . . . . . . . . . . . . . . . 4,526 — 4,679 328 9,533Noncurrent Liabilities:
Due within one year . . . . . . . . . . . . . . . . . . . . . . . . — — 17 — 17Due in more than one year . . . . . . . . . . . . . . . . . . . — — 158 270,000 270,158
Other . . . . . . . . . . . . . . . . . . . . . . . . . . . . . . . . . . . . . . 59 — 1,035 383 1,477________ ________ ________ ________ ________Total liabilities . . . . . . . . . . . . . . . . . . . . . . . . . . 5,614 3 7,176 279,264 292,057________ ________ ________ ________ ________
NET ASSETS:Invested in capital assets, net of related debt . . . . . . . — — 61,507 (23,564) 37,943Restricted for:
Loans/Security Deposits . . . . . . . . . . . . . . . . . . . . . — 2,356 1,035 — 3,391Debt service . . . . . . . . . . . . . . . . . . . . . . . . . . . . . . — — — 23,564 23,564
Unrestricted (deficit) . . . . . . . . . . . . . . . . . . . . . . . . . 25,568 — 5,447 (1,158) 29,857________ ________ ________ ________ ________Total net assets (deficit) . . . . . . . . . . . . . . . . . . . $ 25,568 $ 2,356 $ 67,989 $ (1,158) $ 94,755________ ________ ________ ________ ________________ ________ ________ ________ ________
119
THE CITY OF NEW YORKNONMAJOR COMPONENT UNITS
COMBINING STATEMENT OF NET ASSETS
June 30, 2001(in thousands)

Business Brooklyn NavyIndustrial Relocation Yard Jay Street
Development Assistance Development DevelopmentAgency Corporation Corporation Corp. Total___________ ___________ ____________ ___________ __________
EXPENSES . . . . . . . . . . . . . . . . . . . . . . . . . . . . . . . . . . . . $ 9,575 $ 553 $ 18,158 $ 322 $ 28,608__________ __________ __________ __________ __________PROGRAM REVENUES:
Charges for Services . . . . . . . . . . . . . . . . . . . . . . . . . 12,608 — 15,360 — 27,968Capital Grants and Contributions . . . . . . . . . . . . . . . . — — 15,793 — 15,793__________ __________ __________ __________ __________
Total program revenues . . . . . . . . . . . . . . . . . . . . 12,608 — 31,153 — 43,761__________ __________ __________ __________ __________
Net program revenues (expenses) . . . . . . . . . . . . . . . . . 3,033 (553) 12,995 (322) 15,153__________ __________ __________ __________ __________
GENERAL REVENUES:Investment income . . . . . . . . . . . . . . . . . . . . . . . . . . . 738 53 154 — 945Other . . . . . . . . . . . . . . . . . . . . . . . . . . . . . . . . . . . . . . — — — 1,480 1,480__________ __________ __________ __________ __________General revenues, net . . . . . . . . . . . . . . . . . . . . . . . . . 738 53 154 1,480 2,425__________ __________ __________ __________ __________
Change in net assets . . . . . . . . . . . . . . . . . . . . . . 3,771 (500) 13,149 1,158 17,578Net assets—Beginning . . . . . . . . . . . . . . . . . . . . . . . . . . 25,568 2,356 67,989 (1,158) 94,755__________ __________ __________ __________ __________Net assets—Ending . . . . . . . . . . . . . . . . . . . . . . . . . . . . $ 29,339 $ 1,856 $ 81,138 $ — $ 112,333__________ __________ __________ __________ ____________________ __________ __________ __________ __________
120
THE CITY OF NEW YORKNONMAJOR COMPONENT UNITS
COMBINING STATEMENT OF ACTIVITIES
FOR THE YEAR ENDED JUNE 30, 2002(in thousands)

Business Brooklyn NavyIndustrial Relocation Yard Jay Street
Development Assistance Development DevelopmentAgency Corporation Corporation Corp. Total___________ ___________ ____________ ___________ __________
EXPENSES . . . . . . . . . . . . . . . . . . . . . . . . . . . . . . . . . . . . $ 5,566 $ 503 $ 17,279 $ 1,563 $ 24,911__________ __________ __________ __________ __________PROGRAM REVENUES:
Charges for Services . . . . . . . . . . . . . . . . . . . . . . . . . 7,897 — 14,359 — 22,256Capital Grants and Contributions . . . . . . . . . . . . . . . . — — 6,033 — 6,033__________ __________ __________ __________ __________
Total program revenues . . . . . . . . . . . . . . . . . . . . 7,897 — 20,392 — 28,289__________ __________ __________ __________ __________
Net program revenues (expenses) . . . . . . . . . . . . . . . . . 2,331 (503) 3,113 (1,563) 3,378__________ __________ __________ __________ __________
GENERAL REVENUES:Investment income . . . . . . . . . . . . . . . . . . . . . . . . . . . 1,798 146 237 135 2,316Other . . . . . . . . . . . . . . . . . . . . . . . . . . . . . . . . . . . . . . — — 9,013 270 9,283__________ __________ __________ __________ __________General revenues, net . . . . . . . . . . . . . . . . . . . . . . . . . 1,798 146 9,250 405 11,599__________ __________ __________ __________ __________
Change in net assets . . . . . . . . . . . . . . . . . . . . . . 4,129 (357) 12,363 (1,158) 14,977Net assets—Beginning . . . . . . . . . . . . . . . . . . . . . . . . . . 21,439 2,713 55,626 — 79,778__________ __________ __________ __________ __________Net assets—Ending . . . . . . . . . . . . . . . . . . . . . . . . . . . . $ 25,568 $ 2,356 $ 67,989 $ (1,158) $ 94,755__________ __________ __________ __________ ____________________ __________ __________ __________ __________
121
THE CITY OF NEW YORKNONMAJOR COMPONENT UNITS
COMBINING STATEMENT OF ACTIVITIES
FOR THE YEAR ENDED JUNE 30, 2001(in thousands)

[This page intentionally left blank.]

The City of New York
ComprehensiveAnnual Financial Report
of the Comptroller
OTHER SUPPLEMENTARY INFORMATION
Part II-E
Fiscal Year Ended June 30, 2002


GENERAL FUND
OTHER SUPPLEMENTARY INFORMATION

FISCAL 2002:Federal Grants—Categorical . . . . . . . . . . . . . . . . . . . . . . . . . . . . . . . . . . . . . . . . . . . . . . . . . . . . . . . . . . . . . . $1,949,117,245State Grants—Categorical . . . . . . . . . . . . . . . . . . . . . . . . . . . . . . . . . . . . . . . . . . . . . . . . . . . . . . . . . . . . . . . . 1,708,239,868Non-Governmental Grants . . . . . . . . . . . . . . . . . . . . . . . . . . . . . . . . . . . . . . . . . . . . . . . . . . . . . . . . . . . . . . . . 131,644,359Unrestricted Federal and State Aid . . . . . . . . . . . . . . . . . . . . . . . . . . . . . . . . . . . . . . . . . . . . . . . . . . . . . . . . . . 307,248,351 _________________________
Total—Receivables 2002 . . . . . . . . . . . . . . . . . . . . . . . . . . . . . . . . . . . . . . . . . . . . . . . . . . . . . . . . . . . . . . 4,096,249,823 _________________________FISCAL 2001: . . . . . . . . . . . . . . . . . . . . . . . . . . . . . . . . . . . . . . . . . . . . . . . . . . . . . . . . . . . . . . . . . . . . . . . . . . . . .
Federal Grants—Categorical . . . . . . . . . . . . . . . . . . . . . . . . . . . . . . . . . . . . . . . . . . . . . . . . . . . . . . . . . . . . . . 189,183,497 State Grants—Categorical . . . . . . . . . . . . . . . . . . . . . . . . . . . . . . . . . . . . . . . . . . . . . . . . . . . . . . . . . . . . . . . . 126,721,037 Non-Governmental Grants . . . . . . . . . . . . . . . . . . . . . . . . . . . . . . . . . . . . . . . . . . . . . . . . . . . . . . . . . . . . . . . . 4,322,019 _________________________
Total—Receivables 2001 . . . . . . . . . . . . . . . . . . . . . . . . . . . . . . . . . . . . . . . . . . . . . . . . . . . . . . . . . . . . . . 320,226,553 _________________________FISCAL 2000:
Federal Grants—Categorical . . . . . . . . . . . . . . . . . . . . . . . . . . . . . . . . . . . . . . . . . . . . . . . . . . . . . . . . . . . . . . 71,785,096 State Grants—Categorical . . . . . . . . . . . . . . . . . . . . . . . . . . . . . . . . . . . . . . . . . . . . . . . . . . . . . . . . . . . . . . . . 88,380,432 Non-Governmental Grants . . . . . . . . . . . . . . . . . . . . . . . . . . . . . . . . . . . . . . . . . . . . . . . . . . . . . . . . . . . . . . . . 3,782,684 _________________________
Total—Receivables 2000 . . . . . . . . . . . . . . . . . . . . . . . . . . . . . . . . . . . . . . . . . . . . . . . . . . . . . . . . . . . . . . 163,948,212 _________________________FISCAL 1999:
Federal Grants—Categorical . . . . . . . . . . . . . . . . . . . . . . . . . . . . . . . . . . . . . . . . . . . . . . . . . . . . . . . . . . . . . . 18,297,117 State Grants—Categorical . . . . . . . . . . . . . . . . . . . . . . . . . . . . . . . . . . . . . . . . . . . . . . . . . . . . . . . . . . . . . . . . 31,776,713 Non-Governmental Grants . . . . . . . . . . . . . . . . . . . . . . . . . . . . . . . . . . . . . . . . . . . . . . . . . . . . . . . . . . . . . . . . 9,058,390 _________________________
Total—Receivables 1999 . . . . . . . . . . . . . . . . . . . . . . . . . . . . . . . . . . . . . . . . . . . . . . . . . . . . . . . . . . . . . . 59,132,220 _________________________FISCAL 1998:
Federal Grants—Categorical . . . . . . . . . . . . . . . . . . . . . . . . . . . . . . . . . . . . . . . . . . . . . . . . . . . . . . . . . . . . . . 2,481,716 State Grants—Categorical . . . . . . . . . . . . . . . . . . . . . . . . . . . . . . . . . . . . . . . . . . . . . . . . . . . . . . . . . . . . . . . . 20,074,665 _________________________
Total—Receivables 1998 . . . . . . . . . . . . . . . . . . . . . . . . . . . . . . . . . . . . . . . . . . . . . . . . . . . . . . . . . . . . . . 22,556,381 _________________________FISCAL 1997:
Federal Grants—Categorical . . . . . . . . . . . . . . . . . . . . . . . . . . . . . . . . . . . . . . . . . . . . . . . . . . . . . . . . . . . . . . 8,604,622 State Grants—Categorical . . . . . . . . . . . . . . . . . . . . . . . . . . . . . . . . . . . . . . . . . . . . . . . . . . . . . . . . . . . . . . . . 9,096,208 Non-Governmental Grants . . . . . . . . . . . . . . . . . . . . . . . . . . . . . . . . . . . . . . . . . . . . . . . . . . . . . . . . . . . . . . . . 265,117 _________________________
Total—Receivables 1997 . . . . . . . . . . . . . . . . . . . . . . . . . . . . . . . . . . . . . . . . . . . . . . . . . . . . . . . . . . . . . . 17,965,947 _________________________FISCAL 1996:
Federal Grants—Categorical . . . . . . . . . . . . . . . . . . . . . . . . . . . . . . . . . . . . . . . . . . . . . . . . . . . . . . . . . . . . . . 1,207,926 State Grants—Categorical . . . . . . . . . . . . . . . . . . . . . . . . . . . . . . . . . . . . . . . . . . . . . . . . . . . . . . . . . . . . . . . . 8,627,820 _________________________
Total—Receivables 1996 . . . . . . . . . . . . . . . . . . . . . . . . . . . . . . . . . . . . . . . . . . . . . . . . . . . . . . . . . . . . . . 9,835,746 _________________________FISCAL 1995:
State Grants—Categorical . . . . . . . . . . . . . . . . . . . . . . . . . . . . . . . . . . . . . . . . . . . . . . . . . . . . . . . . . . . . . . . . 87,558,608 _________________________FISCAL 1994:
State Grants—Categorical . . . . . . . . . . . . . . . . . . . . . . . . . . . . . . . . . . . . . . . . . . . . . . . . . . . . . . . . . . . . . . . . 72,333,895 _________________________FISCAL 1993:
State Grants—Categorical . . . . . . . . . . . . . . . . . . . . . . . . . . . . . . . . . . . . . . . . . . . . . . . . . . . . . . . . . . . . . . . . 68,851,936 _________________________Total—Receivables for all Fiscal Years . . . . . . . . . . . . . . . . . . . . . . . . . . . . . . . . . . . . . . . . . . . . . . . . . . . $4,918,659,321 __________________________________________________
126
Comptroller’s Report for Fiscal 2002 Part II-E—General Fund—Schedule G1
Summary of Federal, State and Other Aid Receivables at June 30, 2002
ReceivableBalance
Receivables by Fiscal Year June 30, 2002____________________________________________ _________________________________

TAXES:Real Estate Taxes (Net of Refunds) . . . . . . . . . . . . $ 8,590,371,157 $ 8,753,021,000 $ 8,760,872,526 $ 7,851,526__________________________ __________________________ __________________________ __________________________Sales and Use Taxes (Net of Refunds):
General Sales . . . . . . . . . . . . . . . . . . . . . . . . . 3,710,000,000 3,390,000,000 3,373,354,384 (16,645,616)Cigarette . . . . . . . . . . . . . . . . . . . . . . . . . . . . 28,000,000 27,000,000 27,441,028 441,028Vault . . . . . . . . . . . . . . . . . . . . . . . . . . . . . . . — — 364,517 364,517Commercial Motor Vehicle . . . . . . . . . . . . . . 43,700,000 47,100,000 45,022,617 (2,077,383)Mortgage . . . . . . . . . . . . . . . . . . . . . . . . . . . . 340,000,000 462,000,000 476,941,364 14,941,364Stock Transfer . . . . . . . . . . . . . . . . . . . . . . . . 114,000,000 — 4,299 4,299Auto Use . . . . . . . . . . . . . . . . . . . . . . . . . . . . 32,200,000 34,200,000 34,257,659 57,659__________________________ __________________________ __________________________ __________________________
Total Sales and Use Taxes . . . . . . . . . . . 4,267,900,000 3,960,300,000 3,957,385,868 (2,914,132)__________________________ __________________________ __________________________ __________________________Income Taxes (Net of Refunds):
Personal Income . . . . . . . . . . . . . . . . . . . . . . 5,074,441,000 4,669,139,000 4,555,058,628 (114,080,372)__________________________ __________________________ __________________________ __________________________Other Income Taxes:
General Corporation . . . . . . . . . . . . . . . . . . . 1,475,000,000 1,356,000,000 1,621,437,799 265,437,799Financial Corporation . . . . . . . . . . . . . . . . . . 359,000,000 351,000,000 366,919,875 15,919,875Unincorporated Business Income . . . . . . . . . 802,000,000 789,000,000 829,117,805 40,117,805Personal Income (Non-Resident
City Employees) . . . . . . . . . . . . . . . . . . . . 67,300,000 70,800,000 69,826,206 (973,794)Utility . . . . . . . . . . . . . . . . . . . . . . . . . . . . . . 276,000,000 258,000,000 304,782,479 46,782,479__________________________ __________________________ __________________________ __________________________
Total Other Income Taxes . . . . . . . . . . . 2,979,300,000 2,824,800,000 3,192,084,164 367,284,164__________________________ __________________________ __________________________ __________________________Other Taxes:
Payment in Lieu of Taxes . . . . . . . . . . . . . . . 200,639,000 145,639,000 149,025,731 3,386,731Hotel Room Occupancy . . . . . . . . . . . . . . . . 246,000,000 185,000,000 186,000,353 1,000,353Commercial Rent . . . . . . . . . . . . . . . . . . . . . . 356,000,000 375,000,000 403,094,574 28,094,574Horse Race Admissions . . . . . . . . . . . . . . . . . 100,000 100,000 35,963 (64,037)Conveyance of Real Property . . . . . . . . . . . . 418,000,000 411,000,000 428,994,884 17,994,884Beer and Liquor Excise . . . . . . . . . . . . . . . . . 21,500,000 21,500,000 22,355,271 855,271Taxi Medallion Transfer . . . . . . . . . . . . . . . . 3,600,000 4,100,000 4,286,047 186,047Surcharge on Liquor Licenses . . . . . . . . . . . . 3,000,000 3,500,000 3,973,107 473,107Refunds of Other Taxes . . . . . . . . . . . . . . . . . (15,200,000) (17,200,000) (15,855,911) 1,344,089__________________________ __________________________ __________________________ __________________________
Total Other Taxes . . . . . . . . . . . . . . . . . . 1,233,639,000 1,128,639,000 1,181,910,019 53,271,019__________________________ __________________________ __________________________ __________________________Penalties and Interest on Delinquent Taxes:
Penalties and Interest on Real Estate Taxes . . . . . . . . . . . . . . . . . . 50,000,000 61,000,000 57,263,937 (3,736,063)
Tax Audit Revenue . . . . . . . . . . . . . . . . . . 487,135,000 462,135,000 — (462,135,000)Refunds — Penalties and Interest on
Other Taxes . . . . . . . . . . . . . . . . . . . . . . (19,300,000) (12,000,000) (8,345,437) 3,654,563__________________________ __________________________ __________________________ __________________________Total Penalties and Interest on
Delinquent Taxes . . . . . . . . . . . . . . . . 517,835,000 511,135,000 48,918,500 (462,216,500)__________________________ __________________________ __________________________ __________________________
127
Comptroller’s Report for Fiscal 2002 Part II-E—General Fund—Schedule G2
Revenues vs. Budget by Category
Better (Worse)Budget Actual Than Modified___________________________________________________________________________
Adopted Modified Revenue Budget_________________________________ _________________________________ _________________________________ _________________________________
(Continued)

TAXES: (cont.)Total Other Taxes and Penalties
and Interest on Delinquent Taxes . . . $ 1,751,474,000 $ 1,639,774,000 $ 1,230,828,519 $ (408,945,481)__________________________ __________________________ __________________________ __________________________Total Taxes . . . . . . . . . . . . . . . . . . . . . . . 22,663,486,157 21,847,034,000 21,696,229,705 (150,804,295)__________________________ __________________________ __________________________ __________________________
FEDERAL GRANTS—CATEGORICAL:General Government . . . . . . . . . . . . . . . . . . . 352,727,525 1,091,222,631 861,466,043 (229,756,588)Public Safety and Judicial . . . . . . . . . . . . . . . 56,107,237 610,067,673 606,974,509 (3,093,164)Education . . . . . . . . . . . . . . . . . . . . . . . . . . . . 1,046,465,285 1,390,005,646 1,363,769,252 (26,236,394)Community Colleges . . . . . . . . . . . . . . . . . . — 5,573,740 472,925 (5,100,815)Social Services . . . . . . . . . . . . . . . . . . . . . . . 2,683,947,095 2,841,838,999 2,699,479,893 (142,359,106)Environmental Protection . . . . . . . . . . . . . . . — 51,604,237 82,432,571 30,828,334Transportation Services . . . . . . . . . . . . . . . . . 11,132,403 58,054,935 44,582,456 (13,472,479)Parks, Recreation and Cultural Activities . . . — 1,203,326 1,888,738 685,412Housing . . . . . . . . . . . . . . . . . . . . . . . . . . . . . 151,324,834 175,664,019 171,249,580 (4,414,439)Health . . . . . . . . . . . . . . . . . . . . . . . . . . . . . . 140,688,213 273,303,365 264,423,909 (8,879,456)__________________________ __________________________ __________________________ __________________________
Total Federal Grants—Categorical . . . . 4,442,392,592 6,498,538,571 6,096,739,876 (401,798,695)__________________________ __________________________ __________________________ __________________________STATE GRANTS—CATEGORICAL:
General Government . . . . . . . . . . . . . . . . . . . 59,557,295 62,590,948 33,344,770 (29,246,178)Public Safety and Judicial . . . . . . . . . . . . . . . 129,039,891 137,298,453 125,576,424 (11,722,029)Education . . . . . . . . . . . . . . . . . . . . . . . . . . . . 5,543,392,586 5,614,949,431 5,592,120,305 (22,829,126)Senior Colleges . . . . . . . . . . . . . . . . . . . . . . . 35,000,000 35,000,000 — (35,000,000)Community Colleges . . . . . . . . . . . . . . . . . . . 174,801,463 160,851,750 129,299,587 (31,552,163)Hunter Campus Schools . . . . . . . . . . . . . . . . 1,300,000 1,300,000 1,300,000 —Social Services . . . . . . . . . . . . . . . . . . . . . . . 1,540,285,356 1,574,347,072 1,610,728,349 36,381,277Environmental Protection . . . . . . . . . . . . . . . — 293,400 284,609 (8,791)Transportation Services . . . . . . . . . . . . . . . . . 88,688,042 104,949,527 102,288,872 (2,660,655)Parks, Recreation and Cultural Activities . . . — 807,757 477,485 (330,272)Housing . . . . . . . . . . . . . . . . . . . . . . . . . . . . . 877,001 932,606 862,195 (70,411)Health . . . . . . . . . . . . . . . . . . . . . . . . . . . . . . 368,217,354 432,344,113 434,217,850 1,873,737__________________________ __________________________ __________________________ __________________________
Total State Grants—Categorical . . . . . . 7,941,158,988 8,125,665,057 8,030,500,446 (95,164,611)__________________________ __________________________ __________________________ __________________________NON-GOVERNMENTAL GRANTS:
General Government . . . . . . . . . . . . . . . . . . . 115,870,580 27,021,620 13,534,817 (13,486,803)Public Safety and Judicial . . . . . . . . . . . . . . . 152,611,368 345,666,624 241,734,172 (103,932,452)Education . . . . . . . . . . . . . . . . . . . . . . . . . . . . 15,317,970 51,225,655 51,116,617 (109,038)Social Services . . . . . . . . . . . . . . . . . . . . . . . — 129,296,459 102,967,237 (26,329,222)Environmental Protection . . . . . . . . . . . . . . . 1,600,000 1,931,103 1,847,430 (83,673)Transportation Services . . . . . . . . . . . . . . . . . — 1,516,134 1,252,604 (263,530)Parks, Recreation and Cultural Activities . . . — 6,643,496 6,372,387 (271,109)Housing . . . . . . . . . . . . . . . . . . . . . . . . . . . . . — 1,417,043 1,370,285 (46,758)Health . . . . . . . . . . . . . . . . . . . . . . . . . . . . . . 101,460,685 107,720,889 98,246,851 (9,474,038)Community Colleges . . . . . . . . . . . . . . . . . . . 5,000,000 5,000,000 286,949 (4,713,051)__________________________ __________________________ __________________________ __________________________
Total Non-Governmental Grants . . . . . . 391,860,603 677,439,023 518,729,349 (158,709,674)__________________________ __________________________ __________________________ __________________________Provision for Disallowances of Federal, State
and Other Aid: . . . . . . . . . . . . . . . . . . . . . . . . (15,000,000) (15,000,000) — 15,000,000__________________________ __________________________ __________________________ __________________________Total Federal, State and Other
Categorical Aid (Net) . . . . . . . . . . . . 12,760,412,183 15,286,642,651 14,645,969,671 (640,672,980)__________________________ __________________________ __________________________ __________________________
128
Comptroller’s Report for Fiscal 2002 Part II-E—General Fund—Schedule G2 (Cont.)
Revenues vs. Budget by Category
Better (Worse)Budget Actual Than Modified___________________________________________________________________________
Adopted Modified Revenue Budget_________________________________ _________________________________ _________________________________ _________________________________
(Continued)

UNRESTRICTED FEDERAL AND STATE AID:State Revenue Sharing . . . . . . . . . . . . . . . . . . $ 327,389,668 $ 327,389,668 $ 327,889,668 $ 500,000Intergovernmental Aid . . . . . . . . . . . . . . . . . . 379,029,069 367,386,604 337,930,201 (29,456,403)__________________________ __________________________ __________________________ __________________________
Total Unrestricted Federaland State Aid . . . . . . . . . . . . . . . . . . . 706,418,737 694,776,272 665,819,869 (28,956,403)__________________________ __________________________ __________________________ __________________________
CHARGES FOR SERVICES:General Government Charges . . . . . . . . . . . . 414,746,750 431,835,373 461,181,867 29,346,494Water and Sewer . . . . . . . . . . . . . . . . . . . . . . 863,537,084 845,001,109 857,906,603 12,905,494Housing . . . . . . . . . . . . . . . . . . . . . . . . . . . . . — — 24,411,248 24,411,248Rental Income . . . . . . . . . . . . . . . . . . . . . . . . 110,614,000 109,535,000 114,893,687 5,358,687__________________________ __________________________ __________________________ __________________________
Total Charges for Services . . . . . . . . . . . 1,388,897,834 1,386,371,482 1,458,393,405 72,021,923__________________________ __________________________ __________________________ __________________________OTHER REVENUES:LICENSES, PERMITS, PRIVILEGES AND FRANCHISES:
Licenses . . . . . . . . . . . . . . . . . . . . . . . . . . . . . 46,513,000 44,830,000 46,898,439 2,068,439Permits . . . . . . . . . . . . . . . . . . . . . . . . . . . . . . 84,620,000 90,318,000 94,572,317 4,254,317Privileges and Franchises . . . . . . . . . . . . . . . 188,740,427 204,981,948 214,228,220 9,246,272__________________________ __________________________ __________________________ __________________________
Total Licenses, Permits, Privilegesand Franchises . . . . . . . . . . . . . . . . . . 319,873,427 340,129,948 355,698,976 15,569,028__________________________ __________________________ __________________________ __________________________
FINES AND FORFEITURES:Fines . . . . . . . . . . . . . . . . . . . . . . . . . . . . . . . 476,048,380 467,798,995 478,604,462 10,805,467Forfeitures . . . . . . . . . . . . . . . . . . . . . . . . . . . 3,612,000 6,482,000 6,726,997 244,997__________________________ __________________________ __________________________ __________________________
Total Fines and Forfeitures . . . . . . . . . . 479,660,380 474,280,995 485,331,459 11,050,464__________________________ __________________________ __________________________ __________________________MISCELLANEOUS . . . . . . . . . . . . . . . . . . . . . . . . . . . . 654,443,352 1,043,730,843 786,559,284 (257,171,559)__________________________ __________________________ __________________________ __________________________TOBACCO SETTLEMENT . . . . . . . . . . . . . . . . . . . . . . . 220,258,558 211,158,814 211,158,814 —__________________________ __________________________ __________________________ __________________________INTEREST INCOME . . . . . . . . . . . . . . . . . . . . . . . . . . . 154,540,000 80,170,000 80,559,191 389,191__________________________ __________________________ __________________________ __________________________
Total Other Revenues . . . . . . . . . . . . . . 1,828,775,717 2,149,470,600 1,919,307,724 (230,162,876)__________________________ __________________________ __________________________ __________________________Total Revenues . . . . . . . . . . . . . . . . . . . 39,347,990,628 41,364,295,005 40,385,720,374 (978,574,631)__________________________ __________________________ __________________________ __________________________
OTHER FINANCING SOURCES:TRANSFER FROM DISCRETELY PRESENTED
COMPONENT UNIT:Off-Track Betting . . . . . . . . . . . . . . . . . . . . . 11,700,000 3,700,000 1,000,000 (2,700,000)Off-Track Betting Surtax . . . . . . . . . . . . . . . . 21,300,000 21,000,000 20,707,704 (292,296)__________________________ __________________________ __________________________ __________________________
Total Transfer from Discretely Presented Component Unit . . . . . . . . 33,000,000 24,700,000 21,707,704 (2,992,296)__________________________ __________________________ __________________________ __________________________
TRANSFER FROM NON MAJOR CAPITAL
PROJECTS FUND: . . . . . . . . . . . . . . . . . . . . . . . . . . — 365,927,558 457,832,027 91,904,469__________________________ __________________________ __________________________ __________________________Total Other Financing Sources . . . . . . . 33,000,000 390,627,558 479,539,731 88,912,173__________________________ __________________________ __________________________ __________________________Total Revenues and Other
Financing Sources . . . . . . . . . . . . . . . $39,380,990,628 $41,754,922,563 $40,865,260,105 $ (889,662,458)__________________________ __________________________ __________________________ ____________________________________________________ __________________________ __________________________ __________________________
129
Comptroller’s Report for Fiscal 2002 Part II-E—General Fund—Schedule G2 (Cont.)
Revenues vs. Budget by Category
Better (Worse)Budget Actual Than Modified___________________________________________________________________________
Adopted Modified Revenue Budget_________________________________ _________________________________ _________________________________ _________________________________

002 MAYORALTY
00001 Real Estate Taxes—Fiscal 2002—1st Quarter . . . . . . . . . . . . . . . . . . . $ 3,853,000,000 $ 3,978,294,000 $ 4,030,733,734 $ 3,689,893,424
00002 Real Estate Taxes—Fiscal 2002—2nd Quarter . . . . . . . . . . . . . . . . . . 512,000,000 534,922,000 538,794,617 486,188,258
00003 Real Estate Taxes—Fiscal 2002—3rd Quarter . . . . . . . . . . . . . . . . . . . 3,605,000,000 3,606,954,000 3,611,430,112 3,420,584,671
00004 Real Estate Taxes—Fiscal 2002—4th Quarter . . . . . . . . . . . . . . . . . . . 527,571,157 466,901,000 409,414,668 471,949,222
00005 Real Estate Taxes—Fiscal 2001 . . . . — — 103,967,359 115,059,30300006 Real Estate Taxes—Fiscal 2000 . . . . — — 20,180,953 16,253,64000007 Real Estate Taxes—Fiscal 1999 . . . . — — 9,666,769 7,234,13600008 Real Estate Taxes—Fiscal 1998 . . . . — — 4,526,397 3,691,01700009 Real Estate Taxes—Fiscal 1997 . . . . — — 3,805,789 2,732,33000010 Real Estate Taxes—prior to Fiscal
1997 . . . . . . . . . . . . . . . . . . . . . . — — 6,638,072 5,171,77500021 Real Estate Tax Refunds . . . . . . . . . . (220,000,000) (145,000,000) (134,195,707) (241,108,503)00025 Real Property—Criminal
Justice Fund . . . . . . . . . . . . . . . . . . — — 502,519 454,92400026 School Tax Relief—Property Tax . . . 112,400,000 112,400,000 112,427,950 89,436,11400033 Penalties and Interest on Real
Estate Taxes Prior Year . . . . . . . . . 40,000,000 50,000,000 45,855,674 36,806,74300034 Real Property Tax Liens Sale . . . . . . 72,400,000 49,550,000 44,453,952 204,928,83600036 Defective Lien Refunds Prior Year . . — (4,000,000) (3,852,117) (9,091,151)00048 Prior Year Real Estate Tax Accrual . . — — (29,735,661) (47,528,828)00049 Accrued Real Estate Tax Revenue . . . 128,000,000 153,000,000 32,113,119 29,735,66100050 General Sales Tax . . . . . . . . . . . . . . . 3,710,000,000 3,390,000,000 3,360,235,384 3,661,868,49500070 Cigarette Tax . . . . . . . . . . . . . . . . . . . 28,000,000 27,000,000 27,391,028 27,813,82600072 Vault Tax . . . . . . . . . . . . . . . . . . . . . . — — 360,517 524,43000073 Commercial Motor Vehicle Tax . . . . . 43,700,000 47,100,000 44,936,617 47,795,44000077 Mortgage Tax . . . . . . . . . . . . . . . . . . . 340,000,000 462,000,000 476,941,364 406,699,42800078 Stock Transfer Tax . . . . . . . . . . . . . . . 114,000,000 — 4,299 4,25400079 Auto Use Tax . . . . . . . . . . . . . . . . . . . 32,200,000 34,200,000 34,257,659 33,870,19400088 School Tax Relief—PIT . . . . . . . . . . 560,000,000 520,000,000 520,000,000 415,000,00000090 Personal Income Tax
(Net of Refunds) . . . . . . . . . . . . . . 4,514,441,000 4,149,139,000 4,018,942,628 5,331,255,54200093 General Corporation Tax
(Net of Refunds) . . . . . . . . . . . . . . 1,475,000,000 1,356,000,000 1,329,924,799 1,735,313,72500095 Financial Corporation Tax
(Net of Refunds) . . . . . . . . . . . . . . 359,000,000 351,000,000 319,946,875 423,849,13300099 Unincorporated Business Income Tax
(Net of Refunds) . . . . . . . . . . . . . . 802,000,000 789,000,000 790,499,805 819,851,18900102 Personal Income Tax
(Non-Resident City Employees) . . 67,300,000 70,800,000 69,826,206 63,641,53900103 Utility Tax . . . . . . . . . . . . . . . . . . . . . 276,000,000 258,000,000 258,048,479 299,684,81500110 Payment in Lieu of Taxes . . . . . . . . . 200,639,000 145,639,000 144,920,270 169,153,94300112 Occupancy of Hotel Rooms Tax . . . . 246,000,000 185,000,000 184,048,353 241,996,19100113 Commercial Rent Tax . . . . . . . . . . . . 356,000,000 375,000,000 379,612,574 377,196,12000114 Refunds of All Other Taxes . . . . . . . . (15,200,000) (17,200,000) (15,855,911) (24,561,141)00115 Horse Race Admissions Tax . . . . . . . 100,000 100,000 35,963 33,266
130
Comptroller’s Report for Fiscal 2002 Part II-E—General Fund—Schedule G3
Revenues vs. Budget by Agency
Budget Actual RevenueRevenue Source _________________________________________________________________________ _________________________________________________________________________Within Agency Adopted Modified 2002 2001__________________________ _________________________________ _________________________________ _________________________________ _________________________________
(Continued)

002 MAYORALTY (cont.)00120 Off-Track Betting . . . . . . . . . . . . . . . $ 11,700,000 $ 3,700,000 $ 1,000,000 $ 12,500,00000121 Off-Track Betting Surtax . . . . . . . . . . 21,300,000 21,000,000 20,707,704 20,900,55300122 Conveyance of Real Property Tax . . . 418,000,000 411,000,000 425,130,884 473,290,79600124 Beer and Liquor Excise Tax . . . . . . . 21,500,000 21,500,000 22,355,271 21,477,57400125 Taxi Medallion Transfer Tax . . . . . . . 3,600,000 4,100,000 4,286,047 3,123,74200126 Surcharge on Liquor Licenses . . . . . . 3,000,000 3,500,000 3,743,107 3,436,13000130 Penalties and Interest on
Real Estate Taxes . . . . . . . . . . . . . . 10,000,000 11,000,000 11,408,263 10,258,80900133 Penalties and Interest on
Other Taxes . . . . . . . . . . . . . . . . . . — — — 177,71400134 Refunds—Penalty and Interest
on Other Taxes . . . . . . . . . . . . . . . . (19,300,000) (12,000,000) (8,345,437) (13,760,368)00135 Tax Audit Revenue . . . . . . . . . . . . . . 487,135,000 462,135,000 — —00200 Licenses—General . . . . . . . . . . . . . . 1,600,000 1,200,000 1,482,688 2,006,49500250 Permits—General . . . . . . . . . . . . . . . 65,000 65,000 57,353 56,70300470 Other Services and Fees . . . . . . . . . . 200,000 200,000 232,167 286,26100476 Administrative Services to
the Public . . . . . . . . . . . . . . . . . . . . 2,170,000 2,540,000 2,962,191 2,553,33700521 Reimbursement from Water Board . . 735,096,084 717,851,922 730,757,416 685,223,00600522 Payment from Water Board . . . . . . . . 128,441,000 127,149,187 127,149,187 157,301,93700600 Fines—General . . . . . . . . . . . . . . . . . 7,084,995 7,084,995 7,243,520 7,989,98800752 Airport Rentals—Port of
New York Authority . . . . . . . . . . . . 15,000,000 10,475,000 10,475,000 25,245,37300846 Tobacco Settlement . . . . . . . . . . . . . . 220,258,558 211,158,814 211,158,814 154,339,77800850 WTC Related PS - TFA . . . . . . . . . . . — 245,957,016 361,245,611 —00859 Sundries . . . . . . . . . . . . . . . . . . . . . . 494,252,852 643,443,852 447,384,660 643,778,91100923 Emergency Shelter Grants Program . . — 62,500 62,500 —00931 Community Development
City-Wide . . . . . . . . . . . . . . . . . . . . 309,920,500 273,183,439 219,039,302 231,199,70201209 Housing Opportunity for
People with AIDS . . . . . . . . . . . . . — 18,366,470 18,366,470 5,732,12302100 Unsafe Buildings . . . . . . . . . . . . . . . . — — 44,336 79,26702101 Sweat Equity . . . . . . . . . . . . . . . . . . . — — 120,724 127,49802105 Management of City Buildings—
7A Administrator . . . . . . . . . . . . . . — — 594,996 1,198,32402106 Article 8A—Loan Program . . . . . . . . — — 28,597 113,75702107 Emergency Repairs . . . . . . . . . . . . . . — — 11,918,526 9,232,21902108 Participation Loans . . . . . . . . . . . . . . — — 17,711,529 2,886,22202112 Vacant Lot Clean-up . . . . . . . . . . . . . — — 1,073,530 947,50602114 Tenant Interim Lease . . . . . . . . . . . . . — — 153,413 245,40302115 7A Leases . . . . . . . . . . . . . . . . . . . . . — — 10,003 10,00302116 Community Management Program . . — — 2,653 2,41202117 Private Ownership Management . . . . — — 2,232,832 2,765,00602119 Housing Court Fines . . . . . . . . . . . . . — — 1,449,821 1,512,64002122 Harding Park . . . . . . . . . . . . . . . . . . . — — 4,074 3,63002126 Rehabilitation Loan . . . . . . . . . . . . . . — — 70,989 55,95502128 Publication Sales . . . . . . . . . . . . . . . . — — 46,022 31,57802130 Single Room Occupancy—
Harassment . . . . . . . . . . . . . . . . . . — — 21,200 19,301
131
Comptroller’s Report for Fiscal 2002 Part II-E—General Fund—Schedule G3 (Cont.)
Revenues vs. Budget by Agency
Budget Actual RevenueRevenue Source _________________________________________________________________________ _________________________________________________________________________Within Agency Adopted Modified 2002 2001__________________________ _________________________________ _________________________________ _________________________________ _________________________________
(Continued)

002 MAYORALTY (cont.)02131 Special Housing Loan . . . . . . . . . . . . $ — $ — $ 37,001 $ 45,42002132 Neighborhood Commercial
Revitalization . . . . . . . . . . . . . . . . . — — 155,973 101,29602137 Brooklyn Small Homes . . . . . . . . . . . — — 19,173 20,21502138 Federal Urban Renewal Land Sales . . — — 2,863,137 1,752,08102144 Fair Housing . . . . . . . . . . . . . . . . . . . — — 103,041 89,47502145 Senior Citizens Housing
Assistance Program . . . . . . . . . . . . — — 10,385 11,35702146 Program Income Audit Adjustment . . — — 189,561 162,03402147 Industrial Project Development . . . . . — — 58,968 47,93702150 Revolving Loan Fund . . . . . . . . . . . . — — 50,634 98,05202155 7A Financial Assistance Program . . . . — — 3,318 40002158 Neighborhood Housing Services . . . . — — 816,000 —03255 Urban Search and Rescue . . . . . . . . . — 176 — —03263 Public Assistance — WTC/FEMA . . — 18,020,969 4,353,193 —03919 Public Safety for Civil
Defense—Federal . . . . . . . . . . . . . 903,017 903,017 903,017 933,01703951 Federal Emergency Management
Assistance . . . . . . . . . . . . . . . . . . . — 31,080 31,080 47,37204011 Criminal Justice Coordinating
Council . . . . . . . . . . . . . . . . . . . . . . — — — 4,80204044 CJCC Regional Planning Board . . . . — 52,583 67,327 69,90104176 Drug Courts . . . . . . . . . . . . . . . . . . . . — 474,955 427,916 486,50004215 Center for Sex Offender
Management . . . . . . . . . . . . . . . . . — — — 20,94904228 Cultural Awarenesss and
Diversity Training . . . . . . . . . . . . . — 494,634 3,831 5,36619927 Alternatives to Incarceration . . . . . . . — 3,349,513 3,246,857 3,659,79229978 State Aid Pension Reimbursement . . 643,102 1,388,986 1,834,613 —30800 New York City Veterans Service
Agency . . . . . . . . . . . . . . . . . . . . . . — 29,984 85,722 102,62330906 Local Government Records
Management Improvement Program . — 28,429 26,591 30,70631602 Court Interest Reimbursement . . . . . . 20,885,043 11,253,000 — —31907 Management Welfare Fund . . . . . . . . 651,275 692,464 634,145 737,16231910 Municipal Labor Relations
Deferred Compensation Fund . . . . 910,260 962,179 554,058 733,11031920 Flexible Spending Plan . . . . . . . . . . . 175,740 183,215 73,867 49,74231924 Water Authority Grant . . . . . . . . . . . . 162,414 162,414 148,511 163,96431934 Transitional Finance Authority . . . . . 60,775 60,775 60,775 61,35531936 Sister Cities Program . . . . . . . . . . . . . — 27,372 27,372 29,80031937 NY Community Trust Emergency
Medical Services . . . . . . . . . . . . . . — 38,795 38,795 28,50043900 Private Grant . . . . . . . . . . . . . . . . . . . — 34,122,950 14,102,056 1,62544002 Return of Grant Fund
Administration . . . . . . . . . . . . . . . . 8,000,000 8,000,000 8,000,000 8,000,00044006 Debt Service Reimbursment . . . . . . . 46,553,786 34,082,927 35,471,031 24,664,95844008 Disaster Related TFA Debt Issuance . . — 597,844 — —44020 EDC Brownfield Redevelopment . . . — 13,957 13,957 3,596
132
Comptroller’s Report for Fiscal 2002 Part II-E—General Fund—Schedule G3 (Cont.)
Revenues vs. Budget by Agency
Budget Actual RevenueRevenue Source _________________________________________________________________________ _________________________________________________________________________Within Agency Adopted Modified 2002 2001__________________________ _________________________________ _________________________________ _________________________________ _________________________________
(Continued)
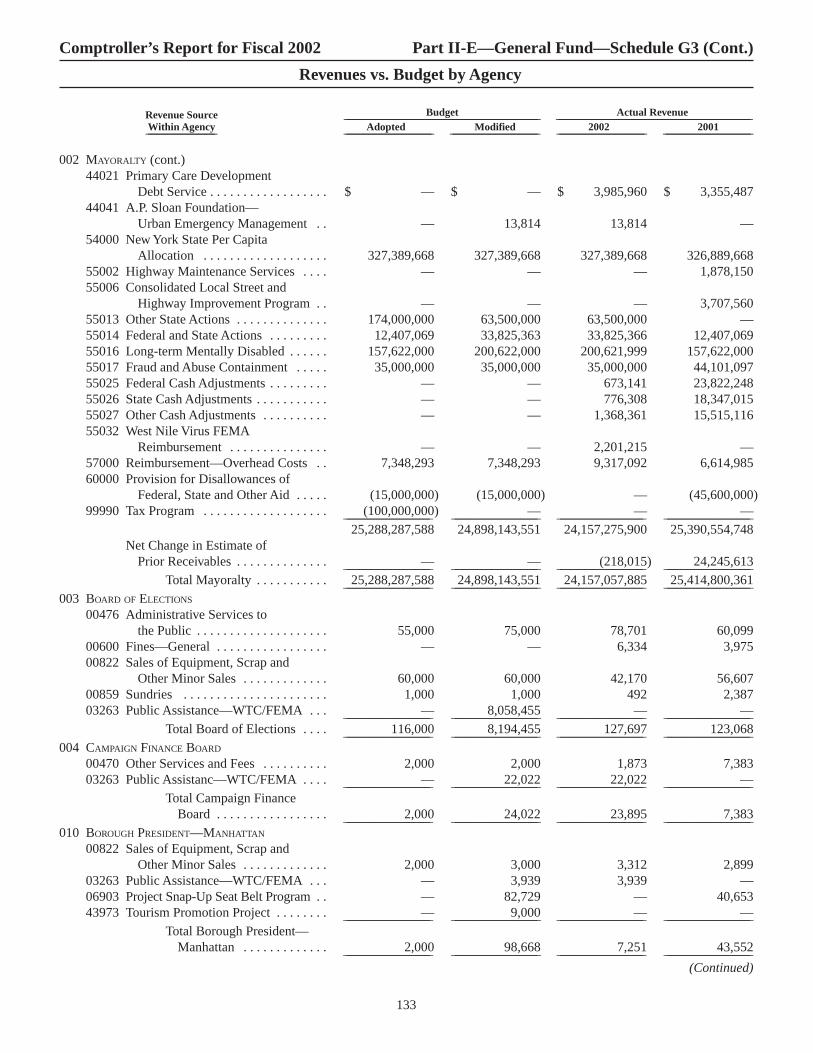
002 MAYORALTY (cont.)44021 Primary Care Development
Debt Service . . . . . . . . . . . . . . . . . . $ — $ — $ 3,985,960 $ 3,355,48744041 A.P. Sloan Foundation—
Urban Emergency Management . . — 13,814 13,814 —54000 New York State Per Capita
Allocation . . . . . . . . . . . . . . . . . . . 327,389,668 327,389,668 327,389,668 326,889,66855002 Highway Maintenance Services . . . . — — — 1,878,15055006 Consolidated Local Street and
Highway Improvement Program . . — — — 3,707,56055013 Other State Actions . . . . . . . . . . . . . . 174,000,000 63,500,000 63,500,000 —55014 Federal and State Actions . . . . . . . . . 12,407,069 33,825,363 33,825,366 12,407,06955016 Long-term Mentally Disabled . . . . . . 157,622,000 200,622,000 200,621,999 157,622,00055017 Fraud and Abuse Containment . . . . . 35,000,000 35,000,000 35,000,000 44,101,09755025 Federal Cash Adjustments . . . . . . . . . — — 673,141 23,822,24855026 State Cash Adjustments . . . . . . . . . . . — — 776,308 18,347,01555027 Other Cash Adjustments . . . . . . . . . . — — 1,368,361 15,515,11655032 West Nile Virus FEMA
Reimbursement . . . . . . . . . . . . . . . — — 2,201,215 —57000 Reimbursement—Overhead Costs . . 7,348,293 7,348,293 9,317,092 6,614,98560000 Provision for Disallowances of
Federal, State and Other Aid . . . . . (15,000,000) (15,000,000) — (45,600,000)99990 Tax Program . . . . . . . . . . . . . . . . . . . (100,000,000) — — —__________________________ __________________________ __________________________ __________________________
25,288,287,588 24,898,143,551 24,157,275,900 25,390,554,748Net Change in Estimate of
Prior Receivables . . . . . . . . . . . . . . — — (218,015) 24,245,613__________________________ __________________________ __________________________ __________________________Total Mayoralty . . . . . . . . . . . 25,288,287,588 24,898,143,551 24,157,057,885 25,414,800,361__________________________ __________________________ __________________________ __________________________
003 BOARD OF ELECTIONS
00476 Administrative Services to the Public . . . . . . . . . . . . . . . . . . . . 55,000 75,000 78,701 60,099
00600 Fines—General . . . . . . . . . . . . . . . . . — — 6,334 3,97500822 Sales of Equipment, Scrap and
Other Minor Sales . . . . . . . . . . . . . 60,000 60,000 42,170 56,60700859 Sundries . . . . . . . . . . . . . . . . . . . . . . 1,000 1,000 492 2,38703263 Public Assistance—WTC/FEMA . . . — 8,058,455 — —__________________________ __________________________ __________________________ __________________________
Total Board of Elections . . . . 116,000 8,194,455 127,697 123,068__________________________ __________________________ __________________________ __________________________004 CAMPAIGN FINANCE BOARD
00470 Other Services and Fees . . . . . . . . . . 2,000 2,000 1,873 7,38303263 Public Assistanc—WTC/FEMA . . . . — 22,022 22,022 —__________________________ __________________________ __________________________ __________________________
Total Campaign Finance Board . . . . . . . . . . . . . . . . . 2,000 24,022 23,895 7,383__________________________ __________________________ __________________________ __________________________
010 BOROUGH PRESIDENT—MANHATTAN
00822 Sales of Equipment, Scrap andOther Minor Sales . . . . . . . . . . . . . 2,000 3,000 3,312 2,899
03263 Public Assistance—WTC/FEMA . . . — 3,939 3,939 —06903 Project Snap-Up Seat Belt Program . . — 82,729 — 40,65343973 Tourism Promotion Project . . . . . . . . — 9,000 — —__________________________ __________________________ __________________________ __________________________
Total Borough President—Manhattan . . . . . . . . . . . . . 2,000 98,668 7,251 43,552__________________________ __________________________ __________________________ __________________________
133
Comptroller’s Report for Fiscal 2002 Part II-E—General Fund—Schedule G3 (Cont.)
Revenues vs. Budget by Agency
Budget Actual RevenueRevenue Source _________________________________________________________________________ _________________________________________________________________________Within Agency Adopted Modified 2002 2001__________________________ _________________________________ _________________________________ _________________________________ _________________________________
(Continued)

011 BOROUGH PRESIDENT—BRONX
00822 Sales of Equipment, Scrap andOther Minor Sales . . . . . . . . . . . . . $ 2,000 $ 4,000 $ 6,061 $ 15,433__________________________ __________________________ __________________________ __________________________
Total Borough President—Bronx . . . . . . . . . . . . . . . . . 2,000 4,000 6,061 15,433__________________________ __________________________ __________________________ __________________________
012 BOROUGH PRESIDENT—BROOKLYN
00859 Sundries . . . . . . . . . . . . . . . . . . . . . . 1,000 1,000 874 99504198 Domestic Violence Grant . . . . . . . . . — 367,017 402,952 487,25104230 Arrest Policies and Enforcement
Protection . . . . . . . . . . . . . . . . . . . . — 133,333 61,212 —06903 Project Snap-Up Seat Belt Program . . — 106,470 104,049 25,68715601 Community Access Program . . . . . . . — — — 25,00030264 NYS Local Waterfront
Revitalization Program . . . . . . . . . — — — 500,00043900 Private Grant . . . . . . . . . . . . . . . . . . . — 45,115 45,115 82,532__________________________ __________________________ __________________________ __________________________
1,000 652,935 614,202 1,121,465Net Change in Estimate of
Prior Receivables . . . . . . . . . . . . . . — — (25,000) —__________________________ __________________________ __________________________ __________________________Total Borough President—
Brooklyn . . . . . . . . . . . . . . 1,000 652,935 589,202 1,121,465__________________________ __________________________ __________________________ __________________________013 BOROUGH PRESIDENT—QUEENS
00822 Sales of Equipment, Scrap andOther Minor Sales . . . . . . . . . . . . . 3,000 3,000 2,008 2,199
04175 Violence Against Women . . . . . . . . . — 482,481 482,481 521,30506903 Project Snap-Up Seat Belt Program . . 44,024 201,738 204,695 211,72043900 Private Grant . . . . . . . . . . . . . . . . . . . — 12,540 12,540 7,46043973 Tourism Promotion Project . . . . . . . . 22,100 22,175 22,174 24,02444008 Disaster Related TFA Debt Issuance . . — 6,396 — —__________________________ __________________________ __________________________ __________________________
Total Borough President—Queens . . . . . . . . . . . . . . . . 69,124 728,330 723,898 766,708__________________________ __________________________ __________________________ __________________________
014 BOROUGH PRESIDENT—STATEN ISLAND
00822 Sales of Equipment, Scrap andOther Minor Sales . . . . . . . . . . . . . 2000 2,000 — —
03263 Public Assistance—WTC/FEMA . . . — 45,578 45,357 —43973 Tourism Promotion Project . . . . . . . . — — 12,750__________________________ __________________________ __________________________ __________________________
2,000 47,578 45,357 12,750Net Change in Estimate of
Prior Receivables . . . . . . . . . . . . . . — — — (62,854)__________________________ __________________________ __________________________ __________________________Total Borough President
Staten Island . . . . . . . . . . . . 2,000 47,578 45,357 (50,104)__________________________ __________________________ __________________________ __________________________015 OFFICE OF THE COMPTROLLER
00470 Other Services and Fees . . . . . . . . . . 145,000 145,000 226,861 455,60500846 Awards from Litigation and
Settlements . . . . . . . . . . . . . . . . . . . 700,000 700,000 641,691 939,29500859 Sundries . . . . . . . . . . . . . . . . . . . . . . 3,439,000 3,439,001 5,376,532 3,727,43356001 Interest Income—Other . . . . . . . . . . . 116,950,000 56,950,000 58,172,936 149,069,465
134
Comptroller’s Report for Fiscal 2002 Part II-E—General Fund—Schedule G3 (Cont.)
Revenues vs. Budget by Agency
Budget Actual RevenueRevenue Source _________________________________________________________________________ _________________________________________________________________________Within Agency Adopted Modified 2002 2001__________________________ _________________________________ _________________________________ _________________________________ _________________________________
(Continued)

015 OFFICE OF THE COMPTROLLER (cont.)56003 Interest Income—Debt
Service Fund . . . . . . . . . . . . . . . . . $ 28,930,000 $ 17,730,000 $ 17,169,673 $ 47,511,759__________________________ __________________________ __________________________ __________________________150,164,000 78,964,001 81,587,693 201,703,557
Net Change in Estimate of Prior Receivables . . . . . . . . . . . . . . — — (1,116) (186,518)__________________________ __________________________ __________________________ __________________________
Total Office of the Comptroller . . . . . . . . . . . . 150,164,000 78,964,001 81,586,577 201,517,039__________________________ __________________________ __________________________ __________________________
025 LAW DEPARTMENT
00476 Administrative Services to the Public . . . . . . . . . . . . . . . . . . . . 150,000 15,000 25,859 33,654
00600 Fines—General . . . . . . . . . . . . . . . . . 600,000 600,000 594,002 1,210,97600820 Sales of Other Real Property . . . . . . . 275,000 341,500 411,900 1,833,99700846 Awards from Litigation and
Settlements . . . . . . . . . . . . . . . . . . . 14,801,000 18,301,000 17,941,808 14,048,20700859 Sundries . . . . . . . . . . . . . . . . . . . . . . 14,657,000 14,837,000 14,968,742 15,297,55603263 Public Assistance—WTC/FEMA . . . — 3,445,231 1,130,174 —04216 Post Detention Responsibility . . . . . . — 417,273 410,536 543,46330906 Local Government Records
Management Improvement Program . . . . . . . . . . . . . . . . . . . . . — — — 27,000
31923 Law Department—NYC HousingAuthority . . . . . . . . . . . . . . . . . . . . — 275,000 289,945 1,040,484
43900 Private Grant . . . . . . . . . . . . . . . . . . . 437,024 437,024 417,024 417,024__________________________ __________________________ __________________________ __________________________30,920,024 38,669,028 36,189,990 34,452,361
Net Change in Estimate of Prior Receivables . . . . . . . . . . . . . . — — (2,103) —__________________________ __________________________ __________________________ __________________________
Total Law Department . . . . . . 30,920,024 38,669,028 36,187,887 34,452,361__________________________ __________________________ __________________________ __________________________030 DEPARTMENT OF CITY PLANNING
00476 Administrative Services to the Public . . . . . . . . . . . . . . . . . . . . 375,000 700,000 794,665 1,308,575
00822 Sales of Equipment, Scrap andOther Minor Sales . . . . . . . . . . . . . 425,000 530,000 475,665 535,968
00859 Sundries . . . . . . . . . . . . . . . . . . . . . . 275,000 275,000 25,589 101,92403263 Public Assistance—WTC/FEMA . . . — 1,588 1,588 —16053 Urban Mass Transportation
Administration Grant . . . . . . . . . . . 888,321 2,533,572 2,174,632 2,901,08730264 NYS Local Waterfront
Revitalization Program . . . . . . . . . — 202,361 232,633 79,000__________________________ __________________________ __________________________ __________________________1,963,321 4,242,521 3,704,772 4,926,554
Net Change in Estimate of Prior Receivables . . . . . . . . . . . . . . — — (3,569) (225,576)__________________________ __________________________ __________________________ __________________________
Total Department ofCity Planning . . . . . . . . . . . 1,963,321 4,242,521 3,701,203 4,700,978__________________________ __________________________ __________________________ __________________________
032 DEPARTMENT OF INVESTIGATION
00470 Other Services and Fees . . . . . . . . . . 801,000 801,000 1,046,345 961,22200600 Fines—General . . . . . . . . . . . . . . . . . 10,000 10,000 5,000 28,50000859 Sundries . . . . . . . . . . . . . . . . . . . . . . 245,000 320,000 316,833 492,718
135
Comptroller’s Report for Fiscal 2002 Part II-E—General Fund—Schedule G3 (Cont.)
Revenues vs. Budget by Agency
Budget Actual RevenueRevenue Source _________________________________________________________________________ _________________________________________________________________________Within Agency Adopted Modified 2002 2001__________________________ _________________________________ _________________________________ _________________________________ _________________________________
(Continued)
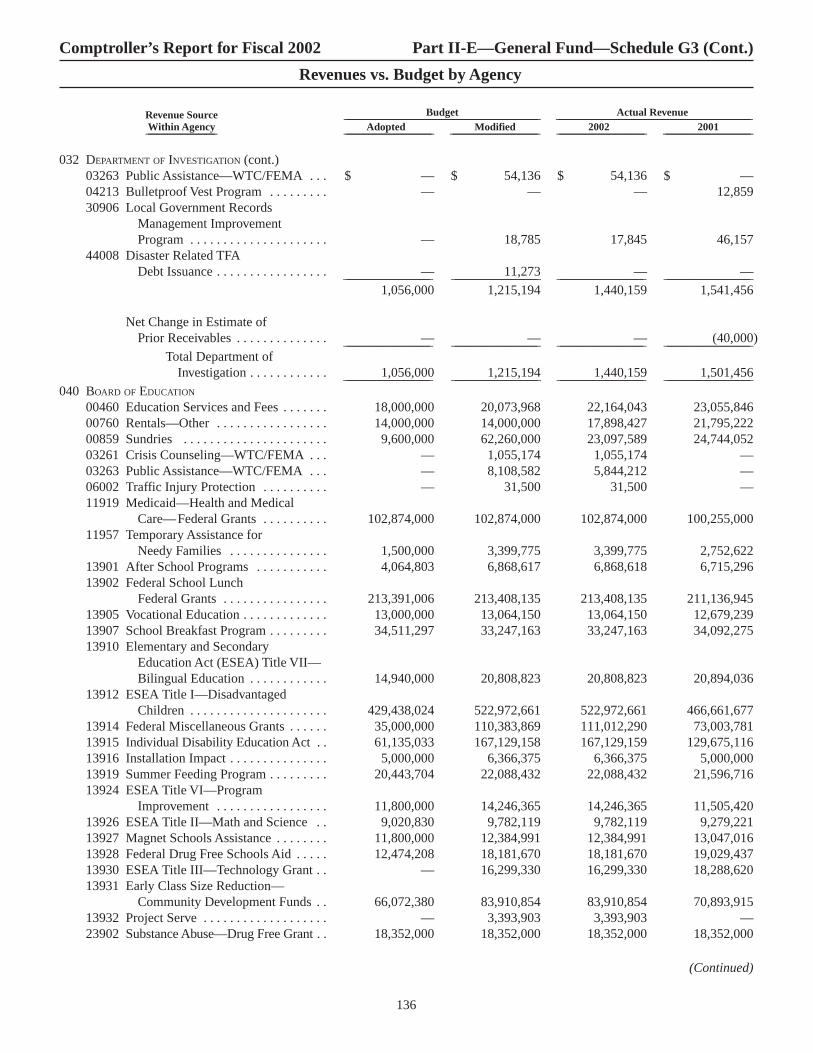
032 DEPARTMENT OF INVESTIGATION (cont.)03263 Public Assistance—WTC/FEMA . . . $ — $ 54,136 $ 54,136 $ —04213 Bulletproof Vest Program . . . . . . . . . — — — 12,85930906 Local Government Records
Management Improvement Program . . . . . . . . . . . . . . . . . . . . . — 18,785 17,845 46,157
44008 Disaster Related TFA Debt Issuance . . . . . . . . . . . . . . . . . — 11,273 — —__________________________ __________________________ __________________________ __________________________
1,056,000 1,215,194 1,440,159 1,541,456
Net Change in Estimate of Prior Receivables . . . . . . . . . . . . . . — — — (40,000)__________________________ __________________________ __________________________ __________________________
Total Department ofInvestigation . . . . . . . . . . . . 1,056,000 1,215,194 1,440,159 1,501,456__________________________ __________________________ __________________________ __________________________
040 BOARD OF EDUCATION
00460 Education Services and Fees . . . . . . . 18,000,000 20,073,968 22,164,043 23,055,84600760 Rentals—Other . . . . . . . . . . . . . . . . . 14,000,000 14,000,000 17,898,427 21,795,22200859 Sundries . . . . . . . . . . . . . . . . . . . . . . 9,600,000 62,260,000 23,097,589 24,744,05203261 Crisis Counseling—WTC/FEMA . . . — 1,055,174 1,055,174 —03263 Public Assistance—WTC/FEMA . . . — 8,108,582 5,844,212 —06002 Traffic Injury Protection . . . . . . . . . . — 31,500 31,500 —11919 Medicaid—Health and Medical
Care—Federal Grants . . . . . . . . . . 102,874,000 102,874,000 102,874,000 100,255,00011957 Temporary Assistance for
Needy Families . . . . . . . . . . . . . . . 1,500,000 3,399,775 3,399,775 2,752,62213901 After School Programs . . . . . . . . . . . 4,064,803 6,868,617 6,868,618 6,715,29613902 Federal School Lunch
Federal Grants . . . . . . . . . . . . . . . . 213,391,006 213,408,135 213,408,135 211,136,94513905 Vocational Education . . . . . . . . . . . . . 13,000,000 13,064,150 13,064,150 12,679,23913907 School Breakfast Program . . . . . . . . . 34,511,297 33,247,163 33,247,163 34,092,27513910 Elementary and Secondary
Education Act (ESEA) Title VII—Bilingual Education . . . . . . . . . . . . 14,940,000 20,808,823 20,808,823 20,894,036
13912 ESEA Title I—Disadvantaged Children . . . . . . . . . . . . . . . . . . . . . 429,438,024 522,972,661 522,972,661 466,661,677
13914 Federal Miscellaneous Grants . . . . . . 35,000,000 110,383,869 111,012,290 73,003,78113915 Individual Disability Education Act . . 61,135,033 167,129,158 167,129,159 129,675,11613916 Installation Impact . . . . . . . . . . . . . . . 5,000,000 6,366,375 6,366,375 5,000,00013919 Summer Feeding Program . . . . . . . . . 20,443,704 22,088,432 22,088,432 21,596,71613924 ESEA Title VI—Program
Improvement . . . . . . . . . . . . . . . . . 11,800,000 14,246,365 14,246,365 11,505,42013926 ESEA Title II—Math and Science . . 9,020,830 9,782,119 9,782,119 9,279,22113927 Magnet Schools Assistance . . . . . . . . 11,800,000 12,384,991 12,384,991 13,047,01613928 Federal Drug Free Schools Aid . . . . . 12,474,208 18,181,670 18,181,670 19,029,43713930 ESEA Title III—Technology Grant . . — 16,299,330 16,299,330 18,288,62013931 Early Class Size Reduction—
Community Development Funds . . 66,072,380 83,910,854 83,910,854 70,893,91513932 Project Serve . . . . . . . . . . . . . . . . . . . — 3,393,903 3,393,903 —23902 Substance Abuse—Drug Free Grant . . 18,352,000 18,352,000 18,352,000 18,352,000
136
Comptroller’s Report for Fiscal 2002 Part II-E—General Fund—Schedule G3 (Cont.)
Revenues vs. Budget by Agency
Budget Actual RevenueRevenue Source _________________________________________________________________________ _________________________________________________________________________Within Agency Adopted Modified 2002 2001__________________________ _________________________________ _________________________________ _________________________________ _________________________________
(Continued)
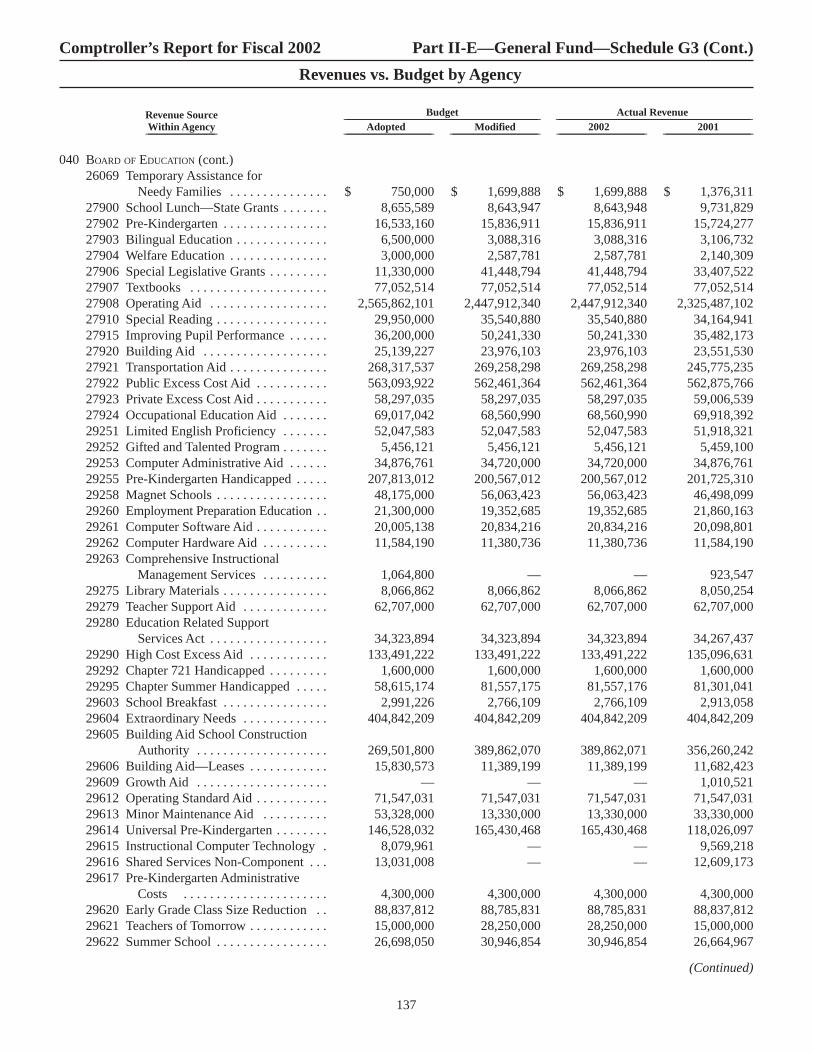
040 BOARD OF EDUCATION (cont.)26069 Temporary Assistance for
Needy Families . . . . . . . . . . . . . . . $ 750,000 $ 1,699,888 $ 1,699,888 $ 1,376,31127900 School Lunch—State Grants . . . . . . . 8,655,589 8,643,947 8,643,948 9,731,82927902 Pre-Kindergarten . . . . . . . . . . . . . . . . 16,533,160 15,836,911 15,836,911 15,724,27727903 Bilingual Education . . . . . . . . . . . . . . 6,500,000 3,088,316 3,088,316 3,106,73227904 Welfare Education . . . . . . . . . . . . . . . 3,000,000 2,587,781 2,587,781 2,140,30927906 Special Legislative Grants . . . . . . . . . 11,330,000 41,448,794 41,448,794 33,407,52227907 Textbooks . . . . . . . . . . . . . . . . . . . . . 77,052,514 77,052,514 77,052,514 77,052,51427908 Operating Aid . . . . . . . . . . . . . . . . . . 2,565,862,101 2,447,912,340 2,447,912,340 2,325,487,10227910 Special Reading . . . . . . . . . . . . . . . . . 29,950,000 35,540,880 35,540,880 34,164,94127915 Improving Pupil Performance . . . . . . 36,200,000 50,241,330 50,241,330 35,482,17327920 Building Aid . . . . . . . . . . . . . . . . . . . 25,139,227 23,976,103 23,976,103 23,551,53027921 Transportation Aid . . . . . . . . . . . . . . . 268,317,537 269,258,298 269,258,298 245,775,23527922 Public Excess Cost Aid . . . . . . . . . . . 563,093,922 562,461,364 562,461,364 562,875,76627923 Private Excess Cost Aid . . . . . . . . . . . 58,297,035 58,297,035 58,297,035 59,006,53927924 Occupational Education Aid . . . . . . . 69,017,042 68,560,990 68,560,990 69,918,39229251 Limited English Proficiency . . . . . . . 52,047,583 52,047,583 52,047,583 51,918,32129252 Gifted and Talented Program . . . . . . . 5,456,121 5,456,121 5,456,121 5,459,10029253 Computer Administrative Aid . . . . . . 34,876,761 34,720,000 34,720,000 34,876,76129255 Pre-Kindergarten Handicapped . . . . . 207,813,012 200,567,012 200,567,012 201,725,31029258 Magnet Schools . . . . . . . . . . . . . . . . . 48,175,000 56,063,423 56,063,423 46,498,09929260 Employment Preparation Education . . 21,300,000 19,352,685 19,352,685 21,860,16329261 Computer Software Aid . . . . . . . . . . . 20,005,138 20,834,216 20,834,216 20,098,80129262 Computer Hardware Aid . . . . . . . . . . 11,584,190 11,380,736 11,380,736 11,584,19029263 Comprehensive Instructional
Management Services . . . . . . . . . . 1,064,800 — — 923,54729275 Library Materials . . . . . . . . . . . . . . . . 8,066,862 8,066,862 8,066,862 8,050,25429279 Teacher Support Aid . . . . . . . . . . . . . 62,707,000 62,707,000 62,707,000 62,707,00029280 Education Related Support
Services Act . . . . . . . . . . . . . . . . . . 34,323,894 34,323,894 34,323,894 34,267,43729290 High Cost Excess Aid . . . . . . . . . . . . 133,491,222 133,491,222 133,491,222 135,096,63129292 Chapter 721 Handicapped . . . . . . . . . 1,600,000 1,600,000 1,600,000 1,600,00029295 Chapter Summer Handicapped . . . . . 58,615,174 81,557,175 81,557,176 81,301,04129603 School Breakfast . . . . . . . . . . . . . . . . 2,991,226 2,766,109 2,766,109 2,913,05829604 Extraordinary Needs . . . . . . . . . . . . . 404,842,209 404,842,209 404,842,209 404,842,20929605 Building Aid School Construction
Authority . . . . . . . . . . . . . . . . . . . . 269,501,800 389,862,070 389,862,071 356,260,24229606 Building Aid—Leases . . . . . . . . . . . . 15,830,573 11,389,199 11,389,199 11,682,42329609 Growth Aid . . . . . . . . . . . . . . . . . . . . — — — 1,010,52129612 Operating Standard Aid . . . . . . . . . . . 71,547,031 71,547,031 71,547,031 71,547,03129613 Minor Maintenance Aid . . . . . . . . . . 53,328,000 13,330,000 13,330,000 33,330,00029614 Universal Pre-Kindergarten . . . . . . . . 146,528,032 165,430,468 165,430,468 118,026,09729615 Instructional Computer Technology . 8,079,961 — — 9,569,21829616 Shared Services Non-Component . . . 13,031,008 — — 12,609,17329617 Pre-Kindergarten Administrative
Costs . . . . . . . . . . . . . . . . . . . . . . 4,300,000 4,300,000 4,300,000 4,300,00029620 Early Grade Class Size Reduction . . 88,837,812 88,785,831 88,785,831 88,837,81229621 Teachers of Tomorrow . . . . . . . . . . . . 15,000,000 28,250,000 28,250,000 15,000,00029622 Summer School . . . . . . . . . . . . . . . . . 26,698,050 30,946,854 30,946,854 26,664,967
137
Comptroller’s Report for Fiscal 2002 Part II-E—General Fund—Schedule G3 (Cont.)
Revenues vs. Budget by Agency
Budget Actual RevenueRevenue Source _________________________________________________________________________ _________________________________________________________________________Within Agency Adopted Modified 2002 2001__________________________ _________________________________ _________________________________ _________________________________ _________________________________
(Continued)

040 BOARD OF EDUCATION (cont.)29623 Big 5 Fund for Innovation . . . . . . . . . $ — $ 9,000,000 $ 9,000,000 —29625 Assembly Legislative Grant . . . . . . . — 23,500,000 23,500,000 —29970 State Aid . . . . . . . . . . . . . . . . . . . . . . — — — 12,273,16830400 Stop DWI . . . . . . . . . . . . . . . . . . . . . . — 173,240 173,240 —41900 Private Grants . . . . . . . . . . . . . . . . . . 15,000,000 17,309,058 17,309,059 16,546,07941901 Private Grants . . . . . . . . . . . . . . . . . . — — — 1,033,63941905 School Construction Authority . . . . . — 14,017,187 14,017,187 17,768,80041911 Non-Resident Tuition . . . . . . . . . . . . 317,970 317,970 317,970 1,100,00041912 CUNY/BOE Partnership . . . . . . . . . . — — — 414,69641913 Universal Service Funds . . . . . . . . . . — 19,581,440 19,581,440 15,221,56355030 WTC PS Related Costs . . . . . . . . . . . — 11,363 — —__________________________ __________________________ __________________________ __________________________
6,683,075,841 7,188,826,063 7,154,004,848 6,752,171,975Net Change in Estimate of
Prior Receivables . . . . . . . . . . . . . . — — (82,538,615) (16,487,638)__________________________ __________________________ __________________________ __________________________Total Board of Education . . . 6,683,075,841 7,188,826,063 7,071,466,233 6,735,684,337__________________________ __________________________ __________________________ __________________________
042 CITY UNIVERSITY OF NEW YORK
00461 Higher Education Services and Fees—Community Colleges . . . . . 132,976,000 132,976,000 138,039,276 132,907,945
00760 Other Rentals . . . . . . . . . . . . . . . . . . . 2,300,000 2,300,000 2,300,000 2,206,62700859 Sundries . . . . . . . . . . . . . . . . . . . . . . 185,000 185,000 56,904 191,78603263 Public Assistance—WTC/FEMA . . . — 4,928,740 218,856 —13017 Individual Vocational Education
Skills Training . . . . . . . . . . . . . . . . — 645,000 399,913 334,29627909 State Aid—Community Colleges . . . 124,188,463 121,488,750 125,723,287 124,812,46327911 Hunter Public School Aid . . . . . . . . . 1,300,000 1,300,000 1,300,000 1,300,00027912 State Aid—Senior Colleges . . . . . . . . 35,000,000 35,000,000 — —27928 SHINN Pension . . . . . . . . . . . . . . . . . 10,500,000 — — —29271 Community College Child Care . . . . 2,425,000 1,865,000 1,865,000 2,425,00029350 Community College Rents . . . . . . . . 624,000 624,000 — —29355 College Discovery Program . . . . . . . 764,000 574,000 574,000 764,00043900 Private Grant . . . . . . . . . . . . . . . . . . . 5,000,000 5,000,000 331,481 1,009,545__________________________ __________________________ __________________________ __________________________
315,262,463 306,886,490 270,808,717 265,951,662Net Change in Estimate of
Prior Receivables . . . . . . . . . . . . . . — — (448,076) (3,940,808)__________________________ __________________________ __________________________ __________________________Total City University of
New York . . . . . . . . . . . . . . 315,262,463 306,886,490 270,360,641 262,010,854__________________________ __________________________ __________________________ __________________________054 CIVILIAN COMPLAINT REVIEW BOARD
00470 Other Services and Fees . . . . . . . . . . — — 5,531 1,81503263 Public Assistance—WTC/FEMA . . . 1,452 — —30906 Local Government Records
Management Improvement Program . . . . . . . . . . . . . . . . . . . . . — 5,000 5,000 —__________________________ __________________________ __________________________ __________________________
— 6,452 10,531 1,815Net Change in Estimate of
Prior Receivables . . . . . . . . . . . . . . — — (19,008) —__________________________ __________________________ __________________________ __________________________Total Civilian Complaint
Review Board . . . . . . . . . . . — 6,452 (8,477) 1,815__________________________ __________________________ __________________________ __________________________
138
Comptroller’s Report for Fiscal 2002 Part II-E—General Fund—Schedule G3 (Cont.)
Revenues vs. Budget by Agency
Budget Actual RevenueRevenue Source _________________________________________________________________________ _________________________________________________________________________Within Agency Adopted Modified 2002 2001__________________________ _________________________________ _________________________________ _________________________________ _________________________________
(Continued)

056 POLICE DEPARTMENT
00200 Licenses—General . . . . . . . . . . . . . . $ 2,735,000 $ 3,300,000 $ 3,499,793 $ 2,449,49500250 Permits—General . . . . . . . . . . . . . . . 855,000 600,000 553,524 575,00000470 Other Services and Fees . . . . . . . . . . 19,617,000 18,460,000 18,914,054 20,550,63200472 Parking Meter Revenues . . . . . . . . . . 586,000 586,000 582,711 731,59000600 Fines—General . . . . . . . . . . . . . . . . . 6,000 6,000 — —00859 Sundries . . . . . . . . . . . . . . . . . . . . . . 9,000,000 24,000,000 9,736,666 9,146,19601225 Bronx Housing—HUD . . . . . . . . . . . — — — 173,69701227 HUD—South Jamaica Housing . . . . — 233,530 158,937 225,00001228 HUD—St. Nicholas Housing Project . . — — — 1,97301229 HUD—Harlem Congregation in
32nd Precinct . . . . . . . . . . . . . . . . . — — — 31,63701231 HUD Operation High Rise
Bronx Highbridge . . . . . . . . . . . . . — 12,734 12,734 26,68303200 Gang Resistance Education Training . . — 343,633 321,196 324,00103263 Public Assistance—WTC/FEMA . . . — 272,455,666 283,746,648 —04017 Federal Assistance for Police . . . . . . 30,000,000 4,000,000 4,000,000 4,000,00004028 Drug Enforcement . . . . . . . . . . . . . . . 702,500 2,499,722 2,589,836 2,500,59804132 High Intensity Drug Trafficking Area
(HIDTA)—Joint Drug Gang . . . . . — — — 217,93504133 HIDTA—Regional Narcotics
Training Center . . . . . . . . . . . . . . . — 118,926 100,187 168,79204139 Weed and Seed Project . . . . . . . . . . . — 480,160 208,431 185,09304150 HIDTA—Drug Gang Trafficking
System . . . . . . . . . . . . . . . . . . . . . . — — — 35,31304158 Federal Crime Bill . . . . . . . . . . . . . . . — 262,903 9,547 304,16304166 Community Oriented Policing
Services (COPS) Universal Hiring Program . . . . . . . . . . . . . . . 22,499,988 26,001,133 22,485,569 66,540,476
04167 Local Law Enforcement Block Grant . . — 20,712,375 19,873,279 20,402,70704170 Northern Manhattan Initiative . . . . . . — 3,646,636 3,833,267 2,282,36804173 School Safety Initiative . . . . . . . . . . . — 95,980 95,980 1,550,79404174 NYC Law Enforcement Crime/Drug
Prevention Block Grant . . . . . . . . . — 51,142 85,255 387,37004175 Violence Against Women . . . . . . . . . — 194,941 198,605 125,09304186 Drug Activity Hotline Block Grant . . — 65,532 2,891 4,39804190 Cops Advancing Community Policy . . — 113,854 82,361 168,35004191 COPS More Program . . . . . . . . . . . . — 3,934,942 3,708,743 14,378,46204192 Domestic Violence Linked
Data Base . . . . . . . . . . . . . . . . . . . . — 516,895 225,254 296,75004196 Federal Anti-terrorist Aid . . . . . . . . . — 4,000,000 — —04205 Nurturing Our Valuable Adolescent
Program . . . . . . . . . . . . . . . . . . . . . — — — 102,54004206 19th Precinct Truancy and Gang
Intervention Program . . . . . . . . . . . — — — 4,16004207 17th Precinct Youth Ambassador
Host Program . . . . . . . . . . . . . . . . . — — — 4,56404211 School Based Partnership Program . . — 64,773 26,861 112,64904219 Alcohol Breath Analyzers Program . . — — — 56,000
139
Comptroller’s Report for Fiscal 2002 Part II-E—General Fund—Schedule G3 (Cont.)
Revenues vs. Budget by Agency
Budget Actual RevenueRevenue Source _________________________________________________________________________ _________________________________________________________________________Within Agency Adopted Modified 2002 2001__________________________ _________________________________ _________________________________ _________________________________ _________________________________
(Continued)

056 POLICE DEPARTMENT (cont.)04220 DNA Evidence Collection
Training Program . . . . . . . . . . . . . . $ — $ 34,011 $ 11,496 $ 65,98904221 94th Precinct Narcotics Awareness
Reach—Children . . . . . . . . . . . . . . — 204,908 188,190 185,09204223 Patrol Service Area 3 Narcotics
Surveillance . . . . . . . . . . . . . . . . . . — 187,985 126,762 152,01504233 HIDTA Rental Program . . . . . . . . . . . — 790,353 790,353 —19929 Forfeiture Law Enforcement . . . . . . . — 5,697,006 4,444,140 4,207,23219934 Soft Body Armor Vests Program . . . . — 297,526 297,525 209,74319935 Enforcement of Navigation Laws . . . 132,000 132,000 400,000 400,00019949 State Felony Program . . . . . . . . . . . . 2,000 2,000 1,379 2,41923801 Highway Emergency Local Patrol . . . — 286,328 1,259,442 1,232,92423802 NYSDOT Traffic Control . . . . . . . . . — 174,212 96,975 431,76823947 Emergency Medical Technical
Training . . . . . . . . . . . . . . . . . . . . . 59,800 59,800 63,537 85,11829853 Aid to Crime Labs . . . . . . . . . . . . . . . 564,430 1,619,921 872,791 846,22229854 Aid to Law Enforcement . . . . . . . . . . 5,094,265 — — 4,354,95829863 Anti-Auto Theft Insurance Program . . — 153,965 122,842 320,54629873 Motor Vechicle Theft
Insurance Fraud . . . . . . . . . . . . . . . — 1,300,301 595,009 374,69929877 Highway District Laser Speed
Measurement . . . . . . . . . . . . . . . . . — — — 1,66529880 Queens North Power Point . . . . . . . . — 4,500 4,440 —29881 7th Precinct Auxillary Program . . . . . — 20,000 — —29882 17th Precinct Youth Ambassador
Host Program . . . . . . . . . . . . . . . . . — 6,000 5,243 —29883 19th Precinct Truancy & Gang
Intervention . . . . . . . . . . . . . . . . . . — 6,000 1,640 —29905 State Grants—Reimbursement
of Retireees—Article 1 . . . . . . . . . 500,000 500,000 500,000 500,00029978 State Aid-Pension Reimbursement . . 8,508,000 7,872,000 8,087,195 7,700,56630400 Stop DWI . . . . . . . . . . . . . . . . . . . . . . — 569,694 388,193 498,27830402 Buckle Up New York Program . . . . . — 463,717 262,505 591,02630403 Traffic Operations Yielding
Safety Program . . . . . . . . . . . . . . . — — — 108,35030406 Combat Aggressive Driving
Program . . . . . . . . . . . . . . . . . . . . . — 319,692 367,688 39,74831652 School Safety Radio . . . . . . . . . . . . . — 150,000 149,989 —31914 Asset Forfeiture—Private . . . . . . . . . — 23,385,005 20,205,318 19,020,82135904 Williamsburg Bridge Project . . . . . . . — 2,295,168 2,288,484 2,720,07535940 Gowanus/Prospect Expressway . . . . . — 13,796 13,796 61,40735941 Queens Midtown Tunnel . . . . . . . . . . — 17,771 17,771 475,36735944 TEA—West Side Highway
Route 9A . . . . . . . . . . . . . . . . . . . . — — — 562,18035947 TEA—Lenox Avenue Rehabilitation . . — — — 2,64235950 TEA—Brooklyn Bridge . . . . . . . . . . — — — 3,92035954 TEA—Long Island Expressway . . . . — 450,370 421,972 392,78235955 TEA—Canal St. Water Main
Replacement . . . . . . . . . . . . . . . . . — 168,225 168,225 304,102
140
Comptroller’s Report for Fiscal 2002 Part II-E—General Fund—Schedule G3 (Cont.)
Revenues vs. Budget by Agency
Budget Actual RevenueRevenue Source _________________________________________________________________________ _________________________________________________________________________Within Agency Adopted Modified 2002 2001__________________________ _________________________________ _________________________________ _________________________________ _________________________________
(Continued)
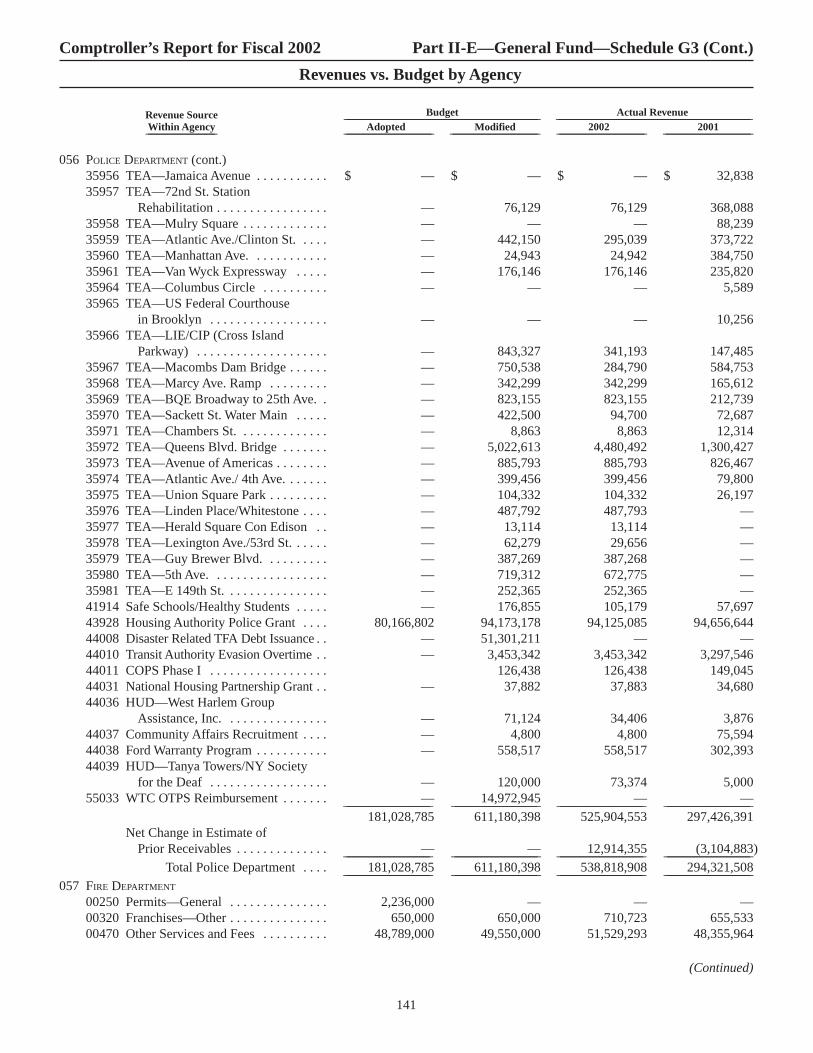
056 POLICE DEPARTMENT (cont.)35956 TEA—Jamaica Avenue . . . . . . . . . . . $ — $ — $ — $ 32,83835957 TEA—72nd St. Station
Rehabilitation . . . . . . . . . . . . . . . . . — 76,129 76,129 368,08835958 TEA—Mulry Square . . . . . . . . . . . . . — — — 88,23935959 TEA—Atlantic Ave./Clinton St. . . . . — 442,150 295,039 373,72235960 TEA—Manhattan Ave. . . . . . . . . . . . — 24,943 24,942 384,75035961 TEA—Van Wyck Expressway . . . . . — 176,146 176,146 235,82035964 TEA—Columbus Circle . . . . . . . . . . — — — 5,58935965 TEA—US Federal Courthouse
in Brooklyn . . . . . . . . . . . . . . . . . . — — — 10,25635966 TEA—LIE/CIP (Cross Island
Parkway) . . . . . . . . . . . . . . . . . . . . — 843,327 341,193 147,48535967 TEA—Macombs Dam Bridge . . . . . . — 750,538 284,790 584,75335968 TEA—Marcy Ave. Ramp . . . . . . . . . — 342,299 342,299 165,61235969 TEA—BQE Broadway to 25th Ave. . — 823,155 823,155 212,73935970 TEA—Sackett St. Water Main . . . . . — 422,500 94,700 72,68735971 TEA—Chambers St. . . . . . . . . . . . . . — 8,863 8,863 12,31435972 TEA—Queens Blvd. Bridge . . . . . . . — 5,022,613 4,480,492 1,300,42735973 TEA—Avenue of Americas . . . . . . . . — 885,793 885,793 826,46735974 TEA—Atlantic Ave./ 4th Ave. . . . . . . — 399,456 399,456 79,80035975 TEA—Union Square Park . . . . . . . . . — 104,332 104,332 26,19735976 TEA—Linden Place/Whitestone . . . . — 487,792 487,793 —35977 TEA—Herald Square Con Edison . . — 13,114 13,114 —35978 TEA—Lexington Ave./53rd St. . . . . . — 62,279 29,656 —35979 TEA—Guy Brewer Blvd. . . . . . . . . . — 387,269 387,268 —35980 TEA—5th Ave. . . . . . . . . . . . . . . . . . — 719,312 672,775 —35981 TEA—E 149th St. . . . . . . . . . . . . . . . — 252,365 252,365 —41914 Safe Schools/Healthy Students . . . . . — 176,855 105,179 57,69743928 Housing Authority Police Grant . . . . 80,166,802 94,173,178 94,125,085 94,656,64444008 Disaster Related TFA Debt Issuance . . — 51,301,211 — —44010 Transit Authority Evasion Overtime . . — 3,453,342 3,453,342 3,297,54644011 COPS Phase I . . . . . . . . . . . . . . . . . . 126,438 126,438 149,04544031 National Housing Partnership Grant . . — 37,882 37,883 34,68044036 HUD—West Harlem Group
Assistance, Inc. . . . . . . . . . . . . . . . — 71,124 34,406 3,87644037 Community Affairs Recruitment . . . . — 4,800 4,800 75,59444038 Ford Warranty Program . . . . . . . . . . . — 558,517 558,517 302,39344039 HUD—Tanya Towers/NY Society
for the Deaf . . . . . . . . . . . . . . . . . . — 120,000 73,374 5,00055033 WTC OTPS Reimbursement . . . . . . . — 14,972,945 — —__________________________ __________________________ __________________________ __________________________
181,028,785 611,180,398 525,904,553 297,426,391Net Change in Estimate of
Prior Receivables . . . . . . . . . . . . . . — — 12,914,355 (3,104,883)__________________________ __________________________ __________________________ __________________________Total Police Department . . . . 181,028,785 611,180,398 538,818,908 294,321,508__________________________ __________________________ __________________________ __________________________
057 FIRE DEPARTMENT
00250 Permits—General . . . . . . . . . . . . . . . 2,236,000 — — —00320 Franchises—Other . . . . . . . . . . . . . . . 650,000 650,000 710,723 655,53300470 Other Services and Fees . . . . . . . . . . 48,789,000 49,550,000 51,529,293 48,355,964
141
Comptroller’s Report for Fiscal 2002 Part II-E—General Fund—Schedule G3 (Cont.)
Revenues vs. Budget by Agency
Budget Actual RevenueRevenue Source _________________________________________________________________________ _________________________________________________________________________Within Agency Adopted Modified 2002 2001__________________________ _________________________________ _________________________________ _________________________________ _________________________________
(Continued)

057 FIRE DEPARTMENT (cont.)00476 Administrative Services to
the Public . . . . . . . . . . . . . . . . . . . . $ 4,690,000 $ — $ — $ —00600 Fines—General . . . . . . . . . . . . . . . . . 1,965,000 — — —00859 Sundries . . . . . . . . . . . . . . . . . . . . . . — — 5,238 71,73003263 Public Assistance—WTC/FEMA . . . — 139,857,777 123,677,336 —04032 Gateway Park . . . . . . . . . . . . . . . . . . . 25,000 25,000 25,000 25,00013019 9/11/01 Related Medical
Monitoring . . . . . . . . . . . . . . . . . . . — 4,801,550 2,717,627 —23989 Health Research Inc. . . . . . . . . . . . . . — — — 5,00029978 State Aid—Pension Reimbursement . . 7,836,000 16,113,838 16,239,858 8,464,57630003 Officer Induction Training School . . . 546,839 700,000 700,000 700,00030953 Emergency Medical Services
Educational Program . . . . . . . . . . . 583,519 427,941 416,281 499,58430954 Trauma Grant . . . . . . . . . . . . . . . . . . — — — 664,18830955 9/11/01 Grant . . . . . . . . . . . . . . . . . . . 415,643 206,461 194,547 238,52537929 Clinical Screening Program . . . . . . . 2,639,566 2,639,566 2,585,236 2,335,55243900 Private Grant . . . . . . . . . . . . . . . . . . . 69,805,000 103,350,330 101,145,090 69,526,20144008 Disaster Related TFA Debt Issuance . . — 36,559,000 — —55030 WTC PS Related Costs . . . . . . . . . . . — 2,902,539 — —__________________________ __________________________ __________________________ __________________________
140,181,567 357,784,002 299,946,229 131,541,853Net Change in Estimate of
Prior Receivables . . . . . . . . . . . . . . — — (10,723) (392,120)__________________________ __________________________ __________________________ __________________________Total Fire Department . . . . . . 140,181,567 357,784,002 299,935,506 131,149,733__________________________ __________________________ __________________________ __________________________
068 ADMINISTRATION FOR CHILDREN’S SERVICES
00859 Sundries . . . . . . . . . . . . . . . . . . . . . . 16,787,500 16,787,500 22,679,988 16,882,27700887 Day Care and Senior Centers . . . . . . 3,419,000 3,419,000 4,634,245 2,615,80003263 Public Assistance—WTC/FEMA . . . — 200,101 200,100 —11905 Personal Services Reimbursement—
Federal . . . . . . . . . . . . . . . . . . . . . . — — — 156,74711914 Fringe Benefits—Federal . . . . . . . . . 19,769,500 19,769,500 19,769,500 18,095,48811919 Medicaid—Health and Medical
Care—Federal Grants . . . . . . . . . . 839,705 811,490 2,203,322 156,29411954 Preventive Services Title-IVB . . . . . . — 8,947,903 8,947,106 9,137,91211956 Temporary Assistance for Needy
Families (TANF) Title XX . . . . . . . — — — 87,166,27211957 TANF—Public Assistance—Federal
Families . . . . . . . . . . . . . . . . . . . . . 8,171,944 10,847,769 36,505,874 13,955,05811958 TANF—Emergency Assistance
for Families . . . . . . . . . . . . . . . . . . 82,733,827 48,692,863 18,934,361 77,138,86111959 Title IV-E—Foster Care Programs . . 307,074,410 240,003,188 206,893,444 210,706,27211960 Title IV-E—Protective Services . . . . 16,975,723 5,943,728 5,217,625 4,069,60511961 Title IV-E—Foster Care
Administration . . . . . . . . . . . . . . . . 68,110,088 78,417,458 76,098,783 71,666,12411962 Title IV-E—Adoption Assistance . . . 134,521,200 149,887,884 151,079,049 108,296,59411963 Title-IV-E—Independent Living . . . . 3,241,002 11,175,102 7,631,575 8,529,45211964 Title-IV-E—Juvenile Delinquents
Fostercare . . . . . . . . . . . . . . . . . . . . 37,038,531 425,821 — —11965 Title-IV-D—Child Support
Enforcement . . . . . . . . . . . . . . . . . . 30,765,407 30,765,407 — —
142
Comptroller’s Report for Fiscal 2002 Part II-E—General Fund—Schedule G3 (Cont.)
Revenues vs. Budget by Agency
Budget Actual RevenueRevenue Source _________________________________________________________________________ _________________________________________________________________________Within Agency Adopted Modified 2002 2001__________________________ _________________________________ _________________________________ _________________________________ _________________________________
(Continued)

068 ADMINISTRATION FOR CHILDREN’S SERVICES (cont.)11966 Child Care and Development Block
Grant—Federal . . . . . . . . . . . . . . . $ 288,723,446 $ 287,729,804 $ 303,908,212 $ 214,940,65211967 Title XX—Social Services
Block Grant . . . . . . . . . . . . . . . . . . 35,963,638 22,710,633 80,480,916 74,041,83211968 TANF—100 Percent Federal . . . . . . . 5,000,000 6,000,000 — —11975 Resettled Refugees . . . . . . . . . . . . . . — 380,571 418,281 266,83611979 Emergency Income Maintenance
Administration—Federal . . . . . . . . — 1,600,000 1,659,785 1,491,14011980 Medical Assistance Program—
Medicaid—Federal . . . . . . . . . . . . 93,989 3,295,615 3,394,210 3,583,05911981 Child Support Administration . . . . . . — 32,833,751 39,736,044 38,170,92911982 Adoption Assistance
Administration—Federal . . . . . . . . 277,075 4,952,042 3,808,716 3,648,19511983 Administrative Training—Federal . . . 11,060 6,411,300 6,264,316 3,102,51711984 Title-IV-E—Preventive Services . . . . 681,481 7,794,350 8,427,040 8,359,29511989 Collabrative Investment for
Child Project . . . . . . . . . . . . . . . . . — 55,028 55,028 49,53211990 TANF-Emergency Assistance for
Families (EAF) Child Protection Services . . . . . . . . . . . . . . . . . . . . . — 47,963,291 17,869,514 —
11991 TANF-EAF Child Welfare . . . . . . . . . — 14,588,140 20,015,08611992 TANF-EAF Juvenile Delinquent
Supervision . . . . . . . . . . . . . . . . . . — 13,581,632 11,378,844 —11993 TANF-EAF NYC Tuition . . . . . . . . . — — 32,161,306 —11994 Title XX—Child Protection . . . . . . . — 5,385,911 16,659,514 —11995 Title XX—Aftercare and Adoption . . — 46,719,775 48,595,740 —11996 HIV Care Formula Grant . . . . . . . . . . — 80,428 40,214 —11997 Project Liberty . . . . . . . . . . . . . . . . . . — 3,501 3,501 —13901 School Lunch . . . . . . . . . . . . . . . . . . . — — 175,084 584,47515901 Head Start Grant . . . . . . . . . . . . . . . . 149,654,587 172,668,162 165,551,501 158,715,90423900 Medical Assistance Reimbursement . . — 70,000 1,104,215 154,91725908 Special Education Services . . . . . . . . — 33,728,757 18,624,383 11,236,68425911 Personal Services
Reimbursement—State . . . . . . . . . — — — 80,74925913 Fringe Benefits—State . . . . . . . . . . . 12,078,530 12,078,530 12,078,530 13,520,08926063 Foster Care Block Grant . . . . . . . . . . 355,830,243 278,160,052 226,534,591 301,686,10726065 Protective Services . . . . . . . . . . . . . . 44,297,893 26,712,287 37,149,900 24,439,28426066 Adoption Assistance
Administration—State . . . . . . . . . . 115,392,536 115,392,536 126,989,723 93,351,16626069 TANF—Public Assistance State . . . . — 7,500,000 6,956,649 7,675,35326070 TANF—Emergency Assistance
for Families . . . . . . . . . . . . . . . . . . — 2,000 563 185,84926071 Safety—Net . . . . . . . . . . . . . . . . . . . . — 500,000 360,572 537,07226084 Title IV-D Child Support
Enforcement . . . . . . . . . . . . . . . . . . 4,830,170 4,830,170 — —26085 Administrative Training—State . . . . . — 900,000 1,121,381 658,04826086 Emergency Income Maintenance
Administration . . . . . . . . . . . . . . . . — 800,000 602,298 592,637
143
Comptroller’s Report for Fiscal 2002 Part II-E—General Fund—Schedule G3 (Cont.)
Revenues vs. Budget by Agency
Budget Actual RevenueRevenue Source _________________________________________________________________________ _________________________________________________________________________Within Agency Adopted Modified 2002 2001__________________________ _________________________________ _________________________________ _________________________________ _________________________________
(Continued)
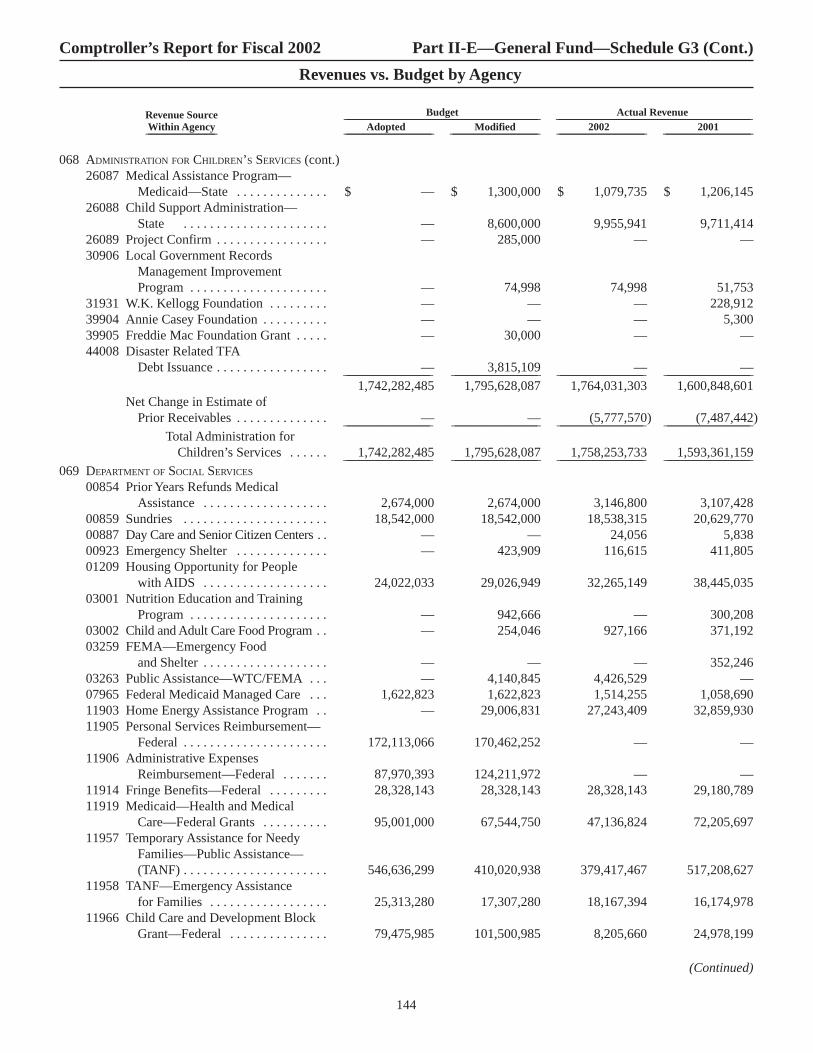
068 ADMINISTRATION FOR CHILDREN’S SERVICES (cont.)26087 Medical Assistance Program—
Medicaid—State . . . . . . . . . . . . . . $ — $ 1,300,000 $ 1,079,735 $ 1,206,14526088 Child Support Administration—
State . . . . . . . . . . . . . . . . . . . . . . — 8,600,000 9,955,941 9,711,41426089 Project Confirm . . . . . . . . . . . . . . . . . — 285,000 — —30906 Local Government Records
Management Improvement Program . . . . . . . . . . . . . . . . . . . . . — 74,998 74,998 51,753
31931 W.K. Kellogg Foundation . . . . . . . . . — — — 228,91239904 Annie Casey Foundation . . . . . . . . . . — — — 5,30039905 Freddie Mac Foundation Grant . . . . . — 30,000 — —44008 Disaster Related TFA
Debt Issuance . . . . . . . . . . . . . . . . . — 3,815,109 — —__________________________ __________________________ __________________________ __________________________1,742,282,485 1,795,628,087 1,764,031,303 1,600,848,601
Net Change in Estimate of Prior Receivables . . . . . . . . . . . . . . — — (5,777,570) (7,487,442)__________________________ __________________________ __________________________ __________________________
Total Administration forChildren’s Services . . . . . . 1,742,282,485 1,795,628,087 1,758,253,733 1,593,361,159__________________________ __________________________ __________________________ __________________________
069 DEPARTMENT OF SOCIAL SERVICES
00854 Prior Years Refunds Medical Assistance . . . . . . . . . . . . . . . . . . . 2,674,000 2,674,000 3,146,800 3,107,428
00859 Sundries . . . . . . . . . . . . . . . . . . . . . . 18,542,000 18,542,000 18,538,315 20,629,77000887 Day Care and Senior Citizen Centers . . — — 24,056 5,83800923 Emergency Shelter . . . . . . . . . . . . . . — 423,909 116,615 411,80501209 Housing Opportunity for People
with AIDS . . . . . . . . . . . . . . . . . . . 24,022,033 29,026,949 32,265,149 38,445,03503001 Nutrition Education and Training
Program . . . . . . . . . . . . . . . . . . . . . — 942,666 — 300,20803002 Child and Adult Care Food Program . . — 254,046 927,166 371,19203259 FEMA—Emergency Food
and Shelter . . . . . . . . . . . . . . . . . . . — — — 352,24603263 Public Assistance—WTC/FEMA . . . — 4,140,845 4,426,529 —07965 Federal Medicaid Managed Care . . . 1,622,823 1,622,823 1,514,255 1,058,69011903 Home Energy Assistance Program . . — 29,006,831 27,243,409 32,859,93011905 Personal Services Reimbursement—
Federal . . . . . . . . . . . . . . . . . . . . . . 172,113,066 170,462,252 — —11906 Administrative Expenses
Reimbursement—Federal . . . . . . . 87,970,393 124,211,972 — —11914 Fringe Benefits—Federal . . . . . . . . . 28,328,143 28,328,143 28,328,143 29,180,78911919 Medicaid—Health and Medical
Care—Federal Grants . . . . . . . . . . 95,001,000 67,544,750 47,136,824 72,205,69711957 Temporary Assistance for Needy
Families—Public Assistance—(TANF) . . . . . . . . . . . . . . . . . . . . . . 546,636,299 410,020,938 379,417,467 517,208,627
11958 TANF—Emergency Assistance for Families . . . . . . . . . . . . . . . . . . 25,313,280 17,307,280 18,167,394 16,174,978
11966 Child Care and Development Block Grant—Federal . . . . . . . . . . . . . . . 79,475,985 101,500,985 8,205,660 24,978,199
144
Comptroller’s Report for Fiscal 2002 Part II-E—General Fund—Schedule G3 (Cont.)
Revenues vs. Budget by Agency
Budget Actual RevenueRevenue Source _________________________________________________________________________ _________________________________________________________________________Within Agency Adopted Modified 2002 2001__________________________ _________________________________ _________________________________ _________________________________ _________________________________
(Continued)

069 DEPARTMENT OF SOCIAL SERVICES (cont.)11967 Title XX Social Services Block
Grant . . . . . . . . . . . . . . . . . . . . . . $ 39,574,839 $ 43,552,423 $ 44,170,533 $ 337,95211968 TANF—100 Percent Federal . . . . . . . 42,680,000 70,984,108 32,107,821 14,294,47311969 Food Stamps Employment and
Training . . . . . . . . . . . . . . . . . . . . . 28,964,567 28,265,773 45,704,768 24,057,63511971 Food Stamps—Federal . . . . . . . . . . . — — 17,292,050 16,970,33511972 Administration . . . . . . . . . . . . . . . . . . 102,000 5,448,783 — —11973 Welfare to Work . . . . . . . . . . . . . . . . . 24,617,914 42,478,185 23,508,557 26,082,41511974 Medicaid Long Term Care—
Federal . . . . . . . . . . . . . . . . . . . . . . 17,194,000 17,194,000 — —11975 Resettled Refugees . . . . . . . . . . . . . . — — 887,999 1,142,19911979 Emergency Income Maintenance
Administration . . . . . . . . . . . . . . . . — — 67,413,047 87,844,94111980 Medical Assistance Program—
Medicaid—Federal . . . . . . . . . . . . 3,269,107 4,669,107 172,338,008 154,018,58511981 Child Support Administration . . . . . . — — 117,910 —11983 Administrative Training . . . . . . . . . . . — — 5,806,862 5,648,09911985 Title IV-F Jobs Administration—
Federal . . . . . . . . . . . . . . . . . . . . . . — 4,484,000 50,802,183 61,884,08011986 Food Stamps—Federal . . . . . . . . . . . — — 73,525,547 61,585,61411987 Special Projects . . . . . . . . . . . . . . . . . — — 12,024,770 10,858,68111988 Safety Net . . . . . . . . . . . . . . . . . . . . . — — 266,608 304,65416149 Workforce Investment Act
(W.I.A.) Adult . . . . . . . . . . . . . . . . 39,552,163 64,577,163 59,859,496 19,144,39416154 W.I.A. Central Administration . . . . . . 2,616,000 2,616,000 4,856,114 1,637,77323900 Medical Assistance Reimbursement . . 68,909,000 141,807,168 128,667,748 140,431,24925911 Personal Services Reimbursement—
State . . . . . . . . . . . . . . . . . . . . . . 120,268,133 119,096,110 — —25912 Administrative Expenses
Reimbursement—State . . . . . . . . . 54,481,515 59,262,062 — 18,635,47125913 Fringe Benefits—State . . . . . . . . . . . 23,585,503 23,585,503 23,585,503 24,180,76926014 Medicaid Managed Care . . . . . . . . . . 1,323,594 1,323,594 1,514,248 1,058,67826064 Child Care and Development Block
Grant—State . . . . . . . . . . . . . . . . . 28,540,000 6,515,000 95,745,924 69,748,18026065 Protective Services . . . . . . . . . . . . . . 1,542,581 1,542,581 684,054 585,49426069 TANF—Public Assistance—State . . . 255,986,997 207,754,105 189,122,135 214,334,80326070 TANF—Emergency Assistance
for Families . . . . . . . . . . . . . . . . . . 12,963,642 12,010,642 8,452,253 7,374,05626071 Safety—Net . . . . . . . . . . . . . . . . . . . . 224,056,386 228,839,046 248,769,072 214,981,48226072 Work Now . . . . . . . . . . . . . . . . . . . . . — 58,975,000 39,648,859 —26073 Food Stamps—State . . . . . . . . . . . . . 148,000 148,000 17,833,046 15,381,41926074 Food Stamp Employment and
Training . . . . . . . . . . . . . . . . . . . . . 10,952,310 10,952,310 13,988,592 7,896,45426075 TANF—100% State . . . . . . . . . . . . . . 400,000 400,000 — —26076 Administration . . . . . . . . . . . . . . . . . . 52,000 2,297,781 — —26078 Medicaid Long Term Care—Adults . . 13,904,000 13,904,000 4,859,730 5,175,20026079 Emergency Assistance for Adults . . . — — 2,622,855 1,965,95526080 Disability . . . . . . . . . . . . . . . . . . . . . . 2,090,000 2,090,000 — —26081 Welfare to Work . . . . . . . . . . . . . . . . . 6,191,728 10,657,728 5,709,060 5,881,703
145
Comptroller’s Report for Fiscal 2002 Part II-E—General Fund—Schedule G3 (Cont.)
Revenues vs. Budget by Agency
Budget Actual RevenueRevenue Source _________________________________________________________________________ _________________________________________________________________________Within Agency Adopted Modified 2002 2001__________________________ _________________________________ _________________________________ _________________________________ _________________________________
(Continued)

069 DEPARTMENT OF SOCIAL SERVICES (cont.)26085 Administrative Training . . . . . . . . . . . $ — $ — $ 3,408,222 $ 2,080,26626086 Emergency Income Maintenance
Administration . . . . . . . . . . . . . . . . — — 54,159,456 85,662,70326087 Medical Assistance Program—
Medicaid—State . . . . . . . . . . . . . . — — 53,549,315 39,369,76026091 Title IV-F—Jobs Administration—
State . . . . . . . . . . . . . . . . . . . . . . . . — 2,242,000 19,327,518 29,736,81426092 Food Stamps—State . . . . . . . . . . . . . — — 66,670,656 90,651,39026093 Division of Post Institutional
Services . . . . . . . . . . . . . . . . . . . . . — — 1,738,241 127,21126094 Mental Hygiene Administration . . . . — — 6,563,619 —26095 Special Projects . . . . . . . . . . . . . . . . . — — 6,733,939 7,077,50026096 Federal Non-Participating
Employment Program . . . . . . . . . . — — 213,552 3,242,35726097 Guide Dogs . . . . . . . . . . . . . . . . . . . . — — 25,929 22,26026098 Adult Care . . . . . . . . . . . . . . . . . . . . . — — 3,723,625 1,504,72430906 Local Government Records
Management Improvement Program . . . . . . . . . . . . . . . . . . . . . — 5,000 — —
31921 Ryan White Title I Care Act . . . . . . . — 4,005,100 5,704,644 2,798,08944008 Disaster Related TFA Debt Issuance . . — 119,970,542 96,586,416 —__________________________ __________________________ __________________________ __________________________
2,105,665,001 2,317,663,203 2,279,748,266 2,233,006,249Net Change in Estimate of
Prior Receivables . . . . . . . . . . . . . . — — (37,748,420) (77,521,361)__________________________ __________________________ __________________________ __________________________Total Department of
Social Services . . . . . . . . . . 2,105,665,001 2,317,663,203 2,241,999,846 2,155,484,888__________________________ __________________________ __________________________ __________________________071 DEPARTMENT OF HOMELESS SERVICES
00859 Sundries . . . . . . . . . . . . . . . . . . . . . . — — 526,674 200,09600923 Emergency Shelter . . . . . . . . . . . . . . — 5,623,549 5,474,285 6,147,61603263 Public Assistance—WTC/FEMA . . . — 591,674 379,164 —11905 Personal Services Reimbursement—
Federal . . . . . . . . . . . . . . . . . . . . . . 20,584,604 20,584,604 15,498,405 15,586,00711906 Administrative Expenses
Reimbursement—Federal . . . . . . . 10,704,591 16,413,368 18,802,481 16,762,91511914 Fringe Benefits—Federal . . . . . . . . . 2,562,642 2,562,642 2,562,642 2,483,09811944 Homeless Families—Federal . . . . . . 77,706,440 72,044,777 70,178,966 60,646,57511950 Shelter Contracts—Federal . . . . . . . . 156,144 156,144 — —11967 Title XX Social Services
Block Grant . . . . . . . . . . . . . . . . . . — 6,000 — —25911 Personal Services Reimbursement—
State . . . . . . . . . . . . . . . . . . . . . . 27,643,068 27,643,068 25,905,287 26,729,47425912 Administrative Expenses
Reimbursement—State . . . . . . . . . 23,855,721 19,430,980 29,375,170 26,608,75125913 Fringe Benefits—State . . . . . . . . . . . 5,221,299 5,221,299 5,221,299 5,305,02926005 Homeless Families—State . . . . . . . . 45,973,265 40,897,219 48,928,330 39,076,62926009 Shelter Contracts—State . . . . . . . . . . 60,105,125 60,407,974 54,223,133 62,006,310__________________________ __________________________ __________________________ __________________________
274,512,899 271,583,298 277,075,836 261,552,500
146
Comptroller’s Report for Fiscal 2002 Part II-E—General Fund—Schedule G3 (Cont.)
Revenues vs. Budget by Agency
Budget Actual RevenueRevenue Source _________________________________________________________________________ _________________________________________________________________________Within Agency Adopted Modified 2002 2001__________________________ _________________________________ _________________________________ _________________________________ _________________________________
(Continued)
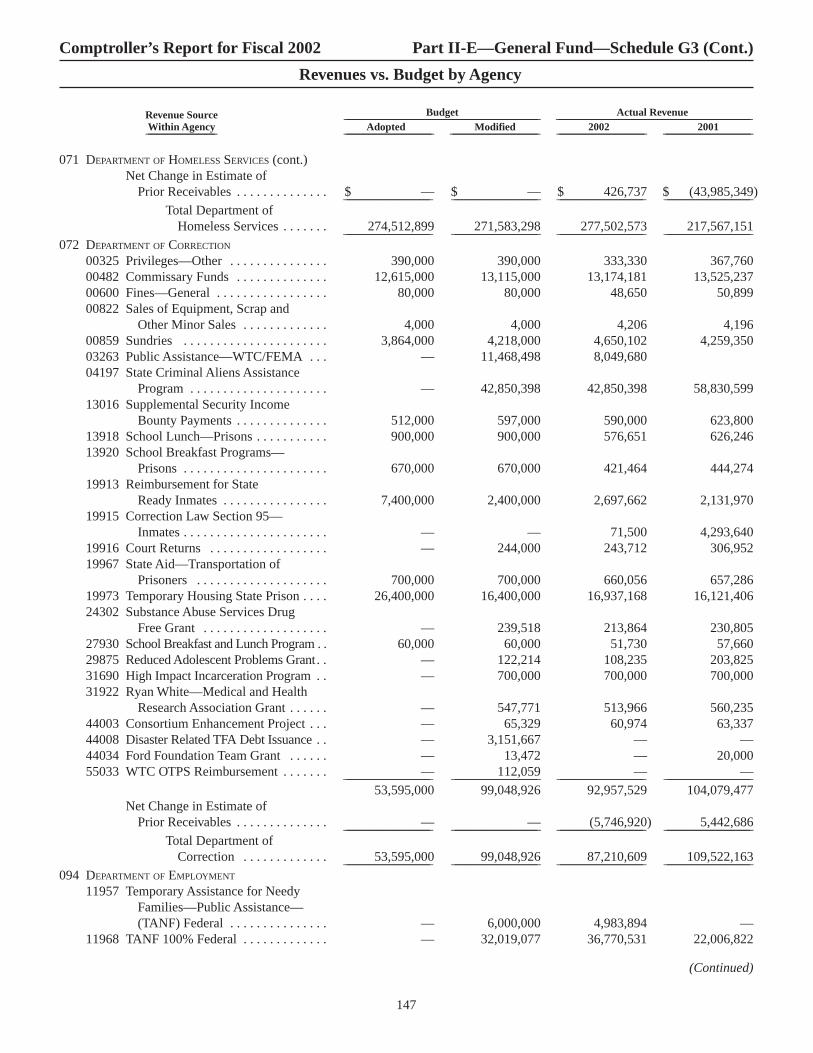
071 DEPARTMENT OF HOMELESS SERVICES (cont.)Net Change in Estimate of
Prior Receivables . . . . . . . . . . . . . . $ — $ — $ 426,737 $ (43,985,349)__________________________ __________________________ __________________________ __________________________Total Department of
Homeless Services . . . . . . . 274,512,899 271,583,298 277,502,573 217,567,151__________________________ __________________________ __________________________ __________________________072 DEPARTMENT OF CORRECTION
00325 Privileges—Other . . . . . . . . . . . . . . . 390,000 390,000 333,330 367,76000482 Commissary Funds . . . . . . . . . . . . . . 12,615,000 13,115,000 13,174,181 13,525,23700600 Fines—General . . . . . . . . . . . . . . . . . 80,000 80,000 48,650 50,89900822 Sales of Equipment, Scrap and
Other Minor Sales . . . . . . . . . . . . . 4,000 4,000 4,206 4,19600859 Sundries . . . . . . . . . . . . . . . . . . . . . . 3,864,000 4,218,000 4,650,102 4,259,35003263 Public Assistance—WTC/FEMA . . . — 11,468,498 8,049,68004197 State Criminal Aliens Assistance
Program . . . . . . . . . . . . . . . . . . . . . — 42,850,398 42,850,398 58,830,59913016 Supplemental Security Income
Bounty Payments . . . . . . . . . . . . . . 512,000 597,000 590,000 623,80013918 School Lunch—Prisons . . . . . . . . . . . 900,000 900,000 576,651 626,24613920 School Breakfast Programs—
Prisons . . . . . . . . . . . . . . . . . . . . . . 670,000 670,000 421,464 444,27419913 Reimbursement for State
Ready Inmates . . . . . . . . . . . . . . . . 7,400,000 2,400,000 2,697,662 2,131,97019915 Correction Law Section 95—
Inmates . . . . . . . . . . . . . . . . . . . . . . — — 71,500 4,293,64019916 Court Returns . . . . . . . . . . . . . . . . . . — 244,000 243,712 306,95219967 State Aid—Transportation of
Prisoners . . . . . . . . . . . . . . . . . . . . 700,000 700,000 660,056 657,28619973 Temporary Housing State Prison . . . . 26,400,000 16,400,000 16,937,168 16,121,40624302 Substance Abuse Services Drug
Free Grant . . . . . . . . . . . . . . . . . . . — 239,518 213,864 230,80527930 School Breakfast and Lunch Program . . 60,000 60,000 51,730 57,66029875 Reduced Adolescent Problems Grant . . — 122,214 108,235 203,82531690 High Impact Incarceration Program . . — 700,000 700,000 700,00031922 Ryan White—Medical and Health
Research Association Grant . . . . . . — 547,771 513,966 560,23544003 Consortium Enhancement Project . . . — 65,329 60,974 63,33744008 Disaster Related TFA Debt Issuance . . — 3,151,667 — —44034 Ford Foundation Team Grant . . . . . . — 13,472 — 20,00055033 WTC OTPS Reimbursement . . . . . . . — 112,059 — —__________________________ __________________________ __________________________ __________________________
53,595,000 99,048,926 92,957,529 104,079,477Net Change in Estimate of
Prior Receivables . . . . . . . . . . . . . . — — (5,746,920) 5,442,686__________________________ __________________________ __________________________ __________________________Total Department of
Correction . . . . . . . . . . . . . 53,595,000 99,048,926 87,210,609 109,522,163__________________________ __________________________ __________________________ __________________________094 DEPARTMENT OF EMPLOYMENT
11957 Temporary Assistance for NeedyFamilies—Public Assistance—(TANF) Federal . . . . . . . . . . . . . . . — 6,000,000 4,983,894 —
11968 TANF 100% Federal . . . . . . . . . . . . . — 32,019,077 36,770,531 22,006,822
147
Comptroller’s Report for Fiscal 2002 Part II-E—General Fund—Schedule G3 (Cont.)
Revenues vs. Budget by Agency
Budget Actual RevenueRevenue Source _________________________________________________________________________ _________________________________________________________________________Within Agency Adopted Modified 2002 2001__________________________ _________________________________ _________________________________ _________________________________ _________________________________
(Continued)
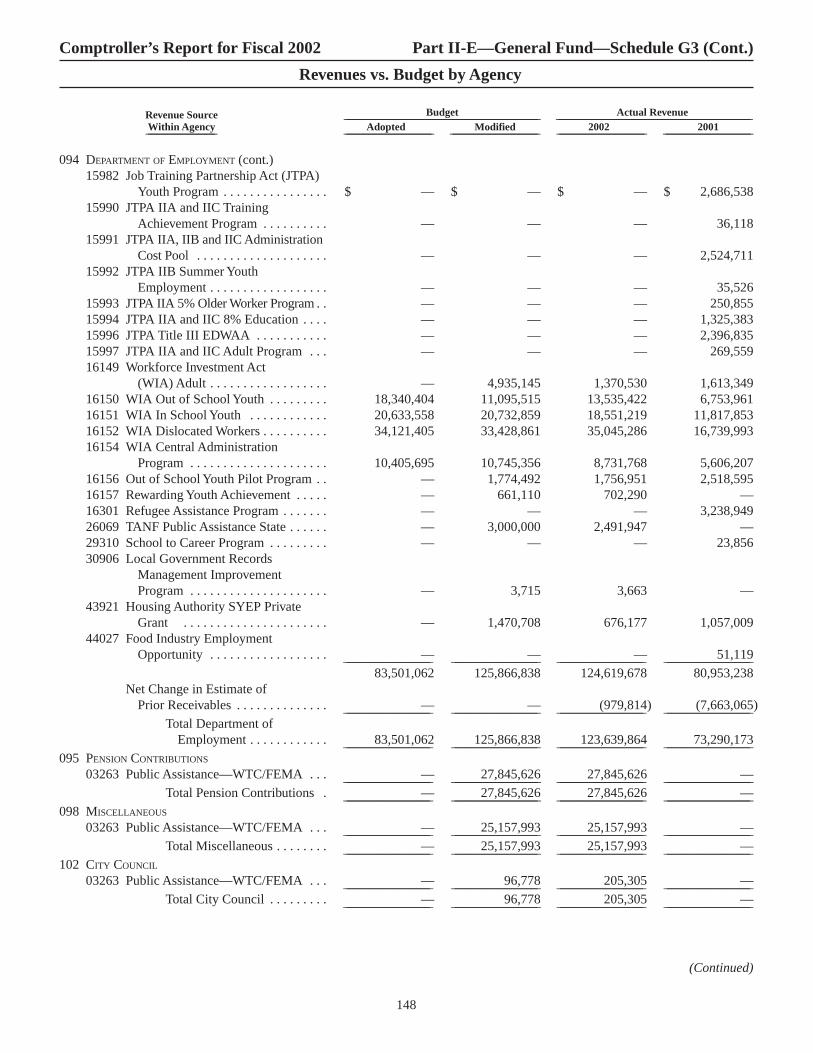
094 DEPARTMENT OF EMPLOYMENT (cont.)15982 Job Training Partnership Act (JTPA)
Youth Program . . . . . . . . . . . . . . . . $ — $ — $ — $ 2,686,53815990 JTPA IIA and IIC Training
Achievement Program . . . . . . . . . . — — — 36,11815991 JTPA IIA, IIB and IIC Administration
Cost Pool . . . . . . . . . . . . . . . . . . . . — — — 2,524,71115992 JTPA IIB Summer Youth
Employment . . . . . . . . . . . . . . . . . . — — — 35,52615993 JTPA IIA 5% Older Worker Program . . — — — 250,85515994 JTPA IIA and IIC 8% Education . . . . — — — 1,325,38315996 JTPA Title III EDWAA . . . . . . . . . . . — — — 2,396,83515997 JTPA IIA and IIC Adult Program . . . — — — 269,55916149 Workforce Investment Act
(WIA) Adult . . . . . . . . . . . . . . . . . . — 4,935,145 1,370,530 1,613,34916150 WIA Out of School Youth . . . . . . . . . 18,340,404 11,095,515 13,535,422 6,753,96116151 WIA In School Youth . . . . . . . . . . . . 20,633,558 20,732,859 18,551,219 11,817,85316152 WIA Dislocated Workers . . . . . . . . . . 34,121,405 33,428,861 35,045,286 16,739,99316154 WIA Central Administration
Program . . . . . . . . . . . . . . . . . . . . . 10,405,695 10,745,356 8,731,768 5,606,20716156 Out of School Youth Pilot Program . . — 1,774,492 1,756,951 2,518,59516157 Rewarding Youth Achievement . . . . . — 661,110 702,290 —16301 Refugee Assistance Program . . . . . . . — — — 3,238,94926069 TANF Public Assistance State . . . . . . — 3,000,000 2,491,947 —29310 School to Career Program . . . . . . . . . — — — 23,85630906 Local Government Records
Management Improvement Program . . . . . . . . . . . . . . . . . . . . . — 3,715 3,663 —
43921 Housing Authority SYEP Private Grant . . . . . . . . . . . . . . . . . . . . . . — 1,470,708 676,177 1,057,009
44027 Food Industry Employment Opportunity . . . . . . . . . . . . . . . . . . — — — 51,119__________________________ __________________________ __________________________ __________________________
83,501,062 125,866,838 124,619,678 80,953,238Net Change in Estimate of
Prior Receivables . . . . . . . . . . . . . . — — (979,814) (7,663,065)__________________________ __________________________ __________________________ __________________________Total Department of
Employment . . . . . . . . . . . . 83,501,062 125,866,838 123,639,864 73,290,173__________________________ __________________________ __________________________ __________________________095 PENSION CONTRIBUTIONS
03263 Public Assistance—WTC/FEMA . . . — 27,845,626 27,845,626 —__________________________ __________________________ __________________________ __________________________Total Pension Contributions . — 27,845,626 27,845,626 —__________________________ __________________________ __________________________ __________________________
098 MISCELLANEOUS
03263 Public Assistance—WTC/FEMA . . . — 25,157,993 25,157,993 —__________________________ __________________________ __________________________ __________________________Total Miscellaneous . . . . . . . . — 25,157,993 25,157,993 —__________________________ __________________________ __________________________ __________________________
102 CITY COUNCIL
03263 Public Assistance—WTC/FEMA . . . — 96,778 205,305 —__________________________ __________________________ __________________________ __________________________Total City Council . . . . . . . . . — 96,778 205,305 —__________________________ __________________________ __________________________ __________________________
148
Comptroller’s Report for Fiscal 2002 Part II-E—General Fund—Schedule G3 (Cont.)
Revenues vs. Budget by Agency
Budget Actual RevenueRevenue Source _________________________________________________________________________ _________________________________________________________________________Within Agency Adopted Modified 2002 2001__________________________ _________________________________ _________________________________ _________________________________ _________________________________
(Continued)

103 CITY CLERK
00201 Marriage Licenses . . . . . . . . . . . . . . . $ 1,625,000 $ 1,775,000 $ 1,890,530 $ 2,253,31000476 Administrative Services to
the Public . . . . . . . . . . . . . . . . . . . . 1,325,000 1,525,000 1,660,508 1,851,29730906 Local Government Records
Management Improvement Program . . . . . . . . . . . . . . . . . . . . . — 80,000 77,629 74,652__________________________ __________________________ __________________________ __________________________
Total City Clerk . . . . . . . . . . . 2,950,000 3,380,000 3,628,667 4,179,259__________________________ __________________________ __________________________ __________________________125 DEPARTMENT FOR THE AGING
00859 Sundries . . . . . . . . . . . . . . . . . . . . . . 1,000,000 1,400,000 1,571,461 1,531,31211903 Home Energy Assistance Program . . 100,000 470,000 502,857 599,83811908 Title III—Older Americans Act
Nutrition Program . . . . . . . . . . . . . 16,211,906 19,072,206 11,420,603 22,493,93211909 Title III—Older Americans Act
Area Services . . . . . . . . . . . . . . . . . 9,522,357 14,094,835 8,962,536 9,866,72711910 Foster Grandparents Grant . . . . . . . . 895,676 996,656 927,800 976,68511921 Title V—National Council on
Aging Employment Grant . . . . . . . 2,265,900 2,151,333 2,078,852 2,066,17111922 Title V—Senior Community
Service Employment Grant . . . . . . 2,742,905 2,825,524 2,544,567 2,688,47611930 Title VII—Commodity Food
Programs . . . . . . . . . . . . . . . . . . . . 7,359,406 7,359,406 8,261,838 7,728,90412508 Health Insurance Information
and Assistance . . . . . . . . . . . . . . . . — 148,195 121,317 72,13212509 Title IIIF—Health Promotion
and Disease . . . . . . . . . . . . . . . . . . 362,425 590,208 538,165 433,44112510 Title VII—Elder Abuse Prevention . . — 322,780 99,732 171,08012513 Weatherization Referral and
Packaging . . . . . . . . . . . . . . . . . . . . 570,812 996,386 748,051 937,48712516 Operation Restore Trust . . . . . . . . . . — 82,489 69,489 116,42812517 Title-E Caregiver Support . . . . . . . . . — 2,760,706 79,403 —15600 Older Refugee Project . . . . . . . . . . . . — — 281,225 496,77615602 Aging Title IV Program . . . . . . . . . . . — 887,023 894,178 —19992 Crime Victims Program . . . . . . . . . . . — 417,370 378,239 417,36625922 Foster Grandparents State Grants . . . 28,567 31,531 31,531 31,53125925 Community Services for the Aging . . 5,185,600 6,023,198 6,204,289 5,289,77225926 Supplemental Nutrition
Assistance Program . . . . . . . . . . . . 5,240,018 6,804,382 6,589,100 6,420,39525927 Expanded In-house Services for
the Elderly . . . . . . . . . . . . . . . . . . . 9,154,932 9,436,193 9,470,347 9,044,37925933 Congregate Services Initiative . . . . . . — 393,046 440,228 416,82725934 Elderly Abuse Education . . . . . . . . . . — 50,000 32,275 5,00025935 Long Term Care Ombudsman . . . . . . 245,137 245,137 225,08526060 Integration Services
for Elderly Blind Persons . . . . . . . . 53,000 — — —43937 Foster Grandparents Institutions . . . . — 5,000 5,000 5,00044032 Volunteer Support Project . . . . . . . . . — — — 5,045__________________________ __________________________ __________________________ __________________________
60,693,504 77,563,604 62,498,220 72,039,789
149
Comptroller’s Report for Fiscal 2002 Part II-E—General Fund—Schedule G3 (Cont.)
Revenues vs. Budget by Agency
Budget Actual RevenueRevenue Source _________________________________________________________________________ _________________________________________________________________________Within Agency Adopted Modified 2002 2001__________________________ _________________________________ _________________________________ _________________________________ _________________________________
(Continued)

125 DEPARTMENT FOR THE AGING (cont.)Net Change in Estimate of
Prior Receivables . . . . . . . . . . . . . . $ — $ — $ 402,782 $ (38,277)__________________________ __________________________ __________________________ __________________________Total Department for
the Aging . . . . . . . . . . . . . . 60,693,504 77,563,604 62,901,002 72,001,512__________________________ __________________________ __________________________ __________________________126 DEPARTMENT OF CULTURAL AFFAIRS
23911 Environmental Conservation . . . . . . . — — — 101,799__________________________ __________________________ __________________________ __________________________Net Change in Estimate of
Prior Receivables . . . . . . . . . . . . . . — — 87,000 (168,228)__________________________ __________________________ __________________________ __________________________Total Department of
Cultural Affairs . . . . . . . . . — — 87,000 (66,429)__________________________ __________________________ __________________________ __________________________127 FINANCIAL INFORMATION SERVICES AGENCY
00859 Sundries . . . . . . . . . . . . . . . . . . . . . . 511,000 537,316 589,812 483,66203263 Public Assistance—WTC/FEMA . . . — — 24,468 —44008 Disaster Related TFA Debt Issuance . . — 187,842 — —__________________________ __________________________ __________________________ __________________________
Total Financial InformationServices Agency . . . . . . . . . 511,000 725,158 614,280 483,662__________________________ __________________________ __________________________ __________________________
130 DEPARTMENT OF JUVENILE JUSTICE
03263 Public Assistance—WTC/FEMA . . . — 77,076 83,181 —04216 Post Detention Responsibility . . . . . . — 5,598,718 6,338,172 2,382,83411957 Temporary Assistance for Needy
Families—Federal . . . . . . . . . . . . . 109,413 109,413 665,679 62,62913901 School Lunch . . . . . . . . . . . . . . . . . . . 54,564 54,564 — —13918 School Lunch—Prisons . . . . . . . . . . . 402,518 402,518 102,430 336,80213920 School Breakfast Programs—
Prisons . . . . . . . . . . . . . . . . . . . . . . 231,254 231,254 — 197,06726069 Temporary Assistance for Needy
Families—State . . . . . . . . . . . . . . . 54,706 54,706 147,040 31,31427930 School Breakfast and
Lunch Program . . . . . . . . . . . . . . . 30,588 30,588 3,154 28,35930850 Non-Secure Detention Services . . . . 14,413,034 14,953,812 6,513,453 6,168,03230851 Secure Detention Services . . . . . . . . . 15,810,574 15,551,692 21,655,591 23,739,23630906 Local Government Record
Management Improvement Program . . . . . . . . . . . . . . . . . . . . . — 55,000 55,000 54,942
37920 Public Housing Drug Administration . . — 359,364 460,420 —__________________________ __________________________ __________________________ __________________________31,106,651 37,478,705 36,024,120 33,001,215
Net Change in Estimate of Prior Receivables . . . . . . . . . . . . . . — — (2,044,553) 6,635,933__________________________ __________________________ __________________________ __________________________
Total Department ofJuvenile Justice . . . . . . . . . 31,106,651 37,478,705 33,979,567 39,637,148__________________________ __________________________ __________________________ __________________________
131 OFFICE OF PAYROLL ADMINISTRATION
00470 Other Services and Fees . . . . . . . . . . 452,000 477,057 529,853 443,94500476 Administrative Services to
the Public . . . . . . . . . . . . . . . . . . . . 485,000 485,000 526,921 512,15700859 Sundries . . . . . . . . . . . . . . . . . . . . . . 434,000 1,072,925 1,069,852 413,022__________________________ __________________________ __________________________ __________________________
1,371,000 2,034,982 2,126,626 1,369,124
150
Comptroller’s Report for Fiscal 2002 Part II-E—General Fund—Schedule G3 (Cont.)
Revenues vs. Budget by Agency
Budget Actual RevenueRevenue Source _________________________________________________________________________ _________________________________________________________________________Within Agency Adopted Modified 2002 2001__________________________ _________________________________ _________________________________ _________________________________ _________________________________
(Continued)

131 OFFICE OF PAYROLL ADMINISTRATION (cont.)Net Change in Estimate of
Prior Receivables . . . . . . . . . . . . . . $ — $ — $ — $ 355,429__________________________ __________________________ __________________________ __________________________Total Office of Payroll
Administration . . . . . . . . . . 1,371,000 2,034,982 2,126,626 1,724,553__________________________ __________________________ __________________________ __________________________136 LANDMARKS PRESERVATION COMMISSION
00859 Sundries . . . . . . . . . . . . . . . . . . . . . . 9,000 9,000 5,807 4,22230474 Photo Document—Public Education . . — — — 2,41830906 Local Government Record
Management Improvement Program . . . . . . . . . . . . . . . . . . . . . — 7,829 6,475 —__________________________ __________________________ __________________________ __________________________
Total Landmarks Preservation Commission . . 9,000 16,829 12,282 6,640__________________________ __________________________ __________________________ __________________________
156 NEW YORK CITY TAXI AND LIMOUSINE COMMISSION
00200 Licenses—General . . . . . . . . . . . . . . 30,493,000 27,400,000 28,582,069 27,062,63600470 Other Services and Fees . . . . . . . . . . 2,555,100 2,900,000 2,933,448 3,026,64600476 Administrative Services to
the Public . . . . . . . . . . . . . . . . . . . . — — 1,939 —00600 Fines—General . . . . . . . . . . . . . . . . . 7,441,000 6,941,000 7,322,274 8,687,59203263 Public Assistance—WTC/FEMA . . . — 266,888 336,726 —30906 Local Government Records
Management Improvement Program . . . . . . . . . . . . . . . . . . . . . — 44,250 44,250 1,250__________________________ __________________________ __________________________ __________________________
Total New York City Taxi andLimousine Commission . . . 40,489,100 37,552,138 39,220,706 38,778,124__________________________ __________________________ __________________________ __________________________
226 COMMISSION ON HUMAN RIGHTS
03263 Public Assistance—WTC/FEMA . . . — 7,718 7,718 —15924 Equal Employment Opportunity
Commission Grant . . . . . . . . . . . . . — 151,825 142,325 122,00037918 MHRA Ryan White HIV Prison
Project . . . . . . . . . . . . . . . . . . . . . . — 250,499 232,616 281,256__________________________ __________________________ __________________________ __________________________— 410,042 382,659 403,256
Net Change in Estimate of Prior Receivables . . . . . . . . . . . . . . — — — (45,916)__________________________ __________________________ __________________________ __________________________
Total Commission on Human Rights . . . . . . . . . . — 410,042 382,659 357,340__________________________ __________________________ __________________________ __________________________
260 DEPARTMENT OF YOUTH AND COMMUNITY
DEVELOPMENT
00859 Sundries . . . . . . . . . . . . . . . . . . . . . . — — 2,899 55500923 Emergency Shelter . . . . . . . . . . . . . . — 98,000 98,217 —03263 Public Assistance—WTC/FEMA . . . — 2,465 2,465 —11903 Home Energy Assistance Program . . 299,579 299,579 — 638,36111957 Temporary Assistance for Needy
Families (TANF) . . . . . . . . . . . . . . 2,000,000 2,000,000 — —14700 Adult Literacy Program . . . . . . . . . . . 516,892 516,892 516,892 657,99215905 Community Services Block Grants . . 28,806,899 35,328,163 32,906,338 25,345,62126019 Integrated County Education
Planning . . . . . . . . . . . . . . . . . . . . . — 394,827 338,065 36,843
151
Comptroller’s Report for Fiscal 2002 Part II-E—General Fund—Schedule G3 (Cont.)
Revenues vs. Budget by Agency
Budget Actual RevenueRevenue Source _________________________________________________________________________ _________________________________________________________________________Within Agency Adopted Modified 2002 2001__________________________ _________________________________ _________________________________ _________________________________ _________________________________
(Continued)

260 DEPARTMENT OF YOUTH AND COMMUNITY
DEVELOPMENT (cont.)26069 TANF Public Assistance—State . . . . $ 1,000,000 $ 1,000,000 $ — $ —29903 State Aid For Youth Services . . . . . . . 11,147,852 11,691,127 12,466,867 11,304,04829976 Runaway and Homeless Youth . . . . . 660,069 660,069 404,769 705,69230855 Housing for Runaways . . . . . . . . . . . 1,179,172 1,179,172 1,042,197 809,96930861 Youth Safety for Learning
Environment . . . . . . . . . . . . . . . . . . — 80,000 80,000 —30906 Local Governments Records
Management Improvement Program . . . . . . . . . . . . . . . . . . . . . — 37,995 29,969 —
44008 Disaster Related TFA Debt Issuance . . — 8,885 — —44030 Family Development Association . . . — 435 310 500__________________________ __________________________ __________________________ __________________________
45,610,463 53,297,609 47,888,988 39,499,581Net Change in Estimate of
Prior Receivables . . . . . . . . . . . . . . (1,726,218) (3,788,812)__________________________ __________________________ __________________________ __________________________Total Department of Youth
and Community Development . . . . . . . . . . . 45,610,463 53,297,609 46,162,770 35,710,769__________________________ __________________________ __________________________ __________________________
312 CONFLICTS OF INTEREST BOARD
00470 Other Services and Fees . . . . . . . . . . 20,000 45,000 42,362 146,650__________________________ __________________________ __________________________ __________________________Total Conflicts of
Interest Board . . . . . . . . . . . 20,000 45,000 42,362 146,650__________________________ __________________________ __________________________ __________________________313 OFFICE OF COLLECTIVE BARGAINING
03263 Public Assistance—WTC/FEMA . . . — 1,210 1,210 —31902 Municipal Labor Committee—
Reimbursement . . . . . . . . . . . . . . . 117,080 135,080 151,008 126,251__________________________ __________________________ __________________________ __________________________Total Office of Collective
Bargaining . . . . . . . . . . . . . 117,080 136,290 152,218 126,251__________________________ __________________________ __________________________ __________________________341 MANHATTAN COMMUNITY BOARD #1
43900 Private Grants . . . . . . . . . . . . . . . . . . — 1,041 — 9,464__________________________ __________________________ __________________________ __________________________Total Manhattan Community
Board # 1 . . . . . . . . . . . . . . — 1,041 — 9,464__________________________ __________________________ __________________________ __________________________347 MANHATTAN COMMUNITY BOARD #7
05974 Miller Highway—Federal . . . . . . . . . — 4,725 —__________________________ __________________________ __________________________ __________________________Net Change in Estimate of
Prior Receivables . . . . . . . . . . . . . . — — — 25,000__________________________ __________________________ __________________________ __________________________Total Manhattan Community
Board # 7 . . . . . . . . . . . . . . — 4,725 — 25,000__________________________ __________________________ __________________________ __________________________431 QUEENS COMMUNITY BOARD #1
43900 Private Grants . . . . . . . . . . . . . . . . . . — 2,475 — 3,971__________________________ __________________________ __________________________ __________________________Total Queens Community
Board # 1 . . . . . . . . . . . . . . — 2,475 — 3,971__________________________ __________________________ __________________________ __________________________436 QUEENS COMMUNITY BOARD #6
30958 Hevesi Initiative . . . . . . . . . . . . . . . . . — — — 986__________________________ __________________________ __________________________ __________________________Total Queens Community
Board # 6 . . . . . . . . . . . . . . — — — 986__________________________ __________________________ __________________________ __________________________
152
Comptroller’s Report for Fiscal 2002 Part II-E—General Fund—Schedule G3 (Cont.)
Revenues vs. Budget by Agency
Budget Actual RevenueRevenue Source _________________________________________________________________________ _________________________________________________________________________Within Agency Adopted Modified 2002 2001__________________________ _________________________________ _________________________________ _________________________________ _________________________________
(Continued)
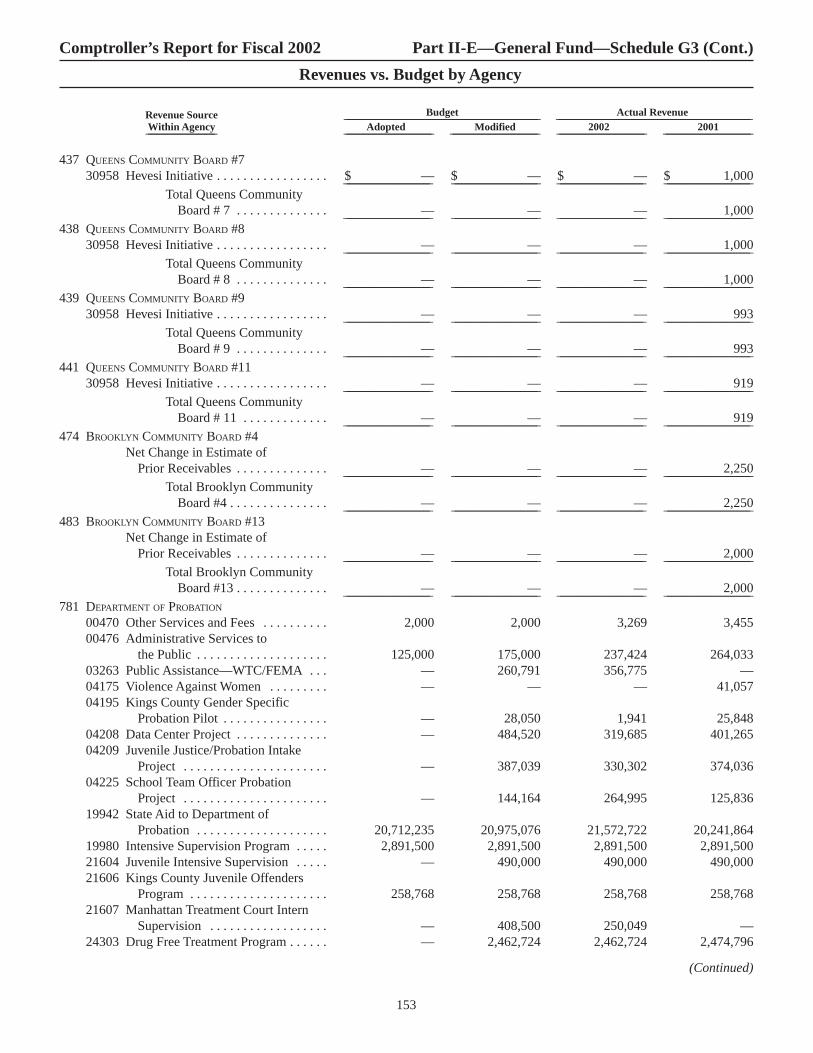
437 QUEENS COMMUNITY BOARD #730958 Hevesi Initiative . . . . . . . . . . . . . . . . . $ — $ — $ — $ 1,000__________________________ __________________________ __________________________ __________________________
Total Queens CommunityBoard # 7 . . . . . . . . . . . . . . — — — 1,000__________________________ __________________________ __________________________ __________________________
438 QUEENS COMMUNITY BOARD #830958 Hevesi Initiative . . . . . . . . . . . . . . . . . — — — 1,000__________________________ __________________________ __________________________ __________________________
Total Queens CommunityBoard # 8 . . . . . . . . . . . . . . — — — 1,000__________________________ __________________________ __________________________ __________________________
439 QUEENS COMMUNITY BOARD #930958 Hevesi Initiative . . . . . . . . . . . . . . . . . — — — 993__________________________ __________________________ __________________________ __________________________
Total Queens CommunityBoard # 9 . . . . . . . . . . . . . . — — — 993__________________________ __________________________ __________________________ __________________________
441 QUEENS COMMUNITY BOARD #1130958 Hevesi Initiative . . . . . . . . . . . . . . . . . — — — 919__________________________ __________________________ __________________________ __________________________
Total Queens CommunityBoard # 11 . . . . . . . . . . . . . — — — 919__________________________ __________________________ __________________________ __________________________
474 BROOKLYN COMMUNITY BOARD #4Net Change in Estimate of
Prior Receivables . . . . . . . . . . . . . . — — — 2,250__________________________ __________________________ __________________________ __________________________Total Brooklyn Community
Board #4 . . . . . . . . . . . . . . . — — — 2,250__________________________ __________________________ __________________________ __________________________483 BROOKLYN COMMUNITY BOARD #13
Net Change in Estimate of Prior Receivables . . . . . . . . . . . . . . — — — 2,000__________________________ __________________________ __________________________ __________________________
Total Brooklyn CommunityBoard #13 . . . . . . . . . . . . . . — — — 2,000__________________________ __________________________ __________________________ __________________________
781 DEPARTMENT OF PROBATION
00470 Other Services and Fees . . . . . . . . . . 2,000 2,000 3,269 3,45500476 Administrative Services to
the Public . . . . . . . . . . . . . . . . . . . . 125,000 175,000 237,424 264,03303263 Public Assistance—WTC/FEMA . . . — 260,791 356,775 —04175 Violence Against Women . . . . . . . . . — — — 41,05704195 Kings County Gender Specific
Probation Pilot . . . . . . . . . . . . . . . . — 28,050 1,941 25,84804208 Data Center Project . . . . . . . . . . . . . . — 484,520 319,685 401,26504209 Juvenile Justice/Probation Intake
Project . . . . . . . . . . . . . . . . . . . . . . — 387,039 330,302 374,03604225 School Team Officer Probation
Project . . . . . . . . . . . . . . . . . . . . . . — 144,164 264,995 125,83619942 State Aid to Department of
Probation . . . . . . . . . . . . . . . . . . . . 20,712,235 20,975,076 21,572,722 20,241,86419980 Intensive Supervision Program . . . . . 2,891,500 2,891,500 2,891,500 2,891,50021604 Juvenile Intensive Supervision . . . . . — 490,000 490,000 490,00021606 Kings County Juvenile Offenders
Program . . . . . . . . . . . . . . . . . . . . . 258,768 258,768 258,768 258,76821607 Manhattan Treatment Court Intern
Supervision . . . . . . . . . . . . . . . . . . — 408,500 250,049 —24303 Drug Free Treatment Program . . . . . . — 2,462,724 2,462,724 2,474,796
153
Comptroller’s Report for Fiscal 2002 Part II-E—General Fund—Schedule G3 (Cont.)
Revenues vs. Budget by Agency
Budget Actual RevenueRevenue Source _________________________________________________________________________ _________________________________________________________________________Within Agency Adopted Modified 2002 2001__________________________ _________________________________ _________________________________ _________________________________ _________________________________
(Continued)

781 DEPARTMENT OF PROBATION (cont.)30857 New Hope Project . . . . . . . . . . . . . . . $ — $ 250,000 $ 250,000 $ 258,94530858 New York City Post Residential
Supervision Project . . . . . . . . . . . . — 815,802 248,126 526,85230906 Local Government Records
Management Improvement Program . . . . . . . . . . . . . . . . . . . . . — — — 71,650__________________________ __________________________ __________________________ __________________________
23,989,503 30,033,934 29,938,280 28,449,905Net Change in Estimate of
Prior Receivables . . . . . . . . . . . . . . — — 353,269 (10,959)__________________________ __________________________ __________________________ __________________________Total Department of
Probation . . . . . . . . . . . . . . 23,989,503 30,033,934 30,291,549 28,438,946__________________________ __________________________ __________________________ __________________________801 DEPARTMENT OF BUSINESS SERVICES
00250 Permits—General . . . . . . . . . . . . . . . 440,000 440,000 651,865 472,53100325 Privileges—Other . . . . . . . . . . . . . . . 2,368,000 980,000 1,440,360 1,006,69000470 Other Services and Fees . . . . . . . . . . — — 126,074 56,69100476 Administrative Services to
the Public . . . . . . . . . . . . . . . . . . . . 31,000 31,000 27,000 42,31100753 Rentals—Dock, Ship, Wharfage . . . . 5,000,000 5,000,000 3,039,500 5,000,00000754 Rentals—Market . . . . . . . . . . . . . . . . 7,036,000 7,036,000 5,277,000 7,036,00000760 Rentals—Other . . . . . . . . . . . . . . . . . 3,372,000 3,372,000 2,452,000 3,372,00000859 Sundries . . . . . . . . . . . . . . . . . . . . . . 29,361,000 79,257,000 76,430,162 67,588,93303100 Department of Defense Grant . . . . . . — 152,953 242,180 —03263 Public Assistance—WTC/FEMA . . . — 14,961,299 827,704 —43900 Private Grant . . . . . . . . . . . . . . . . . . . — — 6,250 —43954 Business Relocation Assistance
Corporation Security Program . . . . — 105,570 104,397 —44008 Disaster Related TFA Debt Issuance . . — 14,113,654 — —__________________________ __________________________ __________________________ __________________________
47,608,000 125,449,476 90,624,492 84,575,156Net Change in Estimate of
Prior Receivables . . . . . . . . . . . . . . 163,499 (11,738)__________________________ __________________________ __________________________ __________________________Total Department of
Business Services . . . . . . . . 47,608,000 125,449,476 90,787,991 84,563,418__________________________ __________________________ __________________________ __________________________806 DEPARTMENT OF HOUSING PRESERVATION AND
DEVELOPMENT
00325 Privileges—Other . . . . . . . . . . . . . . . 34,000 90,000 95,125 110,15800470 Other Services and Fees . . . . . . . . . . 5,924,500 17,435,698 18,447,578 10,007,55100551 Administrative Charges . . . . . . . . . . . 695,000 695,000 716,161 596,46600552 Multiple Family Loans . . . . . . . . . . . — — 26,798 (10)00554 Principal on Article 8 Loans . . . . . . . — — 27,030 (1)00555 Interest Income—Mitchell Lama . . . — — 325,587 28,52000556 Principal Payments—
Mitchell Lama . . . . . . . . . . . . . . . . — — 1,812 —00557 Article 8A Loan Program . . . . . . . . . — — 10,871,349 10,303,63300558 Multi-Family Participation
Loan Program . . . . . . . . . . . . . . . . — — 10,667,219 13,234,55500560 Urban Development Action
Grant/Partnership—(UDAG) . . . . . — — 1,378,807 660,27100561 Nehemiah New Homes . . . . . . . . . . . — — 690,753 565,000
154
Comptroller’s Report for Fiscal 2002 Part II-E—General Fund—Schedule G3 (Cont.)
Revenues vs. Budget by Agency
Budget Actual RevenueRevenue Source _________________________________________________________________________ _________________________________________________________________________Within Agency Adopted Modified 2002 2001__________________________ _________________________________ _________________________________ _________________________________ _________________________________
(Continued)

806 DEPARTMENT OF HOUSING PRESERVATION AND
DEVELOPMENT (cont.)00564 Other Debt Service Reimbursement . . $ — $ — $ 421,894 $ 518,87400600 Fines—General . . . . . . . . . . . . . . . . . 400,000 400,000 483,274 504,21300760 Rentals—Other . . . . . . . . . . . . . . . . . 15,880,000 14,855,000 13,868,427 21,954,21600815 Sales of In Rem Property . . . . . . . . . 79,750,000 55,350,000 37,867,992 20,212,31800859 Sundries . . . . . . . . . . . . . . . . . . . . . . 515,000 2,360,000 3,185,824 2,893,94200923 Emergency Shelter . . . . . . . . . . . . . . — 769,814 766,341 745,48901203 Section 17 Rental Rehabilitation . . . . — — 6,276 —01207 Home Investment Partnership . . . . . . 9,356,972 10,269,681 9,125,855 8,688,69601208 Hope Implementation . . . . . . . . . . . . — 1,680,150 1,680,150 1,166,59601214 Lead Based Paint Abatement . . . . . . . — 252,219 252,218 85,51701223 Home Zone . . . . . . . . . . . . . . . . . . . . — — — 1,456,50001226 Economic Development Initiative . . . — 1,887,419 1,887,419 —01232 Fair Housing Innitiatives Program . . — 11,545 6,294 —03263 Public Assistance—WTC/FEMA . . . — 560,209 268,632 —11918 Emergency Relocation Welfare
Tenants—Federal . . . . . . . . . . . . . . 979,523 952,541 1,034,312 917,26025916 Emergency Relocation Welfare
Tenants—State . . . . . . . . . . . . . . . . 877,001 865,204 793,048 818,88430906 Local Government Records
Management Improvement Program . . . . . . . . . . . . . . . . . . . . . — 67,402 65,524 —
44028 W33rd St. Hotel Parcel Grant . . . . . . — 1,417,043 1,370,285 —50000 Section 8—Rent Subsidy . . . . . . . . . 140,988,339 159,015,689 157,784,570 136,253,089__________________________ __________________________ __________________________ __________________________
255,400,335 268,934,614 274,116,554 231,721,737Net Change in Estimate of
Prior Receivables . . . . . . . . . . . . . . (1,702,035) (1,736,673)__________________________ __________________________ __________________________ __________________________Total Department of Housing
Preservation andDevelopment . . . . . . . . . . . 255,400,335 268,934,614 272,414,519 229,985,064__________________________ __________________________ __________________________ __________________________
810 DEPARTMENT OF BUILDINGS
00200 Licenses—General . . . . . . . . . . . . . . 855,000 965,000 1,149,833 967,99000250 Permits—General . . . . . . . . . . . . . . . 3,030,000 6,386,000 7,437,332 6,475,45100251 Construction Permits . . . . . . . . . . . . . 41,027,000 44,000,000 47,062,866 50,864,51500470 Other Services and Fees . . . . . . . . . . 9,870,750 16,083,750 16,700,114 16,326,82400476 Administrative Services to
the Public . . . . . . . . . . . . . . . . . . . . — 3,030,000 3,107,477 3,102,63900600 Fines—General . . . . . . . . . . . . . . . . . 3,285,000 7,000,000 7,748,305 7,264,28603263 Public Assistance—WTC/FEMA . . . — 264,752 126,948 —__________________________ __________________________ __________________________ __________________________
58,067,750 77,729,502 83,332,875 85,001,705Net Change in Estimate of
Prior Receivables . . . . . . . . . . . . . . 16,223 —__________________________ __________________________ __________________________ __________________________Total Department of
Buildings . . . . . . . . . . . . . . 58,067,750 77,729,502 83,349,098 85,001,705__________________________ __________________________ __________________________ __________________________816 DEPARTMENT OF HEALTH
00200 Licenses—General . . . . . . . . . . . . . . 800,000 800,000 825,167 824,07500250 Permits—General . . . . . . . . . . . . . . . 6,500,000 7,000,000 7,796,543 7,020,77500430 Health Services and Fees . . . . . . . . . . 12,412,500 12,150,000 12,921,692 12,966,987
155
Comptroller’s Report for Fiscal 2002 Part II-E—General Fund—Schedule G3 (Cont.)
Revenues vs. Budget by Agency
Budget Actual RevenueRevenue Source _________________________________________________________________________ _________________________________________________________________________Within Agency Adopted Modified 2002 2001__________________________ _________________________________ _________________________________ _________________________________ _________________________________
(Continued)

816 DEPARTMENT OF HEALTH (cont.)00476 Administrative Services to
the Public . . . . . . . . . . . . . . . . . . . . $ 3,000,000 $ 4,500,000 $ 4,402,657 $ 4,520,60100600 Fines—General . . . . . . . . . . . . . . . . . 12,907,380 9,500,000 10,098,732 11,180,78600760 Rentals—Other . . . . . . . . . . . . . . . . . 68,000 68,000 47,249 26,88000859 Sundries . . . . . . . . . . . . . . . . . . . . . . 100,000 175,000 445,755 224,66700888 Medicaid Management
Information System . . . . . . . . . . . . 101,460,685 107,421,792 107,106,580 105,361,50601214 Lead Based Paint Abatement . . . . . . . — 198,109 141,163 —03263 Public Assistance—WTC/FEMA . . . — 21,292,068 15,174,808 —04218 Combined DNA Index System . . . . . — — — 8,66307906 Lead Poison Control Grant . . . . . . . . 436,808 2,378,174 2,373,466 2,823,69507920 Immunization Program . . . . . . . . . . . 5,055,278 6,672,792 6,604,774 5,289,64007921 Venereal Disease Control . . . . . . . . . 4,756,956 5,858,533 5,739,121 6,200,97307923 Tuberculosis Control Program . . . . . 17,074,421 17,139,722 19,392,059 18,806,22007934 Refugee Health Center for Disease
Control . . . . . . . . . . . . . . . . . . . . . . 213,773 27,279 12,899 207,50107935 AIDS Prevention and Surveillance
Projects . . . . . . . . . . . . . . . . . . . . . 13,574,141 22,297,188 22,041,220 14,192,03207946 Pediatric AIDS Epidemiological
Research . . . . . . . . . . . . . . . . . . . . . 623,811 586,443 563,707 744,92307953 Case Management Services—
Physically Handicapped Children . . — 113,000 138,428 165,36907955 Childhood Lead Screening
Prevention Program . . . . . . . . . . . . 598,480 577,514 484,668 636,56907958 AIDS HIV Surveillance . . . . . . . . . . . 3,383,264 3,706,372 3,327,607 4,559,98907959 Ryan White HIV Emergency Relief
Formula Grant . . . . . . . . . . . . . . . . 73,118,122 143,963,109 145,354,675 114,616,73007964 National Cancer Institute—
Project Assist . . . . . . . . . . . . . . . . . — — — 37,26107968 Day Care Inspections . . . . . . . . . . . . — 2,651,349 3,552,129 2,824,99107973 NYC Prison Health Sexually
Transmitted Disease Initiative . . . . — 58,705 127,110 80,45407976 Healthy Neighborhood Program . . . . — 98,736 169,850 236,90607987 Laboratory Surveillance . . . . . . . . . . 606,034 2,305,069 2,675,949 954,77207990 Maternal Child Health
Epidemiology . . . . . . . . . . . . . . . . . — — 27,466 152,38907994 Asthma Surveillance . . . . . . . . . . . . . — — — 13,16207998 Pregnancy Risk Assessment . . . . . . . — 133,241 90,149 103,36607999 Public Health—Bioterrorism . . . . . . . 1,159,733 1,846,984 1,116,972 503,44908002 TB Epidemiologic . . . . . . . . . . . . . . . 52,672 98,728 141,794 33,80008003 Viral Hepatitis Prevention . . . . . . . . . 109,938 173,865 111,143 4,07008006 Healthy Start Innitiative . . . . . . . . . . — 1,238,382 301,048 —08007 National Urban Commensal
Rodent Control . . . . . . . . . . . . . . . . — 217,230 19,663 —08008 Family Violence—Special
Outreach Program . . . . . . . . . . . . . — 4,185 1,411 —08009 Evaluation of HIV/AIDS
Surveillance System . . . . . . . . . . . . — 77,441 — —
156
Comptroller’s Report for Fiscal 2002 Part II-E—General Fund—Schedule G3 (Cont.)
Revenues vs. Budget by Agency
Budget Actual RevenueRevenue Source _________________________________________________________________________ _________________________________________________________________________Within Agency Adopted Modified 2002 2001__________________________ _________________________________ _________________________________ _________________________________ _________________________________
(Continued)

816 DEPARTMENT OF HEALTH (cont.)08010 HIV/AIDS Research-African
American Museum . . . . . . . . . . . . . $ — $ 107,537 $ — $ —09380 Pest Management . . . . . . . . . . . . . . . — — 45,140 90,35213013 Mammography Quality Standards . . — 160,394 5,740 152,19014704 Early Intervention Respite . . . . . . . . . — — 1,614,658 1,359,64519914 State Autopsy Reimbursement . . . . . 93,000 93,000 — —23908 Public Health—Local Assistance . . . 99,447,967 94,177,421 107,099,823 74,618,85823925 Chief Medical Examiner—Local
Assistance . . . . . . . . . . . . . . . . . . . 3,843,145 7,574,279 17,862,682 4,290,71423926 Chief Medical Examiner—
Laboratories . . . . . . . . . . . . . . . . . . 3,731,134 — — 379,19423934 Physically Handicapped Children’s
Program . . . . . . . . . . . . . . . . . . . . . 650,000 650,000 343,059 271,17923935 Public Health Works—Laboratories . . 2,824,958 492,500 1,200,629 327,26423936 Tick Surveillance Program . . . . . . . . — — 1,741,352 3,621,89623962 Public Health Works—Tuberculosis
Reimbursement . . . . . . . . . . . . . . . 638,651 580,877 401,140 578,77923972 Tuberculosis Control and
Prevention . . . . . . . . . . . . . . . . . . . 2,225,000 2,136,125 1,892,502 2,134,97923974 NYS-NYC Sexually Transmitted
Diseases . . . . . . . . . . . . . . . . . . . . . — 119,048 150,000 150,00023976 Early Intervention Services . . . . . . . . 131,566,409 143,708,317 138,109,064 103,498,58723977 TB Directly Observed Therapy . . . . . — 299,000 262,961 287,87023981 Youth Tobacco Enforcement and
Prevention . . . . . . . . . . . . . . . . . . . 56,682 1,384,612 1,220,230 910,44123983 Child Fatality Review Team . . . . . . . — 40,636 5,803 4,36123984 HIV Partner Notification . . . . . . . . . . — 1,455,478 1,765,760 1,731,70323985 Summer Feeding Surveillance . . . . . . — 31,000 31,000 12,82623986 Source Water Protection Program . . . — — — 69723990 Enhanced Drinking Water
Protection . . . . . . . . . . . . . . . . . . . . — 415,905 98,541 —23991 DNA Database Lab Accreditation . . . — 117,000 — —29866 Office of the Chief Medical
Examiner Toxicology Lab . . . . . . . — 55,597 134,716 240,49829867 Office of the Chief Medical
Examiner DNA Lab . . . . . . . . . . . . — 256,710 226,382 589,73130906 Local Government Records
Management Improvement Program . . . . . . . . . . . . . . . . . . . . . — 51,350 48,049 —
37916 St. John’s Settlement . . . . . . . . . . . . . — — — 19,32437921 Mental Health Research Association
Directly Observed Therapy . . . . . . — 143,044 175,539 251,92737931 Talk to Us Aids Hotline . . . . . . . . . . . — — — 1,10037932 Sexually Transmitted Disease
Continuing Education . . . . . . . . . . — — — 72737933 Merck Hepatitis B Education . . . . . . — — — 16,95937935 Turning Point Program . . . . . . . . . . . — 52,553 23,399 10,23037940 Becton Dickinson Bactec Project . . . — — 925 35,35637942 March of Dimes - Health Bridge . . . . — 38,106 — —
157
Comptroller’s Report for Fiscal 2002 Part II-E—General Fund—Schedule G3 (Cont.)
Revenues vs. Budget by Agency
Budget Actual RevenueRevenue Source _________________________________________________________________________ _________________________________________________________________________Within Agency Adopted Modified 2002 2001__________________________ _________________________________ _________________________________ _________________________________ _________________________________
(Continued)
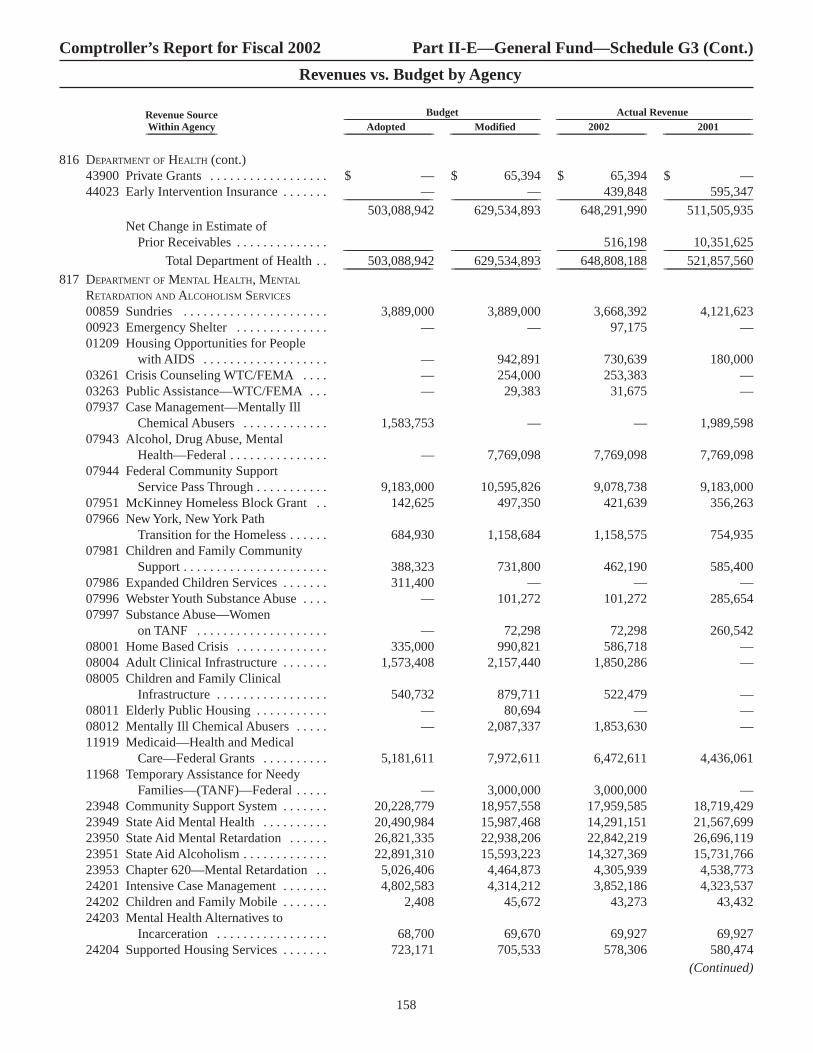
816 DEPARTMENT OF HEALTH (cont.)43900 Private Grants . . . . . . . . . . . . . . . . . . $ — $ 65,394 $ 65,394 $ —44023 Early Intervention Insurance . . . . . . . — — 439,848 595,347__________________________ __________________________ __________________________ __________________________
503,088,942 629,534,893 648,291,990 511,505,935Net Change in Estimate of
Prior Receivables . . . . . . . . . . . . . . 516,198 10,351,625__________________________ __________________________ __________________________ __________________________Total Department of Health . . 503,088,942 629,534,893 648,808,188 521,857,560__________________________ __________________________ __________________________ __________________________
817 DEPARTMENT OF MENTAL HEALTH, MENTAL
RETARDATION AND ALCOHOLISM SERVICES
00859 Sundries . . . . . . . . . . . . . . . . . . . . . . 3,889,000 3,889,000 3,668,392 4,121,62300923 Emergency Shelter . . . . . . . . . . . . . . — — 97,175 —01209 Housing Opportunities for People
with AIDS . . . . . . . . . . . . . . . . . . . — 942,891 730,639 180,00003261 Crisis Counseling WTC/FEMA . . . . — 254,000 253,383 —03263 Public Assistance—WTC/FEMA . . . — 29,383 31,675 —07937 Case Management—Mentally Ill
Chemical Abusers . . . . . . . . . . . . . 1,583,753 — — 1,989,59807943 Alcohol, Drug Abuse, Mental
Health—Federal . . . . . . . . . . . . . . . — 7,769,098 7,769,098 7,769,09807944 Federal Community Support
Service Pass Through . . . . . . . . . . . 9,183,000 10,595,826 9,078,738 9,183,00007951 McKinney Homeless Block Grant . . 142,625 497,350 421,639 356,26307966 New York, New York Path
Transition for the Homeless . . . . . . 684,930 1,158,684 1,158,575 754,93507981 Children and Family Community
Support . . . . . . . . . . . . . . . . . . . . . . 388,323 731,800 462,190 585,40007986 Expanded Children Services . . . . . . . 311,400 — — —07996 Webster Youth Substance Abuse . . . . — 101,272 101,272 285,65407997 Substance Abuse—Women
on TANF . . . . . . . . . . . . . . . . . . . . — 72,298 72,298 260,54208001 Home Based Crisis . . . . . . . . . . . . . . 335,000 990,821 586,718 —08004 Adult Clinical Infrastructure . . . . . . . 1,573,408 2,157,440 1,850,286 —08005 Children and Family Clinical
Infrastructure . . . . . . . . . . . . . . . . . 540,732 879,711 522,479 —08011 Elderly Public Housing . . . . . . . . . . . — 80,694 — —08012 Mentally Ill Chemical Abusers . . . . . — 2,087,337 1,853,630 —11919 Medicaid—Health and Medical
Care—Federal Grants . . . . . . . . . . 5,181,611 7,972,611 6,472,611 4,436,06111968 Temporary Assistance for Needy
Families—(TANF)—Federal . . . . . — 3,000,000 3,000,000 —23948 Community Support System . . . . . . . 20,228,779 18,957,558 17,959,585 18,719,42923949 State Aid Mental Health . . . . . . . . . . 20,490,984 15,987,468 14,291,151 21,567,69923950 State Aid Mental Retardation . . . . . . 26,821,335 22,938,206 22,842,219 26,696,11923951 State Aid Alcoholism . . . . . . . . . . . . . 22,891,310 15,593,223 14,327,369 15,731,76623953 Chapter 620—Mental Retardation . . 5,026,406 4,464,873 4,305,939 4,538,77324201 Intensive Case Management . . . . . . . 4,802,583 4,314,212 3,852,186 4,323,53724202 Children and Family Mobile . . . . . . . 2,408 45,672 43,273 43,43224203 Mental Health Alternatives to
Incarceration . . . . . . . . . . . . . . . . . 68,700 69,670 69,927 69,92724204 Supported Housing Services . . . . . . . 723,171 705,533 578,306 580,474
158
Comptroller’s Report for Fiscal 2002 Part II-E—General Fund—Schedule G3 (Cont.)
Revenues vs. Budget by Agency
Budget Actual RevenueRevenue Source _________________________________________________________________________ _________________________________________________________________________Within Agency Adopted Modified 2002 2001__________________________ _________________________________ _________________________________ _________________________________ _________________________________
(Continued)

817 DEPARTMENT OF MENTAL HEALTH, MENTAL
RETARDATION AND ALCOHOLISM SERVICES (cont.)24206 NYS-NYC Initiative . . . . . . . . . . . . . $ 13,609,753 $ 13,344,125 $ 12,844,525 $ 12,905,81024209 Community Mental Health
Reinvestment . . . . . . . . . . . . . . . . . — 67,363,616 53,536,625 47,164,58324210 Children and Family Support—State . . 1,299,443 1,511,376 1,378,115 1,493,48524213 Children and Family Home Based
Crisis Intervention . . . . . . . . . . . . . 867,690 666,832 240,497 641,24724214 Supportive Case Management . . . . . . 829,115 1,304,378 1,203,627 1,017,78424215 Administrative Case Management . . — 84,004 — —24216 Therapeutic Nursery . . . . . . . . . . . . . — 134,792 134,792 135,29024218 Mentally Ill Chemical Abusers . . . . . — 330,976 190,996 —24220 Assisted Outpatient Treatment . . . . . 641,896 3,822,760 2,342,555 1,357,72524221 State Aid for COLA . . . . . . . . . . . . . . 1,734,635 1,747,853 1,006,832 1,723,12124222 Administrative Case Management—
State . . . . . . . . . . . . . . . . . . . . . . 339,030 81,464 148,668 339,03024224 Children and Family Expanded Services . — 316,708 316,706 239,09124225 Health Care Reform Act Children
and Family—State . . . . . . . . . . . . . 629,564 2,380,655 2,393,378 —24226 Medication Grant Program . . . . . . . . — 346,724 109,850 —29302 Supported Employment Services . . . 2,133,606 2,133,606 2,124,257 2,116,18730400 Stop DWI . . . . . . . . . . . . . . . . . . . . . . — 58,974 58,657 52,424__________________________ __________________________ __________________________ __________________________
146,954,190 221,915,474 194,430,833 191,379,107Net Change in Estimate of
Prior Receivables . . . . . . . . . . . . . . — — (6,144,224) 6,553,793__________________________ __________________________ __________________________ __________________________Total Department of Mental
Health, Mental Retardationand Alcoholism Services . . 146,954,190 221,915,474 188,286,609 197,932,900__________________________ __________________________ __________________________ __________________________
826 DEPARTMENT OF ENVIRONMENTAL PROTECTION
00250 Permits—General . . . . . . . . . . . . . . . 8,400,000 8,000,000 6,639,877 8,324,98300470 Other Services and Fees . . . . . . . . . . 3,100,000 4,118,000 4,418,529 4,062,89000476 Administrative Services to the Public . 150,000 150,000 143,167 161,99600603 Fines—ECB . . . . . . . . . . . . . . . . . . . 33,781,000 42,000,000 44,964,412 42,937,60900760 Rentals—Other . . . . . . . . . . . . . . . . . 750,000 750,000 935,023 795,29000859 Sundries . . . . . . . . . . . . . . . . . . . . . . 750,000 1,750,000 1,873,214 3,471,31003263 Public Assistance—WTC/FEMA . . . — 9,331,187 7,511,508 —04166 Community Oriented Policing
Services (COPS) Universal Hiring Program . . . . . . . — — 81,129 84,889
05991 Intermodal Surface Transport . . . . . . — 30,327 17,390 —09376 National Estuary Long Island . . . . . . — — — 20,00009384 Monitor Peregrine Falcon Nest . . . . . — 14,170 3,578 2,81330266 NYC Ambient Surface Water Project . . — 222,100 219,045 90,72430906 Local Government Records
Management Improvement Program . . . . . . . . . . . . . . . . . . . . . — 71,300 65,564 61,644__________________________ __________________________ __________________________ __________________________
Total Department ofEnvironmental Protection . . 46,931,000 66,437,084 66,872,436 60,014,148__________________________ __________________________ __________________________ __________________________
159
Comptroller’s Report for Fiscal 2002 Part II-E—General Fund—Schedule G3 (Cont.)
Revenues vs. Budget by Agency
Budget Actual RevenueRevenue Source _________________________________________________________________________ _________________________________________________________________________Within Agency Adopted Modified 2002 2001__________________________ _________________________________ _________________________________ _________________________________ _________________________________
(Continued)

827 DEPARTMENT OF SANITATION
00200 Licenses—General . . . . . . . . . . . . . . $ 335,000 $ 335,000 $ 276,125 $ 338,12500304 Dumping Privileges . . . . . . . . . . . . . . — 350,000 470,349 919,26100325 Privileges—Other . . . . . . . . . . . . . . . 4,330,000 3,980,000 4,161,411 3,945,30000420 Sanitation Services and Fees . . . . . . . 10,000 10,000 6,733 3,72800470 Other Services and Fees . . . . . . . . . . 440,000 490,000 740,448 445,64100476 Administrative Services to
the Public . . . . . . . . . . . . . . . . . . . . 50,000 100,000 76,832 101,52900822 Sales of Equipment, Scrap and
Other Minor Sales . . . . . . . . . . . . . 3,219,000 4,885,000 5,090,787 9,232,28700859 Sundries . . . . . . . . . . . . . . . . . . . . . . 1,750,000 2,400,000 2,610,970 2,210,65503263 Public Assistance—WTC/FEMA . . . — 42,203,198 74,666,500 —43900 Private Grant . . . . . . . . . . . . . . . . . . . 1,600,000 1,931,103 1,847,430 346,51055030 WTC PS Related Costs . . . . . . . . . . . — 3,483,106 — —__________________________ __________________________ __________________________ __________________________
Total Department of Sanitation . . . . . . . . . . . . . . 11,734,000 60,167,407 89,947,585 17,543,036__________________________ __________________________ __________________________ __________________________
829 TRADE WASTE COMMISSION
00200 Licenses—General . . . . . . . . . . . . . . 455,000 675,000 851,262 1,040,50900470 Other Services and Fees . . . . . . . . . . 122,000 180,000 145,481 233,91500600 Fines—General . . . . . . . . . . . . . . . . . 314,000 75,000 63,200 450,09003263 Public Assistance—WTC/FEMA . . . — 25,355 152,466 —__________________________ __________________________ __________________________ __________________________
Total Trade Waste Commission . . . . . . . . . . . . 891,000 955,355 1,212,409 1,724,514__________________________ __________________________ __________________________ __________________________
836 DEPARTMENT OF FINANCE
00050 General Sales Tax . . . . . . . . . . . . . . . — — 13,119,000 16,866,00000070 Cigarette Tax . . . . . . . . . . . . . . . . . . . — — 50,000 87,00000072 Vault Tax . . . . . . . . . . . . . . . . . . . . . . — — 4,000 5,00000073 Commercial Motor Vehicle Tax . . . . . — — 86,000 60,00000090 Personal Income Tax . . . . . . . . . . . . . — — 16,116,000 10,818,00000093 General Corporation Tax . . . . . . . . . . — — 291,513,000 242,399,00000095 Financial Corporation Tax . . . . . . . . . — — 46,973,000 45,277,00000099 Unincorporated Business
Income Tax . . . . . . . . . . . . . . . . . . — — 38,618,000 39,954,00000103 Utility Tax . . . . . . . . . . . . . . . . . . . . . — — 46,734,000 15,254,00000110 Payment in Lieu of Taxes . . . . . . . . . — — 2,628,000 65,00000112 Occupancy of Hotel Rooms Tax . . . . — — 1,952,000 1,330,00000113 Commercial Rent Tax . . . . . . . . . . . . — — 23,482,000 22,395,00000122 Conveyance of Real Property Tax . . . — — 3,864,000 6,417,00000126 Surcharge on Liquor Licenses . . . . . . — — 230,000 266,00000129 Coin Operated Amusement
Devices Tax . . . . . . . . . . . . . . . . . . — — — 5,15500200 Licenses—General . . . . . . . . . . . . . . 130,000 130,000 125,400 140,00000410 Highways and Street Services
and Fees . . . . . . . . . . . . . . . . . . . . . 6,500,000 7,000,000 8,534,482 9,308,22800470 Other Services and Fees . . . . . . . . . . 28,492,900 26,128,900 32,597,424 27,742,08400476 Administrative Services to
the Public . . . . . . . . . . . . . . . . . . . . 668,000 673,000 692,661 839,33300600 Fines—General . . . . . . . . . . . . . . . . . 18,067,005 12,000,000 10,773,471 18,524,46500602 Fines—PVB . . . . . . . . . . . . . . . . . . . 383,005,000 373,250,000 379,559,891 382,229,236
160
Comptroller’s Report for Fiscal 2002 Part II-E—General Fund—Schedule G3 (Cont.)
Revenues vs. Budget by Agency
Budget Actual RevenueRevenue Source _________________________________________________________________________ _________________________________________________________________________Within Agency Adopted Modified 2002 2001__________________________ _________________________________ _________________________________ _________________________________ _________________________________
(Continued)

836 DEPARTMENT OF FINANCE (cont.)00603 Fines—ECB . . . . . . . . . . . . . . . . . . . $ 2,200,000 $ 4,400,000 $ 5,306,921 $ 1,879,20600650 Forfeitures—General . . . . . . . . . . . . . 3,000,000 4,360,000 4,806,454 4,465,53700859 Sundries . . . . . . . . . . . . . . . . . . . . . . 19,092,000 22,160,000 22,308,672 2,800,59203263 Public Assistance—WTC/FEMA . . . — 961,759 1,056,382 —29303 Local Government Records
Management Improvement Program . . . . . . . . . . . . . . . . . . . . . 500,000 500,000 500,000 500,000
29906 School Tax Relief . . . . . . . . . . . . . . . — 1,833,751 1,833,751 1,132,37230405 Motor Vehicle Theft & Insurance
Fraud Prevention . . . . . . . . . . . . . . — 107,729 105,842 37,70130906 Local Government Records
Management Improvement Program . . . . . . . . . . . . . . . . . . . . . — 20,000 20,000 7,700
44008 Disaster Related TFA Debt Issuance . . — 21,323 — —56001 Interest Income—Other . . . . . . . . . . . 2,940,000 1,740,000 1,651,093 3,454,80556002 Interest Income—MAC . . . . . . . . . . . 5,720,000 3,750,000 3,556,337 8,508,267__________________________ __________________________ __________________________ __________________________
470,314,905 459,036,462 958,797,781 862,767,681Net Change in Estimate of
Prior Receivables . . . . . . . . . . . . . . — — — (86,150)__________________________ __________________________ __________________________ __________________________Total Department of Finance . . 470,314,905 459,036,462 958,797,781 862,681,531__________________________ __________________________ __________________________ __________________________
841 DEPARTMENT OF TRANSPORTATION
00250 Permits—General . . . . . . . . . . . . . . . 20,236,000 21,996,000 22,052,767 21,235,36800320 Franchises—Other . . . . . . . . . . . . . . . 12,106,000 12,755,000 12,538,968 12,010,37700325 Privileges—Other . . . . . . . . . . . . . . . 39,311,000 39,206,000 39,888,515 38,250,98300410 Highway and Street Services
and Fees . . . . . . . . . . . . . . . . . . . . . 1,765,000 1,515,000 1,496,370 1,018,58600471 Ferry Fares and Tolls . . . . . . . . . . . . . 1,000,000 250,000 250,977 868,28900472 Parking Meter Revenues . . . . . . . . . . 81,174,000 77,694,000 83,191,440 83,843,50500476 Administrative Services to
the Public . . . . . . . . . . . . . . . . . . . . 25,000 25,000 42,255 33,63000822 Sales of Equipment, Scrap and
Other Minor Sales . . . . . . . . . . . . . 50,000 50,000 46,701 39,39800859 Sundries . . . . . . . . . . . . . . . . . . . . . . 250,000 150,000 146,079 247,77403263 Public Assistance—WTC/FEMA . . . — 18,521,769 12,839,364 —05930 Queensborough Bridge . . . . . . . . . . . 55,645 7,038,437 3,585,693 3,008,21905931 Williamsburg Bridge Project . . . . . . . — 461,783 457,819 209,87705935 Purchase of Transit Buses . . . . . . . . . — 768,759 177,270 260,29505959 Manhattan Bridge Enforcement
Agent . . . . . . . . . . . . . . . . . . . . . . — 570,643 649,714 441,85405988 College Point Bus Maintenance . . . . — 149,360 95,197 97,14705991 Intermodal Surface Transportation
and Efficiency . . . . . . . . . . . . . . . . 11,076,758 22,021,158 21,060,000 24,430,78905992 Congestion Mitigation Air Quality . . — 4,460,965 2,297,046 950,00506002 Traffic Injury Prevention . . . . . . . . . . — 608,000 165,899 493,38406003 Computer Oriented Data Analysis . . . — — — 46,46406004 Whitehall Ferry Terminal . . . . . . . . . — 488,221 138,489 115,21106005 Bus Fleet Management Study . . . . . . — 402,658 — 5,95206007 Child Passenger Safety Program . . . . — — — 7,251
161
Comptroller’s Report for Fiscal 2002 Part II-E—General Fund—Schedule G3 (Cont.)
Revenues vs. Budget by Agency
Budget Actual RevenueRevenue Source _________________________________________________________________________ _________________________________________________________________________Within Agency Adopted Modified 2002 2001__________________________ _________________________________ _________________________________ _________________________________ _________________________________
(Continued)
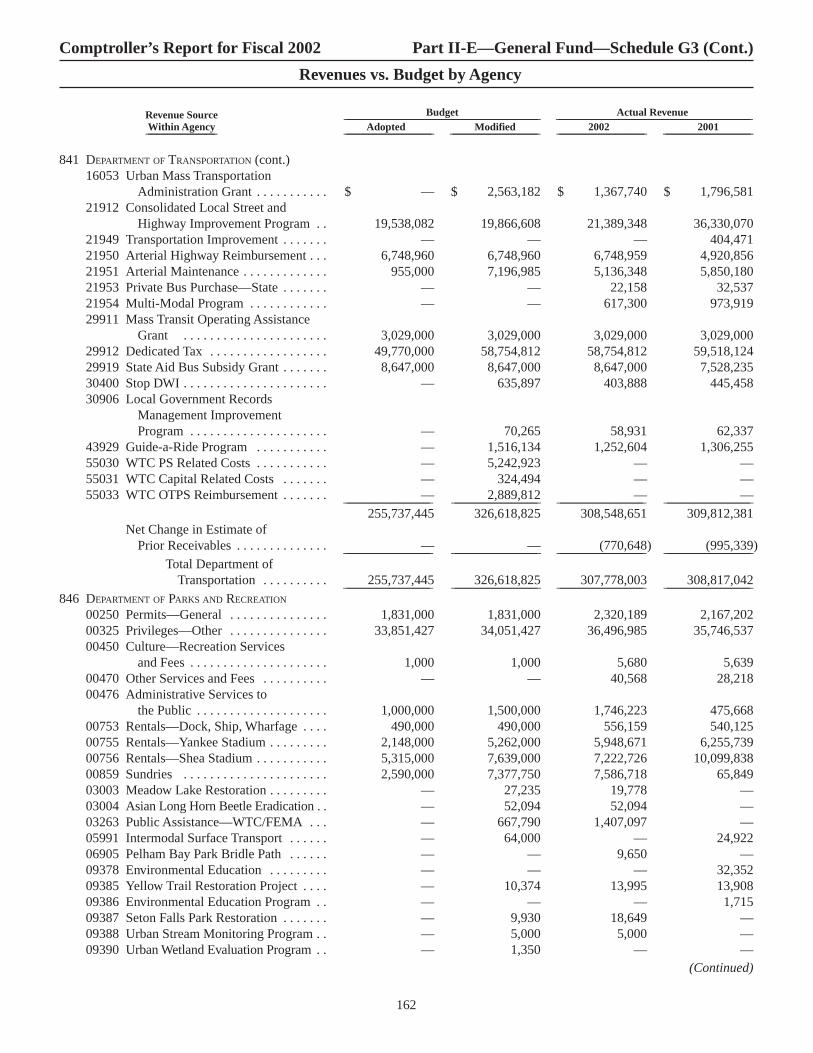
841 DEPARTMENT OF TRANSPORTATION (cont.)16053 Urban Mass Transportation
Administration Grant . . . . . . . . . . . $ — $ 2,563,182 $ 1,367,740 $ 1,796,58121912 Consolidated Local Street and
Highway Improvement Program . . 19,538,082 19,866,608 21,389,348 36,330,07021949 Transportation Improvement . . . . . . . — — — 404,47121950 Arterial Highway Reimbursement . . . 6,748,960 6,748,960 6,748,959 4,920,85621951 Arterial Maintenance . . . . . . . . . . . . . 955,000 7,196,985 5,136,348 5,850,18021953 Private Bus Purchase—State . . . . . . . — — 22,158 32,53721954 Multi-Modal Program . . . . . . . . . . . . — — 617,300 973,91929911 Mass Transit Operating Assistance
Grant . . . . . . . . . . . . . . . . . . . . . . 3,029,000 3,029,000 3,029,000 3,029,00029912 Dedicated Tax . . . . . . . . . . . . . . . . . . 49,770,000 58,754,812 58,754,812 59,518,12429919 State Aid Bus Subsidy Grant . . . . . . . 8,647,000 8,647,000 8,647,000 7,528,23530400 Stop DWI . . . . . . . . . . . . . . . . . . . . . . — 635,897 403,888 445,45830906 Local Government Records
Management Improvement Program . . . . . . . . . . . . . . . . . . . . . — 70,265 58,931 62,337
43929 Guide-a-Ride Program . . . . . . . . . . . — 1,516,134 1,252,604 1,306,25555030 WTC PS Related Costs . . . . . . . . . . . — 5,242,923 — —55031 WTC Capital Related Costs . . . . . . . — 324,494 — —55033 WTC OTPS Reimbursement . . . . . . . — 2,889,812 — —__________________________ __________________________ __________________________ __________________________
255,737,445 326,618,825 308,548,651 309,812,381Net Change in Estimate of
Prior Receivables . . . . . . . . . . . . . . — — (770,648) (995,339)__________________________ __________________________ __________________________ __________________________Total Department of
Transportation . . . . . . . . . . 255,737,445 326,618,825 307,778,003 308,817,042__________________________ __________________________ __________________________ __________________________846 DEPARTMENT OF PARKS AND RECREATION
00250 Permits—General . . . . . . . . . . . . . . . 1,831,000 1,831,000 2,320,189 2,167,20200325 Privileges—Other . . . . . . . . . . . . . . . 33,851,427 34,051,427 36,496,985 35,746,53700450 Culture—Recreation Services
and Fees . . . . . . . . . . . . . . . . . . . . . 1,000 1,000 5,680 5,63900470 Other Services and Fees . . . . . . . . . . — — 40,568 28,21800476 Administrative Services to
the Public . . . . . . . . . . . . . . . . . . . . 1,000,000 1,500,000 1,746,223 475,66800753 Rentals—Dock, Ship, Wharfage . . . . 490,000 490,000 556,159 540,12500755 Rentals—Yankee Stadium . . . . . . . . . 2,148,000 5,262,000 5,948,671 6,255,73900756 Rentals—Shea Stadium . . . . . . . . . . . 5,315,000 7,639,000 7,222,726 10,099,83800859 Sundries . . . . . . . . . . . . . . . . . . . . . . 2,590,000 7,377,750 7,586,718 65,84903003 Meadow Lake Restoration . . . . . . . . . — 27,235 19,778 —03004 Asian Long Horn Beetle Eradication . . — 52,094 52,094 —03263 Public Assistance—WTC/FEMA . . . — 667,790 1,407,097 —05991 Intermodal Surface Transport . . . . . . — 64,000 — 24,92206905 Pelham Bay Park Bridle Path . . . . . . — — 9,650 —09378 Environmental Education . . . . . . . . . — — — 32,35209385 Yellow Trail Restoration Project . . . . — 10,374 13,995 13,90809386 Environmental Education Program . . — — — 1,71509387 Seton Falls Park Restoration . . . . . . . — 9,930 18,649 —09388 Urban Stream Monitoring Program . . — 5,000 5,000 —09390 Urban Wetland Evaluation Program . . — 1,350 — —
162
Comptroller’s Report for Fiscal 2002 Part II-E—General Fund—Schedule G3 (Cont.)
Revenues vs. Budget by Agency
Budget Actual RevenueRevenue Source _________________________________________________________________________ _________________________________________________________________________Within Agency Adopted Modified 2002 2001__________________________ _________________________________ _________________________________ _________________________________ _________________________________
(Continued)

846 DEPARTMENT OF PARKS AND RECREATION (cont.)15702 Americorps Project . . . . . . . . . . . . . . $ — $ 247,714 $ 165,266 $ 144,21616080 Federal Aid . . . . . . . . . . . . . . . . . . . . — 117,839 118,790 81,21023987 Longhorned Beetle Survey . . . . . . . . — — — 285,40930210 Givens Creek Woods . . . . . . . . . . . . . — — — 1,40530257 Wetlands Restoration—Twin Island . . — 143,731 54,683 61,10730264 New York State Local Waterfront
Revitalization . . . . . . . . . . . . . . . . . — 49,230 — 87,98130265 Non-Point Source Abatement and
Control . . . . . . . . . . . . . . . . . . . . . . — 133,407 46,590 —30267 Northern Manhattan Hudson River
Parks—Slope Stabilization . . . . . . — 163,086 163,085 132,68330268 Riverdale Bond Act Project . . . . . . . . — 11,667 11,667 —30475 Bronx River . . . . . . . . . . . . . . . . . . . . — 34,515 34,515 —30901 Natural Heritage Trust #1 . . . . . . . . . — 209,919 209,919 218,43730906 Local Government Records
Management Improvement Program . . . . . . . . . . . . . . . . . . . . . — 62,202 59,272 —
43900 Private Grant . . . . . . . . . . . . . . . . . . . — 3,735,495 3,656,535 3,559,09743935 East River Esplanade . . . . . . . . . . . . . — 223,000 235,631 230,27443958 Battery Park City—Park
Enforcement Patrol . . . . . . . . . . . . — 1,935,000 1,725,000 1,675,91543994 Morningside Park . . . . . . . . . . . . . . . — — — 13,31944007 Sale of Carey House . . . . . . . . . . . . . — — — 14,95144022 Hudson River Park
Enforcement Patrol . . . . . . . . . . . . — 750,001 750,001 766,971__________________________ __________________________ __________________________ __________________________47,226,427 66,806,756 70,681,136 62,730,687
Net Change in Estimate of Prior Receivables . . . . . . . . . . . . . . — — (105,607) (204,460)__________________________ __________________________ __________________________ __________________________
Total Department of Parks and Recreation . . . . . . . . . . 47,226,427 66,806,756 70,575,529 62,526,227__________________________ __________________________ __________________________ __________________________
850 DEPARTMENT OF DESIGN AND CONSTRUCTION
00476 Administrative Services to the Public . . . . . . . . . . . . . . . . . . . . 150,000 100,000 160,242 95,664
03263 Public Assistance—WTC/FEMA . . . — 654,552,834 509,112,674 —03804 Natural Endowment for the Arts . . . . — 50,000 50,000 —30906 Local Government Records
Management Improvement Program . . . . . . . . . . . . . . . . . . . . . — 5,000 5,000 —
43900 Private Grants . . . . . . . . . . . . . . . . . . — 250,000 226,073 200,24955030 WTC PS Related Costs . . . . . . . . . . . — 4,500,000 — —__________________________ __________________________ __________________________ __________________________
150,000 659,457,834 509,553,989 295,913Net Change in Estimate of
Prior Receivables . . . . . . . . . . . . . . — — (200,249) —__________________________ __________________________ __________________________ __________________________Total Department of Design
and Construction . . . . . . . . 150,000 659,457,834 509,353,740 295,913__________________________ __________________________ __________________________ __________________________856 DEPARTMENT OF CITYWIDE ADMINISTRATIVE SERVICES
00110 Payment in Lieu of Taxes . . . . . . . . . — — 1,431,250 1,356,25000200 Licenses—General . . . . . . . . . . . . . . 250,000 250,000 329,250 312,703
163
Comptroller’s Report for Fiscal 2002 Part II-E—General Fund—Schedule G3 (Cont.)
Revenues vs. Budget by Agency
Budget Actual RevenueRevenue Source _________________________________________________________________________ _________________________________________________________________________Within Agency Adopted Modified 2002 2001__________________________ _________________________________ _________________________________ _________________________________ _________________________________
(Continued)
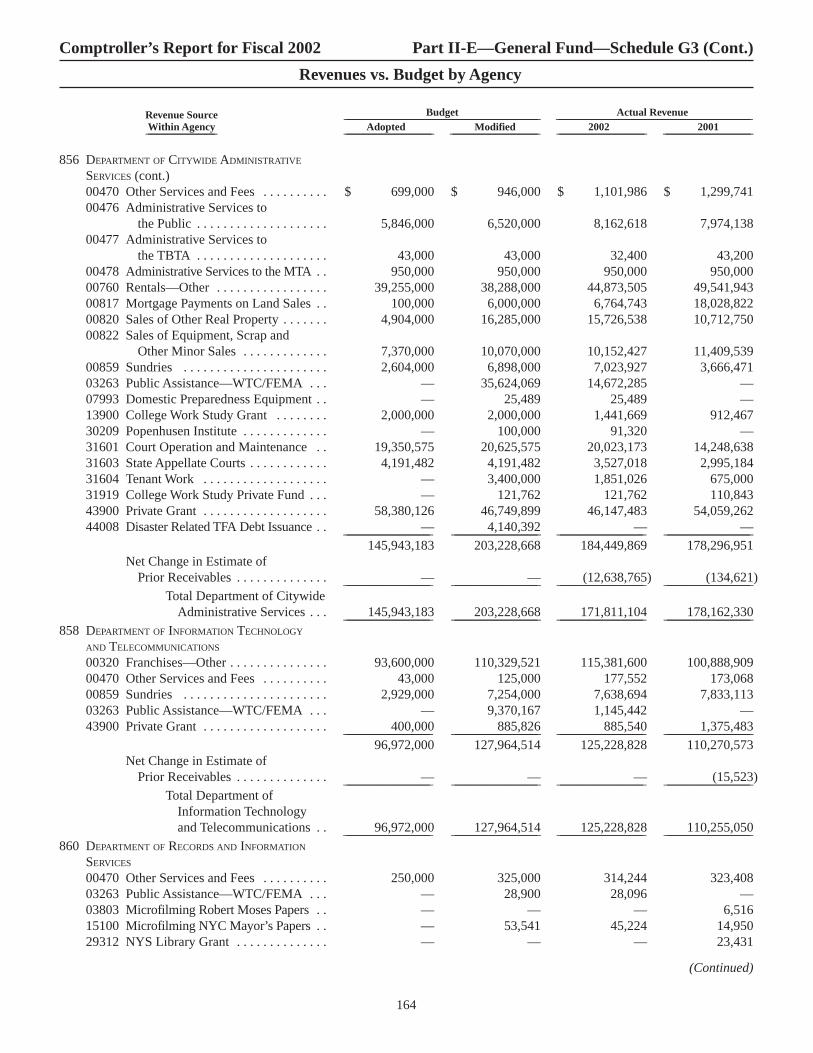
856 DEPARTMENT OF CITYWIDE ADMINISTRATIVE
SERVICES (cont.)00470 Other Services and Fees . . . . . . . . . . $ 699,000 $ 946,000 $ 1,101,986 $ 1,299,74100476 Administrative Services to
the Public . . . . . . . . . . . . . . . . . . . . 5,846,000 6,520,000 8,162,618 7,974,13800477 Administrative Services to
the TBTA . . . . . . . . . . . . . . . . . . . . 43,000 43,000 32,400 43,20000478 Administrative Services to the MTA . . 950,000 950,000 950,000 950,00000760 Rentals—Other . . . . . . . . . . . . . . . . . 39,255,000 38,288,000 44,873,505 49,541,94300817 Mortgage Payments on Land Sales . . 100,000 6,000,000 6,764,743 18,028,82200820 Sales of Other Real Property . . . . . . . 4,904,000 16,285,000 15,726,538 10,712,75000822 Sales of Equipment, Scrap and
Other Minor Sales . . . . . . . . . . . . . 7,370,000 10,070,000 10,152,427 11,409,53900859 Sundries . . . . . . . . . . . . . . . . . . . . . . 2,604,000 6,898,000 7,023,927 3,666,47103263 Public Assistance—WTC/FEMA . . . — 35,624,069 14,672,285 —07993 Domestic Preparedness Equipment . . — 25,489 25,489 —13900 College Work Study Grant . . . . . . . . 2,000,000 2,000,000 1,441,669 912,46730209 Popenhusen Institute . . . . . . . . . . . . . — 100,000 91,320 —31601 Court Operation and Maintenance . . 19,350,575 20,625,575 20,023,173 14,248,63831603 State Appellate Courts . . . . . . . . . . . . 4,191,482 4,191,482 3,527,018 2,995,18431604 Tenant Work . . . . . . . . . . . . . . . . . . . — 3,400,000 1,851,026 675,00031919 College Work Study Private Fund . . . — 121,762 121,762 110,84343900 Private Grant . . . . . . . . . . . . . . . . . . . 58,380,126 46,749,899 46,147,483 54,059,26244008 Disaster Related TFA Debt Issuance . . — 4,140,392 — —__________________________ __________________________ __________________________ __________________________
145,943,183 203,228,668 184,449,869 178,296,951Net Change in Estimate of
Prior Receivables . . . . . . . . . . . . . . — — (12,638,765) (134,621)__________________________ __________________________ __________________________ __________________________Total Department of Citywide
Administrative Services . . . 145,943,183 203,228,668 171,811,104 178,162,330__________________________ __________________________ __________________________ __________________________858 DEPARTMENT OF INFORMATION TECHNOLOGY
AND TELECOMMUNICATIONS
00320 Franchises—Other . . . . . . . . . . . . . . . 93,600,000 110,329,521 115,381,600 100,888,90900470 Other Services and Fees . . . . . . . . . . 43,000 125,000 177,552 173,06800859 Sundries . . . . . . . . . . . . . . . . . . . . . . 2,929,000 7,254,000 7,638,694 7,833,11303263 Public Assistance—WTC/FEMA . . . — 9,370,167 1,145,442 —43900 Private Grant . . . . . . . . . . . . . . . . . . . 400,000 885,826 885,540 1,375,483__________________________ __________________________ __________________________ __________________________
96,972,000 127,964,514 125,228,828 110,270,573Net Change in Estimate of
Prior Receivables . . . . . . . . . . . . . . — — — (15,523)__________________________ __________________________ __________________________ __________________________Total Department of
Information Technology and Telecommunications . . 96,972,000 127,964,514 125,228,828 110,255,050__________________________ __________________________ __________________________ __________________________
860 DEPARTMENT OF RECORDS AND INFORMATION
SERVICES
00470 Other Services and Fees . . . . . . . . . . 250,000 325,000 314,244 323,40803263 Public Assistance—WTC/FEMA . . . — 28,900 28,096 —03803 Microfilming Robert Moses Papers . . — — — 6,51615100 Microfilming NYC Mayor’s Papers . . — 53,541 45,224 14,95029312 NYS Library Grant . . . . . . . . . . . . . . — — — 23,431
164
Comptroller’s Report for Fiscal 2002 Part II-E—General Fund—Schedule G3 (Cont.)
Revenues vs. Budget by Agency
Budget Actual RevenueRevenue Source _________________________________________________________________________ _________________________________________________________________________Within Agency Adopted Modified 2002 2001__________________________ _________________________________ _________________________________ _________________________________ _________________________________
(Continued)
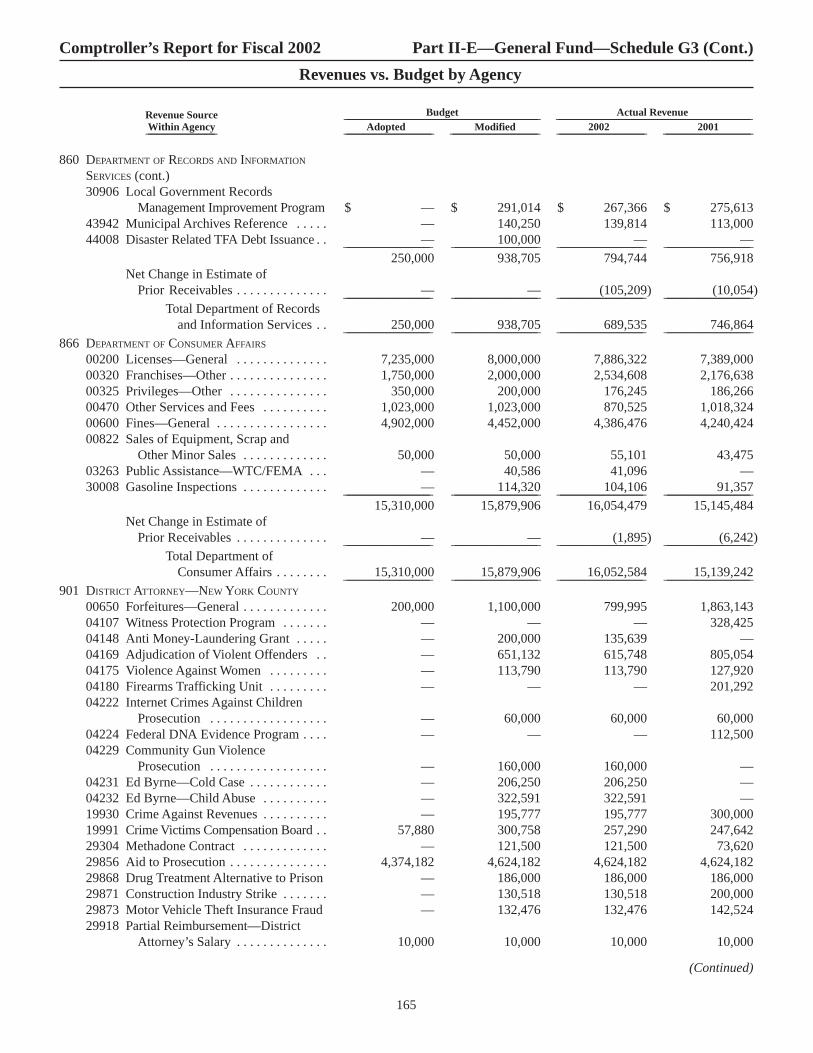
860 DEPARTMENT OF RECORDS AND INFORMATION
SERVICES (cont.)30906 Local Government Records
Management Improvement Program $ — $ 291,014 $ 267,366 $ 275,61343942 Municipal Archives Reference . . . . . — 140,250 139,814 113,00044008 Disaster Related TFA Debt Issuance . . — 100,000 — —__________________________ __________________________ __________________________ __________________________
250,000 938,705 794,744 756,918Net Change in Estimate of
Prior Receivables . . . . . . . . . . . . . . — — (105,209) (10,054)__________________________ __________________________ __________________________ __________________________Total Department of Records
and Information Services . . 250,000 938,705 689,535 746,864__________________________ __________________________ __________________________ __________________________866 DEPARTMENT OF CONSUMER AFFAIRS
00200 Licenses—General . . . . . . . . . . . . . . 7,235,000 8,000,000 7,886,322 7,389,00000320 Franchises—Other . . . . . . . . . . . . . . . 1,750,000 2,000,000 2,534,608 2,176,63800325 Privileges—Other . . . . . . . . . . . . . . . 350,000 200,000 176,245 186,26600470 Other Services and Fees . . . . . . . . . . 1,023,000 1,023,000 870,525 1,018,32400600 Fines—General . . . . . . . . . . . . . . . . . 4,902,000 4,452,000 4,386,476 4,240,42400822 Sales of Equipment, Scrap and
Other Minor Sales . . . . . . . . . . . . . 50,000 50,000 55,101 43,47503263 Public Assistance—WTC/FEMA . . . — 40,586 41,096 —30008 Gasoline Inspections . . . . . . . . . . . . . — 114,320 104,106 91,357__________________________ __________________________ __________________________ __________________________
15,310,000 15,879,906 16,054,479 15,145,484Net Change in Estimate of
Prior Receivables . . . . . . . . . . . . . . — — (1,895) (6,242)__________________________ __________________________ __________________________ __________________________Total Department of
Consumer Affairs . . . . . . . . 15,310,000 15,879,906 16,052,584 15,139,242__________________________ __________________________ __________________________ __________________________901 DISTRICT ATTORNEY—NEW YORK COUNTY
00650 Forfeitures—General . . . . . . . . . . . . . 200,000 1,100,000 799,995 1,863,14304107 Witness Protection Program . . . . . . . — — — 328,42504148 Anti Money-Laundering Grant . . . . . — 200,000 135,639 —04169 Adjudication of Violent Offenders . . — 651,132 615,748 805,05404175 Violence Against Women . . . . . . . . . — 113,790 113,790 127,92004180 Firearms Trafficking Unit . . . . . . . . . — — — 201,29204222 Internet Crimes Against Children
Prosecution . . . . . . . . . . . . . . . . . . — 60,000 60,000 60,00004224 Federal DNA Evidence Program . . . . — — — 112,50004229 Community Gun Violence
Prosecution . . . . . . . . . . . . . . . . . . — 160,000 160,000 —04231 Ed Byrne—Cold Case . . . . . . . . . . . . — 206,250 206,250 —04232 Ed Byrne—Child Abuse . . . . . . . . . . — 322,591 322,591 —19930 Crime Against Revenues . . . . . . . . . . — 195,777 195,777 300,00019991 Crime Victims Compensation Board . . 57,880 300,758 257,290 247,64229304 Methadone Contract . . . . . . . . . . . . . — 121,500 121,500 73,62029856 Aid to Prosecution . . . . . . . . . . . . . . . 4,374,182 4,624,182 4,624,182 4,624,18229868 Drug Treatment Alternative to Prison — 186,000 186,000 186,00029871 Construction Industry Strike . . . . . . . — 130,518 130,518 200,00029873 Motor Vehicle Theft Insurance Fraud — 132,476 132,476 142,52429918 Partial Reimbursement—District
Attorney’s Salary . . . . . . . . . . . . . . 10,000 10,000 10,000 10,000
165
Comptroller’s Report for Fiscal 2002 Part II-E—General Fund—Schedule G3 (Cont.)
Revenues vs. Budget by Agency
Budget Actual RevenueRevenue Source _________________________________________________________________________ _________________________________________________________________________Within Agency Adopted Modified 2002 2001__________________________ _________________________________ _________________________________ _________________________________ _________________________________
(Continued)

901 DISTRICT ATTORNEY—NEW YORK COUNTY (cont.)30400 Stop DWI . . . . . . . . . . . . . . . . . . . . . . $ — $ 48,000 $ 48,000 $ 51,23931914 Asset Forfeiture—Private . . . . . . . . . — 8,565,550 7,745,522 3,629,998__________________________ __________________________ __________________________ __________________________
Total District Attorney—New York County . . . . . . . . 4,642,062 17,128,524 15,865,278 12,963,539__________________________ __________________________ __________________________ __________________________
902 DISTRICT ATTORNEY—BRONX COUNTY
00650 Forfeitures—General . . . . . . . . . . . . . 150,000 300,000 235,027 1,054,86704139 Weed and Seed Project . . . . . . . . . . . — 170,010 170,007 140,33904140 Drug Treatment Alternative
Program . . . . . . . . . . . . . . . . . . . . . — 41,918 41,918 99,88504169 Adjudication of Violent Offenders . . — 398,420 398,420 466,05004175 Violence Against Women . . . . . . . . . — 118,232 118,232 131,07004194 Closed Circuit/Child Testimony . . . . — 23,630 23,630 51,01504201 School Drug Case Prosecution . . . . . — 343,238 343,238 347,05604204 Bronx Community Prosecution
Project . . . . . . . . . . . . . . . . . . . . . . — — — 19,79304210 National Children’s Alliance
Training . . . . . . . . . . . . . . . . . . . . . — — — 4,50004222 Internet Crimes Against Children
Prosecution . . . . . . . . . . . . . . . . . . — 2,231 2,230 13,10704226 Ed Byrne Prosecution of Marijuana
Offenses . . . . . . . . . . . . . . . . . . . . . — 75,000 75,000 —04229 Community Gun Violence
Prosecution . . . . . . . . . . . . . . . . . . — 79,342 79,342 —19929 Forfeiture Law Enforcement . . . . . . . — 113,907 113,907 71,34619949 State Felony Program . . . . . . . . . . . . — 55,100 55,100 55,10019991 Crime Victims Compensation Board . . 137,000 221,148 221,106 216,92529304 Inventory Planning Project . . . . . . . . — 69,527 69,527 20,50829856 Aid to Prosecution . . . . . . . . . . . . . . . 3,326,772 3,326,772 3,326,772 3,326,77229863 Anti-Auto Theft—Bronx . . . . . . . . . . — 150,000 150,000 150,00029873 Motor Vehicle Theft Insurance Fraud . . — 248,142 248,141 303,88329878 Community Projects Fund Gun
Trafficking . . . . . . . . . . . . . . . . . . . — 82,588 82,588 49,58929879 Community Projects Fund
Anti-Auto Theft . . . . . . . . . . . . . . . — 48,671 48,981 101,01929927 Partial Reimbursement—District
Attorney’s Salary . . . . . . . . . . . . . . 10,000 10,000 10,000 10,00030400 Stop DWI . . . . . . . . . . . . . . . . . . . . . . — 52,770 52,770 86,23631914 Asset Forfeiture—Private . . . . . . . . . — 94,632 94,631 37,19343900 Private Grants . . . . . . . . . . . . . . . . . . — 9,247 9,247 15,753__________________________ __________________________ __________________________ __________________________
3,623,772 6,034,525 5,969,814 6,772,006Net Change in Estimate of
Prior Receivables . . . . . . . . . . . . . . — — (401) —__________________________ __________________________ __________________________ __________________________Total District Attorney—
Bronx County . . . . . . . . . . . 3,623,772 6,034,525 5,969,413 6,772,006__________________________ __________________________ __________________________ __________________________903 DISTRICT ATTORNEY—KINGS COUNTY
00400 Public Safety Services and Fees . . . . 26,000 10,000 870 10,35000650 Forfeitures—General . . . . . . . . . . . . . 60,000 350,000 430,250 127,50003263 Public Assistance—WTC/FEMA . . . — 5,377 5,731 —
166
Comptroller’s Report for Fiscal 2002 Part II-E—General Fund—Schedule G3 (Cont.)
Revenues vs. Budget by Agency
Budget Actual RevenueRevenue Source _________________________________________________________________________ _________________________________________________________________________Within Agency Adopted Modified 2002 2001__________________________ _________________________________ _________________________________ _________________________________ _________________________________
(Continued)
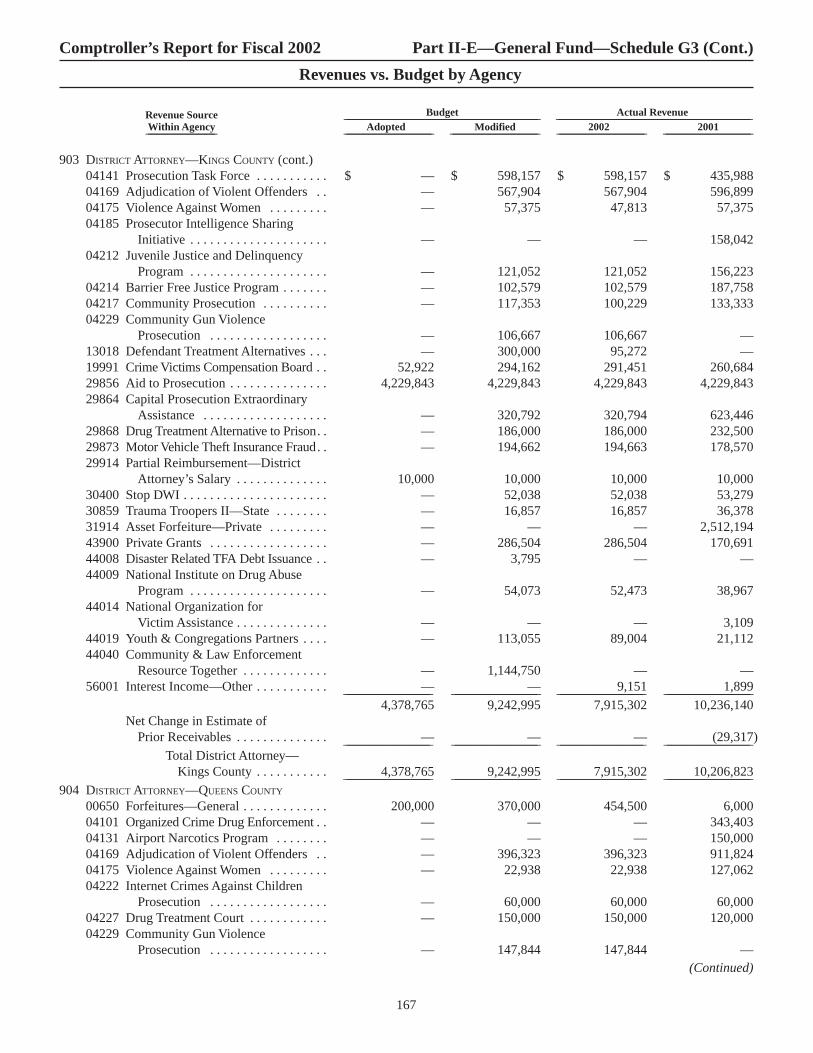
903 DISTRICT ATTORNEY—KINGS COUNTY (cont.)04141 Prosecution Task Force . . . . . . . . . . . $ — $ 598,157 $ 598,157 $ 435,98804169 Adjudication of Violent Offenders . . — 567,904 567,904 596,89904175 Violence Against Women . . . . . . . . . — 57,375 47,813 57,37504185 Prosecutor Intelligence Sharing
Initiative . . . . . . . . . . . . . . . . . . . . . — — — 158,04204212 Juvenile Justice and Delinquency
Program . . . . . . . . . . . . . . . . . . . . . — 121,052 121,052 156,22304214 Barrier Free Justice Program . . . . . . . — 102,579 102,579 187,75804217 Community Prosecution . . . . . . . . . . — 117,353 100,229 133,33304229 Community Gun Violence
Prosecution . . . . . . . . . . . . . . . . . . — 106,667 106,667 —13018 Defendant Treatment Alternatives . . . — 300,000 95,272 —19991 Crime Victims Compensation Board . . 52,922 294,162 291,451 260,68429856 Aid to Prosecution . . . . . . . . . . . . . . . 4,229,843 4,229,843 4,229,843 4,229,84329864 Capital Prosecution Extraordinary
Assistance . . . . . . . . . . . . . . . . . . . — 320,792 320,794 623,44629868 Drug Treatment Alternative to Prison . . — 186,000 186,000 232,50029873 Motor Vehicle Theft Insurance Fraud . . — 194,662 194,663 178,57029914 Partial Reimbursement—District
Attorney’s Salary . . . . . . . . . . . . . . 10,000 10,000 10,000 10,00030400 Stop DWI . . . . . . . . . . . . . . . . . . . . . . — 52,038 52,038 53,27930859 Trauma Troopers II—State . . . . . . . . — 16,857 16,857 36,37831914 Asset Forfeiture—Private . . . . . . . . . — — — 2,512,19443900 Private Grants . . . . . . . . . . . . . . . . . . — 286,504 286,504 170,69144008 Disaster Related TFA Debt Issuance . . — 3,795 — —44009 National Institute on Drug Abuse
Program . . . . . . . . . . . . . . . . . . . . . — 54,073 52,473 38,96744014 National Organization for
Victim Assistance . . . . . . . . . . . . . . — — — 3,10944019 Youth & Congregations Partners . . . . — 113,055 89,004 21,11244040 Community & Law Enforcement
Resource Together . . . . . . . . . . . . . — 1,144,750 — —56001 Interest Income—Other . . . . . . . . . . . — — 9,151 1,899__________________________ __________________________ __________________________ __________________________
4,378,765 9,242,995 7,915,302 10,236,140Net Change in Estimate of
Prior Receivables . . . . . . . . . . . . . . — — — (29,317)__________________________ __________________________ __________________________ __________________________Total District Attorney—
Kings County . . . . . . . . . . . 4,378,765 9,242,995 7,915,302 10,206,823__________________________ __________________________ __________________________ __________________________904 DISTRICT ATTORNEY—QUEENS COUNTY
00650 Forfeitures—General . . . . . . . . . . . . . 200,000 370,000 454,500 6,00004101 Organized Crime Drug Enforcement . . — — — 343,40304131 Airport Narcotics Program . . . . . . . . — — — 150,00004169 Adjudication of Violent Offenders . . — 396,323 396,323 911,82404175 Violence Against Women . . . . . . . . . — 22,938 22,938 127,06204222 Internet Crimes Against Children
Prosecution . . . . . . . . . . . . . . . . . . — 60,000 60,000 60,00004227 Drug Treatment Court . . . . . . . . . . . . — 150,000 150,000 120,00004229 Community Gun Violence
Prosecution . . . . . . . . . . . . . . . . . . — 147,844 147,844 —
167
Comptroller’s Report for Fiscal 2002 Part II-E—General Fund—Schedule G3 (Cont.)
Revenues vs. Budget by Agency
Budget Actual RevenueRevenue Source _________________________________________________________________________ _________________________________________________________________________Within Agency Adopted Modified 2002 2001__________________________ _________________________________ _________________________________ _________________________________ _________________________________
(Continued)

904 DISTRICT ATTORNEY—QUEENS COUNTY (cont.)19929 Forfeiture Law Enforcement . . . . . . . $ — $ — $ — $ 410,31619991 Crime Victims Compensation
Board . . . . . . . . . . . . . . . . . . . . . . — 166,085 166,085 98,25626016 Elderly Abuse Program . . . . . . . . . . . — 54,222 54,222 38,81629856 Aid to Prosecution . . . . . . . . . . . . . . . 2,188,206 1,759,266 1,759,267 2,188,20629860 Points of Entry Program . . . . . . . . . . — — — 300,00029868 Drug Treatment Alternative to Prison . . — 123,000 123,000 123,00029869 State Local Initiative Program . . . . . . — — — 60,00029873 Motor Vehicle Theft Insurance Fraud . . — 481,345 481,345 452,65529928 Partial Reimbursement—District
Attorney’s Salary . . . . . . . . . . . . . . 10,000 10,000 10,000 10,00030400 Stop DWI . . . . . . . . . . . . . . . . . . . . . . — 40,000 40,000 43,43941914 Safe Schools/Healthy Students . . . . . — 89,631 89,631 68,20044031 National Housing Partnership Grant . . — 20,831 20,831 14,899__________________________ __________________________ __________________________ __________________________
2,398,206 3,891,485 3,975,986 5,526,076Net Change in Estimate of
Prior Receivables . . . . . . . . . . . . . . — — (162,953) (1)__________________________ __________________________ __________________________ __________________________Total District Attorney—
Queens County . . . . . . . . . . 2,398,206 3,891,485 3,813,033 5,526,075__________________________ __________________________ __________________________ __________________________905 DISTRICT ATTORNEY—RICHMOND COUNTY
00650 Forfeitures—General . . . . . . . . . . . . . 2,000 2,000 771 5,00004140 Drug Treatment Alternative Program . . — 60,000 60,000 60,00004169 Adjudication of Violent Offenders . . — 178,832 173,375 195,04204175 Violence Against Women . . . . . . . . . — 61,954 57,986 75,20304203 Forensic Prosecution Program . . . . . . — 56,950 56,950 79,11304217 Community Prosecution . . . . . . . . . . — 167,484 132,996 64,57704229 Community Gun Violence
Prosecution . . . . . . . . . . . . . . . . . . — 56,178 56,178 —19991 Crime Victims Compensation Board . . — 68,522 44,199 57,27729304 Inventory Planning Project . . . . . . . . — 62,748 49,911 27,29529856 Aid to Prosecution . . . . . . . . . . . . . . . 224,185 224,185 224,185 224,18529873 Motor Vehicle Theft Insurance
Fraud . . . . . . . . . . . . . . . . . . . . . . — 115,838 111,063 102,00929916 Partial Reimbursement—District
Attorney’s Salary . . . . . . . . . . . . . . 10,000 10,000 10,000 10,00030400 Stop DWI . . . . . . . . . . . . . . . . . . . . . . — 25,000 25,000 26,621__________________________ __________________________ __________________________ __________________________
236,185 1,089,691 1,002,614 926,322Net Change in Estimate of
Prior Receivables . . . . . . . . . . . . . . — — (109) —__________________________ __________________________ __________________________ __________________________Total District Attorney—
Richmond County . . . . . . . 236,185 1,089,691 1,002,505 926,322__________________________ __________________________ __________________________ __________________________906 OFFICE OF THE SPECIAL NARCOTICS PROSECUTOR
04147 Public Housing Drug Control . . . . . . — — — 80,00004148 Anti Money-Laundering Grant . . . . . — 129,832 129,832 —04169 Adjudication of Violent Offenders . . — 190,215 162,896 137,38004176 Block Grant—Drug Courts . . . . . . . . — 203,852 203,853 —04185 Prosecutor Intelligence Sharing
Initiative . . . . . . . . . . . . . . . . . . . . . — — — 114,931
168
Comptroller’s Report for Fiscal 2002 Part II-E—General Fund—Schedule G3 (Cont.)
Revenues vs. Budget by Agency
Budget Actual RevenueRevenue Source _________________________________________________________________________ _________________________________________________________________________Within Agency Adopted Modified 2002 2001__________________________ _________________________________ _________________________________ _________________________________ _________________________________
(Continued)

906 OFFICE OF THE SPECIAL NARCOTICS PROSECUTOR (cont.)29857 Special Narcotics Prosecution
Program . . . . . . . . . . . . . . . . . . . . . $ 1,425,000 $ 1,425,000 $ 1,425,000 $ 1,425,00029868 Drug Treatment Alternative to
Prison . . . . . . . . . . . . . . . . . . . . . . — 105,000 105,000 105,000__________________________ __________________________ __________________________ __________________________Total Office of the Special
Narcotics Prosecutor . . . . . 1,425,000 2,053,899 2,026,581 1,862,311__________________________ __________________________ __________________________ __________________________941 PUBLIC ADMINISTRATOR—NEW YORK COUNTY
00470 Other Services and Fees . . . . . . . . . . 1,500,000 1,500,000 1,228,388 999,37400476 Administrative Services to
the Public . . . . . . . . . . . . . . . . . . . . 60,000 60,000 46,829 37,030__________________________ __________________________ __________________________ __________________________Total Public Administrator—
New York County . . . . . . . . 1,560,000 1,560,000 1,275,217 1,036,404__________________________ __________________________ __________________________ __________________________942 PUBLIC ADMINISTRATOR—BRONX COUNTY
00470 Other Services and Fees . . . . . . . . . . 375,000 375,000 443,346 582,257__________________________ __________________________ __________________________ __________________________Total Public Administrator—
Bronx County . . . . . . . . . . . 375,000 375,000 443,346 582,257__________________________ __________________________ __________________________ __________________________943 PUBLIC ADMINISTRATOR—KINGS COUNTY
00470 Other Services and Fees . . . . . . . . . . 600,000 600,000 421,360 577,224__________________________ __________________________ __________________________ __________________________Total Public Administrator—
Kings County . . . . . . . . . . . 600,000 600,000 421,360 577,224__________________________ __________________________ __________________________ __________________________944 PUBLIC ADMINISTRATOR—QUEENS COUNTY
00470 Other Services and Fees . . . . . . . . . . 600,000 600,000 1,028,366 1,110,609__________________________ __________________________ __________________________ __________________________Total Public Administrator—
Queens County . . . . . . . . . . 600,000 600,000 1,028,366 1,110,609__________________________ __________________________ __________________________ __________________________945 PUBLIC ADMINISTRATOR—RICHMOND COUNTY
00470 Other Services and Fees . . . . . . . . . . 15,000 50,000 46,645 96,767__________________________ __________________________ __________________________ __________________________Total Public Administrator—
Richmond County . . . . . . . 15,000 50,000 46,645 96,767__________________________ __________________________ __________________________ __________________________GRAND TOTAL—GENERAL FUND . . . . . . . . . . . . . . . $39,380,990,628 $41,754,922,563 $40,865,260,105 $40,231,872,370__________________________ __________________________ __________________________ ____________________________________________________ __________________________ __________________________ __________________________
169
Comptroller’s Report for Fiscal 2002 Part II-E—General Fund—Schedule G3 (Cont.)
Revenues vs. Budget by Agency
Budget Actual RevenueRevenue Source _________________________________________________________________________ _________________________________________________________________________Within Agency Adopted Modified 2002 2001__________________________ _________________________________ _________________________________ _________________________________ _________________________________

General Government:002 Mayoralty . . . . . . . . . . . . . . . . . . . . . . . $ 71,805,949 $ 112,383,763 $ 103,984,452 $ 8,399,311003 Board of Elections . . . . . . . . . . . . . . . . . 36,115,410 69,585,541 67,481,430 2,104,111004 Campaign Finance Board . . . . . . . . . . . 77,202,083 49,788,793 48,500,270 1,288,523008 Office of the Actuary . . . . . . . . . . . . . . . 3,820,958 3,334,958 3,148,925 186,033010 Borough President-Manhattan . . . . . . . . 5,322,685 5,049,294 5,027,262 22,032011 Borough President-Bronx . . . . . . . . . . . 7,502,231 7,249,352 6,945,120 304,232012 Borough President-Brooklyn . . . . . . . . . 6,500,009 6,716,143 6,065,331 650,812013 Borough President-Queens . . . . . . . . . . 6,195,727 6,346,686 6,290,390 56,296014 Borough President-Staten Island . . . . . . 5,209,949 4,847,977 4,787,566 60,411015 Office of the Comptroller . . . . . . . . . . . 52,309,901 56,080,595 50,559,193 5,521,402021 Tax Commission . . . . . . . . . . . . . . . . . . 2,193,169 2,043,169 1,958,990 84,179025 Law Department . . . . . . . . . . . . . . . . . . 93,993,365 92,418,417 91,211,955 1,206,462030 Department of City Planning . . . . . . . . . 17,922,647 19,272,139 18,730,957 541,182032 Department of Investigation . . . . . . . . . 21,586,404 20,804,437 20,862,079 (57,642)101 Public Advocate . . . . . . . . . . . . . . . . . . . 2,572,130 2,836,954 2,821,435 15,519102 City Council . . . . . . . . . . . . . . . . . . . . . 47,732,455 47,815,749 47,103,386 712,363103 City Clerk . . . . . . . . . . . . . . . . . . . . . . . 2,731,292 2,770,946 2,710,282 60,664127 Financial Information Services
Agency . . . . . . . . . . . . . . . . . . . . . . . . 28,235,560 26,143,561 25,584,629 558,932131 Office of Payroll Administration . . . . . . 8,442,591 6,002,254 5,900,130 102,124132 Independent Budget Office . . . . . . . . . . 2,855,173 2,672,617 2,551,348 121,269133 Equal Employment Practices
Commission . . . . . . . . . . . . . . . . . . . . 692,107 382,107 326,504 55,603134 Civil Service Commission . . . . . . . . . . . 693,405 484,405 471,038 13,367136 Landmarks Preservation Commission . . 3,340,116 3,231,991 3,169,948 62,043226 Commission on Human Rights . . . . . . . 7,257,479 7,777,404 7,440,732 336,672260 Department of Youth and Community
Development . . . . . . . . . . . . . . . . . . . 154,424,975 158,461,997 141,385,066 17,076,931312 Conflicts of Interest Board . . . . . . . . . . 1,798,669 1,795,897 1,623,869 172,028313 Office of Collective Bargaining . . . . . . . 1,486,610 1,498,220 1,479,336 18,884341 Manhattan Community Board #1 . . . . . 175,758 176,799 173,291 3,508342 Manhattan Community Board #2 . . . . . 229,241 229,004 228,848 156343 Manhattan Community Board #3 . . . . . 180,419 179,751 176,573 3,178344 Manhattan Community Board #4 . . . . . 209,594 211,663 201,382 10,281345 Manhattan Community Board #5 . . . . . 218,248 218,660 205,051 13,609346 Manhattan Community Board #6 . . . . . 249,678 249,678 236,075 13,603347 Manhattan Community Board #7 . . . . . 179,592 184,317 178,815 5,502348 Manhattan Community Board #8 . . . . . 266,119 267,121 252,437 14,684349 Manhattan Community Board #9 . . . . . 193,758 193,758 187,240 6,518350 Manhattan Community Board #10 . . . . 243,274 243,274 214,192 29,082351 Manhattan Community Board #11 . . . . 182,826 182,385 149,006 33,379352 Manhattan Community Board #12 . . . . 175,758 175,758 141,231 34,527381 Bronx Community Board #1 . . . . . . . . . 199,218 199,485 194,855 4,630382 Bronx Community Board #2 . . . . . . . . . 208,673 208,589 207,263 1,326383 Bronx Community Board #3 . . . . . . . . . 200,576 200,033 197,000 3,033384 Bronx Community Board #4 . . . . . . . . . 183,801 183,801 175,404 8,397385 Bronx Community Board #5 . . . . . . . . . 191,501 191,501 182,539 8,962386 Bronx Community Board #6 . . . . . . . . . 175,758 175,758 152,081 23,677
170
Comptroller’s Report for Fiscal 2002 Part II-E—General Fund—Schedule G4
Expenditures and Transfers vs. Budget by Agency
Actual Better (Worse)Budget Expenditures Than Modified__________________________________________________________________________
Adopted Modified and Transfers Budget_________________________________ _________________________________ _________________________________ _________________________________
(Continued)

General Government: (cont.)387 Bronx Community Board #7 . . . . . . . . . $ 208,753 $ 209,160 $ 189,362 $ 19,798388 Bronx Community Board #8 . . . . . . . . . 202,639 202,577 194,300 8,277389 Bronx Community Board #9 . . . . . . . . . 226,656 226,656 200,750 25,906390 Bronx Community Board #10 . . . . . . . . 214,668 213,996 211,039 2,957391 Bronx Community Board #11 . . . . . . . . 208,850 209,274 208,225 1,049392 Bronx Community Board #12 . . . . . . . . 175,758 175,758 172,562 3,196431 Queens Community Board #1 . . . . . . . . 188,922 196,029 182,251 13,778432 Queens Community Board #2 . . . . . . . . 225,765 225,765 208,726 17,039433 Queens Community Board #3 . . . . . . . . 224,960 224,960 227,284 (2,324)434 Queens Community Board #4 . . . . . . . . 203,100 203,110 196,532 6,578435 Queens Community Board #5 . . . . . . . . 199,538 199,399 193,690 5,709436 Queens Community Board #6 . . . . . . . . 211,044 210,656 205,741 4,915437 Queens Community Board #7 . . . . . . . . 195,560 195,560 190,247 5,313438 Queens Community Board #8 . . . . . . . . 198,995 189,386 182,663 6,723439 Queens Community Board #9 . . . . . . . . 175,758 175,758 174,841 917440 Queens Community Board #10 . . . . . . . 203,360 203,360 201,433 1,927441 Queens Community Board #11 . . . . . . . 213,245 217,538 211,833 5,705442 Queens Community Board #12 . . . . . . . 199,188 198,743 179,865 18,878443 Queens Community Board #13 . . . . . . . 197,091 197,039 189,236 7,803444 Queens Community Board #14 . . . . . . . 192,560 192,560 183,342 9,218471 Brooklyn Community Board #1 . . . . . . 213,953 213,074 212,131 943472 Brooklyn Community Board #2 . . . . . . 209,945 209,945 187,385 22,560473 Brooklyn Community Board #3 . . . . . . 193,994 194,283 191,980 2,303474 Brooklyn Community Board #4 . . . . . . 211,845 211,845 202,043 9,802475 Brooklyn Community Board #5 . . . . . . 175,758 175,758 173,742 2,016476 Brooklyn Community Board #6 . . . . . . 175,758 175,758 173,497 2,261477 Brooklyn Community Board #7 . . . . . . 181,758 181,758 180,956 802478 Brooklyn Community Board #8 . . . . . . 214,542 215,621 209,563 6,058479 Brooklyn Community Board #9 . . . . . . 179,777 179,431 170,778 8,653480 Brooklyn Community Board #10 . . . . . 175,758 175,758 173,297 2,461481 Brooklyn Community Board #11 . . . . . 198,586 201,118 198,712 2,406482 Brooklyn Community Board #12 . . . . . 218,714 218,351 213,847 4,504483 Brooklyn Community Board #13 . . . . . 192,570 194,643 167,998 26,645484 Brooklyn Community Board #14 . . . . . 230,736 229,062 225,519 3,543485 Brooklyn Community Board #15 . . . . . 175,758 175,758 173,753 2,005486 Brooklyn Community Board #16 . . . . . 196,337 196,337 185,802 10,535487 Brooklyn Community Board #17 . . . . . 223,365 224,309 220,436 3,873488 Brooklyn Community Board #18 . . . . . 186,360 186,360 154,940 31,420491 Staten Island Community Board #1 . . . 216,940 217,048 211,697 5,351492 Staten Island Community Board #2 . . . 220,760 220,760 172,708 48,052493 Staten Island Community Board #3 . . . 230,484 229,584 221,390 8,194801 Department of Business Services . . . . . 43,873,741 62,275,177 97,221,946 (34,946,769)836 Department of Finance . . . . . . . . . . . . . 206,788,123 184,809,994 182,318,652 2,491,342850 Department of Design and
Construction . . . . . . . . . . . . . . . . . . . . — 654,857,834 536,656,424 118,201,410856 Department of Citywide Administrative
Services . . . . . . . . . . . . . . . . . . . . . . . 218,533,460 255,113,001 241,736,222 13,376,779
171
Comptroller’s Report for Fiscal 2002 Part II-E—General Fund—Schedule G4 (Cont.)
Expenditures and Transfers vs. Budget by Agency
Actual Better (Worse)Budget Expenditures Than Modified__________________________________________________________________________
Adopted Modified and Transfers Budget_________________________________ _________________________________ _________________________________ _________________________________
(Continued)

General Government: (cont.)858 Department of Information Technology
and Telecommunications . . . . . . . . . . $ 54,066,385 $ 60,399,823 $ 46,147,877 $ 14,251,946860 Department of Records and
Information Services . . . . . . . . . . . . . 3,471,423 4,103,037 3,639,015 464,022866 Department of Consumer Affairs . . . . . 13,346,805 12,714,359 12,402,972 311,387________________ ________________ ________________ ________________
Total General Government . . . . . . . 1,221,976,886 1,964,033,771 1,809,624,110 154,409,661________________ ________________ ________________ ________________Public Safety and Judicial:
054 Civilian Complaint Review Board . . . . 11,009,219 9,428,581 9,328,549 100,032056 Police Department . . . . . . . . . . . . . . . . . 3,202,712,381 3,679,408,035 3,576,661,500 102,746,535057 Fire Department . . . . . . . . . . . . . . . . . . . 1,106,327,684 1,245,514,833 1,266,180,081 (20,665,248)072 Department of Correction . . . . . . . . . . . 870,647,558 889,756,827 881,877,068 7,879,759073 Board of Correction . . . . . . . . . . . . . . . . 1,031,243 932,059 906,357 25,702130 Department of Juvenile Justice . . . . . . . 106,187,525 110,823,057 108,636,052 2,187,005156 New York City Taxi and Limousine
Commission . . . . . . . . . . . . . . . . . . . . 24,949,518 23,276,729 22,976,377 300,352781 Department of Probation . . . . . . . . . . . . 92,669,220 90,126,214 88,988,166 1,138,048901 District Attorney-New York County . . . 72,988,747 83,126,117 82,147,070 979,047902 District Attorney-Bronx County . . . . . . 43,519,008 44,766,123 44,722,567 43,556903 District Attorney-Kings County . . . . . . 72,014,516 75,430,296 79,740,773 (4,310,477)904 District Attorney-Queens County . . . . . 37,813,189 38,942,272 39,193,218 (250,946)905 District Attorney-Richmond County . . . 6,468,028 7,166,739 7,046,823 119,916906 Office of The Special Narcotics
Prosecutor . . . . . . . . . . . . . . . . . . . . . 15,684,620 16,015,129 16,010,515 4,614941 Public Administrator-New York County . . 948,795 962,040 914,506 47,534942 Public Administrator-Bronx County . . . 347,637 340,637 328,525 12,112943 Public Administrator-Kings County . . . 470,119 464,119 439,053 25,066944 Public Administrator-Queens County . . 362,675 352,675 343,483 9,192945 Public Administrator-Richmond County . . 247,327 243,327 237,028 6,299
Miscellaneous—Court Costs . . . . . . . . . 100,000 — — —Miscellaneous—Contributions
Legal Aid . . . . . . . . . . . . . . . . . . . . . . 147,642,715 141,934,715 138,842,952 3,091,763Miscellaneous—Criminal Justice
Programs . . . . . . . . . . . . . . . . . . . . . . 46,335,552 46,225,552 45,476,440 749,112Miscellaneous—Other . . . . . . . . . . . . . . 24,614,000 23,452,395 23,452,395 —Miscellaneous—World Trade Center
Disaster Related Expense . . . . . . . . . — 29,209,829 27,861,271 1,348,558________________ ________________ ________________ ________________Total Public Safety and Judicial . . . 5,885,091,276 6,557,898,300 6,462,310,769 95,587,531________________ ________________ ________________ ________________
Education:040 Board of Education . . . . . . . . . . . . . . . . . 11,521,485,031 11,862,491,606 11,715,014,880 147,476,726________________ ________________ ________________ ________________
City University:042 City University of New York
Senior Colleges . . . . . . . . . . . . . . . . . 35,000,000 35,000,000 — 35,000,000Community Colleges . . . . . . . . . . . . . . . 392,983,454 403,928,380 399,963,430 3,964,950Hunter Campus Schools . . . . . . . . . . . . 9,994,438 10,974,190 10,874,501 99,689Educational Aid . . . . . . . . . . . . . . . . . . . 7,000,000 7,000,000 7,000,000 —________________ ________________ ________________ ________________
Total City University . . . . . . . . . . . 444,977,892 456,902,570 417,837,931 39,064,639________________ ________________ ________________ ________________
172
Comptroller’s Report for Fiscal 2002 Part II-E—General Fund—Schedule G4 (Cont.)
Expenditures and Transfers vs. Budget by Agency
Actual Better (Worse)Budget Expenditures Than Modified__________________________________________________________________________
Adopted Modified and Transfers Budget_________________________________ _________________________________ _________________________________ _________________________________
(Continued)

Social Services:068 Administration for Children’s Services . $ 2,437,613,551 $ 2,410,005,036 $ 2,318,278,080 $ 91,726,956069 Department of Social Services . . . . . . . 5,652,874,313 5,952,176,051 5,928,325,802 23,850,249071 Department of Homeless Services . . . . 497,005,274 527,535,310 503,437,631 24,097,679094 Department of Employment . . . . . . . . . 94,354,705 137,021,061 131,511,839 5,509,222125 Department for the Aging . . . . . . . . . . . 245,371,749 248,543,789 216,172,299 32,371,490________________ ________________ ________________ ________________
Total Social Services . . . . . . . . . . . 8,927,219,592 9,275,281,247 9,097,725,651 177,555,596________________ ________________ ________________ ________________Environmental Protection:
826 Department of Environmental Protection . . . . . . . . . . . . . . . . . . . . . . 660,032,765 644,207,386 616,620,330 27,587,056
827 Department of Sanitation . . . . . . . . . . . 974,316,343 1,002,133,765 983,125,537 19,008,228829 Trade Waste Commission . . . . . . . . . . . 2,981,269 2,701,710 2,779,107 (77,397)________________ ________________ ________________ ________________
Total Environmental Protection . . . . 1,637,330,377 1,649,042,861 1,602,524,974 46,517,887________________ ________________ ________________ ________________Transportation Services:
841 Department of Transportation . . . . . . . . 334,813,960 383,159,649 358,887,909 24,271,740Miscellaneous—Payments to the
Transit Authority . . . . . . . . . . . . . . . . 102,968,747 120,439,953 120,439,952 1Miscellaneous—Payments to Private
Bus Companies . . . . . . . . . . . . . . . . . 167,479,000 188,241,940 199,400,066 (11,158,126)________________ ________________ ________________ ________________Total Transportation Services . . . . . 605,261,707 691,841,542 678,727,927 13,113,615________________ ________________ ________________ ________________
Parks, Recreation and Cultural Activities:126 Department of Cultural Affairs . . . . . . . 137,919,020 123,686,680 123,144,471 542,209846 Department of Parks and Recreation . . . 177,422,417 184,272,330 181,918,195 2,354,135________________ ________________ ________________ ________________
Total Parks, Recreation and Cultural Activities . . . . . . . . . . . . 315,341,437 307,959,010 305,062,666 2,896,344________________ ________________ ________________ ________________
Housing:806 Department of Housing Preservation
and Development . . . . . . . . . . . . . . . . 404,726,009 395,048,250 371,242,733 23,805,517810 Department of Buildings . . . . . . . . . . . . 29,859,343 55,924,932 55,860,266 64,666
Miscellaneous—Payments to the Housing Authority . . . . . . . . . . . . . . . 19,331,123 13,181,455 13,181,455 —________________ ________________ ________________ ________________
Total Housing . . . . . . . . . . . . . . . . . 453,916,475 464,154,637 440,284,454 23,870,183________________ ________________ ________________ ________________Health:
816 Department of Health . . . . . . . . . . . . . . 954,194,429 1,070,771,302 1,049,134,555 21,636,747817 Department of Mental Health,
Mental Retardation and Alcoholism Services . . . . . . . . . . . . . 243,522,326 304,634,649 256,064,100 48,570,549
819 New York City Health and Hospitals Corporation . . . . . . . . . . . . . . . . . . . . 835,363,036 832,319,796 826,307,219 6,012,577________________ ________________ ________________ ________________
Total Health . . . . . . . . . . . . . . . . . . 2,033,079,791 2,207,725,747 2,131,505,874 76,219,873________________ ________________ ________________ ________________Libraries:
035 Research Libraries . . . . . . . . . . . . . . . . . 9,963,794 9,238,248 9,198,396 39,852037 New York Public Library . . . . . . . . . . . . 49,752,932 46,934,082 46,905,366 28,716038 Brooklyn Public Library . . . . . . . . . . . . 36,676,181 34,858,512 34,764,297 94,215039 Queens Borough Public Library . . . . . . 35,040,167 32,999,400 32,940,011 59,389________________ ________________ ________________ ________________
Total Libraries . . . . . . . . . . . . . . . . 131,433,074 124,030,242 123,808,070 222,172________________ ________________ ________________ ________________
173
Comptroller’s Report for Fiscal 2002 Part II-E—General Fund—Schedule G4 (Cont.)
Expenditures and Transfers vs. Budget by Agency
Actual Better (Worse)Budget Expenditures Than Modified__________________________________________________________________________
Adopted Modified and Transfers Budget_________________________________ _________________________________ _________________________________ _________________________________
(Continued)

Pensions:095 Pension Contributions . . . . . . . . . . . . . . $ 1,363,844,927 $ 1,397,524,736 $ 1,391,895,675 $ 5,629,061________________ ________________ ________________ ________________
Judgments and Claims . . . . . . . . . . . . . . . . . . . . . . 309,526,919 389,526,919 521,833,753 (132,306,834)________________ ________________ ________________ ________________Fringe Benefits and Other Benefit Payments . . . . 2,288,857,268 2,427,737,040 2,426,143,561 1,593,479________________ ________________ ________________ ________________Other:
098 Miscellaneous . . . . . . . . . . . . . . . . . . . . 990,101,153 551,022,096 359,640,259 191,381,837Interest on Short-Term Borrowings . . . . 36,458,333 14,394,583 14,373,251 21,332________________ ________________ ________________ ________________
Total Other . . . . . . . . . . . . . . . . . . . 1,026,559,486 565,416,679 374,013,510 191,403,169________________ ________________ ________________ ________________Transfers To Debt Service Funds:
099 Debt Service . . . . . . . . . . . . . . . . . . . . . 1,215,088,490 1,408,355,656 1,356,685,953 51,669,703100 Municipal Assistance Corporation . . . . — 5,000,000 5,000,000 —________________ ________________ ________________ ________________
Total Transfers to Debt Service Funds . . . . . . . . . 1,215,088,490 1,413,355,656 1,361,685,953 51,669,703________________ ________________ ________________ ________________Total Expenditures and Transfers . . . . . . . . . . . . . $39,380,990,628 $41,754,922,563 $40,859,999,758 $ 894,922,805________________ ________________ ________________ ________________________________ ________________ ________________ ________________
174
Comptroller’s Report for Fiscal 2002 Part II-E—General Fund—Schedule G4 (Cont.)
Expenditures and Transfers vs. Budget by Agency
Actual Better (Worse)Budget Expenditures Than Modified__________________________________________________________________________
Adopted Modified and Transfers Budget_________________________________ _________________________________ _________________________________ _________________________________

002 MAYORALTY
Personal Services—020 Office of the Mayor . . . . . . . . . . . . . . . . $ 15,314,713 $ 19,392,631 $ 18,999,710 $ 392,921 040 Office of Management and Budget . . . . 21,449,640 20,676,392 19,457,240 1,219,152 050 Criminal Justice Programs . . . . . . . . . . 2,374,295 2,415,566 2,376,505 39,061 061 Office of Labor Relations . . . . . . . . . . . 6,412,601 6,599,183 6,131,732 467,451 070 New York City Commission to the
United Nations and Consular Corps . . 480,615 536,823 534,642 2,181 080 Adult Literacy Program . . . . . . . . . . . . . 35,618 — — — 260 Office for People with Disability . . . . . 550,177 450,877 355,627 95,250 270 Mayor's Voluntary Action Center . . . . . 293,382 301,810 288,577 13,233 280 Office of Construction . . . . . . . . . . . . . . 1,555,068 1,555,068 428,860 1,126,208 340 Community Assistance Unit . . . . . . . . . 1,673,832 1,718,077 1,714,428 3,649 350 Commission on the Status of Women . . 179,667 167,928 157,103 10,825 380 Office of Operations . . . . . . . . . . . . . . . 4,714,948 4,576,804 4,553,965 22,839 560 Special Enforcement . . . . . . . . . . . . . . . 1,196,582 863,246 811,119 52,127 ________________ ________________ ________________ ________________
Total Personal Services . . . . . . . . . . . . . 56,231,138 59,254,405 55,809,508 3,444,897 ________________ ________________ ________________ ________________Other Than Personal Services—021 Office of the Mayor . . . . . . . . . . . . . . . . 3,139,320 27,017,184 27,002,988 14,196 041 Office of Management and Budget . . . . 7,102,115 6,049,775 5,565,107 484,668 051 Criminal Justice Programs . . . . . . . . . . 4,895,928 16,528,122 12,544,565 3,983,557 062 Office of Labor Relations . . . . . . . . . . . 2,082,019 2,101,940 1,892,697 209,243 071 New York City Commission to the
United Nations and Consular Corps . . 148,454 148,714 147,888 826 081 Adult Literacy Program . . . . . . . . . . . . . 977,993 977,993 977,993 — 261 Office for People with Disability . . . . . 279,975 204,088 194,742 9,346 271 Mayor's Voluntary Action Center . . . . . 17,355 17,975 17,759 216 281 Office of Construction . . . . . . . . . . . . . . 22,883 22,883 21,730 1,153 341 Community Assistance Unit . . . . . . . . . 935,577 5,064,137 4,274,458 789,679 351 Commission on the Status of Women . . 11,363 11,363 11,236 127 381 Office of Operations . . . . . . . . . . . . . . . 1,166,153 965,633 938,005 27,628 561 Special Enforcement . . . . . . . . . . . . . . . 283,448 290,823 274,797 16,026 ________________ ________________ ________________ ________________
Total Other Than Personal Services . . . . . 21,062,583 59,400,630 53,863,965 5,536,665 ________________ ________________ ________________ ________________77,293,721 118,655,035 109,673,473 8,981,562
Interfund Agreements . . . . . . . . . . . . . . (4,045,988) (4,135,988) (2,570,737) (1,565,251)Intracity Sales . . . . . . . . . . . . . . . . . . . . (1,441,784) (2,135,284) (1,502,095) (633,189)________________ ________________ ________________ ________________Total Mayoralty . . . . . . . . . . . . . . . . . . . 71,805,949 112,383,763 105,600,641 6,783,122 Net Change in Estimate of
Prior Payables . . . . . . . . . . . . . . . . . . — — (1,616,189) 1,616,189 ________________ ________________ ________________ ________________Net Total Mayoralty . . . . . . . . . . . . . . . 71,805,949 112,383,763 103,984,452 8,399,311 ________________ ________________ ________________ ________________________________ ________________ ________________ ________________
003 BOARD OF ELECTIONS
001 Personal Services . . . . . . . . . . . . . . . . . . 12,855,487 15,958,194 15,940,005 18,189 002 Other Than Personal Services . . . . . . . . 23,259,923 53,627,347 51,541,788 2,085,559 ________________ ________________ ________________ ________________
Total Board of Elections . . . . . . . . . . . . 36,115,410 69,585,541 67,481,793 2,103,748 Net Change in Estimate of
Prior Payables . . . . . . . . . . . . . . . . . . — — (363) 363 ________________ ________________ ________________ ________________Net Total Board of Elections . . . . . . . . . 36,115,410 69,585,541 67,481,430 2,104,111 ________________ ________________ ________________ ________________________________ ________________ ________________ ________________
175
Comptroller’s Report for Fiscal 2002 Part II-E—General Fund—Schedule G5
Expenditures and Transfers vs. Budget by Unit of Appropriation Within Agency
Actual Better (Worse)Unit of Appropriation Budget Expenditures Than Modified___________________________________________________________________________
Within Agency Adopted Modified and Transfers Budget_____________________________________ _________________________________ _________________________________ _________________________________ _________________________________
(Continued)

004 CAMPAIGN FINANCE BOARD
001 Personal Services . . . . . . . . . . . . . . . . . . $ 4,177,273 $ 3,527,273 $ 3,297,939 $ 229,334 ________________ ________________ ________________ ________________Other Than Personal Services—002 Other Than Personal Services . . . . . . . . 9,724,810 8,046,832 6,987,643 1,059,189 003 Election Funding . . . . . . . . . . . . . . . . . . 63,300,000 38,214,688 38,214,688 — ________________ ________________ ________________ ________________
Total Other Than Personal Services . . . 73,024,810 46,261,520 45,202,331 1,059,189 ________________ ________________ ________________ ________________Total Campaign Finance Board . . . . . . . 77,202,083 49,788,793 48,500,270 1,288,523 ________________ ________________ ________________ ________________________________ ________________ ________________ ________________
008 OFFICE OF THE ACTUARY
100 Personal Services . . . . . . . . . . . . . . . . . . 2,758,766 2,362,766 2,338,993 23,773 200 Other Than Personal Services . . . . . . . . 1,062,192 972,192 809,932 162,260 ________________ ________________ ________________ ________________
Total Office of the Actuary . . . . . . . . . . 3,820,958 3,334,958 3,148,925 186,033 ________________ ________________ ________________ ________________________________ ________________ ________________ ________________010 BOROUGH PRESIDENT—MANHATTAN
001 Personal Services . . . . . . . . . . . . . . . . . . 4,350,613 4,208,327 4,207,913 414 002 Other Than Personal Services . . . . . . . . 972,072 840,967 819,397 21,570 ________________ ________________ ________________ ________________
Total Borough President—Manhattan . . 5,322,685 5,049,294 5,027,310 21,984 Net Change in Estimate of
Prior Payables . . . . . . . . . . . . . . . . . . — — (48) 48 ________________ ________________ ________________ ________________Net Total Borough President-Manhattan 5,322,685 5,049,294 5,027,262 22,032 ________________ ________________ ________________ ________________________________ ________________ ________________ ________________
011 BOROUGH PRESIDENT—BRONX
001 Personal Services . . . . . . . . . . . . . . . . . . 5,600,550 5,620,425 5,470,418 150,007 002 Other Than Personal Services . . . . . . . . 1,901,681 1,628,927 1,473,762 155,165 ________________ ________________ ________________ ________________
Total Borough President—Bronx . . . . . 7,502,231 7,249,352 6,944,180 305,172 Net Change in Estimate of
Prior Payables . . . . . . . . . . . . . . . . . . — — 940 (940)________________ ________________ ________________ ________________Net Total Borough President-Bronx . . . 7,502,231 7,249,352 6,945,120 304,232 ________________ ________________ ________________ ________________________________ ________________ ________________ ________________
012 BOROUGH PRESIDENT—BROOKLYN
001 Personal Services . . . . . . . . . . . . . . . . . . 4,910,150 4,986,164 4,426,109 560,055 002 Other Than Personal Services . . . . . . . . 1,589,859 1,729,979 1,664,322 65,657 ________________ ________________ ________________ ________________
Total Borough President—Brooklyn . . . 6,500,009 6,716,143 6,090,431 625,712 Net Change in Estimate of
Prior Payables . . . . . . . . . . . . . . . . . . — — (25,100) 25,100 ________________ ________________ ________________ ________________Net Total Borough President—
Brooklyn . . . . . . . . . . . . . . . . . . . . . . 6,500,009 6,716,143 6,065,331 650,812 ________________ ________________ ________________ ________________________________ ________________ ________________ ________________013 BOROUGH PRESIDENT—QUEENS
001 Personal Services . . . . . . . . . . . . . . . . . . 4,710,834 4,875,971 4,857,338 18,633 002 Other Than Personal Services . . . . . . . . 1,484,893 1,470,715 1,433,052 37,663 ________________ ________________ ________________ ________________
Total Borough President—Queens . . . . 6,195,727 6,346,686 6,290,390 56,296 ________________ ________________ ________________ ________________________________ ________________ ________________ ________________014 BOROUGH PRESIDENT—STATEN ISLAND
001 Personal Services . . . . . . . . . . . . . . . . . . 3,797,244 3,467,023 3,436,492 30,531 002 Other Than Personal Services . . . . . . . . 1,412,705 1,380,954 1,351,311 29,643 ________________ ________________ ________________ ________________
Total Borough President-Staten Island . 5,209,949 4,847,977 4,787,803 60,174 Net Change in Estimate of
Prior Payables . . . . . . . . . . . . . . . . . . — — (237) 237 ________________ ________________ ________________ ________________Net Total Borough President—
Staten Island . . . . . . . . . . . . . . . . . . . 5,209,949 4,847,977 4,787,566 60,411 ________________ ________________ ________________ ________________________________ ________________ ________________ ________________
176
Comptroller’s Report for Fiscal 2002 Part II-E—General Fund—Schedule G5 (Cont.)
Expenditures and Transfers vs. Budget by Unit of Appropriation Within Agency
Actual Better (Worse)Unit of Appropriation Budget Expenditures Than Modified___________________________________________________________________________
Within Agency Adopted Modified and Transfers Budget_____________________________________ _________________________________ _________________________________ _________________________________ _________________________________
(Continued)

015 OFFICE OF THE COMPTROLLER
Personal Services—001 Executive Management . . . . . . . . . . . . . $ 2,755,038 $ 3,237,512 $ 3,237,404 $ 108 002 First Deputy Comptroller . . . . . . . . . . . 26,652,550 29,725,109 29,723,149 1,960 003 Second Deputy Comptroller . . . . . . . . . 8,623,853 8,610,034 8,608,191 1,843 004 Third Deputy Comptroller . . . . . . . . . . . 3,492,761 4,063,169 4,063,164 5 ________________ ________________ ________________ ________________
Total Personal Services . . . . . . . . . . . . . 41,524,202 45,635,824 45,631,908 3,916 ________________ ________________ ________________ ________________Other Than Personal Services—005 First Deputy Comptroller . . . . . . . . . . . 3,468,453 3,155,808 3,088,013 67,795 006 Executive Management . . . . . . . . . . . . . 148,916 106,410 97,900 8,510 007 Second Deputy Comptroller . . . . . . . . . 4,507,492 4,505,867 3,384,040 1,121,827 008 Third Deputy Comptroller . . . . . . . . . . . 5,401,000 5,474,048 5,400,351 73,697 ________________ ________________ ________________ ________________
Total Other Than Personal Services . . . 13,525,861 13,242,133 11,970,304 1,271,829 ________________ ________________ ________________ ________________55,050,063 58,877,957 57,602,212 1,275,745
Interfund Agreements . . . . . . . . . . . . . . (2,527,308) (2,527,308) (2,858,394) 331,086 Intracity Sales . . . . . . . . . . . . . . . . . . . . (212,854) (270,054) (270,054) — ________________ ________________ ________________ ________________Total Office of the Comptroller . . . . . . . 52,309,901 56,080,595 54,473,764 1,606,831 Net Change in Estimate of
Prior Payables . . . . . . . . . . . . . . . . . . — — (3,914,571) 3,914,571 ________________ ________________ ________________ ________________Net Total Office of the Comptroller . . . 52,309,901 56,080,595 50,559,193 5,521,402 ________________ ________________ ________________ ________________________________ ________________ ________________ ________________
021 TAX COMMISSION
001 Personal Services . . . . . . . . . . . . . . . . . . 2,073,165 1,943,165 1,905,220 37,945 002 Other Than Personal Services . . . . . . . . 120,004 100,004 86,606 13,398 ________________ ________________ ________________ ________________
Total Tax Commission . . . . . . . . . . . . . . 2,193,169 2,043,169 1,991,826 51,343 Net Change in Estimate of
Prior Payables . . . . . . . . . . . . . . . . . . — — (32,836) 32,836 ________________ ________________ ________________ ________________Net Total Tax Commission . . . . . . . . . . 2,193,169 2,043,169 1,958,990 84,179 ________________ ________________ ________________ ________________________________ ________________ ________________ ________________
025 LAW DEPARTMENT
001 Personal Services . . . . . . . . . . . . . . . . . . 75,898,228 75,281,429 75,280,738 691 002 Other Than Personal Services . . . . . . . . 22,321,735 21,363,586 20,977,467 386,119 ________________ ________________ ________________ ________________
98,219,963 96,645,015 96,258,205 386,810 Interfund Agreements . . . . . . . . . . . . . . (1,751,464) (1,751,464) (1,751,464) — Intracity Sales . . . . . . . . . . . . . . . . . . . . (2,475,134) (2,475,134) (2,680,088) 204,954 ________________ ________________ ________________ ________________Total Law Department . . . . . . . . . . . . . . 93,993,365 92,418,417 91,826,653 591,764 Net Change in Estimate of
Prior Payables . . . . . . . . . . . . . . . . . . — — (614,698) 614,698 ________________ ________________ ________________ ________________Net Total Law Department . . . . . . . . . . 93,993,365 92,418,417 91,211,955 1,206,462 ________________ ________________ ________________ ________________________________ ________________ ________________ ________________
030 DEPARTMENT OF CITY PLANNING
Personal Services—001 Personal Services . . . . . . . . . . . . . . . . . . 13,953,252 15,173,942 14,969,321 204,621 003 Geographic Systems . . . . . . . . . . . . . . . 1,932,113 1,705,301 1,705,243 58 ________________ ________________ ________________ ________________
Total Personal Services . . . . . . . . . . . . . 15,885,365 16,879,243 16,674,564 204,679 ________________ ________________ ________________ ________________
177
Comptroller’s Report for Fiscal 2002 Part II-E—General Fund—Schedule G5 (Cont.)
Expenditures and Transfers vs. Budget by Unit of Appropriation Within Agency
Actual Better (Worse)Unit of Appropriation Budget Expenditures Than Modified___________________________________________________________________________
Within Agency Adopted Modified and Transfers Budget_____________________________________ _________________________________ _________________________________ _________________________________ _________________________________
(Continued)

030 DEPARTMENT OF CITY PLANNING (cont.)Other Than Personal Services—002 Other Than Personal Services . . . . . . . . $ 1,739,594 $ 2,053,573 $ 1,771,803 $ 281,770 004 Geographic Systems . . . . . . . . . . . . . . . 297,688 339,323 307,345 31,978 ________________ ________________ ________________ ________________
Total Other Than Personal Services . . . 2,037,282 2,392,896 2,079,148 313,748 __________________________ __________________________ __________________________ ________________Total Department of City Planning . . . . 17,922,647 19,272,139 18,753,712 518,427 Net Change in Estimate of
Prior Payables . . . . . . . . . . . . . . . . . . — — (22,755) 22,755 __________________________ __________________________ __________________________ ________________Net Total Department of City Planning . 17,922,647 19,272,139 18,730,957 541,182 __________________________ __________________________ __________________________ __________________________________________ __________________________ __________________________ ________________
032 DEPARTMENT OF INVESTIGATION
Personal Services—001 Personal Services . . . . . . . . . . . . . . . . . . 16,929,275 16,400,542 16,400,541 1 003 Inspector General . . . . . . . . . . . . . . . . . 2,081,835 2,455,240 2,419,726 35,514 __________________________ __________________________ __________________________ ________________
Total Personal Services . . . . . . . . . . . . . 19,011,110 18,855,782 18,820,267 35,515 __________________________ __________________________ __________________________ ________________Other Than Personal Services—002 Other Than Personal Services . . . . . . . . 4,530,223 4,276,529 4,226,220 50,309 004 Inspector General . . . . . . . . . . . . . . . . . 91,501 91,961 91,876 85 __________________________ __________________________ __________________________ ________________
Total Other Than Personal Services . . . 4,621,724 4,368,490 4,318,096 50,394 __________________________ __________________________ __________________________ ________________23,632,834 23,224,272 23,138,363 85,909
Intracity Sales . . . . . . . . . . . . . . . . . . . . (2,046,430) (2,419,835) (2,274,335) (145,500)__________________________ __________________________ __________________________ ________________Total Department of Investigation . . . . . 21,586,404 20,804,437 20,864,028 (59,591)Net Change in Estimate of
Prior Payables . . . . . . . . . . . . . . . . . . — — (1,949) 1,949 __________________________ __________________________ __________________________ ________________Net Total Department of Investigation . 21,586,404 20,804,437 20,862,079 (57,642)__________________________ __________________________ __________________________ __________________________________________ __________________________ __________________________ ________________
035 RESEARCH LIBRARIES
001 Lump Sum . . . . . . . . . . . . . . . . . . . . . . . 9,963,794 9,238,248 9,198,396 39,852 __________________________ __________________________ __________________________ ________________Total Research Libraries . . . . . . . . . . . . 9,963,794 9,238,248 9,198,396 39,852 __________________________ __________________________ __________________________ __________________________________________ __________________________ __________________________ ________________
037 NEW YORK PUBLIC LIBRARY
Other Than Personal Services—003 Lump Sum—Borough of Manhattan . . . 22,935,206 19,509,282 19,509,280 2 004 Lump Sum—Borough of the Bronx . . . 2,700,597 2,925,597 2,925,597 — 005 Lump Sum—Borough of Staten Island . 1,642,546 1,740,546 1,711,832 28,714 006 Systemwide Services . . . . . . . . . . . . . . . 21,025,297 21,294,297 21,294,297 — 007 Consultant and Advisory Services . . . . . 1,449,286 1,464,360 1,464,360 — __________________________ __________________________ __________________________ ________________
Total New York Public Library . . . . . . . 49,752,932 46,934,082 46,905,366 28,716 __________________________ __________________________ __________________________ __________________________________________ __________________________ __________________________ ________________038 BROOKLYN PUBLIC LIBRARY
001 Lump Sum . . . . . . . . . . . . . . . . . . . . . . . 36,676,181 34,858,512 34,764,297 94,215 __________________________ __________________________ __________________________ ________________Total Brooklyn Public Library . . . . . . . 36,676,181 34,858,512 34,764,297 94,215 __________________________ __________________________ __________________________ __________________________________________ __________________________ __________________________ ________________
039 QUEENS BOROUGH PUBLIC LIBRARY
001 Lump Sum . . . . . . . . . . . . . . . . . . . . . . . 35,040,167 32,999,400 32,940,011 59,389 __________________________ __________________________ __________________________ ________________Total Queens Borough Public Library . . 35,040,167 32,999,400 32,940,011 59,389 __________________________ __________________________ __________________________ __________________________________________ __________________________ __________________________ ________________
178
Comptroller’s Report for Fiscal 2002 Part II-E—General Fund—Schedule G5 (Cont.)
Expenditures and Transfers vs. Budget by Unit of Appropriation Within Agency
Actual Better (Worse)Unit of Appropriation Budget Expenditures Than Modified___________________________________________________________________________
Within Agency Adopted Modified and Transfers Budget_____________________________________ _________________________________ _________________________________ _________________________________ _________________________________
(Continued)

040 BOARD OF EDUCATION
Personal Services—301 District Instruction and Instruction
Support Services . . . . . . . . . . . . . . . . $ 2,245,590,818 $ 2,377,000,478 $ 2,395,442,803 $ (18,442,325)303 District Special Education Instruction
Services . . . . . . . . . . . . . . . . . . . . . . . 513,309,629 429,049,937 429,399,755 (349,818)305 District Operations and
Administration . . . . . . . . . . . . . . . . . . 202,169,141 118,982,974 118,850,820 132,154 311 High School Instruction and Instruction
Support Services . . . . . . . . . . . . . . . . 949,002,860 933,779,915 934,324,667 (544,752)313 High School Special Education
Instruction Services . . . . . . . . . . . . . . 205,601,157 186,954,906 186,954,906 — 315 High School Operations and
Administration . . . . . . . . . . . . . . . . . . 111,510,574 123,846,962 123,900,611 (53,649)321 Special Education City Wide Instruction
and Instruction Support Services . . . . 394,136,467 403,703,805 401,639,666 2,064,139 323 Division of Special Education and
Instruction Support Services . . . . . . . 201,947,854 209,867,656 216,955,223 (7,087,567)325 Division of Special Education, Operation
and Administration . . . . . . . . . . . . . . 42,415,010 33,219,868 34,758,076 (1,538,208)327 Special Education Operation and
Administration—City Wide . . . . . . . 37,644,733 26,850,549 27,005,704 (155,155)335 School Facilities—Custodial
Maintenance . . . . . . . . . . . . . . . . . . . 384,139,653 373,322,984 373,322,985 (1)339 School Food Services . . . . . . . . . . . . . . 154,058,880 155,985,912 161,021,565 (5,035,653)341 School Safety . . . . . . . . . . . . . . . . . . . . . 1,997 1,997 — 1,997 353 Central Administration . . . . . . . . . . . . . 50,549,904 102,288,963 113,559,342 (11,270,379)361 Fringe Benefits . . . . . . . . . . . . . . . . . . . 1,304,034,443 1,365,316,961 1,321,617,396 43,699,565 391 Collective Bargaining . . . . . . . . . . . . . . 466,789,154 402,898,237 402,898,237 — __________________________ __________________________ __________________________ ________________
Total Personal Services . . . . . . . . . . . . . 7,262,902,274 7,243,072,104 7,241,651,756 1,420,348 __________________________ __________________________ __________________________ ________________Other Than Personal Services—302 District Instruction and Instruction
Support Services . . . . . . . . . . . . . . . . 239,813,813 218,561,328 209,385,177 9,176,151 304 District Special Education Instruction
Services . . . . . . . . . . . . . . . . . . . . . . . 10,684,657 1,086,783 1,035,779 51,004 306 District Operations and Administration . 4,701,439 6,705,016 4,235,900 2,469,116 312 High School Instruction and Instruction
Support Services . . . . . . . . . . . . . . . . 119,614,085 115,384,953 110,768,241 4,616,712 314 High School Special Education
Instruction Services . . . . . . . . . . . . . . 3,696,827 2,360,482 2,671,131 (310,649)316 High School Operations and
Administration . . . . . . . . . . . . . . . . . . 642,565 836,565 524,230 312,335 322 Special Education City Wide Instruction
and Instruction Support Services . . . . 12,202,574 19,169,839 15,416,531 3,753,308 324 Division of Special Education
Instruction Support Services . . . . . . . 65,599,946 91,701,970 98,629,623 (6,927,653)326 Division of Special Education Operation
and Administration . . . . . . . . . . . . . . 3,453,907 24,920,205 22,074,786 2,845,419
179
Comptroller’s Report for Fiscal 2002 Part II-E—General Fund—Schedule G5 (Cont.)
Expenditures and Transfers vs. Budget by Unit of Appropriation Within Agency
Actual Better (Worse)Unit of Appropriation Budget Expenditures Than Modified___________________________________________________________________________
Within Agency Adopted Modified and Transfers Budget_____________________________________ _________________________________ _________________________________ _________________________________ _________________________________
(Continued)
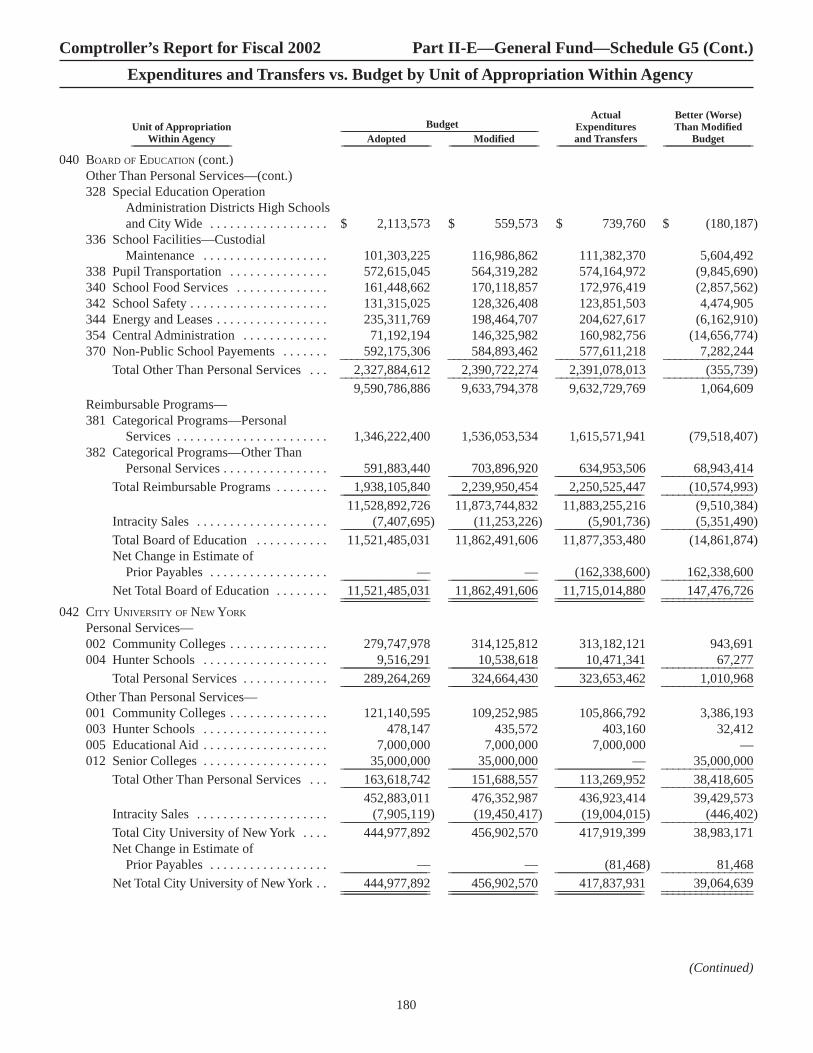
040 BOARD OF EDUCATION (cont.)Other Than Personal Services—(cont.)328 Special Education Operation
Administration Districts High Schools and City Wide . . . . . . . . . . . . . . . . . . $ 2,113,573 $ 559,573 $ 739,760 $ (180,187)
336 School Facilities—Custodial Maintenance . . . . . . . . . . . . . . . . . . . 101,303,225 116,986,862 111,382,370 5,604,492
338 Pupil Transportation . . . . . . . . . . . . . . . 572,615,045 564,319,282 574,164,972 (9,845,690)340 School Food Services . . . . . . . . . . . . . . 161,448,662 170,118,857 172,976,419 (2,857,562)342 School Safety . . . . . . . . . . . . . . . . . . . . . 131,315,025 128,326,408 123,851,503 4,474,905 344 Energy and Leases . . . . . . . . . . . . . . . . . 235,311,769 198,464,707 204,627,617 (6,162,910)354 Central Administration . . . . . . . . . . . . . 71,192,194 146,325,982 160,982,756 (14,656,774)370 Non-Public School Payements . . . . . . . 592,175,306 584,893,462 577,611,218 7,282,244 ________________ ________________ ________________ ________________
Total Other Than Personal Services . . . 2,327,884,612 2,390,722,274 2,391,078,013 (355,739)________________ ________________ ________________ ________________9,590,786,886 9,633,794,378 9,632,729,769 1,064,609
Reimbursable Programs—381 Categorical Programs—Personal
Services . . . . . . . . . . . . . . . . . . . . . . . 1,346,222,400 1,536,053,534 1,615,571,941 (79,518,407)382 Categorical Programs—Other Than
Personal Services . . . . . . . . . . . . . . . . 591,883,440 703,896,920 634,953,506 68,943,414 __________________________ __________________________ __________________________ ________________Total Reimbursable Programs . . . . . . . . 1,938,105,840 2,239,950,454 2,250,525,447 (10,574,993)__________________________ __________________________ __________________________ ________________
11,528,892,726 11,873,744,832 11,883,255,216 (9,510,384)Intracity Sales . . . . . . . . . . . . . . . . . . . . (7,407,695) (11,253,226) (5,901,736) (5,351,490)__________________________ __________________________ __________________________ ________________Total Board of Education . . . . . . . . . . . 11,521,485,031 11,862,491,606 11,877,353,480 (14,861,874)Net Change in Estimate of
Prior Payables . . . . . . . . . . . . . . . . . . — — (162,338,600) 162,338,600 __________________________ __________________________ __________________________ ________________Net Total Board of Education . . . . . . . . 11,521,485,031 11,862,491,606 11,715,014,880 147,476,726 __________________________ __________________________ __________________________ __________________________________________ __________________________ __________________________ ________________
042 CITY UNIVERSITY OF NEW YORK
Personal Services—002 Community Colleges . . . . . . . . . . . . . . . 279,747,978 314,125,812 313,182,121 943,691 004 Hunter Schools . . . . . . . . . . . . . . . . . . . 9,516,291 10,538,618 10,471,341 67,277 __________________________ __________________________ __________________________ ________________
Total Personal Services . . . . . . . . . . . . . 289,264,269 324,664,430 323,653,462 1,010,968 __________________________ __________________________ __________________________ ________________Other Than Personal Services—001 Community Colleges . . . . . . . . . . . . . . . 121,140,595 109,252,985 105,866,792 3,386,193 003 Hunter Schools . . . . . . . . . . . . . . . . . . . 478,147 435,572 403,160 32,412 005 Educational Aid . . . . . . . . . . . . . . . . . . . 7,000,000 7,000,000 7,000,000 — 012 Senior Colleges . . . . . . . . . . . . . . . . . . . 35,000,000 35,000,000 — 35,000,000 __________________________ __________________________ __________________________ ________________
Total Other Than Personal Services . . . 163,618,742 151,688,557 113,269,952 38,418,605 __________________________ __________________________ __________________________ ________________452,883,011 476,352,987 436,923,414 39,429,573
Intracity Sales . . . . . . . . . . . . . . . . . . . . (7,905,119) (19,450,417) (19,004,015) (446,402)__________________________ __________________________ __________________________ ________________Total City University of New York . . . . 444,977,892 456,902,570 417,919,399 38,983,171 Net Change in Estimate of
Prior Payables . . . . . . . . . . . . . . . . . . — — (81,468) 81,468 __________________________ __________________________ __________________________ ________________Net Total City University of New York . . 444,977,892 456,902,570 417,837,931 39,064,639 __________________________ __________________________ __________________________ __________________________________________ __________________________ __________________________ ________________
180
Comptroller’s Report for Fiscal 2002 Part II-E—General Fund—Schedule G5 (Cont.)
Expenditures and Transfers vs. Budget by Unit of Appropriation Within Agency
Actual Better (Worse)Unit of Appropriation Budget Expenditures Than Modified___________________________________________________________________________
Within Agency Adopted Modified and Transfers Budget_____________________________________ _________________________________ _________________________________ _________________________________ _________________________________
(Continued)

054 CIVILIAN COMPLAINT REVIEW BOARD
001 Personal Services . . . . . . . . . . . . . . . . . . $ 8,788,347 $ 7,797,347 $ 7,737,424 $ 59,923 002 Other Than Personal Services . . . . . . . . 2,220,872 1,631,234 1,591,975 39,259 __________________________ __________________________ __________________________ ________________
Total Civilian Complaint Review Board . 11,009,219 9,428,581 9,329,399 99,182 Net Change in Estimate of
Prior Payables . . . . . . . . . . . . . . . . . . — — (850) 850 __________________________ __________________________ __________________________ ________________Net Total Civilian Complaint
Review Board . . . . . . . . . . . . . . . . . . 11,009,219 9,428,581 9,328,549 100,032 __________________________ __________________________ __________________________ __________________________________________ __________________________ __________________________ ________________056 POLICE DEPARTMENT
Personal Services—001 Operations . . . . . . . . . . . . . . . . . . . . . . . 2,309,771,989 2,605,748,478 2,535,238,135 70,510,343 002 Executive Management . . . . . . . . . . . . . 149,769,815 168,114,754 167,855,597 259,157 003 School Safety . . . . . . . . . . . . . . . . . . . . . 96,933,983 135,623,723 135,623,723 — 004 Administration—Personnel . . . . . . . . . . 158,625,762 173,052,207 172,597,660 454,547 006 Criminal Justice . . . . . . . . . . . . . . . . . . . 64,304,398 102,842,426 102,842,362 64 007 Traffic Enforcement . . . . . . . . . . . . . . . 59,955,775 80,496,629 71,766,017 8,730,612 008 Transit Police . . . . . . . . . . . . . . . . . . . . . 168,719,447 168,909,651 166,407,427 2,502,224 009 Housing Police . . . . . . . . . . . . . . . . . . . 102,701,244 113,143,908 113,143,272 636 __________________________ __________________________ __________________________ ________________
Total Personal Services . . . . . . . . . . . . . 3,110,782,413 3,547,931,776 3,465,474,193 82,457,583 __________________________ __________________________ __________________________ ________________Other Than Personal Services—100 Operations . . . . . . . . . . . . . . . . . . . . . . . 41,653,337 65,452,745 66,438,515 (985,770)200 Executive Management . . . . . . . . . . . . . 9,454,475 16,532,838 14,650,452 1,882,386 300 School Safety . . . . . . . . . . . . . . . . . . . . . 2,483,910 4,664,075 3,693,076 970,999 400 Administration . . . . . . . . . . . . . . . . . . . . 118,881,197 162,475,797 149,577,486 12,898,311 600 Criminal Justice . . . . . . . . . . . . . . . . . . . 8,059,693 6,469,460 4,614,350 1,855,110 700 Traffic Enforcement . . . . . . . . . . . . . . . 1,979,859 2,527,989 2,261,506 266,483 __________________________ __________________________ __________________________ ________________
Total Other Than Personal Services . . . 182,512,471 258,122,904 241,235,385 16,887,519 __________________________ __________________________ __________________________ ________________3,293,294,884 3,806,054,680 3,706,709,578 99,345,102
Interfund Agreements . . . . . . . . . . . . . . (1,796,999) (1,796,999) (1,796,999) — Intracity Sales . . . . . . . . . . . . . . . . . . . . (88,785,504) (124,849,646) (124,253,069) (596,577)__________________________ __________________________ __________________________ ________________Total Police Department . . . . . . . . . . . . 3,202,712,381 3,679,408,035 3,580,659,510 98,748,525 Net Change in Estimate of
Prior Payables . . . . . . . . . . . . . . . . . . — — (3,998,010) 3,998,010 __________________________ __________________________ __________________________ ________________Net Total Police Department . . . . . . . . . 3,202,712,381 3,679,408,035 3,576,661,500 102,746,535 __________________________ __________________________ __________________________ __________________________________________ __________________________ __________________________ ________________
057 FIRE DEPARTMENT
Personal Services—001 Executive Administrative . . . . . . . . . . . . 53,875,569 116,485,024 115,693,486 791,538 002 Fire Extinguishment and Emergency
Response . . . . . . . . . . . . . . . . . . . . . . 767,988,565 828,173,414 845,687,010 (17,513,596)003 Fire Investigation . . . . . . . . . . . . . . . . . . 16,537,036 16,966,672 16,929,141 37,531 004 Fire Prevention . . . . . . . . . . . . . . . . . . . 38,674,954 17,022,346 16,885,424 136,922 009 Emergency Medical Services . . . . . . . . 141,767,670 140,238,864 139,804,826 434,038 __________________________ __________________________ __________________________ ________________
Total Personal Services . . . . . . . . . . . . . 1,018,843,794 1,118,886,320 1,134,999,887 (16,113,567)__________________________ __________________________ __________________________ ________________Other Than Personal Services—005 Executive Administrative . . . . . . . . . . . . 47,492,586 89,996,434 92,781,354 (2,784,920)006 Fire Extinguishment and Emergency
Response . . . . . . . . . . . . . . . . . . . . . . 20,745,783 20,155,645 22,105,193 (1,949,548)
181
Comptroller’s Report for Fiscal 2002 Part II-E—General Fund—Schedule G5 (Cont.)
Expenditures and Transfers vs. Budget by Unit of Appropriation Within Agency
Actual Better (Worse)Unit of Appropriation Budget Expenditures Than Modified___________________________________________________________________________
Within Agency Adopted Modified and Transfers Budget_____________________________________ _________________________________ _________________________________ _________________________________ _________________________________
(Continued)

057 FIRE DEPARTMENT (cont.)Other Than Personal Services—(cont.)007 Fire Investigation . . . . . . . . . . . . . . . . . . $ 82,220 $ 82,220 $ 74,980 $ 7,240 008 Fire Prevention . . . . . . . . . . . . . . . . . . . 3,106,013 1,334,896 1,317,531 17,365 010 Emergency Medical Services . . . . . . . . 16,057,288 15,119,318 15,137,010 (17,692)__________________________ __________________________ __________________________ ________________
Total Other Than Personal Services . . . 87,483,890 126,688,513 131,416,068 (4,727,555)__________________________ __________________________ __________________________ ________________1,106,327,684 1,245,574,833 1,266,415,955 (20,841,122)
Intracity Sales . . . . . . . . . . . . . . . . . . . . — (60,000) (60,000) — __________________________ __________________________ __________________________ ________________Total Fire Department . . . . . . . . . . . . . . 1,106,327,684 1,245,514,833 1,266,355,955 (20,841,122)Net Change in Estimate of
Prior Payables . . . . . . . . . . . . . . . . . . — — (175,874) 175,874 __________________________ __________________________ __________________________ ________________Net Total Fire Department . . . . . . . . . . . 1,106,327,684 1,245,514,833 1,266,180,081 (20,665,248)__________________________ __________________________ __________________________ __________________________________________ __________________________ __________________________ ________________
068 ADMINISTRATION FOR CHILDREN’S SERVICES
Personal Services—001 Personal Services . . . . . . . . . . . . . . . . . . 253,059,880 245,714,145 245,538,700 175,445 003 Administration of Headstart, Daycare
and Child Support Enforcement Programs . . . . . . . . . . . . . . . . . . . . . . 42,183,829 43,321,430 43,321,430 —
005 Administrative . . . . . . . . . . . . . . . . . . . . 92,239,803 79,203,068 79,203,068 — __________________________ __________________________ __________________________ ________________Total Personal Services . . . . . . . . . . . . . 387,483,512 368,238,643 368,063,198 175,445 __________________________ __________________________ __________________________ ________________
Other Than Personal Services—002 Other Than Personal Services . . . . . . . . 100,178,138 90,050,563 82,074,597 7,975,966 004 Administration of Headstart, Daycare
and Child Support Enforcement Programs . . . . . . . . . . . . . . . . . . . . . . 702,194,593 647,418,599 630,571,800 16,846,799
006 Child Welfare . . . . . . . . . . . . . . . . . . . . . 1,247,907,178 1,304,827,726 1,294,373,652 10,454,074 __________________________ __________________________ __________________________ ________________Total Other Than Personal Services . . . 2,050,279,909 2,042,296,888 2,007,020,049 35,276,839 __________________________ __________________________ __________________________ ________________
2,437,763,421 2,410,535,531 2,375,083,247 35,452,284 Intracity Sales . . . . . . . . . . . . . . . . . . . . (149,870) (530,495) (285,219) (245,276)__________________________ __________________________ __________________________ ________________Total Administration for Children’s
Services . . . . . . . . . . . . . . . . . . . . . . . 2,437,613,551 2,410,005,036 2,374,798,028 35,207,008 Net Change in Estimate of
Prior Payables . . . . . . . . . . . . . . . . . . — — (56,519,948) 56,519,948 __________________________ __________________________ __________________________ ________________Net Total Administration for
Children’s Services . . . . . . . . . . . . . . 2,437,613,551 2,410,005,036 2,318,278,080 91,726,956 __________________________ __________________________ __________________________ __________________________________________ __________________________ __________________________ ________________069 DEPARTMENT OF SOCIAL SERVICES
Personal Services—201 Administration . . . . . . . . . . . . . . . . . . . . 143,403,554 168,608,360 168,608,359 1 203 Public Assistance . . . . . . . . . . . . . . . . . . 293,516,735 246,703,687 246,668,336 35,351 204 Medical Assistance . . . . . . . . . . . . . . . . 83,225,676 96,472,199 96,472,199 — 205 Adult Services . . . . . . . . . . . . . . . . . . . . 69,648,058 73,354,751 73,354,751 — __________________________ __________________________ __________________________ ________________
Total Personal Services . . . . . . . . . . . . . 589,794,023 585,138,997 585,103,645 35,352 __________________________ __________________________ __________________________ ________________Other Than Personal Services—101 Administration . . . . . . . . . . . . . . . . . . . . 136,660,863 206,696,360 206,393,303 303,057 103 Public Assistance . . . . . . . . . . . . . . . . . . 1,842,658,363 1,777,045,203 1,773,625,408 3,419,795
182
Comptroller’s Report for Fiscal 2002 Part II-E—General Fund—Schedule G5 (Cont.)
Expenditures and Transfers vs. Budget by Unit of Appropriation Within Agency
Actual Better (Worse)Unit of Appropriation Budget Expenditures Than Modified___________________________________________________________________________
Within Agency Adopted Modified and Transfers Budget_____________________________________ _________________________________ _________________________________ _________________________________ _________________________________
(Continued)

069 DEPARTMENT OF SOCIAL SERVICES (cont.)Other Than Personal Services—(cont.)104 Medical Assistance . . . . . . . . . . . . . . . . $ 2,884,744,563 $ 3,180,954,837 $ 3,204,353,720 $ (23,398,883)105 Adult Services . . . . . . . . . . . . . . . . . . . . 199,091,979 203,149,297 203,149,297 — __________________________ __________________________ __________________________ ________________
Total Other Than Personal Services . . . 5,063,155,768 5,367,845,697 5,387,521,728 (19,676,031)__________________________ __________________________ __________________________ ________________5,652,949,791 5,952,984,694 5,972,625,373 (19,640,679)
Intracity Sales . . . . . . . . . . . . . . . . . . . . (75,478) (808,643) (733,165) (75,478)__________________________ __________________________ __________________________ ________________Total Department of Social Services . . . 5,652,874,313 5,952,176,051 5,971,892,208 (19,716,157)Net Change in Estimate of
Prior Payables . . . . . . . . . . . . . . . . . . — — (43,566,406) 43,566,406 __________________________ __________________________ __________________________ ________________Net Total Department of
Social Services . . . . . . . . . . . . . . . . . 5,652,874,313 5,952,176,051 5,928,325,802 23,850,249 __________________________ __________________________ __________________________ __________________________________________ __________________________ __________________________ ________________071 DEPARTMENT OF HOMELESS SERVICES
100 Personal Services . . . . . . . . . . . . . . . . . . 95,720,607 96,887,784 96,887,783 1 200 Department of Homeless Services . . . . 401,284,667 446,487,644 443,471,516 3,016,128 __________________________ __________________________ __________________________ ________________
497,005,274 543,375,428 540,359,299 3,016,129 Intracity Sales . . . . . . . . . . . . . . . . . . . . — (15,840,118) (13,404,171) (2,435,947)__________________________ __________________________ __________________________ ________________Total Department of Homeless Services . 497,005,274 527,535,310 526,955,128 580,182 Net Change in Estimate of
Prior Payables . . . . . . . . . . . . . . . . . . — — (23,517,497) 23,517,497 __________________________ __________________________ __________________________ ________________Net Total Department of Homeless
Services . . . . . . . . . . . . . . . . . . . . . . . 497,005,274 527,535,310 503,437,631 24,097,679 __________________________ __________________________ __________________________ __________________________________________ __________________________ __________________________ ________________072 DEPARTMENT OF CORRECTION
Personal Services—001 Administration . . . . . . . . . . . . . . . . . . . . 42,046,170 44,853,847 44,671,453 182,394 002 Operations . . . . . . . . . . . . . . . . . . . . . . . 713,176,805 738,387,210 738,212,606 174,604 __________________________ __________________________ __________________________ ________________
Total Personal Services . . . . . . . . . . . . . 755,222,975 783,241,057 782,884,059 356,998 __________________________ __________________________ __________________________ ________________Other Than Personal Services—003 Operations . . . . . . . . . . . . . . . . . . . . . . . 101,137,480 92,378,667 89,422,868 2,955,799 004 Administration . . . . . . . . . . . . . . . . . . . . 15,041,873 15,041,873 14,446,760 595,113 __________________________ __________________________ __________________________ ________________
Total Other Than Personal Services . . . 116,179,353 107,420,540 103,869,628 3,550,912 __________________________ __________________________ __________________________ ________________871,402,328 890,661,597 886,753,687 3,907,910
Intracity Sales . . . . . . . . . . . . . . . . . . . . (754,770) (904,770) (395,505) (509,265)__________________________ __________________________ __________________________ ________________Total Department of Correction . . . . . . 870,647,558 889,756,827 886,358,182 3,398,645 Net Change in Estimate of
Prior Payables . . . . . . . . . . . . . . . . . . — — (4,481,114) 4,481,114 __________________________ __________________________ __________________________ ________________Net Total Department of Correction . . . 870,647,558 889,756,827 881,877,068 7,879,759 __________________________ __________________________ __________________________ __________________________________________ __________________________ __________________________ ________________
073 BOARD OF CORRECTION
001 Personal Services . . . . . . . . . . . . . . . . . . 991,020 891,836 868,892 22,944 002 Other Than Personal Services . . . . . . . . 40,223 40,223 37,465 2,758 __________________________ __________________________ __________________________ ________________
Total Board of Correction . . . . . . . . . . . 1,031,243 932,059 906,357 25,702 __________________________ __________________________ __________________________ __________________________________________ __________________________ __________________________ ________________094 DEPARTMENT OF EMPLOYMENT
Personal Services—001 Personal Services . . . . . . . . . . . . . . . . . . 255,742 2,042,953 2,022,481 20,472 770 Job Training Partnership Act . . . . . . . . . 8,095,869 9,413,059 9,412,985 74 __________________________ __________________________ __________________________ ________________
Total Personal Services . . . . . . . . . . . . . 8,351,611 11,456,012 11,435,466 20,546 __________________________ __________________________ __________________________ ________________
183
Comptroller’s Report for Fiscal 2002 Part II-E—General Fund—Schedule G5 (Cont.)
Expenditures and Transfers vs. Budget by Unit of Appropriation Within Agency
Actual Better (Worse)Unit of Appropriation Budget Expenditures Than Modified___________________________________________________________________________
Within Agency Adopted Modified and Transfers Budget_____________________________________ _________________________________ _________________________________ _________________________________ _________________________________
(Continued)

094 DEPARTMENT OF EMPLOYMENT (cont.)Other Than Personal Services—002 Other Than Personal Services . . . . . . . . $ 14,305,525 $ 53,586,955 $ 52,357,841 $ 1,229,114 773 Job Training Partnership Act . . . . . . . . . 75,985,929 72,105,413 72,073,008 32,405 __________________________ __________________________ __________________________ ________________
Total Other Than Personal Services . . . 90,291,454 125,692,368 124,430,849 1,261,519 __________________________ __________________________ __________________________ ________________98,643,065 137,148,380 135,866,315 1,282,065
Intracity Sales . . . . . . . . . . . . . . . . . . . . (4,288,360) (127,319) (96,019) (31,300)__________________________ __________________________ __________________________ ________________Total Department of Employment . . . . . 94,354,705 137,021,061 135,770,296 1,250,765 Net Change in Estimate of
Prior Payables . . . . . . . . . . . . . . . . . . — — (4,258,457) 4,258,457 __________________________ __________________________ __________________________ ________________Net Total Department of Employment . . 94,354,705 137,021,061 131,511,839 5,509,222 __________________________ __________________________ __________________________ __________________________________________ __________________________ __________________________ ________________
095 PENSION CONTRIBUTIONS
Personal Services—001 City Actuarial Pensions . . . . . . . . . . . . . 1,406,791,335 1,442,095,128 1,442,095,128 — 002 Non-City Actuarial Pensions . . . . . . . . . 27,747,000 27,235,294 21,973,497 5,261,797 003 Non-Actuarial Pensions . . . . . . . . . . . . . 19,311,886 28,199,608 27,832,344 367,264 __________________________ __________________________ __________________________ ________________
Total Personal Services . . . . . . . . . . . . . 1,453,850,221 1,497,530,030 1,491,900,969 5,629,061 Intracity Sales . . . . . . . . . . . . . . . . . . . . (90,005,294) (100,005,294) (100,005,294) — __________________________ __________________________ __________________________ ________________Total Pension Contributions . . . . . . . . . 1,363,844,927 1,397,524,736 1,391,895,675 5,629,061 __________________________ __________________________ __________________________ __________________________________________ __________________________ __________________________ ________________
098 MISCELLANEOUS
Personal Services—001 Personal Services . . . . . . . . . . . . . . . . . . 542,995,048 365,879,607 351,116,000 14,763,607 003 Fringe Benefits . . . . . . . . . . . . . . . . . . . 2,327,007,268 2,465,887,040 2,461,142,561 4,744,479 __________________________ __________________________ __________________________ ________________
Total Personal Services . . . . . . . . . . . . . 2,870,002,316 2,831,766,647 2,812,258,561 19,508,086 __________________________ __________________________ __________________________ ________________Other Than Personal Services—002 Other Than Personal Services—
Other Public Safety . . . . . . . . . . . . . . . . 24,614,000 23,452,395 23,452,395 — Court Costs—Public Safety . . . . . . . . . 100,000 — — — Criminal Justice Programs . . . . . . . . . . 46,335,552 46,225,552 45,476,440 749,112 Payments to Transit Authority . . . . . . . . 102,968,747 120,439,953 120,439,952 1 Payments to Private Bus Companies . . . 167,479,000 188,241,940 199,400,066 (11,158,126)Payments to Housing Authority . . . . . . 19,331,123 13,181,455 13,181,455 — Judgments and Claims . . . . . . . . . . . . . . 309,526,919 389,526,919 521,833,753 (132,306,834)World Trade Center Disaster
Related Expense . . . . . . . . . . . . . . . . — 29,209,829 27,861,271 1,348,558 Other . . . . . . . . . . . . . . . . . . . . . . . . . . . 483,564,438 199,537,072 156,317,862 43,219,210
005 Indigent Defense Services . . . . . . . . . . . 147,642,715 141,934,715 138,842,952 3,091,763 __________________________ __________________________ __________________________ ________________Total Other Than Personal Services . . . 1,301,562,494 1,151,749,830 1,246,806,146 (95,056,316)__________________________ __________________________ __________________________ ________________
4,171,564,810 3,983,516,477 4,059,064,707 (75,548,230)Interfund Agreements . . . . . . . . . . . . . . (38,150,000) (38,150,000) (34,999,000) (3,151,000)__________________________ __________________________ __________________________ ________________Total Miscellaneous . . . . . . . . . . . . . . . . 4,133,414,810 3,945,366,477 4,024,065,707 (78,699,230)Net Change in Estimate of
Prior Payables . . . . . . . . . . . . . . . . . . — — (133,420,352) 133,420,352 __________________________ __________________________ __________________________ ________________Net Total Miscellaneous . . . . . . . . . . . . 4,133,414,810 3,945,366,477 3,890,645,355 54,721,122 __________________________ __________________________ __________________________ __________________________________________ __________________________ __________________________ ________________
184
Comptroller’s Report for Fiscal 2002 Part II-E—General Fund—Schedule G5 (Cont.)
Expenditures and Transfers vs. Budget by Unit of Appropriation Within Agency
Actual Better (Worse)Unit of Appropriation Budget Expenditures Than Modified___________________________________________________________________________
Within Agency Adopted Modified and Transfers Budget_____________________________________ _________________________________ _________________________________ _________________________________ _________________________________
(Continued)

099 DEBT SERVICE
Other Than Personal Services—001 Funded Debt Outside
Constitutional Limit . . . . . . . . . . . . . $ 708,063,394 $ 634,369,355 $ 583,320,714 $ 51,048,641 003 Lease Purchase and City
Guaranteed Debt . . . . . . . . . . . . . . . . 162,025,096 111,264,788 110,643,726 621,062 004 Budget Stabilization Account . . . . . . . . 345,000,000 662,721,513 662,721,513 — __________________________ __________________________ __________________________ ________________
Total Debt Service . . . . . . . . . . . . . . . . . 1,215,088,490 1,408,355,656 1,356,685,953 51,669,703 __________________________ __________________________ __________________________ __________________________________________ __________________________ __________________________ ________________100 MUNICIPAL ASSISTANCE CORPORATION
001 MAC Debt Service Funding . . . . . . . . . — 5,000,000 5,000,000 — __________________________ __________________________ __________________________ ________________Total Municipal Assistance Corporation . — 5,000,000 5,000,000 — __________________________ __________________________ __________________________ __________________________________________ __________________________ __________________________ ________________
101 PUBLIC ADVOCATE
001 Personal Services . . . . . . . . . . . . . . . . . . 2,360,651 2,438,142 2,430,984 7,158 002 Other Than Personal Services . . . . . . . . 211,479 398,812 390,451 8,361 __________________________ __________________________ __________________________ ________________
Total Public Advocate . . . . . . . . . . . . . . 2,572,130 2,836,954 2,821,435 15,519 __________________________ __________________________ __________________________ __________________________________________ __________________________ __________________________ ________________102 CITY COUNCIL
Personal Services—001 Council Members . . . . . . . . . . . . . . . . . 14,820,952 14,411,112 14,337,153 73,959 002 Committee Staffing . . . . . . . . . . . . . . . . 8,805,381 8,725,221 8,719,394 5,827 005 Council Services Division . . . . . . . . . . . 9,062,888 9,412,888 9,392,844 20,044 600 Committee on the Aging . . . . . . . . . . . . 1 1 — 1 605 Committee on Civil Service and Labor . 1 1 — 1 610 Committee on Consumer Affairs . . . . . . 1 1 — 1 615 Committee on Contracts . . . . . . . . . . . . 1 1 — 1 620 Committee on Economic Development . . 1 1 — 1 625 Committee on Education . . . . . . . . . . . . 1 1 — 1 630 Committee on Environmental Protection . 1 1 — 1 632 Committee on Finance . . . . . . . . . . . . . 1 1 — 1 633 Committee on Fire & Criminal Justice . . 1 1 — 1 635 Committee on General Welfare . . . . . . . 1 1 — 1 640 Committee on Governmental Operations 1 1 — 1 645 Committee on Health . . . . . . . . . . . . . . 1 1 — 1 647 Committee on Higher Education . . . . . . 1 1 — 1 650 Committee on Housing and Buildings . . 1 1 — 1 655 Committee on Land Use . . . . . . . . . . . . 1 1 — 1 660 Committee on Parks Recreation and
Cultural Affairs . . . . . . . . . . . . . . . . . 1 1 — 1 665 Committee on Public Safety . . . . . . . . . 1 1 — 1 670 Committee on Rules, Privileges and
Elections . . . . . . . . . . . . . . . . . . . . . . 1 1 — 1 675 Committee on Standards and Ethics . . . 1 1 — 1 680 Committee on State and Federal
Legislation . . . . . . . . . . . . . . . . . . . . . 1 1 — 1 685 Committee on Transportation . . . . . . . . 1 1 — 1 687 Committee on Women’s Issues . . . . . . . 1 1 — 1 690 Committee on Youth Services . . . . . . . . 1 1 — 1 __________________________ __________________________ __________________________ ________________
Total Personal Services . . . . . . . . . . . . . 32,689,244 32,549,244 32,449,391 99,853 __________________________ __________________________ __________________________ ________________
185
Comptroller’s Report for Fiscal 2002 Part II-E—General Fund—Schedule G5 (Cont.)
Expenditures and Transfers vs. Budget by Unit of Appropriation Within Agency
Actual Better (Worse)Unit of Appropriation Budget Expenditures Than Modified___________________________________________________________________________
Within Agency Adopted Modified and Transfers Budget_____________________________________ _________________________________ _________________________________ _________________________________ _________________________________
(Continued)

102 CITY COUNCIL (cont.)Other Than Personal Services—100 Council Members . . . . . . . . . . . . . . . . . $ 5,921,712 $ 6,061,712 $ 6,002,367 $ 59,345 200 Central Staff . . . . . . . . . . . . . . . . . . . . . 9,121,476 9,204,770 8,847,346 357,424 800 Committee on the Aging . . . . . . . . . . . . 1 1 — 1 805 Committee on Civil Service and Labor . . 1 1 — 1 810 Committee on Consumer Affairs . . . . . . 1 1 — 1 815 Committee on Contracts . . . . . . . . . . . . 1 1 — 1 820 Committee on Economic Development . . 1 1 — 1 825 Committee on Education . . . . . . . . . . . . 1 1 — 1 830 Committee on Environmental Protection 1 1 — 1 832 Committee on Finance . . . . . . . . . . . . . 1 1 — 1 833 Committee on Fire & Criminal Justice . 1 1 — 1 835 Committee on General Welfare . . . . . . . 1 1 — 1 840 Committee on Governmental
Operations . . . . . . . . . . . . . . . . . . . . . 1 1 — 1 845 Committee on Health . . . . . . . . . . . . . . 1 1 — 1 847 Committee on Higher Education . . . . . . 1 1 — 1 850 Committee on Housing and Buildings . 1 1 — 1 855 Committee on Land Use . . . . . . . . . . . . 1 1 — 1 860 Committee on Parks Recreation
and Cultural . . . . . . . . . . . . . . . . . . . . 1 1 — 1 865 Committee on Public Safety . . . . . . . . . 1 1 — 1 870 Committee on Rules, Privileges and
Elections . . . . . . . . . . . . . . . . . . . . . . 1 1 — 1 875 Committee on Standards and Ethics . . . 1 1 — 1 880 Committee on State and Federal
Legislation . . . . . . . . . . . . . . . . . . . . . 1 1 — 1 885 Committee on Transportation . . . . . . . . 1 1 — 1 887 Committee on Women’s Issues . . . . . . . 1 1 — 1 890 Committee on Youth Services . . . . . . . . 1 1 — 1 __________________________ __________________________ __________________________ ________________
Total Other Than Personal Services . . . 15,043,211 15,266,505 14,849,713 416,792 __________________________ __________________________ __________________________ ________________Total City Council . . . . . . . . . . . . . . . . . 47,732,455 47,815,749 47,299,104 516,645 Net Change in Estimate of
Prior Payables . . . . . . . . . . . . . . . . . . — — (195,718) 195,718 __________________________ __________________________ __________________________ ________________Net Total City Council . . . . . . . . . . . . . . 47,732,455 47,815,749 47,103,386 712,363 __________________________ __________________________ __________________________ __________________________________________ __________________________ __________________________ ________________
103 CITY CLERK
001 Personal Services . . . . . . . . . . . . . . . . . . 2,244,117 2,244,090 2,232,555 11,535 002 Other Than Personal Services . . . . . . . . 487,175 526,856 494,813 32,043 __________________________ __________________________ __________________________ ________________
Total City Clerk . . . . . . . . . . . . . . . . . . . 2,731,292 2,770,946 2,727,368 43,578 Net Change in Estimate of
Prior Payables . . . . . . . . . . . . . . . . . . — — (17,086) 17,086 __________________________ __________________________ __________________________ ________________Net Total City Clerk . . . . . . . . . . . . . . . 2,731,292 2,770,946 2,710,282 60,664 __________________________ __________________________ __________________________ __________________________________________ __________________________ __________________________ ________________
125 DEPARTMENT FOR THE AGING
Personal Services—001 Executive and Administrative
Management . . . . . . . . . . . . . . . . . . . 5,959,470 7,729,076 7,169,687 559,389 002 Community Programs . . . . . . . . . . . . . . 15,356,525 20,725,007 15,445,730 5,279,277 __________________________ __________________________ __________________________ ________________
Total Personal Services . . . . . . . . . . . . . 21,315,995 28,454,083 22,615,417 5,838,666 __________________________ __________________________ __________________________ ________________
186
Comptroller’s Report for Fiscal 2002 Part II-E—General Fund—Schedule G5 (Cont.)
Expenditures and Transfers vs. Budget by Unit of Appropriation Within Agency
Actual Better (Worse)Unit of Appropriation Budget Expenditures Than Modified___________________________________________________________________________
Within Agency Adopted Modified and Transfers Budget_____________________________________ _________________________________ _________________________________ _________________________________ _________________________________
(Continued)

125 DEPARTMENT FOR THE AGING (cont.)Other Than Personal Services —003 Community Programs . . . . . . . . . . . . . . $ 219,734,880 $ 217,388,284 $ 206,020,580 $ 11,367,704 004 Executive and Administrative
Management . . . . . . . . . . . . . . . . . . . 4,552,825 3,433,373 2,590,919 842,454 __________________________ __________________________ __________________________ ________________Total Other Than Personal Services . . . 224,287,705 220,821,657 208,611,499 12,210,158 __________________________ __________________________ __________________________ ________________
245,603,700 249,275,740 231,226,916 18,048,824 Intracity Sales . . . . . . . . . . . . . . . . . . . . (231,951) (731,951) (413,006) (318,945)__________________________ __________________________ __________________________ ________________Total Department for the Aging . . . . . . . 245,371,749 248,543,789 230,813,910 17,729,879 Net Change in Estimate of
Prior Payables . . . . . . . . . . . . . . . . . . — — (14,641,611) 14,641,611 __________________________ __________________________ __________________________ ________________Net Total Department for the Aging . . . 245,371,749 248,543,789 216,172,299 32,371,490 __________________________ __________________________ __________________________ __________________________________________ __________________________ __________________________ ________________
126 DEPARTMENT OF CULTURAL AFFAIRS
001 Office of the Commissioner . . . . . . . . . 2,166,850 2,233,850 2,233,047 803 __________________________ __________________________ __________________________ ________________Other Than Personal Services—002 Office of the Commissioner . . . . . . . . . 1,128,427 1,149,896 1,084,915 64,981 003 Cultural Programs . . . . . . . . . . . . . . . . . 24,143,761 23,870,664 23,868,230 2,434 004 Metropolitan Museum of Art . . . . . . . . . 23,196,333 19,628,472 19,628,343 129 005 New York Botanical Garden . . . . . . . . . 6,308,547 5,961,956 5,913,667 48,289 006 American Museum of Natural History . . 17,205,821 14,409,589 14,409,483 106 007 The Wildlife Conservation Society . . . . 14,482,703 12,201,726 12,201,599 127 008 Brooklyn Museum . . . . . . . . . . . . . . . . . 8,356,781 7,610,809 7,579,143 31,666 009 Brooklyn Children’s Museum . . . . . . . . 2,324,732 2,025,824 2,015,867 9,957 010 Brooklyn Botanical Garden . . . . . . . . . . 4,304,095 3,828,728 3,795,280 33,448 011 Queens Botanical Garden . . . . . . . . . . . 1,369,747 1,551,419 1,551,366 53 012 New York Hall of Science . . . . . . . . . . . 2,014,007 1,980,858 1,953,167 27,691 013 Staten Island Institute of Arts
and Science . . . . . . . . . . . . . . . . . . . . 1,035,197 1,033,478 1,030,444 3,034 014 Staten Island Zoological Society . . . . . . 1,649,112 1,437,010 1,436,767 243 015 Staten Island Historical Society . . . . . . 813,306 806,492 800,988 5,504 016 Museum of the City of New York . . . . . 1,482,626 1,288,303 1,288,244 59 017 Wave Hill Perkins Gardens . . . . . . . . . . 1,133,070 977,115 968,009 9,106 019 Brooklyn Academy of Music . . . . . . . . 3,664,945 3,605,277 3,605,199 78 020 Snug Harbor Cultural Center . . . . . . . . . 2,470,497 1,836,521 1,836,424 97 021 Studio Museum in Harlem . . . . . . . . . . 923,612 810,476 810,351 125 022 Other Cultural Institutions . . . . . . . . . . . 17,782,381 15,503,193 15,350,187 153,006 024 New York Shakespeare Festival . . . . . . . 1,247,170 1,319,724 1,319,565 159 __________________________ __________________________ __________________________ ________________
Total Other Than Personal Services . . . 137,036,870 122,837,530 122,447,238 390,292 __________________________ __________________________ __________________________ ________________139,203,720 125,071,380 124,680,285 391,095
Interfund Agreements . . . . . . . . . . . . . . (41,200) (41,200) (41,200) — Intracity Sales . . . . . . . . . . . . . . . . . . . . (1,243,500) (1,343,500) (1,406,500) 63,000 __________________________ __________________________ __________________________ ________________Total Department of Cultural Affairs . . 137,919,020 123,686,680 123,232,585 454,095 Net Change in Estimate of
Prior Payables . . . . . . . . . . . . . . . . . . — — (88,114) 88,114 __________________________ __________________________ __________________________ ________________Net Total Department of
Cultural Affairs . . . . . . . . . . . . . . . . . 137,919,020 123,686,680 123,144,471 542,209 __________________________ __________________________ __________________________ __________________________________________ __________________________ __________________________ ________________
187
Comptroller’s Report for Fiscal 2002 Part II-E—General Fund—Schedule G5 (Cont.)
Expenditures and Transfers vs. Budget by Unit of Appropriation Within Agency
Actual Better (Worse)Unit of Appropriation Budget Expenditures Than Modified___________________________________________________________________________
Within Agency Adopted Modified and Transfers Budget_____________________________________ _________________________________ _________________________________ _________________________________ _________________________________
(Continued)

188
Comptroller’s Report for Fiscal 2002 Part II-E—General Fund—Schedule G5 (Cont.)
Expenditures and Transfers vs. Budget by Unit of Appropriation Within Agency
Actual Better (Worse)Unit of Appropriation Budget Expenditures Than Modified___________________________________________________________________________
Within Agency Adopted Modified and Transfers Budget_____________________________________ _________________________________ _________________________________ _________________________________ _________________________________
(Continued)
127 FINANCIAL INFORMATION SERVICES AGENCY
001 Personal Services . . . . . . . . . . . . . . . . . . $ 14,481,932 $ 14,081,932 $ 14,077,934 $ 3,998 002 Other Than Personal Services . . . . . . . . 16,565,788 16,722,010 16,711,573 10,437 __________________________ __________________________ __________________________ ________________
31,047,720 30,803,942 30,789,507 14,435 Interfund Agreements . . . . . . . . . . . . . . (2,812,160) (4,202,622) (4,202,622) — Intracity Sales . . . . . . . . . . . . . . . . . . . . — (457,759) (457,759) — __________________________ __________________________ __________________________ ________________Total Financial Information Services
Agency . . . . . . . . . . . . . . . . . . . . . . . . 28,235,560 26,143,561 26,129,126 14,435 Net Change in Estimate of
Prior Payables . . . . . . . . . . . . . . . . . . — — (544,497) 544,497 __________________________ __________________________ __________________________ ________________Net Total Financial Information
Services Agency . . . . . . . . . . . . . . . . 28,235,560 26,143,561 25,584,629 558,932 __________________________ __________________________ __________________________ __________________________________________ __________________________ __________________________ ________________130 DEPARTMENT OF JUVENILE JUSTICE
001 Personal Services . . . . . . . . . . . . . . . . . . 30,789,052 34,042,918 33,408,570 634,348 002 Other Than Personal Services . . . . . . . . 75,398,473 76,980,139 75,534,190 1,445,949 __________________________ __________________________ __________________________ ________________
Total Department of Juvenile Justice . . 106,187,525 111,023,057 108,942,760 2,080,297 Intracity Sales . . . . . . . . . . . . . . . . . . . . — (200,000) (200,000) — __________________________ __________________________ __________________________ ________________Total Department of Juvenile Justice . . 106,187,525 110,823,057 108,742,760 2,080,297 Net Change in Estimate of
Prior Payables . . . . . . . . . . . . . . . . . . — — (106,708) 106,708 __________________________ __________________________ __________________________ ________________Net Total Department of Juvenile
Justice . . . . . . . . . . . . . . . . . . . . . . . . 106,187,525 110,823,057 108,636,052 2,187,005 __________________________ __________________________ __________________________ __________________________________________ __________________________ __________________________ ________________131 OFFICE OF PAYROLL ADMINISTRATION
100 Personal Services . . . . . . . . . . . . . . . . . . 5,325,339 5,052,339 5,008,138 44,201 200 Other Than Personal Services . . . . . . . . 3,476,422 1,179,085 1,121,208 57,877 __________________________ __________________________ __________________________ ________________
8,801,761 6,231,424 6,129,346 102,078 Interfund Agreements . . . . . . . . . . . . . . (359,170) (229,170) (229,170) — __________________________ __________________________ __________________________ ________________Total Office of Payroll Administration . . 8,442,591 6,002,254 5,900,176 102,078 Net Change in Estimate of
Prior Payables . . . . . . . . . . . . . . . . . . — — (46) 46 __________________________ __________________________ __________________________ ________________Net Total Office of Payroll
Administration . . . . . . . . . . . . . . . . . . 8,442,591 6,002,254 5,900,130 102,124 __________________________ __________________________ __________________________ __________________________________________ __________________________ __________________________ ________________132 INDEPENDENT BUDGET OFFICE
001 Personal Services . . . . . . . . . . . . . . . . . . 2,305,924 2,073,883 1,969,948 103,935 002 Other Than Personal Services . . . . . . . . 549,249 598,734 581,400 17,334 __________________________ __________________________ __________________________ ________________
Total Independent Budget Office . . . . . 2,855,173 2,672,617 2,551,348 121,269 __________________________ __________________________ __________________________ __________________________________________ __________________________ __________________________ ________________133 EQUAL EMPLOYMENT PRACTICES COMMISSION
001 Personal Services . . . . . . . . . . . . . . . . . . 637,107 327,107 304,609 22,498 002 Other Than Personal Services . . . . . . . . 55,000 55,000 37,857 17,143 __________________________ __________________________ __________________________ ________________
Total Equal Employment Practices Commission . . . . . . . . . . . . . . . . . . . . 692,107 382,107 342,466 39,641
Net Change in Estimate of Prior Payables . . . . . . . . . . . . . . . . . . — — (15,962) 15,962 __________________________ __________________________ __________________________ ________________
Net Total of Equal Employment PracticesCommission . . . . . . . . . . . . . . . . . . . . 692,107 382,107 326,504 55,603 __________________________ __________________________ __________________________ __________________________________________ __________________________ __________________________ ________________

134 CIVIL SERVICE COMMISSION
001 Personal Services . . . . . . . . . . . . . . . . . . $ 654,037 $ 450,037 $ 447,575 $ 2,462 002 Other Than Personal Services . . . . . . . . 39,368 34,368 23,463 10,905 __________________________ __________________________ __________________________ ________________
Total Civil Service Commission . . . . . . 693,405 484,405 471,038 13,367 __________________________ __________________________ __________________________ __________________________________________ __________________________ __________________________ ________________136 LANDMARKS PRESERVATION COMMISSION
001 Personal Services . . . . . . . . . . . . . . . . . . 2,802,985 2,751,579 2,726,424 25,155 002 Other Than Personal Services . . . . . . . . 537,131 480,412 443,524 36,888 __________________________ __________________________ __________________________ ________________
Total Landmarks Preservation Commission . . . . . . . . . . . . . . . . . . . . 3,340,116 3,231,991 3,169,948 62,043 __________________________ __________________________ __________________________ __________________________________________ __________________________ __________________________ ________________
156 NEW YORK CITY TAXI AND
LIMOUSINE COMMISSION
001 Personal Services . . . . . . . . . . . . . . . . . . 17,998,451 18,119,114 17,972,437 146,677 002 Other Than Personal Services . . . . . . . . 6,951,067 5,157,615 5,005,239 152,376 __________________________ __________________________ __________________________ ________________
Total New York City Taxi and LimousineCommission . . . . . . . . . . . . . . . . . . . . 24,949,518 23,276,729 22,977,676 299,053
Net Change in Estimate of Prior Payables . . . . . . . . . . . . . . . . . . — — (1,299) 1,299 __________________________ __________________________ __________________________ ________________
Net Total New York City Taxi andLimousine Commission . . . . . . . . . . . 24,949,518 23,276,729 22,976,377 300,352 __________________________ __________________________ __________________________ __________________________________________ __________________________ __________________________ ________________
226 COMMISSION ON HUMAN RIGHTS
Personal Services—001 Personal Services . . . . . . . . . . . . . . . . . . 1,834,702 2,369,287 2,327,031 42,256 003 Community Development . . . . . . . . . . . 3,602,169 3,602,169 3,476,660 125,509 __________________________ __________________________ __________________________ ________________
Total Personal Services . . . . . . . . . . . . . 5,436,871 5,971,456 5,803,691 167,765 __________________________ __________________________ __________________________ ________________Other Than Personal Services—002 Other Than Personal Services . . . . . . . . 1,261,722 1,243,775 1,123,442 120,333 004 Community Development . . . . . . . . . . . 558,886 562,173 535,373 26,800 __________________________ __________________________ __________________________ ________________
Total Other Than Personal Services . . . 1,820,608 1,805,948 1,658,815 147,133 __________________________ __________________________ __________________________ ________________Total Commission on Human Rights . . 7,257,479 7,777,404 7,462,506 314,898 Net Change in Estimate of
Prior Payables . . . . . . . . . . . . . . . . . . — — (21,774) 21,774 __________________________ __________________________ __________________________ ________________Net Total Commission on
Human Rights . . . . . . . . . . . . . . . . . . 7,257,479 7,777,404 7,440,732 336,672 __________________________ __________________________ __________________________ __________________________________________ __________________________ __________________________ ________________260 DEPARTMENT OF YOUTH AND
COMMUNITY DEVELOPMENT
Personal Services—002 Community Development . . . . . . . . . . . 10,974,163 10,139,892 9,631,388 508,504 311 Personal Services . . . . . . . . . . . . . . . . . . 5,154,120 4,663,706 4,521,011 142,695 __________________________ __________________________ __________________________ ________________
Total Personal Services . . . . . . . . . . . . . 16,128,283 14,803,598 14,152,399 651,199 __________________________ __________________________ __________________________ ________________Other Than Personal Services—005 Community Development . . . . . . . . . . . 37,191,220 43,235,150 39,729,218 3,505,932 312 Other Than Personal Services . . . . . . . . 109,703,804 106,949,666 99,132,121 7,817,545 __________________________ __________________________ __________________________ ________________
Total Other Than Personal Services . . . 146,895,024 150,184,816 138,861,339 11,323,477 __________________________ __________________________ __________________________ ________________163,023,307 164,988,414 153,013,738 11,974,676
Intracity Sales . . . . . . . . . . . . . . . . . . . . (8,598,332) (6,526,417) (4,865,333) (1,661,084)__________________________ __________________________ __________________________ ________________
189
Comptroller’s Report for Fiscal 2002 Part II-E—General Fund—Schedule G5 (Cont.)
Expenditures and Transfers vs. Budget by Unit of Appropriation Within Agency
Actual Better (Worse)Unit of Appropriation Budget Expenditures Than Modified___________________________________________________________________________
Within Agency Adopted Modified and Transfers Budget_____________________________________ _________________________________ _________________________________ _________________________________ _________________________________
(Continued)

190
Comptroller’s Report for Fiscal 2002 Part II-E—General Fund—Schedule G5 (Cont.)
Expenditures and Transfers vs. Budget by Unit of Appropriation Within Agency
Actual Better (Worse)Unit of Appropriation Budget Expenditures Than Modified___________________________________________________________________________
Within Agency Adopted Modified and Transfers Budget_____________________________________ _________________________________ _________________________________ _________________________________ _________________________________
(Continued)
260 DEPARTMENT OF YOUTH AND COMMUNITY
DEVELOPMENT (cont.)Other Than Personal Services—(cont.)
Total Department of Youth and Community Development . . . . . . . . . $ 154,424,975 $ 158,461,997 $ 148,148,405 $ 10,313,592
Net Change in Estimate of Prior Payables . . . . . . . . . . . . . . . . . . — — (6,763,339) 6,763,339 __________________________ __________________________ __________________________ ________________
Net Total Department of Youth andCommunity Development . . . . . . . . . 154,424,975 158,461,997 141,385,066 17,076,931 __________________________ __________________________ __________________________ __________________________________________ __________________________ __________________________ ________________
312 CONFLICTS OF INTEREST BOARD
001 Personal Services . . . . . . . . . . . . . . . . . . 1,536,529 1,536,529 1,393,583 142,946 002 Other Than Personal Services . . . . . . . . 262,140 259,368 230,286 29,082 __________________________ __________________________ __________________________ ________________
Total Conflicts of Interest Board . . . . . . 1,798,669 1,795,897 1,623,869 172,028 __________________________ __________________________ __________________________ __________________________________________ __________________________ __________________________ ________________313 OFFICE OF COLLECTIVE BARGAINING
001 Personal Services . . . . . . . . . . . . . . . . . . 1,065,759 1,081,759 1,076,678 5,081 002 Other Than Personal Services . . . . . . . . 420,851 416,461 405,450 11,011 __________________________ __________________________ __________________________ ________________
Total Office of Collective Bargaining . . 1,486,610 1,498,220 1,482,128 16,092 Net Change in Estimate of
Prior Payables . . . . . . . . . . . . . . . . . . — — (2,792) 2,792 __________________________ __________________________ __________________________ ________________Net Total Office of Collective
Bargaining . . . . . . . . . . . . . . . . . . . . . 1,486,610 1,498,220 1,479,336 18,884 __________________________ __________________________ __________________________ __________________________________________ __________________________ __________________________ ________________341 MANHATTAN COMMUNITY BOARD #1
001 Personal Services . . . . . . . . . . . . . . . . . . 167,494 167,494 165,223 2,271 002 Other Than Personal Services . . . . . . . . 8,264 9,305 8,068 1,237 __________________________ __________________________ __________________________ ________________
Total Manhattan Community Board #1 . . 175,758 176,799 173,291 3,508 __________________________ __________________________ __________________________ __________________________________________ __________________________ __________________________ ________________342 MANHATTAN COMMUNITY BOARD #2
001 Personal Services . . . . . . . . . . . . . . . . . . 161,883 160,787 160,786 1 __________________________ __________________________ __________________________ ________________Other Than Personal Services—002 Other Than Personal Services . . . . . . . . 13,875 14,767 14,614 153 003 Rent and Energy . . . . . . . . . . . . . . . . . . 53,483 53,450 53,448 2 __________________________ __________________________ __________________________ ________________
Total Other Than Personal Services . . . 67,358 68,217 68,062 155 __________________________ __________________________ __________________________ ________________Total Manhattan Community Board #2 . . 229,241 229,004 228,848 156 __________________________ __________________________ __________________________ __________________________________________ __________________________ __________________________ ________________
343 MANHATTAN COMMUNITY BOARD #3001 Personal Services . . . . . . . . . . . . . . . . . . 148,031 146,831 146,720 111 __________________________ __________________________ __________________________ ________________Other Than Personal Services—002 Other Than Personal Services . . . . . . . . 27,727 28,927 25,862 3,065 003 Rent and Energy . . . . . . . . . . . . . . . . . . 4,661 3,993 3,991 2 __________________________ __________________________ __________________________ ________________
Total Other Than Personal Services . . . 32,388 32,920 29,853 3,067 __________________________ __________________________ __________________________ ________________Total Manhattan Community Board #3 . . 180,419 179,751 176,573 3,178 __________________________ __________________________ __________________________ __________________________________________ __________________________ __________________________ ________________
344 MANHATTAN COMMUNITY BOARD #4001 Personal Services . . . . . . . . . . . . . . . . . . 147,401 140,701 137,007 3,694 __________________________ __________________________ __________________________ ________________Other Than Personal Services—002 Other Than Personal Services . . . . . . . . 28,357 33,757 27,172 6,585 003 Rent . . . . . . . . . . . . . . . . . . . . . . . . . . . . 33,836 37,205 37,203 2 __________________________ __________________________ __________________________ ________________
Total Other Than Personal Services . . . 62,193 70,962 64,375 6,587 __________________________ __________________________ __________________________ ________________Total Manhattan Community Board #4 . . 209,594 211,663 201,382 10,281 __________________________ __________________________ __________________________ __________________________________________ __________________________ __________________________ ________________

345 MANHATTAN COMMUNITY BOARD #5001 Personal Services . . . . . . . . . . . . . . . . . . $ 159,400 $ 132,690 $ 124,097 $ 8,593 __________________________ __________________________ __________________________ ________________Other Than Personal Services—002 Other Than Personal Services . . . . . . . . 16,358 43,068 38,054 5,014 003 Rent and Energy . . . . . . . . . . . . . . . . . . 42,490 42,902 42,900 2 __________________________ __________________________ __________________________ ________________
Total Other Than Personal Services . . . 58,848 85,970 80,954 5,016 __________________________ __________________________ __________________________ ________________Total Manhattan Community Board #5 . . 218,248 218,660 205,051 13,609 __________________________ __________________________ __________________________ __________________________________________ __________________________ __________________________ ________________
346 MANHATTAN COMMUNITY BOARD #6001 Personal Services . . . . . . . . . . . . . . . . . . 161,889 138,232 130,921 7,311__________________________ __________________________ __________________________ ________________Other Than Personal Services—002 Other Than Personal Services . . . . . . . . 13,869 37,526 35,236 2,290003 Rent . . . . . . . . . . . . . . . . . . . . . . . . . . . . 73,920 73,920 69,918 4,002__________________________ __________________________ __________________________ ________________
Total Other Than Personal Services . . . 87,789 111,446 105,154 6,292__________________________ __________________________ __________________________ ________________Total Manhattan Community Board #6 . . 249,678 249,678 236,075 13,603__________________________ __________________________ __________________________ __________________________________________ __________________________ __________________________ ________________
347 MANHATTAN COMMUNITY BOARD #7001 Personal Services . . . . . . . . . . . . . . . . . . 146,203 151,008 146,292 4,716__________________________ __________________________ __________________________ ________________Other Than Personal Services—002 Other Than Personal Services . . . . . . . . 29,555 29,475 28,691 784003 Rent . . . . . . . . . . . . . . . . . . . . . . . . . . . . 3,834 3,834 3,832 2__________________________ __________________________ __________________________ ________________
Total Other Than Personal Services . . . 33,389 33,309 32,523 786__________________________ __________________________ __________________________ ________________Total Manhattan Community Board #7 . . 179,592 184,317 178,815 5,502__________________________ __________________________ __________________________ __________________________________________ __________________________ __________________________ ________________
348 MANHATTAN COMMUNITY BOARD #8001 Personal Services . . . . . . . . . . . . . . . . . . 153,351 151,445 141,326 10,119__________________________ __________________________ __________________________ ________________Other Than Personal Services—002 Other Than Personal Services . . . . . . . . 22,407 24,313 23,434 879003 Rent and Energy . . . . . . . . . . . . . . . . . . 90,361 91,363 91,361 2__________________________ __________________________ __________________________ ________________
Total Other Than Personal Services . . . 112,768 115,676 114,795 881__________________________ __________________________ __________________________ ________________Total Manhattan Community Board #8 . . 266,119 267,121 256,121 11,000Net Change in Estimate of
Prior Payables . . . . . . . . . . . . . . . . . . — — (3,684) 3,684__________________________ __________________________ __________________________ ________________Net Total Manhattan Community
Board #8 . . . . . . . . . . . . . . . . . . . . . . 266,119 267,121 252,437 14,684__________________________ __________________________ __________________________ __________________________________________ __________________________ __________________________ ________________349 MANHATTAN COMMUNITY BOARD #9
001 Personal Services . . . . . . . . . . . . . . . . . . 148,011 119,378 116,937 2,441__________________________ __________________________ __________________________ ________________Other Than Personal Services—002 Other Than Personal Services . . . . . . . . 27,747 56,380 52,303 4,077003 Rent . . . . . . . . . . . . . . . . . . . . . . . . . . . . 18,000 18,000 18,000 — __________________________ __________________________ __________________________ ________________
Total Other Than Personal Services . . . 45,747 74,380 70,303 4,077__________________________ __________________________ __________________________ ________________Total Manhattan Community Board #9 . . 193,758 193,758 187,240 6,518__________________________ __________________________ __________________________ __________________________________________ __________________________ __________________________ ________________
350 MANHATTAN COMMUNITY BOARD #10001 Personal Services . . . . . . . . . . . . . . . . . . 133,612 126,090 112,008 14,082__________________________ __________________________ __________________________ ________________Other Than Personal Services—002 Other Than Personal Services . . . . . . . . 42,146 49,668 38,670 10,998003 Rent . . . . . . . . . . . . . . . . . . . . . . . . . . . . 67,516 67,516 63,514 4,002__________________________ __________________________ __________________________ ________________
Total Other Than Personal Services . . . 109,662 117,184 102,184 15,000__________________________ __________________________ __________________________ ________________Total Manhattan Community Board #10 . . 243,274 243,274 214,192 29,082__________________________ __________________________ __________________________ __________________________________________ __________________________ __________________________ ________________
191
Comptroller’s Report for Fiscal 2002 Part II-E—General Fund—Schedule G5 (Cont.)
Expenditures and Transfers vs. Budget by Unit of Appropriation Within Agency
Actual Better (Worse)Unit of Appropriation Budget Expenditures Than Modified___________________________________________________________________________
Within Agency Adopted Modified and Transfers Budget_____________________________________ _________________________________ _________________________________ _________________________________ _________________________________
(Continued)

351 MANHATTAN COMMUNITY BOARD #11001 Personal Services . . . . . . . . . . . . . . . . . . $ 128,732 $ 66,732 $ 59,932 $ 6,800__________________________ __________________________ __________________________ ________________Other Than Personal Services—002 Other Than Personal Services . . . . . . . . 47,026 109,026 84,249 24,777003 Rent and Energy . . . . . . . . . . . . . . . . . . 7,068 6,627 4,825 1,802__________________________ __________________________ __________________________ ________________
Total Other Than Personal Services . . . 54,094 115,653 89,074 26,579__________________________ __________________________ __________________________ ________________Total Manhattan Community
Board #11 . . . . . . . . . . . . . . . . . . . . . 182,826 182,385 149,006 33,379__________________________ __________________________ __________________________ __________________________________________ __________________________ __________________________ ________________352 MANHATTAN COMMUNITY BOARD #12
001 Personal Services . . . . . . . . . . . . . . . . . . 144,819 144,819 113,154 31,665002 Other Than Personal Services . . . . . . . . 30,939 30,939 28,077 2,862__________________________ __________________________ __________________________ ________________
Total Manhattan Community Board #12 . . . . . . . . . . . . . . . . . . . . . 175,758 175,758 141,231 34,527__________________________ __________________________ __________________________ __________________________________________ __________________________ __________________________ ________________
381 BRONX COMMUNITY BOARD #1001 Personal Services . . . . . . . . . . . . . . . . . . 148,630 141,030 140,582 448__________________________ __________________________ __________________________ ________________Other Than Personal Services—002 Other Than Personal Services . . . . . . . . 27,128 26,728 22,548 4,180003 Rent . . . . . . . . . . . . . . . . . . . . . . . . . . . . 23,460 31,727 31,725 2__________________________ __________________________ __________________________ ________________
Total Other Than Personal Services . . . 50,588 58,455 54,273 4,182__________________________ __________________________ __________________________ ________________Total Bronx Community Board #1 . . . . 199,218 199,485 194,855 4,630__________________________ __________________________ __________________________ __________________________________________ __________________________ __________________________ ________________
382 BRONX COMMUNITY BOARD #2001 Personal Services . . . . . . . . . . . . . . . . . . 164,541 160,172 158,994 1,178__________________________ __________________________ __________________________ ________________Other Than Personal Services—002 Other Than Personal Services . . . . . . . . 11,217 15,586 15,500 86003 Rent and Energy . . . . . . . . . . . . . . . . . . 32,915 32,831 32,769 62__________________________ __________________________ __________________________ ________________
Total Other Than Personal Services . . . 44,132 48,417 48,269 148__________________________ __________________________ __________________________ ________________Total Bronx Community Board #2 . . . . 208,673 208,589 207,263 1,326__________________________ __________________________ __________________________ __________________________________________ __________________________ __________________________ ________________
383 BRONX COMMUNITY BOARD #3001 Personal Services . . . . . . . . . . . . . . . . . . 149,315 149,315 148,309 1,006__________________________ __________________________ __________________________ ________________Other Than Personal Services—002 Other Than Personal Services . . . . . . . . 26,443 26,443 25,246 1,197003 Rent . . . . . . . . . . . . . . . . . . . . . . . . . . . . 24,818 24,275 23,445 830__________________________ __________________________ __________________________ ________________
Total Other Than Personal Services . . . 51,261 50,718 48,691 2,027__________________________ __________________________ __________________________ ________________Total Bronx Community Board #3 . . . . 200,576 200,033 197,000 3,033__________________________ __________________________ __________________________ __________________________________________ __________________________ __________________________ ________________
384 BRONX COMMUNITY BOARD #4001 Personal Services . . . . . . . . . . . . . . . . . . 156,278 157,447 152,227 5,220__________________________ __________________________ __________________________ ________________Other Than Personal Services—002 Other Than Personal Services . . . . . . . . 19,480 18,311 17,828 483003 Rent . . . . . . . . . . . . . . . . . . . . . . . . . . . . 8,043 8,043 8,041 2__________________________ __________________________ __________________________ ________________
Total Other Than Personal Services . . . 27,523 26,354 25,869 485__________________________ __________________________ __________________________ ________________Total Bronx Community Board #4 . . . . 183,801 183,801 178,096 5,705Net Change in Estimate of
Prior Payables . . . . . . . . . . . . . . . . . . — — (2,692) 2,692__________________________ __________________________ __________________________ ________________Net Total Bronx Community Board #4 . . 183,801 183,801 175,404 8,397__________________________ __________________________ __________________________ __________________________________________ __________________________ __________________________ ________________
192
Comptroller’s Report for Fiscal 2002 Part II-E—General Fund—Schedule G5 (Cont.)
Expenditures and Transfers vs. Budget by Unit of Appropriation Within Agency
Actual Better (Worse)Unit of Appropriation Budget Expenditures Than Modified___________________________________________________________________________
Within Agency Adopted Modified and Transfers Budget_____________________________________ _________________________________ _________________________________ _________________________________ _________________________________
(Continued)

385 BRONX COMMUNITY BOARD #5001 Personal Services . . . . . . . . . . . . . . . . . . $ 165,078 $ 120,558 $ 120,193 $ 365__________________________ __________________________ __________________________ ________________Other Than Personal Services—002 Other Than Personal Services . . . . . . . . 10,680 55,200 51,603 3,597003 Rent . . . . . . . . . . . . . . . . . . . . . . . . . . . . 15,743 15,743 10,743 5,000__________________________ __________________________ __________________________ ________________
Total Other Than Personal Services . . . 26,423 70,943 62,346 8,597__________________________ __________________________ __________________________ ________________Total Bronx Community Board #5 . . . . 191,501 191,501 182,539 8,962__________________________ __________________________ __________________________ __________________________________________ __________________________ __________________________ ________________
386 Bronx Community Board #6001 Personal Services . . . . . . . . . . . . . . . . . . 150,054 150,054 131,324 18,730002 Other Than Personal Services . . . . . . . . 25,704 25,704 22,306 3,398__________________________ __________________________ __________________________ ________________
Total Bronx Community Board #6 . . . . 175,758 175,758 153,630 22,128__________________________ __________________________ __________________________ ________________Net Change in Estimate of
Prior Payables . . . . . . . . . . . . . . . . . . — — (1,549) 1,549__________________________ __________________________ __________________________ ________________Net Total Bronx Community Board #6 . . 175,758 175,758 152,081 23,677__________________________ __________________________ __________________________ __________________________________________ __________________________ __________________________ ________________
387 BRONX COMMUNITY BOARD #7001 Personal Services . . . . . . . . . . . . . . . . . . 157,800 157,800 142,276 15,524__________________________ __________________________ __________________________ ________________Other Than Personal Services—002 Other Than Personal Services . . . . . . . . 17,958 17,958 14,339 3,619003 Rent and Energy . . . . . . . . . . . . . . . . . . 32,995 33,402 32,815 587__________________________ __________________________ __________________________ ________________
Total Other Than Personal Services . . . 50,953 51,360 47,154 4,206__________________________ __________________________ __________________________ ________________Total Bronx Community Board #7 . . . . 208,753 209,160 189,430 19,730Net Change in Estimate of
Prior Payables . . . . . . . . . . . . . . . . . . — — (68) 68__________________________ __________________________ __________________________ ________________Net Total Bronx Community Board #7 . . 208,753 209,160 189,362 19,798__________________________ __________________________ __________________________ __________________________________________ __________________________ __________________________ ________________
388 BRONX COMMUNITY BOARD #8001 Personal Services . . . . . . . . . . . . . . . . . . 158,598 155,098 148,371 6,727__________________________ __________________________ __________________________ ________________Other Than Personal Services—002 Other Than Personal Services . . . . . . . . 17,161 20,661 19,113 1,548003 Rent and Energy . . . . . . . . . . . . . . . . . . 26,880 26,818 26,816 2__________________________ __________________________ __________________________ ________________
Total Other Than Personal Services . . . 44,041 47,479 45,929 1,550__________________________ __________________________ __________________________ ________________Total Bronx Community Board #8 . . . . 202,639 202,577 194,300 8,277__________________________ __________________________ __________________________ __________________________________________ __________________________ __________________________ ________________
389 BRONX COMMUNITY BOARD #9001 Personal Services . . . . . . . . . . . . . . . . . . 149,466 149,466 140,466 9,000__________________________ __________________________ __________________________ ________________Other Than Personal Services—002 Other Than Personal Services . . . . . . . . 26,292 26,292 9,388 16,904003 Rent . . . . . . . . . . . . . . . . . . . . . . . . . . . . 50,898 50,898 50,896 2__________________________ __________________________ __________________________ ________________
Total Other Than Personal Services . . . 77,190 77,190 60,284 16,906__________________________ __________________________ __________________________ ________________Total Bronx Community Board #9 . . . . 226,656 226,656 200,750 25,906__________________________ __________________________ __________________________ __________________________________________ __________________________ __________________________ ________________
390 BRONX COMMUNITY BOARD #10001 Personal Services . . . . . . . . . . . . . . . . . . 152,291 152,291 151,990 301__________________________ __________________________ __________________________ ________________Other Than Personal Services—002 Other Than Personal Services . . . . . . . . 23,467 23,467 20,813 2,654003 Rent and Energy . . . . . . . . . . . . . . . . . . 38,910 38,238 38,236 2__________________________ __________________________ __________________________ ________________
Total Other Than Personal Services . . . 62,377 61,705 59,049 2,656__________________________ __________________________ __________________________ ________________Total Bronx Community Board #10 . . . 214,668 213,996 211,039 2,957__________________________ __________________________ __________________________ __________________________________________ __________________________ __________________________ ________________
193
Comptroller’s Report for Fiscal 2002 Part II-E—General Fund—Schedule G5 (Cont.)
Expenditures and Transfers vs. Budget by Unit of Appropriation Within Agency
Actual Better (Worse)Unit of Appropriation Budget Expenditures Than Modified___________________________________________________________________________
Within Agency Adopted Modified and Transfers Budget_____________________________________ _________________________________ _________________________________ _________________________________ _________________________________
(Continued)

391 BRONX COMMUNITY BOARD #11001 Personal Services . . . . . . . . . . . . . . . . . . $ 157,341 $ 156,325 $ 156,325 $ — __________________________ __________________________ __________________________ ________________Other Than Personal Services—002 Other Than Personal Services . . . . . . . . 18,417 19,433 18,386 1,047003 Rent . . . . . . . . . . . . . . . . . . . . . . . . . . . . 33,092 33,516 33,514 2__________________________ __________________________ __________________________ ________________
Total Other Than Personal Services . . . 51,509 52,949 51,900 1,049__________________________ __________________________ __________________________ ________________Total Bronx Community Board #11 . . . 208,850 209,274 208,225 1,049__________________________ __________________________ __________________________ __________________________________________ __________________________ __________________________ ________________
392 BRONX COMMUNITY BOARD #12001 Personal Services . . . . . . . . . . . . . . . . . . 143,873 144,573 144,447 126002 Other Than Personal Services . . . . . . . . 31,885 31,185 28,115 3,070__________________________ __________________________ __________________________ ________________
Total Bronx Community Board #12 . . . 175,758 175,758 172,562 3,196__________________________ __________________________ __________________________ __________________________________________ __________________________ __________________________ ________________431 QUEENS COMMUNITY BOARD #1
001 Personal Services . . . . . . . . . . . . . . . . . . 157,588 157,588 155,162 2,426__________________________ __________________________ __________________________ ________________Other Than Personal Services—002 Other Than Personal Services . . . . . . . . 18,170 20,645 19,026 1,619003 Rent . . . . . . . . . . . . . . . . . . . . . . . . . . . . 13,164 17,796 17,796 — __________________________ __________________________ __________________________ ________________
Total Other Than Personal Services . . . 31,334 38,441 36,822 1,619__________________________ __________________________ __________________________ ________________Total Queens Community Board #1 . . . 188,922 196,029 191,984 4,045Net Change in Estimate of
Prior Payables . . . . . . . . . . . . . . . . . . — — (9,733) 9,733__________________________ __________________________ __________________________ ________________Net Total Queens Community
Board #1 . . . . . . . . . . . . . . . . . . . . . . 188,922 196,029 182,251 13,778__________________________ __________________________ __________________________ __________________________________________ __________________________ __________________________ ________________432 QUEENS COMMUNITY BOARD #2
001 Personal Services . . . . . . . . . . . . . . . . . . 151,868 141,868 133,038 8,830__________________________ __________________________ __________________________ ________________Other Than Personal Services—002 Other Than Personal Services . . . . . . . . 23,890 33,890 27,277 6,613003 Rent . . . . . . . . . . . . . . . . . . . . . . . . . . . . 50,007 50,007 50,005 2__________________________ __________________________ __________________________ ________________
Total Other Than Personal Services . . . 73,897 83,897 77,282 6,615__________________________ __________________________ __________________________ ________________Total Queens Community Board #2 . . . 225,765 225,765 210,320 15,445Net Change in Estimate of
Prior Payables . . . . . . . . . . . . . . . . . . — — (1,594) 1,594__________________________ __________________________ __________________________ ________________Net Total Queens Community
Board #2 . . . . . . . . . . . . . . . . . . . . . . 225,765 225,765 208,726 17,039__________________________ __________________________ __________________________ __________________________________________ __________________________ __________________________ ________________433 QUEENS COMMUNITY BOARD #3
001 Personal Services . . . . . . . . . . . . . . . . . . 158,340 145,956 149,017 (3,061)__________________________ __________________________ __________________________ ________________Other Than Personal Services—002 Other Than Personal Services . . . . . . . . 17,418 29,802 29,793 9 003 Rent . . . . . . . . . . . . . . . . . . . . . . . . . . . . 49,202 49,202 49,200 2 __________________________ __________________________ __________________________ ________________
Total Other Than Personal Services . . . 66,620 79,004 78,993 11 __________________________ __________________________ __________________________ ________________Total Queens Community Board #3 . . . 224,960 224,960 228,010 (3,050)Net Change in Estimate of
Prior Payables . . . . . . . . . . . . . . . . . . — — (726) 726 __________________________ __________________________ __________________________ ________________Net Total Queens Community Board #3 . 224,960 224,960 227,284 (2,324)__________________________ __________________________ __________________________ __________________________________________ __________________________ __________________________ ________________
194
Comptroller’s Report for Fiscal 2002 Part II-E—General Fund—Schedule G5 (Cont.)
Expenditures and Transfers vs. Budget by Unit of Appropriation Within Agency
Actual Better (Worse)Unit of Appropriation Budget Expenditures Than Modified___________________________________________________________________________
Within Agency Adopted Modified and Transfers Budget_____________________________________ _________________________________ _________________________________ _________________________________ _________________________________
(Continued)

434 QUEENS COMMUNITY BOARD #4001 Personal Services . . . . . . . . . . . . . . . . . . $ 151,933 $ 151,933 $ 151,503 $ 430 __________________________ __________________________ __________________________ ________________Other Than Personal Services—002 Other Than Personal Services . . . . . . . . 23,825 23,825 18,013 5,812 003 Rent and Energy . . . . . . . . . . . . . . . . . . 27,342 27,352 27,349 3 __________________________ __________________________ __________________________ ________________
Total Other Than Personal Services . . . 51,167 51,177 45,362 5,815 __________________________ __________________________ __________________________ ________________Total Queens Community Board #4 . . . 203,100 203,110 196,865 6,245 Net Change in Estimate of
Prior Payables . . . . . . . . . . . . . . . . . . — — (333) 333 __________________________ __________________________ __________________________ ________________Net Total Queens Community
Board #4 . . . . . . . . . . . . . . . . . . . . . . 203,100 203,110 196,532 6,578 __________________________ __________________________ __________________________ __________________________________________ __________________________ __________________________ ________________435 QUEENS COMMUNITY BOARD #5
001 Personal Services . . . . . . . . . . . . . . . . . . 160,015 145,395 145,394 1 __________________________ __________________________ __________________________ ________________Other Than Personal Services—002 Other Than Personal Services . . . . . . . . 15,743 30,358 24,653 5,705 003 Rent and Energy . . . . . . . . . . . . . . . . . . 23,780 23,646 23,643 3 __________________________ __________________________ __________________________ ________________
Total Other Than Personal Services . . . 39,523 54,004 48,296 5,708 __________________________ __________________________ __________________________ ________________Total Queens Community Board #5 . . . 199,538 199,399 193,690 5,709 __________________________ __________________________ __________________________ __________________________________________ __________________________ __________________________ ________________
436 QUEENS COMMUNITY BOARD #6001 Personal Services . . . . . . . . . . . . . . . . . . 156,130 158,443 158,443 — __________________________ __________________________ __________________________ ________________Other Than Personal Services—002 Other Than Personal Services . . . . . . . . 19,628 17,315 12,482 4,833 003 Rent and Energy . . . . . . . . . . . . . . . . . . 35,286 34,898 34,816 82 __________________________ __________________________ __________________________ ________________
Total Other Than Personal Services . . . 54,914 52,213 47,298 4,915 __________________________ __________________________ __________________________ ________________Total Queens Community Board #6 . . . 211,044 210,656 205,741 4,915 __________________________ __________________________ __________________________ __________________________________________ __________________________ __________________________ ________________
437 QUEENS COMMUNITY BOARD #7001 Personal Services . . . . . . . . . . . . . . . . . . 157,329 150,046 147,007 3,039 __________________________ __________________________ __________________________ ________________Other Than Personal Services—002 Other Than Personal Services . . . . . . . . 18,429 25,712 23,687 2,025 003 Rent . . . . . . . . . . . . . . . . . . . . . . . . . . . . 19,802 19,802 19,800 2 __________________________ __________________________ __________________________ ________________
Total Other Than Personal Services . . . 38,231 45,514 43,487 2,027 __________________________ __________________________ __________________________ ________________Total Queens Community Board #7 . . . 195,560 195,560 190,494 5,066 Net Change in Estimate of
Prior Payables . . . . . . . . . . . . . . . . . . — — (247) 247 __________________________ __________________________ __________________________ ________________Net Total Queens Community
Board #7 . . . . . . . . . . . . . . . . . . . . . . 195,560 195,560 190,247 5,313 __________________________ __________________________ __________________________ __________________________________________ __________________________ __________________________ ________________438 QUEENS COMMUNITY BOARD #8
001 Personal Services . . . . . . . . . . . . . . . . . . 163,705 140,005 139,914 91 __________________________ __________________________ __________________________ ________________Other Than Personal Services—002 Other Than Personal Services . . . . . . . . 12,053 35,753 34,460 1,293 003 Rent . . . . . . . . . . . . . . . . . . . . . . . . . . . . 23,237 13,628 9,626 4,002 __________________________ __________________________ __________________________ ________________
Total Other Than Personal Services . . . 35,290 49,381 44,086 5,295 __________________________ __________________________ __________________________ ________________Total Queens Community Board #8 . . . 198,995 189,386 184,000 5,386Net Change in Estimate of
Prior Payables . . . . . . . . . . . . . . . . . . — — (1,337) 1,337 __________________________ __________________________ __________________________ ________________Net Total Queens Community
Board #8 . . . . . . . . . . . . . . . . . . . . . . 198,995 189,386 182,663 6,723 __________________________ __________________________ __________________________ __________________________________________ __________________________ __________________________ ________________
195
Comptroller’s Report for Fiscal 2002 Part II-E—General Fund—Schedule G5 (Cont.)
Expenditures and Transfers vs. Budget by Unit of Appropriation Within Agency
Actual Better (Worse)Unit of Appropriation Budget Expenditures Than Modified___________________________________________________________________________
Within Agency Adopted Modified and Transfers Budget_____________________________________ _________________________________ _________________________________ _________________________________ _________________________________
(Continued)

439 QUEENS COMMUNITY BOARD #9001 Personal Services . . . . . . . . . . . . . . . . . . $ 157,321 $ 156,961 $ 156,912 $ 49 002 Other Than Personal Services . . . . . . . . 18,437 18,797 18,071 726 __________________________ __________________________ __________________________ ________________
Total Queens Community Board #9 . . . 175,758 175,758 174,983 775 __________________________ __________________________ __________________________ ________________Net Change in Estimate of
Prior Payables . . . . . . . . . . . . . . . . . . — — (142) 142 __________________________ __________________________ __________________________ ________________Net Total Queens Community
Board #9 . . . . . . . . . . . . . . . . . . . . . . 175,758 175,758 174,841 917 __________________________ __________________________ __________________________ __________________________________________ __________________________ __________________________ ________________440 QUEENS COMMUNITY BOARD #10
001 Personal Services . . . . . . . . . . . . . . . . . . 163,073 155,073 154,129 944 __________________________ __________________________ __________________________ ________________Other Than Personal Services—002 Other Than Personal Services . . . . . . . . 12,685 20,685 19,770 915 003 Rent . . . . . . . . . . . . . . . . . . . . . . . . . . . . 27,602 27,602 27,600 2 __________________________ __________________________ __________________________ ________________
Total Other Than Personal Services . . . 40,287 48,287 47,370 917 __________________________ __________________________ __________________________ ________________Total Queens Community Board #10 . . 203,360 203,360 201,499 1,861 Net Change in Estimate of
Prior Payables . . . . . . . . . . . . . . . . . . — — (66) 66 __________________________ __________________________ __________________________ ________________Net Total Queens Community
Board #10 . . . . . . . . . . . . . . . . . . . . . 203,360 203,360 201,433 1,927 __________________________ __________________________ __________________________ __________________________________________ __________________________ __________________________ ________________441 QUEENS COMMUNITY BOARD #11
001 Personal Services . . . . . . . . . . . . . . . . . . 147,128 147,579 147,301 278 __________________________ __________________________ __________________________ ________________Other Than Personal Services—002 Other Than Personal Services . . . . . . . . 28,630 27,503 22,951 4,552 003 Rent . . . . . . . . . . . . . . . . . . . . . . . . . . . . 37,487 42,456 42,405 51 __________________________ __________________________ __________________________ ________________
Total Other Than Personal Services . . . 66,117 69,959 65,356 4,603 __________________________ __________________________ __________________________ ________________Total Queens Community Board #11 . . 213,245 217,538 212,657 4,881 Net Change in Estimate of
Prior Payables . . . . . . . . . . . . . . . . . . — — (824) 824 __________________________ __________________________ __________________________ ________________Net Total Queens Community
Board #11 . . . . . . . . . . . . . . . . . . . . . 213,245 217,538 211,833 5,705 __________________________ __________________________ __________________________ __________________________________________ __________________________ __________________________ ________________442 QUEENS COMMUNITY BOARD #12
001 Personal Services . . . . . . . . . . . . . . . . . . 152,378 95,326 93,911 1,415 __________________________ __________________________ __________________________ ________________Other Than Personal Services—002 Other Than Personal Services . . . . . . . . 23,380 80,432 64,778 15,654 003 Rent and Energy . . . . . . . . . . . . . . . . . . 23,430 22,985 22,983 2 __________________________ __________________________ __________________________ ________________
Total Other Than Personal Services . . . 46,810 103,417 87,761 15,656 __________________________ __________________________ __________________________ ________________Total Queens Community Board #12 . . 199,188 198,743 181,672 17,071 Net Change in Estimate of
Prior Payables . . . . . . . . . . . . . . . . . . — — (1,807) 1,807 __________________________ __________________________ __________________________ ________________Net Total Queens Community
Board #12 . . . . . . . . . . . . . . . . . . . . . 199,188 198,743 179,865 18,878 __________________________ __________________________ __________________________ __________________________________________ __________________________ __________________________ ________________
196
Comptroller’s Report for Fiscal 2002 Part II-E—General Fund—Schedule G5 (Cont.)
Expenditures and Transfers vs. Budget by Unit of Appropriation Within Agency
Actual Better (Worse)Unit of Appropriation Budget Expenditures Than Modified___________________________________________________________________________
Within Agency Adopted Modified and Transfers Budget_____________________________________ _________________________________ _________________________________ _________________________________ _________________________________
(Continued)
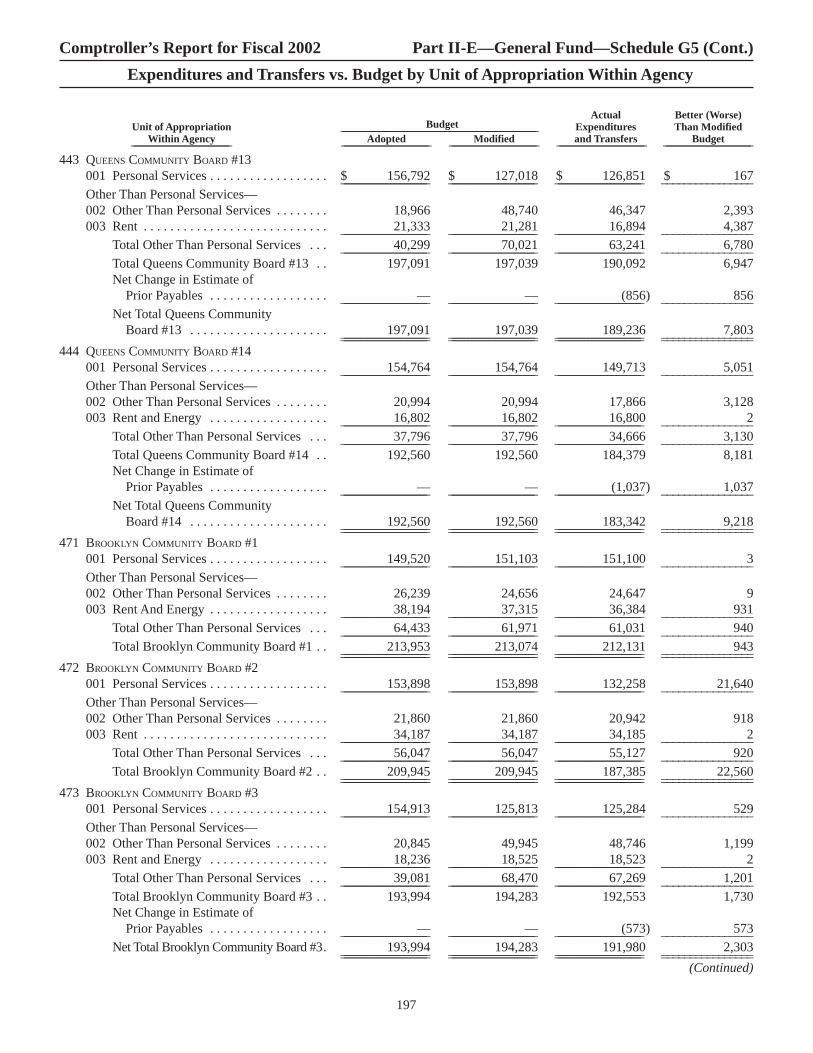
443 QUEENS COMMUNITY BOARD #13001 Personal Services . . . . . . . . . . . . . . . . . . $ 156,792 $ 127,018 $ 126,851 $ 167 __________________________ __________________________ __________________________ ________________Other Than Personal Services—002 Other Than Personal Services . . . . . . . . 18,966 48,740 46,347 2,393 003 Rent . . . . . . . . . . . . . . . . . . . . . . . . . . . . 21,333 21,281 16,894 4,387 __________________________ __________________________ __________________________ ________________
Total Other Than Personal Services . . . 40,299 70,021 63,241 6,780 __________________________ __________________________ __________________________ ________________Total Queens Community Board #13 . . 197,091 197,039 190,092 6,947 Net Change in Estimate of
Prior Payables . . . . . . . . . . . . . . . . . . — — (856) 856 __________________________ __________________________ __________________________ ________________Net Total Queens Community
Board #13 . . . . . . . . . . . . . . . . . . . . . 197,091 197,039 189,236 7,803 __________________________ __________________________ __________________________ __________________________________________ __________________________ __________________________ ________________444 QUEENS COMMUNITY BOARD #14
001 Personal Services . . . . . . . . . . . . . . . . . . 154,764 154,764 149,713 5,051 __________________________ __________________________ __________________________ ________________Other Than Personal Services—002 Other Than Personal Services . . . . . . . . 20,994 20,994 17,866 3,128 003 Rent and Energy . . . . . . . . . . . . . . . . . . 16,802 16,802 16,800 2 __________________________ __________________________ __________________________ ________________
Total Other Than Personal Services . . . 37,796 37,796 34,666 3,130 __________________________ __________________________ __________________________ ________________Total Queens Community Board #14 . . 192,560 192,560 184,379 8,181 Net Change in Estimate of
Prior Payables . . . . . . . . . . . . . . . . . . — — (1,037) 1,037 __________________________ __________________________ __________________________ ________________Net Total Queens Community
Board #14 . . . . . . . . . . . . . . . . . . . . . 192,560 192,560 183,342 9,218 __________________________ __________________________ __________________________ __________________________________________ __________________________ __________________________ ________________471 BROOKLYN COMMUNITY BOARD #1
001 Personal Services . . . . . . . . . . . . . . . . . . 149,520 151,103 151,100 3 __________________________ __________________________ __________________________ ________________Other Than Personal Services—002 Other Than Personal Services . . . . . . . . 26,239 24,656 24,647 9 003 Rent And Energy . . . . . . . . . . . . . . . . . . 38,194 37,315 36,384 931 __________________________ __________________________ __________________________ ________________
Total Other Than Personal Services . . . 64,433 61,971 61,031 940 __________________________ __________________________ __________________________ ________________Total Brooklyn Community Board #1 . . 213,953 213,074 212,131 943 __________________________ __________________________ __________________________ __________________________________________ __________________________ __________________________ ________________
472 BROOKLYN COMMUNITY BOARD #2001 Personal Services . . . . . . . . . . . . . . . . . . 153,898 153,898 132,258 21,640 __________________________ __________________________ __________________________ ________________Other Than Personal Services—002 Other Than Personal Services . . . . . . . . 21,860 21,860 20,942 918 003 Rent . . . . . . . . . . . . . . . . . . . . . . . . . . . . 34,187 34,187 34,185 2 __________________________ __________________________ __________________________ ________________
Total Other Than Personal Services . . . 56,047 56,047 55,127 920 __________________________ __________________________ __________________________ ________________Total Brooklyn Community Board #2 . . 209,945 209,945 187,385 22,560 __________________________ __________________________ __________________________ __________________________________________ __________________________ __________________________ ________________
473 BROOKLYN COMMUNITY BOARD #3001 Personal Services . . . . . . . . . . . . . . . . . . 154,913 125,813 125,284 529 __________________________ __________________________ __________________________ ________________Other Than Personal Services—002 Other Than Personal Services . . . . . . . . 20,845 49,945 48,746 1,199 003 Rent and Energy . . . . . . . . . . . . . . . . . . 18,236 18,525 18,523 2 __________________________ __________________________ __________________________ ________________
Total Other Than Personal Services . . . 39,081 68,470 67,269 1,201 __________________________ __________________________ __________________________ ________________Total Brooklyn Community Board #3 . . 193,994 194,283 192,553 1,730 Net Change in Estimate of
Prior Payables . . . . . . . . . . . . . . . . . . — — (573) 573 __________________________ __________________________ __________________________ ________________Net Total Brooklyn Community Board #3 . 193,994 194,283 191,980 2,303 __________________________ __________________________ __________________________ __________________________________________ __________________________ __________________________ ________________
197
Comptroller’s Report for Fiscal 2002 Part II-E—General Fund—Schedule G5 (Cont.)
Expenditures and Transfers vs. Budget by Unit of Appropriation Within Agency
Actual Better (Worse)Unit of Appropriation Budget Expenditures Than Modified___________________________________________________________________________
Within Agency Adopted Modified and Transfers Budget_____________________________________ _________________________________ _________________________________ _________________________________ _________________________________
(Continued)

474 BROOKLYN COMMUNITY BOARD #4001 Personal Services . . . . . . . . . . . . . . . . . . $ 158,160 $ 149,768 $ 142,590 $ 7,178 __________________________ __________________________ __________________________ ________________Other Than Personal Services—002 Other Than Personal Services . . . . . . . . 17,598 25,990 23,613 2,377 003 Rent . . . . . . . . . . . . . . . . . . . . . . . . . . . . 36,087 36,087 36,085 2 __________________________ __________________________ __________________________ ________________
Total Other Than Personal Services . . . 53,685 62,077 59,698 2,379 __________________________ __________________________ __________________________ ________________Total Brooklyn Community Board #4 . . 211,845 211,845 202,288 9,557 Net Change in Estimate of
Prior Payables . . . . . . . . . . . . . . . . . . — — (245) 245 __________________________ __________________________ __________________________ ________________Net Total Brooklyn Community
Board #4 . . . . . . . . . . . . . . . . . . . . . . 211,845 211,845 202,043 9,802 __________________________ __________________________ __________________________ __________________________________________ __________________________ __________________________ ________________475 BROOKLYN COMMUNITY BOARD #5
001 Personal Services . . . . . . . . . . . . . . . . . . 160,810 152,240 151,774 466 002 Other Than Personal Services . . . . . . . . 14,948 23,518 21,968 1,550 __________________________ __________________________ __________________________ ________________
Total Brooklyn Community Board #5 . . 175,758 175,758 173,742 2,016 __________________________ __________________________ __________________________ __________________________________________ __________________________ __________________________ ________________476 BROOKLYN COMMUNITY BOARD #6
001 Personal Services . . . . . . . . . . . . . . . . . . 160,424 144,003 142,002 2,001 002 Other Than Personal Services . . . . . . . . 15,334 31,755 31,495 260 __________________________ __________________________ __________________________ ________________
Total Brooklyn Community Board #6 . . 175,758 175,758 173,497 2,261 __________________________ __________________________ __________________________ __________________________________________ __________________________ __________________________ ________________477 BROOKLYN COMMUNITY BOARD #7
001 Personal Services . . . . . . . . . . . . . . . . . . 160,513 158,013 157,779 234 002 Other Than Personal Services . . . . . . . . 21,245 23,745 23,177 568 __________________________ __________________________ __________________________ ________________
Total Brooklyn Community Board #7 . . 181,758 181,758 180,956 802 __________________________ __________________________ __________________________ __________________________________________ __________________________ __________________________ ________________478 BROOKLYN COMMUNITY BOARD #8
001 Personal Services . . . . . . . . . . . . . . . . . . 158,563 154,563 153,723 840 __________________________ __________________________ __________________________ ________________Other Than Personal Services—002 Other Than Personal Services . . . . . . . . 17,195 21,195 20,585 610 003 Rent and Energy . . . . . . . . . . . . . . . . . . 38,784 39,863 35,255 4,608 __________________________ __________________________ __________________________ ________________
Total Other Than Personal Services . . . 55,979 61,058 55,840 5,218 __________________________ __________________________ __________________________ ________________Total Brooklyn Community Board #8 . . 214,542 215,621 209,563 6,058 __________________________ __________________________ __________________________ __________________________________________ __________________________ __________________________ ________________
479 BROOKLYN COMMUNITY BOARD #9001 Personal Services . . . . . . . . . . . . . . . . . . 142,753 120,753 113,432 7,321 __________________________ __________________________ __________________________ ________________Other Than Personal Services—002 Other Than Personal Services . . . . . . . . 33,005 55,005 53,749 1,256003 Rent and Energy . . . . . . . . . . . . . . . . . . 4,019 3,673 3,671 2__________________________ __________________________ __________________________ ________________
Total Other Than Personal Services . . . 37,024 58,678 57,420 1,258__________________________ __________________________ __________________________ ________________Total Brooklyn Community Board #9 . . 179,777 179,431 170,852 8,579Net Change in Estimate of
Prior Payables . . . . . . . . . . . . . . . . . . — — (74) 74__________________________ __________________________ __________________________ ________________Net Total Brooklyn Community
Board #9 . . . . . . . . . . . . . . . . . . . . . . 179,777 179,431 170,778 8,653__________________________ __________________________ __________________________ __________________________________________ __________________________ __________________________ ________________480 BROOKLYN COMMUNITY BOARD #10
001 Personal Services . . . . . . . . . . . . . . . . . . 165,399 161,399 160,143 1,256002 Other Than Personal Services . . . . . . . . 10,359 14,359 13,154 1,205__________________________ __________________________ __________________________ ________________
Total Brooklyn Community Board #10 . . 175,758 175,758 173,297 2,461__________________________ __________________________ __________________________ __________________________________________ __________________________ __________________________ ________________
198
Comptroller’s Report for Fiscal 2002 Part II-E—General Fund—Schedule G5 (Cont.)
Expenditures and Transfers vs. Budget by Unit of Appropriation Within Agency
Actual Better (Worse)Unit of Appropriation Budget Expenditures Than Modified___________________________________________________________________________
Within Agency Adopted Modified and Transfers Budget_____________________________________ _________________________________ _________________________________ _________________________________ _________________________________
(Continued)

481 BROOKLYN COMMUNITY BOARD #11001 Personal Services . . . . . . . . . . . . . . . . . . $ 149,769 $ 151,353 $ 151,353 $ — __________________________ __________________________ __________________________ ________________Other Than Personal Services—002 Other Than Personal Services . . . . . . . . 25,989 24,405 22,001 2,404003 Rent and Energy . . . . . . . . . . . . . . . . . . 22,828 25,360 25,358 2__________________________ __________________________ __________________________ ________________
Total Other Than Personal Services . . . 48,817 49,765 47,359 2,406__________________________ __________________________ __________________________ ________________Total Brooklyn Community Board #11 . . 198,586 201,118 198,712 2,406__________________________ __________________________ __________________________ __________________________________________ __________________________ __________________________ ________________
482 BROOKLYN COMMUNITY BOARD #12001 Personal Services . . . . . . . . . . . . . . . . . . 163,840 163,840 163,610 230__________________________ __________________________ __________________________ ________________Other Than Personal Services—002 Other Than Personal Services . . . . . . . . 11,918 11,918 10,373 1,545003 Rent and Energy . . . . . . . . . . . . . . . . . . 42,956 42,593 39,864 2,729__________________________ __________________________ __________________________ ________________
Total Other Than Personal Services . . . 54,874 54,511 50,237 4,274__________________________ __________________________ __________________________ ________________Total Brooklyn Community Board #12 . . 218,714 218,351 213,847 4,504__________________________ __________________________ __________________________ __________________________________________ __________________________ __________________________ ________________
483 BROOKLYN COMMUNITY BOARD #13001 Personal Services . . . . . . . . . . . . . . . . . . 150,516 124,553 124,553 — __________________________ __________________________ __________________________ ________________Other Than Personal Services—002 Other Than Personal Services . . . . . . . . 25,242 51,205 34,150 17,055003 Rent . . . . . . . . . . . . . . . . . . . . . . . . . . . . 16,812 18,885 9,295 9,590__________________________ __________________________ __________________________ ________________
Total Other Than Personal Services . . . 42,054 70,090 43,445 26,645__________________________ __________________________ __________________________ ________________Total Brooklyn Community Board #13 . . 192,570 194,643 167,998 26,645__________________________ __________________________ __________________________ __________________________________________ __________________________ __________________________ ________________
484 BROOKLYN COMMUNITY BOARD #14001 Personal Services . . . . . . . . . . . . . . . . . . 155,297 148,271 148,214 57 __________________________ __________________________ __________________________ ________________Other Than Personal Services—002 Other Than Personal Services . . . . . . . . 20,461 27,487 25,306 2,181 003 Rent and Energy . . . . . . . . . . . . . . . . . . 54,978 53,304 51,999 1,305__________________________ __________________________ __________________________ ________________
Total Other Than Personal Services . . . 75,439 80,791 77,305 3,486__________________________ __________________________ __________________________ ________________Total Brooklyn Community Board #14 . . 230,736 229,062 225,519 3,543__________________________ __________________________ __________________________ __________________________________________ __________________________ __________________________ ________________
485 BROOKLYN COMMUNITY BOARD #15001 Personal Services . . . . . . . . . . . . . . . . . . 162,789 141,984 141,984 — 002 Other Than Personal Services . . . . . . . . 12,969 33,774 31,769 2,005__________________________ __________________________ __________________________ ________________
Total Brooklyn Community Board #15 . . 175,758 175,758 173,753 2,005__________________________ __________________________ __________________________ __________________________________________ __________________________ __________________________ ________________486 BROOKLYN COMMUNITY BOARD #16
001 Personal Services . . . . . . . . . . . . . . . . . . 165,110 165,110 156,053 9,057__________________________ __________________________ __________________________ ________________Other Than Personal Services—002 Other Than Personal Services . . . . . . . . 10,648 10,648 9,173 1,475003 Rent . . . . . . . . . . . . . . . . . . . . . . . . . . . . 20,579 20,579 20,576 3__________________________ __________________________ __________________________ ________________
Total Other Than Personal Services . . . 31,227 31,227 29,749 1,478__________________________ __________________________ __________________________ ________________Total Brooklyn Community Board #16 . . 196,337 196,337 185,802 10,535__________________________ __________________________ __________________________ __________________________________________ __________________________ __________________________ ________________
199
Comptroller’s Report for Fiscal 2002 Part II-E—General Fund—Schedule G5 (Cont.)
Expenditures and Transfers vs. Budget by Unit of Appropriation Within Agency
Actual Better (Worse)Unit of Appropriation Budget Expenditures Than Modified___________________________________________________________________________
Within Agency Adopted Modified and Transfers Budget_____________________________________ _________________________________ _________________________________ _________________________________ _________________________________
(Continued)

487 BROOKLYN COMMUNITY BOARD #17001 Personal Services . . . . . . . . . . . . . . . . . . $ 157,638 $ 157,638 $ 157,230 $ 408__________________________ __________________________ __________________________ ________________Other Than Personal Services—002 Other Than Personal Services . . . . . . . . 18,120 18,120 15,609 2,511003 Rent and Energy . . . . . . . . . . . . . . . . . . 47,607 48,551 47,597 954__________________________ __________________________ __________________________ ________________
Total Other Than Personal Services . . . 65,727 66,671 63,206 3,465__________________________ __________________________ __________________________ ________________Total Brooklyn Community Board #17 . . 223,365 224,309 220,436 3,873__________________________ __________________________ __________________________ __________________________________________ __________________________ __________________________ ________________
488 BROOKLYN COMMUNITY BOARD #18001 Personal Services . . . . . . . . . . . . . . . . . . 143,728 143,728 125,914 17,814__________________________ __________________________ __________________________ ________________Other Than Personal Services—002 Other Than Personal Services . . . . . . . . 32,030 32,030 29,379 2,651003 Rent . . . . . . . . . . . . . . . . . . . . . . . . . . . . 10,602 10,602 — 10,602__________________________ __________________________ __________________________ ________________
Total Other Than Personal Services . . . 42,632 42,632 29,379 13,253__________________________ __________________________ __________________________ ________________Total Brooklyn Community Board #18 . . 186,360 186,360 155,293 31,067Net Change in Estimate of
Prior Payables . . . . . . . . . . . . . . . . . . — — (353) 353__________________________ __________________________ __________________________ ________________Net Total Brooklyn Community
Board #18 . . . . . . . . . . . . . . . . . . . . . 186,360 186,360 154,940 31,420__________________________ __________________________ __________________________ __________________________________________ __________________________ __________________________ ________________491 STATEN ISLAND COMMUNITY BOARD #1
001 Personal Services . . . . . . . . . . . . . . . . . . 163,177 163,177 162,944 233__________________________ __________________________ __________________________ ________________Other Than Personal Services—002 Other Than Personal Services . . . . . . . . 12,581 12,581 8,164 4,417003 Rent . . . . . . . . . . . . . . . . . . . . . . . . . . . . 41,182 41,290 40,760 530__________________________ __________________________ __________________________ ________________
Total Other Than Personal Services . . . 53,763 53,871 48,924 4,947__________________________ __________________________ __________________________ ________________Total Staten Island Community
Board #1 . . . . . . . . . . . . . . . . . . . . . . 216,940 217,048 211,868 5,180Net Change in Estimate of
Prior Payables . . . . . . . . . . . . . . . . . . — — (171) 171__________________________ __________________________ __________________________ ________________Net Total Staten Island Community
Board #1 . . . . . . . . . . . . . . . . . . . . . . 216,940 217,048 211,697 5,351__________________________ __________________________ __________________________ __________________________________________ __________________________ __________________________ ________________492 STATEN ISLAND COMMUNITY BOARD #2
001 Personal Services . . . . . . . . . . . . . . . . . . 157,492 157,492 155,317 2,175__________________________ __________________________ __________________________ ________________Other Than Personal Services—002 Other Than Personal Services . . . . . . . . 18,266 18,266 17,391 875003 Rent . . . . . . . . . . . . . . . . . . . . . . . . . . . . 45,002 45,002 — 45,002__________________________ __________________________ __________________________ ________________
Total Other Than Personal Services . . . 63,268 63,268 17,391 45,877__________________________ __________________________ __________________________ ________________Total Staten Island Community
Board #2 . . . . . . . . . . . . . . . . . . . . . . 220,760 220,760 172,708 48,052__________________________ __________________________ __________________________ __________________________________________ __________________________ __________________________ ________________493 STATEN ISLAND COMMUNITY BOARD #3
001 Personal Services . . . . . . . . . . . . . . . . . . 160,648 160,648 158,438 2,210__________________________ __________________________ __________________________ ________________Other Than Personal Services—002 Other Than Personal Services . . . . . . . . 15,110 15,110 10,038 5,072003 Rent and Energy . . . . . . . . . . . . . . . . . . 54,726 53,826 52,914 912__________________________ __________________________ __________________________ ________________
Total Other Than Personal Services . . . 69,836 68,936 62,952 5,984__________________________ __________________________ __________________________ ________________Total Staten Island Community
Board #3 . . . . . . . . . . . . . . . . . . . . . . 230,484 229,584 221,390 8,194__________________________ __________________________ __________________________ __________________________________________ __________________________ __________________________ ________________
200
Comptroller’s Report for Fiscal 2002 Part II-E—General Fund—Schedule G5 (Cont.)
Expenditures and Transfers vs. Budget by Unit of Appropriation Within Agency
Actual Better (Worse)Unit of Appropriation Budget Expenditures Than Modified___________________________________________________________________________
Within Agency Adopted Modified and Transfers Budget_____________________________________ _________________________________ _________________________________ _________________________________ _________________________________
(Continued)

201
(Continued)
781 DEPARTMENT OF PROBATION
Personal Services—001 Executive Management . . . . . . . . . . . . . $ 6,648,266 $ 9,320,280 $ 7,736,202 $ 1,584,078002 Probation Services . . . . . . . . . . . . . . . . . 67,150,908 62,712,108 61,533,277 1,178,831__________________________ __________________________ __________________________ _________________
Total Personal Services . . . . . . . . . . . . . 73,799,174 72,032,388 69,269,479 2,762,909__________________________ __________________________ __________________________ ________________Other Than Personal Services—003 Probation Services . . . . . . . . . . . . . . . . . 18,628,728 20,947,977 20,204,482 743,495004 Executive Management . . . . . . . . . . . . . 241,318 243,130 186,264 56,866__________________________ __________________________ __________________________ ________________
Total Other Than Personal Services . . . 18,870,046 21,191,107 20,390,746 800,361__________________________ __________________________ __________________________ ________________92,669,220 93,223,495 89,660,225 3,563,270
Intracity Sales . . . . . . . . . . . . . . . . . . . . — (3,097,281) (665,692) (2,431,589)__________________________ __________________________ __________________________ ________________Total Department of Probation . . . . . . . 92,669,220 90,126,214 88,994,533 1,131,681Net Change in Estimate of
Prior Payables . . . . . . . . . . . . . . . . . . — — (6,367) 6,367__________________________ __________________________ __________________________ ________________Net Total Department of Probation . . . . 92,669,220 90,126,214 88,988,166 1,138,048__________________________ __________________________ __________________________ __________________________________________ __________________________ __________________________ ________________
801 DEPARTMENT OF BUSINESS SERVICES
Personal Services—001 Department of Business Opportunity . . 5,014,400 5,521,542 5,381,463 140,079004 Contract Compliance and Business
Opportunity . . . . . . . . . . . . . . . . . . . . 664,764 664,764 597,844 66,920008 Economic Planning/Film . . . . . . . . . . . . 1,134,543 1,062,852 1,059,845 3,007__________________________ __________________________ __________________________ ________________
Total Personal Services . . . . . . . . . . . . . 6,813,707 7,249,158 7,039,152 210,006__________________________ __________________________ __________________________ ________________Other Than Personal Services—002 Department of Business Opportunity . . 32,784,433 26,547,072 26,286,212 260,860005 Contract Compliance and Business
Opportunity . . . . . . . . . . . . . . . . . . . . 56,557 56,557 41,033 15,524006 Economic Development Corporation . . 4,056,540 29,319,553 63,711,243 (34,391,690)009 Economic Planning/Film . . . . . . . . . . . . 172,359 172,359 151,806 20,553__________________________ __________________________ __________________________ ________________
Total Other Than Personal Services . . . 37,069,889 56,095,541 90,190,294 (34,094,753)__________________________ __________________________ __________________________ ________________43,883,596 63,344,699 97,229,446 (33,884,747)
Intracity Sales . . . . . . . . . . . . . . . . . . . . (9,855) (1,069,522) — (1,069,522)__________________________ __________________________ __________________________ ________________Total Department of Business Services . . 43,873,741 62,275,177 97,229,446 (34,954,269)Net Change in Estimate of
Prior Payables . . . . . . . . . . . . . . . . . . — — (7,500) 7,500__________________________ __________________________ __________________________ ________________Net Total Department of Business
Services . . . . . . . . . . . . . . . . . . . . . . . 43,873,741 62,275,177 97,221,946 (34,946,769)__________________________ __________________________ __________________________ __________________________________________ __________________________ __________________________ ________________806 DEPARTMENT OF HOUSING PRESERVATION AND
DEVELOPMENT
Personal Services—001 Office of Administration . . . . . . . . . . . . 17,459,423 22,455,267 22,450,050 5,217002 Office of Development . . . . . . . . . . . . . 13,281,802 15,243,283 15,243,087 196004 Office of Housing Preservation . . . . . . . 44,830,460 42,592,985 42,443,310 149,675006 Housing Maintenance and Sales . . . . . . 47,688,357 43,255,301 39,324,442 3,930,859__________________________ __________________________ __________________________ ________________
Total Personal Services . . . . . . . . . . . . . 123,260,042 123,546,836 119,460,889 4,085,947__________________________ __________________________ __________________________ ________________
Comptroller’s Report for Fiscal 2002 Part II-E—General Fund—Schedule G5 (Cont.)
Expenditures and Transfers vs. Budget by Unit of Appropriation Within Agency
Actual Better (Worse)Unit of Appropriation Budget Expenditures Than Modified___________________________________________________________________________
Within Agency Adopted Modified and Transfers Budget_____________________________________ _________________________________ _________________________________ _________________________________ _________________________________

806 DEPARTMENT OF HOUSING PRESERVATION AND
DEVELOPMENT (cont.)Other Than Personal Services—008 Office of Administration . . . . . . . . . . . . $ 33,037,881 $ 32,352,923 $ 31,768,153 $ 584,770009 Office of Development . . . . . . . . . . . . . 125,938,783 141,097,598 138,146,465 2,951,133010 Housing Management and Sales . . . . . . 84,468,100 72,170,349 68,738,469 3,431,880011 Office of Housing Preservation . . . . . . . 64,986,717 53,018,341 49,915,621 3,102,720__________________________ __________________________ __________________________ ________________
Total Other Than Personal Services . . . 308,431,481 298,639,211 288,568,708 10,070,503__________________________ __________________________ __________________________ ________________431,691,523 422,186,047 408,029,597 14,156,450
Interfund Agreements . . . . . . . . . . . . . . (17,000,041) (14,214,936) (14,080,402) (134,534)Intracity Sales . . . . . . . . . . . . . . . . . . . . (9,965,473) (12,922,861) (12,770,184) (152,677)__________________________ __________________________ __________________________ ________________Total Department of Housing
Preservation and Development . . . . . 404,726,009 395,048,250 381,179,011 13,869,239Net Change in Estimate of
Prior Payables . . . . . . . . . . . . . . . . . . — — (9,936,278) 9,936,278__________________________ __________________________ __________________________ ________________Net Total Department of Housing
Preservation and Development . . . . . 404,726,009 395,048,250 371,242,733 23,805,517__________________________ __________________________ __________________________ __________________________________________ __________________________ __________________________ ________________810 DEPARTMENT OF BUILDINGS
001 Personal Services . . . . . . . . . . . . . . . . . . 18,436,973 39,978,038 40,137,780 (159,742)002 Other Than Personal Services . . . . . . . . 11,680,270 16,447,949 16,240,421 207,528 __________________________ __________________________ __________________________ ________________
30,117,243 56,425,987 56,378,201 47,786 Intracity Sales . . . . . . . . . . . . . . . . . . . . (257,900) (501,055) (501,055) — __________________________ __________________________ __________________________ ________________Total Department of Buildings . . . . . . . 29,859,343 55,924,932 55,877,146 47,786 Net Change in Estimate of
Prior Payables . . . . . . . . . . . . . . . . . . — — (16,880) 16,880 __________________________ __________________________ __________________________ ________________Net Total Department of Buildings . . . . 29,859,343 55,924,932 55,860,266 64,666 __________________________ __________________________ __________________________ __________________________________________ __________________________ __________________________ ________________
816 DEPARTMENT OF HEALTH
Personal Services— 101 Administration and Support Services . . 23,024,282 30,880,443 30,776,951 103,492 102 Health Related Services . . . . . . . . . . . . 77,268,083 78,700,423 76,021,969 2,678,454 103 Community Health Services . . . . . . . . . 91,746,890 80,063,158 79,712,544 350,614 104 Environmental Health Services . . . . . . . 28,063,395 24,165,121 22,513,832 1,651,289 106 Chief Medical Examiner . . . . . . . . . . . . 19,437,002 20,940,593 20,084,716 855,877 107 Health Access . . . . . . . . . . . . . . . . . . . . 2,003,049 2,828,843 2,773,048 55,795 __________________________ __________________________ __________________________ ________________
Total Personal Services . . . . . . . . . . . . . 241,542,701 237,578,581 231,883,060 5,695,521 __________________________ __________________________ __________________________ ________________Other Than Personal Services— 111 Management and Administration . . . . . 27,022,814 30,830,331 30,518,420 311,911 112 Health Related Services . . . . . . . . . . . . 116,947,323 193,337,989 189,631,130 3,706,859 113 Community Health Services . . . . . . . . . 374,585,371 408,254,738 406,223,064 2,031,674 114 Environmental Health Services . . . . . . . 42,071,157 33,741,642 32,611,761 1,129,881 115 Prison Health Services . . . . . . . . . . . . . 135,728,220 140,039,845 139,842,341 197,504
202
Comptroller’s Report for Fiscal 2002 Part II-E—General Fund—Schedule G5 (Cont.)
Expenditures and Transfers vs. Budget by Unit of Appropriation Within Agency
Actual Better (Worse)Unit of Appropriation Budget Expenditures Than Modified___________________________________________________________________________
Within Agency Adopted Modified and Transfers Budget_____________________________________ _________________________________ _________________________________ _________________________________ _________________________________
(Continued)

816 DEPARTMENT OF HEALTH (cont.)Other Than Personal Services—(cont.)116 Chief Medical Examiner . . . . . . . . . . . . $ 11,788,601 $ 27,893,036 $ 27,947,202 $ (54,166)117 Health Access . . . . . . . . . . . . . . . . . . . . 8,419,609 6,844,855 5,116,627 1,728,228 __________________________ __________________________ __________________________ ________________
Total Other Than Personal Services . . . 716,563,095 840,942,436 831,890,545 9,051,891 __________________________ __________________________ __________________________ ________________958,105,796 1,078,521,017 1,063,773,605 14,747,412
Intracity Sales . . . . . . . . . . . . . . . . . . . . (3,911,367) (7,749,715) (3,170,031) (4,579,684)__________________________ __________________________ __________________________ ________________Total Department of Health . . . . . . . . . . 954,194,429 1,070,771,302 1,060,603,574 10,167,728 Net Change in Estimate of
Prior Payables . . . . . . . . . . . . . . . . . . — — (11,469,019) 11,469,019 __________________________ __________________________ __________________________ ________________Net Total Department of Health . . . . . . 954,194,429 1,070,771,302 1,049,134,555 21,636,747 __________________________ __________________________ __________________________ __________________________________________ __________________________ __________________________ ________________
817 DEPARTMENT OF MENTAL HEALTH, MENTAL
RETARDATION AND ALCOHOLISM SERVICES
Personal Services—001 Personal Services . . . . . . . . . . . . . . . . . . 13,333,679 14,731,792 13,046,229 1,685,563 006 Early Intervention . . . . . . . . . . . . . . . . . 370,877 370,877 187,199 183,678 __________________________ __________________________ __________________________ ________________
Total Personal Services . . . . . . . . . . . . . 13,704,556 15,102,669 13,233,428 1,869,241 __________________________ __________________________ __________________________ ________________Other Than Personal Services— 002 Other Than Personal Services . . . . . . . . 5,435,530 5,519,550 4,730,063 789,487 003 Mental Health Services . . . . . . . . . . . . . 126,305,085 191,233,187 166,550,572 24,682,615 004 Mental Retardation Services . . . . . . . . . 46,815,430 42,474,318 42,470,818 3,500 005 Alcholism Services . . . . . . . . . . . . . . . . 51,616,640 54,441,665 51,705,035 2,736,630 007 Early Intervention . . . . . . . . . . . . . . . . . 345,114,176 370,522,726 369,775,054 747,672 __________________________ __________________________ __________________________ ________________
Total Other Than Personal Services . . . 575,286,861 664,191,446 635,231,542 28,959,904 __________________________ __________________________ __________________________ ________________588,991,417 679,294,115 648,464,970 30,829,145
Intracity Sales . . . . . . . . . . . . . . . . . . . . (345,469,091) (374,659,466) (372,386,971) (2,272,495)__________________________ __________________________ __________________________ ________________Total Department of Mental Health,
Mental Retardation and Alcoholism Services . . . . . . . . . . . . . . . . . . . . . . . 243,522,326 304,634,649 276,077,999 28,556,650
Net Change in Estimate of Prior Payables . . . . . . . . . . . . . . . . . . — — (20,013,899) 20,013,899 __________________________ __________________________ __________________________ ________________
Net Total Department of Mental Health,Mental Retardation and AlcoholismServices . . . . . . . . . . . . . . . . . . . . . . . 243,522,326 304,634,649 256,064,100 48,570,549 __________________________ __________________________ __________________________ __________________________________________ __________________________ __________________________ ________________
819 NEW YORK CITY HEALTH AND HOSPITALS
CORPORATION
001 Lump Sum . . . . . . . . . . . . . . . . . . . . . . . 974,852,886 922,683,738 909,464,562 13,219,176 Intracity Sales . . . . . . . . . . . . . . . . . . . . (139,489,850) (90,363,942) (83,027,778) (7,336,164)__________________________ __________________________ __________________________ ________________Total New York City Health andHospitals Corporation . . . . . . . . . . . . . . 835,363,036 832,319,796 826,436,784 5,883,012 Net Change in Estimate of
Prior Payables . . . . . . . . . . . . . . . . . . — — (129,565) 129,565 __________________________ __________________________ __________________________ ________________Net Total New York City Health and
Hospitals Corporation . . . . . . . . . . . . 835,363,036 832,319,796 826,307,219 6,012,577 __________________________ __________________________ __________________________ __________________________________________ __________________________ __________________________ ________________
203
Comptroller’s Report for Fiscal 2002 Part II-E—General Fund—Schedule G5 (Cont.)
Expenditures and Transfers vs. Budget by Unit of Appropriation Within Agency
Actual Better (Worse)Unit of Appropriation Budget Expenditures Than Modified___________________________________________________________________________
Within Agency Adopted Modified and Transfers Budget_____________________________________ _________________________________ _________________________________ _________________________________ _________________________________
(Continued)

826 DEPARTMENT OF ENVIRONMENTAL PROTECTION
Personal Services— 001 Executive and Support . . . . . . . . . . . . . . $ 23,968,493 $ 27,293,742 $ 24,413,799 $ 2,879,943 002 Environmental Management . . . . . . . . . 18,460,195 17,310,195 17,300,646 9,549 003 Water Supply and Wastewater
Collection . . . . . . . . . . . . . . . . . . . . . 116,748,787 114,529,271 114,074,237 455,034 007 Central Utility . . . . . . . . . . . . . . . . . . . . 56,400,572 55,571,802 54,715,060 856,742 008 Wastewater Treatment . . . . . . . . . . . . . . 111,159,615 109,786,695 109,655,412 131,283 __________________________ __________________________ __________________________ ________________
Total Personal Services . . . . . . . . . . . . . 326,737,662 324,491,705 320,159,154 4,332,551 __________________________ __________________________ __________________________ ________________Other Than Personal Services— 004 Utility . . . . . . . . . . . . . . . . . . . . . . . . . . 333,023,700 317,529,081 311,276,678 6,252,403 005 Environmental Management . . . . . . . . . 6,635,946 8,892,702 6,781,057 2,111,645 006 Executive and Support . . . . . . . . . . . . . . 31,429,988 31,088,429 29,999,994 1,088,435 __________________________ __________________________ __________________________ ________________
Total Other Than Personal Services . . . 371,089,634 357,510,212 348,057,729 9,452,483 __________________________ __________________________ __________________________ ________________697,827,296 682,001,917 668,216,883 13,785,034
Interfund Agreements . . . . . . . . . . . . . . (37,302,046) (37,302,046) (33,601,845) (3,700,201)Intracity Sales . . . . . . . . . . . . . . . . . . . . (492,485) (492,485) (492,484) (1)__________________________ __________________________ __________________________ ________________Total Department of Environmental
Protection . . . . . . . . . . . . . . . . . . . . . 660,032,765 644,207,386 634,122,554 10,084,832 Net Change in Estimate of
Prior Payables . . . . . . . . . . . . . . . . . . — — (17,502,224) 17,502,224 __________________________ __________________________ __________________________ ________________Net Total Department of Environmental
Protection . . . . . . . . . . . . . . . . . . . . . 660,032,765 644,207,386 616,620,330 27,587,056 __________________________ __________________________ __________________________ __________________________________________ __________________________ __________________________ ________________827 DEPARTMENT OF SANITATION
Personal Services— 101 Executive Administrative . . . . . . . . . . . . 50,150,231 77,185,699 75,117,045 2,068,654 102 Cleaning and Collection . . . . . . . . . . . . 443,686,982 471,391,718 466,348,688 5,043,030 103 Waste Disposal . . . . . . . . . . . . . . . . . . . 22,740,267 29,698,356 29,589,488 108,868 104 Building Management . . . . . . . . . . . . . . 12,000,011 12,255,316 11,889,914 365,402 105 Bureau of Motor Equipment . . . . . . . . . 49,307,066 55,506,859 54,070,004 1,436,855 107 Snow Budget . . . . . . . . . . . . . . . . . . . . . 10,329,934 6,389,668 6,389,668 — __________________________ __________________________ __________________________ ________________
Total Personal Services . . . . . . . . . . . . . 588,214,491 652,427,616 643,404,807 9,022,809 __________________________ __________________________ __________________________ ________________Other Than Personal Services— 106 Executive and Administrative . . . . . . . . 46,347,062 39,650,430 37,195,287 2,455,143 109 Cleaning and Collection . . . . . . . . . . . . 8,866,294 8,036,634 7,598,367 438,267 110 Waste Disposal . . . . . . . . . . . . . . . . . . . 311,549,186 280,872,101 280,681,788 190,313 111 Building Management . . . . . . . . . . . . . . 2,744,616 2,953,249 2,949,476 3,773 112 Motor Equipment . . . . . . . . . . . . . . . . . 23,288,280 25,981,834 25,981,333 501 113 Snow Budget . . . . . . . . . . . . . . . . . . . . . 12,345,547 7,504,142 7,501,082 3,060 __________________________ __________________________ __________________________ ________________
Total Other Than Personal Services . . . 405,140,985 364,998,390 361,907,333 3,091,057 __________________________ __________________________ __________________________ ________________993,355,476 1,017,426,006 1,005,312,140 12,113,866
Interfund Agreements . . . . . . . . . . . . . . (12,492,749) (11,546,952) (5,578,184) (5,968,768)Intracity Sales . . . . . . . . . . . . . . . . . . . . (6,546,384) (3,745,289) (3,700,742) (44,547)__________________________ __________________________ __________________________ ________________Total Department of Sanitation . . . . . . . 974,316,343 1,002,133,765 996,033,214 6,100,551 Net Change in Estimate of
Prior Payables . . . . . . . . . . . . . . . . . . — — (12,907,677) 12,907,677 __________________________ __________________________ __________________________ ________________Net Total Department of Sanitation . . . . 974,316,343 1,002,133,765 983,125,537 19,008,228 __________________________ __________________________ __________________________ __________________________________________ __________________________ __________________________ ________________
204
Comptroller’s Report for Fiscal 2002 Part II-E—General Fund—Schedule G5 (Cont.)
Expenditures and Transfers vs. Budget by Unit of Appropriation Within Agency
Actual Better (Worse)Unit of Appropriation Budget Expenditures Than Modified___________________________________________________________________________
Within Agency Adopted Modified and Transfers Budget_____________________________________ _________________________________ _________________________________ _________________________________ _________________________________
(Continued)

829 TRADE WASTE COMMISSION
001 Personal Services . . . . . . . . . . . . . . . . . . $ 2,384,019 $ 2,094,189 $ 2,176,044 $ (81,855)002 Other Than Personal Services . . . . . . . . 597,250 607,521 603,063 4,458 __________________________ __________________________ __________________________ ________________
Total Trade Waste Commission . . . . . . . 2,981,269 2,701,710 2,779,107 (77,397)__________________________ __________________________ __________________________ __________________________________________ __________________________ __________________________ ________________836 DEPARTMENT OF FINANCE
Personal Services— 001 Administration and Planning . . . . . . . . . 31,626,402 34,673,507 34,621,150 52,357 002 Operations . . . . . . . . . . . . . . . . . . . . . . . 19,319,372 18,204,372 18,170,729 33,643 003 Property . . . . . . . . . . . . . . . . . . . . . . . . . 19,262,985 19,562,985 19,524,867 38,118 004 Audit . . . . . . . . . . . . . . . . . . . . . . . . . . . 22,868,829 21,753,829 21,737,582 16,247 005 Legal . . . . . . . . . . . . . . . . . . . . . . . . . . . 3,501,211 3,326,211 3,320,635 5,576 006 Tax Appeals Tribunal . . . . . . . . . . . . . . . 1,410,382 1,310,382 1,298,125 12,257 007 Parking Violations Bureau . . . . . . . . . . . 10,108,103 7,623,103 7,573,895 49,208 009 City Sheriff . . . . . . . . . . . . . . . . . . . . . . 10,402,944 10,676,479 10,615,594 60,885 __________________________ __________________________ __________________________ ________________
Total Personal Services . . . . . . . . . . . . . 118,500,228 117,130,868 116,862,577 268,291 __________________________ __________________________ __________________________ ________________Other Than Personal Services— 011 Administration . . . . . . . . . . . . . . . . . . . . 71,978,846 59,236,196 56,729,516 2,506,680 022 Operations . . . . . . . . . . . . . . . . . . . . . . . 9,045,000 4,881,000 4,734,865 146,135 033 Property . . . . . . . . . . . . . . . . . . . . . . . . . 4,608,000 1,236,200 1,099,602 136,598 044 Audit . . . . . . . . . . . . . . . . . . . . . . . . . . . 460,000 423,000 386,648 36,352 055 Legal . . . . . . . . . . . . . . . . . . . . . . . . . . . 141,990 127,490 97,172 30,318 066 Tax Appeals Tribunal . . . . . . . . . . . . . . . 237,465 193,215 166,083 27,132 077 Parking Violations Bureau . . . . . . . . . . . 450,000 400,000 387,646 12,354 099 City Sheriff . . . . . . . . . . . . . . . . . . . . . . 3,572,513 3,411,513 3,354,725 56,788 __________________________ __________________________ __________________________ ________________
Total Other Than Personal Services . . . 90,493,814 69,908,614 66,956,257 2,952,357 __________________________ __________________________ __________________________ ________________208,994,042 187,039,482 183,818,834 3,220,648
Intracity Sales . . . . . . . . . . . . . . . . . . . . (2,205,919) (2,229,488) (486,538) (1,742,950)__________________________ __________________________ __________________________ ________________Total Department of Finance . . . . . . . . . 206,788,123 184,809,994 183,332,296 1,477,698 Net Change in Estimate of
Prior Payables . . . . . . . . . . . . . . . . . . — — (1,013,644) 1,013,644 __________________________ __________________________ __________________________ ________________Net Total Department of Finance . . . . . 206,788,123 184,809,994 182,318,652 2,491,342 __________________________ __________________________ __________________________ __________________________________________ __________________________ __________________________ ________________
841 DEPARTMENT OF TRANSPORTATION
Personal Services— 001 Executive Administration and
Planning Management . . . . . . . . . . . . 26,961,408 40,365,809 37,948,598 2,417,211 002 Highway Operations . . . . . . . . . . . . . . . 65,404,153 75,073,288 73,755,483 1,317,805 003 Transit Operations . . . . . . . . . . . . . . . . . 35,180,073 40,039,717 40,036,220 3,497 004 Traffic Operations . . . . . . . . . . . . . . . . . 50,158,116 57,970,058 56,655,757 1,314,301 006 Bureau of Bridges . . . . . . . . . . . . . . . . . 47,706,571 50,393,628 47,070,576 3,323,052 __________________________ __________________________ __________________________ ________________
Total Personal Services . . . . . . . . . . . . . 225,410,321 263,842,500 255,466,634 8,375,866 __________________________ __________________________ __________________________ ________________Other Than Personal Services— 007 Bureau of Bridges . . . . . . . . . . . . . . . . . 13,054,388 15,802,511 11,943,052 3,859,459 011 Executive and Administration . . . . . . . . 16,151,705 16,714,517 16,492,494 222,023 012 Highway Operations . . . . . . . . . . . . . . . 37,005,668 43,846,066 38,787,856 5,058,210
205
Comptroller’s Report for Fiscal 2002 Part II-E—General Fund—Schedule G5 (Cont.)
Expenditures and Transfers vs. Budget by Unit of Appropriation Within Agency
Actual Better (Worse)Unit of Appropriation Budget Expenditures Than Modified___________________________________________________________________________
Within Agency Adopted Modified and Transfers Budget_____________________________________ _________________________________ _________________________________ _________________________________ _________________________________
(Continued)

841 DEPARTMENT OF TRANSPORTATION (cont.)Other Than Personal Services—(cont.)013 Transit Operations . . . . . . . . . . . . . . . . . $ 58,702,994 $ 59,282,781 $ 58,574,049 $ 708,732 014 Traffic Operations . . . . . . . . . . . . . . . . . 124,886,252 134,734,856 133,861,629 873,227 __________________________ __________________________ __________________________ ________________
Total Other Than Personal Services 249,801,007 270,380,731 259,659,080 10,721,651 __________________________ __________________________ __________________________ ________________475,211,328 534,223,231 515,125,714 19,097,517
Interfund Agreements . . . . . . . . . . . . . . (88,726,721) (94,952,602) (94,583,430) (369,172)Intracity Sales . . . . . . . . . . . . . . . . . . . . (51,670,647) (56,110,980) (55,843,385) (267,595)__________________________ __________________________ __________________________ ________________Total Department of Transportation . . . 334,813,960 383,159,649 364,698,899 18,460,750 Net Change in Estimate of
Prior Payables . . . . . . . . . . . . . . . . . . — — (5,810,990) 5,810,990 __________________________ __________________________ __________________________ ________________Net Total Department of Transportation . . 334,813,960 383,159,649 358,887,909 24,271,740 __________________________ __________________________ __________________________ __________________________________________ __________________________ __________________________ ________________
846 DEPARTMENT OF PARKS AND RECREATION
Personal Services— 001 Executive Management and
Administrative Services . . . . . . . . . . . 7,099,549 7,751,893 7,460,157 291,736 002 Maintenance and Operations . . . . . . . . . 124,689,342 180,660,925 178,999,291 1,661,634 003 Design and Engineering . . . . . . . . . . . . 15,573,092 15,573,092 15,573,092 — 004 Recreation Services . . . . . . . . . . . . . . . . 8,313,391 13,415,073 12,898,549 516,524 __________________________ __________________________ __________________________ ________________
Total Personal Services . . . . . . . . . . . . . 155,675,374 217,400,983 214,931,089 2,469,894 __________________________ __________________________ __________________________ ________________Other Than Personal Services— 006 Maintenance and Operations . . . . . . . . . 33,592,002 36,854,034 35,726,821 1,127,213 007 Executive Management and
Administrative Services . . . . . . . . . . . 19,536,383 19,043,306 18,899,772 143,534 009 Recreation Services . . . . . . . . . . . . . . . . 435,799 926,099 819,241 106,858 010 Design and Engineering . . . . . . . . . . . . 493,878 673,378 457,269 216,109 __________________________ __________________________ __________________________ ________________
Total Other Than Personal Services . . . 54,058,062 57,496,817 55,903,103 1,593,714 __________________________ __________________________ __________________________ ________________209,733,436 274,897,800 270,834,192 4,063,608
Interfund Agreements . . . . . . . . . . . . . . (16,066,970) (16,246,470) (16,246,470) — Intracity Sales . . . . . . . . . . . . . . . . . . . . (16,244,049) (74,379,000) (72,614,438) (1,764,562)__________________________ __________________________ __________________________ ________________Total Department of Parks and
Recreation . . . . . . . . . . . . . . . . . . . . . 177,422,417 184,272,330 181,973,284 2,299,046 Net Change in Estimate of
Prior Payables . . . . . . . . . . . . . . . . — — (55,089) 55,089 __________________________ __________________________ __________________________ ________________Net Total Department of Parks and
Recreation . . . . . . . . . . . . . . . . . . . . . 177,422,417 184,272,330 181,918,195 2,354,135 __________________________ __________________________ __________________________ __________________________________________ __________________________ __________________________ ________________850 DEPARTMENT OF DESIGN AND CONSTRUCTION
001 Personal Services . . . . . . . . . . . . . . . . . . 72,260,292 73,962,626 73,825,929 136,697 002 Other Than Personal Services . . . . . . . . 13,148,265 665,562,650 547,503,899 118,058,751 __________________________ __________________________ __________________________ ________________
85,408,557 739,525,276 621,329,828 118,195,448 Interfund Agreements . . . . . . . . . . . . . . (85,408,557) (84,667,442) (84,667,442) — __________________________ __________________________ __________________________ ________________Total Department of Design and
Construction . . . . . . . . . . . . . . . . . . . — 654,857,834 536,662,386 118,195,448 Net Change in Estimate of
Prior Payables . . . . . . . . . . . . . . . . . . — — (5,962) 5,962 __________________________ __________________________ __________________________ ________________Net Total Department of Design and
Construction . . . . . . . . . . . . . . . . . . . — 654,857,834 536,656,424 118,201,410 __________________________ __________________________ __________________________ __________________________________________ __________________________ __________________________ ________________
206
Comptroller’s Report for Fiscal 2002 Part II-E—General Fund—Schedule G5 (Cont.)
Expenditures and Transfers vs. Budget by Unit of Appropriation Within Agency
Actual Better (Worse)Unit of Appropriation Budget Expenditures Than Modified___________________________________________________________________________
Within Agency Adopted Modified and Transfers Budget_____________________________________ _________________________________ _________________________________ _________________________________ _________________________________
(Continued)
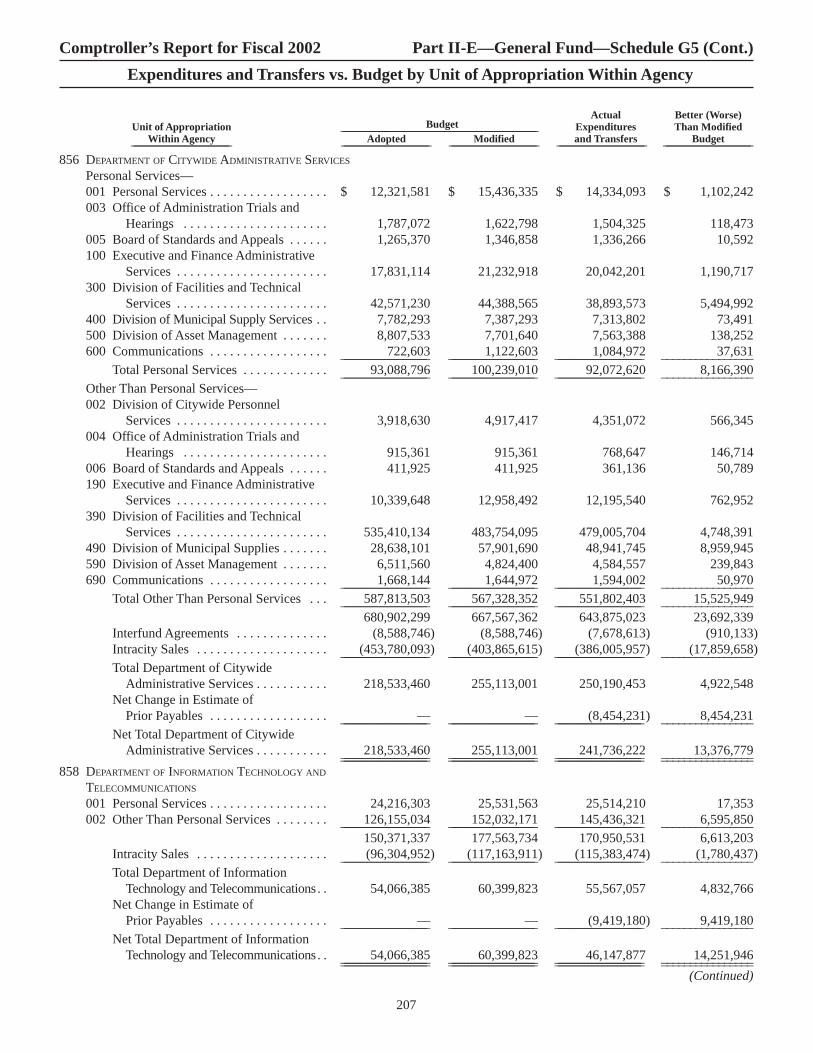
856 DEPARTMENT OF CITYWIDE ADMINISTRATIVE SERVICES
Personal Services—001 Personal Services . . . . . . . . . . . . . . . . . . $ 12,321,581 $ 15,436,335 $ 14,334,093 $ 1,102,242 003 Office of Administration Trials and
Hearings . . . . . . . . . . . . . . . . . . . . . . 1,787,072 1,622,798 1,504,325 118,473 005 Board of Standards and Appeals . . . . . . 1,265,370 1,346,858 1,336,266 10,592 100 Executive and Finance Administrative
Services . . . . . . . . . . . . . . . . . . . . . . . 17,831,114 21,232,918 20,042,201 1,190,717 300 Division of Facilities and Technical
Services . . . . . . . . . . . . . . . . . . . . . . . 42,571,230 44,388,565 38,893,573 5,494,992 400 Division of Municipal Supply Services . . 7,782,293 7,387,293 7,313,802 73,491 500 Division of Asset Management . . . . . . . 8,807,533 7,701,640 7,563,388 138,252 600 Communications . . . . . . . . . . . . . . . . . . 722,603 1,122,603 1,084,972 37,631 __________________________ __________________________ __________________________ ________________
Total Personal Services . . . . . . . . . . . . . 93,088,796 100,239,010 92,072,620 8,166,390 __________________________ __________________________ __________________________ ________________Other Than Personal Services—002 Division of Citywide Personnel
Services . . . . . . . . . . . . . . . . . . . . . . . 3,918,630 4,917,417 4,351,072 566,345 004 Office of Administration Trials and
Hearings . . . . . . . . . . . . . . . . . . . . . . 915,361 915,361 768,647 146,714 006 Board of Standards and Appeals . . . . . . 411,925 411,925 361,136 50,789 190 Executive and Finance Administrative
Services . . . . . . . . . . . . . . . . . . . . . . . 10,339,648 12,958,492 12,195,540 762,952 390 Division of Facilities and Technical
Services . . . . . . . . . . . . . . . . . . . . . . . 535,410,134 483,754,095 479,005,704 4,748,391 490 Division of Municipal Supplies . . . . . . . 28,638,101 57,901,690 48,941,745 8,959,945 590 Division of Asset Management . . . . . . . 6,511,560 4,824,400 4,584,557 239,843 690 Communications . . . . . . . . . . . . . . . . . . 1,668,144 1,644,972 1,594,002 50,970 __________________________ __________________________ __________________________ ________________
Total Other Than Personal Services . . . 587,813,503 567,328,352 551,802,403 15,525,949 __________________________ __________________________ __________________________ ________________680,902,299 667,567,362 643,875,023 23,692,339
Interfund Agreements . . . . . . . . . . . . . . (8,588,746) (8,588,746) (7,678,613) (910,133)Intracity Sales . . . . . . . . . . . . . . . . . . . . (453,780,093) (403,865,615) (386,005,957) (17,859,658)__________________________ __________________________ __________________________ ________________Total Department of Citywide
Administrative Services . . . . . . . . . . . 218,533,460 255,113,001 250,190,453 4,922,548 Net Change in Estimate of
Prior Payables . . . . . . . . . . . . . . . . . . — — (8,454,231) 8,454,231 __________________________ __________________________ __________________________ ________________Net Total Department of Citywide
Administrative Services . . . . . . . . . . . 218,533,460 255,113,001 241,736,222 13,376,779 __________________________ __________________________ __________________________ __________________________________________ __________________________ __________________________ ________________858 DEPARTMENT OF INFORMATION TECHNOLOGY AND
TELECOMMUNICATIONS
001 Personal Services . . . . . . . . . . . . . . . . . . 24,216,303 25,531,563 25,514,210 17,353 002 Other Than Personal Services . . . . . . . . 126,155,034 152,032,171 145,436,321 6,595,850 __________________________ __________________________ __________________________ ________________
150,371,337 177,563,734 170,950,531 6,613,203 Intracity Sales . . . . . . . . . . . . . . . . . . . . (96,304,952) (117,163,911) (115,383,474) (1,780,437)__________________________ __________________________ __________________________ ________________Total Department of Information
Technology and Telecommunications . . 54,066,385 60,399,823 55,567,057 4,832,766 Net Change in Estimate of
Prior Payables . . . . . . . . . . . . . . . . . . — — (9,419,180) 9,419,180 __________________________ __________________________ __________________________ ________________Net Total Department of Information
Technology and Telecommunications . . 54,066,385 60,399,823 46,147,877 14,251,946 __________________________ __________________________ __________________________ __________________________________________ __________________________ __________________________ ________________
207
Comptroller’s Report for Fiscal 2002 Part II-E—General Fund—Schedule G5 (Cont.)
Expenditures and Transfers vs. Budget by Unit of Appropriation Within Agency
Actual Better (Worse)Unit of Appropriation Budget Expenditures Than Modified___________________________________________________________________________
Within Agency Adopted Modified and Transfers Budget_____________________________________ _________________________________ _________________________________ _________________________________ _________________________________
(Continued)

208
Comptroller’s Report for Fiscal 2002 Part II-E—General Fund—Schedule G5 (Cont.)
Expenditures and Transfers vs. Budget by Unit of Appropriation Within Agency
Actual Better (Worse)Unit of Appropriation Budget Expenditures Than Modified___________________________________________________________________________
Within Agency Adopted Modified and Transfers Budget_____________________________________ _________________________________ _________________________________ _________________________________ _________________________________
(Continued)
860 DEPARTMENT OF RECORDS AND INFORMATION
SERVICES
100 Personal Services . . . . . . . . . . . . . . . . . . $ 1,893,627 $ 2,356,181 $ 2,217,613 $ 138,568 200 Other Than Personal Services . . . . . . . . 1,876,796 2,183,054 2,001,791 181,263 __________________________ __________________________ __________________________ ________________
3,770,423 4,539,235 4,219,404 319,831 Intracity Sales . . . . . . . . . . . . . . . . . . . . (299,000) (436,198) (436,198) — __________________________ __________________________ __________________________ ________________Total Department of Records and
Information Services . . . . . . . . . . . . . 3,471,423 4,103,037 3,783,206 319,831 Net Change in Estimate of
Prior Payables . . . . . . . . . . . . . . . . . . — — (144,191) 144,191 __________________________ __________________________ __________________________ ________________Net Total Department of Records and
Information Services . . . . . . . . . . . . . 3,471,423 4,103,037 3,639,015 464,022 __________________________ __________________________ __________________________ __________________________________________ __________________________ __________________________ ________________866 DEPARTMENT OF CONSUMER AFFAIRS
Personal Services—001 Administration . . . . . . . . . . . . . . . . . . . . 1,596,078 1,743,595 1,729,600 13,995 002 Licensing and Enforcement . . . . . . . . . . 7,694,724 8,393,399 8,233,533 159,866 004 Adjudication . . . . . . . . . . . . . . . . . . . . . 1,494,943 1,452,148 1,437,771 14,377 __________________________ __________________________ __________________________ ________________
Total Personal Services . . . . . . . . . . . . . 10,785,745 11,589,142 11,400,904 188,238 __________________________ __________________________ __________________________ ________________003 Other Than Personal Services . . . . . . . . 3,500,747 3,156,064 2,901,143 254,921 __________________________ __________________________ __________________________ ________________
14,286,492 14,745,206 14,302,047 443,159 Intracity Sales . . . . . . . . . . . . . . . . . . . . (939,687) (2,030,847) (1,899,075) (131,772)__________________________ __________________________ __________________________ ________________Total Department of Consumer Affairs . . 13,346,805 12,714,359 12,402,972 311,387 __________________________ __________________________ __________________________ __________________________________________ __________________________ __________________________ ________________
901 DISTRICT ATTORNEY—NEW YORK COUNTY
001 Personal Services . . . . . . . . . . . . . . . . . . 66,733,645 75,767,244 75,014,771 752,473 002 Other Than Personal Services . . . . . . . . 6,910,102 8,333,926 8,112,059 221,867 __________________________ __________________________ __________________________ ________________
73,643,747 84,101,170 83,126,830 974,340 Intracity Sales . . . . . . . . . . . . . . . . . . . . (655,000) (975,053) (975,052) (1)__________________________ __________________________ __________________________ ________________Total District Attorney—
New York County . . . . . . . . . . . . . . . 72,988,747 83,126,117 82,151,778 974,339 Net Change in Estimate of
Prior Payables . . . . . . . . . . . . . . . . . . — — (4,708) 4,708 __________________________ __________________________ __________________________ ________________Net Total District Attorney—
New York County . . . . . . . . . . . . . . . 72,988,747 83,126,117 82,147,070 979,047 __________________________ __________________________ __________________________ __________________________________________ __________________________ __________________________ ________________902 DISTRICT ATTORNEY—BRONX COUNTY
001 Personal Services . . . . . . . . . . . . . . . . . . 41,171,936 41,771,104 41,771,104 — 002 Other Than Personal Services . . . . . . . . 2,908,072 3,622,573 3,583,401 39,172 __________________________ __________________________ __________________________ ________________
44,080,008 45,393,677 45,354,505 39,172 Intracity Sales . . . . . . . . . . . . . . . . . . . . (561,000) (627,554) (627,553) (1)__________________________ __________________________ __________________________ ________________Total District Attorney—Bronx County 43,519,008 44,766,123 44,726,952 39,171 Net Change in Estimate of
Prior Payables . . . . . . . . . . . . . . . . . . — — (4,385) 4,385 __________________________ __________________________ __________________________ ________________Net Total District Attorney—
Bronx County . . . . . . . . . . . . . . . . . . 43,519,008 44,766,123 44,722,567 43,556 __________________________ __________________________ __________________________ __________________________________________ __________________________ __________________________ ________________
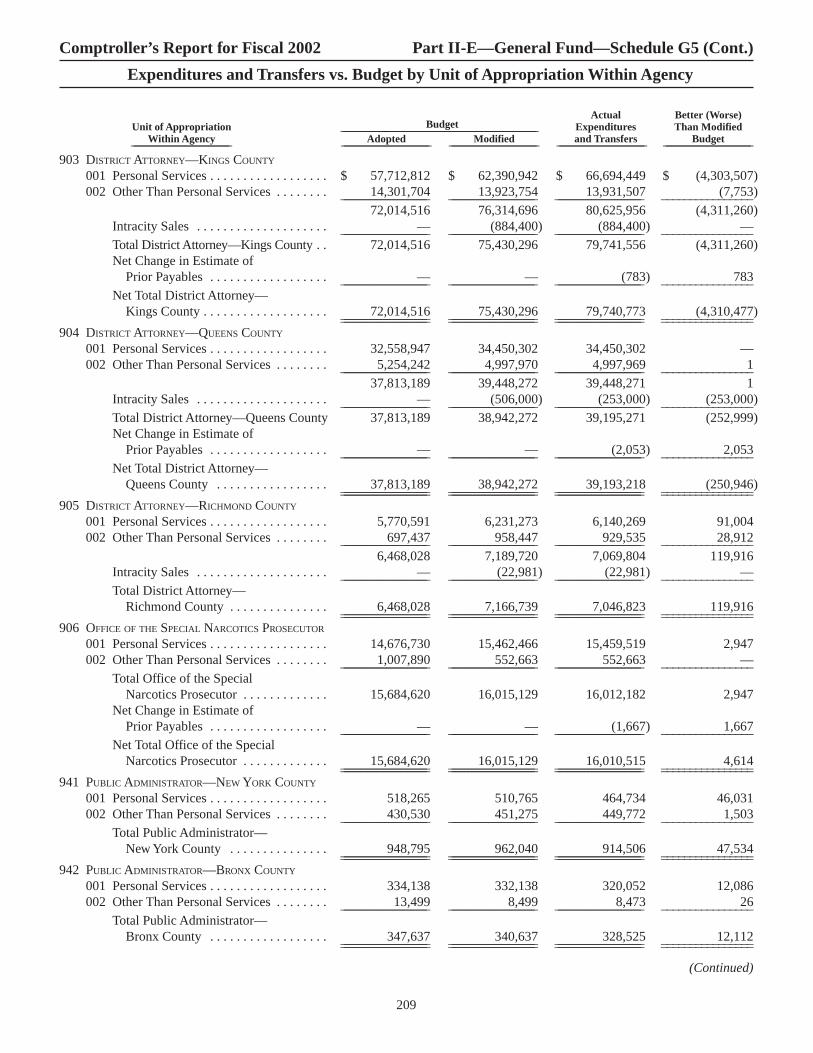
903 DISTRICT ATTORNEY—KINGS COUNTY
001 Personal Services . . . . . . . . . . . . . . . . . . $ 57,712,812 $ 62,390,942 $ 66,694,449 $ (4,303,507)002 Other Than Personal Services . . . . . . . . 14,301,704 13,923,754 13,931,507 (7,753)__________________________ __________________________ __________________________ ________________
72,014,516 76,314,696 80,625,956 (4,311,260)Intracity Sales . . . . . . . . . . . . . . . . . . . . — (884,400) (884,400) — __________________________ __________________________ __________________________ ________________Total District Attorney—Kings County . . 72,014,516 75,430,296 79,741,556 (4,311,260)Net Change in Estimate of
Prior Payables . . . . . . . . . . . . . . . . . . — — (783) 783 __________________________ __________________________ __________________________ ________________Net Total District Attorney—
Kings County . . . . . . . . . . . . . . . . . . . 72,014,516 75,430,296 79,740,773 (4,310,477)__________________________ __________________________ __________________________ __________________________________________ __________________________ __________________________ ________________904 DISTRICT ATTORNEY—QUEENS COUNTY
001 Personal Services . . . . . . . . . . . . . . . . . . 32,558,947 34,450,302 34,450,302 — 002 Other Than Personal Services . . . . . . . . 5,254,242 4,997,970 4,997,969 1 __________________________ __________________________ __________________________ ________________
37,813,189 39,448,272 39,448,271 1 Intracity Sales . . . . . . . . . . . . . . . . . . . . — (506,000) (253,000) (253,000)__________________________ __________________________ __________________________ ________________Total District Attorney—Queens County 37,813,189 38,942,272 39,195,271 (252,999)Net Change in Estimate of
Prior Payables . . . . . . . . . . . . . . . . . . — — (2,053) 2,053 __________________________ __________________________ __________________________ ________________Net Total District Attorney—
Queens County . . . . . . . . . . . . . . . . . 37,813,189 38,942,272 39,193,218 (250,946)__________________________ __________________________ __________________________ __________________________________________ __________________________ __________________________ ________________905 DISTRICT ATTORNEY—RICHMOND COUNTY
001 Personal Services . . . . . . . . . . . . . . . . . . 5,770,591 6,231,273 6,140,269 91,004 002 Other Than Personal Services . . . . . . . . 697,437 958,447 929,535 28,912 __________________________ __________________________ __________________________ ________________
6,468,028 7,189,720 7,069,804 119,916 Intracity Sales . . . . . . . . . . . . . . . . . . . . — (22,981) (22,981) — __________________________ __________________________ __________________________ ________________Total District Attorney—
Richmond County . . . . . . . . . . . . . . . 6,468,028 7,166,739 7,046,823 119,916 __________________________ __________________________ __________________________ __________________________________________ __________________________ __________________________ ________________906 OFFICE OF THE SPECIAL NARCOTICS PROSECUTOR
001 Personal Services . . . . . . . . . . . . . . . . . . 14,676,730 15,462,466 15,459,519 2,947 002 Other Than Personal Services . . . . . . . . 1,007,890 552,663 552,663 — __________________________ __________________________ __________________________ ________________
Total Office of the SpecialNarcotics Prosecutor . . . . . . . . . . . . . 15,684,620 16,015,129 16,012,182 2,947
Net Change in Estimate of Prior Payables . . . . . . . . . . . . . . . . . . — — (1,667) 1,667 __________________________ __________________________ __________________________ ________________
Net Total Office of the Special Narcotics Prosecutor . . . . . . . . . . . . . 15,684,620 16,015,129 16,010,515 4,614 __________________________ __________________________ __________________________ __________________________________________ __________________________ __________________________ ________________
941 PUBLIC ADMINISTRATOR—NEW YORK COUNTY
001 Personal Services . . . . . . . . . . . . . . . . . . 518,265 510,765 464,734 46,031 002 Other Than Personal Services . . . . . . . . 430,530 451,275 449,772 1,503 __________________________ __________________________ __________________________ ________________
Total Public Administrator—New York County . . . . . . . . . . . . . . . 948,795 962,040 914,506 47,534 __________________________ __________________________ __________________________ __________________________________________ __________________________ __________________________ ________________
942 PUBLIC ADMINISTRATOR—BRONX COUNTY
001 Personal Services . . . . . . . . . . . . . . . . . . 334,138 332,138 320,052 12,086 002 Other Than Personal Services . . . . . . . . 13,499 8,499 8,473 26 __________________________ __________________________ __________________________ ________________
Total Public Administrator—Bronx County . . . . . . . . . . . . . . . . . . 347,637 340,637 328,525 12,112 __________________________ __________________________ __________________________ __________________________________________ __________________________ __________________________ ________________
209
Comptroller’s Report for Fiscal 2002 Part II-E—General Fund—Schedule G5 (Cont.)
Expenditures and Transfers vs. Budget by Unit of Appropriation Within Agency
Actual Better (Worse)Unit of Appropriation Budget Expenditures Than Modified___________________________________________________________________________
Within Agency Adopted Modified and Transfers Budget_____________________________________ _________________________________ _________________________________ _________________________________ _________________________________
(Continued)
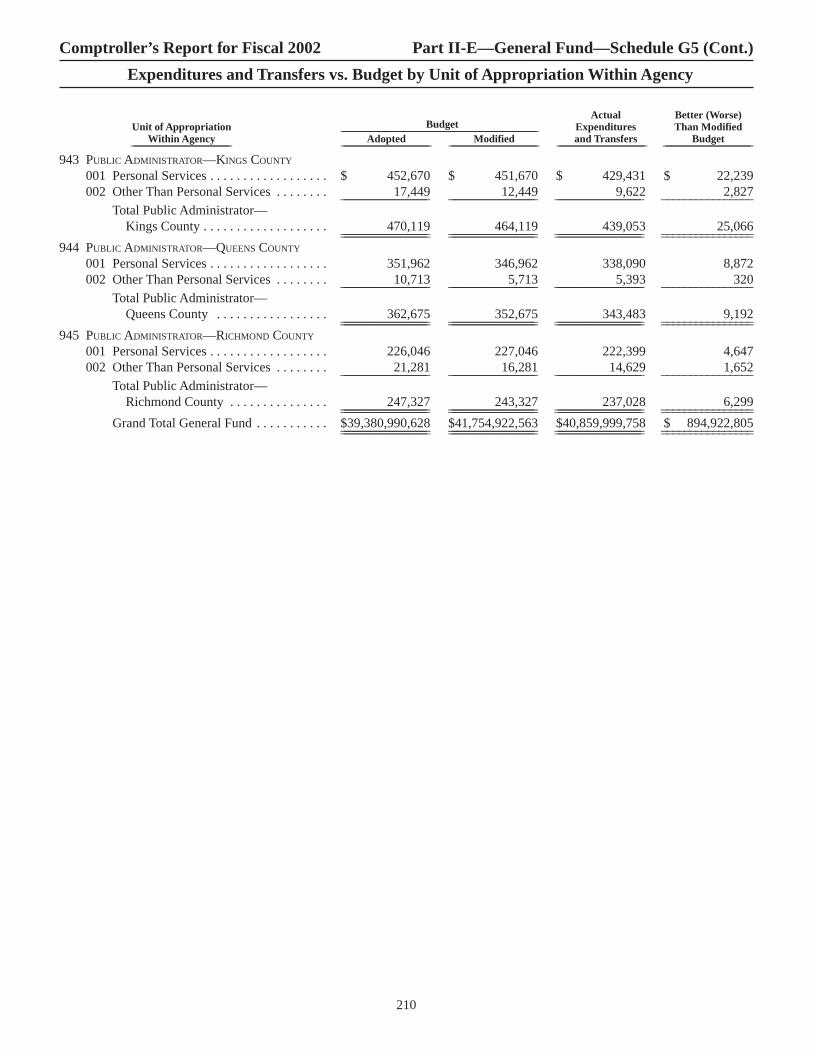
943 PUBLIC ADMINISTRATOR—KINGS COUNTY
001 Personal Services . . . . . . . . . . . . . . . . . . $ 452,670 $ 451,670 $ 429,431 $ 22,239 002 Other Than Personal Services . . . . . . . . 17,449 12,449 9,622 2,827 __________________________ __________________________ __________________________ ________________
Total Public Administrator—Kings County . . . . . . . . . . . . . . . . . . . 470,119 464,119 439,053 25,066 __________________________ __________________________ __________________________ __________________________________________ __________________________ __________________________ ________________
944 PUBLIC ADMINISTRATOR—QUEENS COUNTY
001 Personal Services . . . . . . . . . . . . . . . . . . 351,962 346,962 338,090 8,872 002 Other Than Personal Services . . . . . . . . 10,713 5,713 5,393 320 __________________________ __________________________ __________________________ ________________
Total Public Administrator—Queens County . . . . . . . . . . . . . . . . . 362,675 352,675 343,483 9,192 __________________________ __________________________ __________________________ __________________________________________ __________________________ __________________________ ________________
945 PUBLIC ADMINISTRATOR—RICHMOND COUNTY
001 Personal Services . . . . . . . . . . . . . . . . . . 226,046 227,046 222,399 4,647 002 Other Than Personal Services . . . . . . . . 21,281 16,281 14,629 1,652 __________________________ __________________________ __________________________ ________________
Total Public Administrator—Richmond County . . . . . . . . . . . . . . . 247,327 243,327 237,028 6,299 __________________________ __________________________ __________________________ __________________________________________ __________________________ __________________________ ________________
Grand Total General Fund . . . . . . . . . . . $39,380,990,628 $41,754,922,563 $40,859,999,758 $ 894,922,805 __________________________ __________________________ __________________________ __________________________________________ __________________________ __________________________ ________________
210
Comptroller’s Report for Fiscal 2002 Part II-E—General Fund—Schedule G5 (Cont.)
Expenditures and Transfers vs. Budget by Unit of Appropriation Within Agency
Actual Better (Worse)Unit of Appropriation Budget Expenditures Than Modified___________________________________________________________________________
Within Agency Adopted Modified and Transfers Budget_____________________________________ _________________________________ _________________________________ _________________________________ _________________________________

Personal Services:Full-Time Salaried—
001 Full-Year Positions . . . . . . . . . . . . . . . . $ 4,774,811,523 $ 4,290,168,953 $ 3,683,629,236 $ 3,537,568,733002 New Positions . . . . . . . . . . . . . . . . . . . . 75,000 — — —004 Full-Time Uniformed Personnel . . . . . . 3,476,644,068 3,484,940,548 3,477,066,105 3,440,152,339 005 Full-Time Pedagogical Personnel . . . . . 4,400,215,000 4,682,466,367 4,965,082,822 5,041,197,011009 Unallocated . . . . . . . . . . . . . . . . . . . . . . 6,649 14,824 (18,587,964) (7,915,178)__________________________ __________________________ __________________________ __________________________
Total Full-Time Salaried . . . . . . . . 12,651,752,240 12,457,590,692 12,107,190,199 12,011,002,905 __________________________ __________________________ __________________________ __________________________Other Salaried—
021 Part-Time Positions . . . . . . . . . . . . . . . . 265,352,400 371,987,054 399,301,544 410,619,734022 Seasonal Positions . . . . . . . . . . . . . . . . . 57,524,617 122,692,406 119,443,959 33,729,640 __________________________ __________________________ __________________________ __________________________
Total Other Salaried . . . . . . . . . . . . 322,877,017 494,679,460 518,745,503 444,349,374 __________________________ __________________________ __________________________ __________________________Unsalaried—
031 Hourly . . . . . . . . . . . . . . . . . . . . . . . . . . 1,215,129,664 1,595,976,829 1,614,259,918 1,228,626,629035 Custodial Allowances . . . . . . . . . . . . . . 24,736,233 40,560,622 — 276,236,011__________________________ __________________________ __________________________ __________________________
Total Unsalaried . . . . . . . . . . . . . . 1,239,865,897 1,636,537,451 1,614,259,918 1,504,862,640__________________________ __________________________ __________________________ __________________________Additional Gross Pay—
040 Educational and License Differential . . 2,499,627 2,202,196 733,553 684,915041 Assignment Differential . . . . . . . . . . . . 73,489,603 80,587,641 61,125,430 76,068,784042 Longevity Differential . . . . . . . . . . . . . . 283,411,566 287,389,819 314,945,613 314,774,791043 Shift Differential . . . . . . . . . . . . . . . . . . 158,916,707 162,909,070 164,088,160 161,731,021044 Salary Differential in Excess
of Maximum . . . . . . . . . . . . . . . . . . . 51,539 51,602 — —045 Holiday Pay . . . . . . . . . . . . . . . . . . . . . . 156,680,492 155,155,915 168,474,674 163,439,116 046 Terminal Leave . . . . . . . . . . . . . . . . . . . 6,739,694 19,760,822 49,785,749 20,744,761 047 Overtime . . . . . . . . . . . . . . . . . . . . . . . . 135,619,581 213,953,147 272,246,235 229,589,026 048 Overtime—Uniformed Forces . . . . . . . . 408,410,067 907,165,429 891,684,924 508,634,255 049 Backpay . . . . . . . . . . . . . . . . . . . . . . . . . 2,927,554 6,839,995 473,172,729 285,843,208 050 Payments to Beneficiaries of
Deceased Employees . . . . . . . . . . . . . 1,352,023 1,827,185 1,010,082 590,916 052 Severance Payment . . . . . . . . . . . . . . . . 170,325 16,351,387 — 88 054 Salary Review Adjustments . . . . . . . . . . 717,386 717,444 — —055 Labor Reserve Salary Adjustments . . . . 542,995,048 365,879,607 351,116,000 325,740,087 056 Early Retirement—Terminal Leave . . . 1,501,676 1,198,675 4,683,296 4,503,978 057 Bonus Payments . . . . . . . . . . . . . . . . . . 48,196 1,289,751 4,552,827 3,804,347 058 Non-Pension—Preparation Period . . . . 11,427,358 22,495,312 28,045,076 31,915,764 059 Payment of Deferred Wages . . . . . . . . . 2 133,957 585 362 060 Interest on Deferred Wages/Late
Wage Adjustments . . . . . . . . . . . . . . . 48 48 1,573,185 1,079,032061 Supper Money . . . . . . . . . . . . . . . . . . . . 557,028 568,291 531,329 574,774073 Voluntary Vacation Work . . . . . . . . . . . . 555,000 555,000 4,459,031 4,670,836091 Paraprofessional Per Session . . . . . . . . . 6,884,655 12,252,876 18,074,692 19,585,863__________________________ __________________________ __________________________ __________________________
Total Additional Gross Pay . . . . . . 1,794,955,175 2,259,285,169 2,810,303,170 2,153,975,924__________________________ __________________________ __________________________ __________________________Amounts to be Scheduled—
051 Salary Adjustments . . . . . . . . . . . . . . . . 299,733,215 154,003,463 2,739,102 10,129,457 053 Other Than Salary Adjustments . . . . . . 564,968,574 451,489,093 1,775,729 2,539,746 __________________________ __________________________ __________________________ __________________________
Total Amounts to be Scheduled . . . 864,701,789 605,492,556 4,514,831 12,669,203__________________________ __________________________ __________________________ __________________________
211
Comptroller’s Report for Fiscal 2002 Part II-E—General Fund—Schedule G6
Expenditures and Transfers by Object
Budget Expenditures and Transfers___________________________________________________________________________ ___________________________________________________________________________Adopted Modified 2002 2001_________________________________ _________________________________ _________________________________ _________________________________
(Continued)

Personal Services: (cont.) Fringe Benefits—
Fringe Benefits—Pensions:070 Actuarial Pension Costs . . . . . . . . . . . . $ 5,975,000 $ 5,475,000 $ 1,867,010 $ 1,341,639 071 Non-Actuarial Pension Costs . . . . . . . . 128,000 202,000 152,770 60,200072 Contingent Reserve Fund—Pensions . . 42,204,734 49,987,237 49,968,274 48,497,431075 Supplemental Pension Fund . . . . . . . . . 19,183,886 27,997,608 27,679,574 18,790,000076 Cultural Institutions Pension Fund . . . . 8,326,000 8,272,408 6,629,045 5,836,317077 Teachers’ Retirement System Pension
Fund Reserve No. 2 . . . . . . . . . . . . . . 7,056,720 3,708,491 3,708,491 2,275,271079 Teachers’ Retirement System
Contingent Reserve Fund . . . . . . . . . 259,137,344 497,083,540 497,075,840 435,648,831 080 Payments to Teachers’ Insurance
Annuity Association—CollegeRetirement Equity Fund (CityUniversity of New York) . . . . . . . . . . 13,446,000 13,487,886 13,477,442 12,265,641
082 Police Actuarial Pension Fund . . . . . . . 444,555,522 534,475,649 534,475,649 413,156,056083 Fire Actuarial Pension Fund . . . . . . . . . 255,411,717 302,317,855 302,317,855 241,310,517084 Board of Education Retirement System . 22,672,580 54,549,019 54,549,019 37,952,350094 Additional Pension Accrual . . . . . . . . . . 375,753,486 — — — __________________________ __________________________ __________________________ __________________________
Total Fringe Benefits—Pensions . . 1,453,850,989 1,497,556,693 1,491,900,969 1,217,134,253__________________________ __________________________ __________________________ __________________________Fringe Benefits—Other:
062 Health Insurance Plan City Employees . 1,779,978,663 2,043,815,413 1,993,199,747 1,699,042,999 063 Disability Benefits Insurance . . . . . . . . 351,000 348,000 348,000 (98,121) 064 Allowance for Uniforms . . . . . . . . . . . . 64,099,456 64,051,002 66,858,603 68,330,790 065 Social Security Contributions . . . . . . . . 1,116,032,668 1,246,821,490 1,237,573,780 1,166,122,534 066 Unemployment Insurance . . . . . . . . . . . 27,950,862 26,861,325 26,843,825 16,035,102 067 Supplemental Employee Welfare
Benefits . . . . . . . . . . . . . . . . . . . . . . . 607,090,493 699,112,482 671,956,457 665,701,235 068 Faculty Welfare Benefits . . . . . . . . . . . . 3,144,264 4,246,806 4,429,976 4,392,337 081 Annuity Contributions . . . . . . . . . . . . . . 70,121,943 98,529,831 74,095,527 80,372,555 085 Awards / Expenses—Workers’
Compensation . . . . . . . . . . . . . . . . . . 115,106,413 104,603,064 111,364,738 110,361,815 086 Workers’ Compensation—Other . . . . . . 33,200,000 32,153,529 21,562,944 28,006,910 087 Fringe Benefits—CETA . . . . . . . . . . . . — 155,000 202,190 261,389089 Fringe Benefits—Other . . . . . . . . . . . . . 7,775,731 28,113,629 184,158 —__________________________ __________________________ __________________________ __________________________
Total Fringe Benefits—Other . . . . 3,824,851,493 4,348,811,571 4,208,619,945 3,838,529,545__________________________ __________________________ __________________________ __________________________Total Fringe Benefits . . . . . . . . . . . 5,278,702,482 5,846,368,264 5,700,520,914 5,055,663,798__________________________ __________________________ __________________________ __________________________Total Personal Services . . . . . . . . . 22,152,854,600 23,299,953,592 22,755,534,535 21,182,523,844__________________________ __________________________ __________________________ __________________________
Other Than Personal Services:Supplies and Materials—
100 Supplies and Materials—General . . . . . 824,501,947 629,421,611 335,932,588 372,838,225 101 Printing Supplies . . . . . . . . . . . . . . . . . . 6,360,326 6,990,273 5,671,473 4,686,394 105 Automotive Supplies and Materials . . . 37,482,108 47,710,327 45,862,539 38,652,809 106 Motor Vehicle Fuel . . . . . . . . . . . . . . . . 34,087,347 31,953,325 30,266,228 38,152,375 107 Medical, Surgical and Laboratory
Supplies . . . . . . . . . . . . . . . . . . . . . . . 17,504,275 20,454,552 18,593,544 15,546,945 109 Fuel Oil . . . . . . . . . . . . . . . . . . . . . . . . . 57,948,572 38,915,547 32,312,399 67,187,798 110 Food and Forage Supplies . . . . . . . . . . . 134,810,973 161,356,460 178,034,857 176,257,136
212
Comptroller’s Report for Fiscal 2002 Part II-E—General Fund—Schedule G6 (Cont.)
Expenditures and Transfers by Object
Budget Expenditures and Transfers___________________________________________________________________________ ___________________________________________________________________________Adopted Modified 2002 2001_________________________________ _________________________________ _________________________________ _________________________________
(Continued)

Other Than Personal Services: (cont.)Supplies and Materials—(cont.)
117 Postage . . . . . . . . . . . . . . . . . . . . . . . . . $ 26,119,342 $ 32,523,389 $ 31,099,127 $ 29,516,847 130 Instructional Supplies . . . . . . . . . . . . . . 55,963,081 6,205,910 392,366 3,979,872 132 Expenses Relative to Commissaries . . . 9,624,568 10,107,661 10,396,576 9,101,348133 Expenses Relative to Manufacturing
Industries . . . . . . . . . . . . . . . . . . . . . . 1,449,433 1,276,080 998,656 1,678,022169 Maintenance Supplies . . . . . . . . . . . . . . 15,534,736 21,258,583 19,003,550 20,081,595170 Cleaning Supplies . . . . . . . . . . . . . . . . . 738,702 957,256 838,636 563,602199 Data Processing Supplies . . . . . . . . . . . 8,452,591 50,656,815 27,789,807 84,365,722__________________________ __________________________ __________________________ __________________________
Total Supplies and Materials . . . . . 1,230,578,001 1,059,787,789 737,192,346 862,608,690__________________________ __________________________ __________________________ __________________________Land—
202 Land Acquisition— Condemnation . . . . — 5,820,169 5,789,429 — __________________________ __________________________ __________________________ __________________________Property and Equipment—
300 Equipment— General . . . . . . . . . . . . . . 70,569,756 136,236,943 115,748,517 138,697,648302 Telecommunications Equipment . . . . . . 2,732,491 4,683,897 3,847,684 3,897,420304 Motor Vehicle Equipment . . . . . . . . . . . 12,835 9,601 5,515 17,945305 Motor Vehicles . . . . . . . . . . . . . . . . . . . . 46,470,413 49,373,642 54,317,726 57,594,868307 Medical, Surgical and Laboratory
Equipment . . . . . . . . . . . . . . . . . . . . . 2,236,811 4,770,884 3,880,520 2,835,129314 Office Furniture . . . . . . . . . . . . . . . . . . . 5,718,570 11,460,032 8,588,002 9,853,856315 Office Equipment . . . . . . . . . . . . . . . . . 4,117,347 4,060,322 11,641,277 854,104319 Security Equipment . . . . . . . . . . . . . . . . 1,044,341 2,920,284 2,380,739 1,702,061330 Instructional Equipment . . . . . . . . . . . . 24,690,835 3,040,216 26,048,275 121,429332 Purchases of Data Processing
Equipment . . . . . . . . . . . . . . . . . . . . . 16,018,607 31,955,858 24,385,284 39,210,410337 Books—Other . . . . . . . . . . . . . . . . . . . . 85,240,385 96,708,866 111,366,951 98,796,161338 Library Books . . . . . . . . . . . . . . . . . . . . 13,794,886 19,926,480 31,968,624 26,233,880__________________________ __________________________ __________________________ __________________________
Total Property and Equipment . . . . 272,647,277 365,147,025 394,179,114 379,814,911__________________________ __________________________ __________________________ __________________________Other Services and Charges—
400 Contractual Services—General . . . . . . . 199,992,482 927,769,411 776,972,340 223,263,404402 Telephone and Other Communications . . 144,439,284 167,979,021 163,908,627 147,257,159403 Office Services . . . . . . . . . . . . . . . . . . . 9,631,772 9,648,688 7,516,778 7,465,639404 Traveling Expenses . . . . . . . . . . . . . . . . 11,927 7,261 1,011 8,386407 Maintenance and Repairs—
Motor Vehicle Equipment . . . . . . . . . 555,416 116,645 59,531 89,039412 Rentals—Miscellaneous Equipment . . . 24,454,828 35,050,801 32,101,501 31,086,339413 Rentals—Data Processing Equipment . 801,753 1,898,435 1,278,453 1,254,788414 Rentals—Land, Buildings
and Structures . . . . . . . . . . . . . . . . . . 475,278,299 471,154,733 462,440,583 417,616,271417 Advertising . . . . . . . . . . . . . . . . . . . . . . 5,966,323 22,198,540 19,485,437 23,183,709419 Security Services . . . . . . . . . . . . . . . . . . 305 305 — 405422 Temporary Services . . . . . . . . . . . . . . . . 4,000 — — —423 Heat, Light and Power . . . . . . . . . . . . . . 496,198,084 427,288,122 411,402,409 460,860,080427 Data Processing Services . . . . . . . . . . . 2,152,487 3,287,049 3,109,738 919,744431 Leasing of Miscellaneous Equipment . . 3,637,848 3,526,077 2,435,670 2,476,221432 Leasing of Data Processing Equipment 493,641 1,528,521 1,427,715 285,461451 Non Overnight Travel
Expenses—General . . . . . . . . . . . . . . 8,737,854 21,732,172 7,424,991 24,614,344
213
Comptroller’s Report for Fiscal 2002 Part II-E—General Fund—Schedule G6 (Cont.)
Expenditures and Transfers by Object
Budget Expenditures and Transfers___________________________________________________________________________ ___________________________________________________________________________Adopted Modified 2002 2001_________________________________ _________________________________ _________________________________ _________________________________
(Continued)

Other Than Personal Services: (cont.)Other Services and Charges—(cont.)
452 Non Overnight Travel Expenses—Special . . . . . . . . . . . . . . $ 5,056,258 $ 4,209,578 $ 34,516,424 $ 2,193,194
453 Overnight Travel Expenses—General . . 4,957,312 5,926,459 4,909,004 4,326,738454 Overnight Travel Expenses—Special . . 4,393,231 4,474,335 1,625,886 2,100,569456 Higher Education—Student Assistance 1,276,000 1,107,450 1,106,447 1,198,535460 Special Expenditures . . . . . . . . . . . . . . . 23,466,660 41,675,181 38,129,265 30,488,342464 Court Costs During State Takeover . . . . 100,000 — — —465 Obligatory County Expenses . . . . . . . . . 87,005,695 78,415,720 74,943,034 66,064,027470 Payment to the State Division of Youth
for Incarceration of Juveniles . . . . . . 54,725,890 53,725,890 53,725,890 54,725,890473 Snow Removal Services . . . . . . . . . . . . 205,000 477,422 314,920 273,563485 Tuition Expenses—Board of
Education . . . . . . . . . . . . . . . . . . . . . . — 115,000 4,328,825 1,749,495486 Contributions to New York City
National Shrine Association, Inc . . . . 50,000 50,000 50,000 50,000490 Special Services . . . . . . . . . . . . . . . . . . . 10,000 17,890 15,326 10,842491 Breakfast—Lunch Program . . . . . . . . . . — 1,000 — —493 Financial Assistance—College Students . 10,960,722 8,639,055 8,576,084 8,869,993494 Payments for Students Attending
Community Colleges LocatedOutside the City . . . . . . . . . . . . . . . . . 18,593,000 21,729,545 21,729,333 10,938,303
496 Allowances to Participants . . . . . . . . . . 807,705 777,694 742,338 789,492499 Other Expenses—General . . . . . . . . . . . 477,805,448 108,970,782 6,004,535 893,802__________________________ __________________________ __________________________ __________________________
Total Other Services and Charges . 2,061,769,224 2,423,498,782 2,140,282,095 1,525,053,774__________________________ __________________________ __________________________ __________________________Social Services—
500 Social Services—General . . . . . . . . . . . 1,549,000 1,049,000 666,806 912,788501 Charitable Institutions—Hospitals . . . . 1,300,000 1,300,000 695,391 535,985504 Direct Foster Care of Children . . . . . . . 62,676,253 58,483,038 53,995,963 55,897,338505 Subsidized Adoption . . . . . . . . . . . . . . . 292,787,898 327,719,747 324,391,954 275,549,894509 Non-Grant Charges . . . . . . . . . . . . . . . . 81,231,687 76,500,824 81,006,939 81,464,891510 Homeless Family Services . . . . . . . . . . 39,902,211 30,159,212 29,258,642 26,837,005511 AIDS Services . . . . . . . . . . . . . . . . . . . . 21,302,000 31,552,000 31,666,952 24,798,894512 Employment Services . . . . . . . . . . . . . . 170,733,585 65,782,457 59,965,133 154,210,836513 Home Energy Assistance Program . . . . — 29,006,831 24,602,483 26,820,636514 Aid to Dependent Children . . . . . . . . . . 914,258,674 839,136,674 831,790,225 1,013,890,205515 Payments for Tuberculosis Treatment . . 1,992,150 1,799,570 915,117 2,400,385516 Home Relief . . . . . . . . . . . . . . . . . . . . . 257,803,448 273,774,949 270,222,553 288,327,886518 Medical Assistance . . . . . . . . . . . . . . . . 2,621,719,343 2,868,301,488 2,945,435,238 2,615,960,550519 Children’s Voluntary Agency Medicaid . 24,271,000 24,271,000 21,531,216 21,408,634543 Special Educational Facilities for the
Institutionalized and Foster Care . . . . 77,628,654 77,628,654 77,387,370 66,349,264571 Donations to Patients, Inmates and
Discharged Prisoners . . . . . . . . . . . . . 3,474,155 3,809,596 3,618,743 3,095,420__________________________ __________________________ __________________________ __________________________Total Social Services . . . . . . . . . . . 4,572,630,058 4,710,275,040 4,757,150,725 4,658,460,611__________________________ __________________________ __________________________ __________________________
Contractual Services—600 Contractual Services—General . . . . . . . 603,904,538 550,760,071 542,357,536 418,605,001602 Telecommunications Maintenance—
Contractual . . . . . . . . . . . . . . . . . . . . 20,351,537 32,829,175 29,598,906 35,435,691
214
Comptroller’s Report for Fiscal 2002 Part II-E—General Fund—Schedule G6 (Cont.)
Expenditures and Transfers by Object
Budget Expenditures and Transfers___________________________________________________________________________ ___________________________________________________________________________Adopted Modified 2002 2001_________________________________ _________________________________ _________________________________ _________________________________
(Continued)

Other Than Personal Services: (cont.)Contractual Services—(cont.)
607 Maintenance and Repairs—Motor Vehicle Equipment—Contractual . . . $ 10,143,768 $ 14,497,509 $ 13,083,906 $ 11,456,770
608 Maintenance and Repairs—General—Contractual . . . . . . . . . . . . 91,507,183 102,720,521 90,687,457 98,572,290
612 Office Equipment Maintenance— Contractual . . . . . . . . . . . . . . . . . . . . 20,408,365 23,298,035 16,502,129 22,680,361
613 Data Processing EquipmentMaintenance—Contractual . . . . . . . . 46,539,695 63,230,116 54,789,434 57,702,632
615 Printing Services—Contractual . . . . . . . 16,351,868 35,738,867 33,753,183 21,096,629616 Community Consultants—Contractual . 25,338,341 32,214,844 27,329,654 32,937,644618 Financing Costs—Contractual . . . . . . . 13,056,900 17,403,330 17,457,091 11,694,110619 Security Services—Contractual . . . . . . 49,535,127 65,857,393 64,967,385 60,915,992622 Temporary Services—Contractual . . . . 60,738,353 80,716,089 69,470,192 59,032,436624 Cleaning Services—Contractual . . . . . . 11,464,416 26,336,269 24,738,879 12,637,696626 Investment Costs—Contractual . . . . . . . 5,249,992 5,259,892 2,862,572 5,141,284629 In-Rem Maintenance Costs—
Contractual . . . . . . . . . . . . . . . . . . . . 9,315,512 28,221,492 28,011,930 32,614,167633 Transportation Services—Contractual . . 13,437,048 13,578,356 9,450,150 7,476,090640 Social Services—General—Contractual . 2,764 3,925 3,300 4,380641 Protective Services for Adults—
Contractual . . . . . . . . . . . . . . . . . . . . 7,058,500 7,055,500 6,376,013 7,474,948642 Children’s Charitable Institutions—
Contractual . . . . . . . . . . . . . . . . . . . . 622,173,785 645,045,432 645,294,770 639,708,379643 Child Welfare Services—Contractual . . 133,266,523 151,423,333 145,578,294 141,358,033644 Direct Foster Care of Children—
Contractual . . . . . . . . . . . . . . . . . . . . 3,217 — — —647 Home Care Services—Contractual . . . . 223,433,798 270,433,798 222,351,299 211,964,777648 Homemaking Services—Contractual . . 30,770,236 26,070,236 24,415,959 23,901,839649 Non-Grant Charges—Contractual . . . . . 28,880,378 32,949,675 19,580,634 27,091,743650 Homeless Family
Services—Contractual . . . . . . . . . . . . 196,355,117 230,272,501 219,347,021 165,886,456651 AIDS Services—Contractual . . . . . . . . 179,900,278 246,632,834 245,034,691 217,170,751652 Day Care of Children—Contractual . . . 492,493,599 405,187,616 386,367,322 384,387,403653 Head Start—Contractual . . . . . . . . . . . . 120,092,853 142,441,289 135,865,867 130,228,453655 Mental Hygiene Services—Contractual . 497,477,535 575,135,892 533,994,157 495,389,358657 Hospitals Contracts—Contractual . . . . . 156,240,437 163,744,521 161,527,014 141,785,664658 Veterinary Services—Contractual . . . . . 8,672,534 8,329,534 8,119,472 8,822,064659 Homeless Individual Services—
Contractual . . . . . . . . . . . . . . . . . . . . 138,875,691 142,484,021 135,414,414 131,976,809660 Economic Development—Contractual . 7,062,935 8,554,811 8,291,565 8,027,617662 Employment Services—Contractual . . . 160,269,697 285,656,938 298,120,578 135,198,281665 Legal Aid Society—Contractual . . . . . . 63,234,846 63,334,846 63,057,632 63,107,632667 Payments to Cultural
Institutions—Contractual . . . . . . . . . 34,009,793 34,774,674 34,778,937 34,136,897668 Bus Transportation for Reimbursable
Programs—Contractual . . . . . . . . . . . 3,818,300 3,733,644 24,261 41,135669 Transportation of Pupils—Contractual .. 567,529,563 570,014,115 587,767,882 550,779,273
215
Comptroller’s Report for Fiscal 2002 Part II-E—General Fund—Schedule G6 (Cont.)
Expenditures and Transfers by Object
Budget Expenditures and Transfers___________________________________________________________________________ ___________________________________________________________________________Adopted Modified 2002 2001_________________________________ _________________________________ _________________________________ _________________________________
(Continued)

Other Than Personal Services: (cont.)Contractual Services—(cont.)
670 Payments to Contract Schools and Corporate Schools for HandicappedChildren—Contractual . . . . . . . . . . . $ 383,326,716 $ 471,949,413 $ 438,646,604 $ 502,676,592
671 Training Program for City Employees—Contractual . . . . . . . . . . . . . . . . . . . . 16,433,794 26,724,609 30,479,503 25,642,475
676 Maintenance and Operation of Infrastructure—Contractual . . . . . . . 117,557,642 151,137,726 154,718,174 170,204,288
678 Payments to Delegate Agencies—Contractual . . . . . . . . . . . . . . . . . . . . 356,262,804 374,877,161 345,170,520 312,702,937
681 Professional Services—Accounting,Auditing and Actuarial Services—Contractual . . . . . . . . . . . . . . . . . . . . 18,161,549 22,830,734 17,162,230 14,832,652
682 Professional Services—LegalServices—Contractual . . . . . . . . . . . . 44,140,635 46,612,562 44,052,962 42,674,325
683 Professional Services—Engineering andArchitectural Services—Contractual . 463,657 1,870,754 945,557 1,106,555
684 Professional Services—ComputerServices—Contractual . . . . . . . . . . . . 59,107,183 152,377,102 139,868,387 121,050,065
685 Professional Services—Education—Contractual . . . . . . . . . . . . . . . . . . . . 145,188,076 301,623,255 264,107,500 230,795,955
686 Professional Services—Other—Contractual . . . . . . . . . . . . . . . . . . . . 65,684,608 123,522,032 105,116,237 78,430,936
688 Bank Charges—Public Assistance Accounts—Contractual . . . . . . . . . . . 1,799,864 1,270,689 224,691 2,085,566
689 Professional Services—Curriculum and Professional Development—Contractual . . . . . . . . . . . . . . . . . . . . 9,643,099 46,670,758 40,861,785 50,124,414
695 Educational and Recreational Expenditures for Youth Programs—Contractual . . . . . . . . . . . . . . . . . . . . 102,321,876 100,962,047 88,626,986 97,914,471__________________________ __________________________ __________________________ __________________________
Total Contractual Services . . . . . . . 5,989,056,525 6,928,369,936 6,576,352,622 6,056,681,916__________________________ __________________________ __________________________ __________________________Fixed and Miscellaneous Charges—
700 Fixed Charges—General . . . . . . . . . . . . 59,661,778 54,963,110 47,986,670 41,953,264701 Taxes and Licenses . . . . . . . . . . . . . . . . 57,326,767 72,300,296 71,597,404 67,478,051702 Payments to Staten Island Rapid
Transit Operating Authority . . . . . . . 30,000 — — —703 Advance to State of New York for
City University of New YorkSenior College . . . . . . . . . . . . . . . . . . 69,019,401 67,275,000 32,465,161 35,876,911
704 Payments for Surety Bonds andInsurance Premium . . . . . . . . . . . . . . 15,853,914 15,805,351 15,069,499 13,715,635
706 Prompt Payment Interest . . . . . . . . . . . . 36,648 28,349 110,994 142,818707 Crime Prevention Injury Award . . . . . . . 150,000 103,643 103,643 83,643708 Awards to Widows or Other Dependents
of the Uniformed Forces . . . . . . . . . . 670,000 43,797,859 40,658,048 246,079709 Awards to Beneficiaries of City
Employees Other ThanUniformed Forces . . . . . . . . . . . . . . . 25,000 125,000 — 25,000
216
Comptroller’s Report for Fiscal 2002 Part II-E—General Fund—Schedule G6 (Cont.)
Expenditures and Transfers by Object
Budget Expenditures and Transfers___________________________________________________________________________ ___________________________________________________________________________Adopted Modified 2002 2001_________________________________ _________________________________ _________________________________ _________________________________
(Continued)
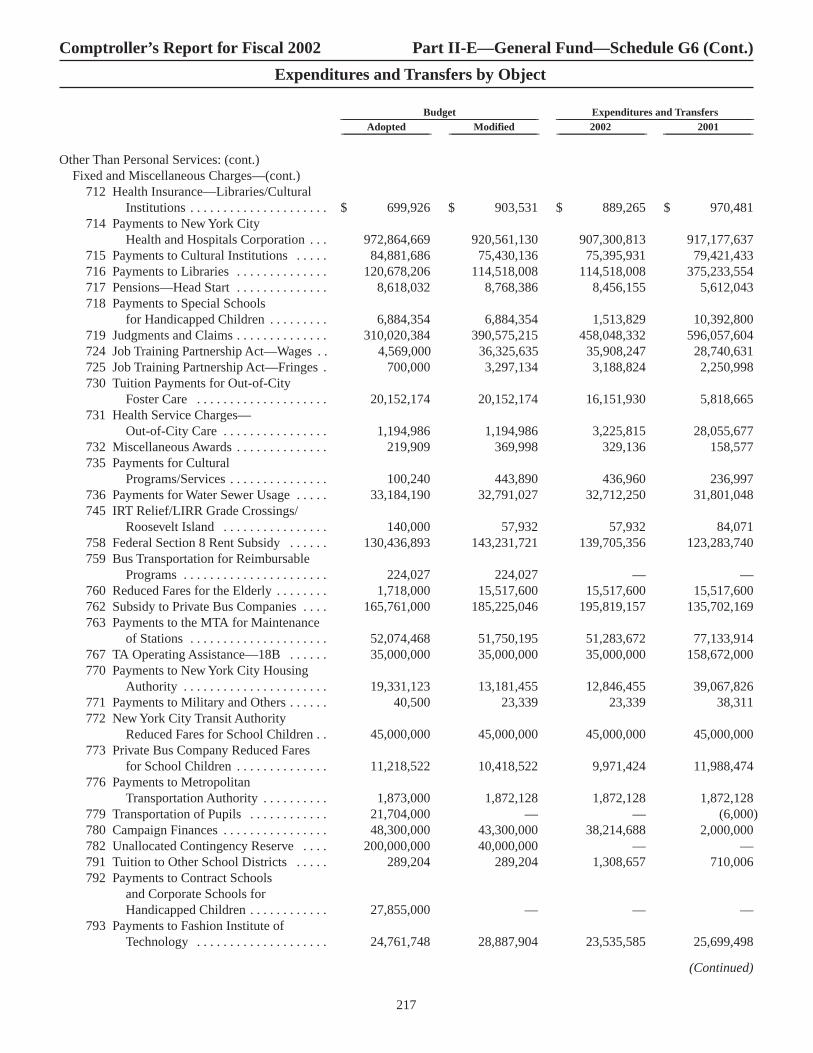
Other Than Personal Services: (cont.)Fixed and Miscellaneous Charges—(cont.)
712 Health Insurance—Libraries/Cultural Institutions . . . . . . . . . . . . . . . . . . . . . $ 699,926 $ 903,531 $ 889,265 $ 970,481
714 Payments to New York CityHealth and Hospitals Corporation . . . 972,864,669 920,561,130 907,300,813 917,177,637
715 Payments to Cultural Institutions . . . . . 84,881,686 75,430,136 75,395,931 79,421,433716 Payments to Libraries . . . . . . . . . . . . . . 120,678,206 114,518,008 114,518,008 375,233,554717 Pensions—Head Start . . . . . . . . . . . . . . 8,618,032 8,768,386 8,456,155 5,612,043718 Payments to Special Schools
for Handicapped Children . . . . . . . . . 6,884,354 6,884,354 1,513,829 10,392,800719 Judgments and Claims . . . . . . . . . . . . . . 310,020,384 390,575,215 458,048,332 596,057,604724 Job Training Partnership Act—Wages . . 4,569,000 36,325,635 35,908,247 28,740,631725 Job Training Partnership Act—Fringes . 700,000 3,297,134 3,188,824 2,250,998730 Tuition Payments for Out-of-City
Foster Care . . . . . . . . . . . . . . . . . . . . 20,152,174 20,152,174 16,151,930 5,818,665731 Health Service Charges—
Out-of-City Care . . . . . . . . . . . . . . . . 1,194,986 1,194,986 3,225,815 28,055,677732 Miscellaneous Awards . . . . . . . . . . . . . . 219,909 369,998 329,136 158,577735 Payments for Cultural
Programs/Services . . . . . . . . . . . . . . . 100,240 443,890 436,960 236,997736 Payments for Water Sewer Usage . . . . . 33,184,190 32,791,027 32,712,250 31,801,048745 IRT Relief/LIRR Grade Crossings/
Roosevelt Island . . . . . . . . . . . . . . . . 140,000 57,932 57,932 84,071758 Federal Section 8 Rent Subsidy . . . . . . 130,436,893 143,231,721 139,705,356 123,283,740759 Bus Transportation for Reimbursable
Programs . . . . . . . . . . . . . . . . . . . . . . 224,027 224,027 — —760 Reduced Fares for the Elderly . . . . . . . . 1,718,000 15,517,600 15,517,600 15,517,600762 Subsidy to Private Bus Companies . . . . 165,761,000 185,225,046 195,819,157 135,702,169763 Payments to the MTA for Maintenance
of Stations . . . . . . . . . . . . . . . . . . . . . 52,074,468 51,750,195 51,283,672 77,133,914767 TA Operating Assistance—18B . . . . . . 35,000,000 35,000,000 35,000,000 158,672,000770 Payments to New York City Housing
Authority . . . . . . . . . . . . . . . . . . . . . . 19,331,123 13,181,455 12,846,455 39,067,826771 Payments to Military and Others . . . . . . 40,500 23,339 23,339 38,311772 New York City Transit Authority
Reduced Fares for School Children . . 45,000,000 45,000,000 45,000,000 45,000,000773 Private Bus Company Reduced Fares
for School Children . . . . . . . . . . . . . . 11,218,522 10,418,522 9,971,424 11,988,474776 Payments to Metropolitan
Transportation Authority . . . . . . . . . . 1,873,000 1,872,128 1,872,128 1,872,128779 Transportation of Pupils . . . . . . . . . . . . 21,704,000 — — (6,000)780 Campaign Finances . . . . . . . . . . . . . . . . 48,300,000 43,300,000 38,214,688 2,000,000782 Unallocated Contingency Reserve . . . . 200,000,000 40,000,000 — —791 Tuition to Other School Districts . . . . . 289,204 289,204 1,308,657 710,006792 Payments to Contract Schools
and Corporate Schools for Handicapped Children . . . . . . . . . . . . 27,855,000 — — —
793 Payments to Fashion Institute of Technology . . . . . . . . . . . . . . . . . . . . 24,761,748 28,887,904 23,535,585 25,699,498
217
Comptroller’s Report for Fiscal 2002 Part II-E—General Fund—Schedule G6 (Cont.)
Expenditures and Transfers by Object
Budget Expenditures and Transfers___________________________________________________________________________ ___________________________________________________________________________Adopted Modified 2002 2001_________________________________ _________________________________ _________________________________ _________________________________
(Continued)

Other Than Personal Services:(cont.)Fixed and Miscellaneous Charges—(cont.)
794 Training City Employees . . . . . . . . . . .. $ 488,436 $ 535,460 $ 136,658 $ 213,398__________________________ __________________________ __________________________ __________________________Total Fixed and Miscellaneous
Charges . . . . . . . . . . . . . . . . . . . 2,553,757,185 2,481,128,745 2,436,359,565 2,878,426,681__________________________ __________________________ __________________________ __________________________Transfers for Debt Service—
801 Sales Tax and Other RevenuesAllocated to Municipal Assistance Corporation . . . . . . . . . . . . . . . . . . . . — 5,000,000 5,000,000 457,899,800
810 Interest on Bonds—General . . . . . . . . . 751,956,972 1,032,084,446 1,029,998,403 2,205,574,348830 Interest on Notes—Funded Debt . . . . . . 36,458,333 14,394,583 14,373,250 13,583,667850 Redemption of General Obligation
Bonds—General . . . . . . . . . . . . . . . . 283,106,822 251,006,822 202,029,919 169,496,000 870 Blended Component Units . . . . . . . . . . 162,025,096 111,264,788 110,643,726 121,083,257__________________________ __________________________ __________________________ __________________________
Total Transfers for Debt Service . . 1,233,547,223 1,413,750,639 1,362,045,298 2,967,637,072__________________________ __________________________ __________________________ __________________________Total Other Than Personal
Services . . . . . . . . . . . . . . . . . . . 17,913,985,493 19,387,778,125 18,409,351,194 19,328,683,655Schedule Reductions to Appropriated Amounts . . (368,779,346) (612,455,209) — —__________________________ __________________________ __________________________ __________________________
Total Expenditures and Transfers . . 39,698,060,747 42,075,276,508 41,164,885,729 40,511,207,499Transfer to Capital Projects
Fund for Interfund Agreements . . (317,070,119) (320,353,945) (304,885,971) (284,230,641)__________________________ __________________________ __________________________ __________________________Net Total Expenditures and
Transfers . . . . . . . . . . . . . . . . . . $39,380,990,628 $41,754,922,563 $40,859,999,758 $40,226,976,858 __________________________ __________________________ __________________________ ____________________________________________________ __________________________ __________________________ __________________________
218
Comptroller’s Report for Fiscal 2002 Part II-E—General Fund—Schedule G6 (Cont.)
Expenditures and Transfers by Object
Budget Expenditures and Transfers___________________________________________________________________________ ___________________________________________________________________________Adopted Modified 2002 2001_________________________________ _________________________________ _________________________________ _________________________________
OTHER SUPPLEMENTARY INFORMATION
NEW YORK CITYCAPITAL PROJECTS FUND

220
GENERAL GOVERNMENT:801 Department of Business Services . . . . . $ 5,211,350 $13,154,239 $ — $ 18,365,589_____________________ ___________________ _____________________ _____________________
PUBLIC SAFETY AND JUDICIAL:056 Police Department . . . . . . . . . . . . . . . . . — — (4,463,956) (4,463,956)057 Fire Department . . . . . . . . . . . . . . . . . . . (1,992) (200) — (2,192)072 Department of Correction . . . . . . . . . . . — (572,557) — (572,557)_____________________ ___________________ _____________________ _____________________
Total—Public Safety and Judicial . . . (1,992) (572,757) (4,463,956) (5,038,705)_____________________ ___________________ _____________________ _____________________
EDUCATION:040 Board of Education . . . . . . . . . . . . . . . . — — 70,080,650 70,080,650042 City University of New York
Community College . . . . . . . . . . . . . — (274,915) — (274,915)_____________________ ___________________ _____________________ _____________________Total—Education . . . . . . . . . . . . . . . . — (274,915) 70,080,650 69,805,735_____________________ ___________________ _____________________ _____________________
SOCIAL SERVICES:096 Human Resources Administration . . . . . 11,321,980 31,411 — 11,353,391_____________________ ___________________ _____________________ _____________________
ENVIRONMENTAL PROTECTION:826 Department of Environmental
Protection . . . . . . . . . . . . . . . . . . . . . (257,112) (93,358) 227,705 (122,765)827 Department of Sanitation . . . . . . . . . . . — 3,224,985 — 3,224,985_____________________ ___________________ _____________________ _____________________
Total—Environmental Protection . . . (257,112) 3,131,627 227,705 3,102,220_____________________ ___________________ _____________________ _____________________
TRANSPORTATION SERVICES:841 Department of Transportation . . . . . . . . 147,754,834 32,527,506 1,729,472 182,011,812998 Transit Authority . . . . . . . . . . . . . . . . . . 1,252,866 55,783 — 1,308,649_____________________ ___________________ _____________________ _____________________
Total—Transportation Services . . . . . 149,007,700 32,583,289 1,729,472 183,320,461_____________________ ___________________ _____________________ _____________________
PARKS, RECREATION AND CULTURAL ACTIVITIES:126 Department of Cultural Affairs . . . . . . . — — (25,927) (25,927)846 Department of Parks and Recreation . . . 1,703,943 (769,974) — 933,969_____________________ ___________________ _____________________ _____________________
Total—Parks, Recreation and Cultural Activities . . . . . . . . . . . . . 1,703,943 (769,974) (25,927) 908,042_____________________ ___________________ _____________________ _____________________
HOUSING:806 Department of Housing Preservation
and Development . . . . . . . . . . . . . . . . 107,334,012 — — 107,334,012_____________________ ___________________ _____________________ _____________________Total aid revenues by agency . . . . . . . $274,319,881 $47,282,920 $67,547,944 $389,150,745_____________________ ___________________ _____________________ __________________________________________ ___________________ _____________________ _____________________
Comptroller’s Report for Fiscal 2002 Part II-E—Capital Projects Fund—Schedule CP1
New York City Capital Projects Fund Aid Revenues by Agency
Federal State Other Total____________________________ ________________________ ___________________________ __________________________

221
GENERAL GOVERNMENT:801 Department of Business Services . . . . . . . . . . . . . . . . . . . . . . . . . . . . . . . . . . . . . . . . . . . . . . . . . . . . $ 176,456,483802 Department of Ports, International Trade and Commerce . . . . . . . . . . . . . . . . . . . . . . . . . . . . . . . . . 195,118856 Department of Citywide Administrative Services . . . . . . . . . . . . . . . . . . . . . . . . . . . . . . . . . . . . . . . 365,665,671858 Department of Information Technology and Telecommunications . . . . . . . . . . . . . . . . . . . . . . . . . . 34,768,910_____________
Total—General Government . . . . . . . . . . . . . . . . . . . . . . . . . . . . . . . . . . . . . . . . . . . . . . . . . . . . . . . . 577,086,182_____________
PUBLIC SAFETY AND JUDICIAL:056 Police Department . . . . . . . . . . . . . . . . . . . . . . . . . . . . . . . . . . . . . . . . . . . . . . . . . . . . . . . . . . . . . . . . 60,661,354057 Fire Department . . . . . . . . . . . . . . . . . . . . . . . . . . . . . . . . . . . . . . . . . . . . . . . . . . . . . . . . . . . . . . . . . 112,048,885072 Department of Correction . . . . . . . . . . . . . . . . . . . . . . . . . . . . . . . . . . . . . . . . . . . . . . . . . . . . . . . . . . 655,521,507130 Department of Juvenile Justice . . . . . . . . . . . . . . . . . . . . . . . . . . . . . . . . . . . . . . . . . . . . . . . . . . . . . . 229,578_____________
Total—Public Safety and Judicial . . . . . . . . . . . . . . . . . . . . . . . . . . . . . . . . . . . . . . . . . . . . . . . . . . . . 828,461,324_____________
EDUCATION:040 Board of Education . . . . . . . . . . . . . . . . . . . . . . . . . . . . . . . . . . . . . . . . . . . . . . . . . . . . . . . . . . . . . . . 1,765,248,662042 City University of New York:
Senior Colleges . . . . . . . . . . . . . . . . . . . . . . . . . . . . . . . . . . . . . . . . . . . . . . . . . . . . . . . . . . . . . . . . 1,109,875Community Colleges . . . . . . . . . . . . . . . . . . . . . . . . . . . . . . . . . . . . . . . . . . . . . . . . . . . . . . . . . . . 9,531,844_____________
Total—Education . . . . . . . . . . . . . . . . . . . . . . . . . . . . . . . . . . . . . . . . . . . . . . . . . . . . . . . . . . . . . . . . 1,775,890,381_____________
SOCIAL SERVICES:068 Administration for Children’s Services . . . . . . . . . . . . . . . . . . . . . . . . . . . . . . . . . . . . . . . . . . . . . . . 30,040,433071 Department of Homeless Services . . . . . . . . . . . . . . . . . . . . . . . . . . . . . . . . . . . . . . . . . . . . . . . . . . . 25,494,232096 Human Resources Administration . . . . . . . . . . . . . . . . . . . . . . . . . . . . . . . . . . . . . . . . . . . . . . . . . . . 48,259,949125 Department for the Aging . . . . . . . . . . . . . . . . . . . . . . . . . . . . . . . . . . . . . . . . . . . . . . . . . . . . . . . . . . 2,393,047_____________
Total—Social Services . . . . . . . . . . . . . . . . . . . . . . . . . . . . . . . . . . . . . . . . . . . . . . . . . . . . . . . . . . . . 106,187,661_____________
ENVIRONMENTAL PROTECTION:826 Department of Environmental Protection . . . . . . . . . . . . . . . . . . . . . . . . . . . . . . . . . . . . . . . . . . . . . . 1,036,705,764827 Department of Sanitation . . . . . . . . . . . . . . . . . . . . . . . . . . . . . . . . . . . . . . . . . . . . . . . . . . . . . . . . . . 185,248,832_____________
Total—Environmental Protection . . . . . . . . . . . . . . . . . . . . . . . . . . . . . . . . . . . . . . . . . . . . . . . . . . . . 1,221,954,596_____________
TRANSPORTATION SERVICES:841 Department of Transportation . . . . . . . . . . . . . . . . . . . . . . . . . . . . . . . . . . . . . . . . . . . . . . . . . . . . . . . 723,585,758998 Transit Authority . . . . . . . . . . . . . . . . . . . . . . . . . . . . . . . . . . . . . . . . . . . . . . . . . . . . . . . . . . . . . . . . . 191,145,973_____________
Total—Transportation Services . . . . . . . . . . . . . . . . . . . . . . . . . . . . . . . . . . . . . . . . . . . . . . . . . . . . . 914,731,731_____________
PARKS, RECREATION AND CULTURAL ACTIVITIES:126 Department of Cultural Affairs . . . . . . . . . . . . . . . . . . . . . . . . . . . . . . . . . . . . . . . . . . . . . . . . . . . . . . 157,599,852846 Department of Parks and Recreation . . . . . . . . . . . . . . . . . . . . . . . . . . . . . . . . . . . . . . . . . . . . . . . . . 211,939,352_____________
Total—Parks, Recreation and Cultural Activities . . . . . . . . . . . . . . . . . . . . . . . . . . . . . . . . . . . . . . . . 369,539,204_____________
HOUSING:806 Department of Housing Preservation and Development . . . . . . . . . . . . . . . . . . . . . . . . . . . . . . . . . . . 380,383,908_____________
HEALTH:816 Department of Health . . . . . . . . . . . . . . . . . . . . . . . . . . . . . . . . . . . . . . . . . . . . . . . . . . . . . . . . . . . . . 49,627,590819 New York City Health and Hospitals Corporation . . . . . . . . . . . . . . . . . . . . . . . . . . . . . . . . . . . . . . . 61,596,701_____________
Total—Health . . . . . . . . . . . . . . . . . . . . . . . . . . . . . . . . . . . . . . . . . . . . . . . . . . . . . . . . . . . . . . . . . . . 111,224,291_____________
LIBRARIES:035 Research Libraries . . . . . . . . . . . . . . . . . . . . . . . . . . . . . . . . . . . . . . . . . . . . . . . . . . . . . . . . . . . . . . . 18,600,740037 New York Public Library . . . . . . . . . . . . . . . . . . . . . . . . . . . . . . . . . . . . . . . . . . . . . . . . . . . . . . . . . . 4,156,256038 Brooklyn Public Library . . . . . . . . . . . . . . . . . . . . . . . . . . . . . . . . . . . . . . . . . . . . . . . . . . . . . . . . . . . 7,500,888039 Queens Borough Public Library . . . . . . . . . . . . . . . . . . . . . . . . . . . . . . . . . . . . . . . . . . . . . . . . . . . . . 4,384,355_____________
Total—Libraries . . . . . . . . . . . . . . . . . . . . . . . . . . . . . . . . . . . . . . . . . . . . . . . . . . . . . . . . . . . . . . . . . 34,642,239_____________Total expenditures by agency . . . . . . . . . . . . . . . . . . . . . . . . . . . . . . . . . . . . . . . . . . . . . . . . . . . . . . . $6,320,101,517__________________________
Comptroller’s Report for Fiscal 2002 Part II-E—Capital Projects Fund—Schedule CP2
New York City Capital Projects Fund Expenditures by Agency

222
(Continued)
GENERAL GOVERNMENT:801 Department of Business Services . . . . . $ 2,972,053,088 $ 2,066,021,703 $ 40,584,378 $ 865,447,007802 Department of Ports, International
Trade and Commerce . . . . . . . . . . . . 432,592,219 431,816,751 1,452,710 (677,242)856 Department of Citywide
Administrative Services . . . . . . . . . . . 7,054,570,708 4,493,442,286 317,505,614 2,243,622,808858 Department of Information
Technology and Telecommunication . . . . . . . . . . . . . . 242,572,933 123,526,958 7,793,137 111,252,838
866 Department of Consumer Affairs . . . . . 1,178,492 1,141,991 — 36,501_______________ ______________ ______________ ______________Total—General Government . . . . . . . . . 10,702,967,440 7,115,949,689 367,335,839 3,219,681,912_______________ ______________ ______________ ______________
PUBLIC SAFETY AND JUDICIAL:056 Police Department . . . . . . . . . . . . . . . . . 1,574,999,321 1,036,986,933 130,542,545 407,469,843057 Fire Department . . . . . . . . . . . . . . . . . . . 1,352,412,311 966,561,842 163,292,619 222,557,850072 Department of Correction . . . . . . . . . . . 2,988,321,199 2,588,299,576 220,003,169 180,018,454130 Department of Juvenile Justice . . . . . . . 75,006,502 82,602,920 7,069,552 (14,665,970)_______________ ______________ ______________ ______________
Total—Public Safety and Judicial . . . . . 5,990,739,333 4,674,451,271 520,907,885 795,380,177_______________ ______________ ______________ ______________
EDUCATION:040 Board of Education . . . . . . . . . . . . . . . . 18,271,989,684 16,338,425,767 1,853,245,059 80,318,858042 City University of New York:
Senior Colleges . . . . . . . . . . . . . . . . . 122,895,100 116,784,747 1,067,264 5,043,089Community Colleges . . . . . . . . . . . . . 256,950,874 195,204,995 2,464,682 59,281,197_______________ ______________ ______________ ______________
Total—Education . . . . . . . . . . . . . . . . . . 18,651,835,658 16,650,415,509 1,856,777,005 144,643,144_______________ ______________ ______________ ______________
SOCIAL SERVICES:068 Administration for Children’s
Services . . . . . . . . . . . . . . . . . . . . . . . 142,443,969 34,836,972 14,046,883 93,560,114071 Department of Homeless Services . . . . 227,051,835 118,431,717 24,230,640 84,389,478096 Human Resources Administration . . . . . 769,430,747 757,153,038 43,807,072 (31,529,363)125 Department for the Aging . . . . . . . . . . . 66,778,322 23,286,120 10,123,950 33,368,252_______________ ______________ ______________ ______________
Total—Social Services . . . . . . . . . . . . . 1,205,704,873 933,707,847 92,208,545 179,788,481_______________ ______________ ______________ ______________
ENVIRONMENTAL PROTECTION:826 Department of Environmental
Protection . . . . . . . . . . . . . . . . . . . . . 22,730,913,917 17,870,730,670 4,230,158,268 630,024,979827 Department of Sanitation . . . . . . . . . . . 4,378,470,939 3,652,059,400 274,483,954 451,927,585_______________ ______________ ______________ ______________
Total—Environmental Protection . . . . . 27,109,384,856 21,522,790,070 4,504,642,222 1,081,952,564_______________ ______________ ______________ ______________
TRANSPORTATION SERVICES:841 Department of Transportation . . . . . . . . 14,866,043,300 9,391,213,514 1,688,031,502 3,786,798,284998 Transit Authority . . . . . . . . . . . . . . . . . . 9,447,349,867 9,072,500,141 159,546,099 215,303,627_______________ ______________ ______________ ______________
Total—Transportation Services . . . . . . . 24,313,393,167 18,463,713,655 1,847,577,601 4,002,101,911_______________ ______________ ______________ ______________
Comptroller’s Report for Fiscal 2002 Part II-E—Capital Projects Fund—Schedule CP3
New York City Capital Projects Fund Expenditures and Commitments vs. Authorizations by Agency Through Fiscal Year 2002
OutstandingAmount Total Contract
Authorized Project and Order Unencumberedfor Expenditures Expenditures Commitments Balance___________________________________ _________________________________ _______________________________ _________________________________
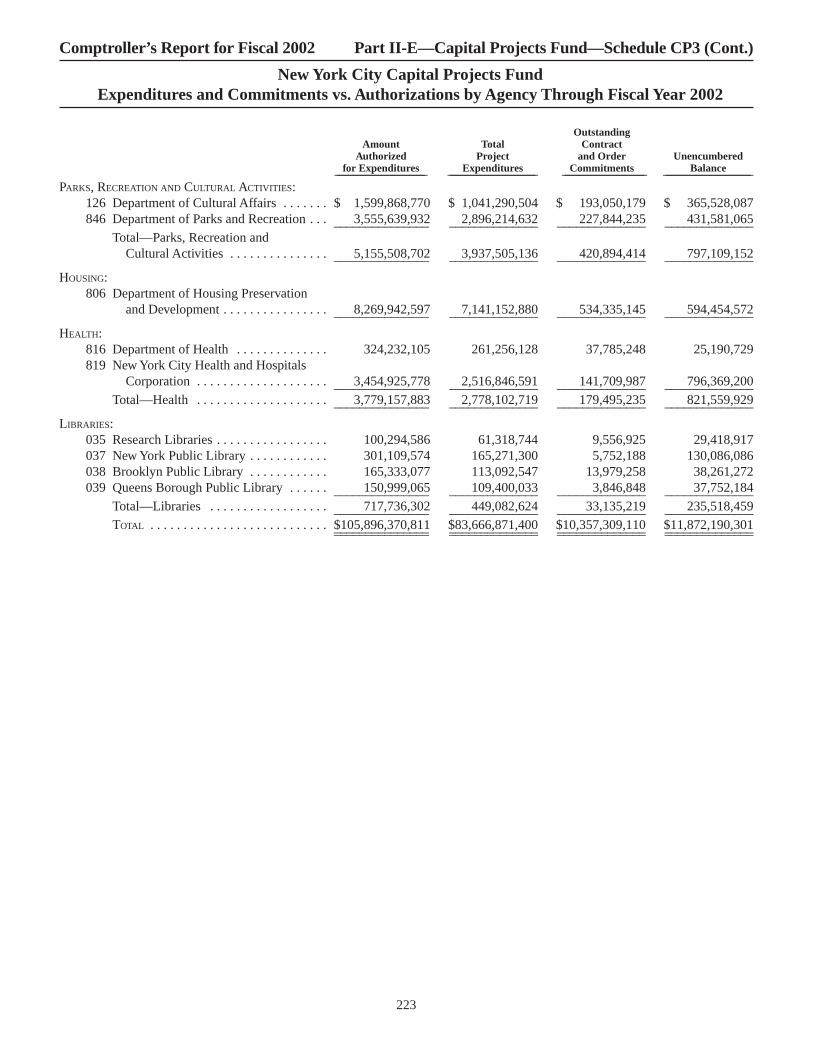
223
PARKS, RECREATION AND CULTURAL ACTIVITIES:126 Department of Cultural Affairs . . . . . . . $ 1,599,868,770 $ 1,041,290,504 $ 193,050,179 $ 365,528,087846 Department of Parks and Recreation . . . 3,555,639,932 2,896,214,632 227,844,235 431,581,065_______________ ______________ ______________ ______________
Total—Parks, Recreation andCultural Activities . . . . . . . . . . . . . . . 5,155,508,702 3,937,505,136 420,894,414 797,109,152_______________ ______________ ______________ ______________
HOUSING:806 Department of Housing Preservation
and Development . . . . . . . . . . . . . . . . 8,269,942,597 7,141,152,880 534,335,145 594,454,572_______________ ______________ ______________ ______________
HEALTH:816 Department of Health . . . . . . . . . . . . . . 324,232,105 261,256,128 37,785,248 25,190,729819 New York City Health and Hospitals
Corporation . . . . . . . . . . . . . . . . . . . . 3,454,925,778 2,516,846,591 141,709,987 796,369,200_______________ ______________ ______________ ______________Total—Health . . . . . . . . . . . . . . . . . . . . 3,779,157,883 2,778,102,719 179,495,235 821,559,929_______________ ______________ ______________ ______________
LIBRARIES:035 Research Libraries . . . . . . . . . . . . . . . . . 100,294,586 61,318,744 9,556,925 29,418,917037 New York Public Library . . . . . . . . . . . . 301,109,574 165,271,300 5,752,188 130,086,086038 Brooklyn Public Library . . . . . . . . . . . . 165,333,077 113,092,547 13,979,258 38,261,272039 Queens Borough Public Library . . . . . . 150,999,065 109,400,033 3,846,848 37,752,184_______________ ______________ ______________ ______________
Total—Libraries . . . . . . . . . . . . . . . . . . 717,736,302 449,082,624 33,135,219 235,518,459_______________ ______________ ______________ ______________TOTAL . . . . . . . . . . . . . . . . . . . . . . . . . . . $105,896,370,811 $83,666,871,400 $10,357,309,110 $11,872,190,301_______________ ______________ ______________ _____________________________ ______________ ______________ ______________
Comptroller’s Report for Fiscal 2002 Part II-E—Capital Projects Fund—Schedule CP3 (Cont.)
New York City Capital Projects Fund Expenditures and Commitments vs. Authorizations by Agency Through Fiscal Year 2002
OutstandingAmount Total Contract
Authorized Project and Order Unencumberedfor Expenditures Expenditures Commitments Balance__________________________________ _________________________________ _______________________________ _________________________________

224
(Continued)
GENERAL GOVERNMENT:Department of Business Services:
Industrial Parks . . . . . . . . . . . . . . . . . . . . . . . . . . . . . . . . . . . . . . . . . . . . . . . . . $ 15,153,941Commercial Development . . . . . . . . . . . . . . . . . . . . . . . . . . . . . . . . . . . . . . . . 161,302,542_____________
176,456,483_____________Department of Ports, International Trade and Commerce . . . . . . . . . . . . . . . . . . . . 195,118_____________Department of Citywide Administrative Services:
Municipal Supplies . . . . . . . . . . . . . . . . . . . . . . . . . . . . . . . . . . . . . . . . . . . . . . 178,439,272Public Buildings . . . . . . . . . . . . . . . . . . . . . . . . . . . . . . . . . . . . . . . . . . . . . . . . 149,728,008Real Estate . . . . . . . . . . . . . . . . . . . . . . . . . . . . . . . . . . . . . . . . . . . . . . . . . . . . 16,769,747Courts . . . . . . . . . . . . . . . . . . . . . . . . . . . . . . . . . . . . . . . . . . . . . . . . . . . . . . . . 20,728,644_____________
365,665,671_____________Department of Information Technology and Telecommunications . . . . . . . . . . . . . 34,768,910_____________
Total General Government . . . . . . . . . . . . . . . . . . . . . . . . . . . . . . . . . . . . $ 577,086,182PUBLIC SAFETY AND JUDICIAL:
Police Department . . . . . . . . . . . . . . . . . . . . . . . . . . . . . . . . . . . . . . . . . . . . . . . . . . . 60,661,354Fire Department . . . . . . . . . . . . . . . . . . . . . . . . . . . . . . . . . . . . . . . . . . . . . . . . . . . . 112,048,885Department of Correction . . . . . . . . . . . . . . . . . . . . . . . . . . . . . . . . . . . . . . . . . . . . . 655,521,507Department of Juvenile Justice . . . . . . . . . . . . . . . . . . . . . . . . . . . . . . . . . . . . . . . . . 229,578_____________
828,461,324_____________Total Public Safety and Judicial . . . . . . . . . . . . . . . . . . . . . . . . . . . . . . . . 828,461,324
EDUCATION:Board of Education . . . . . . . . . . . . . . . . . . . . . . . . . . . . . . . . . . . . . . . . . . . . . . . . . . 1,765,248,662_____________City University of New York:
Senior Colleges . . . . . . . . . . . . . . . . . . . . . . . . . . . . . . . . . . . . . . . . . . . . . . . . . 1,109,875Community Colleges . . . . . . . . . . . . . . . . . . . . . . . . . . . . . . . . . . . . . . . . . . . . 9,531,844_____________
10,641,719_____________Total Education . . . . . . . . . . . . . . . . . . . . . . . . . . . . . . . . . . . . . . . . . . . . . 1,775,890,381
SOCIAL SERVICES:Administration for Children’s Services . . . . . . . . . . . . . . . . . . . . . . . . . . . . . . . . . . 30,040,433Department of Homeless Services . . . . . . . . . . . . . . . . . . . . . . . . . . . . . . . . . . . . . . 25,494,232Human Resources Administration . . . . . . . . . . . . . . . . . . . . . . . . . . . . . . . . . . . . . . 48,259,949Department for the Aging . . . . . . . . . . . . . . . . . . . . . . . . . . . . . . . . . . . . . . . . . . . . . 2,393,047_____________
106,187,661_____________Total Social Services . . . . . . . . . . . . . . . . . . . . . . . . . . . . . . . . . . . . . . . . . 106,187,661
ENVIRONMENTAL PROTECTION:Department of Environmental Protection
Water Supply and Distribution:Water Supply . . . . . . . . . . . . . . . . . . . . . . . . . . . . . . . . . . . . . . . . . . . . . . . 91,007,125Water Mains . . . . . . . . . . . . . . . . . . . . . . . . . . . . . . . . . . . . . . . . . . . . . . . 333,324,404_____________
424,331,529_____________Sewage Collection and Treatment:
Sewers . . . . . . . . . . . . . . . . . . . . . . . . . . . . . . . . . . . . . . . . . . . . . . . . . . . . 184,220,529Water Pollution . . . . . . . . . . . . . . . . . . . . . . . . . . . . . . . . . . . . . . . . . . . . . 355,834,618_____________
540,055,147_____________Equipment . . . . . . . . . . . . . . . . . . . . . . . . . . . . . . . . . . . . . . . . . . . . . . . . . . . . . 72,319,088_____________
Comptroller’s Report for Fiscal 2002 Part II-E—Capital Projects Fund—Schedule CP4
New York City Capital Projects Fund Expenditures by Purpose
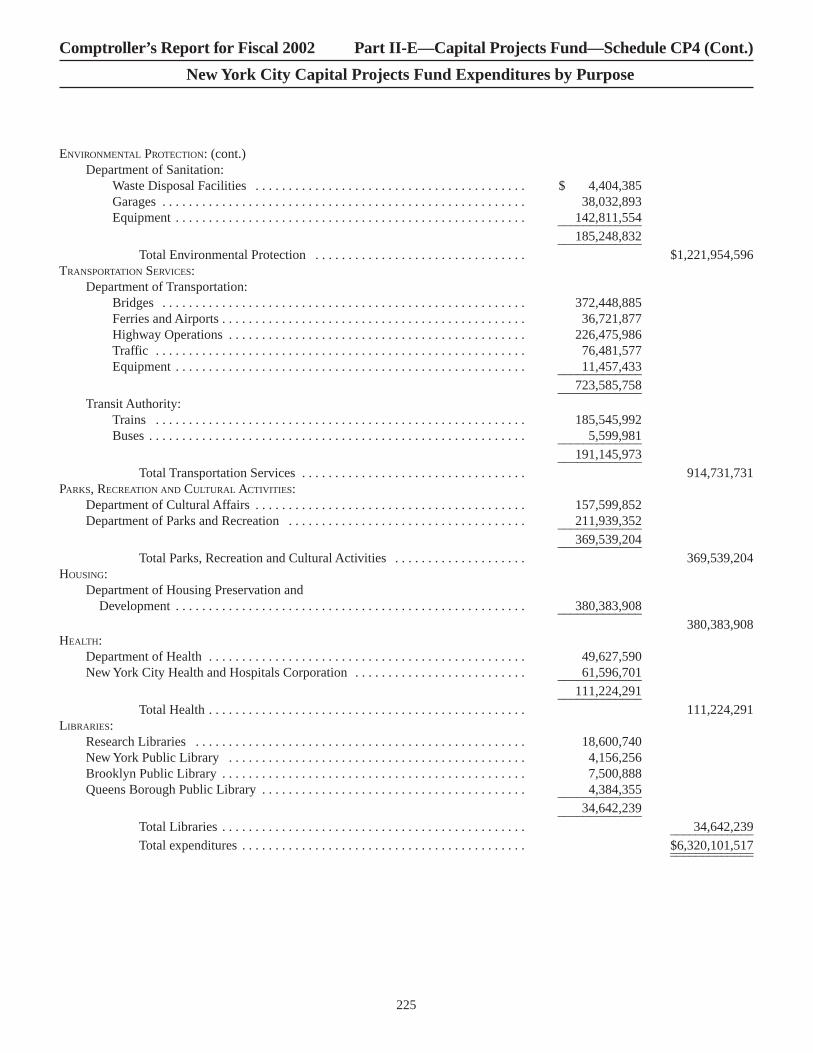
225
ENVIRONMENTAL PROTECTION: (cont.)Department of Sanitation:
Waste Disposal Facilities . . . . . . . . . . . . . . . . . . . . . . . . . . . . . . . . . . . . . . . . . $ 4,404,385Garages . . . . . . . . . . . . . . . . . . . . . . . . . . . . . . . . . . . . . . . . . . . . . . . . . . . . . . . 38,032,893Equipment . . . . . . . . . . . . . . . . . . . . . . . . . . . . . . . . . . . . . . . . . . . . . . . . . . . . . 142,811,554_____________
185,248,832_____________Total Environmental Protection . . . . . . . . . . . . . . . . . . . . . . . . . . . . . . . . $1,221,954,596
TRANSPORTATION SERVICES:Department of Transportation:
Bridges . . . . . . . . . . . . . . . . . . . . . . . . . . . . . . . . . . . . . . . . . . . . . . . . . . . . . . . 372,448,885Ferries and Airports . . . . . . . . . . . . . . . . . . . . . . . . . . . . . . . . . . . . . . . . . . . . . . 36,721,877Highway Operations . . . . . . . . . . . . . . . . . . . . . . . . . . . . . . . . . . . . . . . . . . . . . 226,475,986Traffic . . . . . . . . . . . . . . . . . . . . . . . . . . . . . . . . . . . . . . . . . . . . . . . . . . . . . . . . 76,481,577Equipment . . . . . . . . . . . . . . . . . . . . . . . . . . . . . . . . . . . . . . . . . . . . . . . . . . . . . 11,457,433_____________
723,585,758_____________Transit Authority:
Trains . . . . . . . . . . . . . . . . . . . . . . . . . . . . . . . . . . . . . . . . . . . . . . . . . . . . . . . . 185,545,992Buses . . . . . . . . . . . . . . . . . . . . . . . . . . . . . . . . . . . . . . . . . . . . . . . . . . . . . . . . . 5,599,981_____________
191,145,973_____________Total Transportation Services . . . . . . . . . . . . . . . . . . . . . . . . . . . . . . . . . . 914,731,731
PARKS, RECREATION AND CULTURAL ACTIVITIES:Department of Cultural Affairs . . . . . . . . . . . . . . . . . . . . . . . . . . . . . . . . . . . . . . . . . 157,599,852Department of Parks and Recreation . . . . . . . . . . . . . . . . . . . . . . . . . . . . . . . . . . . . 211,939,352_____________
369,539,204_____________Total Parks, Recreation and Cultural Activities . . . . . . . . . . . . . . . . . . . . 369,539,204
HOUSING:Department of Housing Preservation and
Development . . . . . . . . . . . . . . . . . . . . . . . . . . . . . . . . . . . . . . . . . . . . . . . . . . . . . 380,383,908_____________380,383,908
HEALTH:Department of Health . . . . . . . . . . . . . . . . . . . . . . . . . . . . . . . . . . . . . . . . . . . . . . . . 49,627,590New York City Health and Hospitals Corporation . . . . . . . . . . . . . . . . . . . . . . . . . . 61,596,701_____________
111,224,291_____________Total Health . . . . . . . . . . . . . . . . . . . . . . . . . . . . . . . . . . . . . . . . . . . . . . . . 111,224,291
LIBRARIES:Research Libraries . . . . . . . . . . . . . . . . . . . . . . . . . . . . . . . . . . . . . . . . . . . . . . . . . . 18,600,740New York Public Library . . . . . . . . . . . . . . . . . . . . . . . . . . . . . . . . . . . . . . . . . . . . . 4,156,256Brooklyn Public Library . . . . . . . . . . . . . . . . . . . . . . . . . . . . . . . . . . . . . . . . . . . . . . 7,500,888Queens Borough Public Library . . . . . . . . . . . . . . . . . . . . . . . . . . . . . . . . . . . . . . . . 4,384,355_____________
34,642,239_____________Total Libraries . . . . . . . . . . . . . . . . . . . . . . . . . . . . . . . . . . . . . . . . . . . . . . 34,642,239_____________Total expenditures . . . . . . . . . . . . . . . . . . . . . . . . . . . . . . . . . . . . . . . . . . . $6,320,101,517__________________________
Comptroller’s Report for Fiscal 2002 Part II-E—Capital Projects Fund—Schedule CP4 (Cont.)
New York City Capital Projects Fund Expenditures by Purpose

[This page intentionally left blank.]

OTHER SUPPLEMENTARY INFORMATION
CAPITAL ASSETSUSED IN THE OPERATION
OFGOVERNMENTAL FUNDS
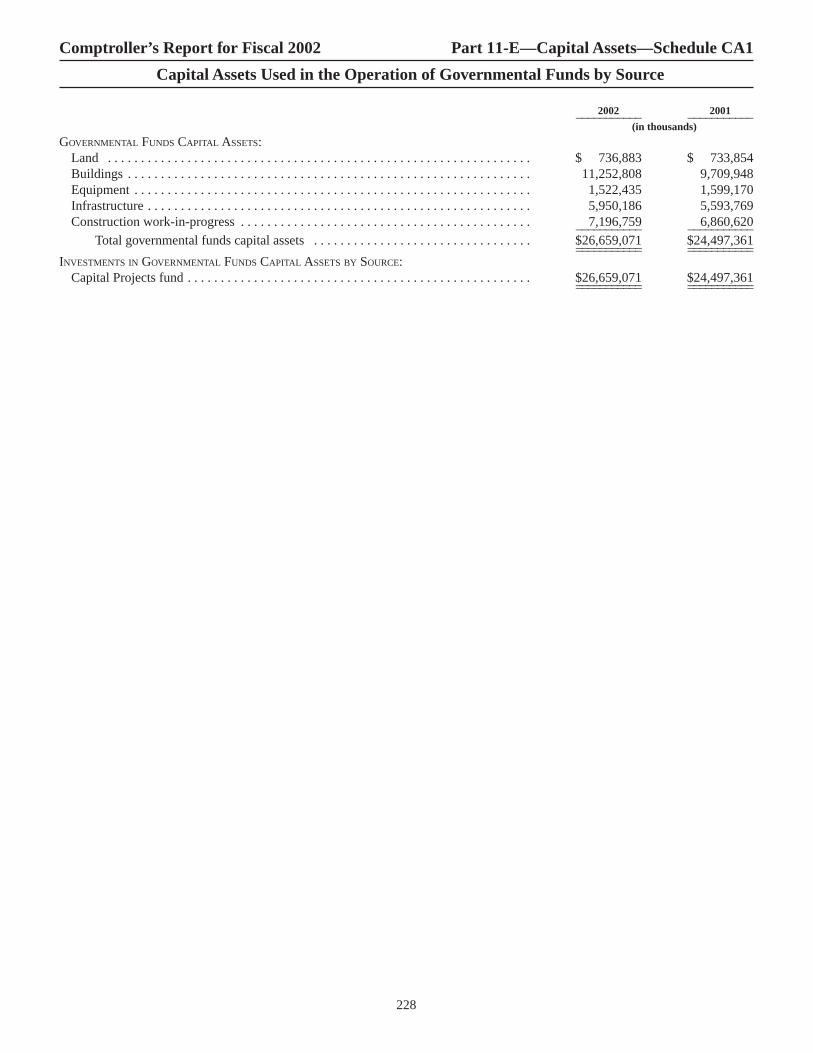
228
2002 2001___________ ___________(in thousands)
GOVERNMENTAL FUNDS CAPITAL ASSETS:Land . . . . . . . . . . . . . . . . . . . . . . . . . . . . . . . . . . . . . . . . . . . . . . . . . . . . . . . . . . . . . . . . $ 736,883 $ 733,854Buildings . . . . . . . . . . . . . . . . . . . . . . . . . . . . . . . . . . . . . . . . . . . . . . . . . . . . . . . . . . . . . 11,252,808 9,709,948Equipment . . . . . . . . . . . . . . . . . . . . . . . . . . . . . . . . . . . . . . . . . . . . . . . . . . . . . . . . . . . . 1,522,435 1,599,170Infrastructure . . . . . . . . . . . . . . . . . . . . . . . . . . . . . . . . . . . . . . . . . . . . . . . . . . . . . . . . . . 5,950,186 5,593,769Construction work-in-progress . . . . . . . . . . . . . . . . . . . . . . . . . . . . . . . . . . . . . . . . . . . . 7,196,759 6,860,620___________ ___________
Total governmental funds capital assets . . . . . . . . . . . . . . . . . . . . . . . . . . . . . . . . . $26,659,071 $24,497,361___________ ______________________ ___________INVESTMENTS IN GOVERNMENTAL FUNDS CAPITAL ASSETS BY SOURCE:
Capital Projects fund . . . . . . . . . . . . . . . . . . . . . . . . . . . . . . . . . . . . . . . . . . . . . . . . . . . . $26,659,071 $24,497,361___________ ______________________ ___________
Comptroller’s Report for Fiscal 2002 Part 11-E—Capital Assets—Schedule CA1
Capital Assets Used in the Operation of Governmental Funds by Source
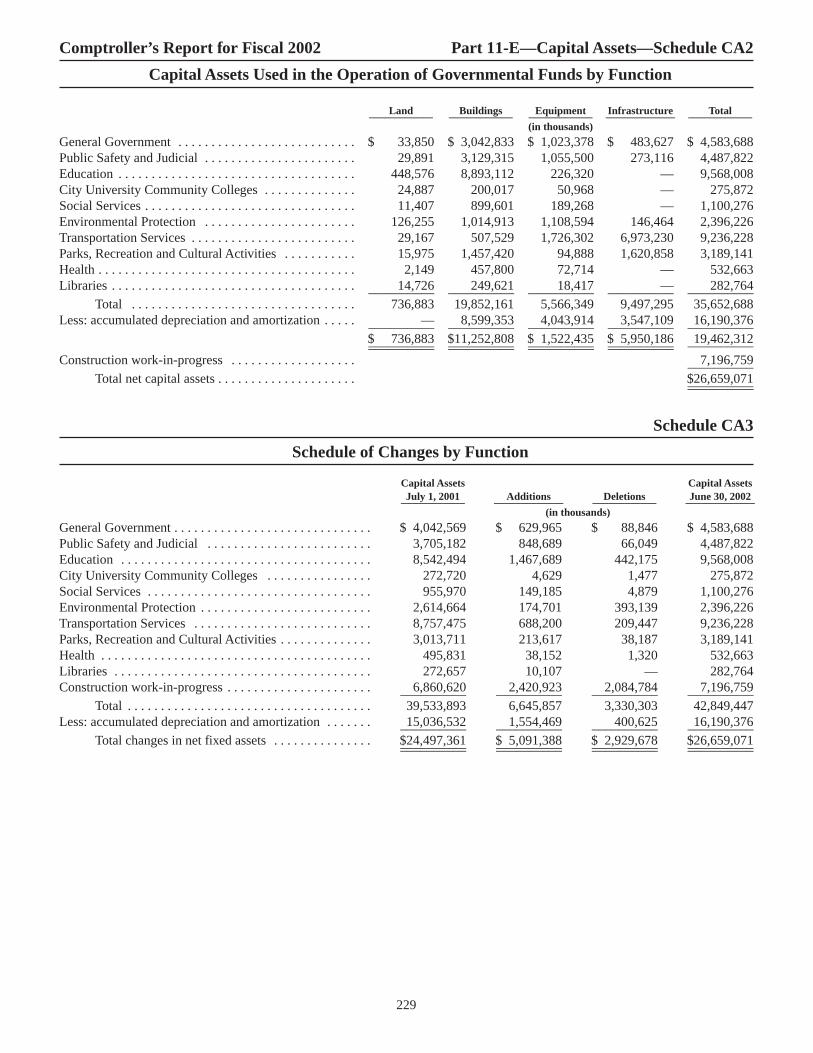
229
Land Buildings Equipment Infrastructure Total____________ ____________ ____________ _____________ ____________(in thousands)
General Government . . . . . . . . . . . . . . . . . . . . . . . . . . . $ 33,850 $ 3,042,833 $ 1,023,378 $ 483,627 $ 4,583,688Public Safety and Judicial . . . . . . . . . . . . . . . . . . . . . . . 29,891 3,129,315 1,055,500 273,116 4,487,822Education . . . . . . . . . . . . . . . . . . . . . . . . . . . . . . . . . . . . 448,576 8,893,112 226,320 — 9,568,008City University Community Colleges . . . . . . . . . . . . . . 24,887 200,017 50,968 — 275,872Social Services . . . . . . . . . . . . . . . . . . . . . . . . . . . . . . . . 11,407 899,601 189,268 — 1,100,276Environmental Protection . . . . . . . . . . . . . . . . . . . . . . . 126,255 1,014,913 1,108,594 146,464 2,396,226Transportation Services . . . . . . . . . . . . . . . . . . . . . . . . . 29,167 507,529 1,726,302 6,973,230 9,236,228Parks, Recreation and Cultural Activities . . . . . . . . . . . 15,975 1,457,420 94,888 1,620,858 3,189,141Health . . . . . . . . . . . . . . . . . . . . . . . . . . . . . . . . . . . . . . . 2,149 457,800 72,714 — 532,663Libraries . . . . . . . . . . . . . . . . . . . . . . . . . . . . . . . . . . . . . 14,726 249,621 18,417 — 282,764__________ __________ __________ __________ __________
Total . . . . . . . . . . . . . . . . . . . . . . . . . . . . . . . . . . 736,883 19,852,161 5,566,349 9,497,295 35,652,688Less: accumulated depreciation and amortization . . . . . — 8,599,353 4,043,914 3,547,109 16,190,376__________ __________ __________ __________ __________
$ 736,883 $11,252,808 $ 1,522,435 $ 5,950,186 19,462,312__________ __________ __________ __________ ____________________ __________ __________ __________Construction work-in-progress . . . . . . . . . . . . . . . . . . . 7,196,759__________
Total net capital assets . . . . . . . . . . . . . . . . . . . . . $26,659,071____________________
Schedule CA3
Schedule of Changes by Function
Capital Assets Capital AssetsJuly 1, 2001 Additions Deletions June 30, 2002____________ _____________ ____________ _____________
(in thousands)
General Government . . . . . . . . . . . . . . . . . . . . . . . . . . . . . . $ 4,042,569 $ 629,965 $ 88,846 $ 4,583,688Public Safety and Judicial . . . . . . . . . . . . . . . . . . . . . . . . . 3,705,182 848,689 66,049 4,487,822Education . . . . . . . . . . . . . . . . . . . . . . . . . . . . . . . . . . . . . . 8,542,494 1,467,689 442,175 9,568,008City University Community Colleges . . . . . . . . . . . . . . . . 272,720 4,629 1,477 275,872Social Services . . . . . . . . . . . . . . . . . . . . . . . . . . . . . . . . . . 955,970 149,185 4,879 1,100,276Environmental Protection . . . . . . . . . . . . . . . . . . . . . . . . . . 2,614,664 174,701 393,139 2,396,226Transportation Services . . . . . . . . . . . . . . . . . . . . . . . . . . . 8,757,475 688,200 209,447 9,236,228Parks, Recreation and Cultural Activities . . . . . . . . . . . . . . 3,013,711 213,617 38,187 3,189,141Health . . . . . . . . . . . . . . . . . . . . . . . . . . . . . . . . . . . . . . . . . 495,831 38,152 1,320 532,663Libraries . . . . . . . . . . . . . . . . . . . . . . . . . . . . . . . . . . . . . . . 272,657 10,107 — 282,764Construction work-in-progress . . . . . . . . . . . . . . . . . . . . . . 6,860,620 2,420,923 2,084,784 7,196,759__________ __________ __________ __________
Total . . . . . . . . . . . . . . . . . . . . . . . . . . . . . . . . . . . . . 39,533,893 6,645,857 3,330,303 42,849,447Less: accumulated depreciation and amortization . . . . . . . 15,036,532 1,554,469 400,625 16,190,376__________ __________ __________ __________
Total changes in net fixed assets . . . . . . . . . . . . . . . $24,497,361 $ 5,091,388 $ 2,929,678 $26,659,071__________ __________ __________ ____________________ __________ __________ __________
Comptroller’s Report for Fiscal 2002 Part 11-E—Capital Assets—Schedule CA2
Capital Assets Used in the Operation of Governmental Funds by Function

[This page intentionally left blank.]
The City of New York
ComprehensiveAnnual Financial Report
of theComptroller
STATISTICAL SECTION
Part III
Fiscal Year Ended June 30, 2002


233
Fiscal Year_________________________________________________2002 2001 2000___________ ___________ ___________
(in thousands)
General government . . . . . . . . . . . . . . . . . . . . . . . . . . . . . . . . . . . . . $ 2,070,573 $ 1,881,812 $ 1,578,356 Public safety and judicial . . . . . . . . . . . . . . . . . . . . . . . . . . . . . . . . . 9,524,318 8,661,411 7,772,048 Education . . . . . . . . . . . . . . . . . . . . . . . . . . . . . . . . . . . . . . . . . . . . . 13,249,344 12,248,775 11,533,688 City University . . . . . . . . . . . . . . . . . . . . . . . . . . . . . . . . . . . . . . . . . 807,960 668,954 652,576 Social services . . . . . . . . . . . . . . . . . . . . . . . . . . . . . . . . . . . . . . . . . . 9,567,970 9,166,149 8,783,221 Environmental protection . . . . . . . . . . . . . . . . . . . . . . . . . . . . . . . . . 2,205,704 2,350,867 2,058,606 Transportation services . . . . . . . . . . . . . . . . . . . . . . . . . . . . . . . . . . . 1,329,314 1,654,344 1,401,725 Parks, recreation and cultural activities . . . . . . . . . . . . . . . . . . . . . . 719,867 488,865 574,024 Housing . . . . . . . . . . . . . . . . . . . . . . . . . . . . . . . . . . . . . . . . . . . . . . . 905,461 1,000,300 847,358 Health (including payments to HHC) . . . . . . . . . . . . . . . . . . . . . . . . 2,816,360 2,329,191 1,976,975 Libraries . . . . . . . . . . . . . . . . . . . . . . . . . . . . . . . . . . . . . . . . . . . . . . 161,250 362,034 268,931 Debt service interest . . . . . . . . . . . . . . . . . . . . . . . . . . . . . . . . . . . . . 2,180,711 2,214,717 2,114,285 ___________ ___________ ___________
Total government-wide expenses by function . . . . . . . . . . . . . . . . $45,538,832 $43,027,419 $39,561,793 ___________ ___________ ______________________ ___________ ___________
* Reporting for government-wide expenses by function began in fiscal year 2000.
Comptroller’s Report for Fiscal 2002 Part III—Statistical Information
Government-wide Expenses by Function—Three Year Trend*

234
Fiscal Year_________________________________________________2002 2001 2000___________ ___________ ___________
(in thousands)
Charges for Services . . . . . . . . . . . . . . . . . . . . . . . . . . . . . . . . . . . . . $ 3,001,330 $ 2,868,605 $ 2,620,702Operating Grants and Contributions . . . . . . . . . . . . . . . . . . . . . . . . . 14,651,155 12,773,015 11,907,550Capital Grants and Contributions . . . . . . . . . . . . . . . . . . . . . . . . . . . 493,798 572,514 378,807Taxes . . . . . . . . . . . . . . . . . . . . . . . . . . . . . . . . . . . . . . . . . . . . . . . . . 21,939,595 23,712,065 22,157,704Investment income . . . . . . . . . . . . . . . . . . . . . . . . . . . . . . . . . . . . . . 190,041 391,902 346,857Other Federal and State aid . . . . . . . . . . . . . . . . . . . . . . . . . . . . . . . . 975,281 928,184 920,547Other . . . . . . . . . . . . . . . . . . . . . . . . . . . . . . . . . . . . . . . . . . . . . . . . . 435,149 633,579 347,937___________ ___________ ___________
Total government-wide revenues . . . . . . . . . . . . . . . . . . . . . . . . . . $41,686,349 $41,879,864 $38,680,104___________ ___________ ______________________ ___________ ___________
* Reporting for government-wide revenues began in fiscal year 2000.
Comptroller’s Report for Fiscal 2002 Part III—Statistical Information
Government-wide Revenues—Three Year Trend*
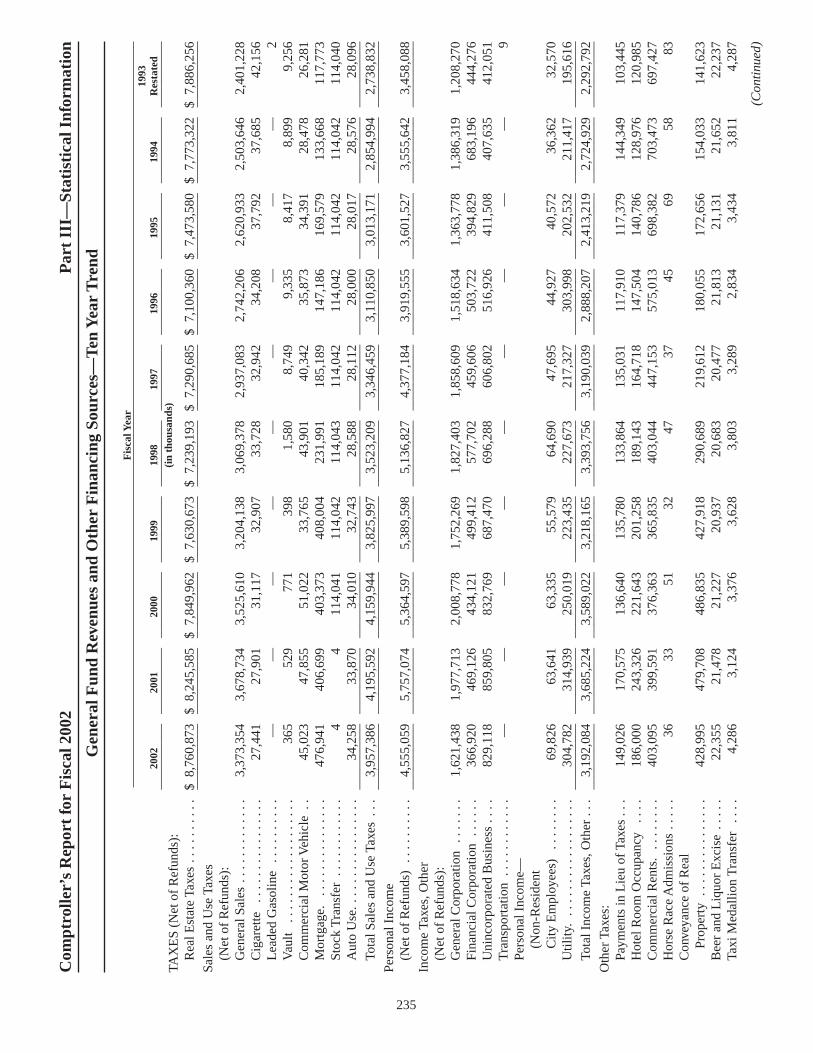
235
TAX
ES
(Net
of
Ref
unds
):R
eal E
stat
e Ta
xes
. . .
. . .
. . .
.$
8,76
0,87
3$
8,24
5,58
5$
7,84
9,96
2$
7,63
0,67
3$
7,23
9,19
3$
7,29
0,68
5$
7,10
0,36
0$
7,47
3,58
0$
7,77
3,32
2$
7,88
6,25
6__
____
____
____
____
____
____
____
____
____
____
____
____
____
____
____
____
____
____
____
____
____
____
____
____
__Sa
les
and
Use
Tax
es
(Net
of
Ref
unds
):G
ener
al S
ales
. . .
. . .
. . .
. . .
.3,
373,
354
3,67
8,73
43,
525,
610
3,20
4,13
83,
069,
378
2,93
7,08
32,
742,
206
2,62
0,93
32,
503,
646
2,40
1,22
8C
igar
ette
. . .
. . .
. . .
. . .
. . .
.27
,441
27,9
0131
,117
32,9
0733
,728
32,9
4234
,208
37,7
9237
,685
42,1
56L
eade
d G
asol
ine
. . .
. . .
. . .
.—
——
——
——
——
2V
ault
. . .
. . .
. . .
. . .
. . .
. . .
.36
552
977
139
81,
580
8,74
99,
335
8,41
78,
899
9,25
6C
omm
erci
al M
otor
Veh
icle
. .
45,0
2347
,855
51,0
2233
,765
43,9
0140
,342
35,8
7334
,391
28,4
7826
,281
Mor
tgag
e. .
. . .
. . .
. . .
. . .
. .47
6,94
140
6,69
940
3,37
340
8,00
423
1,99
118
5,18
914
7,18
616
9,57
913
3,66
811
7,77
3St
ock
Tra
nsfe
r .
. . .
. . .
. . .
. .4
411
4,04
111
4,04
211
4,04
311
4,04
211
4,04
211
4,04
211
4,04
211
4,04
0A
uto
Use
. . .
. . .
. . .
. . .
. . .
. .34
,258
33,8
7034
,010
32,7
4328
,588
28,1
1228
,000
28,0
1728
,576
28,0
96__
____
____
____
____
____
____
____
____
____
____
____
____
____
____
____
____
____
____
____
____
____
____
____
____
__To
tal S
ales
and
Use
Tax
es .
. .3,
957,
386
4,19
5,59
24,
159,
944
3,82
5,99
73,
523,
209
3,34
6,45
93,
110,
850
3,01
3,17
12,
854,
994
2,73
8,83
2__
____
____
____
____
____
____
____
____
____
____
____
____
____
____
____
____
____
____
____
____
____
____
____
____
__Pe
rson
al I
ncom
e (N
et o
f R
efun
ds)
. . .
. . .
. . .
.4,
555,
059
5,75
7,07
45,
364,
597
5,38
9,59
85,
136,
827
4,37
7,18
43,
919,
555
3,60
1,52
73,
555,
642
3,45
8,08
8__
____
____
____
____
____
____
____
____
____
____
____
____
____
____
____
____
____
____
____
____
____
____
____
____
__In
com
e Ta
xes,
Oth
er
(Net
of
Ref
unds
):G
ener
al C
orpo
ratio
n .
. . .
. . .
1,62
1,43
81,
977,
713
2,00
8,77
81,
752,
269
1,82
7,40
31,
858,
609
1,51
8,63
41,
363,
778
1,38
6,31
91,
208,
270
Fina
ncia
l Cor
pora
tion
. . .
. . .
366,
920
469,
126
434,
121
499,
412
577,
702
459,
606
503,
722
394,
829
683,
196
444,
276
Uni
ncor
pora
ted
Bus
ines
s . .
. .
829,
118
859,
805
832,
769
687,
470
696,
288
606,
802
516,
926
411,
508
407,
635
412,
051
Tra
nspo
rtat
ion
. . .
. . .
. . .
. . .
——
——
——
——
—9
Pers
onal
Inc
ome—
(Non
-Res
iden
tC
ity E
mpl
oyee
s) .
. . .
. . .
.69
,826
63,6
4163
,335
55,5
7964
,690
47,6
9544
,927
40,5
7236
,362
32,5
70U
tility
. . .
. . .
. . .
. . .
. . .
. . .
.30
4,78
231
4,93
925
0,01
922
3,43
522
7,67
321
7,32
730
3,99
820
2,53
221
1,41
719
5,61
6__
____
____
____
____
____
____
____
____
____
____
____
____
____
____
____
____
____
____
____
____
____
____
____
____
__To
tal I
ncom
e Ta
xes,
Oth
er .
. .3,
192,
084
3,68
5,22
43,
589,
022
3,21
8,16
53,
393,
756
3,19
0,03
92,
888,
207
2,41
3,21
92,
724,
929
2,29
2,79
2__
____
____
____
____
____
____
____
____
____
____
____
____
____
____
____
____
____
____
____
____
____
____
____
____
__O
ther
Tax
es:
Paym
ents
in L
ieu
of T
axes
. . .
149,
026
170,
575
136,
640
135,
780
133,
864
135,
031
117,
910
117,
379
144,
349
103,
445
Hot
el R
oom
Occ
upan
cy .
. . .
186,
000
243,
326
221,
643
201,
258
189,
143
164,
718
147,
504
140,
786
128,
976
120,
985
Com
mer
cial
Ren
ts.
. . .
. . .
. .
403,
095
399,
591
376,
363
365,
835
403,
044
447,
153
575,
013
698,
382
703,
473
697,
427
Hor
se R
ace
Adm
issi
ons
. . .
. .36
3351
3247
3745
6958
83C
onve
yanc
e of
Rea
l Pr
oper
ty .
. . .
. . .
. . .
. . .
. .42
8,99
547
9,70
848
6,83
542
7,91
829
0,68
921
9,61
218
0,05
517
2,65
615
4,03
314
1,62
3B
eer
and
Liq
uor
Exc
ise
. . .
. .
22,3
5521
,478
21,2
2720
,937
20,6
8320
,477
21,8
1321
,131
21,6
5222
,237
Taxi
Med
allio
n T
rans
fer
. . .
.4,
286
3,12
43,
376
3,62
83,
803
3,28
92,
834
3,43
43,
811
4,28
7
(Con
tinu
ed)
Com
ptro
ller’
s R
epor
t fo
r F
isca
l 200
2P
art
III—
Stat
isti
cal I
nfor
mat
ion
Gen
eral
Fun
d R
even
ues
and
Oth
er F
inan
cing
Sou
rces
—Te
n Y
ear
Tre
nd
Fis
cal Y
ear
1993
2002
2001
2000
1999
1998
1997
1996
1995
1994
Res
tate
d__
____
____
____
____
____
____
____
____
____
____
____
____
____
____
____
____
____
____
____
____
____
____
____
____
__(i
n th
ousa
nds)

236
TAX
ES
(con
t.):
Oth
er T
axes
(co
nt.)
Surc
harg
e on
Liq
uor
Lic
ense
s .
. . .
. . .
. . .
. . .
. .$
3,97
3$
3,70
2$
3,44
5$
4,07
8$
3,18
3$
3,32
4$
3,18
9$
3,18
8$
3,52
6$
2,95
3L
otte
ry C
rim
inal
Jus
tice
Fund
. . .
. . .
. . .
. . .
. . .
. . .
——
——
——
——
—58
6C
oin-
oper
ated
Am
usem
ent
Dev
ices
. . .
. . .
. . .
. . .
. . .
.—
55
1012
796
883
279
998
71,
253
Ref
unds
of
Oth
er T
axes
. . .
. .
(15,
856)
(24,
561)
(17,
941)
(21,
754)
(12,
882)
(14,
630)
(14,
682)
(11,
273)
(12,
128)
(11,
089)
____
____
____
____
____
____
____
____
____
____
____
____
____
____
____
____
____
____
____
____
____
____
____
____
____
Tota
l Oth
er T
axes
. . .
. . .
. . .
.1,
181,
910
1,29
6,98
11,
231,
644
1,13
7,72
21,
031,
701
979,
979
1,03
4,51
31,
146,
551
1,14
8,73
71,
083,
790
____
____
____
____
____
____
____
____
____
____
____
____
____
____
____
____
____
____
____
____
____
____
____
____
____
Pena
lties
and
Int
eres
t on
Del
inqu
ent T
axes
:R
eal E
stat
e Ta
xes
. . .
. . .
. . .
.57
,264
10,2
5950
,245
58,0
2077
,499
89,1
7870
,329
48,8
2486
,230
86,9
93Pe
nalti
es a
nd I
nter
est o
nO
ther
Tax
es .
. . .
. . .
. . .
. .—
178
(39)
2,37
02,
326
3,37
93,
432
5,22
43,
564
58,0
29R
efun
ds—
Pena
lties
and
Inte
rest
on
Oth
er T
axes
. . .
(8,3
46)
(13,
760)
(16,
071)
(4,2
89)
(25,
993)
(9,2
76)
(13,
154)
(16,
856)
(32,
840)
(25,
045)
____
____
____
____
____
____
____
____
____
____
____
____
____
____
____
____
____
____
____
____
____
____
____
____
____
Tota
l Pen
altie
s an
d In
tere
st
on D
elin
quen
t Tax
es .
. . .
.48
,918
(3,3
23)
34,1
3556
,101
53,8
3283
,281
60,6
0737
,192
56,9
5411
9,97
7__
____
____
____
____
____
____
____
____
____
____
____
____
____
____
____
____
____
____
____
____
____
____
____
____
__To
tal T
axes
. . .
. . .
. . .
. . .
. . .
21,6
96,2
3023
,177
,133
22,2
29,3
0421
,258
,256
20,3
78,5
1819
,267
,627
18,1
14,0
9217
,685
,240
18,1
14,5
7817
,579
,735
____
____
____
____
____
____
____
____
____
____
____
____
____
____
____
____
____
____
____
____
____
____
____
____
____
FED
ER
AL
GR
AN
TS—
CA
TE
GO
RIC
AL
:G
ener
al G
over
nmen
t . .
. . .
. .
861,
466
291,
211
301,
107
282,
529
307,
125
316,
699
293,
706
310,
174
283,
110
213,
507
Publ
ic S
afet
y an
d Ju
dici
al .
. .60
6,97
418
5,62
915
7,76
117
5,86
914
4,81
611
3,33
768
,324
19,3
3525
,960
30,0
12T
rans
port
atio
n .
. . .
. . .
. . .
. .44
,582
31,8
6623
,224
27,8
1322
,308
17,2
4318
,160
17,6
456,
415
8,04
6H
ealth
. . .
. . .
. . .
. . .
. . .
. . .
264,
424
205,
137
177,
597
212,
116
197,
673
178,
579
365,
094
161,
519
136,
393
85,5
39So
cial
Ser
vice
s .
. . .
. . .
. . .
.2,
699,
480
2,46
0,14
12,
492,
021
2,35
2,59
62,
454,
896
2,42
4,05
82,
421,
286
2,51
4,48
62,
512,
600
2,32
2,81
8E
duca
tion
. . .
. . .
. . .
. . .
. . .
.1,
363,
769
1,22
6,50
61,
127,
539
1,05
3,01
01,
004,
989
928,
837
887,
206
856,
943
882,
001
867,
301
Com
mun
ity C
olle
ges
. . .
. . .
.47
333
469
657
482
7—
——
——
Env
iron
men
tal P
rote
ctio
n .
. .82
,433
108
183
—33
1314
183
936
169
Hou
sing
. . .
. . .
. . .
. . .
. . .
. .
171,
250
148,
719
136,
763
157,
497
159,
583
154,
040
139,
994
125,
266
112,
214
82,3
31Pa
rks,
Rec
reat
ion
and
Cul
tura
l Act
iviti
es .
. . .
. . .
1,88
911
333
312
017
819
178
346
62
____
____
____
____
____
____
____
____
____
____
____
____
____
____
____
____
____
____
____
____
____
____
____
____
____
Tota
l Fed
eral
Gra
nts
. . .
. . .
.6,
096,
740
4,54
9,76
44,
417,
224
4,26
2,12
44,
292,
428
4,13
2,99
74,
193,
862
4,00
5,89
73,
959,
635
3,60
9,72
5__
____
____
____
____
____
____
____
____
____
____
____
____
____
____
____
____
____
____
____
____
____
____
____
____
__
(Con
tinu
ed)
Com
ptro
ller’
s R
epor
t fo
r F
isca
l 200
2P
art
III—
Stat
isti
cal I
nfor
mat
ion
Gen
eral
Fun
d R
even
ues
and
Oth
er F
inan
cing
Sou
rces
—Te
n Y
ear
Tre
nd (
Con
t.)
Fis
cal Y
ear
1993
2002
2001
2000
1999
1998
1997
1996
1995
1994
Res
tate
d__
____
____
____
____
____
____
____
____
____
____
____
____
____
____
____
____
____
____
____
____
____
____
____
____
__(i
n th
ousa
nds)

237
STA
TE
GR
AN
TS—
CA
TE
GO
RIC
AL
:G
ener
al G
over
nmen
t . .
. . .
. .
$33
,345
$35
,086
$56
,461
$30
,383
$40
,753
$35
,625
$20
,354
$39
,202
$26
,493
$22
,338
Publ
ic S
afet
y an
d Ju
dici
al .
. .12
5,57
614
6,15
515
6,09
116
0,22
613
8,01
213
3,72
812
4,37
613
2,42
112
6,99
711
4,39
7T
rans
port
atio
n .
. . .
. . .
. . .
. .10
2,28
911
8,09
714
4,31
912
0,87
091
,224
117,
778
94,1
4510
2,57
691
,271
102,
526
Hea
lth .
. . .
. . .
. . .
. . .
. . .
. .43
4,21
834
8,51
234
7,82
932
2,60
426
6,88
225
4,05
124
0,88
123
4,65
320
6,71
918
9,13
9So
cial
Ser
vice
s .
. . .
. . .
. . .
.1,
610,
728
1,60
2,44
81,
402,
109
1,46
2,54
71,
566,
657
1,69
0,99
91,
743,
422
2,00
7,03
41,
918,
530
1,79
0,69
2E
duca
tion
. . .
. . .
. . .
. . .
. . .
.5,
592,
120
5,38
7,62
44,
829,
136
4,41
2,58
14,
142,
235
3,90
7,56
93,
745,
871
3,76
9,02
53,
380,
007
3,30
9,17
8E
nvir
onm
enta
l Pro
tect
ion
. . .
285
152
247
—15
249
6(1
0,89
9)18
,627
7,69
05,
117
Hou
sing
. . .
. . .
. . .
. . .
. . .
. .
862
(323
)86
286
585
82,
248
2,10
681
992
669
2Pa
rks,
Rec
reat
ion
and
Cul
tura
l Act
iviti
es .
. . .
. . .
477
713
716
362
273
500
511
600
590
566
Lib
rari
es .
. . .
. . .
. . .
. . .
. . .
——
——
——
——
9,80
89,
714
Seni
or C
olle
ges
. . .
. . .
. . .
. .
——
—10
,000
10,0
008,
868
7,51
910
,542
16,7
137,
513
Com
mun
ity C
olle
ges
. . .
. . .
.12
9,30
012
8,00
112
2,50
011
7,33
511
3,78
111
1,14
210
9,01
511
3,14
111
7,19
210
8,02
1H
unte
r C
ampu
s Sc
hool
. . .
. .
1,30
01,
300
1,45
31,
147
1,30
01,
300
1,30
01,
300
—1,
300
____
____
____
____
____
____
____
____
____
____
____
____
____
____
____
____
____
____
____
____
____
____
____
____
____
Tota
l Sta
te G
rant
s .
. . .
. . .
. .8,
030,
500
7,76
7,76
57,
061,
723
6,63
8,92
06,
372,
127
6,26
4,30
46,
078,
601
6,42
9,94
05,
902,
936
5,66
1,19
3__
____
____
____
____
____
____
____
____
____
____
____
____
____
____
____
____
____
____
____
____
____
____
____
____
__N
ON
-GO
VE
RN
ME
NTA
L
GR
AN
TS:
Gen
eral
Gov
ernm
ent
. . .
. . .
.13
,535
96,0
2164
,620
55,1
8468
,827
59,7
5337
8,11
120
9,38
023
5,26
120
7,79
5Pu
blic
Saf
ety
and
Judi
cial
. . .
241,
734
205,
464
208,
304
209,
363
213,
609
216,
037
167,
567
31,0
2512
,295
19,6
34T
rans
port
atio
n .
. . .
. . .
. . .
. .1,
253
1,30
61,
115
1,22
71,
113
2,09
06,
280
4,17
927
75,
076
Hea
lth .
. . .
. . .
. . .
. . .
. . .
. .98
,247
125,
255
74,2
8152
,336
70,9
5753
,337
51,7
0737
,355
13,6
0613
,628
Soci
al S
ervi
ces
. . .
. . .
. . .
. .
102,
967
4,14
35,
349
5,55
17,
369
6,42
53,
412
4,36
43,
076
3,55
8E
duca
tion
. . .
. . .
. . .
. . .
. . .
.51
,117
51,9
5867
,529
34,2
2439
,304
34,2
0934
,161
25,5
1534
,745
29,8
43E
nvir
onm
enta
l Pro
tect
ion
. . .
1,84
734
736
020
145
940
233
442
228
193
Hou
sing
. . .
. . .
. . .
. . .
. . .
. .
1,37
0—
—3,
017
——
—88
(4,7
16)
5,41
1Pa
rks,
Rec
reat
ion
and
Cul
tura
l Act
iviti
es .
. . .
. . .
6,37
26,
249
5,30
1—
2,91
52,
206
2,14
82,
011
938
638
Com
mun
ity C
olle
ges
. . .
. . .
.28
71,
010
4,56
75,
356
6,97
74,
589
3,59
84,
618
3,60
74,
103
____
____
____
____
____
____
____
____
____
____
____
____
____
____
____
____
____
____
____
____
____
____
____
____
____
Tota
l Non
-Gov
ernm
enta
lG
rant
s . .
. . .
. . .
. . .
. . .
. . .
518,
729
491,
753
431,
426
366,
459
411,
530
379,
048
647,
318
318,
577
299,
317
289,
879
____
____
____
____
____
____
____
____
____
____
____
____
____
____
____
____
____
____
____
____
____
____
____
____
____
PRO
VIS
ION
FO
R
DIS
AL
LO
WA
NC
ES
OF
FED
ER
AL
,STA
TE
AN
DO
TH
ER
AID
. . .
. . .
. . .
. . .
.—
(45,
600)
(5,0
00)
(38,
512)
(14,
500)
(35,
600)
(39,
700)
(21,
100)
(18,
540)
(25,
700)
____
____
____
____
____
____
____
____
____
____
____
____
____
____
____
____
____
____
____
____
____
____
____
____
____
(Con
tinu
ed)
Com
ptro
ller’
s R
epor
t fo
r F
isca
l 200
2P
art
III—
Stat
isti
cal I
nfor
mat
ion
Gen
eral
Fun
d R
even
ues
and
Oth
er F
inan
cing
Sou
rces
—Te
n Y
ear
Tre
nd (
Con
t.)
Fis
cal Y
ear
1993
2002
2001
2000
1999
1998
1997
1996
1995
1994
Res
tate
d__
____
____
____
____
____
____
____
____
____
____
____
____
____
____
____
____
____
____
____
____
____
____
____
____
__(i
n th
ousa
nds)

238
UN
RE
STR
ICT
ED
FE
DE
RA
L
AN
D S
TAT
E A
ID:
Fede
ral a
nd S
tate
Rev
enue
Shar
ing
. . .
. . .
. . .
. . .
. . .
.$
327,
890
$32
6,89
0$
405,
286
$32
8,14
7$
327,
390
$32
2,28
1$
368,
870
$32
5,21
1$
300,
232
$53
5,06
8In
terg
over
nmen
tal A
id .
. . .
. .33
7,93
030
7,49
022
5,93
932
4,19
629
4,28
733
1,28
825
1,93
627
8,07
236
6,65
617
2,04
0__
____
____
____
____
____
____
____
____
____
____
____
____
____
____
____
____
____
____
____
____
____
____
____
____
__To
tal U
nres
tric
ted
Fede
ral
and
Stat
e A
id .
. . .
. . .
. .66
5,82
063
4,38
063
1,22
565
2,34
362
1,67
765
3,56
962
0,80
660
3,28
366
6,88
870
7,10
8__
____
____
____
____
____
____
____
____
____
____
____
____
____
____
____
____
____
____
____
____
____
____
____
____
__C
HA
RG
ES
FOR
SE
RV
ICE
S:G
ener
al G
over
nmen
t C
harg
es .
. . .
. . .
. . .
. . .
. .46
1,18
243
9,18
743
8,99
643
9,75
743
4,71
342
8,22
241
5,39
739
6,07
938
8,86
939
6,87
8W
ater
and
Sew
er .
. . .
. . .
. . .
857,
907
842,
525
801,
255
777,
652
822,
800
775,
318
730,
963
738,
561
717,
846
709,
122
Hou
sing
. . .
. . .
. . .
. . .
. . .
. .
24,4
1125
,311
21,3
3921
,504
12,5
5217
,582
27,3
5736
,790
37,1
4636
,406
Ren
tal I
ncom
e .
. . .
. . .
. . .
. .11
4,89
415
3,86
913
8,91
611
4,25
115
1,38
914
2,96
213
8,72
312
6,53
013
2,81
216
1,76
3__
____
____
____
____
____
____
____
____
____
____
____
____
____
____
____
____
____
____
____
____
____
____
____
____
__To
tal C
harg
es fo
r Ser
vice
s . .
1,45
8,39
41,
460,
892
1,40
0,50
61,
353,
164
1,42
1,45
41,
364,
084
1,31
2,44
01,
297,
960
1,27
6,67
31,
304,
169
____
____
____
____
____
____
____
____
____
____
____
____
____
____
____
____
____
____
____
____
____
____
____
____
____
LIC
EN
SES,
PER
MIT
S,PR
IVIL
EG
ES
AN
D
FRA
NC
HIS
ES:
Lic
ense
s . .
. . .
. . .
. . .
. . .
. . .
46,8
9944
,784
54,8
6642
,751
45,6
2040
,900
38,2
0640
,544
39,5
2239
,031
Perm
its .
. . .
. . .
. . .
. . .
. . .
. .94
,572
97,1
9393
,117
87,5
0184
,173
72,1
8471
,815
70,3
7265
,656
68,2
78Pr
ivile
ges
and
Fran
chis
es .
. .21
4,22
819
6,26
418
0,94
316
1,22
514
2,71
513
2,21
012
7,19
811
1,61
011
9,96
810
5,40
6__
____
____
____
____
____
____
____
____
____
____
____
____
____
____
____
____
____
____
____
____
____
____
____
____
__To
tal L
icen
ses,
Perm
its,
Priv
ilege
s an
d Fr
anch
ises
. . .
. . .
. . .
. . .
355,
699
338,
241
328,
926
291,
477
272,
508
245,
294
237,
219
222,
526
225,
146
212,
715
____
____
____
____
____
____
____
____
____
____
____
____
____
____
____
____
____
____
____
____
____
____
____
____
____
FIN
ES
AN
D F
OR
FEIT
UR
ES:
Fine
s .
. . .
. . .
. . .
. . .
. . .
. . .
478,
604
487,
182
462,
637
470,
175
463,
977
482,
135
413,
741
410,
123
361,
215
370,
931
Forf
eitu
res
. . .
. . .
. . .
. . .
. . .
6,72
77,
522
5,83
08,
888
4,45
48,
425
2,81
66,
674
7,90
78,
738
____
____
____
____
____
____
____
____
____
____
____
____
____
____
____
____
____
____
____
____
____
____
____
____
____
Tota
l Fin
es a
nd
Forf
eitu
res
. . .
. . .
. . .
. .
485,
331
494,
704
468,
467
479,
063
468,
431
490,
560
416,
557
416,
797
369,
122
379,
669
____
____
____
____
____
____
____
____
____
____
____
____
____
____
____
____
____
____
____
____
____
____
____
____
____
MIS
CE
LL
AN
EO
US
. . .
. . .
. . .
786,
559
929,
745
448,
975
386,
695
473,
955
788,
133
352,
056
509,
390
377,
864
281,
281
____
____
____
____
____
____
____
____
____
____
____
____
____
____
____
____
____
____
____
____
____
____
____
____
____
TO
BA
CC
O S
ET
TL
EM
EN
T .
. .21
1,15
915
4,34
024
7,36
4—
——
——
——
____
____
____
____
____
____
____
____
____
____
____
____
____
____
____
____
____
____
____
____
____
____
____
____
____
INT
ER
EST
IN
CO
ME
. . .
. . .
. .
80,5
5924
5,35
319
4,75
318
2,37
119
9,27
216
0,46
411
2,23
394
,909
82,4
8287
,308
____
____
____
____
____
____
____
____
____
____
____
____
____
____
____
____
____
____
____
____
____
____
____
____
____
(Con
tinu
ed)
Com
ptro
ller’
s R
epor
t fo
r F
isca
l 200
2P
art
III—
Stat
isti
cal I
nfor
mat
ion
Gen
eral
Fun
d R
even
ues
and
Oth
er F
inan
cing
Sou
rces
—Te
n Y
ear
Tre
nd (
Con
t.)
Fis
cal Y
ear
1993
2002
2001
2000
1999
1998
1997
1996
1995
1994
Res
tate
d__
____
____
____
____
____
____
____
____
____
____
____
____
____
____
____
____
____
____
____
____
____
____
____
____
__(i
n th
ousa
nds)

239
TR
AN
SFE
R F
RO
M
DIS
CR
ET
ELY
PR
ESE
NT
ED
C
OM
PON
EN
T U
NIT
:(1)
Off
-Tra
ck B
ettin
g . .
. . .
. . .
$1,
000
$12
,500
$9,
180
$11
,350
$11
,000
$10
,100
$5,
508
$3,
490
$—
$—
Off
-Tra
ck B
ettin
g Su
rtax
. .
20,7
0820
,901
20,4
9819
,814
20,1
6720
,406
20,3
0324
,070
24,0
7328
,796
____
____
____
____
____
____
____
____
____
____
____
____
____
____
____
____
____
____
____
____
____
____
____
____
____
Tota
l Tra
nsfe
r fr
om
Dis
cret
ely
Pres
ente
d C
ompo
nent
Uni
t .
. . .
21,7
0833
,401
29,6
7831
,164
31,1
6730
,506
25,8
1127
,560
24,0
7328
,796
____
____
____
____
____
____
____
____
____
____
____
____
____
____
____
____
____
____
____
____
____
____
____
____
____
TR
AN
SFE
R F
RO
M
NO
N M
AJO
R C
API
TAL
PR
OJE
CT
S FU
ND
. . .
. . .
. .
457,
832
——
——
——
——
—__
____
____
____
____
____
____
____
____
____
____
____
____
____
____
____
____
____
____
____
____
____
____
____
____
__T
RA
NSF
ER
FR
OM
PE
NSI
ON
A
ND
SIM
ILA
R T
RU
ST
FUN
DS
. . .
. . .
. . .
. . .
. . .
. .
——
——
——
——
72,2
16—
____
____
____
____
____
____
____
____
____
____
____
____
____
____
____
____
____
____
____
____
____
____
____
____
____
Tota
l Rev
enue
s . .
. . .
. . .
. .
$40,
865,
260
$40,
231,
871
$37,
884,
571
$35,
863,
524
$34,
928,
567
$33,
740,
986
$32,
071,
295
31,5
90,9
79$3
1,35
2,39
0$3
0,11
5,87
8__
____
____
____
____
____
____
____
____
____
____
____
____
____
____
____
____
____
____
____
____
____
____
____
____
____
____
____
____
____
____
____
____
____
____
____
____
____
____
____
____
____
____
____
____
____
____
____
____
____
__
(1)
In F
isca
l Yea
r 19
94 t
he C
ity
impl
emen
ted
GA
SB
Sta
tem
ent
No.
14,
“The
Fin
anci
al R
epor
ting
Ent
ity”
,rec
lass
ifyi
ng t
rans
fers
fro
m E
nter
pris
e F
unds
to
tran
sfer
s fr
omD
iscr
etel
y P
rese
nted
Com
pone
nt U
nits
.
Com
ptro
ller’
s R
epor
t fo
r F
isca
l 200
2P
art
III—
Stat
isti
cal I
nfor
mat
ion
Gen
eral
Fun
d R
even
ues
and
Oth
er F
inan
cing
Sou
rces
—Te
n Y
ear
Tre
nd (
Con
t.)
Fis
cal Y
ear
1993
2002
2001
2000
1999
1998
1997
1996
1995
1994
Res
tate
d__
____
____
____
____
____
____
____
____
____
____
____
____
____
____
____
____
____
____
____
____
____
____
____
____
__(i
n th
ousa
nds)
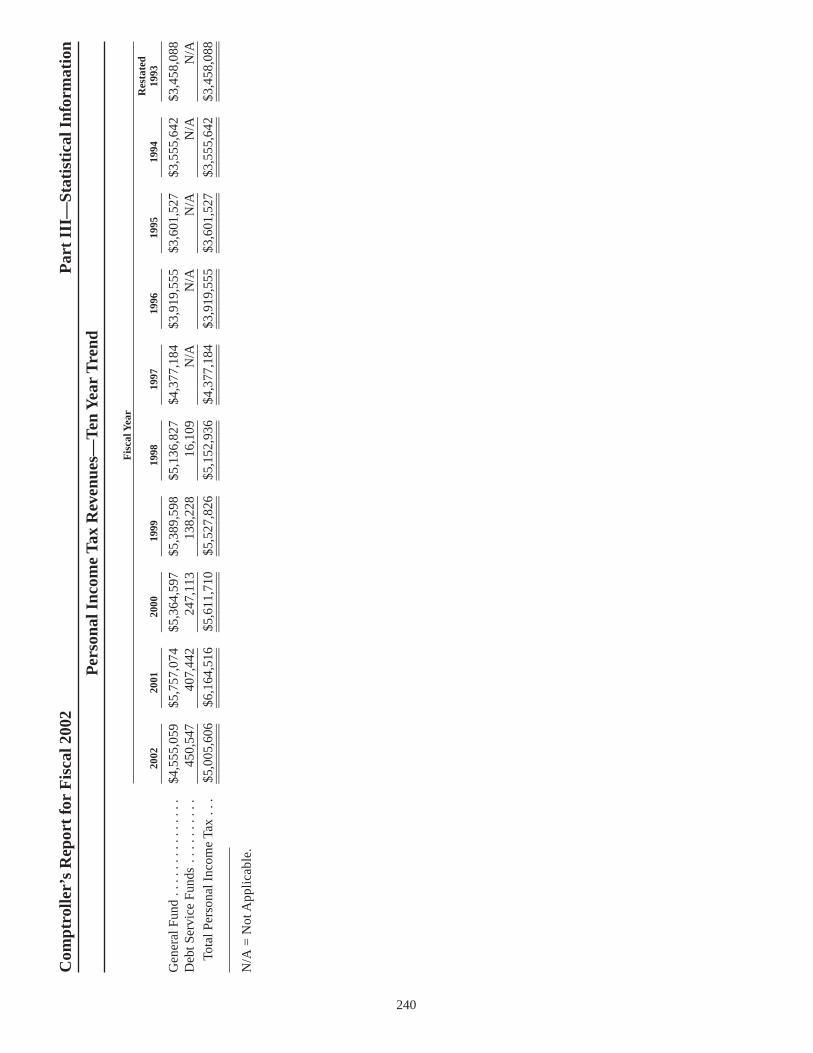
240
Gen
eral
Fun
d . .
. . .
. . .
. . .
. . .
.$4
,555
,059
$5,7
57,0
74$5
,364
,597
$5,3
89,5
98$5
,136
,827
$4,3
77,1
84$3
,919
,555
$3,6
01,5
27$3
,555
,642
$3,4
58,0
88D
ebt S
ervi
ce F
unds
. . .
. . .
. . .
.45
0,54
740
7,44
224
7,11
313
8,22
816
,109
N/A
N/A
N/A
N/A
N/A
____
____
___
____
___
____
____
___
____
___
____
____
___
____
___
____
____
___
____
___
____
____
___
____
___
Tota
l Per
sona
l Inc
ome
Tax
. . .
$5,0
05,6
06$6
,164
,516
$5,6
11,7
10$5
,527
,826
$5,1
52,9
36$4
,377
,184
$3,9
19,5
55$3
,601
,527
$3,5
55,6
42$3
,458
,088
____
____
___
____
___
____
____
___
____
___
____
____
___
____
___
____
____
___
____
___
____
____
___
____
___
____
____
___
____
___
____
____
___
____
___
____
____
___
____
___
____
____
___
____
___
____
____
___
____
___
N/A
= N
ot A
ppli
cabl
e.
Com
ptro
ller’
s R
epor
t fo
r F
isca
l 200
2P
art
III—
Stat
isti
cal I
nfor
mat
ion
Per
sona
l Inc
ome
Tax
Rev
enue
s—Te
n Y
ear
Tre
nd
Fis
cal Y
ear
Res
tate
d20
0220
0120
0019
9919
9819
9719
9619
9519
9419
93__
____
___
____
____
___
____
___
____
____
___
____
___
____
____
___
____
___
____
____
___
____
___
____
____
_

241
Gen
eral
Gov
ernm
ent:
002
May
oral
ty .
. . .
. . .
. . .
. .$
103,
985
$83
,430
$85
,639
$76
,733
$74
,225
$74
,298
$78
,109
$10
9,11
9$
127,
415
$13
3,16
700
3B
oard
of
Ele
ctio
ns .
. . .
.67
,481
44,1
6144
,229
44,2
2236
,662
30,7
6032
,994
29,6
2633
,764
34,8
2300
4C
ampa
ign
Fina
nce
Boa
rd .
. . .
. . .
. . .
. . .
48,5
006,
185
4,98
92,
809
13,8
303,
585
2,46
12,
304
11,4
983,
030
008
Off
ice
of th
e A
ctua
ry .
..3,
149
3,10
02,
858
2,45
82,
358
1,99
62,
107
2,08
72,
312
2,20
600
9N
ew Y
ork
City
Em
ploy
ees’
Ret
irem
ent S
yste
m .
. .—
——
——
—8,
107
7,61
68,
283
8,39
401
0B
orou
gh P
resi
dent
—M
anha
ttan
. . .
. . .
. . .
.5,
027
5,23
05,
244
5,18
15,
169
4,74
14,
920
4,76
04,
837
4,70
801
1B
orou
gh P
resi
dent
—B
ronx
. . .
. . .
. . .
. . .
.6,
945
7,37
87,
104
6,94
26,
829
6,79
86,
444
6,69
56,
943
6,31
901
2B
orou
gh P
resi
dent
—B
rook
lyn
. . .
. . .
. . .
. .
6,06
56,
861
7,54
96,
015
5,20
45,
025
5,03
95,
263
5,07
25,
107
013
Bor
ough
Pre
side
nt—
Que
ens
. . .
. . .
. . .
. . .
6,29
06,
682
6,83
15,
864
5,92
75,
658
5,57
95,
421
4,85
94,
995
014
Bor
ough
Pre
side
nt—
Stat
en I
slan
d .
. . .
. . .
.4,
788
4,98
64,
822
4,72
74,
822
4,78
14,
853
4,58
74,
639
4,52
801
5O
ffic
e of
the
Com
ptro
ller
.50
,559
52,6
2053
,390
49,5
7039
,149
45,2
8780
,476
80,2
4573
,291
63,1
9602
1Ta
x C
omm
issi
on .
. . .
. . .
1,95
92,
129
1,97
21,
855
1,64
61,
647
1,71
41,
891
1,88
01,
940
025
Law
Dep
artm
ent
. . .
. . .
.91
,212
92,9
5588
,210
82,3
2772
,382
67,8
0264
,293
61,1
7959
,256
61,3
6802
9N
ew Y
ork
City
Gam
blin
g C
ontr
ol C
omm
issi
on .
.—
——
—73
8—
——
——
030
Dep
artm
ent o
f C
ity
Plan
ning
. . .
. . .
. . .
. .
18,7
3118
,407
17,5
6915
,901
15,5
3315
,517
16,2
9816
,459
16,6
8116
,812
031
Dep
artm
ent o
f Per
sonn
el . .
——
——
——
27,6
4531
,109
34,8
4731
,779
032
Dep
artm
ent o
f In
vest
igat
ion
. . .
. . .
. .
20,8
6220
,776
18,7
9417
,145
15,9
6314
,152
17,2
3116
,137
16,8
1216
,743
041
Teac
hers
’Ret
irem
ent
Syst
em .
. . .
. . .
. . .
. .—
——
——
—5,
682
4,64
15,
126
5,01
110
1Pu
blic
Adv
ocat
e .
. . .
. . .
2,82
22,
668
2,63
02,
534
2,56
52,
459
2,35
52,
355
3,32
63,
590
102
City
Cou
ncil
. . .
. . .
. . .
.47
,103
44,3
7539
,163
34,5
3332
,367
31,5
6931
,388
29,3
5528
,684
26,4
1810
3C
ity C
lerk
. . .
. . .
. . .
. . .
2,71
02,
612
2,44
32,
312
2,35
32,
096
1,96
21,
987
2,13
32,
131
127
Fina
ncia
l Inf
orm
atio
n Se
rvic
es A
genc
y .
. . .
.25
,585
24,2
4624
,893
23,9
7020
,653
20,7
1220
,380
21,4
0621
,155
21,1
75
(Con
tinu
ed)
Com
ptro
ller’
s R
epor
t fo
r F
isca
l 200
2P
art
III—
Stat
isti
cal I
nfor
mat
ion
Gen
eral
Fun
d E
xpen
ditu
res
and
Oth
er F
inan
cing
Use
s—Te
n Y
ear
Tre
nd
Fis
cal Y
ear
2002
2001
2000
1999
1998
1997
1996
1995
1994
1993
____
____
____
____
____
____
____
____
____
____
____
____
____
____
____
____
____
____
____
____
____
____
____
____
____
(in
thou
sand
s)

242
Gen
eral
Gov
ernm
ent:
(con
t.)13
1O
ffic
e of
Pay
roll
Adm
inis
trat
ion
. . .
. . .
$5,
900
$6,
275
$5,
622
$4,
946
$5,
094
$4,
885
$5,
657
$4,
981
$4,
301
$4,
229
132
Inde
pend
ent B
udge
t O
ffic
e .
. . .
. . .
. . .
. . .
2,55
12,
290
2,48
02,
367
2,33
02,
361
434
——
—13
3E
qual
Em
ploy
men
tPr
actic
es C
omm
issi
on .
.32
748
242
632
244
542
640
527
620
915
013
4C
ivil
Serv
ice
Com
mis
sion
. . .
. . .
. .
471
467
448
498
486
417
294
231
254
287
136
Lan
dmar
ks P
rese
rvat
ion
Com
mis
sion
. . .
. . .
. .
3,17
03,
243
3,11
12,
934
2,65
12,
583
2,52
42,
676
3,09
43,
417
137
Dep
artm
ent o
f Te
leco
mm
unic
atio
ns .
.—
——
——
——
—3,
699
3,07
322
6C
omm
issi
on o
n H
uman
Rig
hts
. . .
. . .
. . .
. . .
.7,
441
7,17
97,
157
6,53
56,
728
7,07
67,
845
7,58
79,
464
9,86
226
0D
epar
tmen
t of Y
outh
and
Com
mun
ityD
evel
opm
ent
. . .
. . .
. .14
1,38
513
8,57
712
2,40
610
8,44
188
,406
86,3
9648
,454
65,1
3767
,737
64,4
4731
2C
onfl
icts
of
Inte
rest
Boa
rd .
. . .
. . .
. . .
. . .
1,62
41,
595
1,37
61,
290
1,10
990
293
488
790
688
731
3O
ffic
e of
Col
lect
ive
Bar
gain
ing
. . .
. . .
. . .
1,47
91,
419
1,35
81,
254
1,26
81,
138
1,08
11,
033
1,33
61,
338
341
Man
hatta
n C
omm
unity
Boa
rd #
1 .
. . .
. . .
. . .
.17
318
816
715
815
513
012
813
614
714
834
2M
anha
ttan
Com
mun
ityB
oard
#2
. . .
. . .
. . .
. .
229
189
162
162
160
138
122
142
154
153
343
Man
hatta
n C
omm
unity
Boa
rd #
3 .
. . .
. . .
. . .
.17
717
316
214
914
813
012
914
014
814
734
4M
anha
ttan
Com
mun
ityB
oard
#4
. . .
. . .
. . .
. .
201
204
176
186
184
155
153
144
165
155
345
Man
hatta
n C
omm
unity
Boa
rd #
5 .
. . .
. . .
. . .
.20
519
919
418
715
015
815
916
815
514
434
6M
anha
ttan
Com
mun
ityB
oard
#6
. . .
. . .
. . .
. .
236
179
169
163
158
137
135
147
157
190
(Con
tinu
ed)
Com
ptro
ller’
s R
epor
t fo
r F
isca
l 200
2P
art
III—
Stat
isti
cal I
nfor
mat
ion
Gen
eral
Fun
d E
xpen
ditu
res
and
Oth
er F
inan
cing
Use
s—Te
n Y
ear
Tre
nd (
Con
t.)
Fis
cal Y
ear
2002
2001
2000
1999
1998
1997
1996
1995
1994
1993
____
____
____
____
____
____
____
____
____
____
____
____
____
____
____
____
____
____
____
____
____
____
____
____
____
(in
thou
sand
s)

243
Gen
eral
Gov
ernm
ent:
(con
t.)34
7M
anha
ttan
Com
mun
ityB
oard
#7
. . .
. . .
. . .
. .
$17
9$
167
$18
9$
163
$15
1$
133
$13
3$
141
$14
9$
147
348
Man
hatta
n C
omm
unity
Boa
rd #
8 .
. . .
. . .
. . .
.25
225
824
419
916
314
414
415
016
515
834
9M
anha
ttan
Com
mun
ityB
oard
#9
. . .
. . .
. . .
. .
187
186
157
153
152
123
130
139
150
145
350
Man
hatta
n C
omm
unity
Boa
rd #
10 .
. . .
. . .
. . .
214
164
174
138
165
145
147
152
168
136
351
Man
hatta
n C
omm
unity
Boa
rd #
11 .
. . .
. . .
. . .
149
133
167
137
148
125
126
129
151
148
352
Man
hatta
n C
omm
unity
Boa
rd #
12 .
. . .
. . .
. . .
141
171
145
107
150
128
120
109
143
141
381
Bro
nx C
omm
unity
Boa
rd #
1 .
. . .
. . .
. . .
.19
517
215
413
611
712
914
815
516
716
538
2B
ronx
Com
mun
ityB
oard
#2
. . .
. . .
. . .
. .
207
199
191
186
186
168
166
172
176
171
383
Bro
nx C
omm
unity
Boa
rd #
3 .
. . .
. . .
. . .
.19
719
318
117
317
214
113
712
814
715
038
4B
ronx
Com
mun
ityB
oard
#4
. . .
. . .
. . .
. .
175
176
158
164
159
143
132
146
144
152
385
Bro
nx C
omm
unity
Boa
rd #
5 .
. . .
. . .
. . .
.18
317
116
315
414
811
512
513
214
114
938
6B
ronx
Com
mun
ityB
oard
#6
. . .
. . .
. . .
. .
152
166
160
156
150
128
127
118
148
146
387
Bro
nx C
omm
unity
Boa
rd #
7 .
. . .
. . .
. . .
.18
922
017
216
815
214
516
716
714
812
138
8B
ronx
Com
mun
ityB
oard
#8
. . .
. . .
. . .
. .
194
191
216
196
197
146
150
159
159
157
389
Bro
nx C
omm
unity
Boa
rd #
9 .
. . .
. . .
. . .
.20
115
217
516
216
915
014
514
915
615
439
0B
ronx
Com
mun
ityB
oard
#10
. . .
. . .
. . .
.21
120
419
719
218
616
616
317
018
218
039
1B
ronx
Com
mun
ityB
oard
#11
. . .
. . .
. . .
.20
820
119
318
917
112
612
413
114
014
4
(Con
tinu
ed)
Com
ptro
ller’
s R
epor
t fo
r F
isca
l 200
2P
art
III—
Stat
isti
cal I
nfor
mat
ion
Gen
eral
Fun
d E
xpen
ditu
res
and
Oth
er F
inan
cing
Use
s—Te
n Y
ear
Tre
nd (
Con
t.)
Fis
cal Y
ear
2002
2001
2000
1999
1998
1997
1996
1995
1994
1993
____
____
____
____
____
____
____
____
____
____
____
____
____
____
____
____
____
____
____
____
____
____
____
____
____
(in
thou
sand
s)

244
Gen
eral
Gov
ernm
ent:
(con
t.)39
2B
ronx
Com
mun
ityB
oard
#12
. . .
. . .
. . .
.$
173
$17
1$
164
$15
6$
151
$12
7$
114
$13
8$
150
$14
943
1Q
ueen
s C
omm
unity
Boa
rd #
1 .
. . .
. . .
. . .
.18
218
717
515
814
412
713
014
215
214
743
2Q
ueen
s C
omm
unity
Boa
rd #
2 .
. . .
. . .
. . .
.20
920
618
116
515
514
614
615
615
915
943
3Q
ueen
s C
omm
unity
Boa
rd #
3 .
. . .
. . .
. . .
.22
721
921
017
014
712
912
913
814
613
243
4Q
ueen
s C
omm
unity
Boa
rd #
4 .
. . .
. . .
. . .
.19
718
618
117
317
115
017
216
316
216
343
5Q
ueen
s C
omm
unity
Boa
rd #
5 .
. . .
. . .
. . .
.19
419
618
216
816
314
214
115
215
916
143
6Q
ueen
s C
omm
unity
Boa
rd #
6 .
. . .
. . .
. . .
.20
620
219
017
816
815
315
015
716
016
443
7Q
ueen
s C
omm
unity
Boa
rd #
7 .
. . .
. . .
. . .
.19
019
918
215
116
014
215
316
216
315
643
8Q
ueen
s C
omm
unity
Boa
rd #
8 .
. . .
. . .
. . .
.18
317
716
715
615
413
413
314
214
914
443
9Q
ueen
s C
omm
unity
Boa
rd #
9 .
. . .
. . .
. . .
.17
517
115
914
715
112
914
112
214
212
644
0Q
ueen
s C
omm
unity
Boa
rd #
10 .
. . .
. . .
. . .
201
199
185
179
173
151
138
155
162
161
441
Que
ens
Com
mun
ityB
oard
#11
. . .
. . .
. . .
.21
219
918
719
415
015
714
915
017
017
044
2Q
ueen
s C
omm
unity
Boa
rd #
12 .
. . .
. . .
. . .
180
184
166
158
164
145
143
142
157
153
443
Que
ens
Com
mun
ityB
oard
#13
. . .
. . .
. . .
.18
919
015
415
114
913
713
013
215
014
544
4Q
ueen
s C
omm
unity
Boa
rd #
14 .
. . .
. . .
. . .
183
185
176
169
156
141
139
145
161
161
471
Bro
okly
n C
omm
unity
Boa
rd #
1 .
. . .
. . .
. . .
.21
220
819
919
318
816
616
116
214
814
747
2B
rook
lyn
Com
mun
ityB
oard
#2
. . .
. . .
. . .
. .
187
184
168
179
168
158
157
163
152
162
(Con
tinu
ed)
Com
ptro
ller’
s R
epor
t fo
r F
isca
l 200
2P
art
III—
Stat
isti
cal I
nfor
mat
ion
Gen
eral
Fun
d E
xpen
ditu
res
and
Oth
er F
inan
cing
Use
s—Te
n Y
ear
Tre
nd (
Con
t.)
Fis
cal Y
ear
2002
2001
2000
1999
1998
1997
1996
1995
1994
1993
____
____
____
____
____
____
____
____
____
____
____
____
____
____
____
____
____
____
____
____
____
____
____
____
____
(in
thou
sand
s)

245
Gen
eral
Gov
ernm
ent:
(con
t.)47
3B
rook
lyn
Com
mun
ityB
oard
#3
. . .
. . .
. . .
. .
$19
2$
177
$17
7$
162
$16
2$
141
$14
3$
152
$15
8$
161
474
Bro
okly
n C
omm
unity
Boa
rd #
4 .
. . .
. . .
. . .
.20
217
716
314
612
613
015
715
615
514
347
5B
rook
lyn
Com
mun
ityB
oard
#5
. . .
. . .
. . .
. .
174
165
157
147
146
128
127
129
142
149
476
Bro
okly
n C
omm
unity
Boa
rd #
6 .
. . .
. . .
. . .
.17
416
915
715
615
013
014
514
614
914
547
7B
rook
lyn
Com
mun
ityB
oard
#7
. . .
. . .
. . .
. .
181
166
150
142
142
127
118
137
142
148
478
Bro
okly
n C
omm
unity
Boa
rd #
8 .
. . .
. . .
. . .
.21
020
319
718
918
515
915
916
314
817
047
9B
rook
lyn
Com
mun
ityB
oard
#9
. . .
. . .
. . .
. .
171
174
165
159
154
133
134
138
147
150
480
Bro
okly
n C
omm
unity
Boa
rd #
10 .
. . .
. . .
. . .
173
168
163
155
150
129
128
143
149
147
481
Bro
okly
n C
omm
unity
Boa
rd #
11 .
. . .
. . .
. . .
199
193
185
176
173
150
148
156
164
164
482
Bro
okly
n C
omm
unity
Boa
rd #
12 .
. . .
. . .
. . .
214
211
205
198
190
167
167
170
167
174
483
Bro
okly
n C
omm
unity
Boa
rd #
13 .
. . .
. . .
. . .
168
150
188
162
148
136
133
145
142
156
484
Bro
okly
n C
omm
unity
Boa
rd #
14 .
. . .
. . .
. . .
226
212
168
177
168
143
144
150
160
161
485
Bro
okly
n C
omm
unity
Boa
rd #
15 .
. . .
. . .
. . .
174
170
161
156
135
130
129
139
149
149
486
Bro
okly
n C
omm
unity
Boa
rd #
16 .
. . .
. . .
. . .
186
188
180
227
160
141
118
109
156
149
487
Bro
okly
n C
omm
unity
Boa
rd #
17 .
. . .
. . .
. . .
220
211
209
205
197
168
174
192
161
188
488
Bro
okly
n C
omm
unity
Boa
rd #
18 .
. . .
. . .
. . .
155
163
157
154
150
129
125
129
136
154
491
Stat
en I
slan
d C
omm
unity
Boa
rd #
1 .
. . .
. . .
. . .
.21
220
418
117
517
415
312
413
314
714
3
(Con
tinu
ed)
Com
ptro
ller’
s R
epor
t fo
r F
isca
l 200
2P
art
III—
Stat
isti
cal I
nfor
mat
ion
Gen
eral
Fun
d E
xpen
ditu
res
and
Oth
er F
inan
cing
Use
s—Te
n Y
ear
Tre
nd (
Con
t.)
Fis
cal Y
ear
2002
2001
2000
1999
1998
1997
1996
1995
1994
1993
____
____
____
____
____
____
____
____
____
____
____
____
____
____
____
____
____
____
____
____
____
____
____
____
____
(in
thou
sand
s)
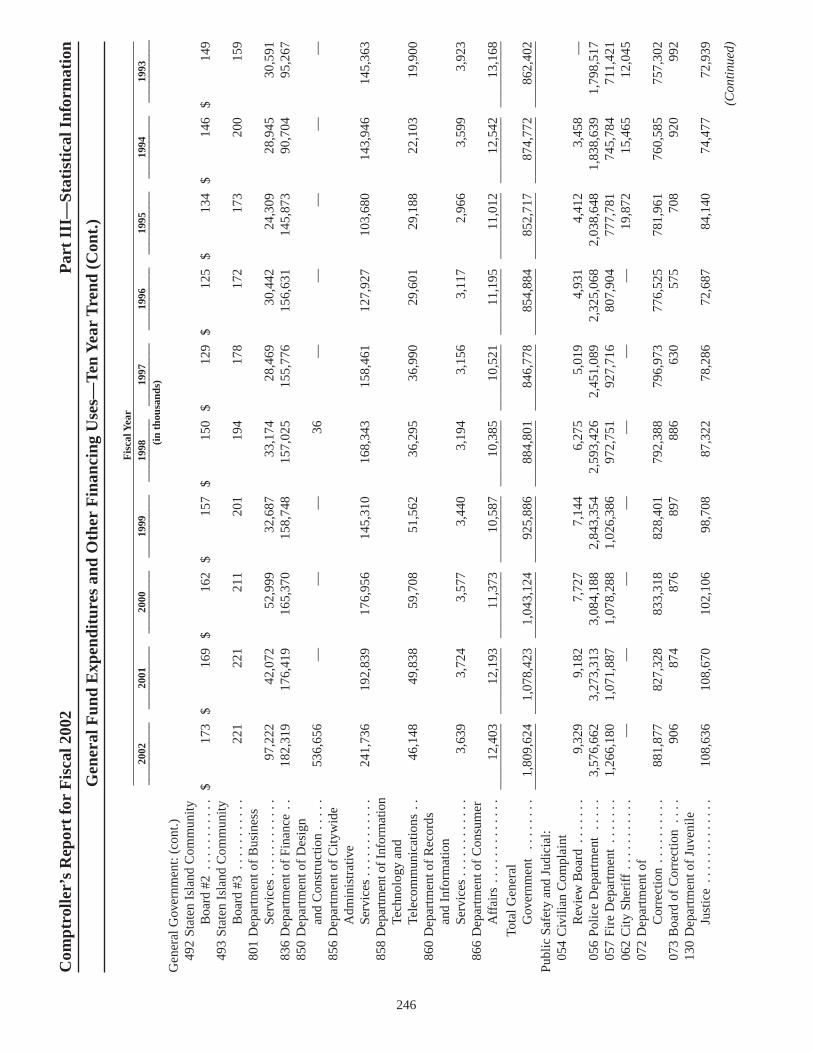
246
Com
ptro
ller’
s R
epor
t fo
r F
isca
l 200
2P
art
III—
Stat
isti
cal I
nfor
mat
ion
Gen
eral
Fun
d E
xpen
ditu
res
and
Oth
er F
inan
cing
Use
s—Te
n Y
ear
Tre
nd (
Con
t.)
Fis
cal Y
ear
2002
2001
2000
1999
1998
1997
1996
1995
1994
1993
____
____
____
____
____
____
____
____
____
____
____
____
____
____
____
____
____
____
____
____
____
____
____
____
____
____
____
____
____
____
(in
thou
sand
s)
Gen
eral
Gov
ernm
ent:
(con
t.)49
2St
aten
Isl
and
Com
mun
ityB
oard
#2
. . .
. . .
. . .
. .
$17
3$
169
$16
2$
157
$15
0$
129
$12
5$
134
$14
6$
149
493
Stat
en I
slan
d C
omm
unity
Boa
rd #
3 .
. . .
. . .
. . .
.22
122
121
120
119
417
817
217
320
015
980
1D
epar
tmen
t of
Bus
ines
s Se
rvic
es .
. . .
. . .
. . .
. .97
,222
42,0
7252
,999
32,6
8733
,174
28,4
6930
,442
24,3
0928
,945
30,5
9183
6D
epar
tmen
t of
Fina
nce
. .18
2,31
917
6,41
916
5,37
015
8,74
815
7,02
515
5,77
615
6,63
114
5,87
390
,704
95,2
6785
0D
epar
tmen
t of
Des
ign
and
Con
stru
ctio
n . .
. . .
536,
656
——
—36
——
——
—85
6D
epar
tmen
t of
City
wid
eA
dmin
istr
ativ
eSe
rvic
es .
. . .
. . .
. . .
. .24
1,73
619
2,83
917
6,95
614
5,31
016
8,34
315
8,46
112
7,92
710
3,68
014
3,94
614
5,36
385
8D
epar
tmen
t of I
nfor
mat
ion
Tech
nolo
gy a
nd
Tele
com
mun
icat
ions
. .
46,1
4849
,838
59,7
0851
,562
36,2
9536
,990
29,6
0129
,188
22,1
0319
,900
860
Dep
artm
ent o
f R
ecor
dsan
d In
form
atio
nSe
rvic
es .
. . .
. . .
. . .
. .3,
639
3,72
43,
577
3,44
03,
194
3,15
63,
117
2,96
63,
599
3,92
386
6D
epar
tmen
t of
Con
sum
er
Aff
airs
. . .
. . .
. . .
. . .
.12
,403
12,1
9311
,373
10,5
8710
,385
10,5
2111
,195
11,0
1212
,542
13,1
68__
____
____
____
____
____
____
____
____
____
____
____
____
____
____
____
____
____
____
____
____
____
____
____
____
__To
tal G
ener
al
Gov
ernm
ent
. . .
. . .
. .
1,80
9,62
41,
078,
423
1,04
3,12
492
5,88
688
4,80
184
6,77
885
4,88
485
2,71
787
4,77
286
2,40
2__
____
____
____
____
____
____
____
____
____
____
____
____
____
____
____
____
____
____
____
____
____
____
____
____
__Pu
blic
Saf
ety
and
Judi
cial
:05
4C
ivili
an C
ompl
aint
Rev
iew
Boa
rd .
. . .
. . .
9,32
99,
182
7,72
77,
144
6,27
55,
019
4,93
14,
412
3,45
8—
056
Polic
e D
epar
tmen
t .
. . .
.3,
576,
662
3,27
3,31
33,
084,
188
2,84
3,35
42,
593,
426
2,45
1,08
92,
325,
068
2,03
8,64
81,
838,
639
1,79
8,51
705
7Fi
re D
epar
tmen
t . .
. . .
. .
1,26
6,18
01,
071,
887
1,07
8,28
81,
026,
386
972,
751
927,
716
807,
904
777,
781
745,
784
711,
421
062
City
She
riff
. . .
. . .
. . .
. .
——
——
——
—19
,872
15,4
6512
,045
072
Dep
artm
ent o
f C
orre
ctio
n .
. . .
. . .
. . .
881,
877
827,
328
833,
318
828,
401
792,
388
796,
973
776,
525
781,
961
760,
585
757,
302
073
Boa
rd o
f C
orre
ctio
n .
. . .
906
874
876
897
886
630
575
708
920
992
130
Dep
artm
ent o
f Ju
veni
leJu
stic
e .
. . .
. . .
. . .
. . .
108,
636
108,
670
102,
106
98,7
0887
,322
78,2
8672
,687
84,1
4074
,477
72,9
39
(Con
tinu
ed)

247
Publ
ic S
afet
y an
d Ju
dici
al:(
cont
.)15
6N
ew Y
ork
City
Tax
i an
d L
imou
sine
C
omm
issi
on .
. . .
. . .
.$
22,9
76$
22,9
19$
21,5
55$
20,0
44$
18,8
45$
17,7
44$
16,2
34$
16,3
58$
17,8
30$
19,0
0678
1D
epar
tmen
t of
Prob
atio
n . .
. . .
. . .
. . .
88,9
8890
,196
83,3
1075
,780
72,7
4468
,800
68,4
3664
,874
62,2
5059
,879
901
Dis
tric
t Atto
rney
New
Yor
k C
ount
y .
. . .
82,1
4777
,643
72,4
7470
,136
68,0
5265
,471
63,8
7661
,595
60,6
3859
,703
902
Dis
tric
t Atto
rney
Bro
nx C
ount
y .
. . .
. . .
44,7
2343
,965
40,3
0938
,905
37,4
0234
,823
34,1
5234
,101
33,1
9231
,200
903
Dis
tric
t Atto
rney
Kin
gs C
ount
y .
. . .
. . .
79,7
4176
,106
70,8
4664
,246
55,6
8556
,290
52,7
1053
,043
51,3
8749
,505
904
Dis
tric
t Atto
rney
Que
ens
Cou
nty
. . .
. . .
39,1
9340
,187
35,8
1134
,144
32,6
3931
,986
31,8
2030
,865
29,8
2228
,101
905
Dis
tric
t Atto
rney
Ric
hmon
d C
ount
y . .
. .
7,04
76,
981
6,34
36,
096
5,69
85,
453
5,25
75,
201
4,83
54,
532
906
Off
ice
of T
he S
peci
al
Nar
cotic
s Pr
osec
utor
. .
16,0
1115
,898
14,8
3914
,405
13,7
3513
,418
13,2
5713
,101
12,9
9912
,415
941
Publ
ic A
dmin
istr
ator
New
Yor
k C
ount
y .
. . .
915
944
759
634
556
548
451
572
586
499
942
Publ
ic A
dmin
istr
ator
Bro
nx C
ount
y .
. . .
. . .
329
326
313
297
270
273
276
273
259
250
943
Publ
ic A
dmin
istr
ator
—K
ings
Cou
nty
. . .
. . .
.43
944
842
037
436
135
535
634
832
631
494
4Pu
blic
Adm
inis
trat
or—
Que
ens
Cou
nty
. . .
. . .
343
335
333
326
292
285
258
278
263
258
945
Publ
ic A
dmin
istr
ator
—R
ichm
ond
Cou
nty
. . .
.23
716
716
717
315
814
115
215
013
813
3M
isce
llane
ous—
Leg
al A
id .
. . .
. . .
. . .
138,
843
137,
587
133,
622
125,
055
130,
628
116,
216
66,9
7070
,308
72,2
6079
,063
Mis
cella
neou
s—C
rim
inal
Jus
tice
Prog
ram
s . .
. . .
. . .
. . .
45,4
7649
,672
43,8
6543
,272
40,8
1839
,134
38,5
21—
——
Mis
cella
neou
s—C
ourt
Cos
ts .
. . .
. . .
. .—
——
1020
4717
968
6494
(Con
tinu
ed)
Com
ptro
ller’
s R
epor
t fo
r F
isca
l 200
2P
art
III—
Stat
isti
cal I
nfor
mat
ion
Gen
eral
Fun
d E
xpen
ditu
res
and
Oth
er F
inan
cing
Use
s—Te
n Y
ear
Tre
nd (
Con
t.)
Fis
cal Y
ear
2002
2001
2000
1999
1998
1997
1996
1995
1994
1993
____
____
____
____
____
____
____
____
____
____
____
____
____
____
____
____
____
____
____
____
____
____
____
____
____
(in
thou
sand
s)

248
Publ
ic S
afet
y an
d Ju
dici
al:(
cont
.)M
isce
llane
ous—
Wor
ld T
rade
Cen
ter
Dis
aste
r R
elat
ed
Exp
ense
. . .
. . .
. . .
. . .
$27
,861
$—
$—
$—
$—
$—
$—
$—
$—
$—
Mis
cella
neou
s—O
ther
. .
23,4
5220
,253
17,1
4918
,754
14,5
8316
,508
65,0
6362
,791
59,9
7061
,175
____
____
____
____
____
____
____
____
____
____
____
____
____
____
____
____
____
____
____
____
____
____
____
____
____
Tota
l Pub
lic S
afet
yan
d Ju
dici
al .
. . .
. . .
6,46
2,31
15,
874,
881
5,64
8,61
85,
317,
541
4,94
5,53
44,
727,
205
4,44
5,65
84,
121,
448
3,84
6,14
73,
759,
343
____
____
____
____
____
____
____
____
____
____
____
____
____
____
____
____
____
____
____
____
____
____
____
____
____
Edu
catio
n:04
0B
oard
of
Edu
catio
n .
. . .
11,7
15,0
1511
,545
,119
10,6
74,4
579,
478,
352
8,81
2,49
48,
085,
127
7,83
5,00
27,
862,
874
7,56
0,98
97,
212,
682
____
____
____
____
____
____
____
____
____
____
____
____
____
____
____
____
____
____
____
____
____
____
____
____
____
City
Uni
vers
ity:
042
City
Uni
vers
ity o
f N
ew Y
ork—
Seni
or C
olle
ges
. . .
. . .
——
——
——
——
—24
1,92
3C
omm
unity
Col
lege
s .
. .39
9,96
337
5,74
536
6,91
436
0,08
835
4,68
134
4,98
733
8,37
133
8,98
134
4,53
932
3,42
4H
unte
r C
ampu
s Sc
hool
s . .
10,8
7510
,191
9,93
79,
855
9,31
69,
068
9,34
49,
093
8,53
77,
999
Edu
catio
nal A
id .
. . .
. . .
7,00
07,
000
7,00
07,
000
——
——
——
____
____
____
____
____
____
____
____
____
____
____
____
____
____
____
____
____
____
____
____
____
____
____
____
____
Tota
l City
Uni
vers
ity .
.41
7,83
839
2,93
638
3,85
137
6,94
336
3,99
735
4,05
534
7,71
534
8,07
435
3,07
657
3,34
6__
____
____
____
____
____
____
____
____
____
____
____
____
____
____
____
____
____
____
____
____
____
____
____
____
__So
cial
Ser
vice
s:06
8A
dmin
istr
atio
n fo
rC
hild
ren’
s Se
rvic
es .
. .
2,31
8,27
82,
237,
328
2,15
2,14
12,
051,
075
1,90
3,76
81,
393,
993
——
——
069
Dep
artm
ent o
f So
cial
Serv
ices
. . .
. . .
. . .
. . .
5,92
8,32
65,
685,
674
5,40
9,32
35,
150,
590
5,22
6,68
75,
715,
053
7,25
1,42
67,
434,
243
7,28
0,85
47,
086,
634
071
Dep
artm
ent o
fH
omel
ess
Serv
ices
. . .
503,
438
472,
742
423,
532
375,
713
366,
416
364,
501
341,
895
344,
263
424,
302
—09
4D
epar
tmen
t of
Em
ploy
men
t . .
. . .
. . .
131,
512
91,3
4813
3,35
512
7,40
611
0,42
110
4,59
910
6,06
812
4,98
312
1,08
614
3,34
909
6H
uman
Res
ourc
esA
dmin
istr
atio
n .
. . .
. .—
——
——
—47
,642
49,2
9152
,762
53,0
6412
5D
epar
tmen
t for
the
Agi
ng .
216,
172
229,
879
211,
463
186,
841
178,
405
170,
459
154,
550
159,
144
151,
185
146,
970
____
____
____
____
____
____
____
____
____
____
____
____
____
____
____
____
____
____
____
____
____
____
____
____
____
Tota
l Soc
ial S
ervi
ces .
. . .
9,09
7,72
68,
716,
971
8,32
9,81
47,
891,
625
7,78
5,69
77,
748,
605
7,90
1,58
18,
111,
924
8,03
0,18
97,
430,
017
____
____
____
____
____
____
____
____
____
____
____
____
____
____
____
____
____
____
____
____
____
____
____
____
____
Env
iron
men
tal P
rote
ctio
n:82
6D
epar
tmen
t of
Env
iron
men
tal
Prot
ectio
n .
. . .
. . .
. . .
616,
620
601,
354
566,
912
533,
948
560,
696
536,
257
497,
529
519,
867
492,
181
472,
286
(Con
tinu
ed)
Com
ptro
ller’
s R
epor
t fo
r F
isca
l 200
2P
art
III—
Stat
isti
cal I
nfor
mat
ion
Gen
eral
Fun
d E
xpen
ditu
res
and
Oth
er F
inan
cing
Use
s—Te
n Y
ear
Tre
nd (
Con
t.)
Fis
cal Y
ear
2002
2001
2000
1999
1998
1997
1996
1995
1994
1993
____
____
____
____
____
____
____
____
____
____
____
____
____
____
____
____
____
____
____
____
____
____
____
____
____
(in
thou
sand
s)

249
Env
iron
men
tal P
rote
ctio
n:(c
ont.)
827
Dep
artm
ent o
fSa
nita
tion
. . .
. . .
. . .
.$
983,
126
$92
4,31
2$
828,
915
$70
4,74
0$
703,
540
$57
8,31
6$
640,
834
$60
0,35
4$
663,
690
$62
1,50
682
9T
rade
Was
te
Com
mis
sion
. . .
. . .
. .
2,77
92,
605
2,36
92,
483
2,26
42,
126
——
——
____
____
____
____
____
____
____
____
____
____
____
____
____
____
____
____
____
____
____
____
____
____
____
____
____
Tota
l Env
iron
men
tal
Prot
ectio
n .
. . .
. . .
. . .
1,60
2,52
51,
528,
271
1,39
8,19
61,
241,
171
1,26
6,50
01,
116,
699
1,13
8,36
31,
120,
221
1,15
5,87
11,
093,
792
____
____
____
____
____
____
____
____
____
____
____
____
____
____
____
____
____
____
____
____
____
____
____
____
____
Tra
nspo
rtat
ion
Serv
ices
:84
1D
epar
tmen
t of
Tra
nspo
rtat
ion
. . .
. . .
.35
8,88
833
2,15
136
5,01
129
8,24
027
8,97
129
6,80
137
4,46
736
1,23
343
9,30
846
1,16
0M
isce
llane
ous—
Paym
ents
to T
rans
itA
utho
rity
. . .
. . .
. . .
. .
120,
440
266,
934
250,
822
248,
394
337,
141
196,
068
258,
927
469,
615
435,
787
462,
897
Mis
cella
neou
s—Pa
ymen
ts to
Pri
vate
B
us C
ompa
nies
. . .
. . .
199,
400
150,
597
147,
504
136,
360
142,
737
107,
901
98,4
9610
1,72
410
5,81
499
,403
____
____
____
____
____
____
____
____
____
____
____
____
____
____
____
____
____
____
____
____
____
____
____
____
____
Tota
l Tra
nspo
rtat
ion
Serv
ices
. . .
. . .
. . .
. . .
678,
728
749,
682
763,
337
682,
994
758,
849
600,
770
731,
890
932,
572
980,
909
1,02
3,46
0__
____
____
____
____
____
____
____
____
____
____
____
____
____
____
____
____
____
____
____
____
____
____
____
____
__Pa
rks,
Rec
reat
ion
and
Cul
tura
l Act
iviti
es:
126
Dep
artm
ent o
f C
ultu
ral
Aff
airs
. . .
. . .
. . .
. . .
.12
3,14
413
3,53
511
5,59
310
1,39
310
6,08
295
,565
98,8
5495
,132
88,7
9881
,531
846
Dep
artm
ent o
f Pa
rks
and
Rec
reat
ion
. . .
. . .
181,
918
183,
615
172,
924
163,
394
153,
506
140,
229
145,
434
144,
439
149,
712
147,
488
____
____
____
____
____
____
____
____
____
____
____
____
____
____
____
____
____
____
____
____
____
____
____
____
____
Tota
l Par
ks,R
ecre
atio
nan
d C
ultu
ral
Act
iviti
es .
. . .
. . .
. . .
.30
5,06
231
7,15
028
8,51
726
4,78
725
9,58
823
5,79
424
4,28
823
9,57
123
8,51
022
9,01
9__
____
____
____
____
____
____
____
____
____
____
____
____
____
____
____
____
____
____
____
____
____
____
____
____
__H
ousi
ng:
806
Dep
artm
ent o
f H
ousi
ngPr
eser
vatio
n an
dD
evel
opm
ent
. . .
. . .
. .37
1,24
339
0,11
235
3,14
535
6,41
437
5,35
239
3,38
339
2,46
941
3,73
242
7,49
335
6,04
481
0D
epar
tmen
t of
Bui
ldin
gs .
. . .
. . .
. . .
.55
,860
48,4
5742
,302
39,5
1734
,210
29,6
1928
,417
29,0
0431
,322
32,4
30
(Con
tinu
ed)
Com
ptro
ller’
s R
epor
t fo
r F
isca
l 200
2P
art
III—
Stat
isti
cal I
nfor
mat
ion
Gen
eral
Fun
d E
xpen
ditu
res
and
Oth
er F
inan
cing
Use
s—Te
n Y
ear
Tre
nd (
Con
t.)
Fis
cal Y
ear
2002
2001
2000
1999
1998
1997
1996
1995
1994
1993
____
____
____
____
____
____
____
____
____
____
____
____
____
____
____
____
____
____
____
____
____
____
____
____
____
(in
thou
sand
s)

250
Hou
sing
:(co
nt.)
Mis
cella
neou
s—Pa
ymen
t to
Hou
sing
Aut
hori
ty .
. . .
. . .
. . .
.$
13,1
81$
39,0
68$
33,1
97$
33,9
30$
33,9
91$
32,5
84$
33,7
78$
84,2
74$
131,
164
$12
7,34
7__
____
____
____
____
____
____
____
____
____
____
____
____
____
____
____
____
____
____
____
____
____
____
____
____
__To
tal H
ousi
ng .
. . .
. . .
. .44
0,28
447
7,63
742
8,64
442
9,86
144
3,55
345
5,58
645
4,66
452
7,01
058
9,97
951
5,82
1__
____
____
____
____
____
____
____
____
____
____
____
____
____
____
____
____
____
____
____
____
____
____
____
____
__H
ealth
:81
6D
epar
tmen
t of
Hea
lth .
. .
1,04
9,13
590
6,94
779
0,72
649
1,60
347
2,03
042
0,27
541
9,30
841
4,60
135
1,57
331
4,97
081
7D
epar
tmen
t of
Men
tal
Hea
lth,M
enta
lR
etar
datio
n an
dA
lcoh
olis
m S
ervi
ces
. .25
6,06
429
5,11
425
1,44
643
7,29
239
6,09
534
5,28
431
9,27
527
3,98
021
1,26
720
1,09
781
9N
ew Y
ork
City
Hea
lthan
d H
ospi
tals
Cor
pora
tion
. . .
. . .
. . .
826,
307
757,
023
735,
127
722,
094
684,
601
682,
924
1,09
0,17
31,
048,
187
1,05
7,17
893
5,63
0__
____
____
____
____
____
____
____
____
____
____
____
____
____
____
____
____
____
____
____
____
____
____
____
____
__To
tal H
ealth
. . .
. . .
. . .
.2,
131,
506
1,95
9,08
41,
777,
299
1,65
0,98
91,
552,
726
1,44
8,48
31,
828,
756
1,73
6,76
81,
620,
018
1,45
1,69
7__
____
____
____
____
____
____
____
____
____
____
____
____
____
____
____
____
____
____
____
____
____
____
____
____
__L
ibra
ries
:03
5R
esea
rch
Lib
rari
es. .
. . .
.9,
198
25,5
9714
,660
14,0
5113
,275
12,9
089,
997
5,60
89,
526
9,02
703
7 N
ew Y
ork
Publ
icL
ibra
ry .
. . .
. . .
. . .
. .46
,906
146,
176
89,0
4781
,871
79,4
7241
,042
100,
119
67,7
5968
,548
58,9
4603
8B
rook
lyn
Publ
icL
ibra
ry .
. . .
. . .
. . .
. .34
,764
107,
650
66,1
0459
,144
55,2
5728
,134
72,9
1747
,926
48,3
6239
,523
039
Que
ens
Bor
ough
Pub
licL
ibra
ry .
. . .
. . .
. . .
. .32
,940
103,
352
62,7
1157
,177
54,0
4625
,493
69,9
6646
,574
46,1
3638
,967
____
____
____
____
____
____
____
____
____
____
____
____
____
____
____
____
____
____
____
____
____
____
____
____
____
Tota
l Lib
rari
es .
. . .
. . .
.12
3,80
838
2,77
523
2,52
221
2,24
320
2,05
010
7,57
725
2,99
916
7,86
717
2,57
214
6,46
3__
____
____
____
____
____
____
____
____
____
____
____
____
____
____
____
____
____
____
____
____
____
____
____
____
__Pe
nsio
ns:
095
Pens
ion
Con
trib
utio
ns .
. .1,
391,
896
1,12
7,12
961
5,08
51,
342,
415
1,40
8,60
41,
318,
556
1,35
6,47
61,
273,
001
1,27
3,81
71,
426,
896
____
____
____
____
____
____
____
____
____
____
____
____
____
____
____
____
____
____
____
____
____
____
____
____
____
Judg
men
ts a
nd C
laim
s .
. . .
. . .
521,
834
594,
846
490,
669
424,
305
386,
127
326,
293
308,
663
251,
247
270,
916
230,
731
____
____
____
____
____
____
____
____
____
____
____
____
____
____
____
____
____
____
____
____
____
____
____
____
____
Frin
ge B
enef
its a
nd O
ther
Ben
efit
Paym
ents
. . .
. . .
. . .
.2,
426,
144
2,20
0,11
72,
065,
166
1,82
4,98
01,
811,
089
1,73
2,24
91,
581,
649
1,44
3,68
61,
551,
629
1,49
2,17
7__
____
____
____
____
____
____
____
____
____
____
____
____
____
____
____
____
____
____
____
____
____
____
____
____
__
(Con
tinu
ed)
Com
ptro
ller’
s R
epor
t fo
r F
isca
l 200
2P
art
III—
Stat
isti
cal I
nfor
mat
ion
Gen
eral
Fun
d E
xpen
ditu
res
and
Oth
er F
inan
cing
Use
s—Te
n Y
ear
Tre
nd (
Con
t.)
Fis
cal Y
ear
2002
2001
2000
1999
1998
1997
1996
1995
1994
1993
____
____
____
____
____
____
____
____
____
____
____
____
____
____
____
____
____
____
____
____
____
____
____
____
____
(in
thou
sand
s)

251
Oth
er:
098
Mis
cella
neou
s . .
. . .
. . .
.$
359,
640
$30
1,69
8$
(48,
848)
$48
,206
$33
4,58
8$
184,
061
$13
9,49
4$
248,
017
$33
8,38
2$
232,
386
Inte
rest
on
Shor
t-te
rm
Bor
row
ings
. . .
. . .
. . .
14,3
7313
,584
12,4
186,
640
30,5
8757
,245
70,2
7759
,502
36,1
9734
,133
____
____
____
____
____
____
____
____
____
____
____
____
____
____
____
____
____
____
____
____
____
____
____
____
____
Tota
l Oth
er .
. . .
. . .
. . .
.37
4,01
331
5,28
2(3
6,43
0)54
,846
365,
175
241,
306
209,
771
307,
519
374,
579
266,
519
____
____
____
____
____
____
____
____
____
____
____
____
____
____
____
____
____
____
____
____
____
____
____
____
____
Tra
nsfe
rs to
Deb
t Ser
vice
Fun
ds:
099
Gen
eral
and
Lea
sePu
rcha
se D
ebt
Serv
ice
Fund
s—G
ener
al D
ebt S
ervi
ce .
.1,
356,
686
2,50
8,77
43,
326,
517
3,35
3,77
42,
903,
466
4,12
7,06
92,
442,
227
2,26
0,11
62,
099,
436
2,06
9,13
810
0M
unic
ipal
Ass
ista
nce
Cor
pora
tion
. . .
. . .
. . .
5,00
045
7,90
045
0,50
038
5,90
077
3,00
026
4,00
013
2,00
029
,000
354,
300
370,
400
____
____
____
____
____
____
____
____
____
____
____
____
____
____
____
____
____
____
____
____
____
____
____
____
____
Tota
l Tra
nsfe
rs to
Deb
t Se
rvic
e Fu
nds
. . .
. . .
.1,
361,
686
2,96
6,67
43,
777,
017
3,73
9,67
43,
676,
466
4,39
1,06
92,
574,
227
2,28
9,11
62,
453,
736
2,43
9,53
8__
____
____
____
____
____
____
____
____
____
____
____
____
____
____
____
____
____
____
____
____
____
____
____
____
__To
tal E
xpen
ditu
res
and
Tra
nsfe
rs .
. . .
. . .
$40,
860,
000
$40,
226,
977
$37,
879,
886
$35,
858,
612
$34,
923,
250
$33,
736,
152
$32,
066,
586
$31,
585,
615
$31,
347,
709
$30,
153,
903
____
____
____
____
____
____
____
____
____
____
____
____
____
____
____
____
____
____
____
____
____
____
____
____
____
____
____
____
____
____
____
____
____
____
____
____
____
____
____
____
____
____
____
____
____
____
____
____
____
____
Com
ptro
ller’
s R
epor
t fo
r F
isca
l 200
2P
art
III—
Stat
isti
cal I
nfor
mat
ion
Gen
eral
Fun
d E
xpen
ditu
res
and
Oth
er F
inan
cing
Use
s—Te
n Y
ear
Tre
nd (
Con
t.)
Fis
cal Y
ear
2002
2001
2000
1999
1998
1997
1996
1995
1994
1993
____
____
____
____
____
____
____
____
____
____
____
____
____
____
____
____
____
____
____
____
____
____
____
____
____
____
____
____
____
____
(in
thou
sand
s)

252
REAL ESTATE TAX COLLECTIONS
Percent of Tax Levy Collected Within______________________________________________________________________1st Year 2nd Year 3rd Year Remaining
Fiscal Tax Year After Year After Year After Year UncollectedYear Levy of Levy of Levy of Levy of Levy June 30, 2002_____ _______________ _______ _________ ________ __________ ____________
1993 and prior . . . . . . . . . . . . . . . . . $ — —% —% —% —% $90,075,816 1994 . . . . . . . . . . . . . . . . . . . . . . . . 8,113,242,933 91.00 1.04 0.15 (0.16) 43,975,638 1995 . . . . . . . . . . . . . . . . . . . . . . . . 7,889,694,447 91.17 1.27 (0.01) 0.11 51,210,913 1996 . . . . . . . . . . . . . . . . . . . . . . . . 7,871,357,765 91.17 1.03 0.17 0.20 54,835,320 1997 . . . . . . . . . . . . . . . . . . . . . . . . 7,835,147,663 93.14 1.12 0.28 0.14 59,439,129 1998 . . . . . . . . . . . . . . . . . . . . . . . . 7,890,421,829 93.18 1.32 0.24 0.11 63,914,863 1999 . . . . . . . . . . . . . . . . . . . . . . . . 8,099,336,484 92.45 1.27 0.25 0.14 69,869,658 2000 . . . . . . . . . . . . . . . . . . . . . . . . 8,374,300,959 92.45 1.37 0.28 — 77,360,240 2001 . . . . . . . . . . . . . . . . . . . . . . . . 8,730,263,712 92.07 1.25 — — 108,998,326 2002 . . . . . . . . . . . . . . . . . . . . . . . . 9,271,238,485 92.40 — — — 306,229,764
SOURCE: New York City Department of Finance and City Council Tax Resolutions.
REAL ESTATE ASSESSMENTS
Tax Rate Tax RateTaxable Per $100 Per $100
Fiscal Assessed Full Tax of Assessed of fullYear Value(1) Value(2) Levy Value(3) Value______ _________________ ___________________ ________________ __________ ________
1993 . . . . . . . . . . . . . . . . . . . . . . . . $81,714,592,106 $649,559,555,692 $8,392,486,255 $10.65 $1.34 1994 . . . . . . . . . . . . . . . . . . . . . . . . 79,296,504,314 729,498,659,742 8,113,242,933 10.31 1.12 1995 . . . . . . . . . . . . . . . . . . . . . . . . 76,807,101,842 696,347,251,514 7,889,694,447 10.31 1.14 1996 . . . . . . . . . . . . . . . . . . . . . . . . 77,424,795,436 426,347,992,489 7,871,357,765 10.30 1.87 1997 . . . . . . . . . . . . . . . . . . . . . . . . 77,509,889,430 374,624,888,497 7,835,147,663 10.29 2.13 1998 . . . . . . . . . . . . . . . . . . . . . . . . 78,771,552,028 359,031,686,545 7,890,421,829 10.29 2.26 1999 . . . . . . . . . . . . . . . . . . . . . . . . 82,155,117,331 331,671,850,347 8,099,336,484 10.31 2.55 2000 . . . . . . . . . . . . . . . . . . . . . . . . 85,868,215,596 339,400,061,644 8,374,300,959 10.31 2.61 2001 . . . . . . . . . . . . . . . . . . . . . . . . 90,569,801,460 361,700,485,064 8,730,263,712 10.18 2.55 2002 . . . . . . . . . . . . . . . . . . . . . . . . 97,486,429,057 409,606,844,777 9,271,238,485 10.17 2.42
(1) Excludes value of certain property eligible for the veteran’s real property exemption.
(2) Full valuation for each fiscal year shown is based on the special equalization rates as reported to the City Council, for purposesof fixing the tax rate for such year.
(3) Based on the weighted average rate of the four real estate classes.
SOURCE: New York City Department of Finance and City Council Tax Resolutions.
Comptroller’s Report for Fiscal 2002 Part III—Statistical Information
Real Estate Tax
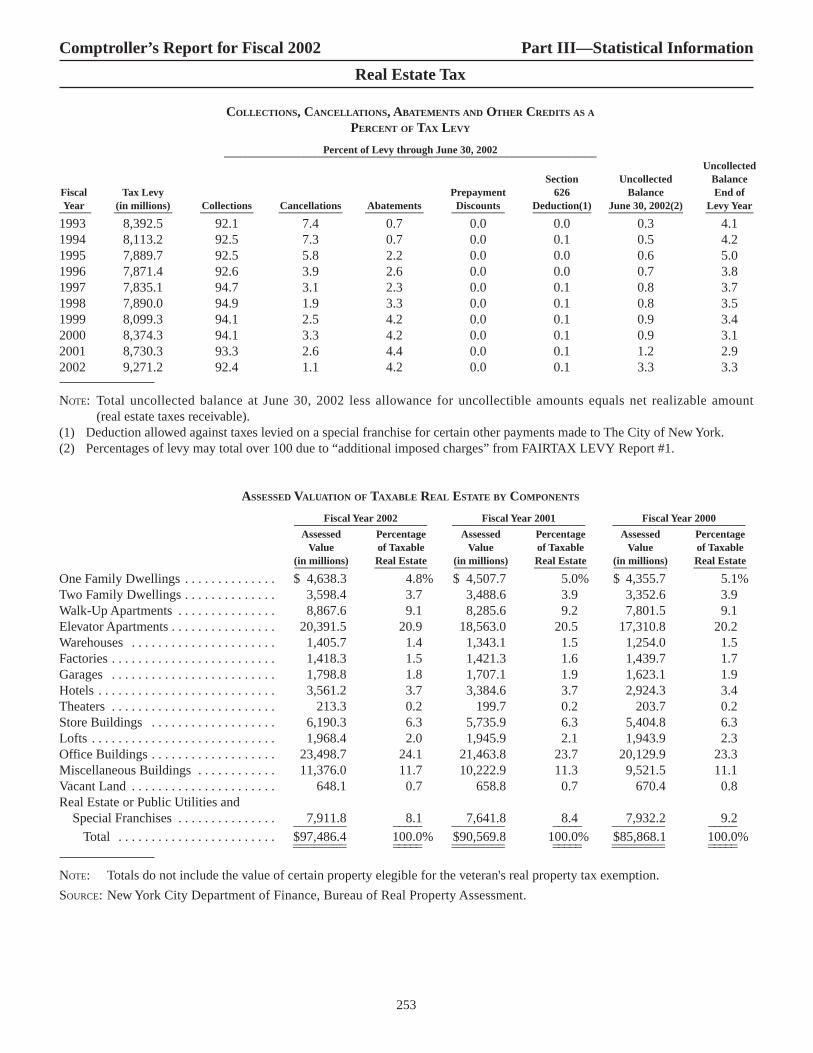
253
COLLECTIONS, CANCELLATIONS, ABATEMENTS AND OTHER CREDITS AS A
PERCENT OF TAX LEVY
Percent of Levy through June 30, 2002______________________________________________________________________Uncollected
Section Uncollected BalanceFiscal Tax Levy Prepayment 626 Balance End ofYear (in millions) Collections Cancellations Abatements Discounts Deduction(1) June 30, 2002(2) Levy Year______ ___________ __________ ____________ ___________ __________ ___________ ______________ _________
1993 8,392.5 92.1 7.4 0.7 0.0 0.0 0.3 4.1 1994 8,113.2 92.5 7.3 0.7 0.0 0.1 0.5 4.2 1995 7,889.7 92.5 5.8 2.2 0.0 0.0 0.6 5.0 1996 7,871.4 92.6 3.9 2.6 0.0 0.0 0.7 3.8 1997 7,835.1 94.7 3.1 2.3 0.0 0.1 0.8 3.7 1998 7,890.0 94.9 1.9 3.3 0.0 0.1 0.8 3.5 1999 8,099.3 94.1 2.5 4.2 0.0 0.1 0.9 3.4 2000 8,374.3 94.1 3.3 4.2 0.0 0.1 0.9 3.1 2001 8,730.3 93.3 2.6 4.4 0.0 0.1 1.2 2.9 2002 9,271.2 92.4 1.1 4.2 0.0 0.1 3.3 3.3
NOTE: Total uncollected balance at June 30, 2002 less allowance for uncollectible amounts equals net realizable amount(real estate taxes receivable).
(1) Deduction allowed against taxes levied on a special franchise for certain other payments made to The City of New York.(2) Percentages of levy may total over 100 due to “additional imposed charges” from FAIRTAX LEVY Report #1.
ASSESSED VALUATION OF TAXABLE REAL ESTATE BY COMPONENTS
Fiscal Year 2002 Fiscal Year 2001 Fiscal Year 2000_________________________ _________________________ _________________________Assessed Percentage Assessed Percentage Assessed Percentage
Value of Taxable Value of Taxable Value of Taxable(in millions) Real Estate (in millions) Real Estate (in millions) Real Estate__________ __________ __________ __________ __________ __________
One Family Dwellings . . . . . . . . . . . . . . $ 4,638.3 4.8% $ 4,507.7 5.0% $ 4,355.7 5.1% Two Family Dwellings . . . . . . . . . . . . . . 3,598.4 3.7 3,488.6 3.9 3,352.6 3.9 Walk-Up Apartments . . . . . . . . . . . . . . . 8,867.6 9.1 8,285.6 9.2 7,801.5 9.1 Elevator Apartments . . . . . . . . . . . . . . . . 20,391.5 20.9 18,563.0 20.5 17,310.8 20.2 Warehouses . . . . . . . . . . . . . . . . . . . . . . 1,405.7 1.4 1,343.1 1.5 1,254.0 1.5 Factories . . . . . . . . . . . . . . . . . . . . . . . . . 1,418.3 1.5 1,421.3 1.6 1,439.7 1.7 Garages . . . . . . . . . . . . . . . . . . . . . . . . . 1,798.8 1.8 1,707.1 1.9 1,623.1 1.9 Hotels . . . . . . . . . . . . . . . . . . . . . . . . . . . 3,561.2 3.7 3,384.6 3.7 2,924.3 3.4 Theaters . . . . . . . . . . . . . . . . . . . . . . . . . 213.3 0.2 199.7 0.2 203.7 0.2 Store Buildings . . . . . . . . . . . . . . . . . . . 6,190.3 6.3 5,735.9 6.3 5,404.8 6.3 Lofts . . . . . . . . . . . . . . . . . . . . . . . . . . . . 1,968.4 2.0 1,945.9 2.1 1,943.9 2.3 Office Buildings . . . . . . . . . . . . . . . . . . . 23,498.7 24.1 21,463.8 23.7 20,129.9 23.3Miscellaneous Buildings . . . . . . . . . . . . 11,376.0 11.7 10,222.9 11.3 9,521.5 11.1 Vacant Land . . . . . . . . . . . . . . . . . . . . . . 648.1 0.7 658.8 0.7 670.4 0.8 Real Estate or Public Utilities and
Special Franchises . . . . . . . . . . . . . . . 7,911.8 8.1 7,641.8 8.4 7,932.2 9.2________ _____ ________ _____ ________ _____Total . . . . . . . . . . . . . . . . . . . . . . . . $97,486.4 100.0% $90,569.8 100.0% $85,868.1 100.0%________ _____ ________ _____ ________ _____________ _____ ________ _____ ________ _____
NOTE: Totals do not include the value of certain property elegible for the veteran's real property tax exemption.
SOURCE: New York City Department of Finance, Bureau of Real Property Assessment.
Comptroller’s Report for Fiscal 2002 Part III—Statistical Information
Real Estate Tax

254
LARGEST REAL ESTATE TAXPAYERS
No single taxpayer accounts for 10% or more of the City’s real property tax. For the 2002 Fiscal Year, the assessed real estateof utility corporations (as a group the largest taxpayers) is $2.0 billion. The following are fully completed properties having transitionalassessed valuations in the 2002 Fiscal Year, as indicated on the tax rolls:
Assessed Percent ofValuation 2002 Total Assessed
Property Fiscal Year Value________ _________________ _____________Consolidated Edison* . . . . . . . . . . . . . . . . . . . . . . . . . . . . . . . . . $1,807,458,633 2.0523%Verizon Building* . . . . . . . . . . . . . . . . . . . . . . . . . . . . . . . . . . . . 517,749,260 0.5879Met Life Building . . . . . . . . . . . . . . . . . . . . . . . . . . . . . . . . . . . . . 249,380,000 0.2832General Motors Building . . . . . . . . . . . . . . . . . . . . . . . . . . . . . . . 216,550,000 0.24591290 Avenue of the Americas . . . . . . . . . . . . . . . . . . . . . . . . . . . . 186,120,000 0.2113Stuyvesant Town . . . . . . . . . . . . . . . . . . . . . . . . . . . . . . . . . . . . . 185,990,000 0.2112Empire State Building . . . . . . . . . . . . . . . . . . . . . . . . . . . . . . . . . 175,800,000 0.1996McGraw-Hill Building . . . . . . . . . . . . . . . . . . . . . . . . . . . . . . . . . 175,680,000 0.1995Bear Stearns Building (Park Ave.) . . . . . . . . . . . . . . . . . . . . . . . . 172,800,000 0.1962Alliance Capital . . . . . . . . . . . . . . . . . . . . . . . . . . . . . . . . . . . . . . 171,280,000 0.1945Bristol-Meyers . . . . . . . . . . . . . . . . . . . . . . . . . . . . . . . . . . . . . . . 166,680,000 0.1893International Building . . . . . . . . . . . . . . . . . . . . . . . . . . . . . . . . . 163,280,000 0.1854Time & Life Building . . . . . . . . . . . . . . . . . . . . . . . . . . . . . . . . . . 160,440,000 0.1822Credit Lyonnais . . . . . . . . . . . . . . . . . . . . . . . . . . . . . . . . . . . . . . 156,659,998 0.1779Paine Webber . . . . . . . . . . . . . . . . . . . . . . . . . . . . . . . . . . . . . . . . 154,339,993 0.1753Waldorf-Astoria . . . . . . . . . . . . . . . . . . . . . . . . . . . . . . . . . . . . . . 150,400,000 0.1708Equitable Tower . . . . . . . . . . . . . . . . . . . . . . . . . . . . . . . . . . . . . . 148,530,000 0.1687Morgan Guaranty . . . . . . . . . . . . . . . . . . . . . . . . . . . . . . . . . . . . . 142,290,000 0.1616Celanese Building . . . . . . . . . . . . . . . . . . . . . . . . . . . . . . . . . . . . 140,490,000 0.1595One Penn Plaza . . . . . . . . . . . . . . . . . . . . . . . . . . . . . . . . . . . . . . 139,770,000 0.1587N.Y. Hilton & Towers . . . . . . . . . . . . . . . . . . . . . . . . . . . . . . . . . . 139,248,000 0.1581Worldwide Plaza . . . . . . . . . . . . . . . . . . . . . . . . . . . . . . . . . . . . . 138,000,000 0.1567Solow Building . . . . . . . . . . . . . . . . . . . . . . . . . . . . . . . . . . . . . . . 129,690,000 0.1473Chase World Headquarters . . . . . . . . . . . . . . . . . . . . . . . . . . . . . . 124,380,000 0.1412The Chase Manhattan Plaza . . . . . . . . . . . . . . . . . . . . . . . . . . . . . 123,750,000 0.1405Bear Stearns Building (Madison Ave.) . . . . . . . . . . . . . . . . . . . . . 121,040,000 0.1374Park Avenue Atrium . . . . . . . . . . . . . . . . . . . . . . . . . . . . . . . . . . . 120,761,520 0.1371One Liberty Plaza . . . . . . . . . . . . . . . . . . . . . . . . . . . . . . . . . . . . . 118,983,919 0.1351Paramount Plaza . . . . . . . . . . . . . . . . . . . . . . . . . . . . . . . . . . . . . . 118,720,000 0.1348666 Fifth Avenue . . . . . . . . . . . . . . . . . . . . . . . . . . . . . . . . . . . . . 112,220,000 0.1274595 Lexington Avenue . . . . . . . . . . . . . . . . . . . . . . . . . . . . . . . . . 112,050,000 0.1272Carpet Center . . . . . . . . . . . . . . . . . . . . . . . . . . . . . . . . . . . . . . . . 106,930,000 0.1214Simon & Schuster . . . . . . . . . . . . . . . . . . . . . . . . . . . . . . . . . . . . 106,680,000 0.1211Kalikow Building . . . . . . . . . . . . . . . . . . . . . . . . . . . . . . . . . . . . . 106,250,000 0.1206Sheraton New York. . . . . . . . . . . . . . . . . . . . . . . . . . . . . . . . . . . . 105,710,000 0.1200Citigroup Center . . . . . . . . . . . . . . . . . . . . . . . . . . . . . . . . . . . . . . 105,570,000 0.1199Reuters Buildings . . . . . . . . . . . . . . . . . . . . . . . . . . . . . . . . . . . . . 103,950,000 0.1180Park Avenue Plaza . . . . . . . . . . . . . . . . . . . . . . . . . . . . . . . . . . . . 103,140,000 0.1171W.R. Grace Building . . . . . . . . . . . . . . . . . . . . . . . . . . . . . . . . . . 97,380,000 0.1106One Astor Plaza . . . . . . . . . . . . . . . . . . . . . . . . . . . . . . . . . . . . . . 96,426,000 0.1095Continental Illinois . . . . . . . . . . . . . . . . . . . . . . . . . . . . . . . . . . . . 91,080,000 0.1034IBM Tower . . . . . . . . . . . . . . . . . . . . . . . . . . . . . . . . . . . . . . . . . . 90,756,000 0.1031______________ _______
Sub-Total Transitional . . . . . . . . . . . . . . . . . . . . . . . . . . . . 7,854,403,323 8.9185All Others . . . . . . . . . . . . . . . . . . . . . . . . . . . . . . . . . . . . . . . . . . . 80,213,650,598 91.0815______________ _______
Total Taxable Real Estate** . . . . . . . . . . . . . . . . . . . . . . . . $88,068,053,921 100.00%______________ _____________________ _______
* Excludes assessed valuations of special franchises:Con Edison $3,110,075,814Verizon $412,697,855
** Includes differences between transitional and actual assessed valuations.
SOURCE: The City of New York, Department of Finance Bureau of Real Property Assessment.
Comptroller’s Report for Fiscal 2002 Part III—Statistical Information
Real Estate Tax

255
GE
NE
RA
LG
OV
ER
NM
EN
T:
Dep
artm
ent o
f B
usin
ess
Serv
ices
. . .
. . .
. . .
. . .
. . .
$18,
366
$—
$—
$—
$5,
598
$27
,688
$—
$6,
129
$8,
133
$49
Dep
artm
ent o
f C
ityw
ide
Adm
inis
trat
ive
Serv
ices
. . .
——
3,58
9—
——
—55
——
____
____
____
____
____
____
____
____
____
____
____
____
____
____
____
____
____
____
____
____
Tota
l Gen
eral
Gov
ernm
ent
. . .
. . .
. .
18,3
66—
3,58
9—
5,59
827
,688
—6,
184
8,13
349
____
____
____
____
____
____
____
____
____
____
____
____
____
____
____
____
____
____
____
____
PUB
LIC
SAFE
TY
AN
DJU
DIC
IAL:
Polic
e D
epar
tmen
t . .
. . .
. . .
.(4
,464
)12
,343
2,38
85,
604
8,28
834
,409
3,79
552
,596
——
Fire
Dep
artm
ent .
. . .
. . .
. . .
.(2
)(1
)1
12
5113
932
613
14D
epar
tmen
t of
Cor
rect
ion
. . .
(573
)3,
691
8,77
41,
505
——
——
——
Dep
artm
ent o
f Ju
veni
leJu
stic
e .
. . .
. . .
. . .
. . .
. . .
——
——
——
——
—1,
324
____
____
____
____
____
____
____
____
____
____
____
____
____
____
____
____
____
____
____
____
Tota
l Pub
lic S
afet
yan
d Ju
dici
al .
. . .
. . .
. .(5
,039
)16
,033
11,1
637,
110
8,29
034
,460
3,93
452
,922
131,
338
____
____
____
____
____
____
____
____
____
____
____
____
____
____
____
____
____
____
____
____
ED
UC
AT
ION
:B
oard
of
Edu
catio
n .
. . .
. . .
.70
,081
——
—1
——
—12
,034
884
City
Uni
vers
ity o
f N
ew Y
ork—
Com
mun
ity C
olle
ges
. . .
. .
(275
)(3
4)1,
998
437
——
154
913
451
800
____
____
____
____
____
____
____
____
____
____
____
____
____
____
____
____
____
____
____
____
Tota
l Edu
catio
n .
. . .
. . .
69,8
06(3
4)1,
998
437
1—
154
913
12,4
851,
684
____
____
____
____
____
____
____
____
____
____
____
____
____
____
____
____
____
____
____
____
EN
VIR
ON
ME
NTA
LPR
OT
EC
TIO
N:
Dep
artm
ent o
f E
nvir
onm
enta
lPr
otec
tion
. . .
. . .
. . .
. . .
. .
(123
)75
83,
261
246
19,1
4242
,854
30,5
6532
,211
31,1
5461
,678
Dep
artm
ent o
f Sa
nita
tion
. . .
3,22
58,
911
—25
,235
——
—50
——
____
____
____
____
____
____
____
____
____
____
____
____
____
____
____
____
____
____
____
____
Tota
l Env
iron
men
tal
Prot
ectio
n .
. . .
. . .
. . .
. .3,
102
9,66
93,
261
25,4
8119
,142
42,8
5430
,565
32,2
6131
,154
61,6
78__
____
____
____
____
____
____
____
____
____
____
____
____
____
____
____
____
____
____
____
__
(Con
tinu
ed)
Com
ptro
ller’
s R
epor
t fo
r F
isca
l 200
2P
art
III—
Stat
isti
cal I
nfor
mat
ion
New
Yor
k C
ity
Cap
ital
Pro
ject
s F
und
Aid
Rev
enue
s by
Age
ncy—
Ten
Yea
r T
rend
Fis
cal Y
ear
2002
2001
2000
1999
1998
1997
1996
1995
1994
1993
____
____
____
____
____
____
____
____
____
____
____
____
____
____
____
____
____
____
____
____
____
____
____
____
____
(in
thou
sand
s)

256
TR
AN
SPO
RTA
TIO
NSE
RV
ICE
S:D
epar
tmen
t of
Tra
nspo
rtat
ion
. . .
. . .
. . .
.$1
82,0
12$1
14,9
30$1
73,8
85$1
92,7
03$2
21,2
30$1
91,4
06$1
46,9
83$1
27,0
20$1
56,0
66$
96,1
48T
rans
it A
utho
rity
. . .
. . .
. . .
.1,
309
(1,3
09)
——
17—
414
82,
376
5,64
8__
____
____
____
____
____
____
____
____
____
____
____
____
____
____
____
____
____
____
____
__To
tal T
rans
port
atio
nSe
rvic
es .
. . .
. . .
. . .
. . .
183,
321
113,
621
173,
885
192,
703
221,
247
191,
406
146,
987
127,
168
158,
442
101,
796
____
____
____
____
____
____
____
____
____
____
____
____
____
____
____
____
____
____
____
____
PAR
KS,
RE
CR
EA
TIO
NA
ND
CU
LTU
RA
LA
CT
IVIT
IES:
Dep
artm
ent o
f Pa
rks
and
Rec
reat
ion
. . .
. . .
. . .
.93
45,
651
12,3
6329
13,
997
280
1,40
010
44,
120
888
Dep
artm
ent o
f C
ultu
ral
Aff
airs
. . .
. . .
. . .
. . .
. . .
.(2
6)—
—73
1,18
0—
288
36—
—__
____
____
____
____
____
____
____
____
____
____
____
____
____
____
____
____
____
____
____
__To
tal P
arks
,Rec
reat
ion
and
Cul
tura
l Act
iviti
es .
.90
85,
651
12,3
6336
45,
177
280
1,68
814
04,
120
888
____
____
____
____
____
____
____
____
____
____
____
____
____
____
____
____
____
____
____
____
HO
USI
NG
:D
epar
tmen
t of
Hou
sing
Pres
erva
tion
and
Dev
elop
men
t .
. . .
. . .
. . .
.10
7,33
420
3,64
610
1,04
210
6,93
963
,584
82,9
9983
,569
147,
232
1,05
73,
764
____
____
____
____
____
____
____
____
____
____
____
____
____
____
____
____
____
____
____
____
HE
ALT
H:
Hea
lth a
nd H
ospi
tals
Cor
pora
tion
. . .
. . .
. . .
. . .
——
——
——
——
2175
9__
____
____
____
____
____
____
____
____
____
____
____
____
____
____
____
____
____
____
____
__O
TH
ER
. . .
. . .
. . .
. . .
. . .
. . .
. .
11,3
536,
772
5,23
619
,546
3,57
098
01,
636
833
765
1,82
4__
____
____
____
____
____
____
____
____
____
____
____
____
____
____
____
____
____
____
____
__N
et C
hang
e in
Est
imat
e of
Prio
r Yea
rs R
ecei
vabl
es .
. . .
.—
——
(771
)(2
,526
)(3
,364
)(6
,257
)(8
,850
)(4
,923
)(9
23)
____
____
____
____
____
____
____
____
____
____
____
____
____
____
____
____
____
____
____
____
Tota
l . .
. . .
. . .
. . .
. . .
. . .
.$3
89,1
51$3
55,3
58$3
12,5
37$3
51,8
09$3
24,0
83$3
77,3
03$2
62,2
76$3
58,8
03$2
11,2
67$1
72,8
57__
____
____
____
____
____
____
____
____
____
____
____
____
____
____
____
____
____
____
____
____
____
____
____
____
____
____
____
____
____
____
____
____
____
____
____
____
____
____
____
__
Com
ptro
ller’
s R
epor
t fo
r F
isca
l 200
2P
art
III—
Stat
isti
cal I
nfor
mat
ion
New
Yor
k C
ity
Cap
ital
Pro
ject
s F
und
Aid
Rev
enue
s by
Age
ncy—
Ten
Yea
r T
rend
(C
ont.
)
Fis
cal Y
ear
2002
2001
2000
1999
1998
1997
1996
1995
1994
1993
____
____
____
____
____
____
____
____
____
____
____
____
____
____
____
____
____
____
____
____
____
____
____
____
____
(in
thou
sand
s)

257
GE
NE
RA
LG
OV
ER
NM
EN
T:
Dep
artm
ent o
f B
usin
ess
Serv
ices
. . .
. . .
. . .
. . .
. . .
$17
6,45
6$
219,
230
$64
,988
$52
,876
$99
,702
$19
6,64
4$
155,
180
$133
,158
$48
,977
$50
,918
Dep
artm
ent o
f Po
rts,
Inte
rnat
iona
l Tra
de a
ndC
omm
erce
. . .
. . .
. . .
. .
195
142
047
83,
662
325
2,94
93,
595
9,32
15,
143
Dep
artm
ent o
f C
ityw
ide
Adm
inis
trat
ive
Serv
ices
. . .
365,
666
341,
441
292,
538
261,
139
200,
522
236,
144
187,
420
293,
720
216,
893
228,
967
Dep
artm
ent o
f In
form
atio
n,Te
chno
logy
and
Tele
com
mun
icat
ions
. . .
.34
,769
23,3
2610
,253
4,14
35,
261
5,96
99,
294
28,5
261,
986
—__
____
____
____
____
____
____
____
____
____
____
____
____
____
____
____
____
____
____
____
____
____
____
____
____
__To
tal G
ener
alG
over
nmen
t .
. . .
. . .
.57
7,08
658
3,99
836
8,19
931
8,63
630
9,14
743
9,08
235
4,84
345
8,99
927
7,17
728
5,02
8__
____
____
____
____
____
____
____
____
____
____
____
____
____
____
____
____
____
____
____
____
____
____
____
____
__PU
BL
ICSA
FET
YA
ND
JUD
ICIA
L:
POL
ICE
DE
PAR
TM
EN
T .
. . .
. . .
.60
,661
64,3
5749
,042
58,1
7736
,356
114,
923
77,1
7813
0,26
134
,471
27,9
32Fi
re D
epar
tmen
t . .
. . .
. . .
. . .
112,
049
79,6
2876
,450
48,2
0579
,095
42,0
9727
,508
28,6
4237
,026
34,9
62D
epar
tmen
t of
Cor
rect
ion.
. . .
655,
521
91,5
4939
6,59
412
0,30
670
,716
51,4
0432
,647
108,
140
110,
956
182,
463
Dep
artm
ent o
f Ju
veni
leJu
stic
e .
. . .
. . .
. . .
. . .
. . .
230
797
841
1,32
16,
350
13,1
9113
,391
21,9
916,
900
7,02
4__
____
____
____
____
____
____
____
____
____
____
____
____
____
____
____
____
____
____
____
____
____
____
____
____
__To
tal P
ublic
Saf
ety
and
Judi
cial
. . .
. . .
. . .
828,
461
236,
331
522,
927
228,
009
192,
517
221,
615
150,
724
289,
034
189,
353
252,
381
____
____
____
____
____
____
____
____
____
____
____
____
____
____
____
____
____
____
____
____
____
____
____
____
____
ED
UC
AT
ION
:B
oard
of
Edu
catio
n .
. . .
. . .
.1,
765,
249
1,70
7,61
41,
295,
717
1,56
8,05
91,
232,
891
613,
817
807,
047
874,
741
722,
365
754,
288
City
Uni
vers
ity o
f N
ew Y
ork:
Seni
or C
olle
ges
. . .
. . .
. . .
1,11
01,
711
13,8
6775
471
31,
925
646
2,25
948
152
4C
omm
unity
Col
lege
s .
. . .
.9,
532
7,32
745
98,
351
7,21
25,
145
3,98
33,
803
3,70
63,
355
____
____
____
____
____
____
____
____
____
____
____
____
____
____
____
____
____
____
____
____
____
____
____
____
____
Tota
l Edu
catio
n .
. . .
. . .
1,77
5,89
11,
716,
652
1,31
0,04
31,
577,
164
1,24
0,81
662
0,88
781
1,67
688
0,80
372
6,55
275
8,16
7__
____
____
____
____
____
____
____
____
____
____
____
____
____
____
____
____
____
____
____
____
____
____
____
____
__E
NV
IRO
NM
EN
TAL
PRO
TE
CT
ION
:D
epar
tmen
t of
Sani
tatio
n .
. .18
5,24
917
8,22
611
8,11
971
,161
116,
195
213,
414
131,
221
113,
728
151,
328
188,
283
Dep
artm
ent o
f E
nvir
onm
enta
lPr
otec
tion
. . .
. . .
. . .
. . .
. .
1,03
6,70
683
0,01
079
6,86
578
7,92
876
4,76
797
7,55
51,
004,
252
705,
399
616,
393
745,
535
____
____
____
____
____
____
____
____
____
____
____
____
____
____
____
____
____
____
____
____
____
____
____
____
____
Tota
l Env
iron
men
tal
Prot
ectio
n .
. . .
. . .
. . .
1,22
1,95
51,
008,
236
914,
984
859,
089
880,
962
1,19
0,96
91,
135,
473
819,
127
767,
721
933,
818
____
____
____
____
____
____
____
____
____
____
____
____
____
____
____
____
____
____
____
____
____
____
____
____
____
(Con
tinu
ed)
Com
ptro
ller’
s R
epor
t fo
r F
isca
l 200
2P
art
III—
Stat
isti
cal I
nfor
mat
ion
New
Yor
k C
ity
Cap
ital
Pro
ject
s F
und
Exp
endi
ture
s—Te
n Y
ear
Tre
nd
Fis
cal Y
ear
2002
2001
2000
1999
1998
1997
1996
1995
1994
1993
____
____
____
____
____
____
____
____
____
____
____
____
____
____
____
____
____
____
____
____
____
____
____
____
____
(in
thou
sand
s)

258
TR
AN
SPO
RTA
TIO
NSE
RV
ICE
S:T
rans
it A
utho
rity
. . .
. . .
. . .
.$
191,
146
$27
8,60
5$
269,
513
$34
1,93
1$
246,
497
$20
1,74
2$
218,
395
$15
0,21
0$
220,
919
$24
9,79
6D
epar
tmen
t of
Tra
nspo
rtat
ion
. . .
. . .
. . .
.72
3,58
657
7,07
263
7,04
663
5,53
158
8,92
153
6,96
255
3,82
444
4,32
242
2,86
734
0,61
2__
____
____
____
____
____
____
____
____
____
____
____
____
____
____
____
____
____
____
____
____
____
____
____
____
__To
tal T
rans
port
atio
nSe
rvic
es .
. . .
. . .
. . .
. .91
4,73
285
5,67
790
6,55
997
7,46
283
5,41
873
8,70
477
2,21
959
4,53
264
3,78
659
0,40
8__
____
____
____
____
____
____
____
____
____
____
____
____
____
____
____
____
____
____
____
____
____
____
____
____
__PA
RK
S,R
EC
RE
AT
ION
AN
D
CU
LTU
RA
LA
CT
IVIT
IES:
Dep
artm
ent o
f C
ultu
ral
Aff
airs
. . .
. . .
. . .
. . .
. . .
.15
7,60
089
,509
66,4
3753
,698
72,6
5344
,390
35,6
6643
,920
32,3
2840
,485
Dep
artm
ent o
f Pa
rks
and
Rec
reat
ion
. . .
. . .
. . .
. . .
.21
1,93
916
6,39
919
5,63
316
7,15
415
7,37
514
1,76
785
,814
96,6
9983
,457
89,6
00__
____
____
____
____
____
____
____
____
____
____
____
____
____
____
____
____
____
____
____
____
____
____
____
____
__To
tal P
arks
,Rec
reat
ion
and
Cul
tura
lA
ctiv
ities
. . .
. . .
. . .
. .
369,
539
255,
908
262,
070
220,
852
230,
028
186,
157
121,
480
140,
619
115,
785
130,
085
____
____
____
____
____
____
____
____
____
____
____
____
____
____
____
____
____
____
____
____
____
____
____
____
____
HO
USI
NG
:D
epar
tmen
t of
Hou
sing
Pres
erva
tion
and
Dev
elop
men
t .
. . .
. . .
. . .
.38
0,38
441
3,89
628
9,84
536
5,05
623
5,47
226
9,00
124
6,35
629
1,88
838
7,28
643
1,30
3__
____
____
____
____
____
____
____
____
____
____
____
____
____
____
____
____
____
____
____
____
____
____
____
____
__H
EA
LTH
:H
ealth
and
Hos
pita
lsC
orpo
ratio
n .
. . .
. . .
. . .
. .61
,597
34,2
4343
,145
18,7
2771
,019
82,5
0810
4,42
013
7,40
616
2,94
916
6,72
5D
epar
tmen
t of
Hea
lth .
. . .
. .49
,627
26,1
8332
,413
40,7
0814
,862
16,0
1116
,169
17,7
5623
,311
6,30
9__
____
____
____
____
____
____
____
____
____
____
____
____
____
____
____
____
____
____
____
____
____
____
____
____
__To
tal H
ealth
. . .
. . .
. . .
.11
1,22
460
,426
75,5
5859
,435
85,8
8198
,519
120,
589
155,
162
186,
260
173,
034
____
____
____
____
____
____
____
____
____
____
____
____
____
____
____
____
____
____
____
____
____
____
____
____
____
LIB
RA
RIE
S:R
esea
rch
Lib
rari
es .
. . .
. . .
. .18
,601
8070
22,
353
2,47
73,
086
8,41
86,
037
622
3,47
1N
ew Y
ork
Publ
ic L
ibra
ry .
. . .
4,15
68,
557
5,75
04,
348
4,48
57,
681
4,75
26,
972
2,70
86,
009
Bro
okly
n Pu
blic
Lib
rary
. . .
.7,
501
5,53
68,
941
8,92
58,
481
4,51
52,
299
2,79
32,
066
1,60
8Q
ueen
s B
orou
gh P
ublic
Lib
rary
. . .
. . .
. . .
. . .
. . .
.4,
384
2,66
65,
554
8,98
616
,342
19,3
147,
040
839
854
2,14
9__
____
____
____
____
____
____
____
____
____
____
____
____
____
____
____
____
____
____
____
____
____
____
____
____
__To
tal L
ibra
ries
. . .
. . .
. .
34,6
4216
,839
20,9
4724
,612
31,7
8534
,596
22,5
0916
,641
6,25
013
,237
____
____
____
____
____
____
____
____
____
____
____
____
____
____
____
____
____
____
____
____
____
____
____
____
____
OT
HE
R*
. . .
. . .
. . .
. . .
. . .
. . .
106,
188
161,
991
138,
351
210,
205
109,
359
59,0
4814
2,23
994
,442
42,6
1249
,581
____
____
____
____
____
____
____
____
____
____
____
____
____
____
____
____
____
____
____
____
____
____
____
____
____
Tota
l . .
. . .
. . .
. . .
. . .
. .
$6,3
20,1
02$5
,309
,954
$4,8
09,4
83$4
,840
,520
$4,1
51,3
85$3
,858
,578
$3,8
78,1
08$3
,741
,247
$3,3
42,7
82$3
,617
,042
____
____
____
____
____
____
____
____
____
____
____
____
____
____
____
____
____
____
____
____
____
____
____
____
____
____
____
____
____
____
____
____
____
____
____
____
____
____
____
____
____
____
____
____
____
____
____
____
____
____
*C
apit
aliz
ed le
ases
hav
e be
en r
ecor
ded
as a
n ex
pend
itur
e be
ginn
ing
in f
isca
l yea
r 19
95.
Com
ptro
ller’
s R
epor
t fo
r F
isca
l 200
2P
art
III—
Stat
isti
cal I
nfor
mat
ion
New
Yor
k C
ity
Cap
ital
Pro
ject
s F
und
Exp
endi
ture
s—Te
n Y
ear
Tre
nd (
Con
t.)
Fis
cal Y
ear
2002
2001
2000
1999
1998
1997
1996
1995
1994
1993
____
____
____
____
____
____
____
____
____
____
____
____
____
____
____
____
____
____
____
____
____
____
____
____
____
____
____
____
____
____
(in
thou
sand
s)
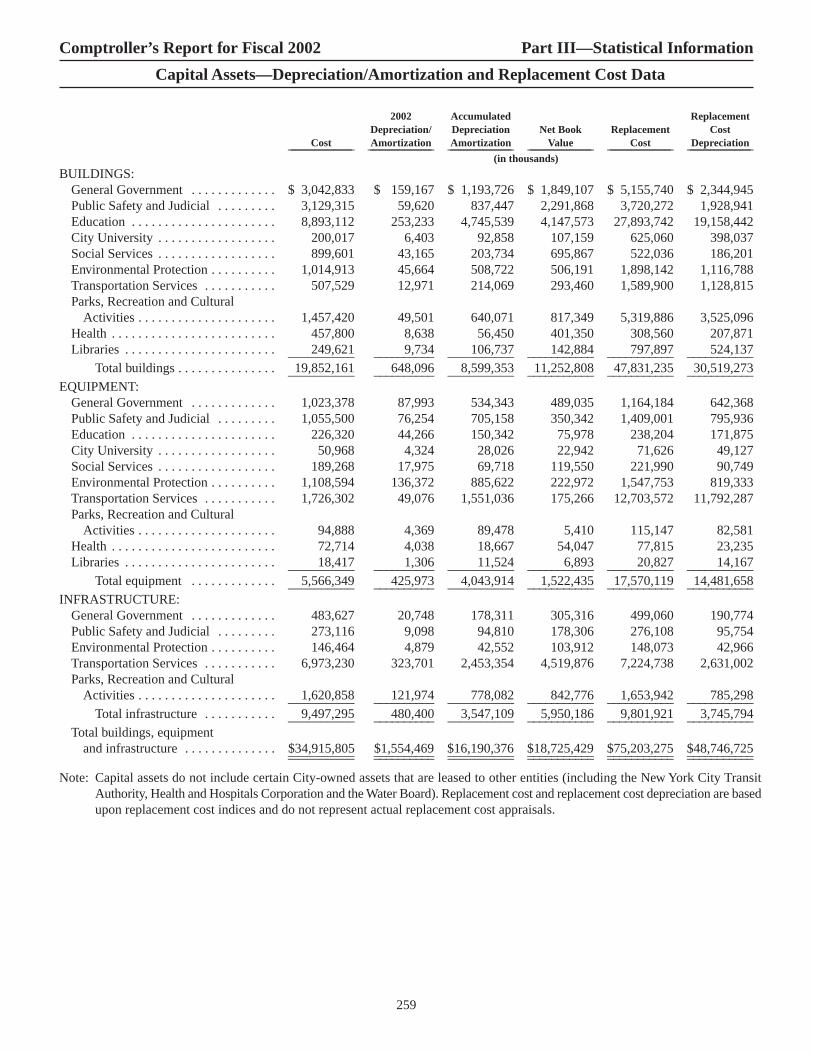
(in thousands)
BUILDINGS:General Government . . . . . . . . . . . . . $ 3,042,833 $ 159,167 $ 1,193,726 $ 1,849,107 $ 5,155,740 $ 2,344,945 Public Safety and Judicial . . . . . . . . . 3,129,315 59,620 837,447 2,291,868 3,720,272 1,928,941 Education . . . . . . . . . . . . . . . . . . . . . . 8,893,112 253,233 4,745,539 4,147,573 27,893,742 19,158,442 City University . . . . . . . . . . . . . . . . . . 200,017 6,403 92,858 107,159 625,060 398,037 Social Services . . . . . . . . . . . . . . . . . . 899,601 43,165 203,734 695,867 522,036 186,201 Environmental Protection . . . . . . . . . . 1,014,913 45,664 508,722 506,191 1,898,142 1,116,788 Transportation Services . . . . . . . . . . . 507,529 12,971 214,069 293,460 1,589,900 1,128,815 Parks, Recreation and Cultural
Activities . . . . . . . . . . . . . . . . . . . . . 1,457,420 49,501 640,071 817,349 5,319,886 3,525,096 Health . . . . . . . . . . . . . . . . . . . . . . . . . 457,800 8,638 56,450 401,350 308,560 207,871 Libraries . . . . . . . . . . . . . . . . . . . . . . . 249,621 9,734 106,737 142,884 797,897 524,137 __________ __________ __________ ___________ ___________ ___________
Total buildings . . . . . . . . . . . . . . . 19,852,161 648,096 8,599,353 11,252,808 47,831,235 30,519,273 __________ __________ __________ ___________ ___________ ___________EQUIPMENT:
General Government . . . . . . . . . . . . . 1,023,378 87,993 534,343 489,035 1,164,184 642,368 Public Safety and Judicial . . . . . . . . . 1,055,500 76,254 705,158 350,342 1,409,001 795,936 Education . . . . . . . . . . . . . . . . . . . . . . 226,320 44,266 150,342 75,978 238,204 171,875 City University . . . . . . . . . . . . . . . . . . 50,968 4,324 28,026 22,942 71,626 49,127 Social Services . . . . . . . . . . . . . . . . . . 189,268 17,975 69,718 119,550 221,990 90,749 Environmental Protection . . . . . . . . . . 1,108,594 136,372 885,622 222,972 1,547,753 819,333 Transportation Services . . . . . . . . . . . 1,726,302 49,076 1,551,036 175,266 12,703,572 11,792,287 Parks, Recreation and Cultural
Activities . . . . . . . . . . . . . . . . . . . . . 94,888 4,369 89,478 5,410 115,147 82,581 Health . . . . . . . . . . . . . . . . . . . . . . . . . 72,714 4,038 18,667 54,047 77,815 23,235 Libraries . . . . . . . . . . . . . . . . . . . . . . . 18,417 1,306 11,524 6,893 20,827 14,167 __________ __________ __________ ___________ ___________ ___________
Total equipment . . . . . . . . . . . . . 5,566,349 425,973 4,043,914 1,522,435 17,570,119 14,481,658 __________ __________ __________ ___________ ___________ ___________INFRASTRUCTURE:
General Government . . . . . . . . . . . . . 483,627 20,748 178,311 305,316 499,060 190,774 Public Safety and Judicial . . . . . . . . . 273,116 9,098 94,810 178,306 276,108 95,754 Environmental Protection . . . . . . . . . . 146,464 4,879 42,552 103,912 148,073 42,966 Transportation Services . . . . . . . . . . . 6,973,230 323,701 2,453,354 4,519,876 7,224,738 2,631,002Parks, Recreation and Cultural
Activities . . . . . . . . . . . . . . . . . . . . . 1,620,858 121,974 778,082 842,776 1,653,942 785,298__________ __________ __________ ___________ ___________ ___________Total infrastructure . . . . . . . . . . . 9,497,295 480,400 3,547,109 5,950,186 9,801,921 3,745,794__________ __________ __________ ___________ ___________ ___________
Total buildings, equipmentand infrastructure . . . . . . . . . . . . . . $34,915,805 $1,554,469 $16,190,376 $18,725,429 $75,203,275 $48,746,725 __________ __________ __________ ___________ ___________ _____________________ __________ __________ ___________ ___________ ___________
Note: Capital assets do not include certain City-owned assets that are leased to other entities (including the New York City TransitAuthority, Health and Hospitals Corporation and the Water Board). Replacement cost and replacement cost depreciation are basedupon replacement cost indices and do not represent actual replacement cost appraisals.
259
Comptroller’s Report for Fiscal 2002 Part III—Statistical Information
Capital Assets—Depreciation/Amortization and Replacement Cost Data
2002 Accumulated ReplacementDepreciation/ Depreciation Net Book Replacement Cost
Cost Amortization Amortization Value Cost Depreciation________________________ ________________________ ________________________ ________________________ ________________________ ________________________

(in thousands)REVENUE ANTICIPATION NOTES
October 23, 2001 April 12, 2002 169 3.0% $ — $1,500,000 $1,500,000 $ —
New York City Transitional Finance Authority
BOND ANTICIPATION NOTES
August 9, 2001 November 30, 2001 113 5.0% — $ 400,000 $ 400,000 $ —
August 9, 2001 November 30, 2001 113 4.0 — 200,000 200,000 —
November 14, 2001 November 13, 2002 364 2.75 — 600,000 — 600,000March 7, 2002 February 26, 2003 356 2.50 — 500,000 — 500,000March 7, 2002 February 26, 2003 356 3.0 — 100,000 — 100,000
RECOVERY NOTES
October 4, 2001 October 2, 2002 363 3.25% — $1,000,000 $ — $1,000,000
Trends in Short-term DebtThe City of New York
Issued_______________________________________________ OutstandingFiscal Private At FiscalYear Sales Public Sales Total Repaid Year-End______ __________ ___________ _____________ ___________ ___________
(in thousands)
1980 $150,000 $ 375,000 $ 525,000 $ 525,000 $ —1981 — 550,000 550,000 550,000 —1982 — 600,000 600,000 600,000 —1983 — 700,000 700,000 700,000 —1984 — 750,000 750,000 750,000 —1985 — 850,000 850,000 850,000 —1986 — 900,000 900,000 900,000 —1987 — 1,000,000 1,000,000 1,000,000 —1988 — 925,000 925,000 925,000 —1989 — 1,200,000 1,200,000 1,200,000 —1990 — 2,450,000 2,450,000 2,450,000 —1991 — 3,650,000 3,650,000 3,650,000 —1992 — 2,250,000 2,250,000 2,250,000 —1993 — 1,400,000 1,400,000 1,400,000 —1994 — 1,750,000 1,750,000 1,750,000 —1995 — 2,200,000 2,200,000 2,200,000 —1996 — 2,400,000 2,400,000 2,400,000 —1997 — 2,400,000 2,400,000 2,400,000 —1998 — 1,075,000 1,075,000 1,075,000 —1999 — 500,000 500,000 500,000 —2000 — 750,000 750,000 750,000 —2001 — 750,000 750,000 750,000 —2002 — 1,500,000 1,500,000 1,500,000 —New York City Transitional Finance Authority•
Issued_______________________________________________ OutstandingFiscal Private At FiscalYear Sales Public Sales Total Repaid Year-End______ __________ ___________ _____________ ___________ ___________
(in thousands)
1998 — — — — —1999 — — — — —2000 — 1,115,000 1,115,000 600,000 515,0002001 — 515,000 515,000 1,030,000 —2002 — 2,800,000 2,800,000 600,000 2,200,000
* NYCTFA—Date of inception October 1, 1997
260
Comptroller’s Report for Fiscal 2002 Part III—Statistical Information
Short-term DebtThe City of New York
Date of Period Amount AmountIssue or of Loan Rate of Outstanding OutstandingRenewal Date Payable Days Interest July 1, 2001 Issued Redeemed June 30, 2002_________ ____________ ________ ________ ___________ ___________ ___________ ____________
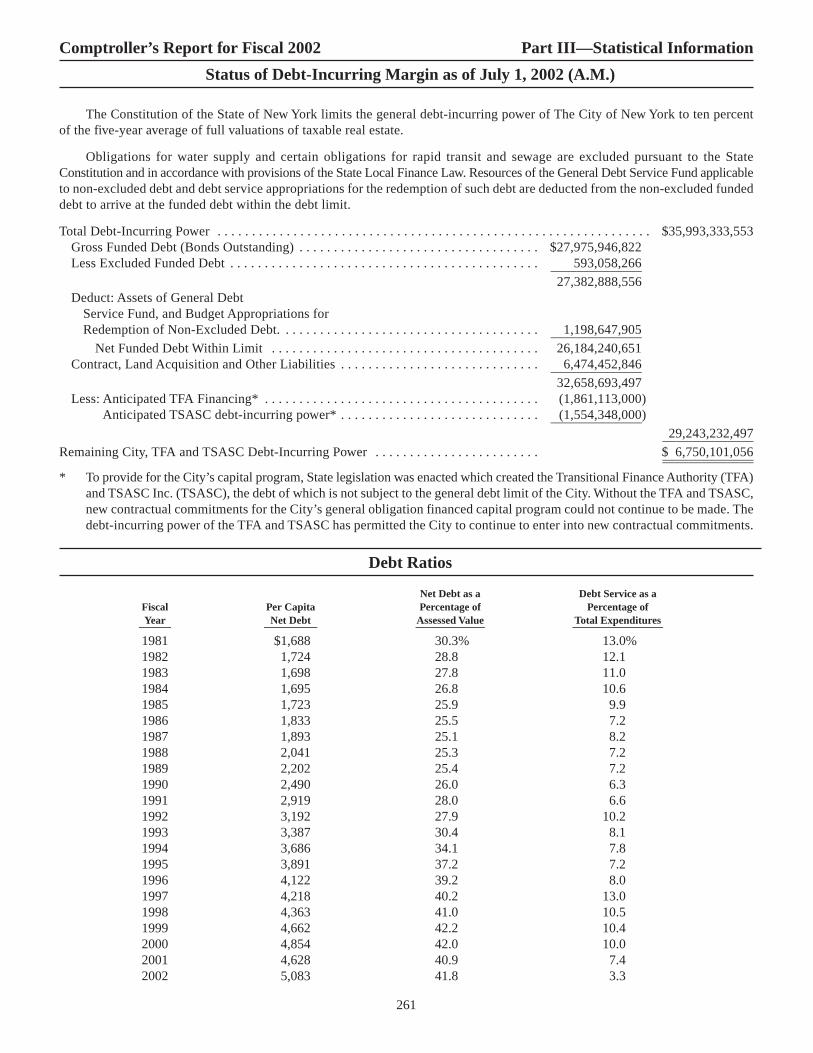
261
Comptroller’s Report for Fiscal 2002 Part III—Statistical Information
Status of Debt-Incurring Margin as of July 1, 2002 (A.M.)
The Constitution of the State of New York limits the general debt-incurring power of The City of New York to ten percentof the five-year average of full valuations of taxable real estate.
Obligations for water supply and certain obligations for rapid transit and sewage are excluded pursuant to the StateConstitution and in accordance with provisions of the State Local Finance Law. Resources of the General Debt Service Fund applicableto non-excluded debt and debt service appropriations for the redemption of such debt are deducted from the non-excluded fundeddebt to arrive at the funded debt within the debt limit.
Total Debt-Incurring Power . . . . . . . . . . . . . . . . . . . . . . . . . . . . . . . . . . . . . . . . . . . . . . . . . . . . . . . . . . . . . . . $35,993,333,553Gross Funded Debt (Bonds Outstanding) . . . . . . . . . . . . . . . . . . . . . . . . . . . . . . . . . . . $27,975,946,822Less Excluded Funded Debt . . . . . . . . . . . . . . . . . . . . . . . . . . . . . . . . . . . . . . . . . . . . . 593,058,266______________
27,382,888,556Deduct: Assets of General Debt
Service Fund, and Budget Appropriations forRedemption of Non-Excluded Debt. . . . . . . . . . . . . . . . . . . . . . . . . . . . . . . . . . . . . . 1,198,647,905______________
Net Funded Debt Within Limit . . . . . . . . . . . . . . . . . . . . . . . . . . . . . . . . . . . . . . . 26,184,240,651Contract, Land Acquisition and Other Liabilities . . . . . . . . . . . . . . . . . . . . . . . . . . . . . 6,474,452,846______________
32,658,693,497Less: Anticipated TFA Financing* . . . . . . . . . . . . . . . . . . . . . . . . . . . . . . . . . . . . . . . . (1,861,113,000)
Anticipated TSASC debt-incurring power* . . . . . . . . . . . . . . . . . . . . . . . . . . . . . (1,554,348,000)______________29,243,232,497______________
Remaining City, TFA and TSASC Debt-Incurring Power . . . . . . . . . . . . . . . . . . . . . . . . $ 6,750,101,056____________________________
* To provide for the City’s capital program, State legislation was enacted which created the Transitional Finance Authority (TFA)and TSASC Inc. (TSASC), the debt of which is not subject to the general debt limit of the City. Without the TFA and TSASC,new contractual commitments for the City’s general obligation financed capital program could not continue to be made. Thedebt-incurring power of the TFA and TSASC has permitted the City to continue to enter into new contractual commitments.
Debt Ratios
Net Debt as a Debt Service as aFiscal Per Capita Percentage of Percentage ofYear Net Debt Assessed Value Total Expenditures______ __________ _____________ _________________
1981 $1,688 30.3% 13.0%1982 1,724 28.8 12.11983 1,698 27.8 11.01984 1,695 26.8 10.61985 1,723 25.9 9.91986 1,833 25.5 7.21987 1,893 25.1 8.21988 2,041 25.3 7.21989 2,202 25.4 7.21990 2,490 26.0 6.31991 2,919 28.0 6.61992 3,192 27.9 10.21993 3,387 30.4 8.11994 3,686 34.1 7.81995 3,891 37.2 7.21996 4,122 39.2 8.01997 4,218 40.2 13.01998 4,363 41.0 10.51999 4,662 42.2 10.42000 4,854 42.0 10.02001 4,628 40.9 7.42002 5,083 41.8 3.3

262
Comptroller’s Report for Fiscal 2002 Part III—Statistical Information
Gross City Debt Outstanding at Fiscal Year-End
City Debt__________________General
Term Obligation Guaranteed MAC TFA TSASC SFC Capital Lease Gross TreasuryBonds Bonds Debt(1) Debt Debt Debt Debt Obligations(2) Debt Obligations(3) Total______ _________ __________ ______ ______ _______ ______ _____________ ________ _____________ ________
(in millions)
1979 . . . $865 $ 6,103 $171 $5,925 $ — $ — $ — $1,014 $14,078 $ (571) $13,5071980 . . . 475 5,704 159 6,116 — — — 953 13,407 (295) 13,1121981 . . . 310 5,584 73 6,770 — — — 925 13,662 (421) 13,2411982 . . . 372 5,937 65 7,371 — — — 871 14,616 (632) 13,9841983 . . . 462 6,036 63 7,655 — — — 733 14,949 (1,119) 13,8301984 . . . 515 6,508 61 7,910 — — — 841 15,835 (1,761) 14,0741985 . . . 890 6,465 59 8,130 — — — 827 16,371 (1,881) 14,4901986 . . . 745 7,699 57 8,157 — — — 809 17,467 (2,046) 15,4211987 . . . 431 8,667 54 8,370 — — — 809 18,331 (2,186) 16,1451988 . . . 389 9,694 52 7,819 — — — 909 18,863 (1,996) 16,8671989 . . . 375 11,037 50 7,537 — — — 989 19,988 (1,985) 18,0031990 . . . 119 13,380 47 7,122 — — — 942 21,610 (1,671) 19,9391991 . . . 80 16,732 44 6,705 — — — 1,052 24,613 (1,509) 23,1041992 . . . 80 19,412 42 5,857 — — — 1,040 26,431 (1,394) 25,0371993 . . . — 20,909 — 5,463 — — 200 1,052 27,624 (1,479) 26,1451994 . . . — 22,903 — 5,075 — — 200 1,461 29,639 (1,366) 28,2731995 . . . — 24,504 — 4,882 — — 200 1,487 31,073 (1,243) 29,8301996 . . . — 26,179 — 4,724 — — 200 1,598 32,701 (1,122) 31,5791997 . . . — 27,148 — 4,424 — — 200 1,682 33,454 (391) 33,0631998 . . . — 26,879 — 4,066 2,150 — 200 1,729 35,024 (365) 34,6591999 . . . — 27,441 — 3,832 4,150 — 160 2,112 37,695 (299) 37,3962000 . . . — 26,892 — 3,532 5,923(4) 709 120 2,374 39,550 (230) 39,3202001 . . . — 26,836 — 3,217 7,386 704 80 2,347 40,570 (168) 40,4022002 . . . — 28,465 — 2,880 8,289(5) 740 40 2,819 43,233 (116) 43,117
(1) Certain debt of the New York City Housing Authority is reported as a Discretely Presented Component Unit for fiscal year1993 and thereafter.
(2) Includes component units debt beginning in 1983 which had been capital lease obligations.
(3) Treasury obligations are notes and bonds payable which are held as investments of the Debt Service Funds.
(4) Excludes bond anticipation notes of $515 million reported in the Capital Projects Funds Combining Balance Sheet.
(5) Excludes bond anticipation notes of $2,200 million reported in the Capital Projects Funds Combining Balance Sheet.
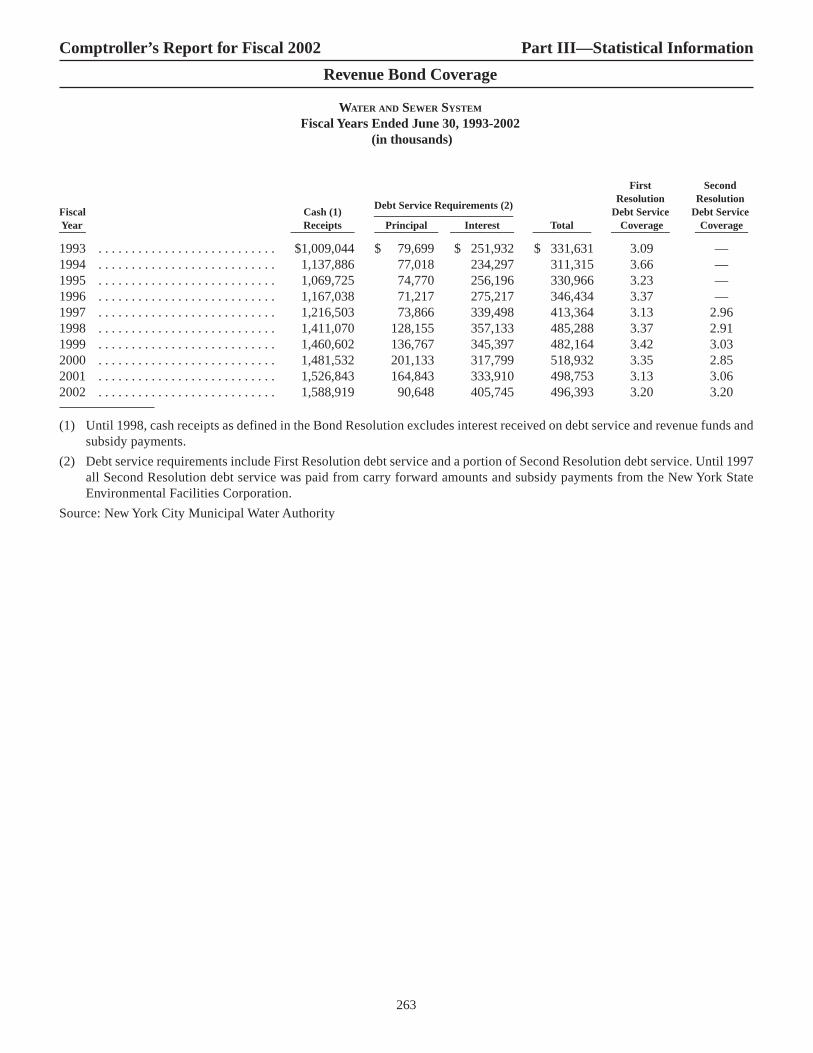
263
Comptroller’s Report for Fiscal 2002 Part III—Statistical Information
Revenue Bond Coverage
WATER AND SEWER SYSTEM
Fiscal Years Ended June 30, 1993-2002(in thousands)
First Second
Debt Service Requirements (2)Resolution Resolution
Fiscal Cash (1) ___________________________ Debt Service Debt ServiceYear Receipts Principal Interest Total Coverage Coverage_____ ____________ ____________ ____________ ___________ ___________ __________
1993 . . . . . . . . . . . . . . . . . . . . . . . . . . . $1,009,044 $ 79,699 $ 251,932 $ 331,631 3.09 —1994 . . . . . . . . . . . . . . . . . . . . . . . . . . . 1,137,886 77,018 234,297 311,315 3.66 —1995 . . . . . . . . . . . . . . . . . . . . . . . . . . . 1,069,725 74,770 256,196 330,966 3.23 —1996 . . . . . . . . . . . . . . . . . . . . . . . . . . . 1,167,038 71,217 275,217 346,434 3.37 —1997 . . . . . . . . . . . . . . . . . . . . . . . . . . . 1,216,503 73,866 339,498 413,364 3.13 2.961998 . . . . . . . . . . . . . . . . . . . . . . . . . . . 1,411,070 128,155 357,133 485,288 3.37 2.911999 . . . . . . . . . . . . . . . . . . . . . . . . . . . 1,460,602 136,767 345,397 482,164 3.42 3.032000 . . . . . . . . . . . . . . . . . . . . . . . . . . . 1,481,532 201,133 317,799 518,932 3.35 2.852001 . . . . . . . . . . . . . . . . . . . . . . . . . . . 1,526,843 164,843 333,910 498,753 3.13 3.062002 . . . . . . . . . . . . . . . . . . . . . . . . . . . 1,588,919 90,648 405,745 496,393 3.20 3.20
(1) Until 1998, cash receipts as defined in the Bond Resolution excludes interest received on debt service and revenue funds andsubsidy payments.
(2) Debt service requirements include First Resolution debt service and a portion of Second Resolution debt service. Until 1997all Second Resolution debt service was paid from carry forward amounts and subsidy payments from the New York StateEnvironmental Facilities Corporation.
Source: New York City Municipal Water Authority

264
Comptroller’s Report for Fiscal 2002 Part III—Statistical Information
Capital Leases
Annual FutureLandlord Expires Purpose Payment Obligation_________ _______ ________ ______________ ______________
180 Water Associate, LP . . . . . . . . . . . . . . . . . . . 2018 Office Space $8,470,368 $163,277,58057-115 Associates . . . . . . . . . . . . . . . . . . . . . . . . 2018 Office Space 6,273,820 105,251,9908-12 West 14th Street Associates, LLC. . . . . . . . . 2018 Office Space 2,240,000 39,658,677421 Tremont, LLC . . . . . . . . . . . . . . . . . . . . . . . . 2020 Office Space 1,535,398 33,827,171213 Duffield, LLC . . . . . . . . . . . . . . . . . . . . . . . . 2020 Office Space 1,498,325 30,906,633L S S Leasing Corp . . . . . . . . . . . . . . . . . . . . . . . 2011 Office Space 3,668,502 29,042,308Charles B Benenson . . . . . . . . . . . . . . . . . . . . . . . 2007 Office and Storage 3,188,578 13,631,541Web Food Products Inc . . . . . . . . . . . . . . . . . . . . 2012 Office Space 1,268,360 13,031,6096740 Company . . . . . . . . . . . . . . . . . . . . . . . . . . . 2019 Office and Job Center 607,225 12,012,387Gabriel Scavello . . . . . . . . . . . . . . . . . . . . . . . . . . 2015 School 799,700 10,976,313Rider Realty Co . . . . . . . . . . . . . . . . . . . . . . . . . . 2012 Income Support Center 930,000 10,276,500Kings County Corp . . . . . . . . . . . . . . . . . . . . . . . 2012 Office and Parking 950,000 9,589,063Harmit Realties, LLC . . . . . . . . . . . . . . . . . . . . . . 2015 School 612,000 9,399,000Tencha Associates . . . . . . . . . . . . . . . . . . . . . . . . 2020 Day Care Center 470,950 9,040,931Albern Realty . . . . . . . . . . . . . . . . . . . . . . . . . . . . 2013 Income Support Center 648,763 8,375,075JBS Associates . . . . . . . . . . . . . . . . . . . . . . . . . . . 2014 Day Care Center 650,414 8,256,504L.S.S. Group LLC . . . . . . . . . . . . . . . . . . . . . . . . 2016 Office Space 525,037 7,706,555Clinton Associates of Kings, Inc . . . . . . . . . . . . . 2010 School 929,000 7,493,833Kimaqu Corp . . . . . . . . . . . . . . . . . . . . . . . . . . . . 2013 Office Space 634,548 7,166,386350 Gerard Ave Corp . . . . . . . . . . . . . . . . . . . . . . 2011 School 819,464 6,806,100460 Atlantic Realty Corp . . . . . . . . . . . . . . . . . . . 2019 Day Care Center 290,507 5,824,156Church Avenue Realty . . . . . . . . . . . . . . . . . . . . . 2016 School 362,175 5,440,856Angiuli Buick, Inc . . . . . . . . . . . . . . . . . . . . . . . . 2010 Income Support Center 602,250 5,413,375147 Corp . . . . . . . . . . . . . . . . . . . . . . . . . . . . . . . . 2008 Office Space 1,008,732 5,312,648Prospect Avenue Property Corp . . . . . . . . . . . . . 2015 Day Care Center 365,841 4,826,659___________ ___________
25 Largest Leases Based on Future Obligations . . . . . . . . . . . . . . . . . . . . . . . . . . . . . . . 39,349,957 562,543,850116 Remaining Leases . . . . . . . . . . . . . . . . . . . . . . . . . . . . . . . . . . . . . . . . . . . . . . . . . . . 34,431,624 365,975,525___ ___________ ___________141 Total Capital Leases . . . . . . . . . . . . . . . . . . . . . . . . . . . . . . . . . . . . . . . . . . . . . . . . . $ 73,781,581 $928,519,375___ ___________ ______________ ___________ ___________
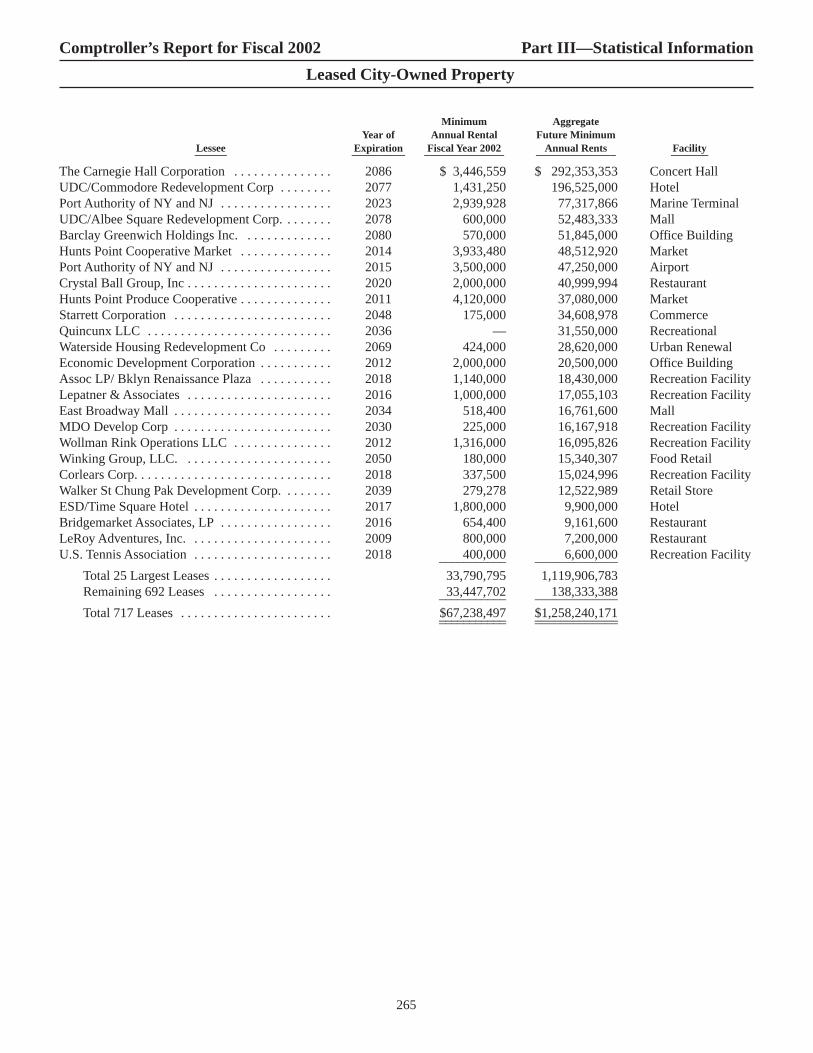
265
Comptroller’s Report for Fiscal 2002 Part III—Statistical Information
Leased City-Owned Property
Minimum AggregateYear of Annual Rental Future Minimum
Lessee Expiration Fiscal Year 2002 Annual Rents Facility______ __________ _______________ _______________ _______
The Carnegie Hall Corporation . . . . . . . . . . . . . . . 2086 $ 3,446,559 $ 292,353,353 Concert HallUDC/Commodore Redevelopment Corp . . . . . . . . 2077 1,431,250 196,525,000 HotelPort Authority of NY and NJ . . . . . . . . . . . . . . . . . 2023 2,939,928 77,317,866 Marine TerminalUDC/Albee Square Redevelopment Corp. . . . . . . . 2078 600,000 52,483,333 MallBarclay Greenwich Holdings Inc. . . . . . . . . . . . . . 2080 570,000 51,845,000 Office BuildingHunts Point Cooperative Market . . . . . . . . . . . . . . 2014 3,933,480 48,512,920 MarketPort Authority of NY and NJ . . . . . . . . . . . . . . . . . 2015 3,500,000 47,250,000 AirportCrystal Ball Group, Inc . . . . . . . . . . . . . . . . . . . . . . 2020 2,000,000 40,999,994 RestaurantHunts Point Produce Cooperative . . . . . . . . . . . . . . 2011 4,120,000 37,080,000 MarketStarrett Corporation . . . . . . . . . . . . . . . . . . . . . . . . 2048 175,000 34,608,978 CommerceQuincunx LLC . . . . . . . . . . . . . . . . . . . . . . . . . . . . 2036 — 31,550,000 RecreationalWaterside Housing Redevelopment Co . . . . . . . . . 2069 424,000 28,620,000 Urban RenewalEconomic Development Corporation . . . . . . . . . . . 2012 2,000,000 20,500,000 Office BuildingAssoc LP/ Bklyn Renaissance Plaza . . . . . . . . . . . 2018 1,140,000 18,430,000 Recreation FacilityLepatner & Associates . . . . . . . . . . . . . . . . . . . . . . 2016 1,000,000 17,055,103 Recreation FacilityEast Broadway Mall . . . . . . . . . . . . . . . . . . . . . . . . 2034 518,400 16,761,600 MallMDO Develop Corp . . . . . . . . . . . . . . . . . . . . . . . . 2030 225,000 16,167,918 Recreation FacilityWollman Rink Operations LLC . . . . . . . . . . . . . . . 2012 1,316,000 16,095,826 Recreation FacilityWinking Group, LLC. . . . . . . . . . . . . . . . . . . . . . . 2050 180,000 15,340,307 Food RetailCorlears Corp. . . . . . . . . . . . . . . . . . . . . . . . . . . . . . 2018 337,500 15,024,996 Recreation FacilityWalker St Chung Pak Development Corp. . . . . . . . 2039 279,278 12,522,989 Retail StoreESD/Time Square Hotel . . . . . . . . . . . . . . . . . . . . . 2017 1,800,000 9,900,000 HotelBridgemarket Associates, LP . . . . . . . . . . . . . . . . . 2016 654,400 9,161,600 RestaurantLeRoy Adventures, Inc. . . . . . . . . . . . . . . . . . . . . . 2009 800,000 7,200,000 RestaurantU.S. Tennis Association . . . . . . . . . . . . . . . . . . . . . 2018 400,000 6,600,000 Recreation Facility___________ _____________
Total 25 Largest Leases . . . . . . . . . . . . . . . . . . 33,790,795 1,119,906,783Remaining 692 Leases . . . . . . . . . . . . . . . . . . 33,447,702 138,333,388___________ _____________
Total 717 Leases . . . . . . . . . . . . . . . . . . . . . . . $67,238,497 $1,258,240,171___________ ________________________ _____________
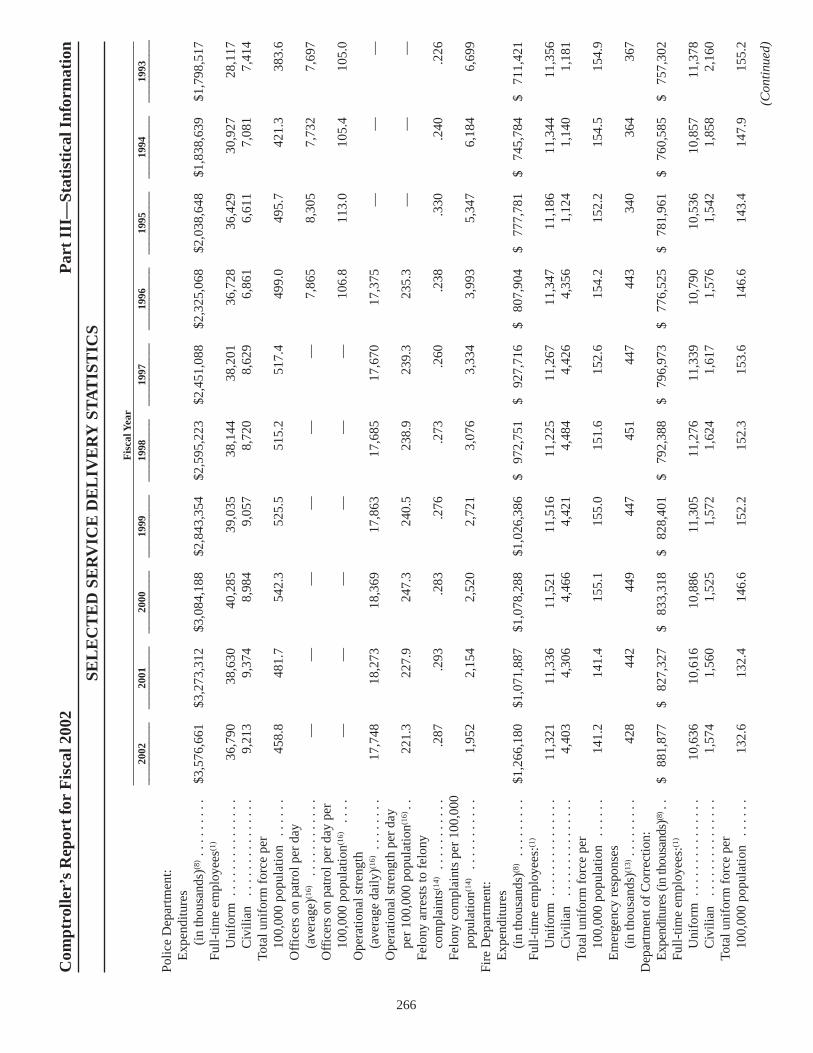
266
Polic
e D
epar
tmen
t:E
xpen
ditu
res
(in
thou
sand
s)(8
) . .
. . .
. . .
.$3
,576
,661
$3,2
73,3
12$3
,084
,188
$2,8
43,3
54$2
,595
,223
$2,4
51,0
88$2
,325
,068
$2,0
38,6
48$1
,838
,639
$1,7
98,5
17Fu
ll-tim
e em
ploy
ees(1
)
Uni
form
. . .
. . .
. . .
. . .
. . .
36,7
9038
,630
40,2
8539
,035
38,1
4438
,201
36,7
2836
,429
30,9
2728
,117
Civ
ilian
. .
. . .
. . .
. . .
. . .
.9,
213
9,37
48,
984
9,05
78,
720
8,62
96,
861
6,61
17,
081
7,41
4To
tal u
nifo
rm f
orce
per
10
0,00
0 po
pula
tion
. . .
. . .
458.
848
1.7
542.
352
5.5
515.
251
7.4
499.
049
5.7
421.
338
3.6
Off
icer
s on
pat
rol p
er d
ay(a
vera
ge)(1
6) .
. . .
. . .
. . .
. .—
——
——
—7,
865
8,30
57,
732
7,69
7O
ffic
ers
on p
atro
l per
day
per
100,
000
popu
latio
n(16)
. . .
.—
——
——
—10
6.8
113.
010
5.4
105.
0O
pera
tiona
l str
engt
h (a
vera
ge d
aily
)(16)
. . .
. . .
. .
17,7
4818
,273
18,3
6917
,863
17,6
8517
,670
17,3
75—
——
Ope
ratio
nal s
tren
gth
per
day
per
100,
000
popu
latio
n(16) .
.22
1.3
227.
924
7.3
240.
523
8.9
239.
323
5.3
——
—Fe
lony
arr
ests
to f
elon
yco
mpl
aint
s(14)
. . .
. . .
. . .
. .
.287
.293
.283
.276
.273
.260
.238
.330
.240
.226
Felo
ny c
ompl
aint
s pe
r 10
0,00
0po
pula
tion(1
4) .
. . .
. . .
. . .
.1,
952
2,15
42,
520
2,72
13,
076
3,33
43,
993
5,34
76,
184
6,69
9Fi
re D
epar
tmen
t:E
xpen
ditu
res
(in
thou
sand
s)(8
) .
. . .
. . .
. .$1
,266
,180
$1,0
71,8
87$1
,078
,288
$1,0
26,3
86$
972,
751
$ 92
7,71
6$
807,
904
$ 77
7,78
1$
745,
784
$ 71
1,42
1Fu
ll-tim
e em
ploy
ees:
(1)
Uni
form
. .
. . .
. . .
. . .
. . .
.11
,321
11,3
3611
,521
11,5
1611
,225
11,2
6711
,347
11,1
8611
,344
11,3
56C
ivili
an
. . .
. . .
. . .
. . .
. . .
4,40
34,
306
4,46
64,
421
4,48
44,
426
4,35
61,
124
1,14
01,
181
Tota
l uni
form
for
ce p
er
100,
000
popu
latio
n .
. . .
. .14
1.2
141.
415
5.1
155.
015
1.6
152.
615
4.2
152.
215
4.5
154.
9E
mer
genc
y re
spon
ses
(in
thou
sand
s)(1
3) .
. . .
. . .
. .42
844
244
944
745
144
744
334
036
436
7D
epar
tmen
t of
Cor
rect
ion:
Exp
endi
ture
s (i
n th
ousa
nds)
(8) .
.$
881,
877
$ 82
7,32
7$
833,
318
$ 82
8,40
1$
792,
388
$ 79
6,97
3$
776,
525
$ 78
1,96
1$
760,
585
$ 75
7,30
2Fu
ll-tim
e em
ploy
ees:
(1)
Uni
form
. .
. . .
. . .
. . .
. . .
.10
,636
10,6
1610
,886
11,3
0511
,276
11,3
3910
,790
10,5
3610
,857
11,3
78C
ivili
an
. . .
. . .
. . .
. . .
. . .
1,57
41,
560
1,52
51,
572
1,62
41,
617
1,57
61,
542
1,85
82,
160
Tota
l uni
form
for
ce p
er
100,
000
popu
latio
n .
. . .
. .13
2.6
132.
414
6.6
152.
215
2.3
153.
614
6.6
143.
414
7.9
155.
2
(Con
tinu
ed)
Com
ptro
ller’
s R
epor
t fo
r F
isca
l 200
2P
art
III—
Stat
isti
cal I
nfor
mat
ion
SEL
EC
TE
D S
ER
VIC
E D
EL
IVE
RY
ST
AT
IST
ICS
Fis
cal Y
ear
2002
2001
2000
1999
1998
1997
1996
1995
1994
1993
____
____
____
____
____
____
____
____
____
____
____
____
____
____
____
____
____
____
____
____
____
____
____
____
____
____
____
____
____
____

267
Dep
artm
ent o
f C
orre
ctio
n:(c
ont.)
Ave
rage
dai
ly p
riso
n po
pula
tion
13,9
3414
,490
15,5
3017
,562
17,5
2419
,205
18,3
2618
,869
18,0
9119
,345
Ave
rage
dai
ly p
riso
n po
pula
tion
to u
nifo
rm f
orce
. . .
. . .
. . .
1.31
1.36
1.43
1.55
1.55
1.69
1.70
1.79
1.67
1.70
Pris
on p
opul
atio
n as
a p
erce
nt
of c
apac
ity .
. . .
. . .
. . .
. . .
97%
98%
98%
99%
99%
100%
99%
99%
94%
94%
City
Uni
vers
ity:
Exp
endi
ture
s(i
n th
ousa
nds)
(6)(
8) .
. . .
. . .
.$
417,
838
$ 39
2,93
6$
383,
851
$ 37
6,94
3$
363,
997
$ 35
4,05
6$
347,
715
$ 34
8,07
4$
353,
076
$ 57
1,34
6Fu
ll-tim
e em
ploy
ees:
Peda
gogi
cal
. . .
. . .
. . .
. . .
2,25
32,
217
2,24
22,
247
2,21
42,
200
2,15
52,
182
2,56
22,
382
Reg
ular
. . .
. . .
. . .
. . .
. . .
.1,
542
1,54
61,
558
1,53
41,
506
1,49
01,
426
1,39
71,
509
1,30
0St
uden
t enr
ollm
ent:
Full-
time
. . .
. . .
. . .
. . .
. .
36,9
1237
,062
37,9
6337
,068
38,7
2240
,486
40,1
4041
,547
42,5
0339
,279
Part
-tim
e .
. . .
. . .
. . .
. . .
.26
,585
25,7
8024
,109
26,3
9725
,638
25,4
5125
,857
27,2
2129
,495
28,9
37D
egre
es g
rant
ed(3
) .
. . .
. . .
. .6,
561
6,80
56,
883
7,44
97,
347
7,58
76,
962
6,67
36,
804
6,89
2D
epar
tmen
t of
Soci
al S
ervi
ces:
Exp
endi
ture
s (i
n th
ousa
nds)
(8)
$5,9
28,3
26$5
,685
,674
$5,4
09,3
2317
$5,1
50,5
9017
$5,2
26,6
8717
$5,7
15,0
5317
$7,2
51,4
26$7
,434
,243
$7,2
80,8
54$7
,086
,634
Full-
time
empl
oyee
s .
. . .
. . .
12,3
4912
,624
13,1
5413
,123
13,6
4114
,269
21,2
3921
,218
22,9
6628
,810
Pers
ons
rece
ivin
g pu
blic
assi
stan
ce (
at J
une
30)
. . .
.42
5,40
049
7,10
057
2,80
067
5,50
076
3,30
088
0,10
01,
007,
900
1,11
9,40
01,
140,
600
1,08
9,00
0Pe
rson
s re
ceiv
ing
publ
icas
sist
ance
per
100
,000
popu
latio
n (a
t Jun
e 30
) .
. .5,
305
6,19
97,
711
9,09
410
,305
11,9
2113
,693
15,2
3115
,537
14,8
59D
epar
tmen
t of
Env
iron
men
tal
Prot
ectio
n:E
xpen
ditu
res
(in
thou
sand
s)(8
) . .
$61
6,62
0$
601,
354
$ 56
6,91
2$
533,
948
$ 59
1,57
1$
536,
257
$ 55
2,60
0$
519,
867
$ 49
2,18
1$
472,
285
Full-
time
empl
oyee
s(1) .
. . .
. .5,
430
5,41
45,
565
5,62
45,
498
5,49
75,
859
5,78
15,
695
5,85
4W
ater
mai
n br
eaks
. . .
. . .
. . .
494
523
592
551
456
595
574
476
652
561
Perc
ent c
apac
ity in
rese
rvoi
rs (
at J
une
30)(1
8) .
.88
.3%
95.2
%94
.9%
65.5
%95
.5%
91.9
%97
.7%
85.8
%94
.7%
88.4
%D
epar
tmen
t of
Sani
tatio
n:E
xpen
ditu
res
(in
thou
sand
s)(8
) . .
$ 98
3,12
6$
924,
311
$ 82
8,91
6$
704,
740
$ 70
8,50
9$
578,
316
$ 64
7,41
4$
600,
354
$ 66
3,69
0$
621,
506
Full-
time
empl
oyee
s:U
nifo
rm .
. . .
. . .
. . .
. . .
. .7,
821
7,94
47,
770
7,18
57,
088
6,90
57,
139
6,98
07,
587
7,66
3C
ivili
an .
. . .
. . .
. . .
. . .
. . .
2,21
32,
222
2,20
72,
215
2,23
72,
223
2,31
52,
497
2,76
43,
197
(Con
tinu
ed)
Com
ptro
ller’
s R
epor
t fo
r F
isca
l 200
2P
art
III—
Stat
isti
cal I
nfor
mat
ion
SEL
EC
TE
D S
ER
VIC
E D
EL
IVE
RY
ST
AT
IST
ICS
(Con
t.)
Fis
cal Y
ear
2002
2001
2000
1999
1998
1997
1996
1995
1994
1993
____
____
____
____
____
____
____
____
____
____
____
____
____
____
____
____
____
____
____
____
____
____
____
____
____
____
____
____
____
____

268
Dep
artm
ent o
f Sa
nita
tion:
(con
t.)To
ns o
f ga
rbag
e co
llect
ed(i
n th
ousa
nds)
. . .
. . .
. . .
. .
2,99
92,
975
2,99
93,
018
3,07
23,
177
3,14
93,
170
3,18
73,
338
Perc
ent o
f st
reet
s ra
ted
acce
ptab
ly c
lean
. . .
. . .
. . .
84.2
%85
.9%
86.7
%87
.2%
85.0
%83
.2%
73.2
%74
.6%
71.6
%74
.4%
Boa
rd o
f E
duca
tion:
Exp
endi
ture
s by
Uni
t of
App
ropr
iatio
n (i
nth
ousa
nds)
:(8)(
15)
Dis
tric
t Ins
truc
tion
and
Adm
inis
trat
ion
. . .
. . .
. .
$—
$—
$—
$ —
$—
$—
$—
$1,8
07,2
32$1
,708
,889
$1,6
67,6
13H
igh
Scho
ols
. . .
. . .
. . .
. .
——
——
——
—99
0,07
095
8,42
592
4,92
5Sp
ecia
l Edu
catio
n .
. . .
. . .
——
——
——
—1,
369,
920
1,27
4,45
71,
180,
597
Scho
ol F
acili
ties
. . .
. . .
. . .
——
——
——
—36
8,88
635
8,62
334
6,03
1C
entr
al A
dmin
istr
atio
n . .
. .
——
——
——
—15
1,58
915
9,27
116
4,70
7R
eim
burs
able
Pro
gram
s . .
.2,
250,
525
2,13
2,86
81,
863,
444
1,64
6,25
41,
499,
383
1,33
3,56
61,
295,
915
1,37
1,20
31,
273,
513
1,18
5,43
7E
nerg
y .
. . .
. . .
. . .
. . .
. . .
——
——
——
—10
9,21
010
6,92
210
2,58
2L
ease
s .
. . .
. . .
. . .
. . .
. . .
——
——
——
—29
,745
25,3
5019
,546
Frin
ge B
enef
its .
. . .
. . .
. . .
1,32
1,61
71,
306,
548
1,20
8,87
21,
099,
660
1,03
6,38
098
3,79
897
6,01
895
9,32
088
7,76
682
4,30
2C
olle
ctiv
e B
arga
inin
g .
. . .
402,
898
173,
995
——
——
——
——
Pupi
l Tra
nspo
rtat
ion
. . .
. . .
——
——
——
—42
5,43
451
0,61
548
9,36
5Sc
hool
Saf
ety
. . .
. . .
. . .
. .
123,
852
112,
150
89,4
9687
,644
80,8
0569
,563
73,7
1176
,767
77,1
7173
,906
Food
Ser
vice
s . .
. . .
. . .
. . .
333,
998
327,
465
300,
019
283,
878
267,
530
256,
242
226,
125
247,
587
259,
755
264,
180
Dis
tric
t Ins
truc
tion
and
Inst
ruct
ion
Supp
ort
Serv
ices
. . .
. . .
. . .
. . .
.2,
604,
828
2,62
1,68
72,
367,
101
2,14
1,12
71,
933,
237
1,72
6,92
21,
750,
851
——
—D
istr
ict S
peci
al E
duca
tion
Inst
ruct
ion
Serv
ices
. . .
.43
0,43
644
6,32
353
1,90
148
5,36
243
7,70
640
1,63
439
1,25
4—
——
Dis
tric
t Ope
ratio
ns a
ndA
dmin
istr
atio
n .
. . .
. . .
.12
3,08
722
1,85
920
8,55
518
7,67
417
0,32
412
4,08
412
3,13
6—
——
Hig
h Sc
hool
Ins
truc
tion
and
Inst
ruct
ion
Supp
ort
Serv
ices
. . .
. . .
. . .
. . .
.1,
045,
093
1,07
0,56
999
6,61
590
8,78
587
7,23
478
4,69
771
4,66
1—
——
Hig
h Sc
hool
Spe
cial
Edu
catio
n In
stru
ctio
nSe
rvic
es .
. . .
. . .
. . .
. . .
189,
626
197,
050
193,
209
179,
708
168,
184
156,
870
153,
063
——
—
(Con
tinu
ed)
Com
ptro
ller’
s R
epor
t fo
r F
isca
l 200
2P
art
III—
Stat
isti
cal I
nfor
mat
ion
SEL
EC
TE
D S
ER
VIC
E D
EL
IVE
RY
ST
AT
IST
ICS
(Con
t.)
Fis
cal Y
ear
2002
2001
2000
1999
1998
1997
1996
1995
1994
1993
____
____
____
____
____
____
____
____
____
____
____
____
____
____
____
____
____
____
____
____
____
____
____
____
____
____
____
____
____
____

269
Boa
rd o
f E
duca
tion:
(con
t.)E
xpen
ditu
res
by U
nit o
fA
ppro
pria
tion
(in
thou
sand
s):(
cont
.)H
igh
Scho
ol O
pera
tions
and
Adm
inis
trat
ion
. . .
. .
$12
4,42
5$
124,
734
$11
5,33
2$
106,
215
$ 95
,791
$ 75
,371
$ 72
,726
$—
$—
$—
Spec
ial E
duca
tion
City
wid
e In
stru
ctio
n an
dIn
stru
ctio
n Su
ppor
tSe
rvic
es .
. . .
. . .
. . .
. . .
. .41
7,05
541
1,52
740
7,87
638
0,81
433
6,60
030
8,48
929
8,89
7—
——
Div
isio
n of
Spe
cial
Edu
catio
nIn
stru
ctio
n Su
ppor
t Se
rvic
es .
. . .
. . .
. . .
. . .
. .31
5,58
529
8,17
627
5,02
025
5,46
725
3,08
823
6,86
322
5,66
6—
——
Div
isio
n of
Spe
cial
Edu
catio
nO
pera
tion
and
Adm
inis
trat
ion
. . .
. . .
. . .
.56
,833
41,4
9933
,952
30,0
2830
,907
30,0
0934
,653
——
—Sp
ecia
l Edu
catio
n,O
pera
tion,
and
Adm
inis
trat
ion—
City
-wid
e .
. . .
. . .
. . .
. . .
.27
,746
26,1
4439
,531
30,6
4325
,555
21,5
5921
,145
——
—Sc
hool
Fac
ilitie
s—C
usto
dial
Mai
nten
ance
. . .
. . .
. . .
. . .
484,
705
501,
868
661,
335
465,
332
387,
042
377,
623
371,
698
——
—Pu
pil T
rans
port
atio
n .
. . .
. . .
574,
165
546,
593
494,
926
460,
997
429,
907
397,
773
373,
685
——
—E
nerg
y an
d L
ease
s . .
. . .
. . .
.20
4,62
821
6,38
118
4,16
317
1,42
417
1,01
716
7,12
315
7,57
2—
——
Cen
tral
Adm
inis
trat
ion
. . .
. .
274,
542
276,
906
287,
678
222,
071
159,
917
120,
234
126,
899
——
—N
on-P
ublic
Sch
ool
Paym
ents
. . .
. . .
. . .
. . .
. .
577,
611
558,
260
497,
292
483,
314
550,
033
528,
537
502,
298
——
—__
____
____
____
____
____
____
____
____
____
___
____
___
____
____
___
____
___
____
____
___
____
___
____
____
_11
,883
,255
11,6
12,6
0210
,756
,317
9,62
6,39
78,
910,
640
8,10
0,95
77,
889,
973
7,90
6,96
37,
600,
757
7,24
3,19
1In
trac
ity S
ales
. . .
. . .
. . .
. . .
. .
(5,9
02)
(4,3
24)
(7,0
18)
(7,1
63)
(7,3
97)
(7,4
83)
(6,6
44)
(7,8
01)
(7,6
07)
(5,8
28)
____
____
____
____
____
____
____
____
____
___
____
____
___
____
___
____
____
___
____
___
____
____
___
____
___
Tota
l Boa
rd o
f E
duca
tion
. . .
. .
11,8
77,3
5311
,608
,278
10,7
49,2
999,
619,
234
8,90
3,24
38,
093,
474
7,88
3,32
97,
899,
162
7,59
3,15
07,
237,
363
Net
Cha
nge
in E
stim
ate
of P
rior
Pay
able
s .
. . .
. . .
. . .
(162
,339
)(6
3,15
9)(7
4,84
1)(1
40,8
82)
(90,
749)
(8,3
47)
(48,
327)
(36,
288)
(32,
161)
(24,
681)
____
____
____
____
____
____
____
____
____
___
____
____
___
____
___
____
____
___
____
___
____
____
___
____
___
Net
Tot
al B
oard
of
Edu
catio
n . .
. . .
. . .
. . .
. . .
. .
$11,
715,
014
$11,
545,
119
$10,
674,
458
$9,4
78,3
52$8
,812
,494
$8,0
85,1
27$7
,835
,002
$7,8
62,8
74$7
,560
,989
$7,2
12,6
82__
____
____
____
____
____
____
____
____
____
___
____
___
____
____
___
____
___
____
____
___
____
___
____
____
___
____
____
____
____
____
____
____
____
____
___
____
___
____
____
___
____
___
____
____
___
____
___
____
____
_
(Con
tinu
ed)
Com
ptro
ller’
s R
epor
t fo
r F
isca
l 200
2P
art
III—
Stat
isti
cal I
nfor
mat
ion
SEL
EC
TE
D S
ER
VIC
E D
EL
IVE
RY
ST
AT
IST
ICS
(Con
t.)
Fis
cal Y
ear
2002
2001
2000
1999
1998
1997
1996
1995
1994
1993
____
____
____
____
____
____
____
____
____
____
____
____
____
____
____
____
____
____
____
____
____
____
____
____
____
____
____
____
____
____

270
Boa
rd o
f E
duca
tion:
(con
t.)R
even
ues
(in
thou
sand
s):(8
)
Fede
ral G
rant
s .
. . .
. . .
. . .
. .$1
,388
,370
$1,2
26,5
06$1
,127
,539
$1,0
53,8
69$1
,013
,579
$ 93
1,57
1$
908,
482
$ 86
7,67
5$
884,
902
$ 86
8,70
8St
ate
Gra
nts
. . .
. . .
. . .
. . .
. .
5,65
1,24
95,
403,
986
4,86
7,33
64,
468,
658
4,15
5,08
93,
915,
129
3,75
3,87
73,
788,
300
3,40
2,42
33,
310,
443
Priv
ate
Gra
nts
. . .
. . .
. . .
. . .
36,8
9032
,801
55,7
6615
,681
14,2
9817
,996
18,0
6715
,812
12,3
0824
,773
Edu
catio
nal C
onst
ruct
ion
Fund
. . .
. . .
. . .
. . .
. . .
. . .
——
——
——
8,05
4—
3,08
92,
000
SCA
. . .
. . .
. . .
. . .
. . .
. . .
. .
14,0
1717
,769
9,50
517
,354
23,6
8217
,640
6,70
07,
500
13,8
93—
Dai
ryle
a M
ilk S
ettle
men
t .
. .—
—77
7178
6773
——
—N
on-R
esid
ent P
upil
Tui
tion
. .31
81,
100
1,70
264
91,
070
1,15
699
91,
500
4,51
8—
CU
NY
-Boa
rd o
f E
duca
tion
Part
ners
hip
. . .
. . .
. . .
. . .
.—
414
479
451
478
649
578
865
1,18
6—
Mis
cella
neou
s (f
ees,
rent
als,
etc.
) .
. . .
. . .
63,1
6069
,595
61,1
1254
,213
47,7
6435
,599
37,2
8139
,620
38,5
4532
,927
Net
Cha
nge
in E
stim
ate
of
Prio
r R
ecei
vabl
es .
. . .
. . .
.(8
2,53
8)(1
6,48
7)(3
8,20
1)(5
6,91
7)(2
1,74
6)(1
3,59
4)(2
9,59
2)(3
0,16
8)(2
5,56
6)39
7__
____
___
____
____
___
____
___
____
____
___
____
___
____
____
___
____
___
____
____
___
____
___
____
____
_To
tal
. . .
. . .
. . .
. . .
. . .
. . .
. .$7
,071
,466
$6,7
35,6
84$6
,085
,315
$5,5
54,0
29$5
,234
,292
$4,9
06,2
13$4
,704
,519
$4,6
91,1
04$4
,335
,298
$4,2
39,2
48__
____
___
____
____
___
____
___
____
____
___
____
___
____
____
___
____
___
____
____
___
____
___
____
____
___
____
___
____
____
___
____
___
____
____
___
____
___
____
____
___
____
___
____
____
___
____
___
____
____
_Fu
ll-tim
e em
ploy
ees(1
)
Peda
gogi
cal
. . .
. . .
. . .
. . .
. .94
,162
94,3
9792
,790
87,7
7485
,487
80,9
0678
,747
81,4
0980
,863
78,7
71R
egul
ar .
. . .
. . .
. . .
. . .
. . .
.8,
158
8,18
67,
958
9,27
38,
121
7,65
98,
829
7,57
47,
776
8,21
0Pu
pil E
nrol
lmen
t:E
lem
enta
ry a
nd I
nter
med
iate
73
6,07
173
7,11
873
3,16
772
0,19
070
7,33
470
1,77
769
2,56
067
7,77
366
3,62
165
2,73
3Sp
ecia
l Edu
catio
n .
. . .
. . .
. .81
,446
84,6
2584
,108
85,9
8884
,038
81,1
7178
,312
75,8
4774
,633
73,1
55H
igh
Scho
ol .
. . .
. . .
. . .
. . .
.27
9,71
228
1,50
228
2,16
228
6,03
529
1,68
629
1,38
228
5,20
227
9,52
227
7,50
226
8,64
3Pu
pil e
nrol
lmen
t to
peda
gogi
cal e
mpl
oyee
s .
. . .
.11
.611
.211
.512
.212
.513
.113
.412
.712
.612
.6R
egul
ar p
upil
enro
llmen
t(4) .
. . .
1,05
3,85
51,
064,
206
1,06
5,67
51,
068,
611
1,06
9,71
21,
061,
975
1,04
4,17
11,
021,
281
1,00
4,25
098
3,20
0A
vera
ge d
aily
atte
ndan
ce(4
)(5)
. . .
.92
6,23
292
4,62
292
7,17
992
9,24
492
7,36
391
2,98
788
4,14
286
7,67
483
8,88
082
3,99
5A
vera
ge d
aily
atte
ndan
ceto
reg
ular
pup
il en
rollm
ent
. .
.879
.869
.870
.870
.867
.860
.847
.850
.835
.838
Perc
ent o
f pu
pils
mee
ting
and
exce
edin
g st
anda
rds
inE
nglis
h la
ngua
ge A
rts(2
)
Gra
de 3
. . .
. . .
. . .
. . .
. .
44.1
%42
.1%
42.2
%40
.5%
51.7
%63
.8%
42.5
%34
.7%
37.6
%38
.0%
Gra
de 8
. . .
. . .
. . .
. . .
. .
29.6
%34
.7%
35.8
%26
.6%
46.9
%45
.2%
40.0
%49
.6%
50.7
%51
.2%
(Con
tinu
ed)
Com
ptro
ller’
s R
epor
t fo
r F
isca
l 200
2P
art
III—
Stat
isti
cal I
nfor
mat
ion
SEL
EC
TE
D S
ER
VIC
E D
EL
IVE
RY
ST
AT
IST
ICS
(Con
t.)
Fis
cal Y
ear
2002
2001
2000
1999
1998
1997
1996
1995
1994
1993
____
____
____
____
____
____
____
____
____
____
____
____
____
____
____
____
____
____
____
____
____
____
____
____
____
____
____
____
____
____

271
Dis
cret
ely
Pres
ente
dC
ompo
nent
Uni
ts:
Hea
lth a
nd H
ospi
tals
Cor
pora
tion:
(12)
Tota
l ope
ratin
g ex
pens
es
(in
thou
sand
s)(8
)(10
) .
. . .
. . .
$4,5
59,2
61$4
,392
,789
$4,0
78,5
43$3
,952
,516
$4,0
20,5
06$3
,953
,936
$4,2
35,1
49$4
,191
,519
$3,9
91,9
91$3
,664
,190
Full-
time
empl
oyee
s .
. . .
. . .
37,6
6634
,524
35,0
3935
,297
35,6
9837
,735
38,8
9843
,915
49,0
7249
,072
Bill
able
inpa
tient
day
s (i
n th
ousa
nds)
(9)
. . .
. . .
. . .
2,44
62,
484
2,49
32,
506
2,58
02,
664
2,86
83,
131
3,29
63,
343
Bill
able
out
patie
nt d
ay v
isits
an
d em
erge
ncy
room
vis
its
(in
thou
sand
s) .
. . .
. . .
. . .
.5,
832
5,70
35,
679
5,54
05,
700
5,69
95,
656
5,69
75,
549
5,30
5O
ff-T
rack
Bet
ting
Cor
pora
tion:
(12)
Tota
l ope
ratin
g ex
pens
es(i
n th
ousa
nds)
(8)(
11)
. . .
. . .
.$
251,
092
$ 25
7,85
3$
217,
839
$ 20
4,05
4$
197,
738
$ 19
1,85
3$
188,
059
$ 17
3,81
9$
164,
347
$ 16
8,61
7Fu
ll-tim
e em
ploy
ee(7
) . .
. . .
. .92
995
999
496
389
387
589
788
694
31,
057
Han
dle
(in
thou
sand
s)(7
) . .
. . .
$1,0
27,0
22$1
,019
,296
$1,0
05,3
12$
939,
893
$ 93
3,69
4$
908,
445
$ 86
8,85
6$
821,
247
$ 74
2,45
6$
811,
432
Tota
l ope
ratin
g re
venu
es
(in
thou
sand
s)(8
) .
. . .
. . .
. .$
251,
016
$ 25
1,35
1$
243,
874
$ 22
8,74
1$
226,
350
$ 22
0,46
9$
212,
098
$ 19
7,95
2$
178,
023
$ 19
3,28
6D
istr
ibut
ion
to P
rim
ary
Gov
ernm
ent
(in
thou
sand
s)(8
) .
. . .
. . .
. .$
33,0
00$
34,4
00$
29,6
77$
31,1
64$
31,1
67$
30,5
06$
25,8
11$
27,5
60$
24,0
73$
28,7
96
Not
es:
(1)
“The
May
or’s
Man
agem
ent R
epor
t Fis
cal 2
002”
and
“MM
R S
uppl
emen
tal I
ndic
ator
Tab
les”
.(2
)B
oard
of
Edu
catio
n sc
ores
for
199
3 to
199
5 ar
e fr
om th
e D
egre
es o
f R
eadi
ng P
ower
(D
RP)
test
. In
fisc
al y
ear
1996
,the
Boa
rd in
trod
uced
a n
ew r
eadi
ng te
st,t
he C
alif
orni
a A
chie
vem
ent T
est.
In F
Y 2
000,
indi
cato
rs th
at r
efle
ct s
tude
nt a
chie
vem
ent a
t gra
de le
vel w
ere
repl
aced
by
pupi
l pro
fici
ency
ach
ieve
men
t. FY
199
9 re
flec
ts th
is c
hang
e. P
rior
to 2
001,
this
sta
tistic
was
iden
tifie
d as
“Pe
rcen
t of
pupi
ls a
t or
abov
e gr
ade
read
ing
leve
l.”(3
)C
UN
Y.
(4)
Per
Boa
rd o
f E
duca
tion.
Exc
lude
s pr
e-ki
nder
gart
en a
nd p
ostg
radu
ate
pupi
ls. I
nclu
des
hom
e in
stru
ctio
n pu
pils
.(5
)Pe
r B
oard
of
Edu
catio
n’s
annu
al S
tate
net
sup
port
aid
cla
ims.
Fis
cal y
ear
2001
ave
rage
dai
ly a
ttend
ance
is e
stim
ated
.(6
)T
he f
igur
es f
or 1
993
incl
ude
Seni
or C
olle
ge e
xpen
ditu
res.
(7)
OT
B.
(8)
Com
ptro
ller’
s A
nnua
l Rep
orts
.(9
)H
HC
. Bill
able
inpa
tient
day
s in
clud
e ne
wbo
rn d
ays.
(10)
Dat
a fo
r 19
93 to
200
2 in
clud
e Pr
ovis
ion
for
Bad
Deb
ts.
(11)
Incl
ude
man
date
d di
stri
butio
ns.
(12)
Rep
orte
d as
Ent
erpr
ise
Fund
s pr
ior
to 1
994.
(13)
Sinc
e FY
199
4,m
edic
al e
mer
genc
ies
have
bee
n in
clud
ed in
this
num
ber.
(14)
The
met
hodo
logy
for
com
putin
g fe
lony
com
plai
nts
and
arre
sts
has
diff
ered
sin
ce f
isca
l yea
r 19
96 in
cou
ntin
g on
ly c
ompl
aint
s an
d ar
rest
s in
the
seve
n m
ajor
fel
ony
cate
gori
es.
(15)
In f
isca
l yea
r 19
96,O
MB
rec
lass
ifie
d B
oard
of
Edu
catio
n ex
pend
iture
s an
d tr
ansf
ers
in n
ew U
nits
of A
ppro
pria
tion.
The
refo
re,d
ata
afte
r fi
scal
yea
r 19
95 a
re n
ot c
ompa
rabl
e to
pri
or y
ears
.(1
6)T
he P
olic
e D
epar
tmen
t sta
rted
usi
ng O
pera
tiona
l Str
engt
h as
the
indi
cato
r to
mea
sure
pol
ice
pres
ence
in f
isca
l yea
r 19
97. I
t inc
lude
s un
ifor
med
per
sonn
el o
f al
l ran
ks p
erfo
rmin
g pa
trol
or
enfo
rcem
ent
func
tions
,or
othe
r op
erat
iona
l dut
ies
that
req
uire
uni
form
ed e
xper
tise;
it in
clud
es p
erso
nnel
ass
igne
d to
the
Det
ectiv
e,In
tern
al A
ffai
rs,P
atro
l Ser
vice
s,O
rgan
ized
Cri
me
Con
trol
,Tra
nsit,
and
Hou
sing
Polic
e bu
reau
s.(1
7)In
Jan
uary
199
9 th
e ag
ency
beg
an u
tiliz
ing
an u
ndup
licat
ed c
ount
of
publ
ic a
ssis
tanc
e re
cipi
ents
.(1
8)FY
199
8 th
roug
h FY
200
0,fi
gure
is a
t Aug
ust 3
1.
Sour
ce:U
nles
s ot
herw
ise
indi
cate
d,al
l dat
a ar
e fr
om th
e M
ayor
’s O
ffic
e of
Ope
ratio
ns.
Com
ptro
ller’
s R
epor
t fo
r F
isca
l 200
2P
art
III—
Stat
isti
cal I
nfor
mat
ion
SEL
EC
TE
D S
ER
VIC
E D
EL
IVE
RY
ST
AT
IST
ICS
(Con
t.)
Fis
cal Y
ear
2002
2001
2000
1999
1998
1997
1996
1995
1994
1993
____
____
____
____
____
____
____
____
____
____
____
____
____
____
____
____
____
____
____
____
____
____
____
____
____
____
____
____
____
____

272
Comptroller’s Report for Fiscal 2002 Part III—Statistical Information
Demographic, Financial & Other Trends
POPULATION
Year Population 1980=100 Year Population 1980=100____ ___________ _________ ____ __________ _________
1960 . . . . . . . . . . . . . . 7,781,984 110.0 1990 . . . . . . . . . . . . . . 7,322,564 103.51970 . . . . . . . . . . . . . . 7,895,563 111.7 1991 . . . . . . . . . . . . . . 7,304,481 103.31980 . . . . . . . . . . . . . . 7,071,639 100.0 1992 . . . . . . . . . . . . . . 7,304,895 103.31981 . . . . . . . . . . . . . . 7,077,279 100.1 1993 . . . . . . . . . . . . . . 7,329,079 103.61982 . . . . . . . . . . . . . . 7,088,350 100.2 1994 . . . . . . . . . . . . . . 7,341,300 103.81983 . . . . . . . . . . . . . . 7,150,150 101.1 1995 . . . . . . . . . . . . . . 7,349,560 103.91984 . . . . . . . . . . . . . . 7,198,277 101.8 1996 . . . . . . . . . . . . . . 7,360,622 104.11985 . . . . . . . . . . . . . . 7,232,780 102.3 1997 . . . . . . . . . . . . . . 7,382,901 104.41986 . . . . . . . . . . . . . . 7,276,928 102.9 1998 . . . . . . . . . . . . . . 7,404,140 104.71987 . . . . . . . . . . . . . . 7,292,432 103.1 1999 . . . . . . . . . . . . . . 7,428,162 105.01988 . . . . . . . . . . . . . . 7,289,880 103.1 2000 . . . . . . . . . . . . . . 8,008,278 113.21989 . . . . . . . . . . . . . . 7,313,757 103.4 2001 . . . . . . . . . . . . . . 8,019,033 113.3
Sources: U.S. Department of Commerce, Bureau of the Census and The City of New York, Department of City Planning.
POPULATION OF NEW YORK CITY BY BOROUGH
2001 2000 1990 1980 1970 1960_______ _______ _______ _______ _______ _______
Bronx . . . . . . . . . . . . . . . . . . . . . . . . . . . 1,337,928 1,332,650 1,203,789 1,168,972 1,471,701 1,424,815Brooklyn . . . . . . . . . . . . . . . . . . . . . . . . 2,465,286 2,465,326 2,300,664 2,230,936 2,602,012 2,627,319Manhattan . . . . . . . . . . . . . . . . . . . . . . . 1,541,150 1,537,195 1,487,536 1,428,285 1,539,233 1,698,281Queens . . . . . . . . . . . . . . . . . . . . . . . . . . 2,224,516 2,229,379 1,951,598 1,891,325 1,987,174 1,809,578Staten Island . . . . . . . . . . . . . . . . . . . . . . 450,153 443,728 378,977 352,121 295,443 221,991
Total . . . . . . . . . . . . . . . . . . . . . . . . . . . 8,019,033 8,008,278 7,322,564 7,071,639 7,895,563 7,781,984
Percentage Increase (Decrease) fromPrior Decade . . . . . . . . . . . . . . . . . . . . 0.1% 9.4% 3.5% (10.4%) 1.5% (1.4%)
Sources: U.S. Department of Commerce, Bureau of the Census and The City of New York, Department of City Planning.

Comptroller’s Report for Fiscal 2002 Part III—Statistical Information
Demographic, Financial & Other Trends (Cont.)
DISTRIBUTION OF POPULATION BY AGE
(in thousands)
2000 1990 1980 1970 1960____________ ____________ ____________ ____________ _____________% of % of % of % of % of
Age (in years) Total Total Total Total Total_____________ ____ ____ ____ ____ ____
Under 5 . . . . . . . . . . . . . . . . . . . . . . . . . 541 6.8 510 7.0 471 6.7 616 7.8 687 8.85 to 19 . . . . . . . . . . . . . . . . . . . . . . . . . . 1,612 20.0 1,378 18.8 1,517 21.4 1,858 23.5 1,658 21.320 to 24 . . . . . . . . . . . . . . . . . . . . . . . . . 590 7.4 577 7.9 604 8.5 650 8.3 483 6.225 to 34 . . . . . . . . . . . . . . . . . . . . . . . . . 1,368 17.1 1,369 18.7 1,203 17.0 1,076 13.6 1,056 13.635 to 44 . . . . . . . . . . . . . . . . . . . . . . . . . 1,263 15.8 1,117 15.2 834 11.8 916 11.6 1,071 13.845 to 64 . . . . . . . . . . . . . . . . . . . . . . . . . 1,696 21.2 1,419 19.4 1,491 21.1 1,832 23.2 2,013 25.965 and over . . . . . . . . . . . . . . . . . . . . . . . 938 11.7 953 13.0 952 13.5 948 12.0 814 10.4
Sources: U.S. Department of Commerce, Bureau of the Census and The City of New York, Department of City Planning.
273

274
Com
ptro
ller’
s R
epor
t fo
r F
isca
l 200
2P
art
III—
Stat
isti
cal I
nfor
mat
ion
Dem
ogra
phic
,Fin
anci
al &
Oth
er T
rend
s (C
ont.
)
PE
RSO
NA
LIN
CO
ME
1991
-200
0P
erso
nal I
ncom
e in
Per
sona
l Inc
ome
inP
er C
apit
aC
urre
nt D
olla
rsC
onst
ant
Dol
lars
Per
sona
l Inc
ome
(in
mill
ions
)(i
n m
illio
ns)
in C
urre
nt D
olla
rs__
____
____
____
____
____
____
____
____
____
____
____
____
____
____
____
____
____
____
____
____
____
____
____
_P
erce
ntag
eP
erce
ntag
e In
crea
seP
erce
ntag
eIn
crea
seC
onsu
mer
(Dec
reas
e) f
rom
Incr
ease
from
Pri
ceP
rior
Yea
r(D
ecre
ase)
____
____
____
____
____
____
_P
rior
Inde
x(a)
New
Yor
k U
nite
dfr
om P
rior
Yea
rA
mou
ntY
ear
(198
2-84
=100
.0)
Am
ount
Cit
ySt
ates
Am
ount
Yea
r__
___
____
____
___
____
____
____
____
____
____
____
___
____
____
____
____
___
____
____
____
___
1991
. . .
. . .
. . .
. . .
. . .
. . .
. . .
. . .
. . .
. .
186,
824
2.5
144.
812
9,02
2(2
.0)
(0.5
)25
,577
2.7
1992
. . .
. . .
. . .
. . .
. . .
. . .
. . .
. . .
. . .
. .
199,
652
6.9
150.
013
3,10
13.
23.
027
,331
6.9
1993
. . .
. . .
. . .
. . .
. . .
. . .
. . .
. . .
. . .
. .
202,
851
1.6
154.
513
1,29
5(1
.4)
1.1
27,6
771.
319
94 .
. . .
. . .
. . .
. . .
. . .
. . .
. . .
. . .
. . .
.20
8,60
82.
815
8.2
131,
863
0.4
2.4
28,4
162.
719
95 .
. . .
. . .
. . .
. . .
. . .
. . .
. . .
. . .
. . .
.22
1,89
96.
416
2.2
136,
806
3.7
2.4
30,1
926.
319
96 .
. . .
. . .
. . .
. . .
. . .
. . .
. . .
. . .
. . .
.23
6,61
96.
616
6.9
141,
773
3.6
2.6
32,1
476.
519
97 .
. . .
. . .
. . .
. . .
. . .
. . .
. . .
. . .
. . .
.24
5,31
73.
717
0.8
143,
628
1.3
3.6
33,2
283.
419
98 .
. . .
. . .
. . .
. . .
. . .
. . .
. . .
. . .
. . .
.26
3,63
47.
517
3.6
151,
863
5.7
5.4
35,6
067.
219
99 .
. . .
. . .
. . .
. . .
. . .
. . .
. . .
. . .
. . .
.27
6,58
44.
917
7.0
156,
263
2.9
2.5
37,2
344.
620
00 .
. . .
. . .
. . .
. . .
. . .
. . .
. . .
. . .
. . .
.30
0,83
58.
818
2.5
164,
841
5.5
3.5
37,5
650.
9
(a)
The
Con
sum
er P
rice
Ind
ex (
CP
I) m
easu
res
the
aver
age
chan
ge in
pri
ces
over
tim
e fo
r a
fixe
d m
arke
t bas
ket o
f go
ods
and
serv
ices
. Thi
s ta
ble
util
izes
the
CP
I fo
r All
Urb
anC
onsu
mer
s (C
PI-U
),w
hich
rep
rese
nts
the
spen
ding
hab
its o
f 80
per
cent
of
the
popu
latio
n of
the
Uni
ted
Stat
es. T
he C
PI-U
incl
udes
wag
e ea
rner
s an
d cl
eric
al w
orke
rs,a
ndgr
oups
suc
h as
pro
fess
iona
l,m
anag
eria
l,an
d te
chni
cal w
orke
rs,s
hort
-ter
m a
nd s
elf-
empl
oyed
wor
kers
,une
mpl
oyed
per
sons
,ret
iree
s,an
d ot
hers
not
in th
e la
bor
forc
e. N
otco
vere
d by
the
CPI
-U a
re p
erso
ns li
ving
in r
ural
are
as,m
embe
rs o
f th
e ar
med
ser
vice
s,an
d pe
rson
s in
inst
itutio
ns.
Not
es:T
he p
erso
nal i
ncom
e of
an
area
is d
efin
ed a
s th
e in
com
e th
at is
rec
eive
d by
,or
on b
ehal
f of
,all
the
indi
vidu
als
who
live
in th
e ar
ea. P
erso
nal i
ncom
e co
nsis
ts o
f th
e in
com
eth
at is
rec
eive
d by
per
sons
fro
m p
artic
ipat
ion
in p
rodu
ctio
n,fr
om b
oth
gove
rnm
ent a
nd b
usin
ess
tran
sfer
pay
men
ts,a
nd f
rom
gov
ernm
ent i
nter
est (
whi
ch is
trea
ted
like
atr
ansf
er p
aym
ent)
. It i
s ca
lcul
ated
as
the
sum
of
wag
e an
d sa
lary
dis
burs
emen
ts,o
ther
labo
r in
com
e,pr
opri
etor
s’in
com
e w
ith in
vent
ory
valu
atio
n an
d ca
pita
l con
sum
ptio
nad
just
men
ts,r
enta
l inc
ome
of p
erso
ns w
ith c
apita
l con
sum
ptio
n ad
just
men
t,pe
rson
al d
ivid
end
inco
me,
pers
onal
inte
rest
inco
me,
and
tran
sfer
pay
men
ts to
per
sons
,les
s pe
rson
alco
ntri
butio
ns f
or s
ocia
l ins
uran
ce.
Per
capi
ta p
erso
nal i
ncom
e is
cal
cula
ted
as th
e to
tal p
erso
nal i
ncom
e of
the
resi
dent
s of
an
area
div
ided
by
the
popu
latio
n of
the
area
.Pe
rson
s is
def
ined
as
indi
vidu
als
and
quas
i-in
divi
dual
s th
at s
erve
indi
vidu
als
or th
at a
ct o
n be
half
of i
ndiv
idua
ls. Q
uasi
-ind
ivid
uals
con
sist
s of
non
prof
it in
stitu
tions
that
pri
mar
ilyse
rve
indi
vidu
als,
priv
ate
noni
nsur
ed w
elfa
re f
unds
,and
pri
vate
trus
t fun
ds.
Sour
ces:
U.S
. Dep
artm
ent o
f C
omm
erce
,Bur
eau
of E
cono
mic
Ana
lysi
s an
d U
.S. D
epar
tmen
t of
Lab
or,B
urea
u of
Lab
or S
tatis
tics.

275
Com
ptro
ller’
s R
epor
t fo
r F
isca
l 200
2P
art
III—
Stat
isti
cal I
nfor
mat
ion
Dem
ogra
phic
,Fin
anci
al &
Oth
er T
rend
s (C
ont.
)P
ER
SON
SR
EC
EIV
ING
PU
BL
ICA
SSIS
TA
NC
E
1992
-200
2(a
nnua
l ave
rage
s in
thou
sand
s)FA
____
____
____
____
____
____
____
____
__A
nnua
lSa
fety
Une
mpl
oyed
SNA
/PG
Yea
rTo
tal(
a)C
hang
eN
etFA
Bas
icP
aren
tsP
GA
DC
(b)
Inte
rim
FA/F
PSN
____
___
____
____
____
____
____
___
____
____
____
____
____
____
____
___
____
___
____
____
_
1992
. . .
. . .
. . .
. . .
. . .
. . .
. . .
. . .
. . .
. . .
. . .
. . .
.1,
008
7.3
189
710
1692
––
1993
. . .
. . .
. . .
. . .
. . .
. . .
. . .
. . .
. . .
. . .
. . .
. . .
.1,
074
6.5
203
765
2879
––
1994
. . .
. . .
. . .
. . .
. . .
. . .
. . .
. . .
. . .
. . .
. . .
. . .
.1,
141
6.2
230
802
4068
––
1995
. . .
. . .
. . .
. . .
. . .
. . .
. . .
. . .
. . .
. . .
. . .
. . .
.1,
110
(2.7
)20
879
947
56–
–19
96 .
. . .
. . .
. . .
. . .
. . .
. . .
. . .
. . .
. . .
. . .
. . .
. . .
1,00
3(9
.6)
161
753
4247
––
1997
* .
. . .
. . .
. . .
. . .
. . .
. . .
. . .
. . .
. . .
. . .
. . .
. . .
866
*13
966
427
36–
–19
98 .
. . .
. . .
. . .
. . .
. . .
. . .
. . .
. . .
. . .
. . .
. . .
. . .
755
(12.
8)12
459
016
25–
–19
99 .
. . .
. . .
. . .
. . .
. . .
. . .
. . .
. . .
. . .
. . .
. . .
. . .
680
(9.9
)11
454
220
3–
–20
00 .
. . .
. . .
. . .
. . .
. . .
. . .
. . .
. . .
. . .
. . .
. . .
. . .
591
(13.
1)95
496
N/A
–90
464
2001
. . .
. . .
. . .
. . .
. . .
. . .
. . .
. . .
. . .
. . .
. . .
. . .
.51
6(1
2.7)
87—
N/A
–87
427
2002
(si
x m
onth
s av
g.)
. . .
. . .
. . .
. . .
. . .
. . .
. . .
. . .
457
(11.
4)82
—N
/A–
—37
5
(a)
Dat
a do
es n
ot in
clud
e ag
ed,d
isab
led
or b
lind
per
sons
tran
sfer
red
from
pub
lic
assi
stan
ce to
the
Sup
plem
enta
l Sec
urit
y In
com
e (S
SI)
pro
gram
,whi
ch is
adm
inis
tere
d by
the
Soc
ial
Sec
urit
y A
dmin
istr
atio
n. T
he S
SI
prog
ram
sup
port
ed,a
s of
Dec
embe
r of
eac
h ye
ar,a
tot
al o
f 29
9,70
9 pe
rson
s in
199
2; 3
29,0
39 p
erso
ns i
n 19
93;
347,
124
pers
ons
in 1
994;
363
,066
per
sons
in 1
995;
375
,045
per
sons
in 1
996,
371,
772
pers
ons
in 1
997;
380
,797
per
sons
in 1
998;
384
,795
per
sons
in 1
999;
371
,245
per
sons
in20
00; 3
95,3
50 in
Dec
embe
r 20
01. D
ata
for
June
200
2 is
not
yet
ava
ilab
le.
(b)
One
of
the
cate
gori
es o
f pu
blic
ass
ista
nce,
whi
ch w
as d
esig
nate
d as
PG
AD
C (
Pre
dete
rmin
atio
n G
rant
Aid
to
Fam
ilie
s w
ith
Dep
ende
nt C
hild
ren)
and
is
fund
ed a
t th
esa
me
rate
as
Saf
ety
Net
,w
as i
niti
ated
in
Sep
tem
ber,
1989
; al
thou
gh t
he g
rant
s fo
r th
e pe
rson
s in
rec
eipt
of
PG
AD
C a
re F
eder
ally
Non
part
icip
atin
g (F
NP
) un
til
elig
ibil
ity
for A
FD
C is
est
abli
shed
,the
per
sons
in r
ecei
pt o
f P
GA
DC
are
incl
uded
in th
e A
FD
C p
erso
ns c
ount
.N
ote:
In 1
997,
Und
er F
eder
al a
nd S
tate
Wel
fare
refo
rm,t
he c
ateg
orie
s of
Pub
lic A
ssis
tanc
e ch
ange
d. W
hat w
as fo
rmer
ly A
DC
(Aid
to F
aim
ilies
with
Dep
ende
nt C
hild
ren)
bec
ame
Fam
ily A
ssis
tanc
e Pr
ogra
m (F
AP)
,als
o kn
own
as T
empo
rary
Ass
ista
nce
for N
eedy
Fam
ilies
(TA
NF)
. Wha
t was
form
erly
Hom
e R
elie
f bec
ame
Safe
ty N
et. S
ince
Dec
embe
r19
99,t
he c
asel
oad
data
has
bee
n re
port
ed in
few
er c
ateg
orie
s. S
afet
y N
et F
amili
es w
ith c
hild
ren
and
PA-T
wo
Pare
nt C
ases
hav
e be
en a
bsor
bed
into
FA
. In
Dec
embe
r 20
01cl
ient
s re
achi
ng 6
0 m
onth
s tim
e lim
it w
ere
conv
erte
d to
Saf
ety
Net
,but
are
bei
ng c
ount
ed to
war
ds T
AN
F,du
e to
MO
E r
equi
rem
ents
. Als
o,in
Dec
embe
r 20
01 S
afet
y N
etis
bro
ken
dow
n in
to tw
o co
mpo
netn
s:Sa
fety
Net
Cas
h A
ssis
tanc
e (S
NC
A)
and
Safe
ty N
et N
on-C
ash
(SN
NC
). T
his
chan
ge s
houl
d be
kep
t in
min
d w
hen
com
pari
sons
are
mad
e. D
etai
ls m
ay n
ot a
dd to
tota
ls d
ue to
rou
ndin
g.*
Star
ting
in J
uly
1996
(Fe
brua
ry 1
997
for
Safe
ty N
et),
HR
A b
egan
rep
ortin
g un
dupl
icat
ed c
ase
coun
ts a
s w
ell a
s co
ntin
uing
the
met
hodo
logy
whi
ch in
clud
ed d
uplic
ate
case
coun
ts. D
uplic
ate
case
s oc
cur
whe
n in
divi
dual
s tr
ansf
er to
dif
fere
nt c
ente
rs. B
egin
ning
in J
anua
ry 1
999,
HR
A is
rec
ordi
ng u
ndup
lica
ted
case
cou
nts
only
. The
dif
fere
nce
betw
een
the
case
cou
nts
for
the
two
met
hods
are
not
maj
or. F
rom
199
7 fo
rwar
d,on
ly u
ndup
licat
ed c
ases
are
sho
wn
on th
is ta
ble.
Sour
ces:
The
City
of N
ew Y
ork,
Hum
an R
esou
rces
Adm
inis
trat
ion,
Off
ice
of B
udge
t Adm
inis
trat
ion
and
U.S
. Dep
artm
ent o
f Hea
lth &
Hum
an S
ervi
ces,
Soci
al S
ecur
ity A
dmin
istr
atio
n.

276
EMPLOYMENT STATUS OF THE RESIDENT POPULATION
1992-2002
Civilian Labor Force(in thousands) Unemployment Percentage_______________________________________ ___________________________
New York UnitedYear Total Employed Unemployed(a) City States____ _____ __________ ______________ _________ ________
1992 . . . . . . . . . . . . . . . . . . . . . . . . . . . 3,262 2,902 360 11.0 7.51993 . . . . . . . . . . . . . . . . . . . . . . . . . . . 3,237 2,901 336 10.4 6.91994 . . . . . . . . . . . . . . . . . . . . . . . . . . . 3,221 2,941 280 8.7 6.11995 . . . . . . . . . . . . . . . . . . . . . . . . . . . 3,185 2,925 260 8.2 5.61996 . . . . . . . . . . . . . . . . . . . . . . . . . . . 3,282 2,994 288 8.8 5.41997 . . . . . . . . . . . . . . . . . . . . . . . . . . . 3,403 3,084 319 9.4 4.91998 . . . . . . . . . . . . . . . . . . . . . . . . . . . 3,451 3,174 277 8.0 4.51999 . . . . . . . . . . . . . . . . . . . . . . . . . . . 3,449 3,218 231 6.7 4.22000 . . . . . . . . . . . . . . . . . . . . . . . . . . . 3,561 3,357 204 5.7 4.02001 . . . . . . . . . . . . . . . . . . . . . . . . . . . 3,509 3,296 212 6.1 4.82002 (six months avg.) . . . . . . . . . . . . . 3,518 3,252 283 8.7 6.0
(a) Unemployed persons are all civilians who had no employment during the survey week, were available for work, except fortemporary illness, and had made specific efforts to find employment some time during the prior four weeks. Also, personswho were waiting to be recalled to a job from which they had been laid off or were waiting to report to a new job within 30 daysneed not be looking for work to be classified as unemployed.
Note: The data are on 2001 benchmarks and are not seasonally adjusted.
Sources: U.S. Department of Labor, Bureau of Labor Statistics and State of New York, Department of Labor, Division of Researchand Statistics.
Comptroller’s Report for Fiscal 2002 Part III—Statistical Information
Demographic, Financial & Other Trends (Cont.)

277
NO
NA
GR
ICU
LTU
RA
LW
AG
EA
ND
SAL
AR
YE
MP
LO
YM
EN
T
1992
-200
2(a
vera
ge a
nnua
l em
ploy
men
t in
thou
sand
s)
2002
(b)
2001
2000
1999
1998
1997
1996
1995
1994
1993
1992
____
___
____
___
____
___
____
___
____
___
____
___
____
___
____
___
____
___
____
___
____
___
Priv
ate
Em
ploy
men
t:Se
rvic
es a
nd M
inin
g(a)
. . .
. . .
. . .
1,43
91,
465
1,45
71,
385
1,32
61,
275
1,22
71,
184
1,14
81,
116
1,09
3W
hole
sale
Tra
de .
. . .
. . .
. . .
. . .
.18
018
319
019
119
019
018
819
119
019
019
6R
etai
l Tra
de .
. . .
. . .
. . .
. . .
. . .
. .42
543
643
741
940
038
837
736
435
434
835
0M
anuf
actu
ring
. . .
. . .
. . .
. . .
. . .
.21
923
024
325
125
926
526
627
428
128
929
3Fi
nanc
e,In
sura
nce
and
Rea
l Est
ate
. . .
. . .
. . .
. . .
. .
460
487
491
486
483
473
469
473
480
471
473
Tra
nspo
rtat
ion
and
Publ
ic U
tiliti
es .
. . .
. . .
. . .
. . .
.19
921
221
320
820
620
520
520
320
220
320
5C
onst
ruct
ion
. . .
. . .
. . .
. . .
. . .
. .
119
125
122
114
102
9491
9089
8687
____
___
___
____
___
___
____
___
___
____
___
___
____
___
___
____
_To
tal P
riva
te E
mpl
oym
ent
. . .
. . .
.3,
041
3,13
83,
153
3,05
42,
966
2,89
02,
823
2,77
92,
744
2,70
32,
697
Gov
ernm
ent
. . .
. . .
. . .
. . .
. . .
. . .
562
564
570
567
562
552
546
560
578
588
585
____
___
___
____
___
___
____
___
___
____
___
___
____
___
___
____
_To
tal
. . .
. . .
. . .
. . .
. . .
. . .
. .3,
603
3,70
23,
723
3,62
13,
528
3,44
23,
369
3,33
93,
322
3,29
13,
282
____
___
___
____
___
___
____
___
___
____
___
___
____
___
___
____
___
___
____
___
___
____
___
___
____
___
___
____
___
___
____
___
___
Perc
enta
ge I
ncre
ase
(Dec
reas
e)fr
om P
rior
Yea
r .
. . .
. . .
. . .
. . .
. .N
/A(0
.6%
)2.
8%2.
6%2.
5%2.
2%0.
9%0.
5%0.
9%0.
3%(2
.8%
)
(a)
Incl
udes
rou
ndin
g ad
just
men
t.
(b)
Six
mon
ths
aver
age.
Not
e:D
ata
are
not s
easo
nall
y ad
just
ed.
N/A
:Not
Ava
ilab
le.
Sou
rce:
Sta
te o
f N
ew Y
ork,
Dep
artm
ent o
f L
abor
,Div
isio
n of
Res
earc
h an
d S
tati
stic
s.
Com
ptro
ller’
s R
epor
t fo
r F
isca
l 200
2P
art
III—
Stat
isti
cal I
nfor
mat
ion
Dem
ogra
phic
,Fin
anci
al &
Oth
er T
rend
s (C
ont.
)

278
NU
MB
ER
OF
CIT
YE
MP
LO
YE
ES
1993
-200
2
Ful
l-ti
me
Em
ploy
ees
____
____
____
____
____
____
____
____
____
____
____
____
____
____
____
____
____
____
____
____
____
____
____
____
____
____
____
____
____
____
____
____
____
____
__Ju
ne 3
0,Ju
ne 3
0,Ju
ne 3
0,Ju
ne 3
0,Ju
ne 3
0,Ju
ne 3
0,Ju
ne 3
0,Ju
ne 3
0,Ju
ne 3
0,Ju
ne 3
0,20
0220
0120
0019
9919
9819
9719
9619
9519
9419
93__
____
___
____
___
____
___
____
___
____
___
____
___
____
___
____
___
____
___
____
_
Res
pons
ibili
ty A
rea:
Edu
catio
n . .
. . .
. . .
. . .
. . .
. .
102,
320
102,
583
100,
748
97,0
4793
,620
88,5
6587
,576
88,9
8388
,639
86,9
81Po
lice
. . .
. . .
. . .
. . .
. . .
. . .
.46
,003
48,0
0449
,269
48,0
9246
,864
46,8
3043
,589
43,0
4038
,008
35,5
31So
cial
Ser
vice
s .
. . .
. . .
. . .
.19
,874
19,7
4520
,275
20,3
6820
,812
20,8
9121
,239
21,2
1822
,966
28,8
10H
ighe
r E
duca
tion
. . .
. . .
. . .
.3,
795
3,76
33,
800
3,78
13,
720
3,69
03,
581
3,57
94,
071
3,68
2E
nvir
onm
enta
l Pro
tect
ion
. . .
5,43
05,
414
5,56
55,
624
5,49
85,
497
5,85
95,
781
5,69
55,
854
Sani
tatio
n . .
. . .
. . .
. . .
. . .
. .
10,0
3410
,166
9,97
79,
400
9,32
59,
128
9,45
49,
477
10,3
5110
,860
Fire
. . .
. . .
. . .
. . .
. . .
. . .
. .
15,7
2415
,642
15,9
8715
,937
15,7
0915
,693
15,7
03(a
)12
,310
12,4
8412
,537
All
Oth
er .
. . .
. . .
. . .
. . .
. . .
44,5
0144
,507
45,2
3546
,505
47,1
6247
,276
49,6
7350
,221
53,5
3854
,184
____
___
____
___
____
___
____
___
____
___
____
___
____
___
____
___
____
___
____
___
Tota
l . .
. . .
. . .
. . .
. . .
. .
247,
681
249,
824
250,
856
246,
754
242,
710
237,
570
236,
674
234,
609
235,
752
238,
439
____
___
____
___
____
___
____
___
____
___
____
___
____
___
____
___
____
___
____
___
____
___
____
___
____
___
____
___
____
___
____
___
____
___
____
___
____
___
____
___
Perc
enta
ge I
ncre
ase
(Dec
reas
e)fr
om P
rior
Yea
r .
. . .
. . .
. . .
.(0
.9%
)(0
.4%
)1.
7%1.
7%2.
2%0.
4%0.
9%(0
.5%
)(1
.1%
)1.
9%
(a)
Em
erge
ncy
Med
ical
Ser
vice
s (E
MS
) w
as c
onso
lida
ted
wit
h F
ire
Dep
artm
ent o
pera
tion
s on
Mar
ch 1
7,19
96.
Sou
rces
:Int
egra
ted
Fin
anci
al M
anag
emen
t Sys
tem
(IF
MS
),F
inan
cial
Man
agem
ent S
yste
m (
FM
S),
May
or’s
Off
ice
of M
anag
emen
t and
Bud
get,
and
May
or’s
Off
ice
of
Ope
rati
ons.
Com
ptro
ller’
s R
epor
t fo
r F
isca
l 200
2P
art
III—
Stat
isti
cal I
nfor
mat
ion
Dem
ogra
phic
,Fin
anci
al &
Oth
er T
rend
s (C
ont.
)

279
CORPORATE HEADQUARTERS
1992-2001
2001 2000 1999 1998 1997 1996 1995 1994 1993 1992_____ _____ _____ _____ _____ _____ _____ _____ _____ _____Number of 500 Largest:Industrial and Service Corporations (a) . . . . 40 40 42 46 46 46 47 49 30 34
The New York City Corporations that were included in the 2001 Fortune 500 count for the United States are as follows:
Percent PercentRevenues(b) Change Revenues(b) Change(in millions) from 2000 (in millions) from 2000____________ ___________ ____________ ___________
Citigroup . . . . . . . . . . . . . . . . . . . . . $112,022.0 0.2 Consolidated Edison . . . . . . . . $9,634.0 2.1Philip Morris . . . . . . . . . . . . . . . . . . 72,944.0 15.3 Colgate-Palmolive . . . . . . . . . . 9,427.8 0.7Verizon Communications . . . . . . . . 67,190.0 3.8 Cendant . . . . . . . . . . . . . . . . . . 8,950.0 91.5 American International Group . . . . 62,402.0 35.7 Guardian Life Ins,AT&T . . . . . . . . . . . . . . . . . . . . . . . 59,142.0 (10.4) Co. of America . . . . . . . . . 8,906.9 (0.7)JP Morgan Chase & Co. . . . . . . . . . 50,429.0 (16.0) Bear Stearns . . . . . . . . . . . . . . . 8,701.0 (15.3)Morgan Stanley Dean Witter . . . . . 43,727.0 (3.7) Bank of New York Co. . . . . . . . 7,192.0 (3.9)Merrill Lynch . . . . . . . . . . . . . . . . . 38,793.0 (13.5) Keyspan . . . . . . . . . . . . . . . . . . 6,899.9 34.7AOL Time Warner . . . . . . . . . . . . . 38,234.0 — Omnicom Group . . . . . . . . . . . 6,889.4 11.9Pfizer . . . . . . . . . . . . . . . . . . . . . . . 32,259.0 9.1 Interpublic Group . . . . . . . . . . 6,726.8 19.6MetLife . . . . . . . . . . . . . . . . . . . . . . 31,928.0 (0.1) Avon Products . . . . . . . . . . . . . 5,994.5 4.9Goldman Sachs Group . . . . . . . . . . 31,138.0 (5.6) USA Networks . . . . . . . . . . . . 5,284.8 14.4New York Life Insurance . . . . . . . . 25,678.2 19.7 Barnes & Noble . . . . . . . . . . . . 4,870.4 11.3TIAA-CREF . . . . . . . . . . . . . . . . . . 24,230.6 (36.3) McGraw-Hill . . . . . . . . . . . . . . 4,645.5 8.5Viacom . . . . . . . . . . . . . . . . . . . . . . 23,222.8 15.9 Estee Lauder . . . . . . . . . . . . . . 4,608.1 5.5American Express . . . . . . . . . . . . . . 22,582.0 (4.6) Dover . . . . . . . . . . . . . . . . . . . . 4,528.0 (16.2)Lehman Brothers Holdings . . . . . . . 22,392.0 (15.3) Foot Locker . . . . . . . . . . . . . . . 4,379.0 (6.7)Bristol-Myers Squibb . . . . . . . . . . . 21,717.0 1.8 NTL . . . . . . . . . . . . . . . . . . . . . 3,754.9 —Loews . . . . . . . . . . . . . . . . . . . . . . . 18,799.1 (9.1) Liz Claiborne . . . . . . . . . . . . . . 3,448.5 11.1Amerada Hess . . . . . . . . . . . . . . . . . 13,413.0 9.3 New York Times . . . . . . . . . . . 3,042.5 (12.8)Marsh & McLennan . . . . . . . . . . . . 9,943.0 (2.1)
(a) Prior to 1994, the Fortune 500 included only industrial corporations; service companies were ranked in a separate Service500 list.
(b) All companies on the list must publish financial data and must report part or all of their figures to a government agency. Privatecompanies and cooperatives that produce a 10-K are, therefore, included; subsidiaries of foreign companies incorporated in theU.S. are excluded. Revenues are as reported, including revenues from discontinued operations when they are published on aconsolidated basis (except when the divested company’s revenues equal 50% or more of the surviving company’s revenues onan annualized basis). The revenues for commercial banks and savings institutions are interest and noninterest revenues. Suchfigures for insurance companies include premium and annuity income, investment income, and capital gains or losses, but excludedeposits. Revenue figures for all companies include consolidated subsidiaries and exclude excise taxes. Data shown are for thefiscal year ended on or before January 31, 2002.
SOURCES: FORTUNE 500, © 2002 Time Inc. All rights reserved.
Comptroller’s Report for Fiscal 2002 Part III—Statistical Information
Demographic, Financial & Other Trends (Cont.)
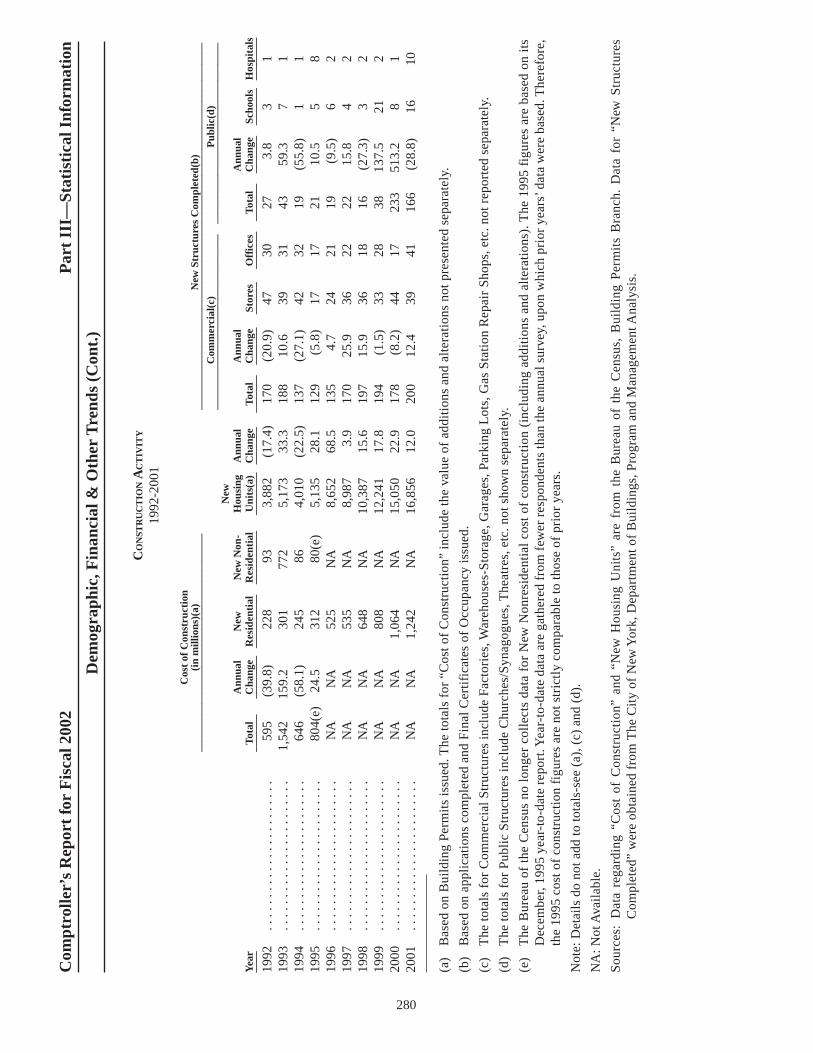
280
Com
ptro
ller’
s R
epor
t fo
r F
isca
l 200
2P
art
III—
Stat
isti
cal I
nfor
mat
ion
Dem
ogra
phic
,Fin
anci
al &
Oth
er T
rend
s (C
ont.
)
CO
NST
RU
CT
ION
AC
TIV
ITY
1992
-200
1
Cos
t of
Con
stru
ctio
n(i
n m
illio
ns)(
a)N
ew S
truc
ture
s C
ompl
eted
(b)
____
____
____
____
____
____
____
____
____
____
___
____
____
____
____
____
____
____
____
____
____
____
____
____
____
____
____
___
Com
mer
cial
(c)
Pub
lic(d
)__
____
____
____
____
____
____
____
___
____
____
____
____
____
____
____
____
__N
ewA
nnua
lN
ewN
ew N
on-
Hou
sing
Ann
ual
Ann
ual
Ann
ual
Yea
rTo
tal
Cha
nge
Res
iden
tial
Res
iden
tial
Uni
ts(a
)C
hang
eTo
tal
Cha
nge
Stor
esO
ffic
esTo
tal
Cha
nge
Scho
ols
Hos
pita
ls__
____
____
___
____
____
____
____
____
____
____
____
____
____
___
____
___
____
___
____
____
___
____
___
____
___
____
___
____
____
1992
. . .
. . .
. . .
. . .
. . .
. . .
. . .
. .
595
(39.
8)22
893
3,88
2(1
7.4)
170
(20.
9)47
3027
3.8
31
1993
. . .
. . .
. . .
. . .
. . .
. . .
. . .
. .
1,54
215
9.2
301
772
5,17
333
.318
810
.639
3143
59.3
71
1994
. . .
. . .
. . .
. . .
. . .
. . .
. . .
. .
646
(58.
1)24
586
4,01
0(2
2.5)
137
(27.
1)42
3219
(55.
8)1
119
95 .
. . .
. . .
. . .
. . .
. . .
. . .
. . .
.80
4(e)
24.5
312
80(e
)5,
135
28.1
129
(5.8
)17
1721
10.5
58
1996
. . .
. . .
. . .
. . .
. . .
. . .
. . .
. .
NA
NA
525
NA
8,65
268
.513
54.
724
2119
(9.5
)6
219
97 .
. . .
. . .
. . .
. . .
. . .
. . .
. . .
.N
AN
A53
5N
A8,
987
3.9
170
25.9
3622
2215
.84
219
98 .
. . .
. . .
. . .
. . .
. . .
. . .
. . .
.N
AN
A64
8N
A10
,387
15.6
197
15.9
3618
16(2
7.3)
32
1999
. . .
. . .
. . .
. . .
. . .
. . .
. . .
. .
NA
NA
808
NA
12,2
4117
.819
4(1
.5)
3328
3813
7.5
212
2000
. . .
. . .
. . .
. . .
. . .
. . .
. . .
. .
NA
NA
1,06
4N
A15
,050
22.9
178
(8.2
)44
1723
351
3.2
81
2001
. . .
. . .
. . .
. . .
. . .
. . .
. . .
. .
NA
NA
1,24
2N
A16
,856
12.0
200
12.4
3941
166
(28.
8)16
10
(a)
Bas
ed o
n B
uild
ing
Per
mit
s is
sued
. The
tota
ls f
or “
Cos
t of
Con
stru
ctio
n”in
clud
e th
e va
lue
of a
ddit
ions
and
alt
erat
ions
not
pre
sent
ed s
epar
atel
y.
(b)
Bas
ed o
n ap
plic
atio
ns c
ompl
eted
and
Fin
al C
erti
fica
tes
of O
ccup
ancy
issu
ed.
(c)
The
tota
ls f
or C
omm
erci
al S
truc
ture
s in
clud
e Fa
ctor
ies,
War
ehou
ses-
Sto
rage
,Gar
ages
,Par
king
Lot
s,G
as S
tati
on R
epai
r S
hops
,etc
. not
rep
orte
d se
para
tely
.
(d)
The
tota
ls f
or P
ubli
c S
truc
ture
s in
clud
e C
hurc
hes/
Syn
agog
ues,
The
atre
s,et
c. n
ot s
how
n se
para
tely
.
(e)
The
Bur
eau
of t
he C
ensu
s no
lon
ger
coll
ects
dat
a fo
r N
ew N
onre
side
ntia
l co
st o
f co
nstr
ucti
on (
incl
udin
g ad
diti
ons
and
alte
rati
ons)
. The
199
5 fi
gure
s ar
e ba
sed
on i
tsD
ecem
ber,
1995
yea
r-to
-dat
e re
port
. Yea
r-to
-dat
e da
ta a
re g
athe
red
from
few
er r
espo
nden
ts th
an th
e an
nual
sur
vey,
upon
whi
ch p
rior
yea
rs’d
ata
wer
e ba
sed.
The
refo
re,
the
1995
cos
t of
cons
truc
tion
fig
ures
are
not
str
ictl
y co
mpa
rabl
e to
thos
e of
pri
or y
ears
.
Not
e:D
etai
ls d
o no
t add
to to
tals
-see
(a)
,(c)
and
(d)
.
NA
:Not
Ava
ilab
le.
Sou
rces
:D
ata
rega
rdin
g “C
ost
of C
onst
ruct
ion”
and
“New
Hou
sing
Uni
ts”
are
from
the
Bur
eau
of t
he C
ensu
s,B
uild
ing
Per
mit
s B
ranc
h. D
ata
for
“New
Str
uctu
res
Com
plet
ed”
wer
e ob
tain
ed f
rom
The
Cit
y of
New
Yor
k,D
epar
tmen
t of
Bui
ldin
gs,P
rogr
am a
nd M
anag
emen
t Ana
lysi
s.

281
BANK DEPOSITS AND LOANS
1993-2002(in millions)
Bank Deposits Loans______________________________________________________________ ______________________________Commercial Banks(a) Commercial Banks(a) Thrift__________________________________________________ ___________________
Nontransaction Transaction Balances(c) Thrift Commercial Institutions______________________ ____________Year Balances(b) Demand Other Total Institutions(d) and Industrial Mortgages(d)____ ______________ __________ _________ __________ _____________ ______________ ____________
1993 . . . . . . . . . . . . . . . . . . . . . . $100,042 $52,797 $10,092 $162,931 $60,071 $41,438 $42,8101994 . . . . . . . . . . . . . . . . . . . . . . 94,623 53,127 10,380 158,130 58,597 37,274 42,4881995 . . . . . . . . . . . . . . . . . . . . . . 93,841 52,532 10,846 157,219 58,451 39,367 39,0911996 . . . . . . . . . . . . . . . . . . . . . . 102,016 50,949 7,117 160,082 59,009 42,498 38,3491997 . . . . . . . . . . . . . . . . . . . . . . 147,230 48,739 —* 195,969 56,164 45,870 41,8971998 . . . . . . . . . . . . . . . . . . . . . . 164,148 49,212 —* 213,360 55,643 50,888 47,5531999** . . . . . . . . . . . . . . . . . . . . . 174,739 49,659 —* 224,398 61,461 54,892 56,3552000 . . . . . . . . . . . . . . . . . . . . . . 186,097 50,633 —* 236,730 56,671 59,283 58,6192001 . . . . . . . . . . . . . . . . . . . . . . 285,703 56,132 —* 341,835 58,909 —** 66,7442002 . . . . . . . . . . . . . . . . . . . . . . 317,093 57,151 —* 374,244 44,884 —** 49,151
(a) Data are reported for the last Wednesday in June for the “Large Weekly Reporting Commercial Banks In New York City.”
(b) Nontransaction Balances include Savings Deposits (Money Market Deposit Accounts and Other Savings Deposits) and TimeDeposits (Time Certificates of Deposit and Time Deposits, Open Account).
(c) Transaction Balances are deposits or accounts from which the depositor or account holder is permitted to make transfers orwithdrawals by negotiable or transferable instruments, payment orders of withdrawal, telephone transfers, or other similardevices for the purpose of making payments or transfers to third persons or others or from which the depositor may makethird party payments at an automated teller machine (ATM), a remote service unit (RSU), or another electronic device, includingby debit card. Transaction Balances consist of Demand Deposits, NOW Accounts (including accounts previously designatedas “Super NOWs”), Automatic Transfer Service (ATS) Accounts, and Telephone and Preauthorized Transfer Accounts.
(d) Thrift Institutions are Savings and Loan Associations (S&Ls) and Savings Banks, where data are reported as of June 30th.Deposits for S&Ls and Savings Banks consist of NOW, Super NOW, Demand, Passbook, Time and Money Market DepositAccounts, and Escrow Accounts (where funds are owned by customers and held by the institutions as trustee or agent). Mortgagesare the total real estate loans outstanding, which exclude mortgage-backed passthroughs/securities.
* Since 1997, transaction balances have been reported as a single number for demand and other accounts.
The relative shifts in volume between Nontransaction Accounts and Transaction Balances since 1997 are attributable to “sweepaccounts”, i.e., the shifting of funds from NOW accounts into Money Market Accounts.
** As of December 23, 1998, the last date for which the Federal Reserve reported these figures for commercial banks on a municipallevel.
Details for Commercial Banks may not add to totals due to rounding.
SOURCES: The Federal Reserve, New York City; Office of Thrift Supervision of the Department of the Treasury; and New YorkState Banking Department.
Comptroller’s Report for Fiscal 2002 Part III—Statistical Information
Demographic, Financial & Other Trends (Cont.)
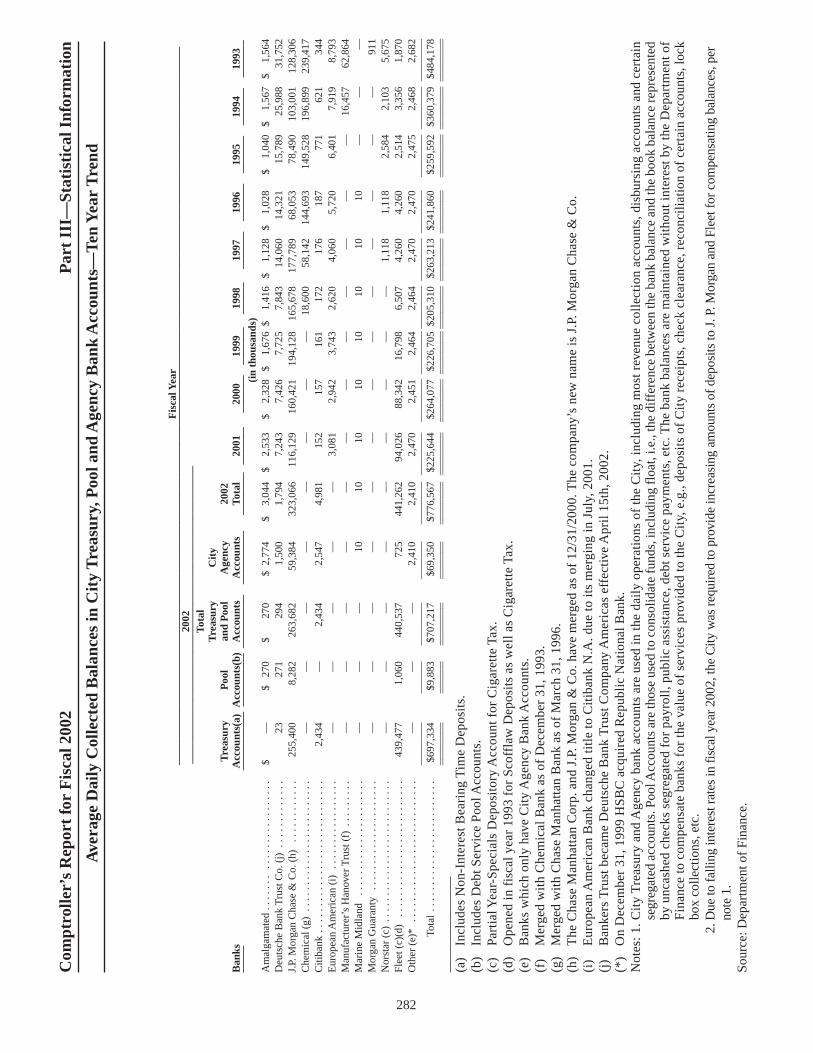
282
Fis
cal Y
ear
____
____
____
____
____
____
____
____
____
____
____
____
____
____
____
____
____
____
____
____
____
____
____
____
____
____
____
____
____
____
____
____
____
___
2002
____
____
____
____
____
____
____
____
____
____
____
____
____
____
Tota
lT
reas
ury
Cit
yT
reas
ury
Poo
lan
d P
ool
Age
ncy
2002
Ban
ksA
ccou
nts(
a)A
ccou
nts(
b)A
ccou
nts
Acc
ount
sTo
tal
2001
2000
1999
1998
1997
1996
1995
1994
1993
____
___
____
____
___
____
____
____
____
____
____
____
____
____
____
___
____
___
____
___
____
____
____
___
____
___
____
___
____
___
____
_(i
n th
ousa
nds)
Am
alga
mat
ed .
. . .
. . .
. . .
. . .
. . .
. . .
. . .
. .
$—
$27
0$
270
$2,
774
$3,
044
$2,
533
$2,
328
$1,
676
$1,
416
$1,
128
$1,
028
$1,
040
$1,
567
$1,
564
Deu
tsch
e B
ank
Tru
st C
o. (
j) .
. . .
. . .
. . .
. . .
2327
129
41,
500
1,79
47,
243
7,42
67,
725
7,84
314
,060
14,3
2115
,789
25,9
8831
,752
J.P.
Mor
gan
Cha
se &
Co.
(h)
. . .
. . .
. . .
. . .
255,
400
8,28
226
3,68
259
,384
323,
066
116,
129
160,
421
194,
128
165,
678
177,
789
68,0
5378
,490
103,
001
128,
306
Che
mic
al (
g) .
. . .
. . .
. . .
. . .
. . .
. . .
. . .
. . .
——
——
——
——
18,6
0058
,142
144,
693
149,
528
196,
899
239,
417
Citi
bank
. . .
. . .
. . .
. . .
. . .
. . .
. . .
. . .
. . .
. .
2,43
4—
2,43
42,
547
4,98
115
215
716
117
217
618
777
162
134
4E
urop
ean
Am
eric
an (
i) .
. . .
. . .
. . .
. . .
. . .
.—
——
——
3,08
12,
942
3,74
32,
620
4,06
05,
720
6,40
17,
919
8,79
3M
anuf
actu
rer’
s H
anov
er T
rust
(f)
. . .
. . .
. . .
——
——
——
——
——
——
16,4
5762
,864
Mar
ine
Mid
land
. . .
. . .
. . .
. . .
. . .
. . .
. . .
.—
——
1010
1010
1010
1010
——
—M
orga
n G
uara
nty
. . .
. . .
. . .
. . .
. . .
. . .
. . .
——
——
——
——
——
——
—91
1N
orst
ar (
c) .
. . .
. . .
. . .
. . .
. . .
. . .
. . .
. . .
. .—
——
——
——
——
1,11
81,
118
2,58
42,
103
5,67
5Fl
eet (
c)(d
) .
. . .
. . .
. . .
. . .
. . .
. . .
. . .
. . .
.43
9,47
71,
060
440,
537
725
441,
262
94,0
2688
,342
16,7
986,
507
4,26
04,
260
2,51
43,
356
1,87
0O
ther
(e)
* .
. . .
. . .
. . .
. . .
. . .
. . .
. . .
. . .
. .—
——
2,41
02,
410
2,47
02,
451
2,46
42,
464
2,47
02,
470
2,47
52,
468
2,68
2__
____
____
____
____
____
____
___
____
____
____
____
____
____
____
____
____
____
____
____
____
____
____
____
____
____
____
____
Tota
l . .
. . .
. . .
. . .
. . .
. . .
. . .
. . .
. .
$697
,334
$9,8
83$7
07,2
17$6
9,35
0$7
76,5
67$2
25,6
44$2
64,0
77$2
26,7
05$2
05,3
10$2
63,2
13$2
41,8
60$2
59,5
92$3
60,3
79$4
84,1
78__
____
____
____
____
____
____
___
____
____
____
____
____
____
____
____
____
____
____
____
____
____
____
____
____
____
____
____
____
____
____
____
____
____
____
___
____
____
____
____
____
____
____
____
____
____
____
____
____
____
____
____
____
____
____
__
(a)
Incl
udes
Non
-Int
eres
t Bea
ring
Tim
e D
epos
its.
(b)
Incl
udes
Deb
t Ser
vice
Poo
l Acc
ount
s.(c
)Pa
rtia
l Yea
r-S
peci
als
Dep
osit
ory
Acc
ount
for
Cig
aret
te T
ax.
(d)
Ope
ned
in f
isca
l yea
r 19
93 f
or S
coff
law
Dep
osit
s as
wel
l as
Cig
aret
te T
ax.
(e)
Ban
ks w
hich
onl
y ha
ve C
ity
Age
ncy
Ban
k A
ccou
nts.
(f)
Mer
ged
wit
h C
hem
ical
Ban
k as
of
Dec
embe
r 31
,199
3.(g
)M
erge
d w
ith
Cha
se M
anha
ttan
Ban
k as
of
Mar
ch 3
1,19
96.
(h)
The
Cha
se M
anha
ttan
Cor
p. a
nd J
.P. M
orga
n &
Co.
hav
e m
erge
d as
of
12/3
1/20
00. T
he c
ompa
ny’s
new
nam
e is
J.P
. Mor
gan
Cha
se &
Co.
(i)
Eur
opea
n A
mer
ican
Ban
k ch
ange
d ti
tle
to C
itib
ank
N.A
. due
to it
s m
ergi
ng in
Jul
y,20
01.
(j)
Ban
kers
Tru
st b
ecam
e D
euts
che
Ban
k T
rust
Com
pany
Am
eric
as e
ffec
tive
Apr
il 1
5th,
2002
.(*
)O
n D
ecem
ber
31,1
999
HS
BC
acq
uire
d R
epub
lic
Nat
iona
l Ban
k.N
otes
:1. C
ity
Tre
asur
y an
d A
genc
y ba
nk a
ccou
nts
are
used
in th
e da
ily
oper
atio
ns o
f th
e C
ity,
incl
udin
g m
ost r
even
ue c
olle
ctio
n ac
coun
ts,d
isbu
rsin
g ac
coun
ts a
nd c
erta
inse
greg
ated
acc
ount
s. P
ool A
ccou
nts
are
thos
e us
ed to
con
solid
ate
fund
s,in
clud
ing
floa
t,i.e
.,th
e di
ffer
ence
bet
wee
n th
e ba
nk b
alan
ce a
nd th
e bo
ok b
alan
ce re
pres
ente
dby
unc
ashe
d ch
ecks
seg
rega
ted
for
payr
oll,
publ
ic a
ssis
tanc
e,de
bt s
ervi
ce p
aym
ents
,etc
. The
ban
k ba
lanc
es a
re m
aint
aine
d w
itho
ut in
tere
st b
y th
e D
epar
tmen
t of
Fin
ance
to c
ompe
nsat
e ba
nks
for
the
valu
e of
ser
vice
s pr
ovid
ed to
the
Cit
y,e.
g.,d
epos
its
of C
ity
rece
ipts
,che
ck c
lear
ance
,rec
onci
liat
ion
of c
erta
in a
ccou
nts,
lock
box
colle
ctio
ns,e
tc.
2. D
ue to
falli
ng in
tere
st r
ates
in fi
scal
yea
r 20
02,t
he C
ity w
as r
equi
red
to p
rovi
de in
crea
sing
am
ount
s of
dep
osits
to J
. P. M
orga
n an
d Fl
eet f
or c
ompe
nsat
ing
bala
nces
,per
note
1.
Sour
ce:D
epar
tmen
t of
Fina
nce.
Com
ptro
ller’
s R
epor
t fo
r F
isca
l 200
2P
art
III—
Stat
isti
cal I
nfor
mat
ion
Ave
rage
Dai
ly C
olle
cted
Bal
ance
s in
Cit
y T
reas
ury,
Poo
l and
Age
ncy
Ban
k A
ccou
nts—
Ten
Yea
r T
rend
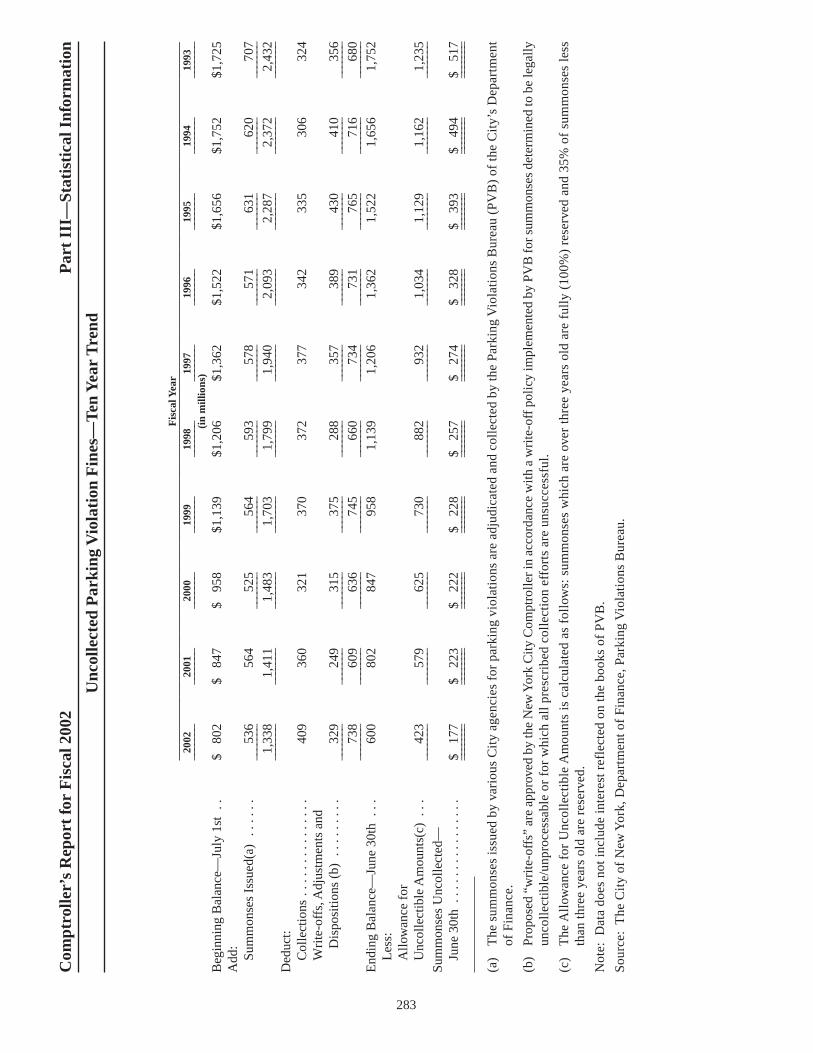
283
Fis
cal Y
ear
____
____
____
____
____
____
____
____
____
____
____
____
____
____
____
____
____
____
____
____
____
____
____
____
____
____
____
____
____
____
____
____
____
___
2002
2001
2000
1999
1998
1997
1996
1995
1994
1993
____
___
____
___
____
___
____
___
____
___
____
___
____
___
____
___
____
___
____
___
(in
mill
ions
)
Beg
inni
ng B
alan
ce—
July
1st
. .
$80
2$
847
$95
8$1
,139
$1,2
06$1
,362
$1,5
22$1
,656
$1,7
52$1
,725
Add
:Su
mm
onse
s Is
sued
(a)
. . .
. . .
536
564
525
564
593
578
571
631
620
707
____
___
____
___
____
___
____
___
____
___
____
___
____
___
____
___
____
___
1,33
81,
411
1,48
31,
703
1,79
91,
940
2,09
32,
287
2,37
22,
432
____
___
____
___
____
___
____
___
____
___
____
___
____
___
____
___
____
___
____
___
Ded
uct:
Col
lect
ions
. . .
. . .
. . .
. . .
. . .
409
360
321
370
372
377
342
335
306
324
Wri
te-o
ffs,
Adj
ustm
ents
and
Dis
posi
tions
(b)
. . .
. . .
. . .
329
249
315
375
288
357
389
430
410
356
____
___
____
___
____
___
____
___
____
___
____
___
____
___
____
___
____
___
____
___
738
609
636
745
660
734
731
765
716
680
____
___
____
___
____
___
____
___
____
___
____
___
____
___
____
___
____
___
____
___
End
ing
Bal
ance
—Ju
ne 3
0th
. . .
600
802
847
958
1,13
91,
206
1,36
21,
522
1,65
61,
752
Les
s:A
llow
ance
for
U
ncol
lect
ible
Am
ount
s(c)
. . .
423
579
625
730
882
932
1,03
41,
129
1,16
21,
235
____
___
____
___
____
___
____
___
____
___
____
___
____
___
____
___
____
___
____
___
Sum
mon
ses
Unc
olle
cted
—Ju
ne 3
0th
. . .
. . .
. . .
. . .
. . .
.$
177
$22
3$
222
$22
8$
257
$27
4$
328
$39
3$
494
$51
7__
____
___
____
___
____
___
____
___
____
___
____
___
____
___
____
___
____
___
____
___
____
___
____
___
____
___
____
___
____
___
____
___
____
___
____
___
____
___
____
_
(a)
The
sum
mon
ses
issu
ed b
y va
riou
s C
ity
agen
cies
for
par
king
vio
lati
ons
are
adju
dica
ted
and
coll
ecte
d by
the
Park
ing
Vio
lati
ons
Bur
eau
(PV
B)
of th
e C
ity’
s D
epar
tmen
tof
Fin
ance
.
(b)
Prop
osed
“w
rite
-off
s”ar
e ap
prov
ed b
y th
e N
ew Y
ork
Cit
y C
ompt
roll
er in
acc
orda
nce
wit
h a
wri
te-o
ff p
olic
y im
plem
ente
d by
PV
B fo
r sum
mon
ses
dete
rmin
ed to
be
lega
lly
unco
llec
tibl
e/un
proc
essa
ble
or f
or w
hich
all
pre
scri
bed
coll
ecti
on e
ffor
ts a
re u
nsuc
cess
ful.
(c)
The
All
owan
ce f
or U
ncol
lect
ible
Am
ount
s is
cal
cula
ted
as f
ollo
ws:
sum
mon
ses
whi
ch a
re o
ver
thre
e ye
ars
old
are
full
y (1
00%
) re
serv
ed a
nd 3
5% o
f su
mm
onse
s le
ssth
an th
ree
year
s ol
d ar
e re
serv
ed.
Not
e:D
ata
does
not
incl
ude
inte
rest
ref
lect
ed o
n th
e bo
oks
of P
VB
.
Sou
rce:
The
Cit
y of
New
Yor
k,D
epar
tmen
t of
Fin
ance
,Par
king
Vio
lati
ons
Bur
eau.
Com
ptro
ller’
s R
epor
t fo
r F
isca
l 200
2P
art
III—
Stat
isti
cal I
nfor
mat
ion
Unc
olle
cted
Par
king
Vio
lati
on F
ines
—Te
n Y
ear
Tre
nd

284
Fis
cal Y
ear
____
____
____
____
____
____
____
____
____
____
____
____
____
____
____
____
____
____
____
____
____
____
____
____
____
____
____
____
____
____
____
____
____
___
2002
2001
2000
1999
1998
1997
1996
1995
1994
1993
____
____
____
____
____
____
____
____
____
___
____
____
____
___
____
___
____
____
____
____
(in
mill
ions
)R
even
ues
. . .
. . .
. . .
. . .
. . .
. . .
. . .
. .
$40
,385
$40
,232
$37
,885
$35
,864
$34
,929
$33
,741
$32
,071
$31
,591
$31
,353
$30
,157
Exp
endi
ture
s B
efor
e T
rans
fers
. . .
. . .
(39,
498)
(37,
260)
(33,
921)
(32,
119)
(31,
248)
(29,
345)
(29,
492)
(29,
297)
(28,
894)
(27,
712)
____
___
____
___
____
___
____
___
____
___
____
___
____
___
____
___
____
___
____
___
Surp
lus
Bef
ore
Deb
t Ser
vice
and
O
ther
Tra
nsfe
rs .
. . .
. . .
. . .
. . .
. . .
887
2,97
23,
964
3,74
53,
681
4,39
62,
579
2,29
42,
459
2,44
5T
rans
fers
For
Deb
t Ser
vice
and
O
ther
Pur
pose
s . .
. . .
. . .
. . .
. . .
. . .
(882
)(2
,967
)(3
,777
)(3
,740
)(3
,676
)(4
,391
)(2
,574
)(2
,289
)(2
,454
)(2
,440
)T
rans
fer
to C
apita
l Pro
ject
s Fu
nd .
. . .
.—
—(1
82)
——
——
——
—__
____
___
____
___
____
___
____
___
____
___
____
___
____
___
____
___
____
___
____
_Su
rplu
s fr
om G
ener
al F
und
Ope
ratio
ns .
.5
55
55
55
55
5A
djus
tmen
ts to
Bri
ng O
pera
tions
to
Cas
h B
asis
:In
crea
se (
Dec
reas
e) in
Pay
able
s .
. . .
.81
42,
716
3,42
2(1
,047
)60
711
11,
659
1,30
535
042
6D
ecre
ase
(Inc
reas
e) in
Rec
eiva
bles
. . .
(687
)75
1(1
,595
)12
9(9
39)
146
(967
)(8
97)
(216
)(2
37)
Prov
isio
n Fo
r D
isal
low
ance
s of
Fe
dera
l and
Sta
te A
id .
. . .
. . .
. . .
. .(8
)51
561
28(1
7)40
2119
43L
ess
Dis
allo
wan
ce P
aid
. . .
. . .
. . .
. . .
—(4
6)(5
)(3
9)(1
4)(3
6)(2
8)(1
0)(1
0)(2
6)__
____
___
____
___
____
___
____
___
____
___
____
___
____
___
____
___
____
___
____
_C
ash
Prov
ided
by
Ope
ratio
ns .
. . .
. . .
. .12
43,
477
1,83
2(8
91)
(313
)20
970
942
414
821
1__
____
___
____
___
____
___
____
___
____
___
____
___
____
___
____
___
____
___
____
_O
ther
Sou
rces
of
Cas
h:Pr
ocee
ds F
rom
Sal
e of
City
Bon
ds .
. .2,
667
1,25
73,
125
3,60
953
72,
560
2,59
42,
242
2,75
41,
930
Tra
nsfe
rs f
rom
Gen
eral
Fun
d . .
. . .
. . .
——
182
——
——
——
—T
rans
fers
fro
m T
rans
ition
al F
inan
ce
Aut
hori
ty .
. . .
. . .
. . .
. . .
. . .
. . .
. .—
——
—2,
055
——
——
—T
rans
fers
fro
m N
on M
ajor
Cap
ital
Proj
ects
Fun
ds .
. . .
. . .
. . .
. . .
. . .
.2,
229
1,57
7—
——
——
——
—C
apita
lized
Lea
ses
. . .
. . .
. . .
. . .
. . .
.56
355
329
146
68—
——
——
Dec
reas
e (I
ncre
ase)
in A
mou
nts
Res
tric
ted
Pend
ing
Exp
endi
ture
s . .
.(1
22)
1,09
4(5
51)
(397
)29
980
(282
)22
173
806
Seas
onal
Bor
row
ings
. . .
. . .
. . .
. . .
. .
1,50
075
075
050
01,
075
2,40
02,
400
2,20
01,
750
1,40
0__
____
___
____
___
____
___
____
___
____
___
____
___
____
___
____
___
____
___
____
_To
tal O
ther
Sou
rces
of
Cas
h .
. . .
. . .
. . .
6,83
74,
733
3,83
53,
858
4,03
45,
040
4,71
24,
663
4,57
74,
136
____
___
____
___
____
___
____
___
____
___
____
___
____
___
____
___
____
___
____
___
Oth
er U
ses
of C
ash:
Rep
aym
ent o
f Se
ason
al B
orro
win
gs .
.(1
,500
)(7
50)
(750
)(5
00)
(1,0
75)
(2,4
00)
(2,4
00)
(2,2
00)
(1,7
50)
(1,4
00)
Fede
ral a
nd S
tate
Fin
ance
d C
apita
l Dis
burs
emen
ts .
. . .
. . .
. . .
.(3
33)
(590
)(3
54)
(352
)(3
20)
(380
)(3
75)
(331
)(8
8)(2
70)
Les
s R
eim
burs
emen
ts .
. . .
. . .
. . .
. . .
389
369
313
352
324
332
244
810
142
185
City
Fin
ance
d D
isbu
rsem
ents
Fo
r C
apita
l Con
stru
ctio
n .
. . .
. . .
. .(5
,986
)(4
,822
)(4
,607
)(4
,489
)(3
,780
)(3
,478
)(3
,421
)(3
,344
)(3
,322
)(3
,594
)D
ecre
ase
(Inc
reas
e) in
Oth
er,N
et .
. . .
763
(2,5
84)
391
1,66
21,
561
430
258
427
491
688
____
___
____
___
____
___
____
___
____
___
____
___
____
___
____
___
____
___
____
___
Tota
l Oth
er U
ses
of C
ash
. . .
. . .
. . .
. . .
.(6
,667
)(8
,377
)(5
,007
)(3
,327
)(3
,290
)(5
,496
)(5
,694
)(4
,638
)(4
,527
)(4
,391
)__
____
___
____
___
____
___
____
___
____
___
____
___
____
___
____
___
____
___
____
_N
et I
ncre
ase
(Dec
reas
e) in
Cas
h .
. . .
. . .
294
(167
)66
0(3
60)
431
(247
)(2
73)
449
198
(44)
Cas
h,B
egin
ning
of
the
Yea
r .
. . .
. . .
. . .
792
959
299
659
228
475
748
299
101
145
____
___
____
___
____
___
____
___
____
___
____
___
____
___
____
___
____
___
____
___
Cas
h,E
nd o
f th
e Y
ear
. . .
. . .
. . .
. . .
. . .
$1,
086
$79
2$
959
$29
9$
659
$22
8$
475
$74
8$
299
$10
1__
____
___
____
___
____
___
____
___
____
___
____
___
____
___
____
___
____
___
____
___
____
___
____
___
____
___
____
___
____
___
____
___
____
___
____
___
____
___
____
_
Com
ptro
ller’
s R
epor
t fo
r F
isca
l 200
2P
art
III—
Stat
isti
cal I
nfor
mat
ion
Gen
eral
Fun
d an
d N
ew Y
ork
Cit
y C
apit
al P
roje
cts
Fun
d—So
urce
s an
d U
ses
of C
ash—
Ten
Yea
r T
rend

WILLIAM C. THOMPSON, JR., Comptroller
GREG BROOKS, Deputy Comptroller
WARREN RUPPEL, Assistant Comptroller for Accounting
BUREAU OF ACCOUNTANCY
MICHAEL SPITZER, Chief Accountant/Bureau Chief
EILEEN MORAN, Deputy Chief Accountant/Deputy Bureau Chief
DIVISION CHIEFSSteve Bass Bruce GoodmanNancy Brunner Maria Tavares
UNIT CHIEFSBruce Barton Stephen MessingGertrude Capili Augustine OgisteGerard Cento Wannee PhanichayakarnStuart Frankel Wafik TawfikYolanda Gomez Denise Thorpe-ClarrettPatricia Kearns Martin WeinshenkerNatilie Laws Sharon Yip
285
E