2
44
1 | Copeland Associates @OHIO Integrated Business Cluster Transmittal Subject: Prepare a feasibility analysis on opening a business that offers outdoor adventure and health eating options in Portland Maine. Date November 15,2014 To: Professor Lori Marchese Professor John Keifer Professor Luke McElfresh Professor Jamie Lambert From: Queen's Port Tea PM 107 Billy Groves Anthony Head Jordan Andrews Harley O’Flaherty Lin Weisheng We established a business concept for the feasibility analysis, which includes: Trade dress for tea store Information System Insightly Memberships and promotions Brand identity Included in our report are two demand scenarios for the specialty tea store through comparable markets and traffic patters. We also described Porters 5 forces for the industry. A marketing plan has been set to describe our strategy towards gaining potential customers. To finalize the feasibility analysis we created financial project for the stores cash flows over a 5 year period. Each of these pieces of information helped us determine the feasibility to open a tea store in Portland Maine. Thank you for the opportunity to conduct this feasibility analysis for our client. We feel that this project has helped us gain an understanding and knowledge on how to determine the most effective plan towards starting a business.
-
Upload
anthony-head -
Category
Documents
-
view
46 -
download
2
Transcript of 2
1|Copeland Associates @OHIO
Integrated Business Cluster
Transmittal
Subject: Prepare a feasibility analysis on opening a business that offers outdoor adventure and health
eating options in Portland Maine.
Date November 15,2014
To: Professor Lori Marchese
Professor John Keifer
Professor Luke McElfresh
Professor Jamie Lambert
From: Queen's Port Tea PM 107
Billy Groves
Anthony Head
Jordan Andrews
Harley O’Flaherty
Lin Weisheng
We established a business concept for the feasibility analysis, which includes:
Trade dress for tea store
Information System Insightly
Memberships and promotions
Brand identity
Included in our report are two demand scenarios for the specialty tea store through comparable
markets and traffic patters. We also described Porters 5 forces for the industry. A marketing plan has
been set to describe our strategy towards gaining potential customers. To finalize the feasibility
analysis we created financial project for the stores cash flows over a 5 year period. Each of these
pieces of information helped us determine the feasibility to open a tea store in Portland Maine.
Thank you for the opportunity to conduct this feasibility analysis for our client. We feel that this
project has helped us gain an understanding and knowledge on how to determine the most effective
plan towards starting a business.

Copeland Associates @OHIO
Integrated Business Cluster
Natural & Specialty
Food Analysis
Prepared for:
Professor: Lori Marchese
Professor: John Keifer
Professor: Luke McElfresh
Professor: Jamie Lambert
Copeland Associates Faculty
College of Business
Ohio University
Prepared by:
Anthony Head
Harley O’Flaherty
Billy Groves
Lin Weisheng
Jordan Andrews
Copeland Associates Students
College of Business
Ohio University
3|Copeland Associates @OHIO
Integrated Business Cluster
Industry
Analysis
Business
Concept
Demand
Scenario
Marketing
Plan
Financial
Projections
Table of Contents
Figure 1 – Projected Profit Margins Natural and Specialty foods
Figure 2 – Major Market Segmentation by age
Figure 3 – Shopping Preferences of Specialty food consumers in U.S
Figure 4 – Store layout with key
Figure 5 – Comparable market cities with similar tea shops
Figure 6 – Population/Commuter/Tourist Population Maine
Figure 7 – Number of visitors daily near location of tea shop with expected average
Figure 8 – Initial Balance Sheet
Figure 9 – Income Statement
Appendix- A - Pest Analysis
Appendix- B - Porters 5 Forces
Appendix- C - Marketing 4 P’s
Appendix- D - Location Information
Appendix- E - Extra Industry Information
Appendix- F - Persona Identification
Appendix- G - Comparable Market Continued
Appendix- H - Store Supply Items
Appendix- I - Hours Open & Employee Schedule
Appendix- J - Store Flyer
Appendix- K - Queen’s Port Statement of Financial Position
Appendix- L - Website Screenshots
Section Description Slide No.
1 Introduction
Transmittal………………………………………………………………………………………………… #1
Title Page………………………………………………………………………………………………….. #2
Table of Contents………………………………………………………………………………………….. #3
Executive Summary……………………………………………………………………………………….. #4
Introduction……………………………………………………………………………………….……….. #5
2 Industry Analysis
Industry……………………………………………………………………………………………………. #6
Market……………………………………………………………………………………………………... #7
Competition……………………………………………………………………………………………....... #8
3 Business Concept…………………………………………………………………………………………….......... #9
4 Demand Scenarios
Comparable Market……………………………………………………………………………………….. #12
Traffic Patterns……………………………………………………………………………………………. #13
5 Marketing Plan……………………………………………………………………………………………………. #14
6 Financials………………………………………………………………………………………………………….. #16
Conclusion………………………………………………………………………………………………………… #17
References………………………………………………………………………………………………………… #18
Appendix………………………………………………………………………………………………………….. #24
Figure 10 – Average daily customers
Figure 11 – Product Breakdown
Figure 12 – Cash Flow Projection

4|Copeland Associates @OHIO
Integrated Business Cluster
Executive Summary
The purpose of this project is to provide a feasibility study on a Natural and Specialty Foods store in
the area of Portland, Maine. After conducting an industry analysis we had to create a store that had a
high chance of being profitable in the market. The store that research showed would be popular in
Portland, Maine was a British themed Tea House called Queens Ports Tea. The report will provide
an in depth look into the business concept and marketing plan that would make Queens Ports Tea
successful business Venture in Portland, Maine. The report will also include pro-forma financial
statements that will show that Queens Port Tea is in fact a feasible business.
Unique Business in a Growing Industry
After intensive analytical research the Natural and Specialty Food industry is growing due to
changes in social trends and the influx of different ethnic groups. People are starting to become
more health conscious and making healthy alternatives to products like coffee, processed foods, etc.
Portland, Maine is one of the healthiest cities in America and a majority of the population consumes
tea. This is perfect for a British themed tea house because of the high demand, low barriers to entry,
and lack of competition in the surrounding area. The location of Queen’s Port Tea is a high
trafficked area that draws a lot of attention. Both of our demand scenarios predict a high volume
amount of customers to enter our store. The location is critical to Queen Port’s success. Not only is
the location a high trafficked area but other tea shops in similar markets are also experiencing a
plethora of customers giving Queen’s Port Tea a very bright future.
High IRR and Positive Net Present Value
Based upon analytical research and the development of pro-forma financial statements the study
shows that this project should be accepted and is highly feasible. With an IRR of 57% and NPV of
$2,891,055 Queens Port Tea will be a very successful business in the Portland, Maine area
financially. Cash flows are significantly increasing, with a starting investment of $796,850.49
Queens Port Tea is expected to generate $559,942.29 by its 5th year of operating.
Final Recommendation
In conclusion Queens Port Tea has shown to be financially feasible as well as a unique business
concept that is in demand in the area of Portland, Maine. The NPV and IRR present enough data to
prove that financially the project is feasible and will be incredibly successful. The high trafficked
location of Queens Port Tea and the high amount of tea consumption in Portland, Maine also show
that the environment a catalyst to Queens Port Tea’s road to success.

5|Copeland Associates @OHIO
Integrated Business Cluster
Introduction
The purpose of this project is to conduct an initial environmental analysis, develop a business
concept and market plan, and compute financials to determine whether opening a natural and
specialty food store in Portland, Maine would be feasible. Statistics and findings have led us to
develop three key factors that lead to success in this industry. These three factors include average
household income, healthy trends of the area, and age demographics. Through our research we have
determined Queen’s Port Tea store to be highly feasible in the Portland, Maine area. Through our
report we analyze opportunities, threats, and trends that lead us to developing our project’s scope
and strategy that we can present to our client.
Average household
income
Healthy Trends of the
Area
Age Demographic
Key Success Factors
The reason that averagehousehold income is such animportant factor in thenatural and specialty foodindustry is considered aluxury way of eating and ispriced higher than regularretail stores. Averagehousehold income isimportant because thehigher the income the higheramount that will bedisposable and will be spenton specialty and naturalfoods.
The reasons for why healthytrends of the location isimportant is because thebigger the trend the moresuccessful that natural andspecialty foods will be.Locations who have a higherhealthy trend usually have apopulation of peoplewho prefer to workout, andeat organic. More peoplewill be interested in healthconscious alternativemaking it crucial to anindustry's success.
The age demographic is akey success factor becausethe amount of people thatbuy natural and specialtyfoods are going to be inbetween 18-50 years old. Itis important that the area ispopulated with this agegroup because of theeducation level of peoplewho are 18 or older is atleast through high schooland have been taught aboutnutrition.
6|Copeland Associates @OHIO
Integrated Business Cluster
Industry
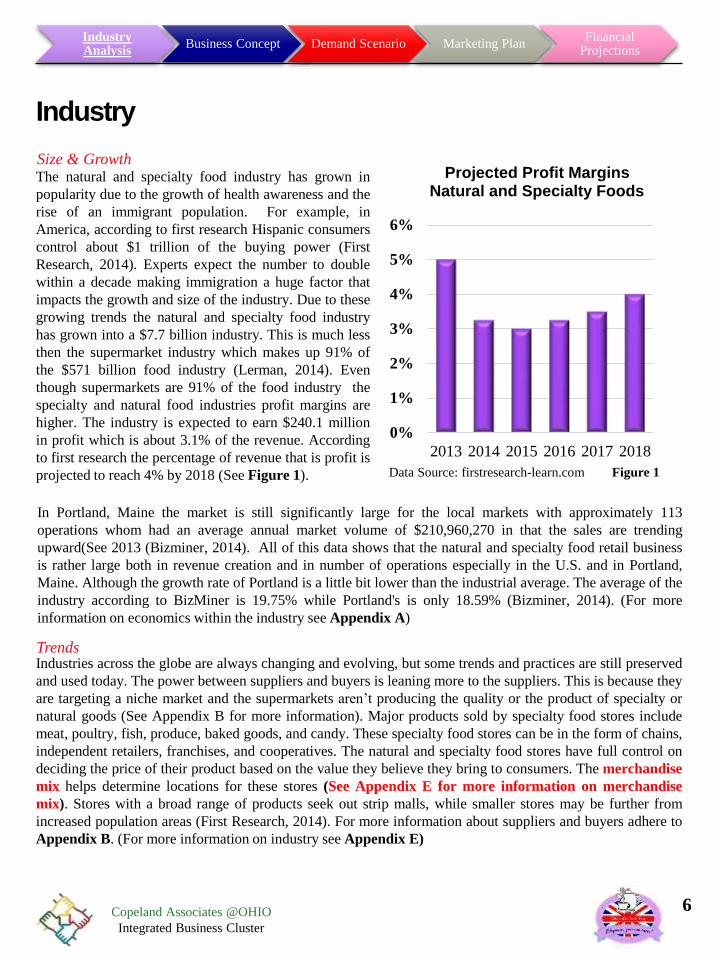
The natural and specialty food industry has grown in
popularity due to the growth of health awareness and the
rise of an immigrant population. For example, in
America, according to first research Hispanic consumers
control about $1 trillion of the buying power (First
Research, 2014). Experts expect the number to double
within a decade making immigration a huge factor that
impacts the growth and size of the industry. Due to these
growing trends the natural and specialty food industry
has grown into a $7.7 billion industry. This is much less
then the supermarket industry which makes up 91% of
the $571 billion food industry (Lerman, 2014). Even
though supermarkets are 91% of the food industry the
specialty and natural food industries profit margins are
higher. The industry is expected to earn $240.1 million
in profit which is about 3.1% of the revenue. According
to first research the percentage of revenue that is profit is
projected to reach 4% by 2018 (See Figure 1).
Industry Analysis
Business Concept Demand Scenario Marketing PlanFinancial
Projections
Data Source: firstresearch-learn.com Figure 1
In Portland, Maine the market is still significantly large for the local markets with approximately 113
operations whom had an average annual market volume of $210,960,270 in that the sales are trending
upward(See 2013 (Bizminer, 2014). All of this data shows that the natural and specialty food retail business
is rather large both in revenue creation and in number of operations especially in the U.S. and in Portland,
Maine. Although the growth rate of Portland is a little bit lower than the industrial average. The average of the
industry according to BizMiner is 19.75% while Portland's is only 18.59% (Bizminer, 2014). (For more
information on economics within the industry see Appendix A)
0%
1%
2%
3%
4%
5%
6%
2013 2014 2015 2016 2017 2018
Projected Profit Margins Natural and Specialty Foods
Industries across the globe are always changing and evolving, but some trends and practices are still preserved
and used today. The power between suppliers and buyers is leaning more to the suppliers. This is because they
are targeting a niche market and the supermarkets aren’t producing the quality or the product of specialty or
natural goods (See Appendix B for more information). Major products sold by specialty food stores include
meat, poultry, fish, produce, baked goods, and candy. These specialty food stores can be in the form of chains,
independent retailers, franchises, and cooperatives. The natural and specialty food stores have full control on
deciding the price of their product based on the value they believe they bring to consumers. The merchandise
mix helps determine locations for these stores (See Appendix E for more information on merchandise
mix). Stores with a broad range of products seek out strip malls, while smaller stores may be further from
increased population areas (First Research, 2014). For more information about suppliers and buyers adhere to
Appendix B. (For more information on industry see Appendix E)
Size & Growth
Trends

7|Copeland Associates @OHIO
Integrated Business Cluster
Market
ProductsThough, this industry may be considered somewhat of a niche market, there are still, a significant amount of
products in which a natural and specialty food retailer can sell. Located around Deering Oaks Park in
Portland more than 30% of the population uses organic foods. The three most common types of
organic food used in Portland are meat and poultry, any frozen foods, and yogurt (Simple Map, 2012
SimmonsLOCAL). Though, these brands may be less known among the general population, they are known
by some of the consumers in the industry and they would be willing to pay a higher price or a premium for
these natural and specialty foods.
Demographics & ConsumersThe natural and specialty foods demographic is very
broad. This is because each store is designed for a
specific niche market. The new healthy eating trend has
been perfect for this industry showing that one of the
most important demographic segments is age. As shown
on IBISWorld the industry is mostly comprised of people
who are aged between 18-35 taking up 34.5% of the
market while the second highest is adults 36-50 who take
up 29.5% of the market (Lerman, 2014). This shows that
adults and young adults are more educated and
aware of eating healthy than children or the
older generation. The consumers of this industry are
very knowledgeable of the products and expect the
employees of their store to be knowledgeable as
well. Statistically, 64% of customers shop at
specialty food stores where employees are
knowledgeable about products. Knowing the
information about the product will help with promotion
and knowledge of the health issues and benefits. 36% of
US consumers shop at specialty stores for this
reason (Statista, 2013 August). (For more information
on buyers refer to Appendix B)
OpportunitiesIn this industry, the rise in popularity of butcher shops are viewed as one of the industry opportunities because
it provides high quality products. Customers who shop in this industry care about quality over any other
factor. Another opportunity is called “DIY FOOD”, which means do-it-yourself food. A large majority of
customers show their interests in making food by themselves due to their independent lifestyle. The
opportunities will not only increase the demand for specialty and natural foods but also the ingredients that are
used to make them (First Research, 2014). (For more information on threats refer to Appendix B)
34%
29%19%
18%
Major Market Segmentation by age (2014)
18 - 35 36 - 50
Under 18 51 and Older
First Research (2014, October) Figure 2
Industry Analysis
Business Concept Demand Scenario Marketing PlanFinancial
Projections

8|Copeland Associates @OHIO
Integrated Business Cluster
Competition
Specialty FoodsStores in this industry are able to create a competitive advantage by “carving out a niche,” or focusing on
perfecting fewer products rather than wholesale. Generally these stores remain local and rely on strong
customer loyalty and uniqueness to distribute their products. Specialty food stores differentiate themselves
through quality, price, and brand to target the niche market.. The three most common types of organic food
used in Portland are meat and poultry, any frozen foods, and yogurt (Simple Map, 2012 SimmonsLOCAL).
These items give insight, from which our client can determine what kinds of specialty food products to
supply.
Employee knowledge of productsOrganic food demand is rising and will lead to more
demand in the specialty food store market (Lerman,
Sally, 2014 June). Knowing all the information about
your products enhance the chances of selling it. (See
Figure 4)
Informing individuals of the health benefits from
specialty food items gives reasoning for the value on
what consumer choose to eat and increases demand.
Increasing the awareness on the long-term effect that
specialty foods have on an individual’s life influences
the consumer’s decision to buy the product.
•Where employees knowledgeable about products64%
•Where consumers agree with company values46%•Where employees knowledgeable about health wellness issues
36%
•Where advice on recipe techniques are supplied33%
•Where consumers know the owner27%
(Statista, 2013 August). Figure 3
Shopping preferences
of specialty food consumers in U.S.
PricingCustomers that opt for lower costs over quality
can stop at any local Specialty Foods store and
find what they’re looking for. Mass
supermarkets’ and grocery stores pose a threat
to specialty food stores by providing customers
with products at lower prices. Two
components that need to be evaluated to
determine markup rates for our products are
household income and what we can afford to
invest into the business.
Building brand imageGrowing population in the United States increases
demand for food products (Lerman, Sally, 2014 June).
Finding who and what to supply will be crucial in
creating a valuable product for consumers.
Appealing productsWhen products are appealing to consumers, and are
considered a part of their culture, it will influence them
to buy the products. Specialty food stores produce
healthy and organic foods that appeal highly to diet-
conscious consumers.
Industry Analysis
Business Concept Demand Scenario Marketing PlanFinancial
Projections

9|Copeland Associates @OHIO
Integrated Business Cluster
Business Concept
Queen's Port Tea cares about having strong relationships with our customers that is why we have
started the usage of our CRM program ,Insightly , to track the habits, behaviors, and memberships
of our business. This will allow ease and efficiency of the business model. Queen's Port Tea will
implement Square Up to keep track of our transactions and sales to make sure that the financials are
accurate and clear. (for more information on technology refer to Appendix A.)
The items that Queen's Port Tea will sell to consumers all represent our brand image, elegance and
class. We will produce the finest and freshest exotic teas that can only be acquired at very select
stores in Portland, Maine. We will also have special seasonal beverages which include in the fall a
spicy sweet pumpkin tea latte, in the summer, a sweet and tart lemon tea, the winter, a spiced calm
and relaxing winter tea and in the spring a rejuvenating and revitalizing spring tea. We also offer an
assortment of fruit, black, white, herb, and milk teas that are good for the spirit, body, and mind.
There are two categories of teas that we offer beverage and traditional tea. Beverage teas include
fruit and milk whereas traditional includes original tea. Not only do we have a variety of teas we
also offer a plethora of delicious succulent food that makes any persons mouth water. These include
different kinds of nuts, muffins, dried fruit, scones and other pastries that go great with any one of
Queen's Port Tea’s teas. (For more information or product see Appendix C and Appendix L)
Vision
“Providing consumers with a relaxed but elegant ambiance, while they experience a unique way to enjoy their tea of choice”
Location 569 Congress St
Yearly cost = $34,110
Monthly cost = $2,842.50
Bus stop Hotel
Starbucks Congress Square
Gourmet pizza Misc. Shopping
Deering Oaks park Restaurants
Queen's Port Tea is aimed to provide consumers
with a unique way to purchase, experiment, and
enjoy specialty tea and food options. We have
targeted a specific market in order to integrate our
products successfully into the natural and specialty
foods industry. Our target market includes tea
enthusiasts, well educated, people with ages ranging
from early twenties to late fifties. The location of
our store is located near a park, apartment complex,
hotel, parking garage, and is located exactly 1 mile
away from the University of Southern Maine. We
chose this location because all factors of our target
market are met and accounted for. Refer to
Appendix D for further explanation on how our
location meets the factors of our target market. Our
tagline states our overall view of the products we
provide to consumers, “Elegance you can taste”.
Products Offered
Information Systems
Introduction
Industry AnalysisBusiness Concept
Demand Scenario Marketing PlanFinancial
Projections

10|Copeland Associates @OHIO
Integrated Business Cluster
Business Concept
High quality products
Strong branding techniques
Promotional options
Marketing strategies
Brand Identity
Queen's Port Tea isn’t just a tea store and cafe it is a way of life. To embrace the Queen's Port Tea
lifestyle the customer must breathe class, elegance, and relaxation. Queen's Port Tea not only
represents elegance but the ability to remain calm at all times. Queen's Port Tea believes that the
different teas can affect a customer's mood, health, and overall life. The company wants to provide
consumers with a relaxed but powerful ambiance, while they experience a unique way to enjoy their
tea of choice. The way that allow customer creativity is we have a tea creation and taste bar. This is
one of the most unique features of the brand. Customers will be able to try any tea of their choice
and create their own special concoction of Queen's Port Teas exotic teas. This will give the
customer the ultimate interactive experience to find their own Zen. Queen's Port Tea wants
customers to discover their identity through our variety of specialty teas.
Memberships & Promotions:
Queen's Port Tea offers many promotional offerings for our
consumers through our membership program. Signing up for
exclusive access into our membership club rewards consumers with
multiple benefits. Exclusive members of Queen's Port Tea receive
discount tea and retail options, birthdays and Holidays, as well as
discount cooking classes and free recipe pamphlets. Each member
receives a membership loyalty card that can be swiped for discounts
and prepay options. We offer incentives, such as discounts and retail
items, to members who sign up others for memberships here at
Queen's Port Tea. Social media is a huge part in people’s daily lives
all over the world. Consumers who post pictures enjoying Queen's
Port Tea products to social media accounts and captioning the photo
with, #Queen'sPortTea, will receive a one time discount off their
next purchase. Discounts for consumers differ depending on their
membership level.(For more information on 4ps see Appendix C)
Figure 4
Key Takeaway
Industry AnalysisBusiness Concept
Demand Scenario Marketing PlanFinancial
Projections

11|Copeland Associates @OHIO
Integrated Business Cluster
Business Concept
More info Appendix D
Queen's Port Tea integrates a relaxed but yet elegant
ambiance throughout our store. Our theme is designed
to represent a traditional style English tea store that
provides customers with a unique way to enjoy their
tea of choice. Our theme will include colors that are
represented on the English flag; white, red and blue.
Being located near a main distribution port in Portland,
we plan to design our store with a sea theme as well.
This sea theme will include antique look-a-like ships,
English style table and chair set up, and elegant drapes.
These factors will create the English ambiance we are
trying to portray in our Queen's Port Tea store for
customers in the Portland, Maine area. Providing
scones, pastries, and muffins will only add to the
customer’s experience of a traditional style English tea
house. We plan to incorporate our store logo on our to-
go tea cups, to-go bags, and on all packaged brand
items. Placing our logo on these products will only
help Queen's Port Tea integrate our product and brand
identity to the tourists and local population of Portland,
Maine. The brand image we portray to consumers is
unique and different than what any competitor in our
industry provides. Our promotional and marketing
ideas are what bring our customers in, while our
environment and ambiance keep loyal customers
coming back.
Trade Dress
Industry AnalysisBusiness Concept
Demand Scenario Marketing PlanFinancial
Projections

12|Copeland Associates @OHIO
Integrated Business Cluster
Demand Scenario
Figure 5References Page 13, lines 3-8
Williamsburg, VA (70%)Williamsburg, VA is an extremely close
comparison to the market in Portland, ME.
This is due to Williamsburg’s similar tourist
population and other similarities such as
weather and demographics. The person that
was interviewed for the information in Figure
5, was Laura from the Spice & Tea Exchange.
The location of this store is also significantly
more similar in location to Queen's Port Tea,
than the location of the store in Bellingham,
WA. This is why Williamsburg is weighted as
a 70%.
Bellingham, WA (30%)Bellingham, WA also, has a comparable market
to Portland, ME. They have a similar tourist
population each year, as well as, a similar
median household income. Though, they do
have tea shops, the locations of the tea shops
are not as comparable to the location of Queen's
Port Tea. The person that was interviewed in
Bellingham, WA, was Allie from Spice Hut.
The information that they provided was
inputted into Figure 5. This is why the city of
Bellingham, WA, was only rated as 30%, in
comparability to the location in Portland, ME.
The data that both Laura and Allie provided from their stores was used to determine the potential
daily visitors of Queen's Port Tea. The similarity in the tourist population and social population
between all three of the cities listed in Figure 5, allows us to determine the approximation of these
variables. We took the weighted average, of the percentage of the daily population who visit the tea
shops in both Williamsburg, VA and Bellingham, WA. Through this equation, Queen's Port Tea is
projected to have 125 visitors daily. This scenario was weighted at 75% because this scenario uses
primary information from similar markets. This makes the comparable market the most feasible
demand scenario.
Comparable Market: 75%
Key Takeaway:
Industry Analysis Business ConceptDemand Scenario
Marketing PlanFinancial
Projections

13|Copeland Associates @OHIO
Integrated Business Cluster
Demand Scenario
569 Congress St. is located in the heart of
downtown Portland. Portland has many different
attractions from arts & culture, shopping,
transportation, and corporate offices. Being a
gathering point for the community and tourist
this are gives them ability to enjoy a day in
Portland Maine. The street to with Congress
Square located on one end and Lincoln Park on
the other. Being located closer to these parks will
bring more pedestrian traffic that will create
more awareness towards our retail store.
110
250
592
317
0 200 400 600
FIVE FIFTY-FIVE
DUNKIN DONUTS
STARBUCKS
TEAM 5
Number of Visits Per Day
References Page 13, lines 3-8 Figure 7
Data Source: SimmonsLOCAL, Portland
Maine Figure 6
Total Population of Portland
• 66,318
Portland employed commuters
• 270,000
Average Annual Tourism Yearly
• 5,800,000
We will use marketing techniques for
designing the display of our store front to draw
customers into our store. From the investment
in our prime location we gained the high foot
traffic that will be influenced by out discounts
and free samples described in our business
concept. We rated traffic pattern demand
scenario at 25% because this statists rely more
on secondary research compared to
comparable markets primary research (refer to
Figure 7). For more information on the key
location for Queen’s Port Tea refer to
Appendix D.
Key Takeaways:
Average Annual Tourism
Commuter EmploymentTraffic Patterns: 25%
Nearly 270,000 people that live in Maine
commute to work in the Portland area every
day. (Tourist stats Portland Maine 2010, Feb).
Congress St. annual average daily traffic is
around 29,000 cars per day. (Maine Traffic
Counts 2014, September). The massive amount
of people that come to Portland every day will
bring awareness and potential customers to our
sites location because of the high traffic area.
The average annual tourist population for
Portland Maine 5,800,000 people. Tourists that
enjoy there stay at the Westin Portland
Harborview hotel will be supplied with a
broacher that will promote our stores products
and bring potential consumers to our store.
Industry Analysis Business ConceptDemand Scenario
Marketing PlanFinancial
Projections

14|Copeland Associates @OHIO
Integrated Business Cluster
Marketing Plan
Queen's Port Tea plans to integrate our products
and service by creating a strong strategically
designed marketing plan. Our marketing plan will
include product sampling, a marketing partnership
with local book store, a “Grand Opening” banner,
a table at a local festival, and a designed flyer and
brochure. This marketing plan will help integrate
our high quality products into a competitive
market in Portland, Maine.
Yes Books
Product Marketing
Promotional Days
Product Marketing
Queen's Port Tea plans to incorporate the use of a brochure to expand our name to Portland, Maine
and surrounding areas. The brochure will include key features of our store, popular items, contact
information, and information about the location of our store. The brochures are going to be located
in the hotel to attract tourists staying at the hotel to experience something unique and different. Not
only will these brochures also be located outside of our store for pass-through traffic, but we will be
providing street side samples of our products. By providing products to consumer’s street side, we
can attract them directly into our store. Also, flyers with similar but less detailed information will be
passed around the local college campus to attract college students and local residents of Portland,
Maine. Flyers are generally used for disposable marketing and are intended to be passed out to
random people. Queen's Port Tea will also be placing a “Grand Opening” banner across the top of
our store to attract all customers, and invite them to try something new. Successfully marketing our
product will lead to an increased customer base leading to customer loyalty and satisfaction
Marketing Partnership
To reach our target market even more effectively we have collaborated with a local book store and
reached a marketing partnership agreement. Yes Books is a local book store located only 1 minute
walking distance away from our store’s location. The thought of being able to purchase a book and
make the short walk to our store to enjoy a tea of choice and the newly purchased book creates more
interest for our target market. Purchasing a book from Yes Books will guarantee a 5% onetime
discount offer on a customer’s tea of choice. Likewise, purchasing a retail item in our store will
guarantee a 5% onetime discount offer on a single book of the customer’s choice. People enjoy
something warm to sip on while diving in and enjoying a great book that Yes Books can offer. This
marketing partnership will lead customers to our store over competitors due to the discount they will
receive upon buying a book.
Industry Analysis Business Concept Demand Scenario Marketing PlanFinancial
Projections

15|Copeland Associates @OHIO
Integrated Business Cluster
Marketing Plan
Queen's Port Tea wants to prove to our customers that we are much more than simply a tea store
looking to make money. We plan to donate 10% of our generated revenue from a specific product on
October 1st, to breast cancer research. October is the month to raise awareness and promote breast
cancer research. We also plan to do the same process in April with the organization, Autism speaks.
This organization raises awareness and promotes Autism research. We plan to analyze our data and
determine what product will be used based on popularity to ensure we can donate as much as
possible. People are more apt to buy products where the money they are spending is going to a
benefit or charity rather than to the stores revenue. These two days will not only increase our
revenue, but also raise money and awareness for two of the biggest research organizations in the
world.
Promotional Days
We plan to attract the local population of Portland, Maine by setting up a table at the local festival.
This festival attracts people of all ages including children who can have their face painted and visit
the local toy stores as the festival is going on. This is why Portland’s annual Kick-Off to Summer
festival is the perfect destination for us to integrate and introduce our products to the local
community. The more than 30 year on-going festival includes local foods, arts and crafts, and
multiple music stages creating a vibrant environment for festival-goers. Lemonade is a local favorite
beverage at this festival, which allows us to challenge this norm and introduce our refreshing
summer tea to the local population. Our tea would provide an alternative beverage for customers of
the festival to enjoy something new with their food rather than lemonade.
Industry Analysis Business Concept Demand Scenario Marketing PlanFinancial
Projections
16|Copeland Associates @OHIO
Integrated Business Cluster
Financial Projections
Industry Analysis Business Concept Demand Scenario Marketing PlanFinancial
Projections
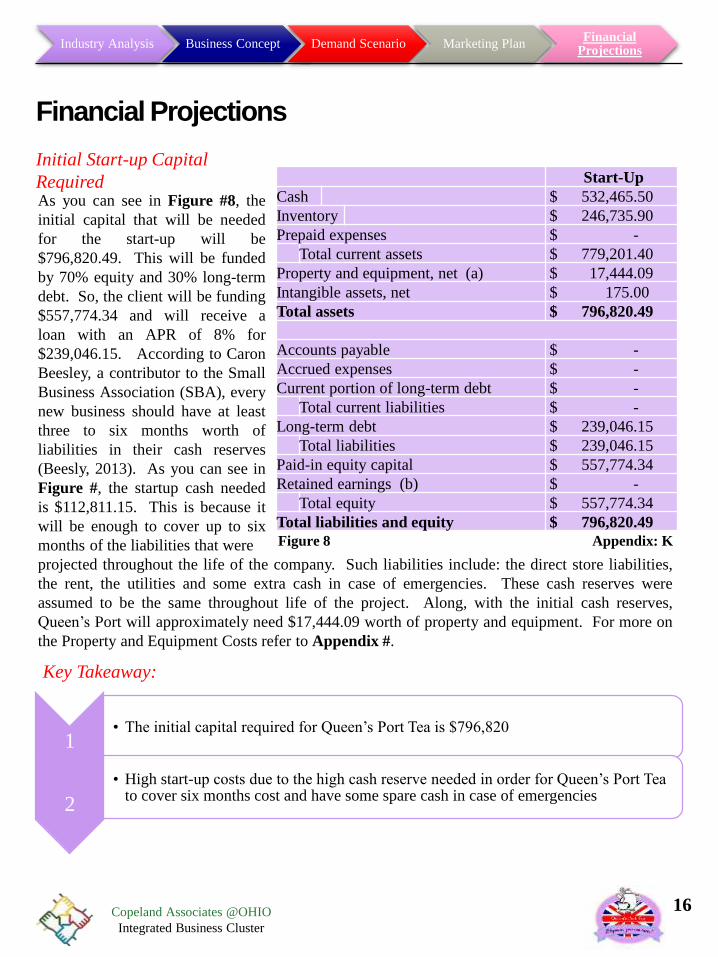
Start-Up
Cash $ 532,465.50
Inventory $ 246,735.90
Prepaid expenses $ -
Total current assets $ 779,201.40
Property and equipment, net (a) $ 17,444.09
Intangible assets, net $ 175.00
Total assets $ 796,820.49
Accounts payable $ -
Accrued expenses $ -
Current portion of long-term debt $ -
Total current liabilities $ -
Long-term debt $ 239,046.15
Total liabilities $ 239,046.15
Paid-in equity capital $ 557,774.34
Retained earnings (b) $ -
Total equity $ 557,774.34
Total liabilities and equity $ 796,820.49
Initial Start-up Capital
RequiredAs you can see in Figure #8, the
initial capital that will be needed
for the start-up will be
$796,820.49. This will be funded
by 70% equity and 30% long-term
debt. So, the client will be funding
$557,774.34 and will receive a
loan with an APR of 8% for
$239,046.15. According to Caron
Beesley, a contributor to the Small
Business Association (SBA), every
new business should have at least
three to six months worth of
liabilities in their cash reserves
(Beesly, 2013). As you can see in
Figure #, the startup cash needed
is $112,811.15. This is because it
will be enough to cover up to six
months of the liabilities that were
projected throughout the life of the company. Such liabilities include: the direct store liabilities,
the rent, the utilities and some extra cash in case of emergencies. These cash reserves were
assumed to be the same throughout life of the project. Along, with the initial cash reserves,
Queen’s Port will approximately need $17,444.09 worth of property and equipment. For more on
the Property and Equipment Costs refer to Appendix #.
Figure 8 Appendix: K
Key Takeaway:
1• The initial capital required for Queen’s Port Tea is $796,820
2
• High start-up costs due to the high cash reserve needed in order for Queen’s Port Tea to cover six months cost and have some spare cash in case of emergencies

17|Copeland Associates @OHIO
Integrated Business Cluster
Financial Projections
Year 1 Year 2 Year 3 Year 4 Year 5
Sales (a) $ 1,711,067 $ 1,763,987 $ 1,818,543 $ 1,874,787 $ 1,932,770
Gross profit $ 1,062,572.76 $ 1,095,435.83 $ 1,129,315.29 $ 1,164,242.57 $ 1,200,250.07
Operating income $ 877,511.46 $ 904,514.74 $ 934,231.84 $ 964,519.71 $ 995,472.89
Net income $ 492,872.15 $ 508,185.08 $ 525,016.18 $ 542,249.24 $ 559,942.29
Industry Analysis Business Concept Demand Scenario Marketing PlanFinancial
Projections
Figure #9 Appendix: K
Income StatementFigure #9 contains the pro forma income statement for Queen’s
Port Tea in the first five years of operation. The projected revenue
for Queen’s Port Tea is expected to be almost $2,000,000 in its first
year alone. This is a significant amount of sales for a start-up
company. However, this was calculated using the weighted
average of the demand scenarios discussed earlier. The weighted
average showed that there should be approximately 173 customers
daily. Since, the businesses had been in operation for more than
five years, the consumers daily of 173 was placed in the fifth year
and subtracted three percent each year to account for the lack of
brand from a start-up Figure #10. This was then multiplied by the
average transaction value, which was approximated at $31.12. The
average transaction value was calculated through benchmarking a
similar store called Teavana. Teavana had an average transaction
value of $36. This was broken down to 56% Tea Retail 40% Tea
ware and 4% Beverages. Queen’s Port Tea will have a similar
product breakdown. However, Queen’s Port Tea has more variety
in their product lines. So, the product breakdown was broken
down in Figure #11. The cost of goods sold (COGS), was also
benchmarked off of Teavana’s 10k that was found on
getfilings.com. The COGS was found as 37.90% of revenue. This
will allow Queen’s Port Tea to have significant margins and leave
the owner with a substantially higher net income. (Cain, 2011).
Queen’s Port Tea: Product Breakdown
52% Tea Retail 30% Tea ware 10% Services8%
Beverage/Foods
Figure #11 Appendix: K
140
145
150
155
160
165
170
175
1 2 3 4 5
Average Daily
Customers
YearFigure #10 Appendix: K

18|Copeland Associates @OHIO
Integrated Business Cluster
Financial Projections
Project Cash Flows0 1 2 3 4 5
Project
cash flow $(796,645.49) $(3,015.17) $16,228.20 $34,449.53 $53,511.11
$
7,451,182.12
Industry Analysis Business Concept Demand Scenario Marketing PlanFinancial
Projections
Accept or Decline Queen’s Port TeaFigure #12 contains the cash flows that were
projected from the pro income statement and
pro forma balance sheet. Theses cash flows
show that the initial investment will be
approximately $796,645.49. The first year will
have a negative cash flow. However, The rest
rise steadily.
Figure #12 also, contains the Weighted
Average Cost of Capital (WACC) which is
13.23%. The cost of equity was determined to
be around 16.94% because according to
Aswath Damodaran from Stern School of
Business, the risk premium that should be
added to a five year projection should be
8.94% (Damodaran, Pg. 6).
Figure #12 contains the net present value,
internal rate of return, and payback period.
With the use of the WACC the net present
value shows that is safe to accept the project.
The IRR is also higher than the WACC so this
also shows that one should accept Queen’s Port
Tea.
Capitalx
Cost ofx
After-Tax= WACC
Structure Capital Adjustment
Debt 30% x 8% x 57% = 1.37%
Equity 70% x 16.94% = 11.86%
13.23%
Decision-Making Criteria
Net present value = $2,891,054.60
Internal rate of return = 57%
Payback period = 4.09
Figure #12 Appendix: K
Key Takeaway:
Projected cash flows steadily increase throughout the 5
years.
The WACC is 13.23%
Both the NPV and IRR show that a manager would accept
Queen’s Port Tea
19|Copeland Associates @OHIO
Integrated Business Cluster
Conclusion
Through conducting an initial environmental analysis, developing a business concept and marketing
plan, and computing financials, research proves that Queen’s Ports Tea store is highly feasible in the
Portland, Maine area. Statistics throughout the report prove that Portland, Maine has an increasing
demand for products and services in the Natural and Specialty Foods industry. Average household
income, age demographics, and increasing healthy trends are the three key factors that drive demand
in this industry. Queen’s Port tea will be successful in the Portland, Maine area by providing
customers with healthy delicious beverages, compatible food items, and a unique experience
different from competitors. By weighing the two demand scenarios we were able to create a more
focused strategy for Queen’s Port Tea. After conducting a in-depth financial analysis Queens Port
Tea is a feasible and the owner is projected to have enough income to open up another Queens Port
Tea in a different location.
Key TakeawaysPortland high demand for Specialty food items
Growing Market Trends
Traffic Patters Demand Scenario = 25%
Comparable Markets Demand Scenario = 75%
Brand Oriented Marketing Plan
Feasible Business

20|Copeland Associates @OHIO
Integrated Business Cluster
Reference
Geographic Research, Inc. (2014). Standard Report of Retail Sales from Specialty Food Stores
2014 NAICS
Retrieved from Simple Map database
http://www.simplymap.com.proxy.library.ohiou.edu/index.html
IBISWorld US. Lerman, Sally (2014 June). Specialty Food Stores in the US
Retrieved from IBISWorld
http://clients1.ibisworld.com.proxy.library.ohiou.edu/reports/us/industry/currentperforma
nce.aspx?entid=1046
Geographic Research, Inc. (2012). SimmonsLOCAL Organic food uses Yes
Retrieved from Simply Map database
http://www.simplymap.com.proxy.library.ohiou.edu/index.html
Statista, Mintel (2013, August) Shopping preferences of specialty food consumers in the US 2013
Retrieved from Statista
http://www.statista.com.proxy.library.ohiou.edu/statistics/301330/us-specialty-food-
consumers-shopping-preferences/
Statista, Mintel (2013 August). US consumers reasons for purchasing specialty foods in 2013
Retrieved from Statista
http://www.statista.com.proxy.library.ohiou.edu/statistics/301311/specialty-foods-us-
consumers-reasons-for-purchase/
Lerman, Sally. (2014 June). Specialty Foods Stores in the US.
Retrieved from IBIS world
http://clients1.ibisworld.com.proxy.library.ohiou.edu/reports/us/industry/default.aspx?ent
id=1046
FDA. (2014, June 26). Food Labeling Guide.
Retrieved from FDA’s homepage
http://www.fda.gov/Food/GuidanceRegulation/GuidanceDocumentsRegulatoryInformati
on/LabelingNutrition/ucm2006828.htm
First research. (2014 October, 13). Specialty Food Stores.
Retrieved from First Research
http://mergent.firstresearchlearn.com.proxy.library.ohiou.edu/industry_detail.aspx?pid=3
30&chapter=1
21|Copeland Associates @OHIO
Integrated Business Cluster
Reference
Tourism Matters, (2014). Tourism in Washington
Retrieved from
http://www.whytourismmatters.com/regions/nwwashington/default.html
U.S. Dept. Bureau of Economic Analysis (2013, March) Per Capita Personal Income by State
Retrieved from
http://bber.unm.edu/econ/us-pci.htm
Sperling Best Places (2010, September) Economy in Bellingham, Washington
Retrieved from
http://www.bestplaces.net/economy/city/washington/bellingham
City Data (2013) Portland Maine Onboard Infomatics
Retrieved from
http://www.city-data.com/city/Portland-Maine.html
City Data (2013) Williamsburg Virginia Onboard Infomatics
Retrieved from
http://www.city-data.com/city/Williamsburg-Virginia.html
City Data (2013) Bellingham Washington Onboard Infomatics
Retrieved from
http://www.city-data.com/city/Bellingham-Washington.html
Tourists’ population stats Portland. Sanford, Sarah (2010 February) Portland Maine
Retrieved from
http://newenglandcondo.com/articles/273/1/Portland-Maine/Page1.html
Tourists’ population stats Williamsburg. (2002, March) Tourist Satisfaction
Retrieved from
http://scholar.lib.vt.edu/theses/available/etd-05142002-171010/unrestricted/Thesis.pdf
Bernstein Research. (2007, October 1). U.S Packaged Foods: Beyond Atkins- The Trend Toward
Healthy
Eating. Retrieved October 16, 2014, from Bernstein Research website:
http://web.b.ebscohost.com.proxy.library.ohiou.edu/ehost/pdfviewer/pdfviewer?sid=e1a0cc73-
f071-4b1b-9c2c-dab8d42898f9%40sessionmgr198&vid=6&hid=105

22|Copeland Associates @OHIO
Integrated Business Cluster
Reference
SpecialtyFoods.com. (2014). The State of the Specialty Foods Industry 2014.
Retrieved from Specialty Foods.com
http://www.specialtyfood.com/knowledge-center/industry-info/state-industry-14/
Bizminer. (2014, October). Specialty Food Stores: Maine.
Retrieved from Bizminer
http://reports.bizminer.com/temp/pdf/1802266941.pdf
Bizminer. (2014, October). Specialty Food Stores: Portland, Maine.
Retrieved from
http://reports.bizminer.com/temp/pdf/795775566.pdf
Bizminer. (2014, October). Specialty Food Stores: U.S.
Retrieved from
http://reports.bizminer.com/temp/pdf/12313087.pdf
Dan. (2011, September 30). Your retail pricing is key.
Retrieved from
http://tothegroceryshelf.com/2011/09/30/your-retail-pricing-is-key/
Dan. (2011, September 2). Who you sell when using a Specialty Food Distributor.
Retrieved from
http://tothegroceryshelf.com/2011/09/02/who-you-sell-when-using-a-specialty-food-
distributor/
Dan. (2011, August 19). What is specialty food?
Retrieved from
http://tothegroceryshelf.com/2011/08/19/what-is-specialty-food/
Natural food. (n.d.). Natural Food
Retrieved from
http://www.merriam-webster.com/dictionary/naturalfood

23|Copeland Associates @OHIO
Integrated Business Cluster
Reference
Hoovers Inc. (2014). Specialty Food Stores. Retrieved from First Research website:
http://mergent.firstresearch.learn.com.proxy.library.ohiou.edu/industry.aspx?chapter=0&pid=33
0
Specialty Food Association. (2013, October). Distribution of specialty food consumers in the
U.S. in 2013, by gender. Retrieved from Statista website:
http://www.statista.com.proxy.library.ohiou.edu/statistics/301325/us-specialty-foods-share-of-
consumers-buying-online/
Special food association. (2013, August). Share of U.S. consumers purchasing specialty foods
online in 2013, by category. Retrieved from Specialty Food association: Mintrel website:
http://www.statista.com.proxy.library.ohiou.edu/statistics/301325/us-specialty-foods-share-of-
consumers-buying-online/
Telesca, J. (2011, October 16). Natural Food Industry Brings Attention to GMOs. Retrieved from
White House website:
http://web.b.ebscohost.com.proxy.library.ohiou.edu/ehost/detail/detail?sid=64899b98-9b3c-
4f71-9491-
a89785382b67%40sessionmgr112&vid=0&hid=105&bdata=JnNpdGU9ZWhvc3QtbGl2ZSZzY
29wZT1zaXRl#db=bth&AN=67075779
Geographic Research, Inc. (2014) Standard Report of Retail Sales from Specialty Food Stores
2014 NAICS
Retrieved from Simple Map database
http://www.simplymap.com.proxy.library.ohiou.edu/index.html
Geographic Research, Inc. (2012, fall) SimmonsLOCAL Shopping Primary Shopper Gender
Retrieved from Simple Map database
http://sm2.simplymap.com.proxy.library.ohiou.edu/index.html
Sullivan, Laura, Spice & Tea Exchange (2014, October 3) Phone call (757)-229-8327
Retrieved by Phone call
Sargent, Charles, (2014, November 16) “Yes Books” Phone call (207)-775-3233
Retrieved by Phone call

24|Copeland Associates @OHIO
Integrated Business Cluster
Reference
Stern School of Business, (ND) Equity Risk Premiums
Retrieved from World Bank
http://www1.worldbank.org/finance/assets/images/Equity_Risk_Premiums.pdf
Bankrate Inc. (April 15, 2014) 2013/2104 Tax Brackets
Retrieved from Bankrate.com
http://www.bankrate.com/finance/taxes/tax-brackets.aspx
Teavana FORM 10-K (2012, April 13) Teavana Holdings, Inc. FORM 10-K
Retrieved from getfilings.com
http://www.getfilings.com/sec-filings/120413/Teavana-Holdings-Inc_10-K/
IRS Publications (ND) Figuring Depreciation Under MARCS
Retrieved from IRS.gov
http://www.irs.gov/publications/p946/ch04.html#d0e4058
A/N Group Inc. (2014, January 27) Federal Depreciation Rates
Retrieved from SMBIZ.com
http://www.smbiz.com/sbrl012.html
Beesley, Caron (2013, April 15) Managing Small Business Cash Flow
Retrieved from Small Business Administration
https://www.sba.gov/blogs/managing-small-business-cash-flow-answers-10-
commonly-asked-questions
Study Coupons (2010, May 26) 60% of customers look for coupons before shopping
Retrieved from Retail customer experience
http://www.retailcustomerexperience.com/articles/study-60-percent-of-customers-
look-for-coupons-before-shopping/
Dahl, Darren (2011, August 8) The cost of Starting up Retail Shop
Retrieved from INC.com
http://www.inc.com/articles/201108/business-start-up-costs-retail-store.html

25|Copeland Associates @OHIO
Integrated Business Cluster
Reference
Stern School of Business, (ND) Equity Risk Premiums
Retrieved from World Bank
http://www1.worldbank.org/finance/assets/images/Equity_Risk_Premiums.pdf
Miller, Stephen (2013, October 8) Pay Trends for 2014: Salary Increases Hold Steady
Retrieved from Society for Human Resource Management
http://www.shrm.org/hrdisciplines/compensation/articles/pages/2014-salary-
increases-flat.aspx
Salary Retail Store (ND) National Averages Retail Store Manager Assistant
Retrieved from International Business Machines Corporation
http://swz.salary.com/salarywizard/Retail-Store-Manager-Assistant-Salary-
Details.aspx?hdcbxbonuse=off&isshowpiechart=true&isshowjobchart=false&isshow
salarydetailcharts=false&isshownextsteps=false&isshowcompanyfct=false&isshowa
boutyou=false

26|Copeland Associates @OHIO
Integrated Business Cluster
Appendix A Pest Analysis
Political
• The Food and Drug Administration (FDA) is responsible for assuring that food products sold here in the US are safe and properly labeled. The FDA has passed The Federal Food, Drug, and Cosmetic Act (FD&C Act) and the Fair Packaging and Labeling act to govern food products under the FDA’s supervision. The Nutrition Labeling and Education Act require most foods to have nutritional labeling. Foods that have this nutritional content and health messages must comply with specific requirements. Regulations in this industry frequently change, which is why it is so important for companies in this industry to remain current on all political issues.
Economic
• The natural and specialty food industry is expected to experience growth due to the increase in consumer confidence and the increase in per capita disposable income. As disposable income rises, consumer’s confidence raises allowing them to spend their extra money at the natural and specialty food stores. Revenue is expected to grow at an annualized rate of 1.3% for the next 5 years to $8.3 billion. Most players in this industry are American-owned and earn their sales domestically. Some players do own operations abroad, but research shows there are no major players in this industry abroad. Companies in the US do not directly trade in exports, but still may be affected by them (Lerman, 2014 June).
Social
• The social element of the PEST model deals with social behaviors of the companies and consumers within a certain industry or market. Disposable income is one factor that must be taking into consideration when discussing social behavior within the natural and specialty foods industry. As the economy continues to recover and disposable income increases, the number of stores in the natural and specialty foods industry is expected to increase at an annualized rate of 1.8% for the next five years. This growth is likely to be offset by increased growth in supermarkets offering specialty foods, but still be effective due to consumers buying local products (Lerman, 2014).
Technological
• Technology advancement and research is low in the natural and specialty foods industry. The technological aspect of this industry is generally limited to shop security and the use of cash registers. Recently players in this industry have experienced the development of radio frequency identification (RFID) tags. RFID is used as an efficiency improving inventory control device that can store more product information. RFID has the ability to track all food product items throughout its supply chain. This increase of stored information allows retailers to minimize store shrinkage. This RFID technology is used to save costs for retailers in the long run of their company (Lerman, 2014 June).

27|Copeland Associates @OHIO
Integrated Business Cluster
Appendix B Porters 5 Forces
Supplier Power
Suppliers in this industry have the power to offer different prices, differentproducts, and target a specific niche market. These three factors are what cangive a company an advantage over competitors in this industry. Companiescan focus on providing certain products to a specific target market. Thisallows companies to perfect their products uniqueness and quality, leadingthem to an advantage over competitors.
Buyer Power
Buyer power is extremely high in this industry because consumers can getspecialty food products at supermarkets for cheaper prices than actual naturaland specialty food stores. Consumers choose these products because they aremuch higher quality items than what is sold at supermarkets for cheaperprices. As disposable income continues to increase, consumers will continueto gain confidence in spending the extra money for higher quality productsoffered in this industry.
Competitive Rivalry
The competition not only lies among companies within this industry, but alsolarge retail supermarkets and grocery stores. These larger retail stores canoffer natural and specialty food products at a lower price than stores in thisindustry. Stores within the natural and specialty foods industry compete byoffering local and natural products to a targeted market of consumers at a fairprice. The price is driven by what suppliers feel is necessary for the qualityof their product.
Threat of Substitution
The threat of substitution throughout this industry is relatively lowconsidering the local trend of consumer buying. Stores within this industryfocus on providing consumers with high product quality to a specific targetmarket. Focusing on a specific target market allows suppliers to perfect theirproducts. Large supermarkets and grocery stores offer a variety of specialtyfood products at a lower cost, but are lower quality than products offeredfrom stores in natural and specialty foods industry.
Threat of New Entry
The threat of new entry is low and continuing to remain low. The absence oflarge major players in this industry is why this industry has such a low levelof industry concentration. This lack of market dominance does potentiallyallow new store retailers to enter this industry by creating an easier route toattract and maintain market share. Entry costs are relatively low compared toother industries allowing potential players the ability to not be constrained bythe initial capital investment.

28|Copeland Associates @OHIO
Integrated Business Cluster
Appendix C4 P’s
Product
Our products not only add value to our store, but help create a connection with our store and
potential customers. Customers are able to experience high quality products in a unique way that
only Queen Port’s tea store can provide. Located in our store is a tea creation bar that allows
customers to mix and match tea and create their very own blend of tea. We offer retail packages of
our tea so that customers have the chance to make their tea in the comfort of their home. Customers
are also able to purchase to-go cups of tea to enjoy their favorite tea blend on the go. Our brand
image creates a relaxed but elegant feel that customers enjoy while they enjoy their favorite blend of
Queen Port’s tea.
Price
Our products quality reflects the pricing of our products. Our average transaction cost is $31.12. We
provide customers with retail products and a service, yet still manage to have a 5$ less average
transaction cost than Teavana. We sell our retailed packaged tea at $20 for 4 ounces. We offer
customers the ability to rent a tearoom for $50. This tearoom can serve as a meeting place for
organizations while they enjoy their tea of choice from our creation bar. We also sell tea ware at
various prices, and our pastries and food items on average are sold for $8.
Place
Our store is located on one of the most highly trafficked streets in Portland, Maine, Congress St. Not
only do locals enjoy shopping and visiting the boutiques on this street, also tourists are highly
attracted to this area. We differentiate ourselves from competitors by providing the unique tea
creation bar for customers to create their own blend of tea. Our store is designed with a sitting area
located towards the back of the store in a secluded room. The front of our store is where we have our
tea creation bar, retail products, and checkout area.
Promotion
We have planned promotional days throughout the year to benefit two national charities. The best
time to reach out to our target market would be on the weekends when people are out enjoying the
shopping options Portland, Maine has to offer. We are passing out flyers around the local college
campus, and placing brochures at the local hotel in hopes to attract tourists visiting the area. Our
“Grand Opening” banner will attract customers into a new place that they have never experienced.
We plan to promote our products as the highest quality products in the area, while providing a
unique experience no other competitor can duplicate.

29|Copeland Associates @OHIO
Integrated Business Cluster
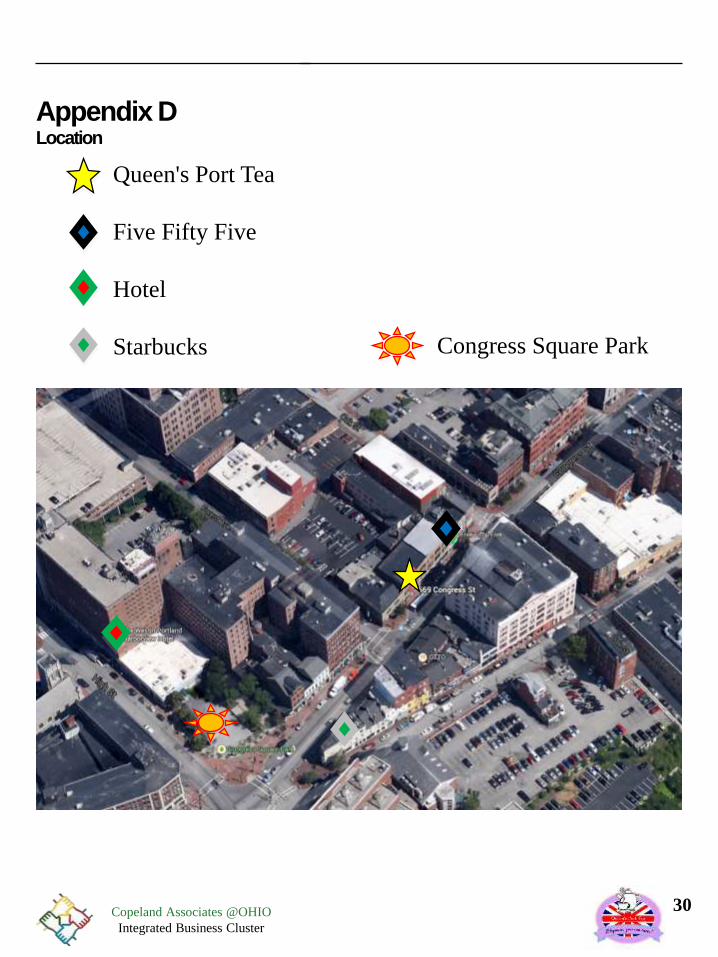
Appendix DLocation
Portland, Maine is a rather large city with many people and many outdoor attractions to
complement. Keys to identifying a target market for specialty food items is determining the best
location for distribution. When supermarkets open they create detrimental threats to smaller
specialty food stored. These supermarkets are targeting their niche market and if the market can
attain products and sell them at a cheaper price then it will be very hard to compete. There is a great
area in Portland, ME where consumers can be reached with healthy food products. This place is
called Deering Oaks Park. Deering Oaks Park has a farmer’s market event that takes place yearly
and can be used to help promote a new store in town that supplies specialty food items. In real
estate, the greatest value of a building is location. For this business to compete, an effective location
will be key.Location of store =
Location
30|Copeland Associates @OHIO
Integrated Business Cluster
Appendix DLocation
Queen's Port Tea
Five Fifty Five
Hotel
Starbucks Congress Square Park

31|Copeland Associates @OHIO
Integrated Business Cluster
Appendix EExtra Industry Information
40%
35%
15%10%
Product Segmentation by Revenue -Census Bureau
Meat, fish & Poultry
Other
Produce
Baked Goods & Candy
Data Source: firstresearch-learn.com Figure 2
No company throughout this industry can succeed without adhering to certain regulations and
restrictions. Starting a franchise in this industry typically will include an initial fee, royalty
payments, and marketing costs. Anti-trust laws, such as the Clayton Act and the Sherman Anti-Trust
Act, play a dynamic role by keeping the environment competitive for smaller businesses to compete.
States enforce many of their own laws to provide consumers with the best price, quality, and
competition (Lerman, 2014). Several Government agencies, including the FDA, EPA, and the
Consumer Products Safety Commission (CPSC), regulate the manufacturing, labeling, advertising,
and sale of food products. The most influential law affecting the food industry and having a positive
impact on natural and specialty food stores is the new labeling law (Bernstein Research, 2007). For
more information about the labeling law and other restrictions companies must adhere to appendix
A.
Laws & Regulations
32|Copeland Associates @OHIO
Integrated Business Cluster
Appendix FPersona Identification
Data Source: firstresearch-learn.com Figure 2
Emily Edwards is a 22 year old senior who is majoring in English at the University of SouthernMaine. She is always looking for new relaxing places where she can study and write papers. Sheusually goes to coffee shops but the environment is either not relaxing or she doesn't drink a lot ofcoffee. Queen's Port Tea gives a different location where she can study and hang out with herfriends,
Laura Landsdown is a 30 year old event planner who lives in the West End part of Portland, Maine.She always drinks a cup of tea to start her day and is looking for new places to take her clients.Queen's Port Tea is the perfect location for her to discover new teas to fuel her day and entertainher clients to an elegant experience.
Mike Masterson is a 50 year old family man who lives in the West End. He enjoys treating his wifeto unique experiences and because of his heart conditions he is constantly finding new beveragesthat can get him through the day and a healthy alternative to coffee. Queen's Port Tea presents anincredible opportunity to take his wife on brunch dates where they can try new and different teas. Italso gives him a healthy solution to help with his heart condition.

33|Copeland Associates @OHIO
Integrated Business Cluster
Appendix GComparable Market Continued
Weighted Average for % of Daily Available Population
Who Are Visitors
% of Daily Available Population Who Are Visitors
Tea Shops Visitors (Daily) 100 45
Daily Share of Population Multiplied
By:
% of Daily Available Population who
are visitors
1.77% 1.07%
= Daily Available Population 8,036 5,638 4,223
1.77%
1.07%
x
x
70%
30%
1.24%
.32%+
1.56%
Projected Tea Shop Visits (Daily)
= Daily Available Population 8,036 5,638 4,223
xDaily Share of Population
Multiplied By:% of Daily Available
Population who are visitors1.56% 1.77% 1.07%
= Tea Shops Visitors (Daily) 125 100 45

34|Copeland Associates @OHIO
Integrated Business Cluster
Appendix HStore Supply Items
Item Quantity Cost
Fruit & Nut Display 1 $199.95
Wood Chairs 32 $1,760
Round Tables 4 $312
Rectangular Tables 2 $612
Electric Range/Oven 2 $989.98
Tea Display 2 $6,225
Pastry Display 1 $2,643.56
NCR Silver POS Cash Register 1 $499

35|Copeland Associates @OHIO
Integrated Business Cluster
Appendix IHours open and Employee Schedule
Employee's
Hours Weekly Wages
A 32 weekly $12,480
B 32 weekly $12,480
C 32 weekly $12,480
D 34 weekly $13,260
E 34 weekly $13,260
F 24 weekly $9,360
G 24 weekly $9,360
H 24 weekly $9,360
I 14 weekly $5,460
Open Hours
Shift 1 (7-3) Shift 2 (3-10) M-F/ (4-10) S
Monday….. 7am-10pm 15 A,B,C D,E
Tuesday….. 7am-10pm 15 F,G,H D,I
Wednesday.. 7am-10pm 15 A,B,C D,E
Thursday…. 7am-10pm 15 F,G,H E,I
Friday….… 7am-10pm 15 A,B,C D,E
Saturday…. 8am- 10pm 14 F,G,H D,E
Sunday…… 8am-4pm 8 A,B,C Closed

36|Copeland Associates @OHIO
Integrated Business Cluster
Appendix JStore Flyer

37|Copeland Associates @OHIO
Integrated Business Cluster
Appendix KQueens Port Statements of Financial Position
Queens Port Tea Pro Forma Balance Sheet
Start-Up Year 1 Year 2 Year 3 Year 4 Year 5
Cash $ 532,465.50 $ 532,465.50 $ 532,465.50 $ 532,465.50 $ 532,465.50 $ 532,465.50
Inventory $ 246,735.90 $ 254,366.90 $ 262,233.92 $ 270,344.25 $ 278,705.41 $ 287,066.57
Prepaid expenses $ - $ - $ - $ - $ - $ -
Total current assets $ 779,201.40 $ 786,832.40 $ 794,699.42 $ 802,809.75 $ 811,170.91 $ 819,532.07
Property and equipment, net (a) $ 17,444.09 $ 15,150.32 $ 11,208.86 $ 8,370.51 $ 6,316.19 $ 4,793.68
Intangible assets, net $ 175.00 $ 175.00 $ 175.00 $ 175.00 $ 175.00 $ 175.00
Total assets $ 796,820.49 $ 802,157.73 $ 806,083.28 $ 811,355.26 $ 817,662.10 $ 824,500.75
Accounts payable $ - $ - $ - $ - $ - $ -
Accrued expenses $ - $ 254,366.90 $ 262,233.92 $ 270,344.25 $ 278,705.41 $ 287,066.57
Current portion of long-term debt $ - $ 26,591.70 $ 28,783.71 $ 31,156.41 $ 33,724.70 $ 36,504.70
Total current liabilities $ - $ 280,958.60 $ 291,017.63 $ 301,500.66 $ 312,430.11 $ 323,571.27
Long-term debt $ 239,046.15 $ 212,454.45 $ 183,670.74 $ 152,514.33 $ 118,789.63 $ 82,284.93
Total liabilities $ 239,046.15 $ 493,413.05 $ 474,688.37 $ 454,014.99 $ 431,219.75 $ 405,856.21
Paid-in equity capital $ 557,774.34 $ - $ - $ - $ - $ -
Retained earnings (b) $ - $ 308,744.68 $ 331,394.91 $ 357,340.26 $ 386,442.35 $ 418,644.54
Total equity $ 557,774.34 $ 308,744.68 $ 331,394.91 $ 357,340.26 $ 386,442.35 $ 418,644.54
Total liabilities and equity $ 796,820.49 $ 802,157.73 $ 806,083.28 $ 811,355.26 $ 817,662.10 $ 824,500.75
(a) Property and equipment, net:
Leasehold improvements $ 2,485.00 $ 2,485.00 $ 2,360.75 $ 2,124.68 $ 1,912.21 $ 1,720.86
Fixtures and equipment $ 14,401.09 $ 14,401.09 $ 12,343.17 $ 8,816.35 $ 6,297.60 $ 4,498.90
Computer hardware and software $ 558.00 $ 558.00 $ 446.40 $ 267.84 $ 160.70 $ 96.42
$ 17,444.09 $ 17,444.09 $ 15,150.32 $ 11,208.86 $ 8,370.51 $ 6,316.19
Less: Accumulated depr and amort $ - $ 2,293.77 $ 3,941.46 $ 2,838.35 $ 2,054.32 $ 1,522.51
Property and equipment, net $ 17,444.09 $ 15,150.32 $ 11,208.86 $ 8,370.51 $ 6,316.19 $ 4,793.68
(b) Retained earnings:
Balance, beginning of year $ - $ - $ 308,744.68 $ 331,394.91 $ 357,340.26 $ 386,442.35
Net income $ - $ 492,872.15 $ 508,185.08 $ 525,016.18 $ 542,249.24 $ 559,942.29
Less: Distribution to owner $ - $ (184,127.47) $ (485,534.85) $ (499,070.83) $ (513,147.15) $ (527,740.10)
Balance, end of year $ - $ 308,744.68 $ 331,394.91 $ 357,340.26 $ 386,442.35 $ 418,644.54

38|Copeland Associates @OHIO
Integrated Business Cluster
Appendix KQueens Port Statements of Financial Position
Queens Port Tea Pro Forma Income Statement
Year 1 Year 2 Year 3 Year 4 Year 5
Sales (a) $ 1,711,067 $ 1,763,987 $ 1,818,543 $ 1,874,787 $ 1,932,770
Cost of goods sold and occupancy costs (b) $ 648,494.48 $ 668,551.02 $ 689,227.85 $ 710,544.18 $ 732,519.77
Gross profit $ 1,062,572.76 $ 1,095,435.83 $ 1,129,315.29 $ 1,164,242.57 $ 1,200,250.07
Direct store expenses (c) $ 183,421.30 $ 190,181.10 $ 194,343.46 $ 198,982.86 $ 204,037.18
SG&A Expenses $ 740.00 $ 740.00 $ 740.00 $ 740.00 $ 740.00
Pre-opening expenses $ 900.00 $ - $ - $ - $ -
Operating income $ 877,511.46 $ 904,514.74 $ 934,231.84 $ 964,519.71 $ 995,472.89
Interest expense $ 18,339.10 $ 16,147.09 $ 13,774.39 $ 11,206.10 $ 8,426.10
Income before income taxes $ 859,172.36 $ 888,367.64 $ 920,457.45 $ 953,313.61 $ 987,046.79
Provision for income taxes $ 366,300.21 $ 380,182.56 $ 395,441.27 $ 411,064.37 $ 427,104.50
Net income $ 492,872.15 $ 508,185.08 $ 525,016.18 $ 542,249.24 $ 559,942.29
(a) Sales:
Number of customers per day 153 158 163 168 173
x Average transaction value $ 31.12 $ 31.12 $ 31.12 $ 31.12 $ 31.12
Sales per day $ 4,766.20 $ 4,913.61 $ 5,065.58 $ 5,222.25 $ 5,383.76
x Number of days open per year 359 359 359 359 359
Sales $ 1,711,067.24 $ 1,763,986.85 $ 1,818,543.14 $ 1,874,786.74 $ 1,932,769.84
(b) Cost of goods sold and occupancy costs:
Cost of goods sold $ 752,869.59 $ 776,154.21 $ 800,158.98 $ 824,906.17 $ 850,418.73
Rent $ 34,110.00 $ 34,110.00 $ 34,110.00 $ 34,110.00 $ 34,110.00
Utilities $ 8,091.00 $ 8,091.00 $ 8,091.00 $ 8,091.00 $ 8,091.00
[Modify, delete, or insert items]
Cost of goods sold and occupancy costs $ 795,070.59 $ 818,355.21 $ 842,359.98 $ 867,107.17 $ 892,619.73
(c) Direct store expenses:
Store payroll, payroll taxes, and benefits $ 170,403.47 $ 175,515.57 $ 180,781.04 $ 186,204.47 $ 191,790.61
Store supplies $ 1,200.00 $ 1,200.00 $ 1,200.00 $ 1,200.00 $ 1,200.00
Depreciation and amortization $ 2,293.77 $ 3,941.46 $ 2,838.35 $ 2,054.32 $ 1,522.51
Advertising $ 8,816.06 $ 8,816.06 $ 8,816.06 $ 8,816.06 $ 8,816.06
Software Expenses $ 708.00 $ 708.00 $ 708.00 $ 708.00 $ 708.00
Direct store expenses $ 183,421.30 $ 190,181.10 $ 194,343.46 $ 198,982.86 $ 204,037.18

39|Copeland Associates @OHIO
Integrated Business Cluster
Appendix KQueens Port Statements of Financial Position
Required Rate of Return
Weighted average cost of capital (WACC):
Capitalx
Cost ofx
After-Tax= WACC
Structure Capital Adjustment
Debt 30% x 8% x 57% = 1.37%
Equity 70% x 16.94% = 11.86%
13.23%
Decision-Making Criteria IRR Numbers$ (796,645.49)
Net present value = $ 2,891,054.60 $ (3,015.17)
$ 16,228.20
Internal rate of return = 57% $ 34,449.53
$ 53,511.11
Payback period = 4.09 $ 7,451,182.12

40|Copeland Associates @OHIO
Integrated Business Cluster
Appendix KQueens Port Statements of Financial Position
Depreciation BreakdownYear 3-Year 5-Year 7-Year 10-Year 15-Year
1 33.33% 20.00% 14.29% 10.00% 5.00%
2 44.45% 32.00% 24.49% 18.00% 9.50%
3 14.81% 19.20% 17.49% 14.40% 8.55%
4 7.41% 11.52% 12.49% 11.52% 7.70%
5 11.52% 8.93% 9.22% 6.93%
6 5.76% 8.92% 7.37% 6.23%
7 8.93% 6.55% 5.90%
8 4.46% 6.55% 5.90%
9 6.56% 5.91%
10 6.55% 5.90%
11 3.28% 5.91%
12 5.90%
13 5.91%
14 5.90%
15 5.91%
16 2.95%
17
Total 100.00% 100.00% 100.00% 100.00% 100.00%
Year Products Fixtures and equipment Book ValueComputer Hardware and
SoftwareBook Value
Leasehold
ImprovementsBook Value
Total Yearly
Depreciation
0
Total
Value $ 14,401.09 $ 14,401.09 $ 558.00 $ 558.00 $ 2,485.00 $ 2,485.00 $ -
1 $ 2,057.92 $ 12,343.17 $ 111.60 $ 446.40 $ 124.25 $ 2,360.75 $ 2,293.77
2 $ 3,526.83 $ 8,816.35 $ 178.56 $ 267.84 $ 236.08 $ 2,124.68 $ 3,941.46
3 $ 2,518.75 $ 6,297.60 $ 107.14 $ 160.70 $ 212.47 $ 1,912.21 $ 2,838.35
4 $ 1,798.70 $ 4,498.90 $ 64.28 $ 96.42 $ 191.35 $ 1,720.86 $ 2,054.32
5 $ 1,286.02 $ 3,212.88 $ 64.28 $ 32.14 $ 172.21 $ 1,548.65 $ 1,522.51
6 $ 1,284.58 $ 1,928.31 $ 32.14 $ - $ 154.82 $ 1,393.84 $ 1,471.53
7 $ 1,286.02 $ 642.29 $ 146.62 $ 1,247.22 $ 1,432.63
8 $ 642.29 $ - $ 146.62 $ 1,100.61 $ 788.90
9 $ - $ 146.86 $ 953.74 $ 146.86
10 $ 146.62 $ 807.13 $ 146.62
11 $ 146.86 $ 660.26 $ 146.86
12 $ 146.62 $ 513.65 $ 146.62
13 $ 146.86 $ 366.79 $ 146.86
14 $ 146.62 $ 220.17 $ 146.62
15 $ 146.86 $ 73.31 $ 146.86
16 $ 73.31 $ 0.00 $ 73.31
17

41|Copeland Associates @OHIO
Integrated Business Cluster
Appendix KQueens Port Statements of Financial Position
Loan Amortization Table
Loan Amount $ 239,046.15
Interest Rate 2% Quarterly
Loan Period 28 Quarters
PMT $11,232.70 Quarterly
Quarterly Beginning Balance Total Quarterly Payment Interest Paid Principal Paid Ending Balance
1 $ 239,046.15 $11,232.70 $ 4,780.92 $ 6,451.78 $ 232,594.37
2 $ 232,594.37 $11,232.70 $ 4,651.89 $ 6,580.81 $ 226,013.56
3 $ 226,013.56 $11,232.70 $ 4,520.27 $ 6,712.43 $ 219,301.13
4 $ 219,301.13 $11,232.70 $ 4,386.02 $ 6,846.68 $ 212,454.45
YEAR 1 $ 239,046.15 $44,930.80 $18,339.10 $26,591.70 $ 212,454.45
5 $ 212,454.45 $11,232.70 $ 4,249.09 $ 6,983.61 $ 205,470.84
6 $ 205,470.84 $11,232.70 $ 4,109.42 $ 7,123.28 $ 198,347.56
7 $ 198,347.56 $11,232.70 $ 3,966.95 $ 7,265.75 $ 191,081.81
8 $ 191,081.81 $11,232.70 $ 3,821.64 $ 7,411.06 $ 183,670.74
YEAR 2 $ 212,454.45 $44,930.80 $16,147.09 $28,783.71 $ 183,670.74
9 $ 183,670.74 $11,232.70 $ 3,673.41 $ 7,559.29 $ 176,111.46
10 $ 176,111.46 $11,232.70 $ 3,522.23 $ 7,710.47 $ 168,400.99
11 $ 168,400.99 $11,232.70 $ 3,368.02 $ 7,864.68 $ 160,536.31
12 $ 160,536.31 $11,232.70 $ 3,210.73 $ 8,021.97 $ 152,514.33
YEAR 3 $ 183,670.74 $44,930.80 $13,774.39 $31,156.41 $ 152,514.33
13 $ 152,514.33 $11,232.70 $ 3,050.29 $ 8,182.41 $ 144,331.92
14 $ 144,331.92 $11,232.70 $ 2,886.64 $ 8,346.06 $ 135,985.86
15 $ 135,985.86 $11,232.70 $ 2,719.72 $ 8,512.98 $ 127,472.88
16 $ 127,472.88 $11,232.70 $ 2,549.46 $ 8,683.24 $ 118,789.63
YEAR 4 $ 152,514.33 $44,930.80 $11,206.10 $33,724.70 $ 118,789.63
17 $ 118,789.63 $11,232.70 $ 2,375.79 $ 8,856.91 $ 109,932.73
18 $ 109,932.73 $11,232.70 $ 2,198.65 $ 9,034.05 $ 100,898.68
19 $ 100,898.68 $11,232.70 $ 2,017.97 $ 9,214.73 $ 91,683.96
20 $ 91,683.96 $11,232.70 $ 1,833.68 $ 9,399.02 $ 82,284.93
YEAR 5 $ 118,789.63 $44,930.80 $ 8,426.10 $36,504.70 $ 82,284.93
21 $ 82,284.93 $11,232.70 $ 1,645.70 $ 9,587.00 $ 72,697.93
22 $ 72,697.93 $11,232.70 $ 1,453.96 $ 9,778.74 $ 62,919.19
23 $ 62,919.19 $11,232.70 $ 1,258.38 $ 9,974.32 $ 52,944.88
24 $ 52,944.88 $11,232.70 $ 1,058.90 $10,173.80 $ 42,771.07
YEAR 6 $ 82,284.93 $44,930.80 $ 5,416.94 $39,513.86 $ 42,771.07
25 $ 42,771.07 $11,232.70 $ 855.42 $10,377.28 $ 32,393.80
26 $ 32,393.80 $11,232.70 $ 647.88 $10,584.82 $ 21,808.97
27 $ 21,808.97 $11,232.70 $ 436.18 $10,796.52 $ 11,012.45
28 $ 11,012.45 $11,232.70 $ 220.25 $11,012.45 $ -
YEAR 7 $ 42,771.07 $44,930.80 $ 2,159.73 $42,771.07 $ -

42|Copeland Associates @OHIO
Integrated Business Cluster
Appendix KQueens Port Statements of Financial Position
Tax Bracket 2014Year 1 2 3 4 5
Tax Rate Single Income $ 859,172 $ 888,367.64 $ 920,457.45 $ 953,313.61 $ 987,046.79
10.00% $ - $ 8,925.00 State Tax$ 68,304.20 $ 70,625.23 $ 73,176.37 $ 75,788.43 $ 78,470.22
15.00% $ 8,926.00 $ 36,250.00 7.95%
25.00% $ 36,251.00 $ 87,850.00 Federal
28.00% $ 87,851.00 $183,250.00 10.00% $ 892.50 $ 892.50 $ 892.50 $ 892.50 $ 892.50
33.00% $ 183,251.00 $398,350.00 15.00% $ 4,098.75 $ 4,098.75 $ 4,098.75 $ 4,098.75 $ 4,098.75
35.00% $ 398,351.00 $400,000.00 25.00% $ 12,900.00 $ 12,900.00 $ 12,900.00 $ 12,900.00 $ 12,900.00
39.60% $ 400,001.00 + 28.00% $ 26,712.00 $ 26,712.00 $ 26,712.00 $ 26,712.00 $ 26,712.00
33.00% $ 70,983.00 $ 70,983.00 $ 70,983.00 $ 70,983.00 $ 70,983.00
35.00% $ 577.50 $ 577.50 $ 577.50 $ 577.50 $ 577.50
39.60% $ 181,832.25 $ 193,393.59 $ 206,101.15 $ 219,112.19 $ 232,470.53
Total Tax
Liability$ 366,300.21 $ 380,182.56 $ 395,441.27 $ 411,064.37 $ 427,104.50
Year
1 43%
2 43%
3 43%
4 43%
5 43%
Average Tax Rate 43%

43|Copeland Associates @OHIO
Integrated Business Cluster
Appendix LWebsite Screenshots
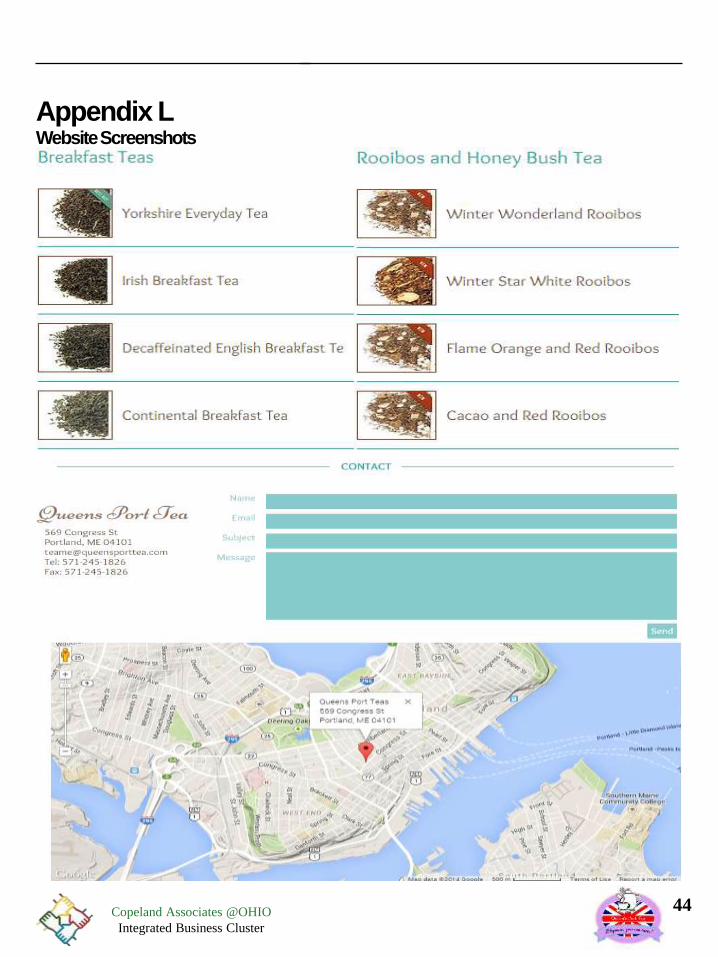
44|Copeland Associates @OHIO
Integrated Business Cluster
Appendix LWebsite Screenshots


![[XLS] · Web view1 2 2 2 3 2 4 2 5 2 6 2 7 2 8 2 9 2 10 2 11 2 12 2 13 2 14 2 15 2 16 2 17 2 18 2 19 2 20 2 21 2 22 2 23 2 24 2 25 2 26 2 27 2 28 2 29 2 30 2 31 2 32 2 33 2 34 2 35](https://static.fdocuments.us/doc/165x107/5aa4dcf07f8b9a1d728c67ae/xls-view1-2-2-2-3-2-4-2-5-2-6-2-7-2-8-2-9-2-10-2-11-2-12-2-13-2-14-2-15-2-16-2.jpg)
![file.henan.gov.cn · : 2020 9 1366 2020 f] 9 e . 1.2 1.3 1.6 2.2 2.3 2.4 2.5 2.6 2.7 2. 2. 2. 2. 2. 2. 2. 2. 2. 2. 2. 2. 2. 2. 2. 2. 2. 2. 2. 2. 17](https://static.fdocuments.us/doc/165x107/5fcbd85ae02647311f29cd1d/filehenangovcn-2020-9-1366-2020-f-9-e-12-13-16-22-23-24-25-26-27.jpg)