25(2), 217–226 Research Article ... · target specimens and to compare the metabolic ... YZ Yuzu...
10
Feburary 2015 ⎪ Vol. 25 ⎪ No. 2 J. Microbiol. Biotechnol. (2015), 25(2), 217–226 http://dx.doi.org/10.4014/jmb.1408.08021 Research Article jmb Comparison of Traditional and Commercial Vinegars Based on Metabolite Profiling and Antioxidant Activity Yu Kyung Jang 1 , Mee Youn Lee 1 , Hyang Yeon Kim 1 , Sarah Lee 1 , Soo Hwan Yeo 2 , Seong Yeol Baek 2 , and Choong Hwan Lee 1 * 1 Department of Bioscience and Biotechnology, Konkuk University, Seoul 143-701, Republic of Korea 2 Fermented Food Science Division, Department of Agro-food Resource, NAAS, RDA, Jeollabuk-do 565-851, Republic of Korea Introduction Vinegar has been made from a variety of agricultural materials and has been used since around 3000 BC in Asian, European, and other traditional cuisines of the world [3, 8]. It is a traditional fermented food with a sour flavor and is widely used as an acidic seasoning, preservative, beverage, and dressing. It contains specific volatile and nonvolatile compounds, including organic acids, sugars, amino acids, and esters [10]. The health benefits of drinking vinegar are well known and include an immune modulation effect, resistance to cardiovascular disease, appetite suppression, improved digestion, decreased serum cholesterol and blood pressure [29], and reduced fasting blood glucose [11, 17]. According to the Korean food standard code, vinegar is divided into traditional vinegar and commercial vinegar [12]. The manufacturing methods involve the use of common materials that are rich in sugars or starches, such as fruits juices, that go through alcohol fermentation and oxidation of ethanol to acetic acid [20]. These fermentation processes are carried out using various kinds of microorganisms, including molds, yeasts, and bacteria. These organisms produce acetic acid, as well as various metabolic compounds that control the taste and flavor of vinegar [2]. However, differences in periods of fermentation, cost of production, and maintaining a constant quality have been issues between traditional and commercial vinegars [12, 10]. The influence of industrialization in the 1970s created a sharp increase in productivity and consumption of cheap commercial vinegars, which were a major product on the Received: August 11, 2014 Revised: September 22, 2014 Accepted: October 3, 2014 First published online October 8, 2014 *Corresponding author Phone: +82-2-2049-6177; Fax: +82-2-455-4291; E-mail: [email protected] upplementary data for this paper are available on-line only at http://jmb.or.kr. pISSN 1017-7825, eISSN 1738-8872 Copyright © 2015 by The Korean Society for Microbiology and Biotechnology Metabolite profiles of seven commercial vinegars and two traditional vinegars were performed by gas chromatography time-of-flight mass spectrometry with multivariate statistical analysis. During alcohol fermentation, yeast, nuruk, and koji were used as sugars for nutrients and as fermentation substrates. Commercial and traditional vinegars were significantly separated in the principal component analysis and orthogonal partial least square discriminant analysis. Six sugars and sugar alcohols, three organic acids, and two other components were selected as different metabolites. Target analysis by ultra-performance liquid chromatography quadruple-time-of-flight mass spectrometry and liquid chromatography- ion trap-mass spectrometry/mass spectrometry were used to detect several metabolites having antioxidant activity, such as cyanidin-3-xylosylrutinoside, cyanidin-3-rutinoside, and quercetin, which were mainly detected in Rural Korean Black raspberry vinegar (RKB). These metabolites contributed to the highest antioxidant activity measured in RKB among the nine vinegars. This study revealed that MS-based metabolite profiling was useful in helping to understand the metabolite differences between commercial and traditional vinegars and to evaluate the association between active compounds of vinegar and antioxidant activity. Keywords: Antioxidant activity, commercial vinegar, mass spectrometry, metabolite profiling, traditional vinegar S S
-
Upload
trinhkhanh -
Category
Documents
-
view
213 -
download
0
Transcript of 25(2), 217–226 Research Article ... · target specimens and to compare the metabolic ... YZ Yuzu...

Feburary 2015⎪Vol. 25⎪No. 2
J. Microbiol. Biotechnol. (2015), 25(2), 217–226http://dx.doi.org/10.4014/jmb.1408.08021 Research Article jmbReview
Comparison of Traditional and Commercial Vinegars Based onMetabolite Profiling and Antioxidant ActivityYu Kyung Jang1, Mee Youn Lee1, Hyang Yeon Kim1, Sarah Lee1, Soo Hwan Yeo2, Seong Yeol Baek2, and
Choong Hwan Lee1*
1Department of Bioscience and Biotechnology, Konkuk University, Seoul 143-701, Republic of Korea2Fermented Food Science Division, Department of Agro-food Resource, NAAS, RDA, Jeollabuk-do 565-851, Republic of Korea
Introduction
Vinegar has been made from a variety of agricultural
materials and has been used since around 3000 BC in
Asian, European, and other traditional cuisines of the
world [3, 8]. It is a traditional fermented food with a sour
flavor and is widely used as an acidic seasoning,
preservative, beverage, and dressing. It contains specific
volatile and nonvolatile compounds, including organic
acids, sugars, amino acids, and esters [10]. The health
benefits of drinking vinegar are well known and include an
immune modulation effect, resistance to cardiovascular
disease, appetite suppression, improved digestion, decreased
serum cholesterol and blood pressure [29], and reduced
fasting blood glucose [11, 17].
According to the Korean food standard code, vinegar is
divided into traditional vinegar and commercial vinegar
[12]. The manufacturing methods involve the use of
common materials that are rich in sugars or starches, such
as fruits juices, that go through alcohol fermentation and
oxidation of ethanol to acetic acid [20]. These fermentation
processes are carried out using various kinds of
microorganisms, including molds, yeasts, and bacteria.
These organisms produce acetic acid, as well as various
metabolic compounds that control the taste and flavor of
vinegar [2]. However, differences in periods of fermentation,
cost of production, and maintaining a constant quality
have been issues between traditional and commercial
vinegars [12, 10].
The influence of industrialization in the 1970s created a
sharp increase in productivity and consumption of cheap
commercial vinegars, which were a major product on the
Received: August 11, 2014
Revised: September 22, 2014
Accepted: October 3, 2014
First published online
October 8, 2014
*Corresponding author
Phone: +82-2-2049-6177;
Fax: +82-2-455-4291;
E-mail: [email protected]
upplementary data for this
paper are available on-line only at
http://jmb.or.kr.
pISSN 1017-7825, eISSN 1738-8872
Copyright© 2015 by
The Korean Society for Microbiology
and Biotechnology
Metabolite profiles of seven commercial vinegars and two traditional vinegars were
performed by gas chromatography time-of-flight mass spectrometry with multivariate
statistical analysis. During alcohol fermentation, yeast, nuruk, and koji were used as sugars for
nutrients and as fermentation substrates. Commercial and traditional vinegars were
significantly separated in the principal component analysis and orthogonal partial least square
discriminant analysis. Six sugars and sugar alcohols, three organic acids, and two other
components were selected as different metabolites. Target analysis by ultra-performance
liquid chromatography quadruple-time-of-flight mass spectrometry and liquid chromatography-
ion trap-mass spectrometry/mass spectrometry were used to detect several metabolites
having antioxidant activity, such as cyanidin-3-xylosylrutinoside, cyanidin-3-rutinoside, and
quercetin, which were mainly detected in Rural Korean Black raspberry vinegar (RKB). These
metabolites contributed to the highest antioxidant activity measured in RKB among the nine
vinegars. This study revealed that MS-based metabolite profiling was useful in helping to
understand the metabolite differences between commercial and traditional vinegars and to
evaluate the association between active compounds of vinegar and antioxidant activity.
Keywords: Antioxidant activity, commercial vinegar, mass spectrometry, metabolite profiling,
traditional vinegar
S
S

218 Jang et al.
J. Microbiol. Biotechnol.
market [10, 31]. During the 1990s, traditional vinegars
gained popularity by many customers because of increased
recognition of diet and pursuit of health enhancement,
showing that traditional vinegars were better than
commercial vinegars [7].
To reveal the effect and activity of vinegar, many studies
have been performed comparing its antioxidant activity [2,
17], and measuring the content of sugars, organic acids,
and amino acids [25, 10], and in in vivo studies, acute
cardiovascular effects on rats [29] and inhibition of lipid
peroxidation in mouse serum and liver [26] have been
shown. On the other hand, using a metabolomics approach
for vinegars, measuring the amount of volatile or
nonvolatile metabolites for the development of flavors and
taste connected with mass spectrometry (MS) technique
was reported [20]. MS-based vinegar research uses mainly
GC-MS analysis to detect volatile aroma compounds [20],
and targeted analysis using high-performance liquid
chromatography-photodiode array detector-MS (HPLC-
DAD-MS) to detect phenolic compounds [24].
Metabolomics is a field that studies the change in the
metabolites in various ecological conditions, and has been
increasingly used to characterize the natural variance of
target specimens and to compare the metabolic composition
of primary and secondary metabolites in fermented foods,
such as fermented soybean paste (cheonggukjang) [15],
vinegars [22], cheeses [23], and Korean traditional meju
[21]. However, the studies of non-target analysis for primary
metabolite profiling of vinegars using gas chromatography
time-of-flight mass spectrometry (GC-TOF-MS) are less
reported.
Therefore, the objectives of this study were metabolite
profiling combined with MS techniques and multivariate
analysis to characterize the metabolic differences between
commercial and traditional vinegars and to evaluate their
antioxidant activities.
Materials and Methods
Chemicals and Reagents
Methoxyamine hydrochloride and N-methyl-N-(trimethylsilyl)
trifluoroacetamide (MSTFA), used in derivation for GC-TOF-MS,
were purchased from Sigma Aldrich (St. Louis, MO, USA). 2-2’-
Azinobis (3-ethylbenzothiazoline-6-sulfonic acid) di-ammonium salt
(ABTS), potassium persulfate, 1,1-diphenyl-2-picrylhydrazyl (DPPH),
sodium acetate, 2,4,6-tripyridinyl-s-triazine (TPTZ), ferric chloride
hexahydrate, sodium hydroxide (NaOH), diethylene glycol, folin-
ciacaltam, sodium carbonate (NaCO3), and other standards (gallic
acid, naringin, and 6-hydroxy-2,5,7,8-tetramethylchroman-2-carboxylic
acid (Trolox)), which were used for total acidity, antioxidant
assays (ABTS, DPPH, and FRAP), total flavonoid contents, and
total polyphenol contents, were also purchased from Sigma
Aldrich (USA).
Materials
Seven commercial vinegars were purchased from the open
market in Seoul, Korea, and two traditional vinegars (rural Korean
Black raspberry (Rubus coreanus Miquel) vinegar (RKB) and the
rural detoxified lacquer (Rhus verniciflua stokes) vinegar (RLQ))
were provided by the Korean Rural Department Administration
(Suwon, Korea). The details for each vinegar (major ingredients,
Table 1. Vinegar samples information.
Vinegar
sampleSample name Resource Major ingredients (%) pH
Total
acidity (%)
BS Balsamic vinegar Open market Balsamic vinegar 35%,
red grapes condensed matter 23%
2.91 ± 0.02 4.55 ± 0.05
JA Japanese apricot vinegar Open market Japanese apricot condensed matter 5%,
apple condensed matter 19.8%
3.21 ± 0.00 4.72 ± 0.06
YZ Yuzu vinegar Open market Citron fruit juice 15.08%, alcohol 2.64 ± 0.01 4.60 ± 0.03
LM Lemon vinegar Open market Lemon condensed matter 3.5% 2.65 ± 0.01 6.10 ± 0.06
AP Apple vinegar Open market Apple condensed matter 5.6% 2.72 ± 0.01 5.98 ± 0.07
KB Korean Black raspberry vinegar Open market Bokbunja 95%, apple condensed matter 3.19 ± 0.01 2.14 ± 0.03
BR Brown vinegar Open market Brown rice sugar condensed matter 6.81%
(Brown rice 99%)
2.59 ± 0.01 6.30 ± 0.03
RLQ Rural lacquer vinegar Rural Development
Administration
Rhus verniciflua stokes 2% 2.99 ± 0.01 5.87 ± 0.03
RKB Rural Korean Black raspberry
vinegar
Rural Development
Administration
Rubus coreanus Miquel 100% 3.01 ± 0.02 4.75 ± 0.05
All values are expressed as mean ± SD.

Metabolite Profiling of Vinegars 219
Feburary 2015⎪Vol. 25⎪No. 2
pH, total acidity, and full name of samples) are given in Table 1.
Fermentation Processes of RKB, RLQ, and Commercial Vinegar
In the RKB process (Fig. 1A), the initial conditions for alcohol
fermentation were as follows: sugar concentration of 25°Brix,
temperature of 25°C, and duration of 10 days. After alcohol
fermentation, water was added to make 6% alcohol. The
conditions for acetic acid fermentation were stationary fermentation
for 2-3 weeks at 30°C with jongcho, which was made from Korean
Black raspberry wine with Acetobacter pasterius RDAFR KACC16934,
with a total acidity of 4%.
In the RLQ process (Fig. 1B), the alcohol fermentation of sticky
rice and brown rice was performed using rice-nuruk (Saccharomyces
cerevisiae (La Parisienne)) and koji for 10 days at 20°C with addition
of 5% rushiol-free fermented Rhus verniciflua strokes stem bark
extracts. Acetic acid fermentation was sustained for 3-4 weeks at
30°C with jongcho, which was made from rushiol-free wine with
Acetobacter pasteurianus CV3 KACC17058, with a total acidity of
4%. The commercial vinegar process (Fig. 1C) used edible alcohol
with fruit squeeze instead of the alcohol fermentation process,
followed by acetic acid fermentation with Acetobacter and some
other artificial sweeteners.
Analysis of pH and Total Acidity
The pH of the vinegars was measured with a pH meter (Termo,
USA). Analysis of total acidity was according to a slightly
modified method of Jo et al. [12]. All vinegars were titrated using a
0.1 N NaOH solution and an endpoint of pH 8.2 for measuring
total acidity.
The results for the pH and total acidity of the various vinegars
are presented in Table 1. The pH values of the vinegars ranged
from approximately 2.5 to 3.2, and total acidities were approximately
4%-6%, which were suitable according to the classification of the
Korean food standard code [12]. All experiments were performed
in triplicate.
Sample Preparation
Vinegar samples were mixed with an equal volume of a solvent
(vinegar:methanol = 1:1 (v/v)) using a Twist Shaker (Biofree,
Seoul, Korea) for 1 h, and centrifuged at 4°C and 5,000 rpm for
5 min (Hettich Zentrifugen, Universal 320R, Germany) with 50 ml
centrifuge tubes. After centrifuging, supernatants were transferred
to new tubes and completely dried in a speed vacuum concentrator
(Biotron, Seoul, Korea). For GC-TOF-MS analysis, 50 µl of
methoxyamine hydrochloride (2% in pyridine) was added to the
Fig. 1. Flow diagrams showing the fermentation process for Rural Korean Black raspberry vinegar (RKB) (A), Rural lacquer
vinegar (RLQ) (B), and commercial vinegar (C).

220 Jang et al.
J. Microbiol. Biotechnol.
extracted samples that were dissolved in 50% methanol and
oximated at 30°C for 90 min. Then, the oximated samples were
silylated with 50 µl of MSTFA at 37°C for 30 min. All derivatized
samples were filtered through a 0.2 µm polytetrafluoroethylene
(PTFE) filter. For target analysis, the dried samples were dissolved
in 50% methanol and then filtered through a 0.2 µm PTFE filter.
Three analytical replications from two different batches were used
for both GC-TOF-MS and ultra-performance liquid chromatography
quadruple-time-of-flight mass spectrometry (UPLC-Q-TOF-MS)
analyses.
Analysis of Various Vinegar Compounds by GC-TOF-MS
For GC-TOF-MS analysis, each sample (1 µl) was injected into
an Agilent 7890A gas chromatography system equipped with an
Agilent 79693 autosampler (Agilent, Atlanta, GA, USA) coupled
to a Pegasus Time of Flight-Mass Spectrometer detector (Leco, St.
Joseph, MI, USA). Metabolites were separated on an RTx-5MS
column (30 m × 0.25 mm; film thickness, 0.25 µm) and helium was
used as the carrier gas at a constant flow rate of 1.5 ml/min. The
temperature program for metabolome analysis started with a 2
min isothermal step at 75°C, followed by temperature ramping of
15°C to a final temperature of 300°C, which was maintained for 3
min. The acquisition rate was set to 30 spectra with the mass range
of 45-1,000 m/z.
Target Analysis of the Metabolites Associated with Antioxidant
Activity Using UPLC-Q-TOF-MS
Ultra-performance liquid chromatography-quadruple-time-of-
flight mass spectrometry was used to analyze secondary
metabolites. Extracted vinegars were analyzed using a Waters
Micromass Q-TOF Premier UPLC-Q-TOF-MS system with a
UPLC Acquity System (Waters, Milford, MA, USA). Analysis was
performed with an Acquity UPLC BEH C18 column (100 ×
2.1 mm; Waters; 1.7 µm particle size). The mobile phase consisted
of A (0.1% (v/v) formic acid in water) and B (0.1% (v/v) formic
acid in acetonitrile) and the gradient conditions were increased
from 5% to 100% acetonitrile over 10 min, and then decreased
back to 5% over 2 min. The flow rate was maintained at 0.3 ml/min
and the volume of sample injected was 5 µl. ESI was performed in
negative (−) and positive (+) ion modes within a range of 100-
1,000 m/z. The operating parameters were as follows: ion source
temperature, 100°C; cone gas flow, 0.0 l/h; desolvation gas flow,
650 l/h; capillary voltage, 2.5 kV; and cone voltage, up to 50 V.
The UPLC-Q-TOF-MS raw data were analyzed using MassLynx
software (Waters Corp.), which was used to calculate accurate
masses and elemental compositions for the metabolite scans.
Target Analysis of the Metabolites Associated with Antioxidant
Activity Using LC-IT-MS/MS
Liquid chromatography-ion trap-mass spectrometry/mass
spectrometry (LC-IT-MS/MS) analysis was performed using a
Varian 500-MS ion trap mass spectrometer (Varian, USA), which
consisted of an LC pump (Varian 212), an auto sampler (Prostar
410), and a photodiode array detector (Prostar 335). The LC
system was equipped with a Varian PurSuit XRs C18 column (i.d.,
100 mm × 2.0 mm; 3 µm particle size; Varian, Lake Forest, CA,
USA). The initial mobile phase conditions consisted of 90% A
(0.1% (v/v) formic acid in water) and 10% B (0.1% (v/v) formic
acid in acetonitrile), which was maintained for 2 min, followed by
an increase to 90% B for 25 min. The gradient was maintained at
90% B for 5 min, rapidly decreased to 50% B for 0.06 min, and then
maintained for 5 min. The flow rate was set to 0.2 ml/min and the
volume of sample injected was 10 µl. The full-scan mass spectral
range was 100-1,000 m/z. The operating parameters for analyzing
the samples were as follows: spray needle voltage, 5 kV; capillary
voltage, 80 V; drying temperature, 300°C; drying gas pressure
(nitrogen), 20 psi; nebulizer gas pressure (air), 40 psi. Tandem
mass spectrometry analysis was carried out using scan-type turbo
data-dependent scanning (DDS) under the same conditions. LC-
IT-MS/MS data were analyzed using the MS workstation
software (ver. 6.9; Varian, USA).
Data Processing and Statistical Analysis
GC-TOF-MS raw data files were converted to computable
document form (*.cdf) using the inbuilt data processing software
of the Agilent GC system program. After acquiring the data in .cdf
format, the files were subjected to preprocessing alignment by the
metAlign software package (http://www.metalign.nl). After
alignment, the resulting peak list was obtained as a .txt file, which
was exported into Microsoft Excel (Microsoft, Redmond, WA,
USA). The Excel file included the corrected peak retention times
(min), peak areas, and corresponding mass (m/z) data for further
analysis.
Primary metabolites were represented through multivariate
statistical analysis using SIMCA-P+ 12.0 software (Umerics, Umea,
Sweden) to identify metabolite differences between commercial
and traditional vinegars.
Orthogonal partial least square discriminant analysis (OPLS-
DA) was used for the processing and classification of GC-TOF-MS
data to identify metabolites that showed variations between
commercial vinegars and traditional vinegars. All variables were
selected based on the variable importance in projection values
(VIP > 0.7) and significance (p < 0.05) for Student’s t-test of
individual samples, and the variable selection was used and
compared by box-and-whisker plots using STATISTICA (ver. 7.0;
Stat Soft, Tulsa, OK, USA). The variable selection was annotated
based on standard retention time, m/z, and existing references.
Determination of Antioxidant Activity by ABTS, DPPH, and
FRAP
The ABTS assay protocol followed the method of Re et al. [27]
with slight modifications. The stock solution was 2.45 mM
potassium persulfate solution with 7 mM ABTS. The solution was
diluted until the absorbance reached 0.7 ± 0.02 at 750 nm using a
spectrophotometer (SpectronicGenesys 6; Thermo Electron, Madison,
WI, USA). Ten microliters of extracted vinegar was reacted with

Metabolite Profiling of Vinegars 221
Feburary 2015⎪Vol. 25⎪No. 2
190 µl of the diluted ABTS solution for 7 min in the dark, followed
by absorbance measurement at 750 nm.
The DPPH assay protocol was conducted according to the
method of Lee et al. [19] with slight modifications. Briefly, 20 µl of
each vinegar extract was reacted with 180 µl of DPPH ethanol
solution for 20 min at room temperature in the dark, followed by
absorbance measurement at 515 nm.
The FRAP assay was conducted according to the method of
Benzie and Strain et al. [1] with slight modifications. Briefly, the
FRAP reagent was prepared by mixing acetate buffer (pH 3.6),
10 mM TPTZ (in 40 mM HCl solution), and 20 mM FeCl3·6H2O in
a ratio of 10:1:1. Then, 10 µl of each vinegar extract was reacted
with 300 µl of FRAP reagent for 6 min at room temperature in the
dark. The absorbance was measured at 570 nm. In all experiments,
standard curves were linear between 0.0625 and 2 mM Trolox
equivalents, and results were presented in µmol Trolox equivalents
(TE) per gram sample extract. All experiments were performed in
triplicate.
Determination of Total Polyphenol Contents (TPC) and Total
Flavonoid Contents (TFC)
TPC was determined according to the method of Folin-Denis
with slight modifications. Twenty microliters of each vinegars
extract was reacted with 100 µl of 0.2 N folin-ciocaltam for 5 min
in the dark. Then, 80 µl of 7.5% NaCO3 was added, followed by
incubation for 60 min in the dark, and absorbance measurement at
750 nm using a spectrophotometer. Standard curves were linear
between 7.81 and 500 ppm gallic acid equivalents and results were
presented in ppm gallic acid per gram sample extract.
The TFC protocol was conducted according to the method of
Jung et al. [13] with slight modifications. Briefly, 20 µl of each
vinegar extract was reacted with 20 µl of 1 N NaOH and 180 µl of
90% diethylene glycol for 60 min in the dark and absorbance was
measured at 405 nm using a spectrophotometer. Standard curves
were linear between 6.25 and 200 ppm naringin equivalents and
results were presented in ppm naringin per gram sample extract.
All experiments were performed in triplicate.
Results
Multivariate Analysis of Various Vinegars Performed on
GC-TOF-MS Data
In Fig. 2A, the PCA model of seven commercial vinegars
and two traditional vinegars (RKB and RLQ) were separated
by PC3, and the scores explained 21.9% of the total
variability (PC2: 12.6%; PC3: 9.3%).
The OPLS-DA (Fig. 2B) showed a clear difference
between commercial and traditional vinegars. Significantly
different primary metabolites were selected from OPLS-
DA, based on VIP (VIP > 0.7) and p-values (p-value < 0.05),
and the identified metabolites were annotated by their
retention time compared with standard mass fragmentation
(Table 2). Discriminated metabolites of commercial and
traditional vinegars were presented by box-and-whisker
plots, which were calculated by peak area (Fig. 3). Fructose,
glucose, sorbitol, glucopyranose, malic acid, and citric acid
Fig. 2. Principal component analysis score plots (A) and orthogonal partial least square discriminant analysis score plots (B) from
gas chromatography time-of-flight mass spectrometry analysis of commercial vinegars (BS, JA, YZ, LM, AP, KB, and BR) and
traditional vinegars (RKB and RLQ).
▲ Balsamic vinegar (BS); ▲ Japanese apricot vinegar (JA); ▲ Yuzu vinegar (YZ); ▲ Lemon vinegar (LM); ▲ Apple vinegar (AP); ▲ Korean Black
raspberry vinegar (KB); ▲ Brown rice vinegar (BR); △ Rural lacquer vinegar (RLQ); △ Rural Korean Black raspberry vinegar (RKB).

222 Jang et al.
J. Microbiol. Biotechnol.
levels were high in commercial vinegars, whereas xylitol,
myo-inositol, succinic acid, glycerol, and ethanolamine
levels were high in traditional vinegars.
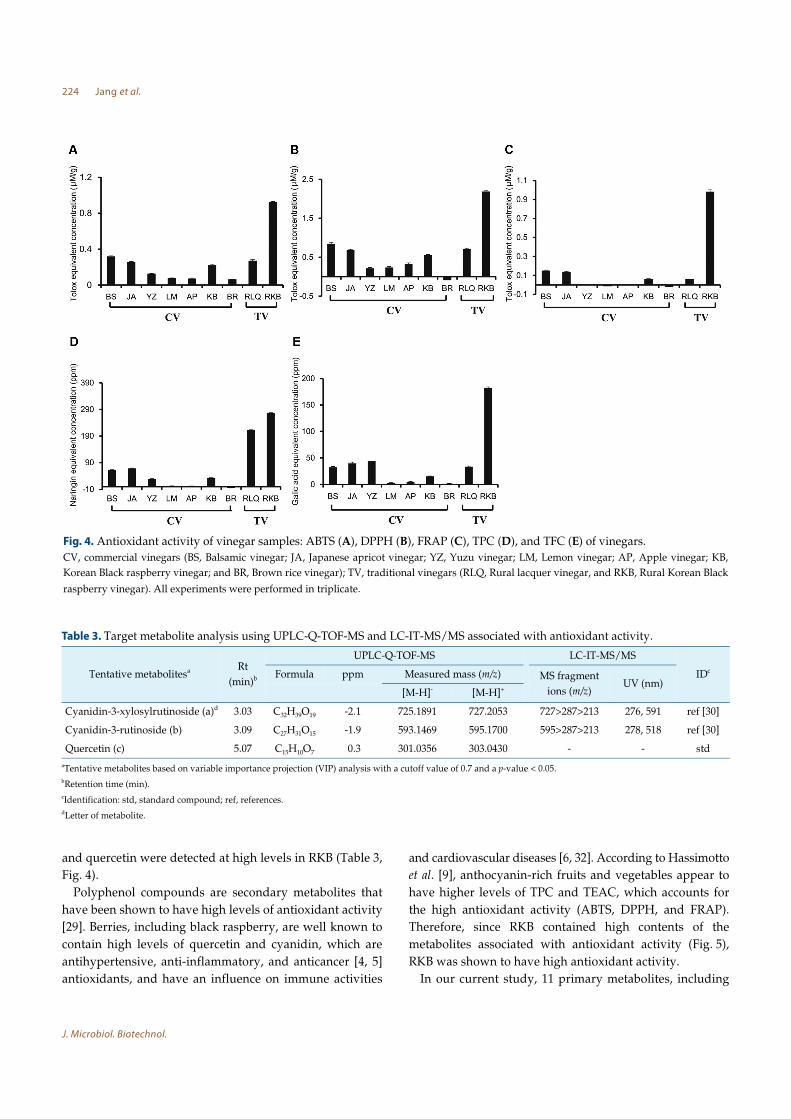
Antioxidant Activity, Total Flavonoid Content, and Total
Polyphenol Content of Various Vinegars
The results of the three in vitro assays (ABTS, DPPH, and
FRAP), total flavonoid contents, and total polyphenol
contents are presented in Fig. 4. The ABTS (Fig. 4A) value
of RKB was highest at 0.93 ± 0.004 µmol trolox equivalents
(TE)/g, followed by RLQ and JA. DPPH (Fig. 4B) and
FRAP (Fig. 4C) also appeared to have a similar pattern and
had a similar tendency. The estimated total flavonoid and
total polyphenol contents of the nine vinegars are
presented in Figs. 4D and 4E. The total flavonoid content of
various vinegars ranged from 1.54 to 182.42 ppm (Fig. 4D).
Of the vinegars, the total flavonoid content of RKB was the
highest at 182.42 ± 1.823 ppm, followed by 43.47 ±
0.526 ppm for YZ, and 39.44 ± 2.596 ppm and 33.30 ±
1.324 ppm for RLQ and JA, respectively. Except for YZ, the
result of antioxidant activity and total flavonoid contents
showed a similar tendency. The total polyphenol contents
of vinegars ranged from -4.55 to 276.62 ppm (Fig. 4E).
Among the vinegars, RKB had the highest total polyphenol
content at 276.62 ± 1.141 ppm, followed by 213.58 ± 1.848
ppm for RLQ, and 67.91 ± 1.730 ppm and 61.77 ± 2.685 ppm
for JA and BS, respectively.
Target Analysis of Compounds Associated with Antioxidant
Activity Using UPLC-Q-TOF-MS and LC-IT-MS/MS
UPLC-Q-TOF-MS and LC-IT-MS/MS were used for
target analysis to detect secondary metabolites associated
with antioxidant activity. The molecular weights of the
antioxidant compounds carotenoids (beta-carotene, lycopene,
and lutein) and flavonoids (anthocyanins, catechins,
quercetins, and proanthocyanidins) in the various vinegar
samples were determined. Cyanidin-3-xylosylrutinoside
(a), cyanidin-3-rutinoside (b), and quercetin (c) were detected
(Table 3) and, those metabolites were found mainly in RKB
compared with other vinegars (Figs. 5 and S1).
Discussion
In this study, non-target and target metabolite profiles of
seven commercial vinegars and two traditional vinegars
were determined by GC-TOF-MS and UPLC-Q-TOF-MS
Table 2. List of significantly different primary metabolites between commercial vinegars and traditional vinegars as identified by
GC-TOF-MS.
No.a Rt (min)b Compoundc MS fragment ions (m/z) TMSd p-value IDe
Sugars & sugar alcohols
1 10.70 Xylitol 217, 147, 133, 129, 75 TMS (X5) 1.18E-09 std
2 11.96 Fructose 217, 147, 133, 117, 103 TMS (X5) 2.48E-08 std
3 12.20 Glucose 204, 160, 133, 117, 103 TMS (X5) 5.69E-07 std
4 12.34 Sorbitol 205, 160, 147, 117, 103 TMS (X5) 5.12E-03 std
5 12.94 Glucopyranose 217, 205, 204, 191, 129 TMS (X5) 9.48E-05 std
6 13.33 myo- Inositol 305, 217, 191, 147, 103 TMS (X6) 1.24E-06 std
Organic acids
7 7.30 Succinic acid 149, 148, 75, 74, 59, 55 TMS (X2) 3.08E-06 std
8 8.94 Malic acid 148, 133, 117, 75, 59 TMS (X3) 1.33E-06 std
9 11.50 Citric acid 273, 211, 183, 149, 147 TMS (X4) 4.56E-04 std
Others
10 6.96 Glycerol 205, 148, 147, 133, 117 TMS (X3) 3.80E-02 std
11 7.34 Ethanolamine 175, 147, 133, 100, 89 TMS (X3) 3.08E-06 std
Variables were selected based on variable importance in projection (VIP >0.7) and p-value (<0.05).aNumber of metabolite.bRetention time.cIdentified: standard mass spectrum was consistent with those of standard compounds.dTMS, trimethylsilyl.eIdentification: std, standard compound.

Metabolite Profiling of Vinegars 223
Feburary 2015⎪Vol. 25⎪No. 2
with multivariate analysis. As shown in Fig. 3, we thought
artificial sweeteners and saccharide were added to the
commercial vinegars during the acetic acid fermentation
process. That is why the saccharide content of commercial
vinegars was higher than in the traditional vinegars
(Fig. 3). According to Park et al. [25, 28], during alcohol
fermentation, yeast, nuruk, and koji were used as sugars for
nutrients and as the fermentation substrate that was used
for the biochemical saccharification of starch to alcohol. It
seems that the sugar content of traditional vinegars
decreased and the alcohol percentage increased during
fermentation processing.
In this study, the ABTS, DPPH, and FRAP results were
similar to those of total flavonoid content and total
polyphenol content (Fig. 4), except for YZ and RLQ. YZ is a
popular citrus fruit in Korea and Japan, having flavonoids
and vitamin C in its peel [14], and RLQ is made using Rhus
verniciflua stokes extracts that include phenolic compounds
[16]. For these reasons, the total flavonoid content of YZ and
total polyphenol content of RLQ were shown to be high.
Among the nine vinegars, several polyphenol compounds,
such as cyanidin-3-xylosylrutinoside, cyanidin-3-rutinoside,
Fig. 3. Box-and-whisker plots of primary metabolites.
The plots varied significantly between commercial vinegar and traditional vinegar: higher content in commercial vinegars than traditional
vinegars (A) and higher content in traditional vinegars than commercial vinegars (B). CV, commercial vinegars (BS, Balsamic vinegar; JA, Japanese
apricot vinegar; YZ, Yuzu vinegar; LM, Lemon vinegar; AP, Apple vinegar; KB, Korean Black raspberry vinegar; and BR, Brown rice vinegar); TV,
traditional vinegars (RLQ, Rural lacquer vinegar; and RKB, Rural Korean Black raspberry vinegar).
224 Jang et al.
J. Microbiol. Biotechnol.
and quercetin were detected at high levels in RKB (Table 3,
Fig. 4).
Polyphenol compounds are secondary metabolites that
have been shown to have high levels of antioxidant activity
[29]. Berries, including black raspberry, are well known to
contain high levels of quercetin and cyanidin, which are
antihypertensive, anti-inflammatory, and anticancer [4, 5]
antioxidants, and have an influence on immune activities
and cardiovascular diseases [6, 32]. According to Hassimotto
et al. [9], anthocyanin-rich fruits and vegetables appear to
have higher levels of TPC and TEAC, which accounts for
the high antioxidant activity (ABTS, DPPH, and FRAP).
Therefore, since RKB contained high contents of the
metabolites associated with antioxidant activity (Fig. 5),
RKB was shown to have high antioxidant activity.
In our current study, 11 primary metabolites, including
Fig. 4. Antioxidant activity of vinegar samples: ABTS (A), DPPH (B), FRAP (C), TPC (D), and TFC (E) of vinegars.
CV, commercial vinegars (BS, Balsamic vinegar; JA, Japanese apricot vinegar; YZ, Yuzu vinegar; LM, Lemon vinegar; AP, Apple vinegar; KB,
Korean Black raspberry vinegar; and BR, Brown rice vinegar); TV, traditional vinegars (RLQ, Rural lacquer vinegar, and RKB, Rural Korean Black
raspberry vinegar). All experiments were performed in triplicate.
Table 3. Target metabolite analysis using UPLC-Q-TOF-MS and LC-IT-MS/MS associated with antioxidant activity.
Tentative metabolitesa Rt
(min)b
UPLC-Q-TOF-MS LC-IT-MS/MS
IDcFormula ppm Measured mass (m/z) MS fragment
ions (m/z)UV (nm)
[M-H]- [M-H]+
Cyanidin-3-xylosylrutinoside (a)d 3.03 C32H39O19 -2.1 725.1891 727.2053 727>287>213 276, 591 ref [30]
Cyanidin-3-rutinoside (b) 3.09 C27H31O15-1.9 593.1469 595.1700 595>287>213 278, 518 ref [30]
Quercetin (c) 5.07 C15
H10
O7
0.3 301.0356 303.0430 - - std
aTentative metabolites based on variable importance projection (VIP) analysis with a cutoff value of 0.7 and a p-value < 0.05.bRetention time (min).cIdentification: std, standard compound; ref, references.dLetter of metabolite.

Metabolite Profiling of Vinegars 225
Feburary 2015⎪Vol. 25⎪No. 2
sugars and sugar alcohols, amino acids, and others, were
detected as being significantly different between commercial
and traditional vinegars using GC-TOF-MS-based non-
target MS profiling. The pH, total acidity, antioxidant
activity, total flavonoid content, and total polyphenol
content were also measured. The results for the pH and
total acidity conformed to the classification of the Korean
food standard code. In the antioxidant activity assay, RKB
measured the highest ABTS, DPPH, FRAP, total flavonoid
content, and total polyphenol content among the nine
vinegars. However, YZ and RLQ showed high total
flavonoid content and total polyphenol content owing
to the characteristics of each material. Target analysis
of the secondary metabolites using UPLC-Q-TOF-MS
showed association with antioxidant activity. Cyanidin-3-
xylosylrutinoside, cyanidin-3-rutinoside, and quercetin
were detected, and those compounds were more highly
detected in RKB, than in the other vinegars. We believe
those kinds of polyphenols and flavonoids contributed to
the high antioxidant activity in RKB.
In this study, we investigated the metabolite differences
between commercial and traditional vinegars using MS-
based metabolite profiling. We also identified three secondary
metabolites, which were associated with the antioxidant
activities of the vinegars, by target analysis using UPLC-Q-
TOF-MS. Our study suggests that MS-based metabolite
profiling can be a useful tool for evaluating the quality of
vinegar. However, further studies of metabolite profiling of
vinegars taking into account the fermentation periods and
differences in fermentation processing methods are needed
to improve the knowledge of the vinegar manufacturing
industry.
Acknowledgments
This work was supported by the “Cooperative Research
Program for Agricultural Science & Technology Development
(No. PJ 009826)”, Rural Department Administration, Republic
of Korea.
References
1. Benzie IF, Strain JJ. 1996. The ferric reducing ability of
plasma (FRAP) as a measure of “antioxidant power”: the
FRAP assay. Anal. Biochem. 239: 70-76.
2. Budak HN, Guzel-Seydim ZB. 2010. Antioxidant activity
and phenolic content of wine vinegars produced by two
different techniques. J. Sci. Food Agric. 90: 2021-2026.
3. Chen JC, Chen QH, Guo Q, Ruan S, Ruan H, He GQ, Gu Q. 2010.
Simultaneous determination of acetoin and tetramethylpyrazine
in traditional vinegars by HPLC method. Food Chem. 122:
1247-1252.
4. Chen PN, Chu SC, Chiou HL, Kuo WH, Chiang CL, Hsieh
YS. 2006. Mulberry anthocyanins, cyanidin 3-rutinoside and
cyanidin 3-glucoside, exhibited an inhibitory effect on the
migration and invasion of a human lung cancer cell line.
Cancer Lett. 235: 248-259.
5. Choung MG, Lim JD. 2012. Antioxidant, anticancer and
immune activation of anthocyanin fraction from Rubus
coreanus miquel fruits (Bokbunja). Korean J. Med. Crop Sci. 20:
259-269.
6. Cuevas-Rodriìguez EO, Yousef GG, Garciìa-Saucedo PA,
Loìpez-Medina J, Paredes-Loìpez O, Lila MA. 2010.
Characterization of anthocyanins and proanthocyanidins in
wild and domesticated Mexican blackberries (Rubus spp.). J.
Agric. Food Chem. 58: 7458-7464.
7. Greco E, Cervellati R, Litterio ML. 2013. Antioxidant
capacity and total reducing power of balsamic and traditional
balsamic vinegar from Modena and Reggio Emilia by
conventional chemical assays. Food Sci. Technol. 48: 114-120.
8. Hashimoto M, Obara K, Ozono M, Furuyashiki M, Ikeda T,
Suda Y, Shigehisa H. 2012. Separation and characterization
of the immunostimulatory components in unpolished rice
black vinegar (Kurozu). J. Biosci. Bioeng. 21: 1729-1734.
9. Hassimotto NMA, Genovese MI, Lajolo FM. 2005. Antioxidant
activity of dietary fruits, vegetables, and commercial frozen
fruit pulps. J. Agric. Food Chem. 53: 2928-2935.
Fig. 5. Box-and-whisker plots of target analyzed secondary metabolites related with the antioxidant activity.

226 Jang et al.
J. Microbiol. Biotechnol.
10. Hong SM, Moon HS, Lee JH, Lee HI, Jeong JH, Lee MK, Seo
KI. 2012. Development of functional vinegar by using
cucumbers. J. Korean Soc. Food Sci. Nutr. 41: 927-935.
11. Jeong CH, Choi GN, Kim JH, Kwak JH, Kang ST, Choi SG,
Heo HJ. 2009. In vitro antioxidant properties and phenolic
composition of Korean commercial vinegars. Food Sci.
Biotechnol. 18: 1258-1262.
12. Jo DJ, Park EJ, Kim GR, Yeo SH, Jeong YJ, Kwon JH. 2012.
Quality comparison of commercial cider vinegars by their
acidity levels. Korean J. Food Sci. Technol. 44: 699-703.
13. Jung ES, Lee S, Lim SH, Ha SH, Liu KH, Lee CH. 2013.
Metabolite profiling of the short-term responses of rice
leaves (Oryza sativa cv. Ilmi) cultivated under different LED
lights and its correlations with antioxidant activities. Plant
Sci. 210: 61-69.
14. Kawaii S, Tomono Y, Katase E, Ogawa K, Yano M. 1999.
Quantitation of flavonoid constituents in citrus fruits. J.
Agric. Food Chem. 47: 3565-3571.
15. Kim J, Choi JN, Choi JH, Cha YS, Muthaiya MJ, Lee CH.
2013. Effect of fermented soybean product (Cheonggukjang)
intake on metabolic parameters in mice fed a high-fat diet.
Mol. Nutr. Food Res. 57: 1886-1891.
16. Kim SA, Kim SH, Kim IS, Lee D, Dong MS, Na CS, Yoo
HH. 2013. Simultaneous determination of bioactive phenolic
compounds in the stem extract of Rhus verniciflua stokes by
high performance liquid chromatography. Food Chem. 141:
3813-3819.
17. Kim SH, Cho HK, Shin HS. 2012. Physicochemical properties
and antioxidant activities of commercial vinegar drinks in
Korea. Food Sci. Biotechnol. 21: 1729-1734.
18. Kwon SH, Jeong EJ, Lee GD, Jeong YJ. 2000. Preparation
method of fruit vinegars by two stage fermentation and
beverages including vinegar. Food Ind. Nutr. 5: 18-24.
19. Lee S, Do SG, Kim SY, Kim J, Jin Y, Lee CH. 2012. Mass
spectrometry-based metabolite profiling and antioxidant
activity of aloe vera (Aloe barbadensis miller) in different
growth stages. J. Agric. Food Chem. 60: 11222-11228.
20. Lee SW, Yoon SR, Kim GR, Woo SM, Jeong YJ. Yeo SH, et
al. 2012. Effect of nuruk and fermentation method on
organic acid and volatile compounds in brown rice vinegar.
Food Sci. Biotechnol. 21: 453-460.
21. Lee SY, Kim HY, Lee S, Lee JM, Muthaiya MJ, Kim BS, et al.
2012. Mass spectrometry-based metabolite profiling and
bacterial diversity characterization of Korean traditional meju
during fermentation. J. Microbiol. Biotechnol. 22: 1523-1531.
22. Morales LM, González GA, Casas JA, Troncoso AM. 2001.
Multivariate analysis of commercial and laboratory produced
sherry wine vinegars: influence of acetification and aging.
Eur. Food Res. Technol. 212: 676-682.
23. Nielsen MS, Frisvad JC, Nielsen PV. 1998. Protection by
fungal starters against growth and secondary metabolite
production of fungal spoilers of cheese. Food Microbiol. 42:
91-99.
24. Ordoudi SA, Mantzouridou F, Daftsiou E, Malo C,
Hatzidimitriou E, Nenadis N, Tsimidou MZ. 2014. Pomegranate
juice functional constituents after alcoholic and acetic acid
fermentation. J. Funct. Foods 8: 161-168.
25. Park SY, Chae KS, Son RH, Jung JH, Im YR, Kwon JW.
2012. Quality characteristic and antioxidant activity of
bokbunja (Black raspberry) vinegars. Food Eng. Progress 16:
340-346.
26. Qiu J, Ren C, Fan J, Li Z. 2010. Antioxidant activities of
aged oat vinegar in vitro and in mouse serum and liver. J.
Sci. Food Agric. 90: 1951-1958.
27. Re R, Pellegrini N, Proteggente A, Pannala A, Yang M, Rice-
Evans C. 1999. Antioxidant activity applying an improved
ABTS radical cation decolorization assay. Free Radic. Biol.
Med. 26: 1231-1237.
28. Seo H, Jeon BY, Yun A, Park DH. 2010. Effect of glasswort
(Salicorniai herbacea L.) on microbial community variation in
the vinegar-making process and vinegar characteristics. J.
Microbiol. Biotechnol. 20: 1322-1330.
29. Sugiyama A, Saitoh M, Takahara A. 2003. Acute cardiovascular
effects of a new beverage made of wine vinegar and grape
juice, assessed using an in vivo rat. Nutr. Res. 23: 1291-1296.
30. Tian Q, Giusti MM, Stoner GD, Schwartz SJ. 2006.
Characterization of a new anthocyanin in black raspberries
(Rubus occidentalis) by liquid chromatography electrospray
ionization tandem mass spectrometry. Food Chem. 94: 465-468.
31. Yong JJ. 2009. Current trends and future prospects in the
Korean vinegar industry. Food Sci. Ind. 42: 52-59.
32. Yukiko Y, Eriko O. 2006. Antihypertensive effect of quercetin
in rats fed with a high-fat high-sucrose diet. Biosci. Biotechnol.
Biochem. 70: 933-939.