25.10.2015 Basic Principles of Doppler Radar Elena Saltikoff Alessandro Chiariello Finnish...
26
23.03.22 Basic Principles of Doppler Radar Elena Saltikoff Alessandro Chiariello Finnish Meteorological Institute
-
Upload
elinor-murphy -
Category
Documents
-
view
221 -
download
4
Transcript of 25.10.2015 Basic Principles of Doppler Radar Elena Saltikoff Alessandro Chiariello Finnish...

20.04.23
Basic Principles of Doppler Radar
Elena Saltikoff
Alessandro Chiariello
Finnish Meteorological Institute

Learning Objectives
• What the Doppler colours mean
• Why the pictures are not always as beautiful as in textbooks
• Where the wind barbs come from
• Combining and comparing radar to other wind data sources: benefits and traps (amdar, NWP, radiosound)
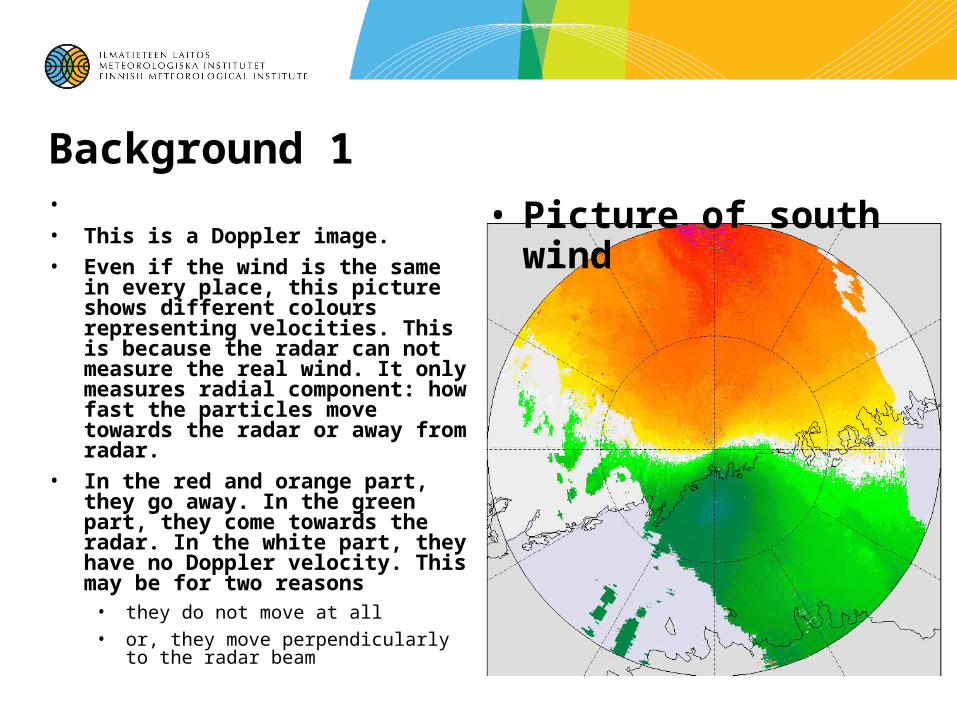
Background 1• • This is a Doppler image.• Even if the wind is the same in every
place, this picture shows different colours representing velocities. This is because the radar can not measure the real wind. It only measures radial component: how fast the particles move towards the radar or away from radar.
• In the red and orange part, they go away. In the green part, they come towards the radar. In the white part, they have no Doppler velocity. This may be for two reasons
• they do not move at all
• or, they move perpendicularly to the radar beam
• Picture of south wind

Background 2• The radar can not measure
speeds of clean air, there has to be something reflecting the microwaves: raindrops, snowflakes, birds or insects.
• In 1950’s people believed that the changes of refractive index are enough, too. Probably not at 5 cm microwaves,
• Wind from west. At sea, showers, over land, insects.

20.04.23Ilmatieteen laitos / PowerPoint ohjeistus 5
Some theory and terminology, briefly
Radial Velocity is the component of the velocity that is parallel to the radial from the radar to the point in question the component towards or away from from the radar
Colour convention: cold colour towards (cold wind toward your face)
Red colours away (back lights of cars)

Technically speaking• Speed is calculated from change of phase in the
microwave pulse
• Change of phase is related to change of frequency
• For good estimate, several ( > 30) pulses are needed
20.04.23Ilmatieteen laitos / PowerPoint ohjeistus 6
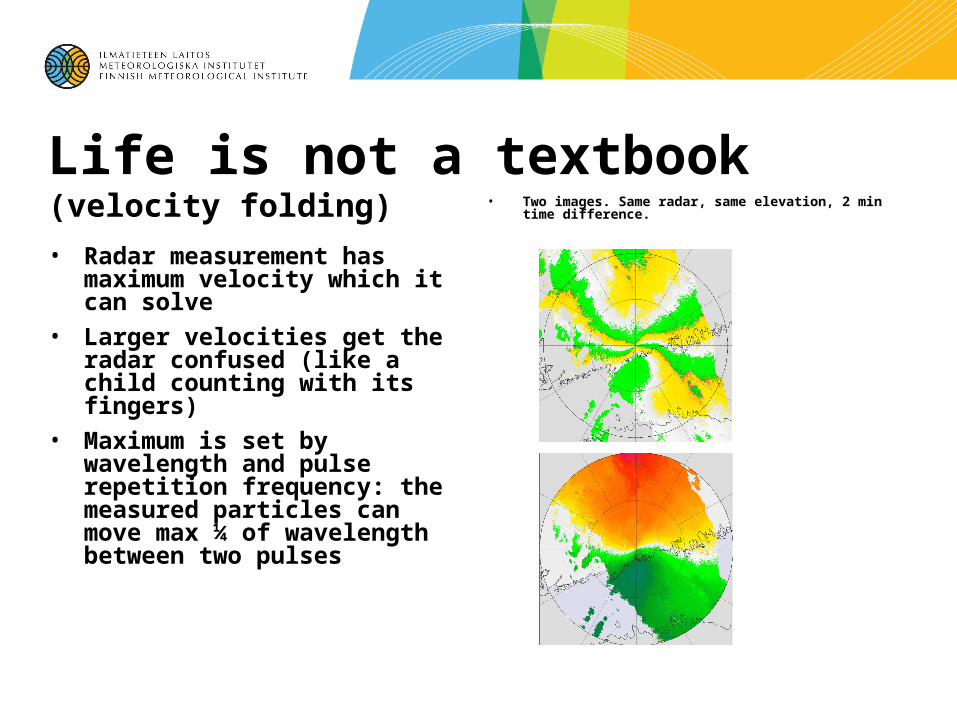
Life is not a textbook (velocity folding)
• Radar measurement has maximum velocity which it can solve
• Larger velocities get the radar confused (like a child counting with its fingers)
• Maximum is set by wavelength and pulse repetition frequency: the measured particles can move max ¼ of wavelength between two pulses
• Two images. Same radar, same elevation, 2 min time difference.

20.04.23Ilmatieteen laitos / PowerPoint ohjeistus 8
What can we do to aliasing ?• If we increase pulse repetition frequency, we can
measure speeds better, but then we cannot see so far.
• Wind profile program (VVP) can solve some de-aliasing, if there is enough data
• In Finland, twice in 15 minutes we stop normal measurement and make a good speed measurement for short distances. This is used for
• Wind profiles for aviation weather services
• Tornado hunting
• NWP assimilation

Wind Profiles• Most countries use their weather radar to measure,
not only the precipitation near the ground, but also at higher altitudes, so that we get a 3-dimensional image of the atmosphere.
• Wind measurements from higher altitudes can be used to create wind profiles.
• You can also get wind profiles from radiosoundings, AMDAR, NWP models, Wind profilers.
• Wind profiles are used in • aviation weather service (wind shear warnings)
• input to numerical weather prediction
• input to pollution and radioactive dispersion models
• synoptical analysis

How the wind arrows are calculatedVelocity Azimuth Display (VAD)
For a fixed elevation angle and range, corresponding to a fixed height, the radial velocity will vary sinusoidally as the antenna scans through a full 360 degrees

How the wind profiles are buildt• By scanning at a number of
elevation angles and ranges, vertical wind profiles can be derived. These will be volume averages where the range and elevation chosen will determine the size of the volume.
• Typically, the first few km near the radar are not used
Radius 20-50 km
Thickness 100-500 m
Inner gap 1-5 km
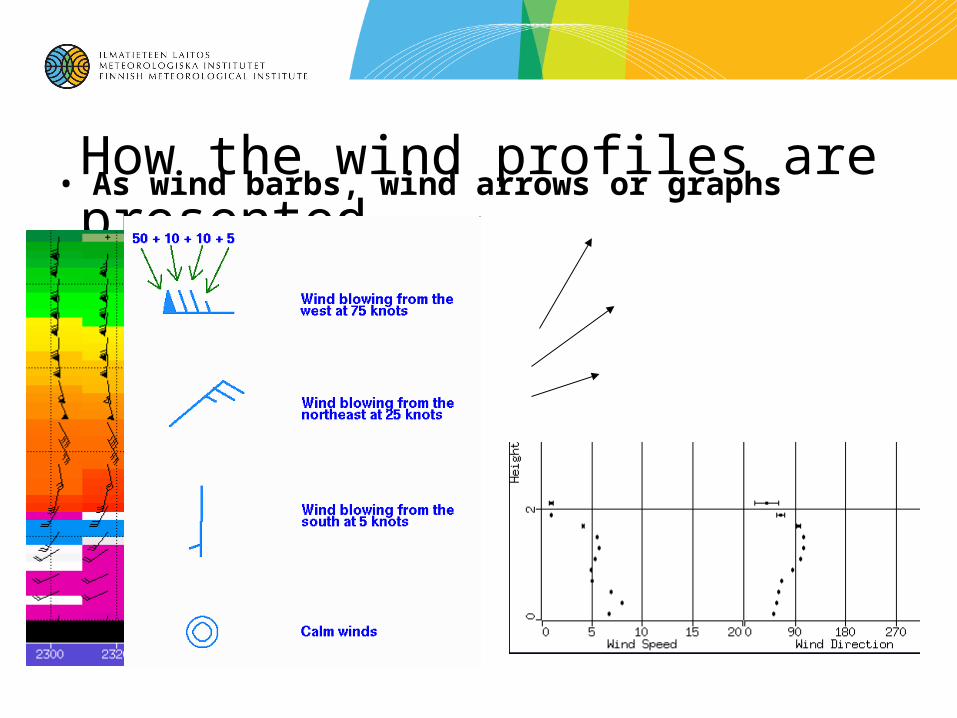
How the wind profiles are presented• As wind barbs, wind arrows or graphs
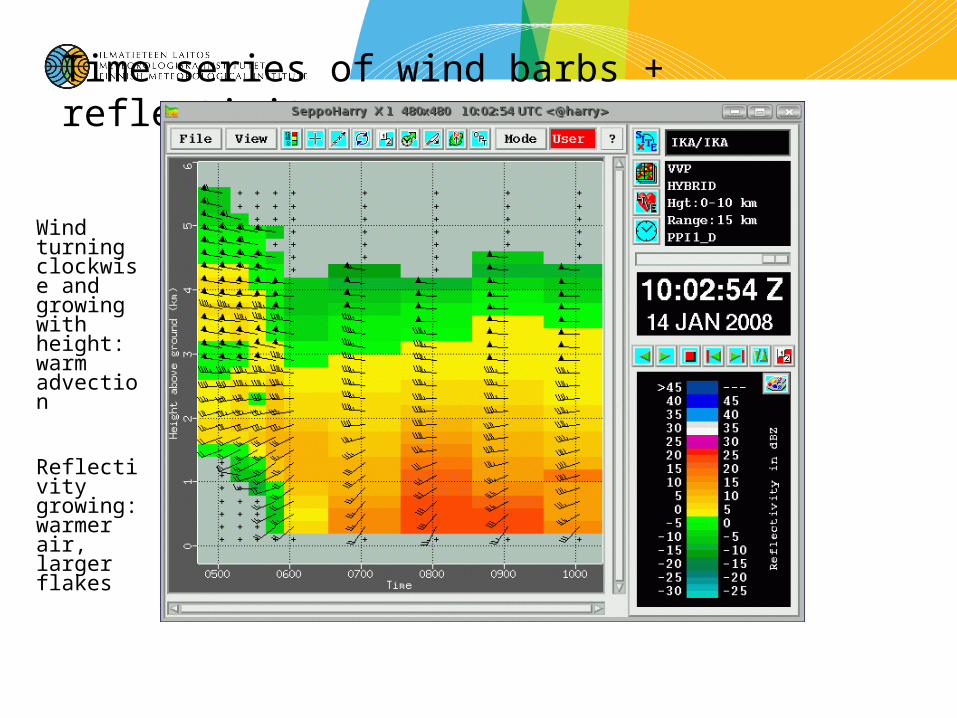
Time series of wind barbs + reflectivity
Wind turning clockwise and growing with height: warm advection
Reflectivity growing: warmer air, larger flakes

Single wind profile: Speed, direction, reflectivity as averages in a 15-km cylinder

Wind profiles online• http://www.metoffice.gov.uk/science/specialist/cwinde/wradar/

Summary• Doppler radar measures speed of particles
• no particles, no measurement
• mountains have no speed
• Raindrops and insects move with wind so we get information of wind
• Sometimes it can help in finding a tornado

20.04.23
Advanced comments toDoppler Radar
Elena Saltikoff
Alessandro Chiariello
Finnish Meteorological Institute

Two techniques: VAD and VVP
• Classical VAD uses one elevation
• Hence, waves are fit to smaller circles near ground than aloft
• VVP: number of elevation angles and ranges to produce volume averages
• Typically, the first few km near the radar are not used
20.04.23Ilmatieteen laitos / PowerPoint ohjeistus 18

20.04.23Ilmatieteen laitos / PowerPoint ohjeistus 19
When does it work ?• For good quality wind profile,
data is needed from all sides of radar
• Data must be connected to wind speed, not birds
• Wind field must be uniform: strong convergence makes a mess
• Averaging over shear area makes a mess
•
• Error bars in VVP display show how well the trigonometrical wave fits in data
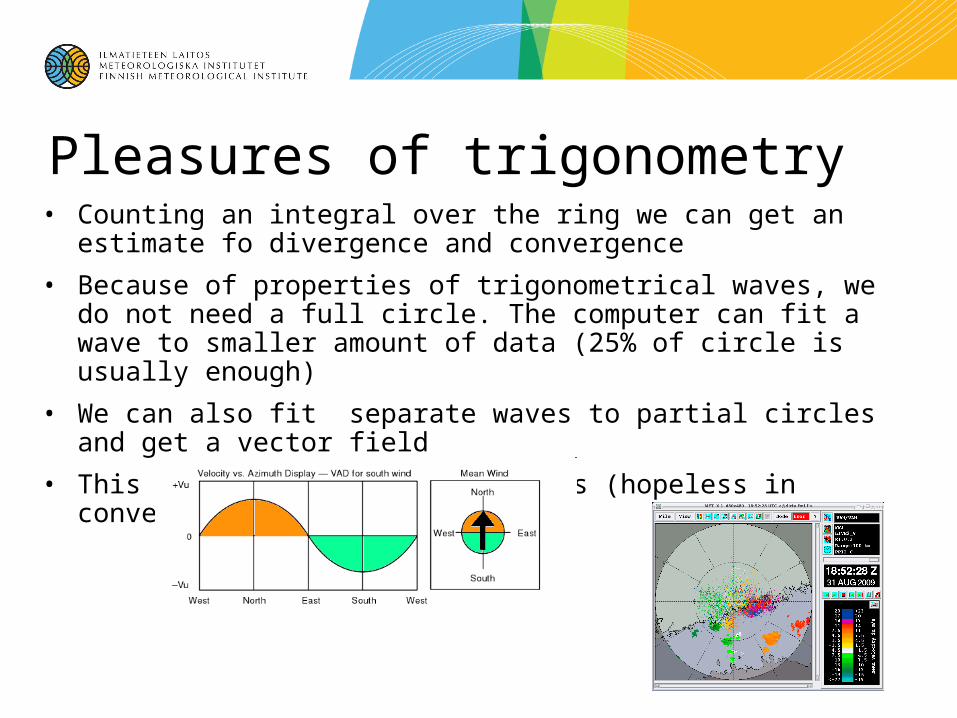
Pleasures of trigonometry• Counting an integral over the ring we can get an estimate fo
divergence and convergence
• Because of properties of trigonometrical waves, we do not need a full circle. The computer can fit a wave to smaller amount of data (25% of circle is usually enough)
• We can also fit separate waves to partial circles and get a vector field
• This works with some assumptions (hopeless in convection)

20.04.23Ilmatieteen laitos / PowerPoint ohjeistus 21
Divergence and convergence

20.04.23Ilmatieteen laitos / PowerPoint ohjeistus 22
Wind vector field

20.04.23Ilmatieteen laitos / PowerPoint ohjeistus 23
Arrow shows the real wind direction.
In area ”Away” particle movement has a component away (1-3 m/s). In green area, it has component towards the radar (3-8 m/s) . In aliased area, movement towards the radar is bigger, radar cannot measure it and gets confused….

20.04.23Ilmatieteen laitos / PowerPoint ohjeistus 24
Wind barbs from same situation: IRIS solved it

With small amount to data,
• average can usually be solved
• Small details can not
• Not useful for tornado catching
• Not to see local convergence and divergence
20.04.23Ilmatieteen laitos / PowerPoint ohjeistus 25

Doppler spectrum gives threshold tools (inside the computer)
buildingrain bird
Spectrum is calculated from the 32-64 samples we take from the same location.