250 Manor Avenue - LoopNet
22
1853 William Penn Way Lancaster, PA 17601 717.293.4477 www.highassociates.com 717.293.4477 250 MANOR AVENUE MILLERSVILLE, PA 17551 Jeffrey Kurtz, CCIM 717.293.4554 – direct line [email protected] For Lease
Transcript of 250 Manor Avenue - LoopNet

1853 William Penn Way Lancaster, PA 17601 717.293.4477 www.highassociates.com
717.293.4477
250 MANOR AVENUEMILLERSVILLE, PA 17551
Jeffrey Kurtz, CCIM717.293.4554 – direct [email protected]
For Lease

1853 William Penn Way Lancaster, PA 17601 717.293.4477 www.highassociates.com
250 Manor AvenueMillersville, PA 17551
Table of Contents
• Property Information Sheet
• Property Photos
• Location Maps
• Aerial Photo/Tax Map
• Zoning Map
• Floor Plan
• ESRI Retail Market Potential

1853 William Penn Way Lancaster, PA 17601 717.293.4477 www.highassociates.com
717.293.4477For Lease
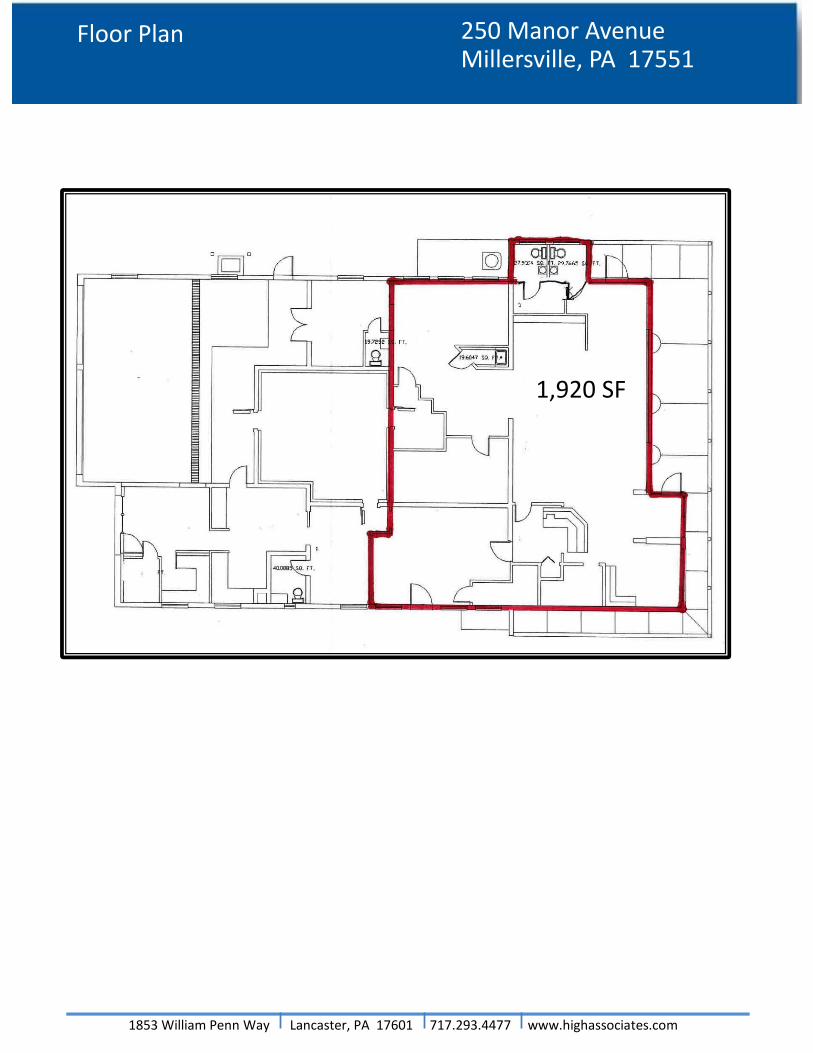
Available Square Feet:1,970 square feet
Lease Rate$12.00/SF N/N/N
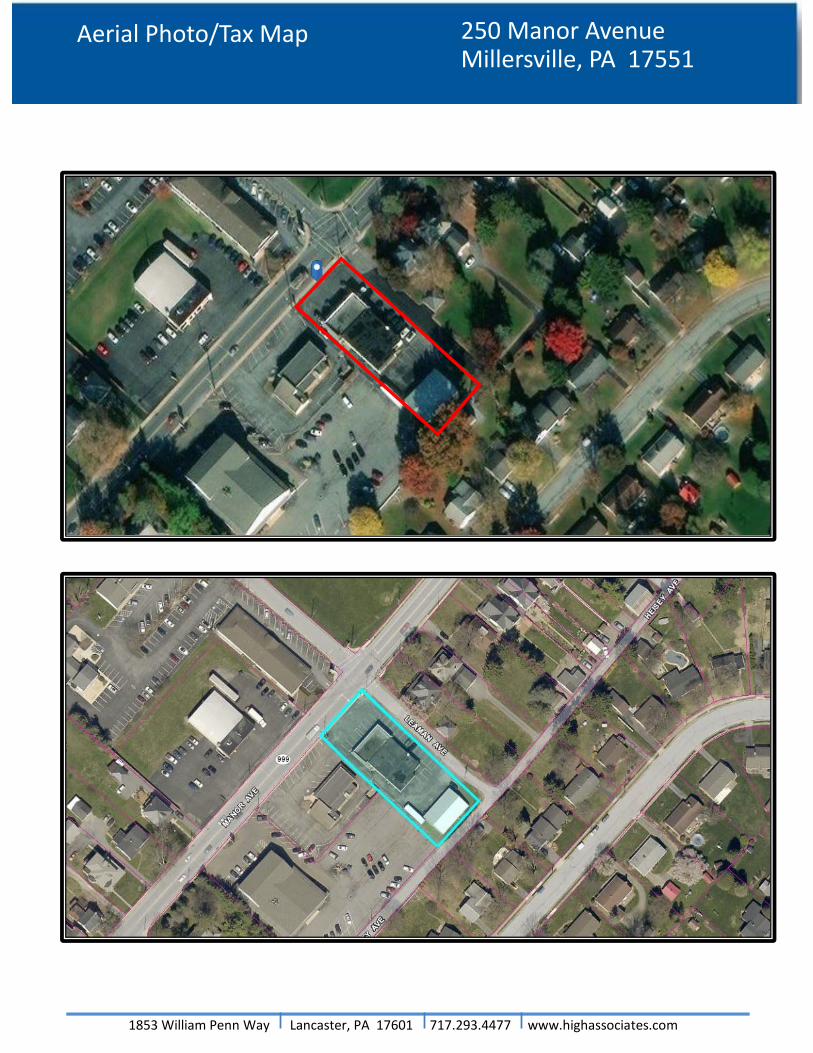
Description:Great corner location at traffic light in busy Millersville intersection. Former salon. Can adapt to many similar uses or become an office/professional space.
Jeffrey Kurtz, CCIM717.293.4554 – direct [email protected]
Retail/Office Property
250 Manor AvenueMillersville, PA 17551
PROPERTY INFORMATION
Available Square Feet 1,970 square feet
Construction Brick
Heat Gas ceiling
Air Conditioning Central A/C, electric
Electric 200 amp service
Ceiling Height 8 feet
Water & Sewer Public
Parking On‐site
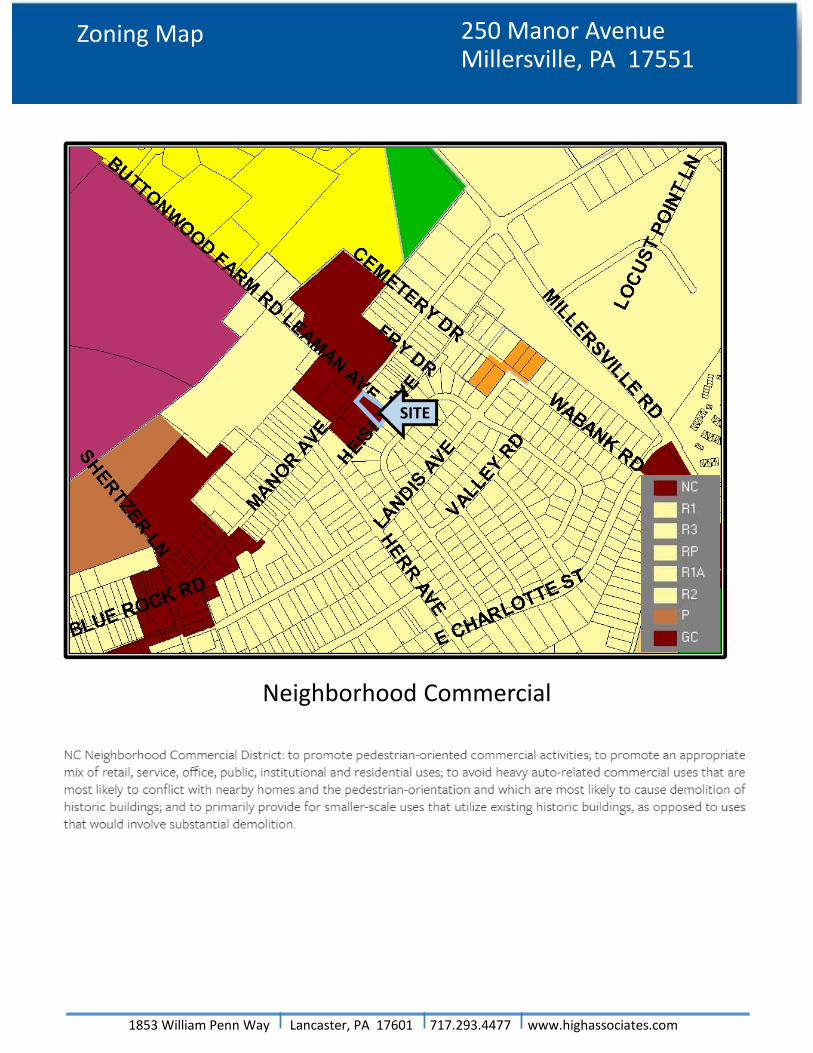
Zoning Neighborhood Commercial
Acres .57 acres
Municipality Millersville Borough
County Lancaster

1853 William Penn Way Lancaster, PA 17601 717.293.4477 www.highassociates.com
250 Manor AvenueMillersville, PA 17551
For Lease
Information furnished regarding property for sale or rent is from sources deemed reliable, but is not guaranteed. No warranty or representation is made as to accuracy thereof and is submitted subject to errors, omissions, change of price, or other conditions, prior sale or lease or withdrawal without notice. No liability of any kind is to be imposed on the broker herein.
CAM Charges Cost
Taxes 5,061.93$
Insurance 1,126.00$
Snow Removal 740.00$
Trash Removal 1,020.00$
Total 7,947.93$
Building Square Feet 4,240
CAM Fee/SF $1.87
Tenant pays water and sewer directly to the Landlord.
Gas and electric paid to supplier by Tenant.

1853 William Penn Way Lancaster, PA 17601 717.293.4477 www.highassociates.com
250 Manor AvenueMillersville, PA 17551
Property Photos

1853 William Penn Way Lancaster, PA 17601 717.293.4477 www.highassociates.com
250 Manor AvenueMillersville, PA 17551
Location Maps
1853 William Penn Way Lancaster, PA 17601 717.293.4477 www.highassociates.com
250 Manor AvenueMillersville, PA 17551
Aerial Photo/Tax Map
1853 William Penn Way Lancaster, PA 17601 717.293.4477 www.highassociates.com
250 Manor AvenueMillersville, PA 17551
Zoning Map
SITE
Neighborhood Commercial
1853 William Penn Way Lancaster, PA 17601 717.293.4477 www.highassociates.com
250 Manor AvenueMillersville, PA 17551
Floor Plan
1,920 SF

Retail Market Potential250 Manor Ave, Millersville, Pennsylvania, 17551 Prepared by EsriRing: 1 mile radius Latitude: 40.01218
Longitude: -76.35346
Demographic Summary 2018 2023Population 6,767 6,998Population 18+ 5,856 6,054Households 2,551 2,649Median Household Income $60,135 $65,247
Expected Number of Percent of Product/Consumer Behavior Adults/HHs Adults/HHs MPIApparel (Adults)
Bought any men's clothing in last 12 months 2,752 47.0% 100Bought any women's clothing in last 12 months 2,526 43.1% 100Bought clothing for child <13 years in last 6 months 1,496 25.5% 95Bought any shoes in last 12 months 3,182 54.3% 102Bought costume jewelry in last 12 months 1,056 18.0% 99Bought any fine jewelry in last 12 months 1,045 17.8% 100Bought a watch in last 12 months 993 17.0% 107
Automobiles (Households)HH owns/leases any vehicle 2,273 89.1% 104HH bought/leased new vehicle last 12 mo 274 10.7% 111
Automotive Aftermarket (Adults)Bought gasoline in last 6 months 5,179 88.4% 104Bought/changed motor oil in last 12 months 2,956 50.5% 106Had tune-up in last 12 months 1,556 26.6% 103
Beverages (Adults)Drank bottled water/seltzer in last 6 months 3,849 65.7% 94Drank regular cola in last 6 months 2,410 41.2% 93Drank beer/ale in last 6 months 2,516 43.0% 102
Cameras (Adults)Own digital point & shoot camera/camcorder 748 12.8% 109Own digital SLR camera/camcorder 433 7.4% 95Printed digital photos in last 12 months 1,451 24.8% 107
Cell Phones (Adults/Households)Bought cell phone in last 12 months 2,015 34.4% 95Have a smartphone 4,714 80.5% 101Have a smartphone: Android phone (any brand) 2,144 36.6% 94Have a smartphone: Apple iPhone 2,431 41.5% 108Number of cell phones in household: 1 807 31.6% 103Number of cell phones in household: 2 1,019 39.9% 104Number of cell phones in household: 3+ 629 24.7% 89HH has cell phone only (no landline telephone) 1,310 51.4% 98
Computers (Households)HH owns a computer 1,992 78.1% 105HH owns desktop computer 1,034 40.5% 106HH owns laptop/notebook 1,516 59.4% 105HH owns any Apple/Mac brand computer 444 17.4% 98HH owns any PC/non-Apple brand computer 1,700 66.6% 106HH purchased most recent computer in a store 1,032 40.5% 109HH purchased most recent computer online 352 13.8% 103Spent <$500 on most recent home computer 435 17.1% 112Spent $500-$999 on most recent home computer"
513 20.1% 114Spent $1,000-$1,499 on most recent home computer 260 10.2% 107Spent $1,500-$1,999 on most recent home computer 121 4.7% 103Spent $2,000+ on most recent home computer 87 3.4% 84
Data Note: An MPI (Market Potential Index) measures the relative likelihood of the adults or households in the specified trade area to exhibit certain consumer behavior or purchasing patterns compared to the U.S. An MPI of 100 represents the U.S. average. Source: These data are based upon national propensities to use various products and services, applied to local demographic composition. Usage data were collected by GfK MRI in a nationally representative survey of U.S. households. Esri forecasts for 2018 and 2023.
©2018 Esri
Retail Market Potential250 Manor Ave, Millersville, Pennsylvania, 17551 Prepared by EsriRing: 1 mile radius Latitude: 40.01218
Longitude: -76.35346
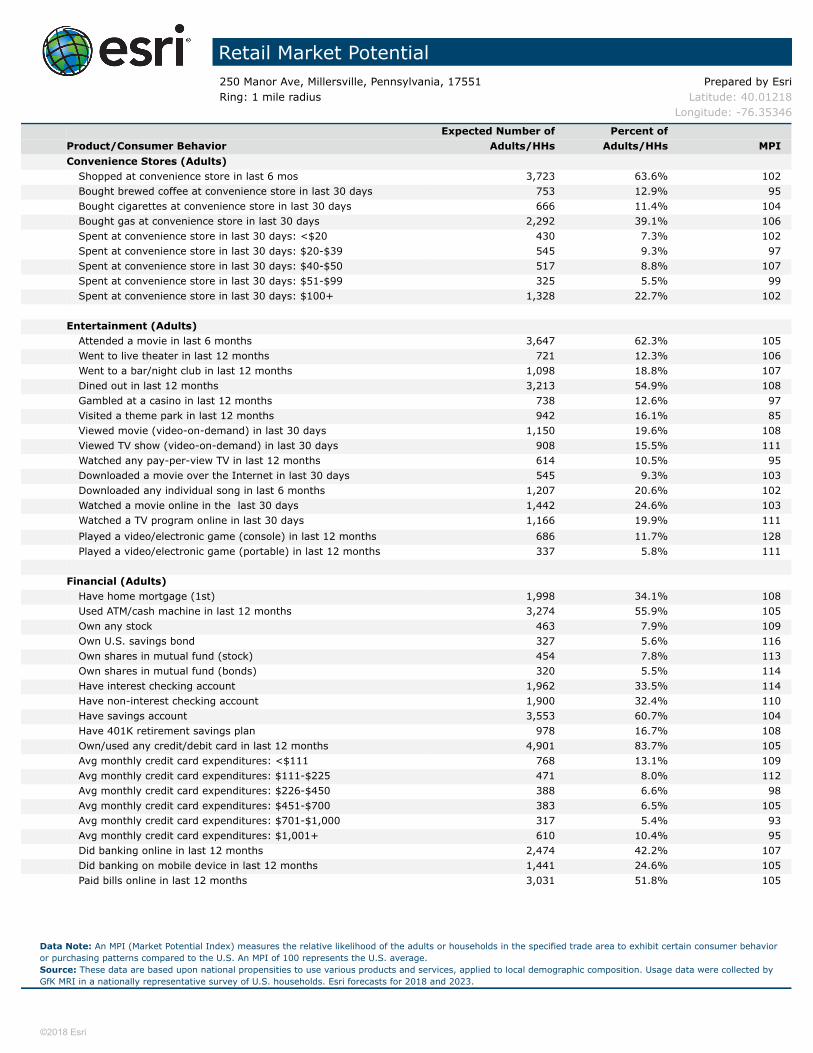
Expected Number of Percent of Product/Consumer Behavior Adults/HHs Adults/HHs MPIConvenience Stores (Adults)
Shopped at convenience store in last 6 mos 3,723 63.6% 102Bought brewed coffee at convenience store in last 30 days 753 12.9% 95Bought cigarettes at convenience store in last 30 days 666 11.4% 104Bought gas at convenience store in last 30 days 2,292 39.1% 106Spent at convenience store in last 30 days: <$20 430 7.3% 102Spent at convenience store in last 30 days: $20-$39 545 9.3% 97Spent at convenience store in last 30 days: $40-$50 517 8.8% 107Spent at convenience store in last 30 days: $51-$99 325 5.5% 99Spent at convenience store in last 30 days: $100+ 1,328 22.7% 102
Entertainment (Adults)Attended a movie in last 6 months 3,647 62.3% 105Went to live theater in last 12 months 721 12.3% 106Went to a bar/night club in last 12 months 1,098 18.8% 107Dined out in last 12 months 3,213 54.9% 108Gambled at a casino in last 12 months 738 12.6% 97Visited a theme park in last 12 months 942 16.1% 85Viewed movie (video-on-demand) in last 30 days 1,150 19.6% 108Viewed TV show (video-on-demand) in last 30 days 908 15.5% 111Watched any pay-per-view TV in last 12 months 614 10.5% 95Downloaded a movie over the Internet in last 30 days 545 9.3% 103Downloaded any individual song in last 6 months 1,207 20.6% 102Watched a movie online in the last 30 days 1,442 24.6% 103Watched a TV program online in last 30 days 1,166 19.9% 111Played a video/electronic game (console) in last 12 months 686 11.7% 128Played a video/electronic game (portable) in last 12 months 337 5.8% 111
Financial (Adults)Have home mortgage (1st) 1,998 34.1% 108Used ATM/cash machine in last 12 months 3,274 55.9% 105Own any stock 463 7.9% 109Own U.S. savings bond 327 5.6% 116Own shares in mutual fund (stock) 454 7.8% 113Own shares in mutual fund (bonds) 320 5.5% 114Have interest checking account 1,962 33.5% 114Have non-interest checking account 1,900 32.4% 110Have savings account 3,553 60.7% 104Have 401K retirement savings plan 978 16.7% 108Own/used any credit/debit card in last 12 months 4,901 83.7% 105Avg monthly credit card expenditures: <$111 768 13.1% 109Avg monthly credit card expenditures: $111-$225 471 8.0% 112Avg monthly credit card expenditures: $226-$450 388 6.6% 98Avg monthly credit card expenditures: $451-$700 383 6.5% 105Avg monthly credit card expenditures: $701-$1,000 317 5.4% 93Avg monthly credit card expenditures: $1,001+ 610 10.4% 95Did banking online in last 12 months 2,474 42.2% 107Did banking on mobile device in last 12 months 1,441 24.6% 105Paid bills online in last 12 months 3,031 51.8% 105
Data Note: An MPI (Market Potential Index) measures the relative likelihood of the adults or households in the specified trade area to exhibit certain consumer behavior or purchasing patterns compared to the U.S. An MPI of 100 represents the U.S. average. Source: These data are based upon national propensities to use various products and services, applied to local demographic composition. Usage data were collected by GfK MRI in a nationally representative survey of U.S. households. Esri forecasts for 2018 and 2023.
©2018 Esri

Retail Market Potential250 Manor Ave, Millersville, Pennsylvania, 17551 Prepared by EsriRing: 1 mile radius Latitude: 40.01218
Longitude: -76.35346
Expected Number of Percent of Product/Consumer Behavior Adults/HHs Adults/HHs MPIGrocery (Adults)
Used beef (fresh/frozen) in last 6 months 1,751 68.6% 100Used bread in last 6 months 2,397 94.0% 100Used chicken (fresh or frozen) in last 6 months 1,716 67.3% 98Used turkey (fresh or frozen) in last 6 months 369 14.5% 94Used fish/seafood (fresh or frozen) in last 6 months 1,336 52.4% 96Used fresh fruit/vegetables in last 6 months 2,224 87.2% 100Used fresh milk in last 6 months 2,219 87.0% 101Used organic food in last 6 months 551 21.6% 91
Health (Adults)Exercise at home 2+ times per week 1,715 29.3% 105Exercise at club 2+ times per week 874 14.9% 103Visited a doctor in last 12 months 4,531 77.4% 101Used vitamin/dietary supplement in last 6 months 3,274 55.9% 103
Home (Households)Any home improvement in last 12 months 796 31.2% 112Used housekeeper/maid/professional HH cleaning service in last 12 months
349 13.7% 98Purchased low ticket HH furnishings in last 12 months 448 17.6% 105Purchased big ticket HH furnishings in last 12 months 584 22.9% 104Bought any small kitchen appliance in last 12 months 549 21.5% 96Bought any large kitchen appliance in last 12 months 378 14.8% 105
Insurance (Adults/Households)Currently carry life insurance 2,842 48.5% 109Carry medical/hospital/accident insurance 4,607 78.7% 105Carry homeowner insurance 3,058 52.2% 110Carry renter's insurance 513 8.8% 102Have auto insurance: 1 vehicle in household covered 794 31.1% 102Have auto insurance: 2 vehicles in household covered 809 31.7% 110Have auto insurance: 3+ vehicles in household covered 603 23.6% 104
Pets (Households)Household owns any pet 1,449 56.8% 104Household owns any cat 643 25.2% 110Household owns any dog 1,069 41.9% 101
Psychographics (Adults)Buying American is important to me 2,409 41.1% 101Usually buy items on credit rather than wait 698 11.9% 91Usually buy based on quality - not price 1,031 17.6% 91Price is usually more important than brand name 1,688 28.8% 103Usually use coupons for brands I buy often 1,076 18.4% 103Am interested in how to help the environment 1,003 17.1% 94Usually pay more for environ safe product 749 12.8% 90Usually value green products over convenience 552 9.4% 83Likely to buy a brand that supports a charity 2,065 35.3% 102
Reading (Adults)Bought digital book in last 12 months 835 14.3% 107Bought hardcover book in last 12 months 1,273 21.7% 109Bought paperback book in last 12 month 1,776 30.3% 105Read any daily newspaper (paper version) 1,471 25.1% 122Read any digital newspaper in last 30 days 2,435 41.6% 111Read any magazine (paper/electronic version) in last 6 months 5,351 91.4% 101
Data Note: An MPI (Market Potential Index) measures the relative likelihood of the adults or households in the specified trade area to exhibit certain consumer behavior or purchasing patterns compared to the U.S. An MPI of 100 represents the U.S. average. Source: These data are based upon national propensities to use various products and services, applied to local demographic composition. Usage data were collected by GfK MRI in a nationally representative survey of U.S. households. Esri forecasts for 2018 and 2023.
©2018 Esri

Retail Market Potential250 Manor Ave, Millersville, Pennsylvania, 17551 Prepared by EsriRing: 1 mile radius Latitude: 40.01218
Longitude: -76.35346
Expected Number of Percent of Product/Consumer Behavior Adults/HHs Adults/HHs MPIRestaurants (Adults)
Went to family restaurant/steak house in last 6 months 4,534 77.4% 103Went to family restaurant/steak house: 4+ times a month 1,611 27.5% 102Went to fast food/drive-in restaurant in last 6 months 5,380 91.9% 102Went to fast food/drive-in restaurant 9+ times/mo 2,400 41.0% 103Fast food/drive-in last 6 months: eat in 2,275 38.8% 106Fast food/drive-in last 6 months: home delivery 508 8.7% 103Fast food/drive-in last 6 months: take-out/drive-thru 2,965 50.6% 107Fast food/drive-in last 6 months: take-out/walk-in 1,266 21.6% 103
Television & Electronics (Adults/Households)Own any tablet 2,718 46.4% 102Own any e-reader 488 8.3% 112Own e-reader/tablet: iPad 1,643 28.1% 105HH has Internet connectable TV 699 27.4% 106Own any portable MP3 player 1,302 22.2% 103HH owns 1 TV 513 20.1% 96HH owns 2 TVs 683 26.8% 99HH owns 3 TVs 587 23.0% 110HH owns 4+ TVs 477 18.7% 105HH subscribes to cable TV 1,309 51.3% 115HH subscribes to fiber optic 193 7.6% 95HH owns portable GPS navigation device 693 27.2% 109HH purchased video game system in last 12 mos 176 6.9% 81HH owns any Internet video device for TV 547 21.4% 105
Travel (Adults)Domestic travel in last 12 months 3,281 56.0% 108Took 3+ domestic non-business trips in last 12 months 796 13.6% 114Spent on domestic vacations in last 12 months: <$1,000 717 12.2% 113Spent on domestic vacations in last 12 months: $1,000-$1,499 406 6.9% 116Spent on domestic vacations in last 12 months: $1,500-$1,999 249 4.3% 108Spent on domestic vacations in last 12 months: $2,000-$2,999 245 4.2% 110Spent on domestic vacations in last 12 months: $3,000+ 369 6.3% 100Domestic travel in the 12 months: used general travel website 393 6.7% 97Foreign travel in last 3 years 1,511 25.8% 97Took 3+ foreign trips by plane in last 3 years 234 4.0% 83Spent on foreign vacations in last 12 months: <$1,000 271 4.6% 99Spent on foreign vacations in last 12 months: $1,000-$2,999 189 3.2% 86Spent on foreign vacations in last 12 months: $3,000+ 314 5.4% 91Foreign travel in last 3 years: used general travel website 310 5.3% 88Nights spent in hotel/motel in last 12 months: any 2,717 46.4% 106Took cruise of more than one day in last 3 years 514 8.8% 102Member of any frequent flyer program 1,010 17.2% 99Member of any hotel rewards program 1,091 18.6% 111
Data Note: An MPI (Market Potential Index) measures the relative likelihood of the adults or households in the specified trade area to exhibit certain consumer behavior or purchasing patterns compared to the U.S. An MPI of 100 represents the U.S. average. Source: These data are based upon national propensities to use various products and services, applied to local demographic composition. Usage data were collected by GfK MRI in a nationally representative survey of U.S. households. Esri forecasts for 2018 and 2023.
©2018 Esri
Retail Market Potential250 Manor Ave, Millersville, Pennsylvania, 17551 Prepared by EsriRing: 3 mile radius Latitude: 40.01218
Longitude: -76.35346
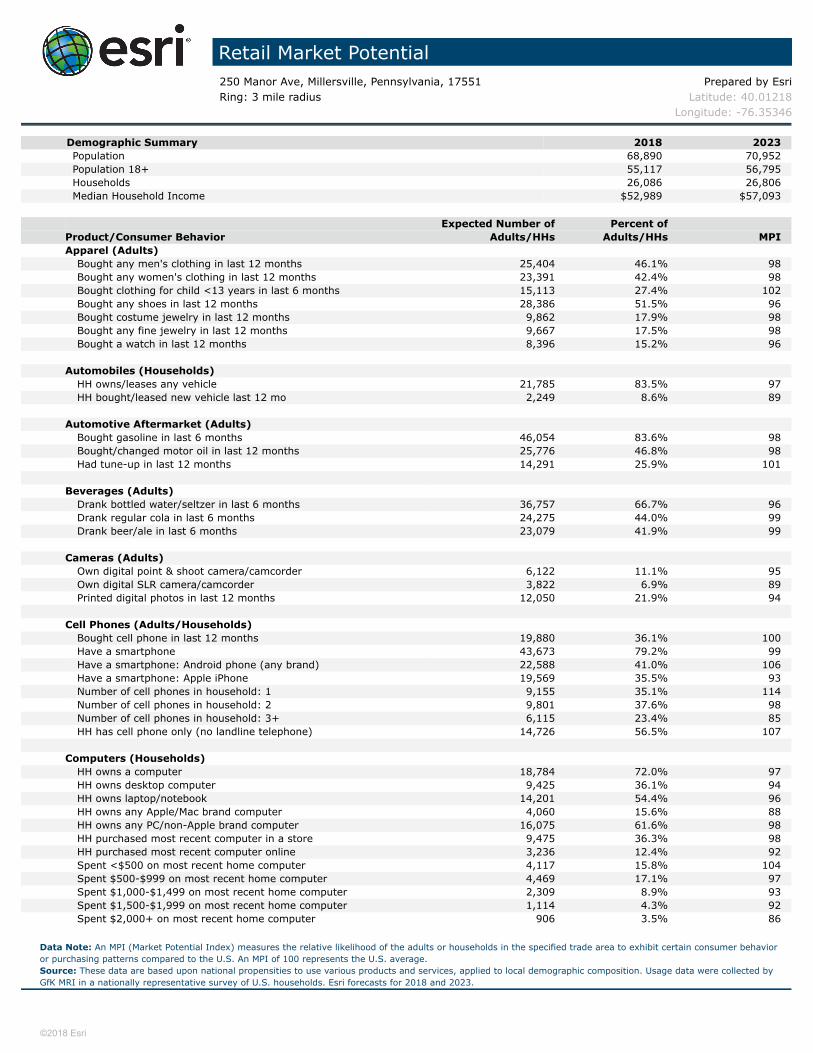
Demographic Summary 2018 2023Population 68,890 70,952Population 18+ 55,117 56,795Households 26,086 26,806Median Household Income $52,989 $57,093
Expected Number of Percent of Product/Consumer Behavior Adults/HHs Adults/HHs MPIApparel (Adults)
Bought any men's clothing in last 12 months 25,404 46.1% 98Bought any women's clothing in last 12 months 23,391 42.4% 98Bought clothing for child <13 years in last 6 months 15,113 27.4% 102Bought any shoes in last 12 months 28,386 51.5% 96Bought costume jewelry in last 12 months 9,862 17.9% 98Bought any fine jewelry in last 12 months 9,667 17.5% 98Bought a watch in last 12 months 8,396 15.2% 96
Automobiles (Households)HH owns/leases any vehicle 21,785 83.5% 97HH bought/leased new vehicle last 12 mo 2,249 8.6% 89
Automotive Aftermarket (Adults)Bought gasoline in last 6 months 46,054 83.6% 98Bought/changed motor oil in last 12 months 25,776 46.8% 98Had tune-up in last 12 months 14,291 25.9% 101
Beverages (Adults)Drank bottled water/seltzer in last 6 months 36,757 66.7% 96Drank regular cola in last 6 months 24,275 44.0% 99Drank beer/ale in last 6 months 23,079 41.9% 99
Cameras (Adults)Own digital point & shoot camera/camcorder 6,122 11.1% 95Own digital SLR camera/camcorder 3,822 6.9% 89Printed digital photos in last 12 months 12,050 21.9% 94
Cell Phones (Adults/Households)Bought cell phone in last 12 months 19,880 36.1% 100Have a smartphone 43,673 79.2% 99Have a smartphone: Android phone (any brand) 22,588 41.0% 106Have a smartphone: Apple iPhone 19,569 35.5% 93Number of cell phones in household: 1 9,155 35.1% 114Number of cell phones in household: 2 9,801 37.6% 98Number of cell phones in household: 3+ 6,115 23.4% 85HH has cell phone only (no landline telephone) 14,726 56.5% 107
Computers (Households)HH owns a computer 18,784 72.0% 97HH owns desktop computer 9,425 36.1% 94HH owns laptop/notebook 14,201 54.4% 96HH owns any Apple/Mac brand computer 4,060 15.6% 88HH owns any PC/non-Apple brand computer 16,075 61.6% 98HH purchased most recent computer in a store 9,475 36.3% 98HH purchased most recent computer online 3,236 12.4% 92Spent <$500 on most recent home computer 4,117 15.8% 104Spent $500-$999 on most recent home computer"
4,469 17.1% 97Spent $1,000-$1,499 on most recent home computer 2,309 8.9% 93Spent $1,500-$1,999 on most recent home computer 1,114 4.3% 92Spent $2,000+ on most recent home computer 906 3.5% 86
Data Note: An MPI (Market Potential Index) measures the relative likelihood of the adults or households in the specified trade area to exhibit certain consumer behavior or purchasing patterns compared to the U.S. An MPI of 100 represents the U.S. average. Source: These data are based upon national propensities to use various products and services, applied to local demographic composition. Usage data were collected by GfK MRI in a nationally representative survey of U.S. households. Esri forecasts for 2018 and 2023.
©2018 Esri
Retail Market Potential250 Manor Ave, Millersville, Pennsylvania, 17551 Prepared by EsriRing: 3 mile radius Latitude: 40.01218
Longitude: -76.35346
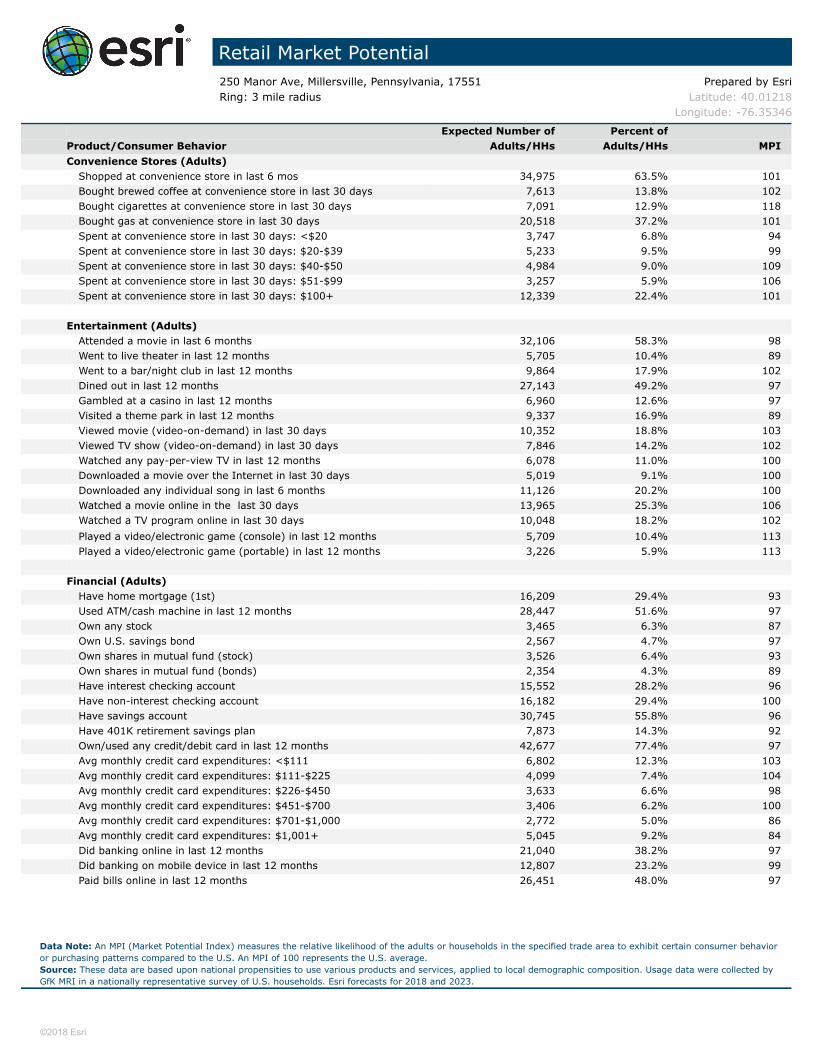
Expected Number of Percent of Product/Consumer Behavior Adults/HHs Adults/HHs MPIConvenience Stores (Adults)
Shopped at convenience store in last 6 mos 34,975 63.5% 101Bought brewed coffee at convenience store in last 30 days 7,613 13.8% 102Bought cigarettes at convenience store in last 30 days 7,091 12.9% 118Bought gas at convenience store in last 30 days 20,518 37.2% 101Spent at convenience store in last 30 days: <$20 3,747 6.8% 94Spent at convenience store in last 30 days: $20-$39 5,233 9.5% 99Spent at convenience store in last 30 days: $40-$50 4,984 9.0% 109Spent at convenience store in last 30 days: $51-$99 3,257 5.9% 106Spent at convenience store in last 30 days: $100+ 12,339 22.4% 101
Entertainment (Adults)Attended a movie in last 6 months 32,106 58.3% 98Went to live theater in last 12 months 5,705 10.4% 89Went to a bar/night club in last 12 months 9,864 17.9% 102Dined out in last 12 months 27,143 49.2% 97Gambled at a casino in last 12 months 6,960 12.6% 97Visited a theme park in last 12 months 9,337 16.9% 89Viewed movie (video-on-demand) in last 30 days 10,352 18.8% 103Viewed TV show (video-on-demand) in last 30 days 7,846 14.2% 102Watched any pay-per-view TV in last 12 months 6,078 11.0% 100Downloaded a movie over the Internet in last 30 days 5,019 9.1% 100Downloaded any individual song in last 6 months 11,126 20.2% 100Watched a movie online in the last 30 days 13,965 25.3% 106Watched a TV program online in last 30 days 10,048 18.2% 102Played a video/electronic game (console) in last 12 months 5,709 10.4% 113Played a video/electronic game (portable) in last 12 months 3,226 5.9% 113
Financial (Adults)Have home mortgage (1st) 16,209 29.4% 93Used ATM/cash machine in last 12 months 28,447 51.6% 97Own any stock 3,465 6.3% 87Own U.S. savings bond 2,567 4.7% 97Own shares in mutual fund (stock) 3,526 6.4% 93Own shares in mutual fund (bonds) 2,354 4.3% 89Have interest checking account 15,552 28.2% 96Have non-interest checking account 16,182 29.4% 100Have savings account 30,745 55.8% 96Have 401K retirement savings plan 7,873 14.3% 92Own/used any credit/debit card in last 12 months 42,677 77.4% 97Avg monthly credit card expenditures: <$111 6,802 12.3% 103Avg monthly credit card expenditures: $111-$225 4,099 7.4% 104Avg monthly credit card expenditures: $226-$450 3,633 6.6% 98Avg monthly credit card expenditures: $451-$700 3,406 6.2% 100Avg monthly credit card expenditures: $701-$1,000 2,772 5.0% 86Avg monthly credit card expenditures: $1,001+ 5,045 9.2% 84Did banking online in last 12 months 21,040 38.2% 97Did banking on mobile device in last 12 months 12,807 23.2% 99Paid bills online in last 12 months 26,451 48.0% 97
Data Note: An MPI (Market Potential Index) measures the relative likelihood of the adults or households in the specified trade area to exhibit certain consumer behavior or purchasing patterns compared to the U.S. An MPI of 100 represents the U.S. average. Source: These data are based upon national propensities to use various products and services, applied to local demographic composition. Usage data were collected by GfK MRI in a nationally representative survey of U.S. households. Esri forecasts for 2018 and 2023.
©2018 Esri

Retail Market Potential250 Manor Ave, Millersville, Pennsylvania, 17551 Prepared by EsriRing: 3 mile radius Latitude: 40.01218
Longitude: -76.35346
Expected Number of Percent of Product/Consumer Behavior Adults/HHs Adults/HHs MPIGrocery (Adults)
Used beef (fresh/frozen) in last 6 months 17,858 68.5% 100Used bread in last 6 months 24,488 93.9% 100Used chicken (fresh or frozen) in last 6 months 17,643 67.6% 98Used turkey (fresh or frozen) in last 6 months 3,862 14.8% 97Used fish/seafood (fresh or frozen) in last 6 months 13,830 53.0% 97Used fresh fruit/vegetables in last 6 months 22,463 86.1% 99Used fresh milk in last 6 months 22,422 86.0% 100Used organic food in last 6 months 5,773 22.1% 94
Health (Adults)Exercise at home 2+ times per week 14,996 27.2% 97Exercise at club 2+ times per week 7,415 13.5% 93Visited a doctor in last 12 months 41,488 75.3% 98Used vitamin/dietary supplement in last 6 months 29,186 53.0% 98
Home (Households)Any home improvement in last 12 months 6,459 24.8% 89Used housekeeper/maid/professional HH cleaning service in last 12 months
3,135 12.0% 86Purchased low ticket HH furnishings in last 12 months 4,243 16.3% 97Purchased big ticket HH furnishings in last 12 months 5,788 22.2% 101Bought any small kitchen appliance in last 12 months 5,735 22.0% 98Bought any large kitchen appliance in last 12 months 3,549 13.6% 96
Insurance (Adults/Households)Currently carry life insurance 23,150 42.0% 94Carry medical/hospital/accident insurance 40,979 74.3% 99Carry homeowner insurance 24,309 44.1% 93Carry renter's insurance 5,342 9.7% 113Have auto insurance: 1 vehicle in household covered 8,745 33.5% 110Have auto insurance: 2 vehicles in household covered 7,096 27.2% 94Have auto insurance: 3+ vehicles in household covered 4,904 18.8% 82
Pets (Households)Household owns any pet 13,809 52.9% 97Household owns any cat 6,086 23.3% 102Household owns any dog 9,923 38.0% 91
Psychographics (Adults)Buying American is important to me 22,218 40.3% 99Usually buy items on credit rather than wait 7,542 13.7% 105Usually buy based on quality - not price 10,673 19.4% 100Price is usually more important than brand name 15,847 28.8% 103Usually use coupons for brands I buy often 10,074 18.3% 102Am interested in how to help the environment 9,931 18.0% 99Usually pay more for environ safe product 7,898 14.3% 101Usually value green products over convenience 5,979 10.8% 96Likely to buy a brand that supports a charity 19,057 34.6% 100
Reading (Adults)Bought digital book in last 12 months 6,661 12.1% 91Bought hardcover book in last 12 months 10,655 19.3% 97Bought paperback book in last 12 month 15,614 28.3% 98Read any daily newspaper (paper version) 12,153 22.0% 107Read any digital newspaper in last 30 days 20,924 38.0% 101Read any magazine (paper/electronic version) in last 6 months 50,259 91.2% 101
Data Note: An MPI (Market Potential Index) measures the relative likelihood of the adults or households in the specified trade area to exhibit certain consumer behavior or purchasing patterns compared to the U.S. An MPI of 100 represents the U.S. average. Source: These data are based upon national propensities to use various products and services, applied to local demographic composition. Usage data were collected by GfK MRI in a nationally representative survey of U.S. households. Esri forecasts for 2018 and 2023.
©2018 Esri

Retail Market Potential250 Manor Ave, Millersville, Pennsylvania, 17551 Prepared by EsriRing: 3 mile radius Latitude: 40.01218
Longitude: -76.35346
Expected Number of Percent of Product/Consumer Behavior Adults/HHs Adults/HHs MPIRestaurants (Adults)
Went to family restaurant/steak house in last 6 months 40,926 74.3% 98Went to family restaurant/steak house: 4+ times a month 14,171 25.7% 96Went to fast food/drive-in restaurant in last 6 months 49,857 90.5% 100Went to fast food/drive-in restaurant 9+ times/mo 21,448 38.9% 98Fast food/drive-in last 6 months: eat in 19,607 35.6% 97Fast food/drive-in last 6 months: home delivery 4,680 8.5% 101Fast food/drive-in last 6 months: take-out/drive-thru 26,400 47.9% 101Fast food/drive-in last 6 months: take-out/walk-in 11,530 20.9% 99
Television & Electronics (Adults/Households)Own any tablet 24,481 44.4% 97Own any e-reader 3,779 6.9% 92Own e-reader/tablet: iPad 13,468 24.4% 92HH has Internet connectable TV 6,212 23.8% 92Own any portable MP3 player 11,287 20.5% 95HH owns 1 TV 5,764 22.1% 105HH owns 2 TVs 7,172 27.5% 102HH owns 3 TVs 5,163 19.8% 94HH owns 4+ TVs 4,261 16.3% 92HH subscribes to cable TV 12,901 49.5% 111HH subscribes to fiber optic 1,874 7.2% 90HH owns portable GPS navigation device 5,928 22.7% 91HH purchased video game system in last 12 mos 1,964 7.5% 88HH owns any Internet video device for TV 5,018 19.2% 94
Travel (Adults)Domestic travel in last 12 months 27,450 49.8% 96Took 3+ domestic non-business trips in last 12 months 6,274 11.4% 96Spent on domestic vacations in last 12 months: <$1,000 6,055 11.0% 102Spent on domestic vacations in last 12 months: $1,000-$1,499 3,140 5.7% 95Spent on domestic vacations in last 12 months: $1,500-$1,999 1,922 3.5% 89Spent on domestic vacations in last 12 months: $2,000-$2,999 1,822 3.3% 87Spent on domestic vacations in last 12 months: $3,000+ 3,000 5.4% 87Domestic travel in the 12 months: used general travel website 3,332 6.0% 87Foreign travel in last 3 years 12,926 23.5% 89Took 3+ foreign trips by plane in last 3 years 2,197 4.0% 83Spent on foreign vacations in last 12 months: <$1,000 2,413 4.4% 94Spent on foreign vacations in last 12 months: $1,000-$2,999 1,835 3.3% 88Spent on foreign vacations in last 12 months: $3,000+ 2,796 5.1% 86Foreign travel in last 3 years: used general travel website 2,864 5.2% 86Nights spent in hotel/motel in last 12 months: any 22,688 41.2% 94Took cruise of more than one day in last 3 years 3,970 7.2% 84Member of any frequent flyer program 8,272 15.0% 86Member of any hotel rewards program 8,124 14.7% 88
Data Note: An MPI (Market Potential Index) measures the relative likelihood of the adults or households in the specified trade area to exhibit certain consumer behavior or purchasing patterns compared to the U.S. An MPI of 100 represents the U.S. average. Source: These data are based upon national propensities to use various products and services, applied to local demographic composition. Usage data were collected by GfK MRI in a nationally representative survey of U.S. households. Esri forecasts for 2018 and 2023.
©2018 Esri

Retail Market Potential250 Manor Ave, Millersville, Pennsylvania, 17551 Prepared by EsriRing: 5 mile radius Latitude: 40.01218
Longitude: -76.35346
Demographic Summary 2018 2023Population 151,597 156,783Population 18+ 120,094 124,507Households 57,987 59,924Median Household Income $53,515 $58,079
Expected Number of Percent of Product/Consumer Behavior Adults/HHs Adults/HHs MPIApparel (Adults)
Bought any men's clothing in last 12 months 55,670 46.4% 98Bought any women's clothing in last 12 months 51,472 42.9% 99Bought clothing for child <13 years in last 6 months 32,717 27.2% 101Bought any shoes in last 12 months 62,212 51.8% 97Bought costume jewelry in last 12 months 22,204 18.5% 102Bought any fine jewelry in last 12 months 21,525 17.9% 100Bought a watch in last 12 months 18,305 15.2% 96
Automobiles (Households)HH owns/leases any vehicle 48,330 83.3% 97HH bought/leased new vehicle last 12 mo 5,077 8.8% 91
Automotive Aftermarket (Adults)Bought gasoline in last 6 months 100,112 83.4% 98Bought/changed motor oil in last 12 months 54,986 45.8% 96Had tune-up in last 12 months 30,912 25.7% 100
Beverages (Adults)Drank bottled water/seltzer in last 6 months 81,225 67.6% 97Drank regular cola in last 6 months 52,659 43.8% 99Drank beer/ale in last 6 months 50,419 42.0% 99
Cameras (Adults)Own digital point & shoot camera/camcorder 13,344 11.1% 95Own digital SLR camera/camcorder 8,373 7.0% 89Printed digital photos in last 12 months 26,440 22.0% 95
Cell Phones (Adults/Households)Bought cell phone in last 12 months 43,357 36.1% 100Have a smartphone 94,998 79.1% 99Have a smartphone: Android phone (any brand) 49,200 41.0% 106Have a smartphone: Apple iPhone 42,756 35.6% 93Number of cell phones in household: 1 20,345 35.1% 114Number of cell phones in household: 2 21,572 37.2% 97Number of cell phones in household: 3+ 13,941 24.0% 87HH has cell phone only (no landline telephone) 32,264 55.6% 106
Computers (Households)HH owns a computer 41,779 72.0% 97HH owns desktop computer 21,089 36.4% 95HH owns laptop/notebook 31,683 54.6% 97HH owns any Apple/Mac brand computer 9,236 15.9% 90HH owns any PC/non-Apple brand computer 35,727 61.6% 98HH purchased most recent computer in a store 20,909 36.1% 97HH purchased most recent computer online 7,242 12.5% 93Spent <$500 on most recent home computer 9,027 15.6% 103Spent $500-$999 on most recent home computer"
9,828 16.9% 96Spent $1,000-$1,499 on most recent home computer 5,243 9.0% 95Spent $1,500-$1,999 on most recent home computer 2,475 4.3% 92Spent $2,000+ on most recent home computer 2,022 3.5% 86
Data Note: An MPI (Market Potential Index) measures the relative likelihood of the adults or households in the specified trade area to exhibit certain consumer behavior or purchasing patterns compared to the U.S. An MPI of 100 represents the U.S. average. Source: These data are based upon national propensities to use various products and services, applied to local demographic composition. Usage data were collected by GfK MRI in a nationally representative survey of U.S. households. Esri forecasts for 2018 and 2023.
©2018 Esri

Retail Market Potential250 Manor Ave, Millersville, Pennsylvania, 17551 Prepared by EsriRing: 5 mile radius Latitude: 40.01218
Longitude: -76.35346
Expected Number of Percent of Product/Consumer Behavior Adults/HHs Adults/HHs MPIConvenience Stores (Adults)
Shopped at convenience store in last 6 mos 75,468 62.8% 100Bought brewed coffee at convenience store in last 30 days 17,041 14.2% 105Bought cigarettes at convenience store in last 30 days 14,548 12.1% 111Bought gas at convenience store in last 30 days 43,765 36.4% 99Spent at convenience store in last 30 days: <$20 8,434 7.0% 97Spent at convenience store in last 30 days: $20-$39 11,389 9.5% 99Spent at convenience store in last 30 days: $40-$50 10,636 8.9% 107Spent at convenience store in last 30 days: $51-$99 7,106 5.9% 106Spent at convenience store in last 30 days: $100+ 26,314 21.9% 99
Entertainment (Adults)Attended a movie in last 6 months 69,732 58.1% 98Went to live theater in last 12 months 12,942 10.8% 93Went to a bar/night club in last 12 months 21,482 17.9% 102Dined out in last 12 months 59,471 49.5% 97Gambled at a casino in last 12 months 15,585 13.0% 100Visited a theme park in last 12 months 20,817 17.3% 92Viewed movie (video-on-demand) in last 30 days 22,512 18.7% 103Viewed TV show (video-on-demand) in last 30 days 17,067 14.2% 102Watched any pay-per-view TV in last 12 months 13,497 11.2% 102Downloaded a movie over the Internet in last 30 days 10,692 8.9% 98Downloaded any individual song in last 6 months 24,068 20.0% 99Watched a movie online in the last 30 days 30,003 25.0% 104Watched a TV program online in last 30 days 21,695 18.1% 101Played a video/electronic game (console) in last 12 months 11,626 9.7% 106Played a video/electronic game (portable) in last 12 months 6,796 5.7% 109
Financial (Adults)Have home mortgage (1st) 35,374 29.5% 93Used ATM/cash machine in last 12 months 61,853 51.5% 97Own any stock 7,975 6.6% 92Own U.S. savings bond 5,616 4.7% 97Own shares in mutual fund (stock) 7,766 6.5% 94Own shares in mutual fund (bonds) 5,402 4.5% 94Have interest checking account 34,094 28.4% 96Have non-interest checking account 34,583 28.8% 98Have savings account 67,055 55.8% 96Have 401K retirement savings plan 17,279 14.4% 93Own/used any credit/debit card in last 12 months 92,942 77.4% 97Avg monthly credit card expenditures: <$111 14,853 12.4% 103Avg monthly credit card expenditures: $111-$225 8,748 7.3% 101Avg monthly credit card expenditures: $226-$450 7,850 6.5% 97Avg monthly credit card expenditures: $451-$700 7,448 6.2% 100Avg monthly credit card expenditures: $701-$1,000 6,568 5.5% 94Avg monthly credit card expenditures: $1,001+ 11,567 9.6% 88Did banking online in last 12 months 45,509 37.9% 96Did banking on mobile device in last 12 months 27,449 22.9% 97Paid bills online in last 12 months 57,223 47.6% 97
Data Note: An MPI (Market Potential Index) measures the relative likelihood of the adults or households in the specified trade area to exhibit certain consumer behavior or purchasing patterns compared to the U.S. An MPI of 100 represents the U.S. average. Source: These data are based upon national propensities to use various products and services, applied to local demographic composition. Usage data were collected by GfK MRI in a nationally representative survey of U.S. households. Esri forecasts for 2018 and 2023.
©2018 Esri
Retail Market Potential250 Manor Ave, Millersville, Pennsylvania, 17551 Prepared by EsriRing: 5 mile radius Latitude: 40.01218
Longitude: -76.35346
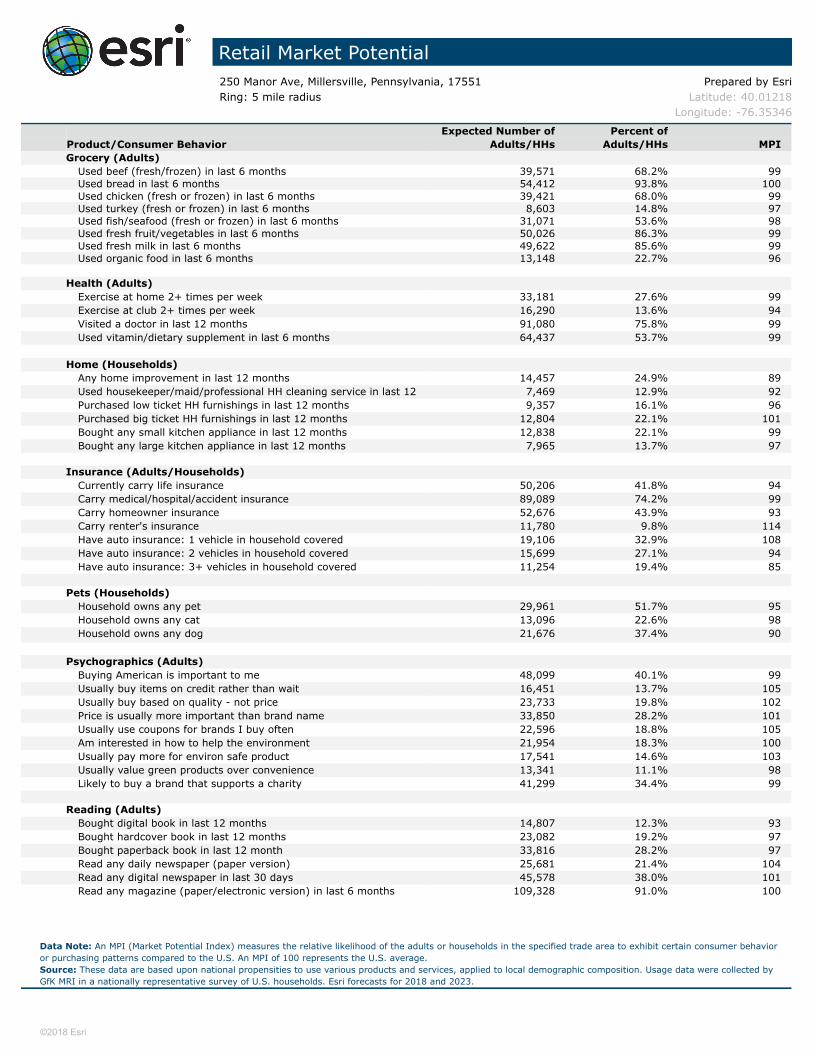
Expected Number of Percent of Product/Consumer Behavior Adults/HHs Adults/HHs MPIGrocery (Adults)
Used beef (fresh/frozen) in last 6 months 39,571 68.2% 99Used bread in last 6 months 54,412 93.8% 100Used chicken (fresh or frozen) in last 6 months 39,421 68.0% 99Used turkey (fresh or frozen) in last 6 months 8,603 14.8% 97Used fish/seafood (fresh or frozen) in last 6 months 31,071 53.6% 98Used fresh fruit/vegetables in last 6 months 50,026 86.3% 99Used fresh milk in last 6 months 49,622 85.6% 99Used organic food in last 6 months 13,148 22.7% 96
Health (Adults)Exercise at home 2+ times per week 33,181 27.6% 99Exercise at club 2+ times per week 16,290 13.6% 94Visited a doctor in last 12 months 91,080 75.8% 99Used vitamin/dietary supplement in last 6 months 64,437 53.7% 99
Home (Households)Any home improvement in last 12 months 14,457 24.9% 89Used housekeeper/maid/professional HH cleaning service in last 12 months
7,469 12.9% 92Purchased low ticket HH furnishings in last 12 months 9,357 16.1% 96Purchased big ticket HH furnishings in last 12 months 12,804 22.1% 101Bought any small kitchen appliance in last 12 months 12,838 22.1% 99Bought any large kitchen appliance in last 12 months 7,965 13.7% 97
Insurance (Adults/Households)Currently carry life insurance 50,206 41.8% 94Carry medical/hospital/accident insurance 89,089 74.2% 99Carry homeowner insurance 52,676 43.9% 93Carry renter's insurance 11,780 9.8% 114Have auto insurance: 1 vehicle in household covered 19,106 32.9% 108Have auto insurance: 2 vehicles in household covered 15,699 27.1% 94Have auto insurance: 3+ vehicles in household covered 11,254 19.4% 85
Pets (Households)Household owns any pet 29,961 51.7% 95Household owns any cat 13,096 22.6% 98Household owns any dog 21,676 37.4% 90
Psychographics (Adults)Buying American is important to me 48,099 40.1% 99Usually buy items on credit rather than wait 16,451 13.7% 105Usually buy based on quality - not price 23,733 19.8% 102Price is usually more important than brand name 33,850 28.2% 101Usually use coupons for brands I buy often 22,596 18.8% 105Am interested in how to help the environment 21,954 18.3% 100Usually pay more for environ safe product 17,541 14.6% 103Usually value green products over convenience 13,341 11.1% 98Likely to buy a brand that supports a charity 41,299 34.4% 99
Reading (Adults)Bought digital book in last 12 months 14,807 12.3% 93Bought hardcover book in last 12 months 23,082 19.2% 97Bought paperback book in last 12 month 33,816 28.2% 97Read any daily newspaper (paper version) 25,681 21.4% 104Read any digital newspaper in last 30 days 45,578 38.0% 101Read any magazine (paper/electronic version) in last 6 months 109,328 91.0% 100
Data Note: An MPI (Market Potential Index) measures the relative likelihood of the adults or households in the specified trade area to exhibit certain consumer behavior or purchasing patterns compared to the U.S. An MPI of 100 represents the U.S. average. Source: These data are based upon national propensities to use various products and services, applied to local demographic composition. Usage data were collected by GfK MRI in a nationally representative survey of U.S. households. Esri forecasts for 2018 and 2023.
©2018 Esri

Retail Market Potential250 Manor Ave, Millersville, Pennsylvania, 17551 Prepared by EsriRing: 5 mile radius Latitude: 40.01218
Longitude: -76.35346
Expected Number of Percent of Product/Consumer Behavior Adults/HHs Adults/HHs MPIRestaurants (Adults)
Went to family restaurant/steak house in last 6 months 89,260 74.3% 98Went to family restaurant/steak house: 4+ times a month 31,268 26.0% 97Went to fast food/drive-in restaurant in last 6 months 108,185 90.1% 100Went to fast food/drive-in restaurant 9+ times/mo 46,199 38.5% 97Fast food/drive-in last 6 months: eat in 42,916 35.7% 97Fast food/drive-in last 6 months: home delivery 10,158 8.5% 101Fast food/drive-in last 6 months: take-out/drive-thru 56,282 46.9% 99Fast food/drive-in last 6 months: take-out/walk-in 24,774 20.6% 98
Television & Electronics (Adults/Households)Own any tablet 53,856 44.8% 98Own any e-reader 8,503 7.1% 96Own e-reader/tablet: iPad 30,143 25.1% 94HH has Internet connectable TV 13,855 23.9% 92Own any portable MP3 player 24,742 20.6% 96HH owns 1 TV 12,822 22.1% 106HH owns 2 TVs 15,675 27.0% 100HH owns 3 TVs 11,484 19.8% 94HH owns 4+ TVs 9,670 16.7% 94HH subscribes to cable TV 28,451 49.1% 110HH subscribes to fiber optic 4,174 7.2% 90HH owns portable GPS navigation device 13,574 23.4% 94HH purchased video game system in last 12 mos 4,446 7.7% 90HH owns any Internet video device for TV 11,382 19.6% 96
Travel (Adults)Domestic travel in last 12 months 60,615 50.5% 97Took 3+ domestic non-business trips in last 12 months 13,729 11.4% 96Spent on domestic vacations in last 12 months: <$1,000 13,068 10.9% 101Spent on domestic vacations in last 12 months: $1,000-$1,499 6,875 5.7% 95Spent on domestic vacations in last 12 months: $1,500-$1,999 4,245 3.5% 90Spent on domestic vacations in last 12 months: $2,000-$2,999 4,078 3.4% 89Spent on domestic vacations in last 12 months: $3,000+ 6,864 5.7% 91Domestic travel in the 12 months: used general travel website 7,481 6.2% 90Foreign travel in last 3 years 29,089 24.2% 91Took 3+ foreign trips by plane in last 3 years 4,943 4.1% 86Spent on foreign vacations in last 12 months: <$1,000 5,409 4.5% 96Spent on foreign vacations in last 12 months: $1,000-$2,999 4,213 3.5% 93Spent on foreign vacations in last 12 months: $3,000+ 6,310 5.3% 89Foreign travel in last 3 years: used general travel website 6,443 5.4% 89Nights spent in hotel/motel in last 12 months: any 49,890 41.5% 95Took cruise of more than one day in last 3 years 9,332 7.8% 91Member of any frequent flyer program 19,000 15.8% 91Member of any hotel rewards program 18,521 15.4% 92
Data Note: An MPI (Market Potential Index) measures the relative likelihood of the adults or households in the specified trade area to exhibit certain consumer behavior or purchasing patterns compared to the U.S. An MPI of 100 represents the U.S. average. Source: These data are based upon national propensities to use various products and services, applied to local demographic composition. Usage data were collected by GfK MRI in a nationally representative survey of U.S. households. Esri forecasts for 2018 and 2023.
©2018 Esri

1853 William Penn Way Lancaster, PA 17601 717.293.4477 www.highassociates.com
717.293.4477
Information furnished regarding property for sale or rent is from sources deemed reliable, but is not guaranteed. No warranty or representation is made as to accuracy thereof and is submitted subject to errors, omissions, change of price, or other conditions, prior sale or lease or withdrawal without notice. No liability of any kind is to be imposed on the broker herein.
1853 William Penn Way
Lancaster, PA 17601
717.291.2284
FAX 717.293.4488
1.800.638.4414
5000 Ritter Road
Suite 201
Mechanicsburg, PA 17055
717.697.2422
FAX 717.697.0870
1.800.213.0094
495 Highlands Boulevard
Suite 103
Coatesville, PA 19320
610.380.8437
FAX 610.380.0583
11020 David Taylor Drive
Suite 130
Charlotte, NC 28262
704.688.0800
FAX 704.688.0801
6497 Parkland Drive
Suite E
Sarasota, FL 34243
941.756.5599
FAX 941.758.7614