25 July 2013 5.40 PM Press & Analyst meeting ... - Quest for Growth · 26 July 2013 11.00 AM Press...
8
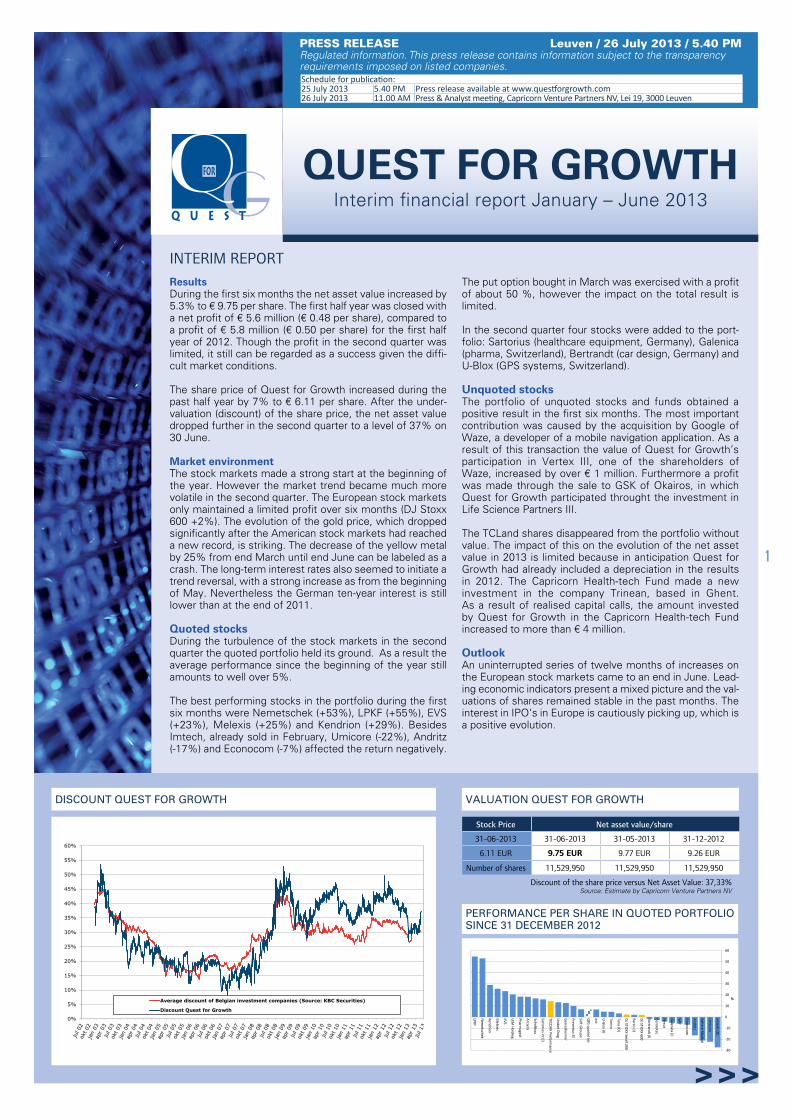
DISCOUNT QUEST FOR GROWTH QUEST FOR GROWTH Interim financial report January – June 2013 INTERIM REPORT Results During the first six months the net asset value increased by 5.3% to € 9.75 per share. The first half year was closed with a net profit of € 5.6 million (€ 0.48 per share), compared to a profit of € 5.8 million (€ 0.50 per share) for the first half year of 2012. Though the profit in the second quarter was limited, it still can be regarded as a success given the diffi- cult market conditions. The share price of Quest for Growth increased during the past half year by 7% to € 6.11 per share. After the under- valuation (discount) of the share price, the net asset value dropped further in the second quarter to a level of 37% on 30 June. Market environment The stock markets made a strong start at the beginning of the year. However the market trend became much more volatile in the second quarter. The European stock markets only maintained a limited profit over six months (DJ Stoxx 600 +2%). The evolution of the gold price, which dropped significantly after the American stock markets had reached a new record, is striking. The decrease of the yellow metal by 25% from end March until end June can be labeled as a crash. The long-term interest rates also seemed to initiate a trend reversal, with a strong increase as from the beginning of May. Nevertheless the German ten-year interest is still lower than at the end of 2011. Quoted stocks During the turbulence of the stock markets in the second quarter the quoted portfolio held its ground. As a result the average performance since the beginning of the year still amounts to well over 5%. The best performing stocks in the portfolio during the first six months were Nemetschek (+53%), LPKF (+55%), EVS (+23%), Melexis (+25%) and Kendrion (+29%). Besides Imtech, already sold in February, Umicore (-22%), Andritz (-17%) and Econocom (-7%) affected the return negatively. The put option bought in March was exercised with a profit of about 50 %, however the impact on the total result is limited. In the second quarter four stocks were added to the port- folio: Sartorius (healthcare equipment, Germany), Galenica (pharma, Switzerland), Bertrandt (car design, Germany) and U-Blox (GPS systems, Switzerland). Unquoted stocks The portfolio of unquoted stocks and funds obtained a positive result in the first six months. The most important contribution was caused by the acquisition by Google of Waze, a developer of a mobile navigation application. As a result of this transaction the value of Quest for Growth’s participation in Vertex III, one of the shareholders of Waze, increased by over € 1 million. Furthermore a profit was made through the sale to GSK of Okairos, in which Quest for Growth participated throught the investment in Life Science Partners III. The TCLand shares disappeared from the portfolio without value. The impact of this on the evolution of the net asset value in 2013 is limited because in anticipation Quest for Growth had already included a depreciation in the results in 2012. The Capricorn Health-tech Fund made a new investment in the company Trinean, based in Ghent. As a result of realised capital calls, the amount invested by Quest for Growth in the Capricorn Health-tech Fund increased to more than € 4 million. Outlook An uninterrupted series of twelve months of increases on the European stock markets came to an end in June. Lead- ing economic indicators present a mixed picture and the val- uations of shares remained stable in the past months. The interest in IPO’s in Europe is cautiously picking up, which is a positive evolution. 0% 5% 10% 15% 20% 25% 30% 35% 40% 45% 50% 55% 60% Average discount of Belgian investment companies (Source: KBC Securities) Discount Quest for Growth Stock Price Net asset value/share 31-06-2013 31-06-2013 31-05-2013 31-12-2012 6.11 EUR 9.75 EUR 9.77 EUR 9.26 EUR Number of shares 11,529,950 11,529,950 11,529,950 Discount of the share price versus Net Asset Value: 37,33% Source: Estimate by Capricorn Venture Partners NV PERFORMANCE PER SHARE IN QUOTED PORTFOLIO SINCE 31 DECEMBER 2012 -30 -20 -10 0 10 20 30 40 50 60 Imtech (O) Umicore Sphere Medical Andritz Econocom SAP Galenica (I) Nexus Centrotec Bertrandt (I) DJ STOXX 600 Barco (I) DJ STOXX Small 200 Teva (O) Tomra U-Blox (I) Init QfG quoted (e) Saſt Groupe Fresenius SE Gerresheimer United Drug TECDAX Performance Sartorius Vz (I) Schaltbau Arcadis Pharmagest LEM Holding EVS Melexis Kendrion Nemetschek LPKF % VALUATION QUEST FOR GROWTH 1 Schedule for publicaon: 25 July 2013 5.40 PM Press release available at www.quesorgrowth.com 26 July 2013 11.00 AM Press & Analyst meeng, Capricorn Venture Partners NV, Lei 19, 3000 Leuven PRESS RELEASE Leuven / 26 July 2013 / 5.40 PM Regulated information. This press release contains information subject to the transparency requirements imposed on listed companies.
Transcript of 25 July 2013 5.40 PM Press & Analyst meeting ... - Quest for Growth · 26 July 2013 11.00 AM Press...
DISCOUNT QUEST FOR GROWTH
QUEST FOR GROWTHInterim financial report January – June 2013
INTERIM REPORTResultsDuring the first six months the net asset value increased by 5.3% to € 9.75 per share. The first half year was closed with a net profit of € 5.6 million (€ 0.48 per share), compared to a profit of € 5.8 million (€ 0.50 per share) for the first half year of 2012. Though the profit in the second quarter was limited, it still can be regarded as a success given the diffi-cult market conditions.
The share price of Quest for Growth increased during the past half year by 7% to € 6.11 per share. After the under-valuation (discount) of the share price, the net asset value dropped further in the second quarter to a level of 37% on 30 June.
Market environmentThe stock markets made a strong start at the beginning of the year. However the market trend became much more volatile in the second quarter. The European stock markets only maintained a limited profit over six months (DJ Stoxx 600 +2%). The evolution of the gold price, which dropped significantly after the American stock markets had reached a new record, is striking. The decrease of the yellow metal by 25% from end March until end June can be labeled as a crash. The long-term interest rates also seemed to initiate a trend reversal, with a strong increase as from the beginning of May. Nevertheless the German ten-year interest is still lower than at the end of 2011.
Quoted stocksDuring the turbulence of the stock markets in the second quarter the quoted portfolio held its ground. As a result the average performance since the beginning of the year still amounts to well over 5%.
The best performing stocks in the portfolio during the first six months were Nemetschek (+53%), LPKF (+55%), EVS (+23%), Melexis (+25%) and Kendrion (+29%). Besides Imtech, already sold in February, Umicore (-22%), Andritz (-17%) and Econocom (-7%) affected the return negatively.
The put option bought in March was exercised with a profit of about 50 %, however the impact on the total result is limited.
In the second quarter four stocks were added to the port-folio: Sartorius (healthcare equipment, Germany), Galenica (pharma, Switzerland), Bertrandt (car design, Germany) and U-Blox (GPS systems, Switzerland).
Unquoted stocksThe portfolio of unquoted stocks and funds obtained a positive result in the first six months. The most important contribution was caused by the acquisition by Google of Waze, a developer of a mobile navigation application. As a result of this transaction the value of Quest for Growth’s participation in Vertex III, one of the shareholders of Waze, increased by over € 1 million. Furthermore a profit was made through the sale to GSK of Okairos, in which Quest for Growth participated throught the investment in Life Science Partners III.
The TCLand shares disappeared from the portfolio without value. The impact of this on the evolution of the net asset value in 2013 is limited because in anticipation Quest for Growth had already included a depreciation in the results in 2012. The Capricorn Health-tech Fund made a new investment in the company Trinean, based in Ghent. As a result of realised capital calls, the amount invested by Quest for Growth in the Capricorn Health-tech Fund increased to more than € 4 million.
Outlook An uninterrupted series of twelve months of increases on the European stock markets came to an end in June. Lead-ing economic indicators present a mixed picture and the val-uations of shares remained stable in the past months. The interest in IPO’s in Europe is cautiously picking up, which is a positive evolution.
0%
5%
10%
15%
20%
25%
30%
35%
40%
45%
50%
55%
60%
Average discount of Belgian investment companies (Source: KBC Securities)
Discount Quest for Growth
Stock Price Net asset value/share
31-06-2013 31-06-2013 31-05-2013 31-12-2012
6.11 EUR 9.75 EUR 9.77 EUR 9.26 EUR
Number of shares 11,529,950 11,529,950 11,529,950
Discount of the share price versus Net Asset Value: 37,33%Source: Estimate by Capricorn Venture Partners NV
PERFORMANCE PER SHARE IN QUOTED PORTFOLIO SINCE 31 DECEMBER 2012
-30
-20
-10
0
10
20
30
40
50
60
Imtech (O
)
Um
icore
Sphere Medical
Andritz
Econocom
SAP
Galenica (I)
Nexus
Centrotec
Bertrandt (I)
DJ STO
XX 600
Barco (I)
DJ STO
XX Small 200
Teva (O)
Tomra
U-Blox (I)
Init
QfG
quoted (e)
Saft G
roupe
Fresenius SE
Gerresheim
er
United D
rug
TECDA
X Performance
Sartorius Vz (I)
Schaltbau
Arcadis
Pharmagest
LEM H
olding
EVS
Melexis
Kendrion
Nem
etschek
LPKF
%
VALUATION QUEST FOR GROWTH
1
Schedule for publication: 25 July 2013 5.40 PM Press release available at www.questforgrowth.com 26 July 2013 11.00 AM Press & Analyst meeting, Capricorn Venture Partners NV, Lei 19, 3000 Leuven
PRESS RELEASE Leuven / 26 July 2013 / 5.40 PMRegulated information. This press release contains information subject to the transparency requirements imposed on listed companies.
CONDENSED INTERIM FINANCIAL STATEMENTS
2
201330 June
201231 December
201330 June
201231 December
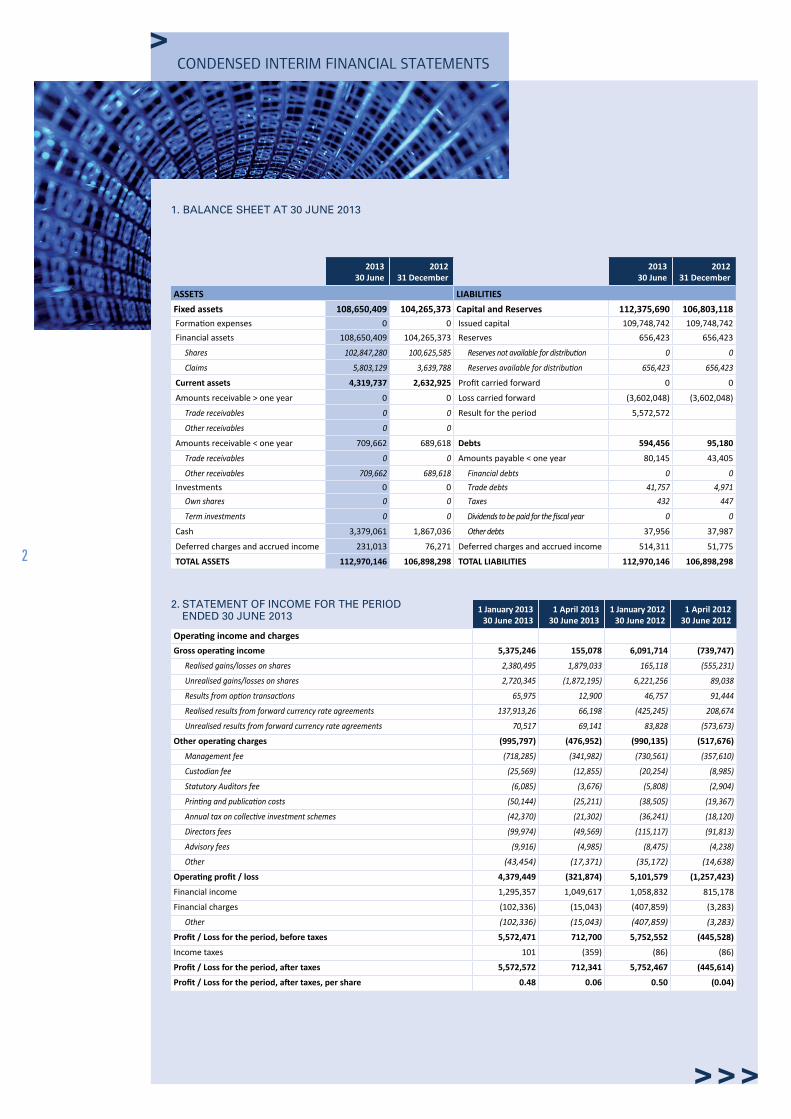
ASSETS LIABILITIES
Fixed assets 108,650,409 104,265,373 Capital and Reserves 112,375,690 106,803,118Formation expenses 0 0 Issued capital 109,748,742 109,748,742
Financial assets 108,650,409 104,265,373 Reserves 656,423 656,423
Shares 102,847,280 100,625,585 Reserves not available for distribution 0 0
Claims 5,803,129 3,639,788 Reserves available for distribution 656,423 656,423
Current assets 4,319,737 2,632,925 Profit carried forward 0 0
Amounts receivable > one year 0 0 Loss carried forward (3,602,048) (3,602,048)
Trade receivables 0 0 Result for the period 5,572,572
Other receivables 0 0
Amounts receivable < one year 709,662 689,618 Debts 594,456 95,180
Trade receivables 0 0 Amounts payable < one year 80,145 43,405
Other receivables 709,662 689,618 Financial debts 0 0
Investments 0 0 Trade debts 41,757 4,971
Own shares 0 0 Taxes 432 447
Term investments 0 0 Dividends to be paid for the fiscal year 0 0
Cash 3,379,061 1,867,036 Other debts 37,956 37,987
Deferred charges and accrued income 231,013 76,271 Deferred charges and accrued income 514,311 51,775
TOTAL ASSETS 112,970,146 106,898,298 TOTAL LIABILITIES 112,970,146 106,898,298
1. BALANCE SHEET AT 30 JUNE 2013
2. STATEMENT OF INCOME FOR THE PERIOD ENDED 30 JUNE 2013
1 January 2013 30 June 2013
1 April 201330 June 2013
1 January 2012 30 June 2012
1 April 201230 June 2012
Operating income and charges
Gross operating income 5,375,246 155,078 6,091,714 (739,747)
Realised gains/losses on shares 2,380,495 1,879,033 165,118 (555,231)
Unrealised gains/losses on shares 2,720,345 (1,872,195) 6,221,256 89,038
Results from option transactions 65,975 12,900 46,757 91,444
Realised results from forward currency rate agreements 137,913,26 66,198 (425,245) 208,674
Unrealised results from forward currency rate agreements 70,517 69,141 83,828 (573,673)
Other operating charges (995,797) (476,952) (990,135) (517,676)
Management fee (718,285) (341,982) (730,561) (357,610)
Custodian fee (25,569) (12,855) (20,254) (8,985)
Statutory Auditors fee (6,085) (3,676) (5,808) (2,904)
Printing and publication costs (50,144) (25,211) (38,505) (19,367)
Annual tax on collective investment schemes (42,370) (21,302) (36,241) (18,120)
Directors fees (99,974) (49,569) (115,117) (91,813)
Advisory fees (9,916) (4,985) (8,475) (4,238)
Other (43,454) (17,371) (35,172) (14,638)
Operating profit / loss 4,379,449 (321,874) 5,101,579 (1,257,423)
Financial income 1,295,357 1,049,617 1,058,832 815,178
Financial charges (102,336) (15,043) (407,859) (3,283)
Other (102,336) (15,043) (407,859) (3,283)
Profit / Loss for the period, before taxes 5,572,471 712,700 5,752,552 (445,528)
Income taxes 101 (359) (86) (86)
Profit / Loss for the period, after taxes 5,572,572 712,341 5,752,467 (445,614)
Profit / Loss for the period, after taxes, per share 0.48 0.06 0.50 (0.04)
3
Commitments Currency Commitments in €
Capricorn Cleantech Co-investments 821,728 € 821,728
Capricorn Cleantech Fund 250,000 € 250,000
Capricorn Health-tech Fund 9,750,000 € 9,750,000
Capricorn ICT ARKIV 5,625,000 € 5,625,000
Carlyle Europe Technology Partners I 385,055 € 385,055
Carlyle Europe Technology Partners II 468,259 € 468,259
Life Sciences Partners III 70,799 € 70,799
Life Sciences Partners IV 813,711 € 813,711
Vertex III 49,023 $ 37,479
TOTAL: 18,222,032
3.1 Commitments
3. OFF BALANCE POSITIONS AT 30 JUNE 2013
3.2 Forward currency rate agreements
Value date Counterparty Quest for Growth buys Quest for Growth sells
31/07/2013 Belfius Bank € 3,175,084,76 £ 2,700,000
31/07/2013 Belfius Bank € 837,452,07 $ 1,100,000
31/07/2013 KBC Bank € 3,054,331,86 £ 2,600,000
31/07/2013 KBC Bank € 913,485,33 $ 1,200,000
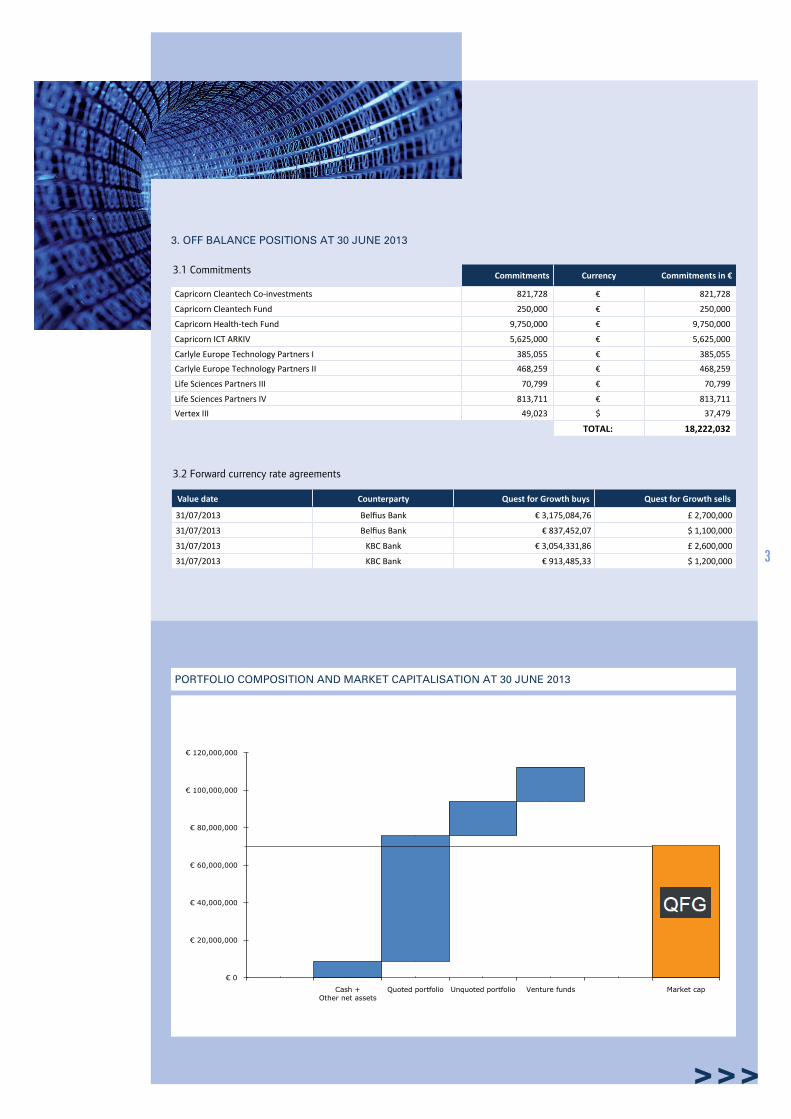
PORTFOLIO COMPOSITION AND MARKET CAPITALISATION AT 30 JUNE 2013
€ 0
€ 20,000,000
€ 40,000,000
€ 60,000,000
€ 80,000,000
€ 100,000,000
€ 120,000,000
Cash +Other net assets
Quoted portfolio Unquoted portfolio Venture funds Market cap
4
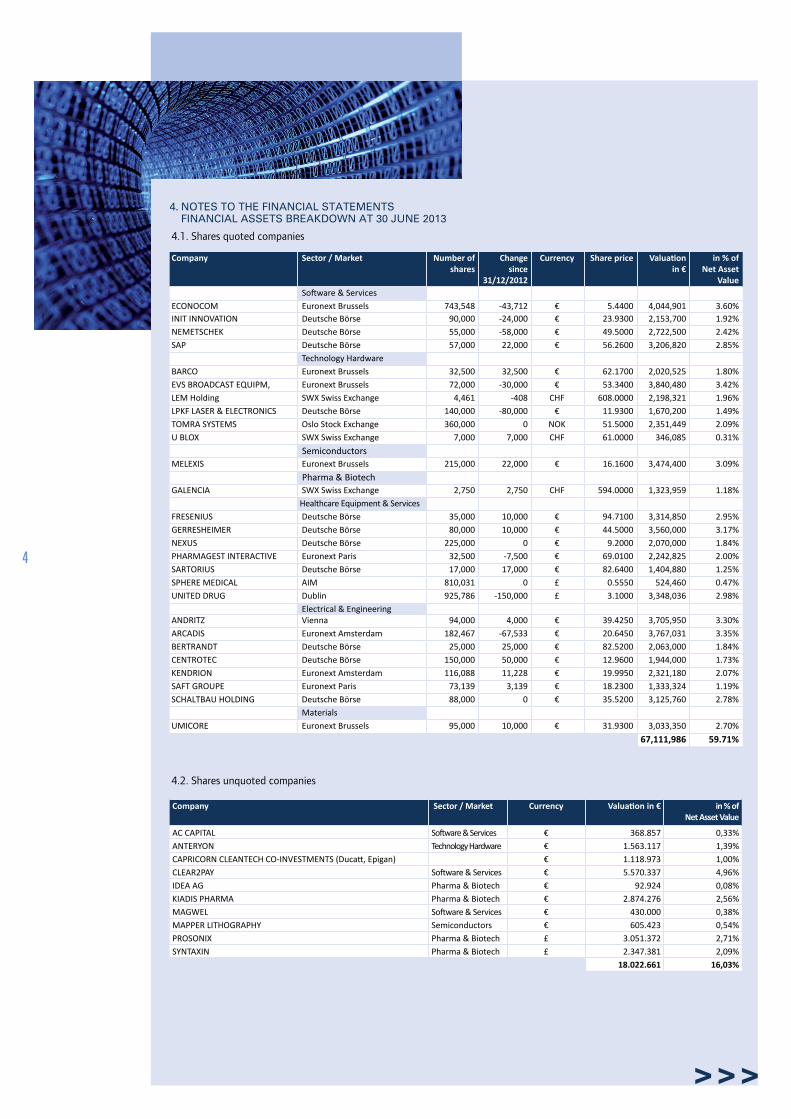
Company Sector / Market Number of shares
Change since
31/12/2012
Currency Share price Valuation in €
in % of Net Asset
Value Software & Services
ECONOCOM Euronext Brussels 743,548 -43,712 € 5.4400 4,044,901 3.60%INIT INNOVATION Deutsche Börse 90,000 -24,000 € 23.9300 2,153,700 1.92%NEMETSCHEK Deutsche Börse 55,000 -58,000 € 49.5000 2,722,500 2.42%SAP Deutsche Börse 57,000 22,000 € 56.2600 3,206,820 2.85%
Technology Hardware BARCO Euronext Brussels 32,500 32,500 € 62.1700 2,020,525 1.80%EVS BROADCAST EQUIPM, Euronext Brussels 72,000 -30,000 € 53.3400 3,840,480 3.42%LEM Holding SWX Swiss Exchange 4,461 -408 CHF 608.0000 2,198,321 1.96%LPKF LASER & ELECTRONICS Deutsche Börse 140,000 -80,000 € 11.9300 1,670,200 1.49%TOMRA SYSTEMS Oslo Stock Exchange 360,000 0 NOK 51.5000 2,351,449 2.09%U BLOX SWX Swiss Exchange 7,000 7,000 CHF 61.0000 346,085 0.31%
Semiconductors MELEXIS Euronext Brussels 215,000 22,000 € 16.1600 3,474,400 3.09%
Pharma & Biotech GALENCIA SWX Swiss Exchange 2,750 2,750 CHF 594.0000 1,323,959 1.18%
Healthcare Equipment & Services FRESENIUS Deutsche Börse 35,000 10,000 € 94.7100 3,314,850 2.95%GERRESHEIMER Deutsche Börse 80,000 10,000 € 44.5000 3,560,000 3.17%NEXUS Deutsche Börse 225,000 0 € 9.2000 2,070,000 1.84%PHARMAGEST INTERACTIVE Euronext Paris 32,500 -7,500 € 69.0100 2,242,825 2.00%SARTORIUS Deutsche Börse 17,000 17,000 € 82.6400 1,404,880 1.25%SPHERE MEDICAL AIM 810,031 0 £ 0.5550 524,460 0.47%UNITED DRUG Dublin 925,786 -150,000 £ 3.1000 3,348,036 2.98%
Electrical & Engineering ANDRITZ Vienna 94,000 4,000 € 39.4250 3,705,950 3.30%ARCADIS Euronext Amsterdam 182,467 -67,533 € 20.6450 3,767,031 3.35%BERTRANDT Deutsche Börse 25,000 25,000 € 82.5200 2,063,000 1.84%CENTROTEC Deutsche Börse 150,000 50,000 € 12.9600 1,944,000 1.73%KENDRION Euronext Amsterdam 116,088 11,228 € 19.9950 2,321,180 2.07%SAFT GROUPE Euronext Paris 73,139 3,139 € 18.2300 1,333,324 1.19%SCHALTBAU HOLDING Deutsche Börse 88,000 0 € 35.5200 3,125,760 2.78%
Materials UMICORE Euronext Brussels 95,000 10,000 € 31.9300 3,033,350 2.70%
67,111,986 59.71%
4.1. Shares quoted companies
4. NOTES TO THE FINANCIAL STATEMENTS FINANCIAL ASSETS BREAKDOWN AT 30 JUNE 2013
4.2. Shares unquoted companies
Company Sector / Market Currency Valuation in € in % of Net Asset Value
AC CAPITAL Software & Services € 368.857 0,33%ANTERYON Technology Hardware € 1.563.117 1,39%CAPRICORN CLEANTECH CO-INVESTMENTS (Ducatt, Epigan) € 1.118.973 1,00%CLEAR2PAY Software & Services € 5.570.337 4,96%IDEA AG Pharma & Biotech € 92.924 0,08%KIADIS PHARMA Pharma & Biotech € 2.874.276 2,56%MAGWEL Software & Services € 430.000 0,38%MAPPER LITHOGRAPHY Semiconductors € 605.423 0,54%PROSONIX Pharma & Biotech £ 3.051.372 2,71%SYNTAXIN Pharma & Biotech £ 2.347.381 2,09%
18.022.661 16,03%

5
PORTFOLIO DISTRIBUTION BY SECTOR
Software & Services16.3%
Technology Hardware
12.2%Semiconductors
3.6%
Health Care Equipment &
Services14.6%
Pharma & Biotech8.6%
Electrical & Engineering
17.9%
Materials2.7%
Funds & Diversified Companies
16.3%
Other sectors4.4%
Cash & other net assets3.3%
PORTFOLIO DISTRIBUTION BY COUNTRY
Belgium33.7%
Germany25.0%
Netherlands12.4%
United Kingdom10.2%
France4.3%
Austria3.5%
Ireland3.4%
Israel3.1%
US2.2% Norway
2.2%
Switzerland0.1%
PORTFOLIO DISTRIBUTION BY CURRENCY
CHF3.22%
EUR85.15%
GBP8.89%
USD2.75%
4.3. Investments in Venture Funds
CAPRICORN VENTURE PARTNERS Currency Last Valuation Date
Valuation in € in % of Net Asset Value
CAPRICORN CLEANTECH FUND € 31-03-2013 1,555,651 3.73%CAPRICORN HEALTH-TECH FUND € 31-03-2013 4,187,581 1.60%CAPRICORN ICT ARKIV € 31-03-2013 1,798,898 1.38%THIRD PARTY FUNDSCARLYLE EUROPE TECHNOLOGY PARTNERS I € 31-03-2013 472,604 0.42%CARLYLE EUROPE TECHNOLOGY PARTNERS II € 31-03-2013 3,839,806 3.42%CETP LP CO-INVESTMENT € 31-03-2013 677,354 0.60%CETP II LP CO-INVESTMENT £ 31-03-2013 187,682 0.17%LIFE SCIENCES PARTNERS III € 31-03-2013 1,262,826 1.12%LIFE SCIENCES PARTNERS IV € 31-03-2013 1,042,271 0.93%SCHRODER VENTURES LSF II $ 31-12-2012 134,209 0.12%VENTECH CAPITAL 2 € 31-03-2013 769,559 0.68%
VERTEX III $ 30-06-2013 2,378,621 2.12% 18,307,063 16.29%
Total Financial Assets - Shares € 103,441,709 92.03%Depreciation unquoted companies € -594,429 -0.53%Total Financial Assets – Shares after depreciation € 102,847,280 91.50%
4.4. Amounts receivable Companies
Company Face value in currency
Currency Valuation in € in % of Net Asset Value
Loan notesCAPRICORN CLEANTECH CO-INVESTMENTS 718,281 € 718,281 0.64%ANTERYON CONVERTIBLE LOAN NOTE 85,000 € 85,000 0.08%
803,281 0.71%
Commercial paperCODRALUX 1,000,000 € 999,977 0.89%CODRALUX 2,000,000 € 1,999,906 1.78%DEME 2,000,000 € 1,999,965 1.78%
4,999,847 4.45%
Total Financial Assets - Amounts receivable € 5,803,128 5.16%
Total Financial Assets € 108,650,409 96.68%
Cash € 3,385,374 3.01%Other Net Assets € 339,907 0.30%Quest for Growth - Ordinary shares € - 0.00%
Total Net Asset Value € 112,375,690 100.00%
PROFILE, AIM
Quest for Growth focuses on European technol-ogy-based growth companies in sectors such as life sciences, information technology, software, semiconductors, telecom, electronics, new materials and special situations in other growth sectors. Funds under management amounted to € 112 million on 30 June 2013.
Quest for Growth has been listed on Euronext Brussels since September 23rd 1998.
The Privak, created by Royal Decree of April 18th 1997, is an investment vehicle, specially tailored to provide a suitable framework for investments in private equity and in growth companies.
The privak is a closed-end Undertakings for Collective Investments in Transferrable Securities (UCITS), under the regulation of the Financial Services and Market Authority (FSMA) and sub-ject to specific investment and dividend pay-out.
INVESTMENT POLICY
Quest for Growth invests in growth companies with the objective of converting capital gains into tax-free income through the Privak structure. The largest part of the portfolio is invested in growth companies listed on European stock exchanges (Euronext, London Stock Exchange, Deutsche Börse etc,) and other regulated markets. Under Privak rules this part may not exceed 65 % of the assets.
6
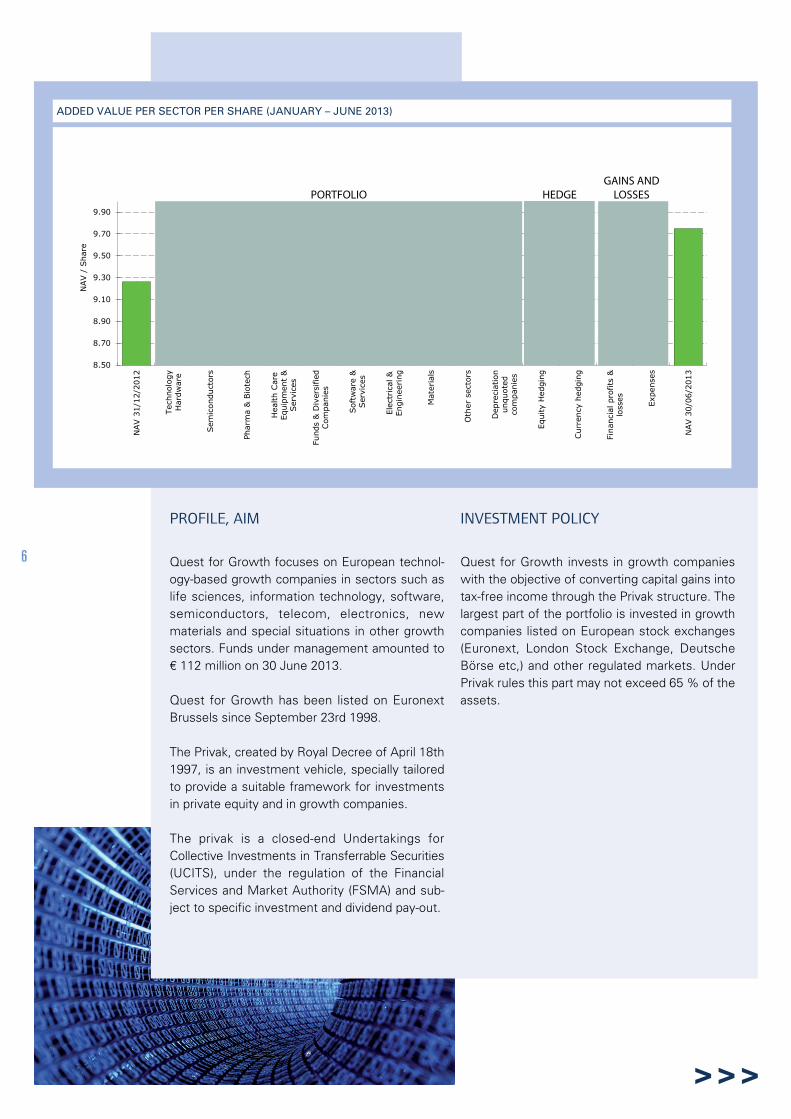
ADDED VALUE PER SECTOR PER SHARE (JANUARY – JUNE 2013)
8.50
8.70
8.90
9.10
9.30
9.50
9.70
9.90
NAV
31/
12/2
012
Tech
nolo
gyH
ardw
are
Sem
icon
duct
ors
Phar
ma
& B
iote
ch
Hea
lth C
are
Equi
pmen
t &
Ser
vice
s
Fund
s &
Div
ersi
fied
Com
pani
es
Sof
twar
e &
Ser
vice
s
Elec
tric
al &
Engi
neer
ing
Mat
eria
ls
Oth
er s
ecto
rs
Dep
reci
atio
nun
quot
edco
mpa
nies
Equi
ty H
edgi
ng
Cur
renc
y he
dgin
g
Fina
ncia
l pro
fits
&lo
sses Expe
nses
NAV
30/
06/2
013
NAV /
Sha
re
PORTFOLIO
GAINS ANDLOSSESHEDGE

7
STATUTORY AUDITOR’S REPORT TO THE BOARD OF DIRECTORS OF QUEST FOR GROWTH NV-SA ON THE REVIEW OF THE CONDENSED INTERIM FINANCIAL INFORMATION AS AT JUNE 30, 2013 AND FOR THE SIX-MONTH PERIOD THEN ENDED (FREE TRANSLATION OF A REPORT ORIGINALLY PREPARED IN THE DUTCH LANGUAGE)
STATEMENT ON THE TRUE AND FAIR VIEW OF THE CONDENSED INTERIM FINANCIAL STATEMENTS AND THE FAIR OVERVIEW OF THE INTERIM FINANCIAL REPORT
INTRODUCTIONWe have reviewed the accompanying condensed statement of financial position of Quest for Growth NV-SA as at June 30, 2013, the condensed income statement for the six-month period then ended and notes to the interim financial information (“the condensed interim financial information”). The board of directors is responsible for the preparation and presentation of this condensed interim financial information in accordance with the accounting framework and standards applicable in Belgium. Our responsibility is to express a conclusion on this condensed interim financial information based on our review.
SCOPE OF REVIEWWe conducted our review in accordance with the International Standard on Review Engagements 2410, “Review of Interim Financial Information Performed by the Independent Auditor of the Entity”. A review of interim financial information consists of making inquiries, primarily of persons responsible for financial and accounting matters, and applying analytical and other review procedures. A review is substantially less in scope than an audit conducted in accordance with International Standards on Auditing and consequently does not enable us to obtain assurance that we would become aware of all significant matters that might be identified in an audit. Accordingly, we do not express an audit opinion.
CONCLUSIONBased on our review, nothing has come to our attention that causes us to believe that the accompanying condensed interim financial information as at June 30, 2013 and for the six-month period then ended is not prepared, in all material respects, in accordance with the accounting framework and standards applicable in Belgium.
Kontich, 22 July 2013
Klynveld Peat Marwick Goerdeler Réviseurs d’Entreprises / Bedrijfsrevisoren - Statutory auditorRepresented by Erik Clinck, Réviseur d’Entreprises / Bedrijfsrevisor
Regine Slagmulder BVBA, represented by Prof, Regine Slagmulder, Director – Chairman of the Audit Committee, René Avonts BVBA, represented by Mr René Avonts, Director – Effective Leader and Axxis BVBA, represented by Mr Philippe de Vicq de Cumptich, Director – Effective Leader, certify, on behalf and for the account of the Board of Directors of Quest for Growth NV, that, to their knowledge,
a) the condensed interim financial statements which have been prepared in accordance with the accounting framework and standards applicable in Belgium give a true and fair view of the assets, liabilities, financial position and profit or loss of the company, under Article 13, § 4 of the Royal Decree of November 14, 2007 on the obligations of issuers of financial instruments admitted to trading on a regulated market,
b) the interim financial report includes a fair overview of the information required under Article 13, §§ 5 and 6 of the Royal Decree of November 14, 2007 on the obligations of issuers of financial instruments admitted to trading on a regulated market,
Leuven, 22 July 2013
Regine Slagmulder BVBA René Avonts BVBA Axxis BVBA Director – Chairman of the Audit Committee Director – Effective Leader Director – Effective Leaderrepresented by represented by represented byRegine Slagmulder René Avonts Philippe de Vicq de Cumptich
TOTAL SHAREHOLDERS RETURN (SINCE 30/06/2010) QUEST FOR GROWTH: RESULTS FROM 1 JANUARY 2005 UNTIL 30 JUNE 2013
-20,000,000
-10,000,000
-
10,000,000
20,000,000
30,000,000
40,000,000
2005 2006 2007 2008 2009 2010 2011 2012 2013
GENERAL INFORMATIONS
QUEST FOR GROWTH NVPrivak, fixed capital investment company established under Belgian LawLei 19, box 3 - B-3000 Leuven - Phone: +32 (0)16 28 41 28 - Fax: +32 (0)16 28 41 [email protected]
8
Board of Directors ADP Vision BVBA, Chairman, represented by Mr. Antoon De ProftRené Avonts BVBA, Director – Effective Leader, represented by Mr. René Avonts Axxis BVBA, Director – Effective Leader, represented by Mr. Philippe de Vicq de CumptichAuxilium Keerbergen BVBA, Director, represented by Mr. Frans TheeuwesBaron Bernard de Gerlache de Gomery, DirectorDe Meiboom NV, Director, represented by Mr Edward ClaeysEuro Invest Management NV, Director, represented by Prof. Philippe HaspeslaghGengest BVBA, Director, represented by Mr. Rudi MariënPamica NV, Director, represented by Mr. Michel AkkermansDr. Jos B. Peeters, DirectorRegine Slagmulder BVBA, represented by Prof. Regine SlagmulderMr. Bart Fransis, Director
Audit Committee Regine Slagmulder BVBA, Chairman, represented by Prof. Regine SlagmulderAuxilium Keerbergen BVBA, represented by Mr Frans TheeuwesBaron Bernard de Gerlache de Gomery
Asset Manager Capricorn Venture Partners NV, Lei 19 box 1, B-3000 Leuven,
Auditors Klynveld Peat Marwick Goerdeler Bedrijfsrevisoren Burg. CV, represented by Mr. Erik Clinck, Prins Boudewijnlaan 24d, B-2550 Kontich
Depositary bank BELFIUS BANK BELGIUM, Pachecolaan 44, B-1000 Brussels
Incorporation June 9th, 1998
Official listing September 23rd, 1998 on Euronext Brussels
Security number ISIN: BE0003730448
Stock Price Bloomberg: QFG BB EquityReuters: QUFG.BRTelekurs: 950524
Company reports The next interim financial report will be published in October 2013
Estimated
Net Asset Value
published every first Saturday of the month in De Tijd and in L’Echo, Moneytalk and on the website www.questforgrowth.com