
24uturtuyryu374
16
Journal of Engineering Volume 17 February 2011 Number1 46 BEHAVIOR OF CONCRETE BEAMS REINFORCED IN SHEAR WITH CARBON FIBER REINFORCED POLYMER Dr. Abdul-Muttalib I. Said Al-Mussaue Mr. Amjad H. Abdul-Razaq Al-Modhafer Ass. Prof Ass. Lecturer University of Baghdad University of Kufa College of Engineering College of Engineering ABSTRUCT Carbon fiber reinforced polymers (CFRP) were widely used in strengthening reinforced concrete members in the last few years, these fibers consist mainly of high strength fibers which increase the member capacity in addition to changing the mode of failure of the reinforced concrete beams. Experimental and theoretical investigations were carried to find the behavior of reinforced concrete beams strengthened by CFRP in shear and bending. The experimental work included testing of 12 beams divided into 4 groups; each group contains 3 beams. The following parameters were taken into consideration: - Concrete crushing strength. - CFRP strengthening location (shear strengthening and both shear and flexure strengthening). Reinforced beams were simply supported subjected to two point loads. Each group consists of three beams; the first beam without CFRP, the second one, is strengthened with CFRP in shear and the third is strengthened with CFRP in both flexure and shear. Four groups with different crushing strength of (12, 20, 30 and 39 MPa). The CFRP sheets are attached externally. It was found that in beam with low crushing strength loads transfer to the CFRP at early stages while in those of high crushing strength, CFRP contribution only starts when full strength of the beam is fulfilled. A full bond between CFRP sheets and the concrete is assumed in the theoretical analysis. Comparison between the theoretical and the experimental results revealed the validity of the numerical analysis and the developed methods such that there was a difference of 13% in the ultimate strength for the tested and analyzed beams. ﺧﻼﺻﺔ: اﺳﺘﻌﻤﻠﺖ اﻟﻌﻨﺎﺻﺮ اﻹﻧﺸﺎﺋﻴﺔ اﻟﺨﺮﺳﺎﻧﻴﺔ اﻟﻤﻘﻮاة اﻟﻤﺴﻠﺤﺔ ﺑﺄﻟﻴﺎف اﻟﺒﻮﻟﻴﻤﺮ اﻟﻜﺎرﺑﻮﻧ ﻴﺔ، اﻟﺤﺪﻳﺜﺔ اﻟﺴﻨﻮات ﻓﻲ ﺗﺘﺄﻟﻒ أﻟﻴﺎف اﻟﺘﻘﻮﻳﺔ اﻟﺒﻮﻟﻴﻤﺮﻳﺔ ﺑﺼﻮرة أﺳﺎﺳﻴﺔ ﻣﻦ أﻟﻴﺎف) ﻋﺎﻟﻴﺔ اﻟﻤﻘﺎوﻣﺔ( ﺣﻴﺚ ﺗ ﺰﻳﺪ ﺳﻌﺔ اﻟﺘﺤﻤﻞ ﺑﺎﻹﺿﺎﻓﺔ إﻟﻰ ﺗﻐﻴﻴﺮ أﺳﻠﻮب اﻟﻔﺸﻞ ﻟﻠﻌﺘﺒﺎت اﻟﺨﺮﺳﺎﻧﺔ اﻟﻤﺴﻠﺤﺔ. أﺟ ﺮﻳﺖ ﺗﺤﺮﻳﺎت ﻋﻤﻠﻴﺔ وﻧﻈﺮﻳﺔ ﻟﺴﻠﻮك اﻟﻌﺘﺒﺎت اﻟﺨﺮﺳﺎﻧﻴﺔ ﻟﺤﺎﻟﺘﻲ اﻟﻤﺴﻠﺤﺔ، اﻟ ﺗﻘﻮﻳﺔ ﻓﺸﻞ ﻣﻨﺎﻃﻖ ﻓﻲ ﻌﺘﺒﺎت اﻟﻘﺺ ﺑﺎﺳﺘﺨﺪام اﻟﻤﻘﻮاة واﻻﻧﺜﻨﺎءCFRP ﻣﻦ اﻟﻌﻤﻠﻲ اﻟﺒﺮﻧﺎﻣﺞ ﻳﺘﻜﻮن ﺣﻴﺚ12 ﻋﺘﺒﺔ ﻓﺤﺺ ﻗﺴﻤﺖ إﻟﻰ ﻣﺠﺎﻣﻴﻊ أرﺑﻌﺔ ،آﻞ ﻣﺠﻤﻮﻋﺔ ﺗﻀﻢ3 ﻋﺘﺒﺎت. ا ﻟ ﺪراﺳﺔ أﺧﺬت ﺑﻨﻈﺮ اﻻﻋﺘﺒﺎر ﻣﻘﺎوﻣﺔ اﻻﻧﻀ ﺣﺎﻟﺔ و ﻟﻠﺨﺮﺳﺎﻧﺔ ﻐﺎط اﻟﺘﻘﻮﻳﺔ اﺳﺘﻌﻤﻠﺖ، ﻣﺮة ﻟﻠﺘﻘﻮﻳﺔ وأﺧﺮى اﻟﻘﺺ ﻣﻨﻄﻘﺔ ﻓﻲ ﻣﻌﺎ اﻻﻧﺜﻨﺎء و اﻟﻘﺺ ﻣﻨﻄﻘﺘﻲ ﻓﻲ. آﻞ اﻟﻌﺘﺒﺎت ﺗﻢ ﻓﻲ ﻓﺤﺼﻬﺎ ﻓﻀﺎء ﺑﺴﻴﻂ اﻹﺳﻨﺎد وﻣﺘﻌﺮض ﻟﻨﻘﻄﺘﻲ ﺗﺤﻤﻴﻞ ﺑﻴﻨﻤﺎ اﻟﻤﺘﻐﻴﺮ اﻟﺮﺋﻴﺲ ﻳﻤﺜﻞ ﻟﻠﺨﺮﺳﺎﻧﺔ اﻻﻧﻀﻐﺎط ﻣﻘﺎوﻣﺔ و ﻣﻮﻗﻊ. CFRP ﻣﻦ ﺗﺘﻜﻮن ﻣﺠﻤﻮﻋﺔ آﻞ ﻋﺘﺒﺎ ﺛﻼﺛﺔ وه اﻷول ت ﻮ اﻟﻤﺮﺟﻌﻲ اﻟﻨﻤﻮذج وه ﻮ ﺧﺎﻟﻲ ﻣﻦCFRP و اﻟﺜﺎﻧﻲ ﻳ ﻋﻠﻰ ﺤﺘﻮيCFRP ﻓﻲ ﺳﺒﻌﺔ ﻋﻦ ﻋﺒﺎرة هﻲ و اﻟﻘﺺ ﻣﻨﻄﻘﺔ ﺑﺰاوﻳﺔ ﻣﺎﺋﻠﺔ ﺷﺮاﺋﺢ45 اﻟﺜﺎﻟﺚ و درﺟﺔ ﻳ ﻋﻠﻰ ﺤﺘﻮيCFRP ﻓﻲ اﻻﻧﺜﻨﺎء و اﻟﻘﺺ ﻣﻨﻄﻘﺘﻲ. وهﻲ اﻷﺧﺮى ﻋﻦ ﻣﺨﺘﻠﻔﺔ اﻧﻀﻐﺎط ﻣﻘﺎوﻣﺔ ﻟﻬﺎ ﻣﺠﻤﻮﻋﺔ آﻞ) 12 - 20 - 30 - 39 MPa .( إﺳﺘﻌﻤ ﻞCFRP آﻤﻘﻮي ﺧﺎرﺟﻲ. اﺳﺘﻌﻤﺎل أنCFRP ﻟﻪ ﻋﻠﻰ ﺗﺄﺛﻴﺮ ﻧﺘﺎﺋﺞ اﻟﺤﻤﻞ اﻷﻗﺼﻰ، ﺷﻜﻞ اﻟﺘﺸﻘﻖ، اﻟﻬﻄﻮل. ﺗﻢ إن اآﺘﺸﺎفCFRP ﻳﺸﺎرك ﺑﻌﻜﺲ اﻟﺤﻤﻞ ﻣﻦ ﻣﺒﻜﺮة أوﻗﺎت ﻓﻲ اﻟﻀﻌﻴﻔﺔ اﻟﺨﺮﺳﺎﻧﺔ ﺷﺮاﺋﺢ ﺗﺸﺎرآﻬﺎ ﺛﻢ اﻻﺟﺘﻬﺎدات ﺟﻤﻴﻊ ﻟﻮﺣﺪهﺎ هﻲ أوﻻ ﺗﺘﺤﻤﻞ ﺣﻴﺚ ﻋﺎﻟﻴﺔ اﻧﻀﻐﺎط ﻗﻮة ﻟﻬﺎ اﻟﺘﻲ اﻟﺨﺮﺳﺎﻧﺔCFRP اﻟﺘﺤﻤﻞ ﻓﻲ. اﺳﺘﺨﺪام أﻓﻀﻞ إن ﻟﺸﺮاﺋﺢCFRP اﻟﺸﺮاﺋﺢ هﺬﻩ ﻋﻠﻰ ﺷﺪ إﻟﻰ ﻣﺒﺎﺷﺮة ﺑﺼﻮرة اﻟﻘﻮى ﺗﺤﻮل ﺑﺴﺒﺐ اﻟﻘﺺ ﻣﻨﻄﻘﺔ ﻓﻲ. ﺗﻢ اﺳﺘﻌﻤﺎل اﻟﺘﺤﻠﻴﻞ اﻟﻼﺧﻄﻲ ﺑﻮاﺳﻄﺔ اﻟﻌﻨﺎﺻﺮ ﺛﻼﺛﻴﺔ اﻹﺑﻌﺎد ﻟﺘﺤﺮي أداء اﻟﻌﺘﺒﺎت اﻟﻤﺴﻠﺤﺔ اﻟﺨﺮﺳﺎﻧﻴﺔ اﻟﻤﻘﻮاة بCFRP ﺗﻢ ﺣﻴﺚ، اﻟﺒﺮﻧﺎﻣﺞ اﺳﺘﺨﺪام اﻟﺤﺎﺳﻮﺑﻲANSYS . ﺗﻤﺎس هﻨﺎﻟﻚ اﻋﺘﺒﺮﻧﺎ ﺗﺎم ﺑﻴﻦ ﺷﺮاﺋﺢCFRP واﻟﺨﺮﺳﺎﻧﺔ. اﻟﺤﺼﻮل وﺗﻢ ﻋﻠﻰ ﺗﻨﺒﺆ ﺟﻴﺪ ﻟﺴﻠﻮك ﻣﺎ ﺑﻌﺪ اﻟﺘﺼﺪع. اﻟﻤﻘﺎرﻧﺔ ﺑﻴﻦ اﻟﻨﺘﺎﺋﺞ اﻟﻨﻈﺮﻳﺔ واﻟﻌﻤﻠﻴﺔ ﺻﻼﺣﻴﺔ أآﺪت اﻟﺘﺤﻠﻴﻞ اﻟﻌﺪدي و ﺣﻴﺚ آﺎﻧﺖ أآﺒﺮ ﻧﺴﺒﺔ ﻓﺮق ﻓﻲ اﻟﻤﻘ ﺎ وﻣﺔ أﻗﻞ اﻟﻘﺼﻮى ﻣﻦ13 % ﻟﻜﻞ اﻟﻌﺘﺒﺎت اﻟﻤﻔﺤﻮﺻﺔ.
-
Upload
emadsaad77 -
Category
Documents
-
view
213 -
download
0
description
tyrtytrutyu
Transcript of 24uturtuyryu374

Journal of Engineering Volume 17 February 2011 Number1
46
BEHAVIOR OF CONCRETE BEAMS REINFORCED IN SHEAR WITH CARBON FIBER REINFORCED POLYMER
Dr. Abdul-Muttalib I. Said Al-Mussaue Mr. Amjad H. Abdul-Razaq Al-Modhafer Ass. Prof Ass. Lecturer University of Baghdad University of Kufa College of Engineering College of Engineering ABSTRUCT Carbon fiber reinforced polymers (CFRP) were widely used in strengthening reinforced concrete members in the last few years, these fibers consist mainly of high strength fibers which increase the member capacity in addition to changing the mode of failure of the reinforced concrete beams. Experimental and theoretical
investigations were carried to find the behavior of reinforced concrete beams strengthened by CFRP in shear and bending. The experimental work included testing of 12 beams divided into 4 groups; each group contains
3 beams. The following parameters were taken into consideration: - Concrete crushing strength. - CFRP strengthening location (shear strengthening and both shear and flexure strengthening). Reinforced beams were simply supported subjected to two point loads. Each group consists of three
beams; the first beam without CFRP, the second one, is strengthened with CFRP in shear and the third is strengthened with CFRP in both flexure and shear. Four groups with different crushing strength of (12, 20, 30 and 39 MPa). The CFRP sheets are attached externally.
It was found that in beam with low crushing strength loads transfer to the CFRP at early stages while in those of high crushing strength, CFRP contribution only starts when full strength of the beam is fulfilled. A full bond between CFRP sheets and the concrete is assumed in the theoretical analysis. Comparison between the theoretical and the experimental results revealed the validity of the numerical analysis and the developed methods such that there was a difference of 13% in the ultimate strength for the tested and analyzed beams.
:خالصة البوليمرية التقوية أليافتتألف في السنوات الحديثة ، يةالكاربون البوليمر بألياف المسلحة المقواة الخرسانية اإلنشائية العناصر استعملت
ريتأج.المسلحة الخرسانة للعتبات الفشل أسلوب تغيير إلى باإلضافة التحمل سعة زيدتحيث ) المقاومة عالية( ألياف من أساسية بصورة CFRPواالنثناء المقواة باستخدام القص عتبات في مناطق فشل تقوية الالمسلحة، لحالتي الخرسانية العتبات لسلوك ونظرية عملية تحريات
مقاومة االعتبار بنظر أخذت دراسةلا . عتبات3 تضم مجموعة ،آل أربعة مجاميع إلى قسمت فحص عتبة 12حيث يتكون البرنامج العملي من فحصها في تم العتبات آل.في منطقتي القص و االنثناء معًا في منطقة القص وأخرى للتقوية مرة ، استعملت التقوية غاط للخرسانة و حالةاالنضآل مجموعة تتكون من CFRP .موقع و مقاومة االنضغاط للخرسانة يمثل الرئيس المتغير بينما تحميل لنقطتي ومتعرض اإلسناد بسيط فضاء
منطقة القص و هي عبارة عن سبعة في CFRP حتوي على ي الثاني و CFRP من خالي و وهالنموذج المرجعي وت األول وهثالثة عتبا . منطقتي القص و االنثناءفي CFRPحتوي على ي درجة و الثالث 45شرائح مائلة بزاوية
CFRPأن استعمال . خارجي آمقويCFRPل إستعم). MPa 39-30-20-12(آل مجموعة لها مقاومة انضغاط مختلفة عن األخرى وهي الخرسانة الضعيفة في أوقات مبكرة من الحمل بعكس يشارك CFRPاآتشاف إن تم. الهطول التشقق، شكل األقصى، الحمل نتائج تأثير على له
إن أفضل استخدام . في التحمل CFRPالخرسانة التي لها قوة انضغاط عالية حيث تتحمل أوال هي لوحدها جميع االجتهادات ثم تشارآها شرائح . في منطقة القص بسبب تحول القوى بصورة مباشرة إلى شد على هذه الشرائح CFRPلشرائح ، حيث تم CFRP ب المقواة الخرسانية المسلحة العتبات أداء لتحري اإلبعاد ثالثية العناصر بواسطة الالخطي التحليل استعمال تم
.ANSYSالحاسوبي استخدام البرنامج النظرية النتائج بين المقارنة .التصدع بعد ما لسلوك جيد تنبؤ على وتم الحصول . والخرسانةCFRPشرائح بين تام اعتبرنا هنالك تماس
.المفحوصة العتبات لكل % 13 من القصوى أقل ومةاالمق في فرق نسبة أآبر آانت حيث و العددي التحليل أآدت صالحية والعملية

A.I. S. Al-Mussaue Behavior Of Concrete Beams Reinforced In A.H. A Al-Modhafer Shear With Carbon Fiber Reinforced Polymer
47
Keywords: Crushing strength, CFRP, Shear, Inclined strips, flexure, strengthening INTRODUCTION:
A carbon fiber sheet is formed by laying out
fibers in single or multiple directions and embedding in a protective epoxy resin. A carbon fiber sheet receives particular attention due to its higher strength, stiffness, corrosion and fatigue resistance with reasonable cost. One advantage of using a fiber composite material is the negligible increase in dead load due to its light weight; in addition, it can be easily carried to construction site in rolls. Because the reinforcing technique is much simpler with fiber composite, strengthening/ retrofitting work is more convenient in a limited workspace and no specific work experience and heavy construction equipment are required at the site.
Carbon fiber sheet has a very high unidirectional tensile strength but has stiffness close to that of steel. Typical values are between 2500-4600 MPa for tensile strength and 235-269 GPa for Young’s modulus. The behavior is essentially linearly elastic up to the tensile strength limit. Once it reaches its tensile strength, it fails in a perfectly brittle model, Figure 1. Fibers are assumed to have strength and stiffness only in the fiber direction and no resistance perpendicular to the fiber direction is considered. Because of its negligible thickness, carbon fiber sheet exhibit no effective compression or bending stiffness. Taking the above characteristics into account, a finite element with only axial stiffness is used to represent carbon fiber in structural analysis.
Fiber materials commonly used are carbon,
glass or aramid. The different FRP materials and systems have varying properties and behavior. A qualitative comparison of the performance of carbon, glass, and aramid composites is presented in Table 1.
This carbon fiber used to manufacture an un-directional tow sheet that has a width off 330 mm and is suitable for applications requiring a wet lay-up process to conform to the surface configuration of the structure as shown in Figure 2.
EXPERIMENTAL WORK:
The experimental program consisted of
testing twelve simply supported beams. Beams with rectangular cross sections of 150 mm width by 280 mm height and 3350 mm length. A span between supports of 3200 mm and distance between loads of 1200 mm. The longitudinal reinforcement consists of three No.16 bars (16-mm-dia.) in tension and two No. 10 bars (10-mm-dia.) in compression, equivalent to reinforcement ratios of ρ=0.0157 and ρ’=0.0041, respectively.
Figures 3 and 4 show specimen dimensions, reinforcement details, support locations, and location of loading points.
No shear reinforcement in tested beam to ensure that shear failure in happen before bending failure.
In order to identify the test specimens with different strengthening schemes and different concrete strengths, the following designation system is used as list in Table 2:
Figures (4), show the reinforced concrete beams with CFRP in shear and flexure zone (side and bottom view). TESTING PROCEDURE:
All beams were tested in a universal testing machine, with maximum capacity of 2000 kN. Beam was loaded directly at the top face with two equal concentrated loads. The ends of all beams were extended 125mm beyond the supports centerline to provide adequate anchorage for the longitudinal steel. 60mm x150mm bearing plates were used at loading points and at supports to avoid local crushing of concrete. The beams were tested under static loads, loaded in successive increments up to failure. For each increment, the load was kept constant until the required readings were recorded. Demec points were used for each tested beam at mid-span on concrete surface and CFRP shown in Figures 5 and the initial distance between each two horizontal Demec points were calibrated using an accompanying special ruler.

Journal of Engineering Volume 17 February 2011 Number1
48
TEST RESULTS
The ultimate load and mid span deflections
at cracking and ultimate stages are shown in Table 4. The same mode failure occurred for all beams. This mode was a diagonal shear crack causes rupture of all CFRP sheets located in the shear zone at ultimate load level. Discussion of results obtained for each group is presented in the following sections. The beams before tested are shown in Figures 6. CRACK PATTERNS AND FAILURE MODE:
The loads are applied gradually up to
failure. Figure 7 shows crack patterns of all tested beams.
The sketch the map of cracks of BC1, BC2, BC3 and BC4 shown in Figures 8.
LOAD AGAINST MID-SPAN DEFLECTION:
From the load deflection curves of the tested
beams it can be observed that the load against mid-span deflection response can be divided into three stages of behavior. In the first stage, a linear behavior of the load deflection response is observed. In the second stage, a nonlinear behavior of the load deflection response is noticed. Finally in third stage, as the applied load reaches near its ultimate value, the rate of increase in deflection is substantially exceeding the rate of increase in the value of the applied loads. Figure 9, shows the load-deflection for beams having same crushing strength at f’c=12, 20, 30 and 39 MPa respectively. FINITE ELEMENT MODEL:
The tested beams where analyzed using ANSYS program (ANSYS 2005 version 10). Four different materials are involved concrete, reinforcement, steel plates, and CFRP strips. Concrete: the solid 65, 3-D reinforced concrete solid element was used to represent concrete in the models. The element using a 2× 2× 2 Gaussian set of integration points is defined by eight nodes having three degrees of freedom at each node: translations in the nodal x, y, and z directions. This element is capable of cracking in tension and crushing in compression.
Steel: the solid 45 is used for the 3-D modeling of structural members steel bearing plates located at supports and under the applied loads.
Reinforcement: The link 8 element is a uniaxial tension-compression element with three degrees of freedom at each node, translations in the nodal x, y, and z directions. This element is used to represent the steel bars. CFRP Sheets: Solid 46 is a layered version of the 8-node structural solid designed to model layered thick shells or solids. The element allows up to 250 different material layers. In present study, this element is used to represent CFRP strips.
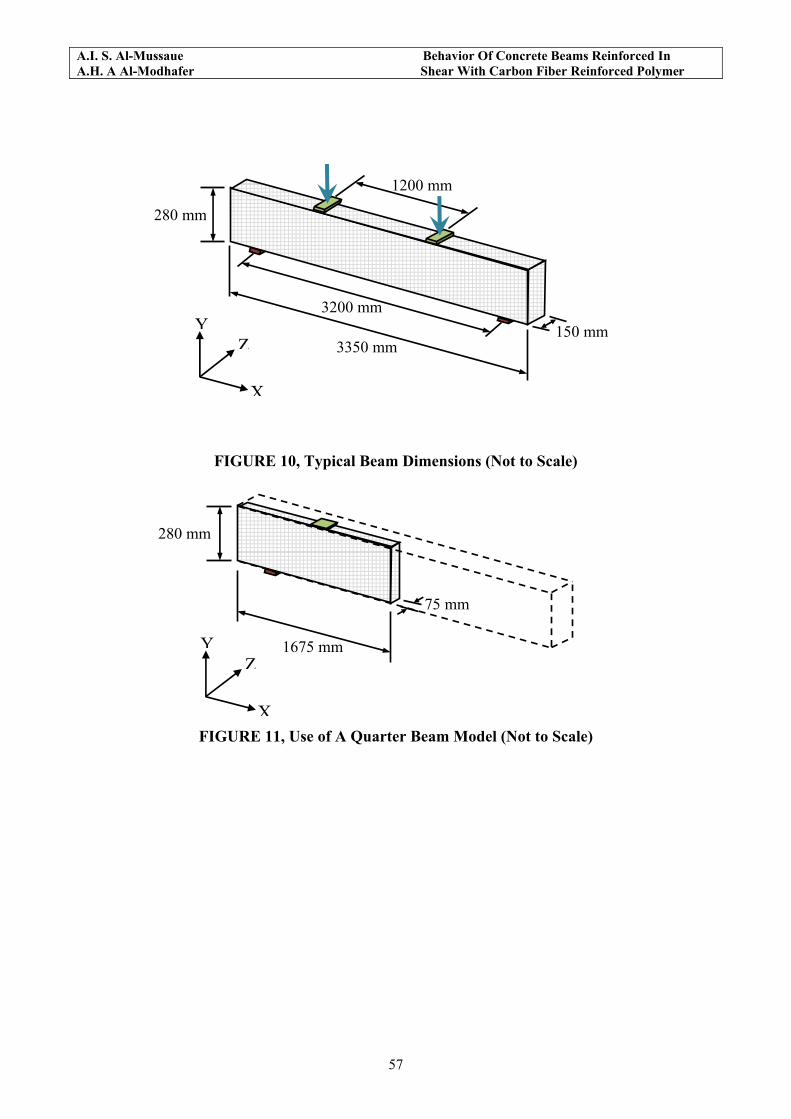
Tested beams are 150 mm × 280 mm × 3350 mm; with a span between supports of 3200 mm. Figure 10, illustrates typical dimensions for all four beams before CFRP reinforcing. By taking advantage of the symmetry of the beams, a quarter of the full beam was used for modeling. This approach reduced computational time and computer disk space requirements significantly. A quarter of the beam model is shown in Figure 11.
Figure 12 shows typical steel reinforcement
for a quarter beam model. Ideally, the bond strength between the
concrete and steel reinforcement should be considered. However, in this study, perfect bond between materials was assumed. To provide the perfect bond, the link element for the steel reinforcing was connected between nodes of each adjacent concrete solid element, so the two materials shared the same nodes. The same approach was adopted for CFRP composites. The high strength of the epoxy used to attach CFRP sheets to the beams supported the perfect bond assumption.
ANALYTICAL RESULTS: The accuracy of the finite element modeling
is determined by ensuring that the ultimate load is reasonably predicted in comparison with the experimental results, and the load-deflection curves are close to the experimental curves as well as the crack patterns are similar to that obtained from experimental test.
Comparison of the load-deflection curves, cracking loads, ultimate load carrying capacity and crack pattern by the finite element analysis and the laboratory tests is made. The ratios of the predicted finite element ultimate loads to the corresponding experimental ultimate loads of the analyzed beams are listed in Table 5.

A.I. S. Al-Mussaue Behavior Of Concrete Beams Reinforced In A.H. A Al-Modhafer Shear With Carbon Fiber Reinforced Polymer
49
NUMERICAL LOAD VERSUS MID-SPAN DEFLECTION: Figures 13 shows the load versus mid-span deflection curves for the finite element analyses and experimental results for beams. Several conclusions are drawn from may be notice from comparison between experimental and analytical case studies. - The theoretical results are nearby the experimental results as the appears of beam at the mid span deflection whereas the basic splits - The failure load predicted is very close to the failure load measured during experimental testing. - Established the beam in analytical analysis carried load greater than from experiential results due to technique of presented of model in ANSYS are it ideal and it not afforded to any outside factors corresponding to the experimental results. - The theoretical solution gives a good impression in the reinforced concrete beam strengthened by CFRP, and it is possible to dispense of experimental work.
CONCLUSIONS:
• From test results and observations, the following conclusions can be drawn:
• Using of CFRP as an external strengthening technique results in a noticeable effect on ultimate load, crack pattern, deflections and as described below:
o Increasing the ultimate load and the capacity of the beams.
o Delaying the crack appearance and reducing the crack width.
• The location of CFRP sheets has a major effect; attaching CFRP in bottom face in addition to side face has more effect than when attaching the same quantity of CFRP to the side faces of beams.
• In all cases in the present work, the failure in strengthened beams is caused by shear failure fallowed by CFRP rupture.
• The presence of external CFRP bonded to concrete beams increases the ultimate load at failure to a significant value. The maximum increase in the ultimate strength of externally strengthened beams by CFRP depends on the amount of the area and configuration of the external CFRP sheet added.
• In this study, it is observed that the use of external CFRP sheet connected to the tension sides of beams could enhance the ultimate load capacity by (58%) over the capacity of the identical unstrengthened control beam.
• Using CFRP for strengthening beams at shear zone by CFRP sheet is found successful.
• 10. The beam strengthening by shear at any compressive strength of concrete are more load capacities less than from the beam strengthening for shear and flexure.
• 11. The three-dimensional finite element model used in the present work is able to simulate the behavior of externally strengthened reinforced concrete beams by CFRP in shear and flexural groups.
• 12. The comparison between the numerical and the experimental results declared the validity of the numerical analysis and the methodology developed here where the maximum difference ratio in ultimate load was less than 13% for all the tested and analyzed beams.
• 13. The general behavior of the finite element models represented by the center span load deflection curve shows good agreement with the test results from the experimentally tested beams.
NOTATION ACI= American Concrete Institute ANSYS=Finite Element Computer Program CFRP=Carbon Fiber Reinforced Polymer REFERENCES
• ACI Committee 318, 2002, “PCA Notes on ACI 318-02 Building Code Requirement for Structural Concrete,” American Concrete Institute.
• ACI Committee 318, 2008, “Building
Code Requirement for Structural Concrete (ACI 318-08) and Commentary,” American Concrete Institute, Farmington Hills.
• ACI Committee 440, 2002, “Guide for the design and construction of externally bonded FRP systems for strengthening of concrete structures,” American Concrete Institute, Michigan, USA.

Journal of Engineering Volume 17 February 2011 Number1
50
• Al-Mahaidi, R., Lee, K., and Taplin, G.,
"Behavior and Analysis of RC T-Beams
Partially Damaged in Shear and Repaired
with CFRP Laminates", Monash
University, Australia; 2001, al-
• ANSYS, 2005, “ANSYS Help,” Release
10.
• Kachlakev, D., Miller, T., "Finite
Element Modeling of Reinforced
Concrete Structures Strengthened
With FRP Laminates", Final Report,
Oregon Department of Transportation,
May, 2001.
Table 1, Qualitative Comparison of Different Fibers Used in Composites.
Type of fibers used in composite Condition
Carbon Fibers Glass Fibers Aramid Fibers
Tensile Strength Very good Very good Very good
Young’s Modulus Very good Good Adequate
Long-term behavior Very good Good Adequate Fatigue behavior Excellent Good Adequate
Bulk density Good Excellent Adequate Alkaline resistance Very good Good Inadequate
Price Adequate Adequate Very good
FIGURE 1, Carbon Fiber Sheet Modeling in Finite Element analysis

A.I. S. Al-Mussaue Behavior Of Concrete Beams Reinforced In A.H. A Al-Modhafer Shear With Carbon Fiber Reinforced Polymer
51
FIGURE 2, Carbon Fiber Sheet
FIGURE 3, Geometry of Laboratory Specimens
Table 2, Classifications of BeamsNo. The Symbol The Name
1 BC1 Beam Control at compressive strength equal 12 MPa
2 BS1 Beam Strengthened for shear at compressive strength equal 12 MPa
3 BF1 Beam Strengthened for shear and flexure at compressive strength equal 12 MPa
4 BC2 Beam Control at compressive strength equal 20 MPa
5 BS2 Beam Strengthened for shear at compressive strength equal 20 MPa
6 BF2 Beam Strengthened for shear and flexure at compressive strength equal 20 MPa
7 BC3 Beam Control at compressive strength equal 30 MPa
8 BS3 Beam Strengthened for shear at compressive strength equal 30 MPa
9 BF3 Beam Strengthened for shear and flexure at compressive strength equal 30 MPa
10 BC4 Beam Control at compressive strength equal 39 MPa
11 BS4 Beam Strengthened for shear at compressive strength equal 39 MPa
12 BF4 Beam Strengthened for shear and flexure at compressive strength equal 39 MPa
Concrete Specimen
1200
3200
3350
P P
2-Ø10
3-Ø16
150 mm
280
mm

Journal of Engineering Volume 17 February 2011 Number1
52
(Side View)
(Bottom View)
FIGURE 4, Specimens with CFRP in Flexure Zone
FIGURE 5, Demec Points in Concrete and CFRP
3200 mm3350 mm
1200 mm
P P CFRP
150 mm
2800 mm
3350 mm
100m
m
150m
m

A.I. S. Al-Mussaue Behavior Of Concrete Beams Reinforced In A.H. A Al-Modhafer Shear With Carbon Fiber Reinforced Polymer
53
FIGURE 6, Beams Strengthened for Shear (f’c=12, 20, 30 and 39 MPa)
Table 4, Experimental results of the tested beams. Total applied
load
(KN)
Mid-span
deflection
(mm) Group
no
Beam
designation
crushing
strengths
(MPa) u
Percentage increase
in ultimate load with
respect to reference
beam %
Percentage increase
in ultimate deflection
with respect to
reference beam %
BC1 12 45 9.229 ------- ---------
BS1 12 65 22.625 44.4 145.2
1 BF1 12 70 29.445 55.5 219
BC2 20 58 13.348 ------- ----------
BS2 20 69 21.679 19 62.4
2
BF2 20 80 27.81 37.9 108.3
BC3 30 60 14.498 ------- ---------
BS3 30 71 19.702 18.3 35.9 3
BF3 30 95 31.236 58.3 115.5
BC4 39 80 15.41 ------- ---------
BS4 39 95 23.318 18.8 51.33 4
BF4 39 104 32.1 30 108.3
(a) (b)
(c) (d)

Journal of Engineering Volume 17 February 2011 Number1
54
FIGURE 13, BF1, BF2, BF3 and BF4 After Tested
(a)
color Load (kN)
10
20
25
35
40
45
50
55
(d) (c)
(b) (a)
CENTER
BC3

A.I. S. Al-Mussaue Behavior Of Concrete Beams Reinforced In A.H. A Al-Modhafer Shear With Carbon Fiber Reinforced Polymer
55
(b)
color Load
(kN)
15
20
30
40
50
60
70
73
color Load
(kN)
20
30
40
50
60
70
80
85
95
CENTER
BF1
CENTER
BF3
(c)
FIGURE 8, Crack Patterns for BC3, BS3 and BF3 respectively

Journal of Engineering Volume 17 February 2011 Number1
56
(a) (b)
(c) (d)
FIGURE 9, Load-Deflection Curves for Beams having between Beams at f’c=12, 20, 30 and 39
MPa respectively
A.I. S. Al-Mussaue Behavior Of Concrete Beams Reinforced In A.H. A Al-Modhafer Shear With Carbon Fiber Reinforced Polymer
57
FIGURE 10, Typical Beam Dimensions (Not to Scale)
FIGURE 11, Use of A Quarter Beam Model (Not to Scale)
150 mm
1200 mm
3350 mm
3200 mm
280 mm
X
YZ
280 mm
X
YZ
75 mm
1675 mm

Journal of Engineering Volume 17 February 2011 Number1
58
FIGURE 12, Typical Steel Reinforcement for A Quarter Beam Model (Not to Scale)
280
mm
1675 mm
150 mm
1Ø12 mm
1/2Ø16mm
1Ø16mm
1Ø12 mm
1/2Ø16 mm 1Ø16 mm
150 mm
280 mm

A.I. S. Al-Mussaue Behavior Of Concrete Beams Reinforced In A.H. A Al-Modhafer Shear With Carbon Fiber Reinforced Polymer
59
Table 5, Comparisons between experimental and numerical ultimate loads
Beam designation
Numerical ultimate load (kN)
Experimental ultimate load (kN)
BC1 50.0 45 1.11
BS1 70.0 65.0 1.08
BF1 74.7 70.0 1.07
BC2 63.6 58.0 1.09
BS2 66.7 69.0 0.97
BF2 80.0 80.0 1.00
BC3 67.6 60.0 1.13
BS3 77.8 71.0 1.10
BF3 90.0 95.0 0.95
BC4 88.5 80.0 1.11
BS4 100.0 95.0 1.05
BF4 106.0 104.0 1.02
(a) (d)

Journal of Engineering Volume 17 February 2011 Number1
60
(c) (d)
FIGURE 31, Load-Deflection Curve BC1, BC2, BC3 and BC4 respectively
(a) (b)
(c) (d)
FIGURE 32, Load-Deflection Curve BS1, BS2, BS3 and BS4 respectively

A.I. S. Al-Mussaue Behavior Of Concrete Beams Reinforced In A.H. A Al-Modhafer Shear With Carbon Fiber Reinforced Polymer
61
(a) (b)
(c) (d)
FIGURE 33, Load-Deflection Curve BF1, BF2, BF3 and BF4 respectively


