24th International Investors’ Day
81
24 th International Investors’ Day Hannover, 14 October 2021
Transcript of 24th International Investors’ Day
24th International Investors’ Day
Hannover, 14 October 2021

Teaming up to create opportunitiesUpdate on Group strategy
Jean-Jacques Henchoz, Chief Executive Officer
24th International Investors’ Day 2021
Hannover, 14 October 2021

2 Teaming up to create opportunities
Outlook 20224
ESG strategy3
Update on strategy cycle 2021 - 20232
Our position in the reinsurance market1
Agenda
- Investors’ Day 2021

Our position in the reinsurance market1

4 Teaming up to create opportunities
Metrics Targets 2020 2019 2018 ø 2018 - 2020
Investment return ≥ 2.7% 3.0% 3.4% 3.2% 3.2%
GroupReturn on equity
900 bps above
risk-free 8.2% 13.3% 12.2% 11.1%
Solvency ratio ≥ 200% 235.2% 250.7% 246.0% 243.6%
Gross premium 3 - 5% 15.8% 20.4% 16.2% 17.5%
Property & Casualty R/ICombined ratio ≤ 97% 101.6% 98.2% 96.5% 99.0%
EBIT margin ≥ 10% 5.9% 10.0% 12.2% 9.1%
Gross premium 3 - 5% 4.7% 6.7% 4.6% 5.3%
Life & Health R/I Value of New Business ≥ EUR 220 m. EUR 778 m. EUR 663 m. EUR 290 m. EUR 557 m.
EBIT ≥ 5% -32.5% 106.6% 12.5% 16.2%
Target attainment
Successful execution of our Group strategy in a challenging environment
Review of strategy cycle 2018 - 2020
| 1 Our position in the reinsurance market | 2 | 3 | 4 |
- Investors’ Day 2021
growth
growth
growth

5 Teaming up to create opportunities
10-year average
13.1 %
8.1 %
7.8 %
7.3 %
7.5 %
Consistent outperformance – independent of market cycles
10-year average RoE of 13.1%; 5.6%p above sector average
Return on equity (RoE)
1) Aon Reinsurance Aggregate 2) HSBC claims tracker 3) Swiss Re Sigma Explorer
RoE: on own calculation based on company reports
-3%
3%
9%
15%
2011 2012 2013 2014 2015 2016 2017 2018 2019 2020
Hannover Re
Peer 1
Peer 2
Peer 3
Sector average 1)
0
50
100
150
200
2011 2012 2013 2014 2015 2016 2017 2018 2019 2020
Covid-19 losses in bn. USD
Insured losses fromcatastrophes in bn. USD
Guy Carpenter GlobalProperty Catastrophe Rate-On-Line Index
2)
3)
Insured losses and pricing development
| 1 Our position in the reinsurance market | 2 | 3 | 4 |
- Investors’ Day 2021

6 Teaming up to create opportunities
Lean operating model remains a key competitive advantage
2.8% 2.6% 2.4% 2.4%2.2%
5.7% 5.5% 5.6% 5.6%4.8%
2016 2017 2018 2019 2020
Hannover Re Peer average
5.2
21.3
0.2
0.5
2000 2005 2010 2015 2020
Net earned premium Administrative expenses
Average spread vs. peers: 3.0%p
1) Peers: Munich Re, Swiss Re, SCOR; own calculation
• Business model is highly scalable
• Investments and services are
connected to future profits
• Cost leadership is based on mix of cultural and
organisational factors that are hard to replicate
• Continued focus on organisational simplicity and efficient
decision-making
1)
normalised, in EUR bn.
x 4.1
x 2.8
Administrative expense ratio
| 1 Our position in the reinsurance market | 2 | 3 | 4 |
- Investors’ Day 2021
7 Teaming up to create opportunities
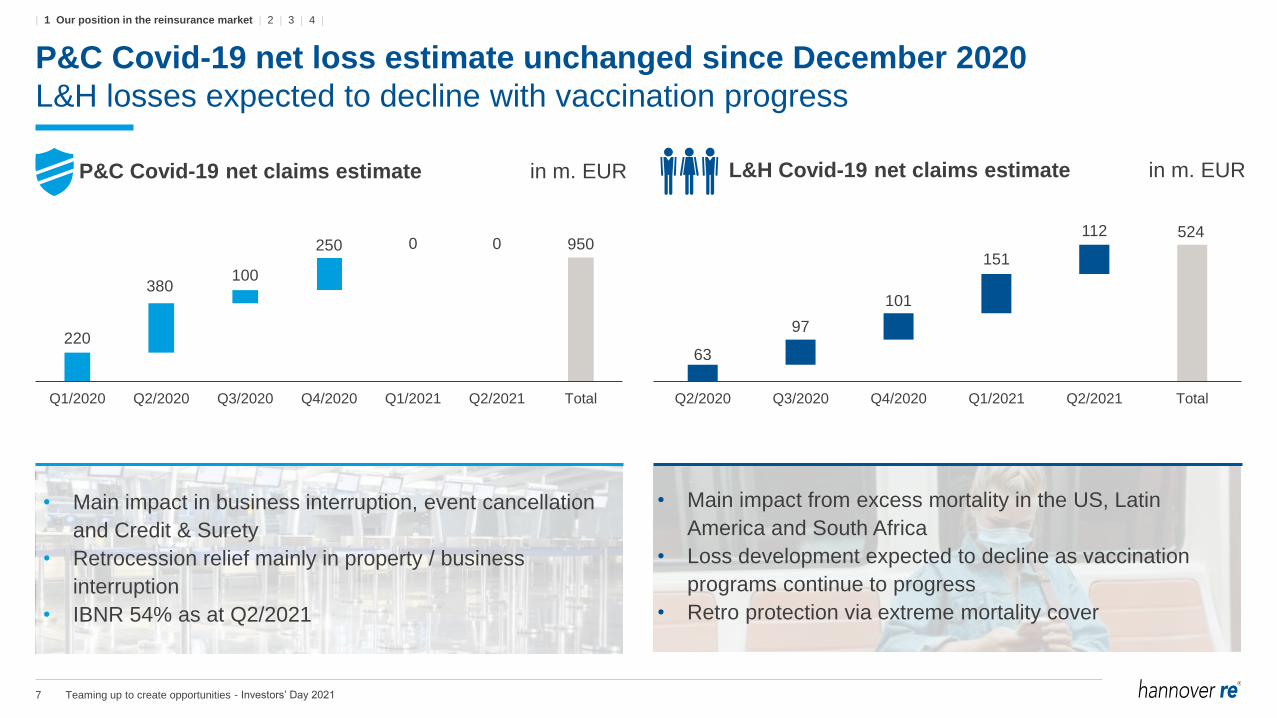
P&C Covid-19 net loss estimate unchanged since December 2020
L&H losses expected to decline with vaccination progress
220
380100
250 0 0 950
Q1/2020 Q2/2020 Q3/2020 Q4/2020 Q1/2021 Q2/2021 Total
• Main impact in business interruption, event cancellation
and Credit & Surety
• Retrocession relief mainly in property / business
interruption
• IBNR 54% as at Q2/2021
63
97
101
151
112 524
Q2/2020 Q3/2020 Q4/2020 Q1/2021 Q2/2021 Total
P&C Covid-19 net claims estimate in m. EUR L&H Covid-19 net claims estimate in m. EUR
• Main impact from excess mortality in the US, Latin
America and South Africa
• Loss development expected to decline as vaccination
programs continue to progress
• Retro protection via extreme mortality cover
| 1 Our position in the reinsurance market | 2 | 3 | 4 |
- Investors’ Day 2021
8 Teaming up to create opportunities
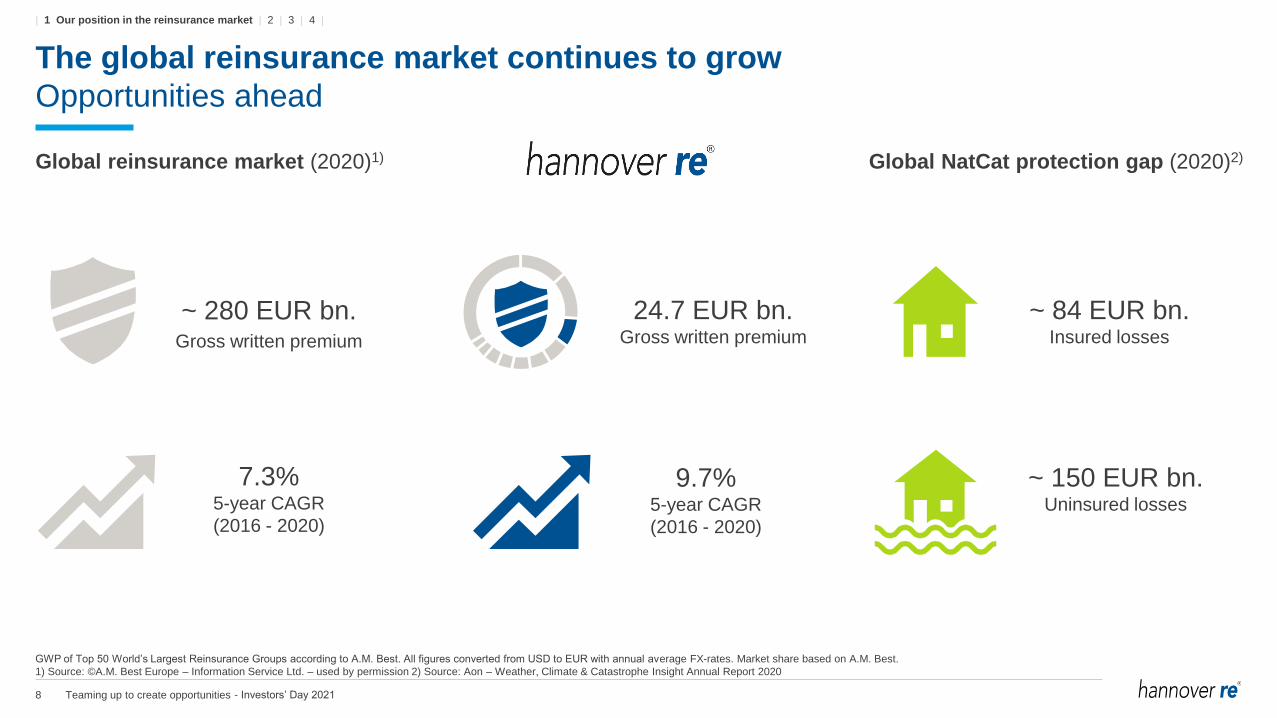
The global reinsurance market continues to grow
Opportunities ahead
Global reinsurance market (2020)1)
~ 280 EUR bn.Gross written premium
7.3%5-year CAGR
(2016 - 2020)
Global NatCat protection gap (2020)2)
~ 84 EUR bn.Insured losses
~ 150 EUR bn.Uninsured losses
24.7 EUR bn.Gross written premium
9.7%5-year CAGR
(2016 - 2020)
GWP of Top 50 World’s Largest Reinsurance Groups according to A.M. Best. All figures converted from USD to EUR with annual average FX-rates. Market share based on A.M. Best.
1) Source: ©A.M. Best Europe – Information Service Ltd. – used by permission 2) Source: Aon – Weather, Climate & Catastrophe Insight Annual Report 2020
| 1 Our position in the reinsurance market | 2 | 3 | 4 |
- Investors’ Day 2021
Update on strategy cycle 2021 - 20232

10 Teaming up to create opportunities
Sound
foundations
Performance enablers
Performance drivers
Drive
We-spirit
Beyond risk
sharing –
we team up
to create
opportunities
Responsibility
supported by a strategic initiative
Embedded
compliance
and corporate
social
responsibility
Strong
governance
and risk
management
Preferred
business partner
Earnings
growth
Innovation
catalyst
Empowered
people
Lean
operating model
Effective capital
management
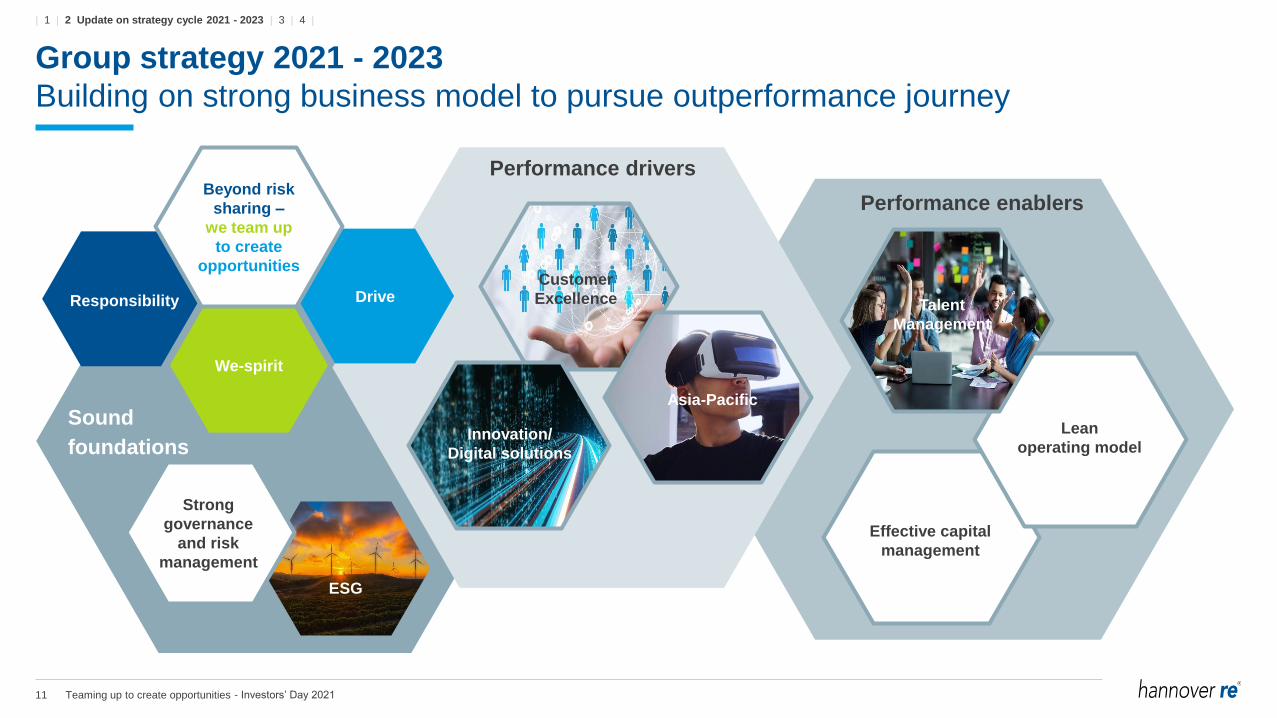
Group strategy 2021 - 2023
Building on strong business model to pursue outperformance journey
| 1 | 2 Update on strategy cycle 2021 - 2023 | 3 | 4 |
- Investors’ Day 2021
11 Teaming up to create opportunities
Sound
foundations
Performance enablers
Performance drivers
Drive
We-spirit
Beyond risk
sharing –
we team up
to create
opportunities
Responsibility
ESG
Strong
governance
and risk
management
Customer
Excellence
Lean
operating model
Effective capital
management
Group strategy 2021 - 2023
Building on strong business model to pursue outperformance journey
Asia-Pacific
Talent
Management
Innovation/
Digital solutions
| 1 | 2 Update on strategy cycle 2021 - 2023 | 3 | 4 |
- Investors’ Day 2021

12 Teaming up to create opportunities
Well-defined growth initiatives with flexible responses to
market and regulatory changes
EBIT growth on-track to hit 2023 ambition
Life & Health
Financial Solutions outperforming targets
Selective U/W in Short-Term Health & Critical Illness
Property & Casualty
Increased proximity to clients opens up new opportunities
and strengthens partnerships
Rising primary market penetration benefits growth in
reinsurance
Asia-Pacific
We are successfully expanding our footprint in the region
Expected business development in m. EUR
EBIT Gross written premium
• EBIT growth ambition and underwriting focus
• Focus on the business in which we have particular expertise
• Strong market knowledge – Delegated responsibility to empower our regional hubs
5,477
284
2020 2021E 2022E 2023E
~6,500
~540
Ambition: EUR +140 m. additional EBIT by 2023
| 1 | 2 Update on strategy cycle 2021 - 2023 | 3 | 4 |
- Investors’ Day 2021

13 Teaming up to create opportunities
Innovation & Digital Strategy
We have defined two main themes to enable future growth
• Committed to reinsurance – Focus on supporting digital ventures through our core business
• Selective investments – Clearly geared towards improving our core competencies
Ambition: EUR +60 m. additional EBIT by 2023
Digital health data Direct digital distribution
Provide cedents with leading digital health technology solutions Support cedents in acquiring digitally distributed business
• Connected devices create new pools of data
whose implications are barely considered
• (Re)insurers use this data to build deeper
insights into behavior and risk
• Example:
• Rapid shift in product distribution from
physical to virtual environment
• (Re)insurers provide capacity for digital
companies
• Example:
| 1 | 2 Update on strategy cycle 2021 - 2023 | 3 | 4 |
- Investors’ Day 2021

14 Teaming up to create opportunities
Client Excellence
Creating today the infrastructure to manage growing client relationships tomorrow
• Driven by our underwriting expertise and client-centric culture
• Individualised rather than ‘one-size-fits-all’ approach
• Staying true to our lean operating model
Today … … we master tomorrow’s excellence for our clients
No.1 rankings1)
Client ManagementSolicitation effectiveness
Know client company
Can-do approach
Effective follow-up
No.1 rankings1)
Client Management
Claims Management
Leading customer
experience metrics:e.g.: Partnership approach,
Ease of doing business
L&HP&C
Enable future earnings growth
Create joint new opportunities with key clients
Navigate our solutions portfolio across the firm
Automate and digitise CRM processAmbition: EUR +100 m. additional EBIT by 2023
1) NMG Global L&H Reinsurance Study 2020 (Target Markets) and NMG P&C Reinsurance Study 2021
| 1 | 2 Update on strategy cycle 2021 - 2023 | 3 | 4 |
- Investors’ Day 2021
15 Teaming up to create opportunities
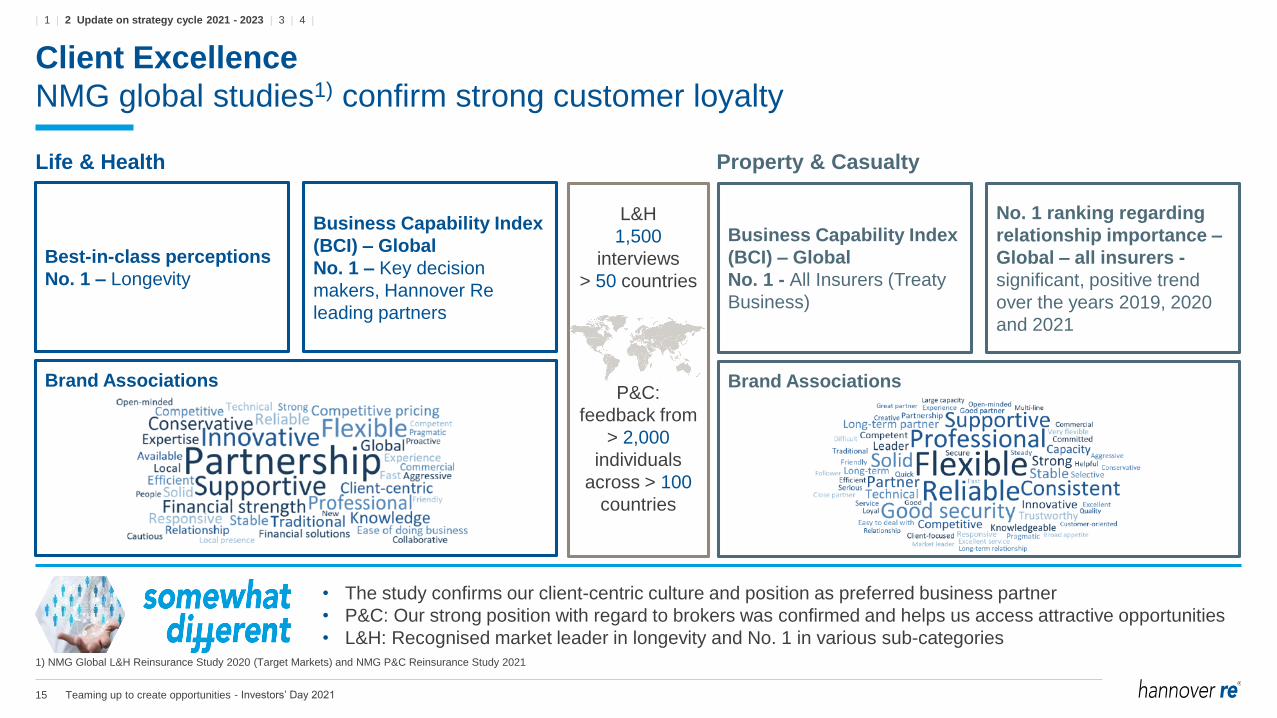
Client Excellence
NMG global studies1) confirm strong customer loyalty
• The study confirms our client-centric culture and position as preferred business partner
• P&C: Our strong position with regard to brokers was confirmed and helps us access attractive opportunities
• L&H: Recognised market leader in longevity and No. 1 in various sub-categories
Life & Health Property & Casualty
Best-in-class perceptions
No. 1 – Longevity
1) NMG Global L&H Reinsurance Study 2020 (Target Markets) and NMG P&C Reinsurance Study 2021
Enable future growth
Our ambitious growth trajectory goes beyond the current strategy
cycle and is based on a true quest for excellence
Create joint new opportunities
Our purpose embraces our clients and with our team spirit, we are
building strong partnerships to create tailor-made success stories
Business Capability Index
(BCI) – Global
No. 1 – Key decision
makers, Hannover Re
leading partners
Brand Associations
Business Capability Index
(BCI) – Global
No. 1 - All Insurers (Treaty
Business)
No. 1 ranking regarding
relationship importance –
Global – all insurers -
significant, positive trend
over the years 2019, 2020
and 2021
Brand Associations
L&H
1,500
interviews
> 50 countries
P&C:
feedback from
> 2,000
individuals
across > 100
countries
| 1 | 2 Update on strategy cycle 2021 - 2023 | 3 | 4 |
- Investors’ Day 2021
16 Teaming up to create opportunities
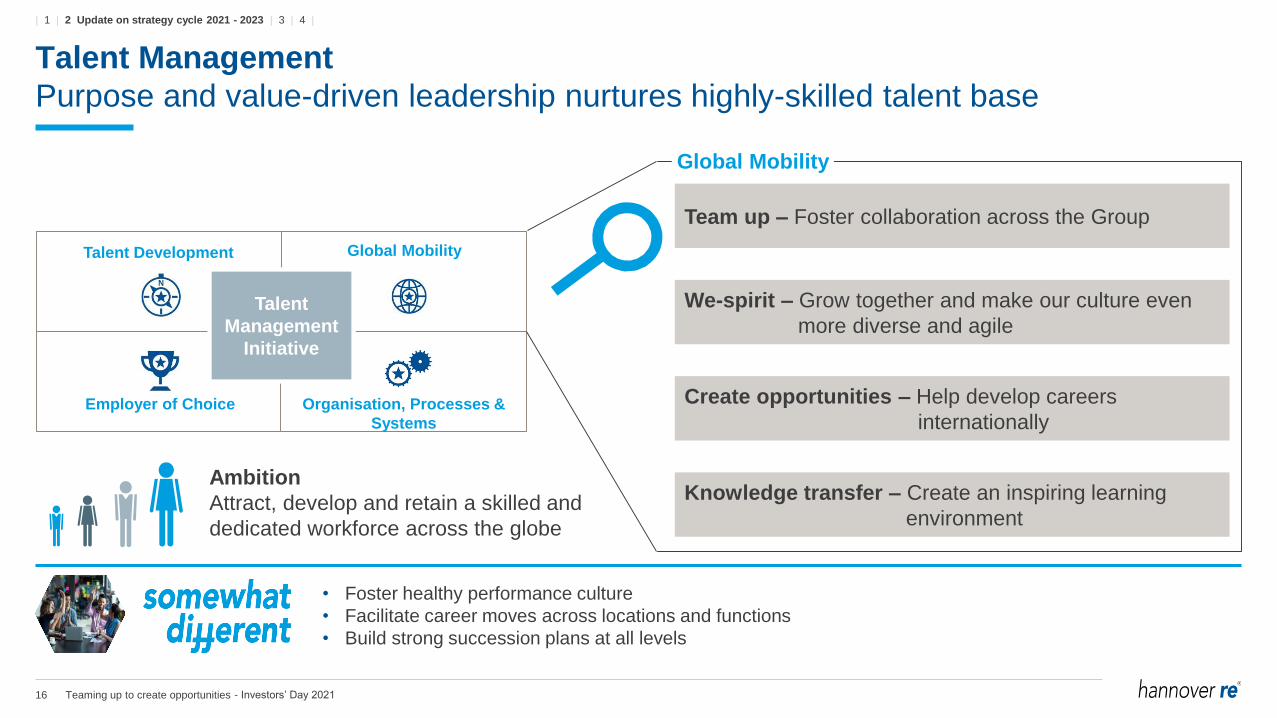
Talent Management
Purpose and value-driven leadership nurtures highly-skilled talent base
• Foster healthy performance culture
• Facilitate career moves across locations and functions
• Build strong succession plans at all levels
Ambition
Attract, develop and retain a skilled and
dedicated workforce across the globe
Talent
Management
Initiative
Talent Development Global Mobility
Employer of Choice Organisation, Processes &
Systems
Team up – Foster collaboration across the Group
We-spirit – Grow together and make our culture even
more diverse and agile
Create opportunities – Help develop careers
internationally
Knowledge transfer – Create an inspiring learning
environment
Global Mobility
| 1 | 2 Update on strategy cycle 2021 - 2023 | 3 | 4 |
- Investors’ Day 2021
17 Teaming up to create opportunities
ESG strategy3
18 Teaming up to create opportunities
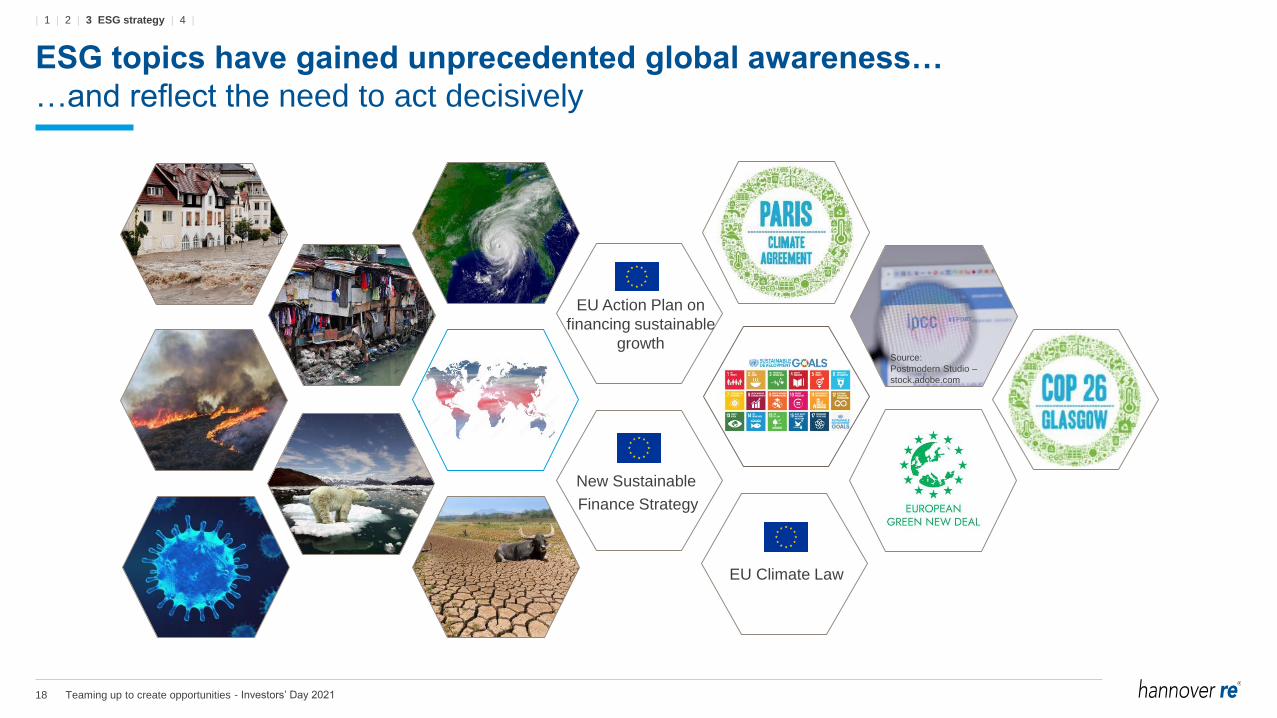
ESG topics have gained unprecedented global awareness…
…and reflect the need to act decisively
New Sustainable
Finance Strategy
EU Climate Law
EU Action Plan on
financing sustainable
growth
| 1 | 2 | 3 ESG strategy | 4 |
- Investors’ Day 2021
Source:
Postmodern Studio –
stock.adobe.com

19 Teaming up to create opportunities
Our ESG strategy
How we evolved in the past 18 months
Set net zero targets and
participation in Net-Zero
Insurance Alliance
2H/2021
• Execution of phased exit
strategy for thermal coal
• Execution of climate strategy
for asset management
Climate action
• Strengthened ESG
governance structure
• Regular Executive Board
reviews
ESG
manual
• Completion of ESG manual
for facultative business
Initiatives and
commitments
• Participant in UN Global
Compact
• Recognition of ILO core
labour standards
• Human rights policy
• Signatory to UN Principles for
Sustainable Insurance (PSI)
• Signatory to UN Principles for
Responsible Investment (PRI)
ESG governance
structure
| 1 | 2 | 3 ESG strategy | 4 |
- Investors’ Day 2021

20 Teaming up to create opportunities
Net zero targets
Comprehensive goal setting in core business and own business operations
• Climate strategy:
– Decarbonisation: -30% of CO2 footprint by 20251)
– Active investment in sustainable assets
– Engagement; via proxy voting
• Application of specific exclusion criteria – e.g. thermal
coal, oil sands
• Negative screening / active divestment since 2012
• Carbon neutral at Head Office since 2016
• Certified according to ISO 14001 and publication of
annual EMAS-III statements
• Extension of measures to further locations currently
developed (e.g. expansion of data recording to at
least 75% of the global workforce; compensation of
all CO2 emissions recorded by 2023)
• Exit from all risks connected with thermal coal and
related infrastructure by 2038 in the entire P&C
portfolio
• Participation in Net-Zero Insurance Alliance
• Application of specific exclusion criteria
Asset Management Own business operationsUnderwriting
1) Corporates, covered bonds and equities; compared to base year 2019
Net zero
by 2030Net zero
by 2050Net zero
by 2050
| 1 | 2 | 3 ESG strategy | 4 |
- Investors’ Day 2021
21 Teaming up to create opportunities
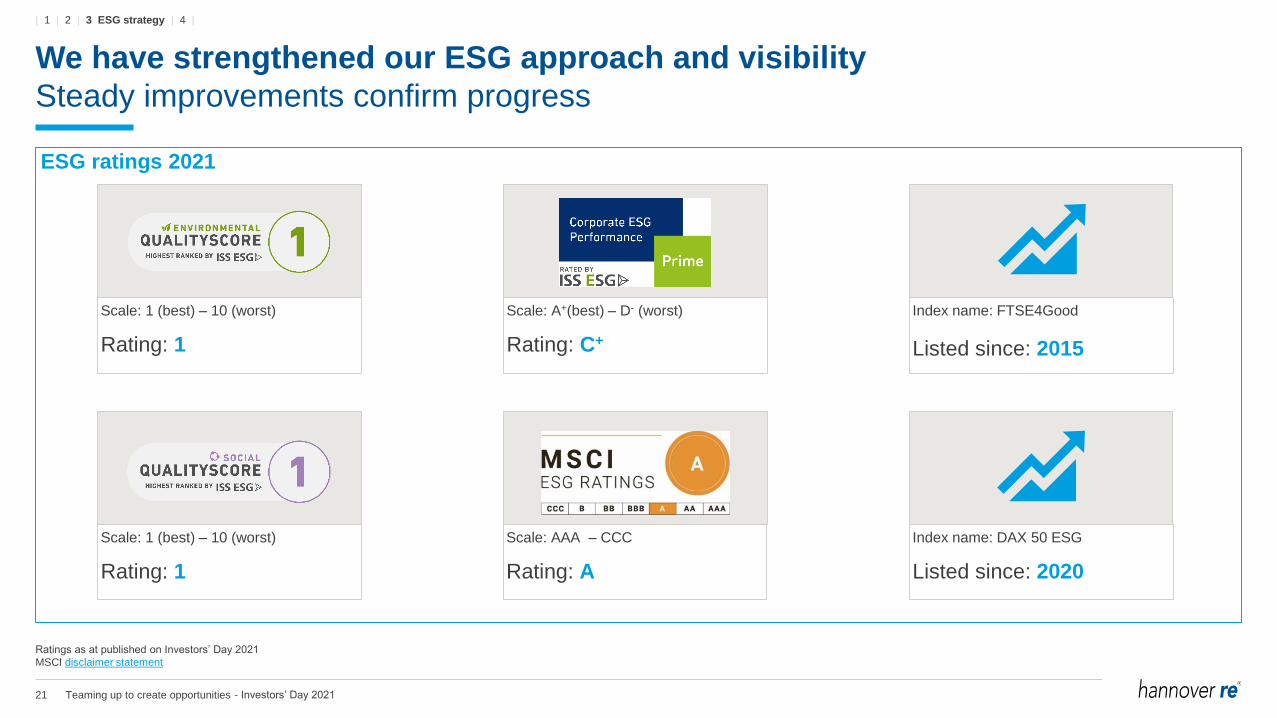
We have strengthened our ESG approach and visibility
Steady improvements confirm progress
Ratings as at published on Investors’ Day 2021
MSCI disclaimer statement
ESG ratings 2021
Scale: 1 (best) – 10 (worst)
Rating: 1
Scale: 1 (best) – 10 (worst)
Rating: 1
Scale: AAA – CCC
Rating: A
Index name: FTSE4Good
Listed since: 2015
Scale: A+(best) – D- (worst)
Rating: C+
Index name: DAX 50 ESG
Listed since: 2020
| 1 | 2 | 3 ESG strategy | 4 |
- Investors’ Day 2021

22 Teaming up to create opportunities
Outlook 20223
Update on strategy cycle 2021 - 20232
Our position in the reinsurance market1
Agenda
Outlook 20224
| 1 | 2 | 3 | 4 Outlook 2022 |
23 Teaming up to create opportunities
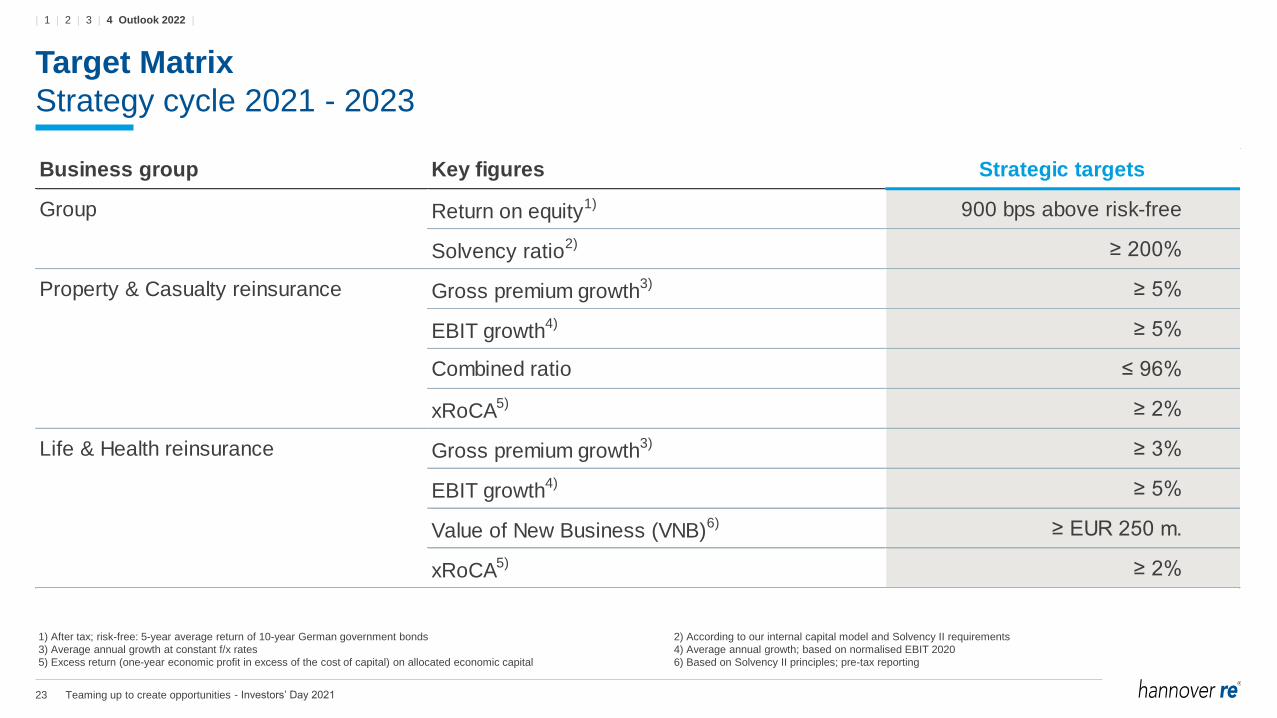
Business group Key figures Strategic targets
Group Return on equity1) 900 bps above risk-free
Solvency ratio2) ≥ 200%
Property & Casualty reinsurance Gross premium growth3) ≥ 5%
EBIT growth4) ≥ 5%
Combined ratio ≤ 96%
xRoCA5) ≥ 2%
Life & Health reinsurance Gross premium growth3) ≥ 3%
EBIT growth4) ≥ 5%
Value of New Business (VNB)6) ≥ EUR 250 m.
xRoCA5) ≥ 2%
Target Matrix
Strategy cycle 2021 - 2023
1) After tax; risk-free: 5-year average return of 10-year German government bonds 2) According to our internal capital model and Solvency II requirements
3) Average annual growth at constant f/x rates 4) Average annual growth; based on normalised EBIT 2020
5) Excess return (one-year economic profit in excess of the cost of capital) on allocated economic capital 6) Based on Solvency II principles; pre-tax reporting
| 1 | 2 | 3 | 4 Outlook 2022 |
- Investors’ Day 2021

24 Teaming up to create opportunities
Stronger emphasis on continuity of ordinary dividend distribution
Continued use of special dividend for efficient and flexible capital management
Dividend per share in EUR
2.10 2.60
0.40 3.00 3.00
1.25
3.25
1.50
3.50
1.50
3.50
1.50
3.75
1.50
4.00
1.50
4.50
37%37% 37%37%34%34%
36%36%
44%44% 43%43%
38%38%
42%42% 43%43%40%40%
52%52%50%50% 51%51%
63%63%60%60%
52%52%
61%61%
2011 2012 2013 2014 2015 2016 2017 2018 2019 2020
Ordinary dividend per share Payout ratio ordinary dividend per share
Total payout ratio dividend per share
35%
45%
New dividend metric
Ordinary DPS ≥ prior year
+
Special dividend if capitalisation exceeds capital requirements for future growth
and profit targets are achieved
Target payout ratio
35%
40%
Payout ratio target discontinued
Continuity of ordinary dividend now
more explicit
Special dividend per share
| 1 | 2 | 3 | 4 Outlook 2022 |
- Investors’ Day 2021
25 Teaming up to create opportunities
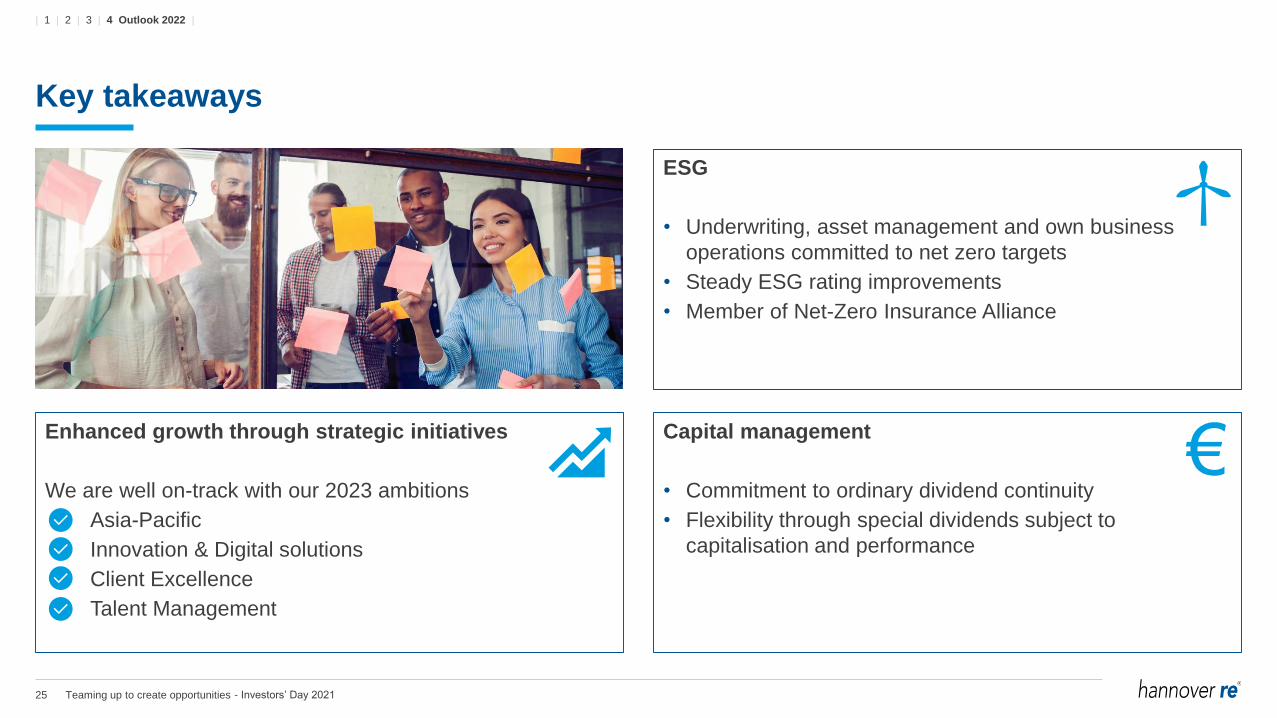
Key takeaways
ESG
• Underwriting, asset management and own business
operations committed to net zero targets
• Steady ESG rating improvements
• Member of Net-Zero Insurance Alliance
Enhanced growth through strategic initiatives
We are well on-track with our 2023 ambitions
Asia-Pacific
Innovation & Digital solutions
Client Excellence
Talent Management
Capital management
• Commitment to ordinary dividend continuity
• Flexibility through special dividends subject to
capitalisation and performance
| 1 | 2 | 3 | 4 Outlook 2022 |
- Investors’ Day 2021

26 Teaming up to create opportunities
This presentation does not address the investment objectives or financial situation of any particular person or legal entity.
Investors should seek independent professional advice and perform their own analysis regarding the appropriateness of
investing in any of our securities.
While Hannover Re has endeavoured to include in this presentation information it believes to be reliable, complete and up-to-
date, the company does not make any representation or warranty, express or implied, as to the accuracy, completeness or
updated status of such information.
Some of the statements in this presentation may be forward-looking statements or statements of future expectations based on
currently available information. Such statements naturally are subject to risks and uncertainties. Factors such as the
development of general economic conditions, future market conditions, unusual catastrophic loss events, changes in the capital
markets and other circumstances may cause the actual events or results to be materially different from those anticipated by
such statements.
This presentation serves information purposes only and does not constitute or form part of an offer or solicitation to acquire,
subscribe to or dispose of, any of the securities of Hannover Re.
© Hannover Rück SE. All rights reserved.
Hannover Re is the registered service mark of Hannover Rück SE.
Disclaimer
- Investors’ Day 2021

Investment update and inflation
Clemens Jungsthöfel, Chief Financial Officer
24th International Investors’ Day
Hannover, 14 October 2021

2 Investment update and inflation
Key takeaways3
Focus topic: inflation2
Investment update1
Agenda
- Investors’ Day 2021

1 Investment update

4 Investment update and inflation
Return on investment supported by comfortable “locked in” yields
Whilst re-investment yields remain challenging
Fixed-income portfolio as at 30 July 20211)
0.00
0.50
1.00
1.50
2.00
2.50
3.00
3.50
EUR USD GBP AUD CAD Other
"Locked-in" portfolio yield Current market yield Re-investment yield
Current portfolio market
yield
1.38%
2.21%
1.22%
“Locked in” portfolio yield
Average yield levels :
Actual re-investment yield
1) Excluding short-term investments and cash
| 1 Investment update | 2 | 3 |
- Investors’ Day 2021
5 Investment update and inflation
Reporting according to signed UN PRI;
increase share of proxy votings and direct
engagements
IFRS 9 preparation: reduce equity ETF’s
and shift to direct listed equities;
keep PE and RE funds
Stable returns of real assets and closer
movement to RoE business models by
investing in (private) equities is key
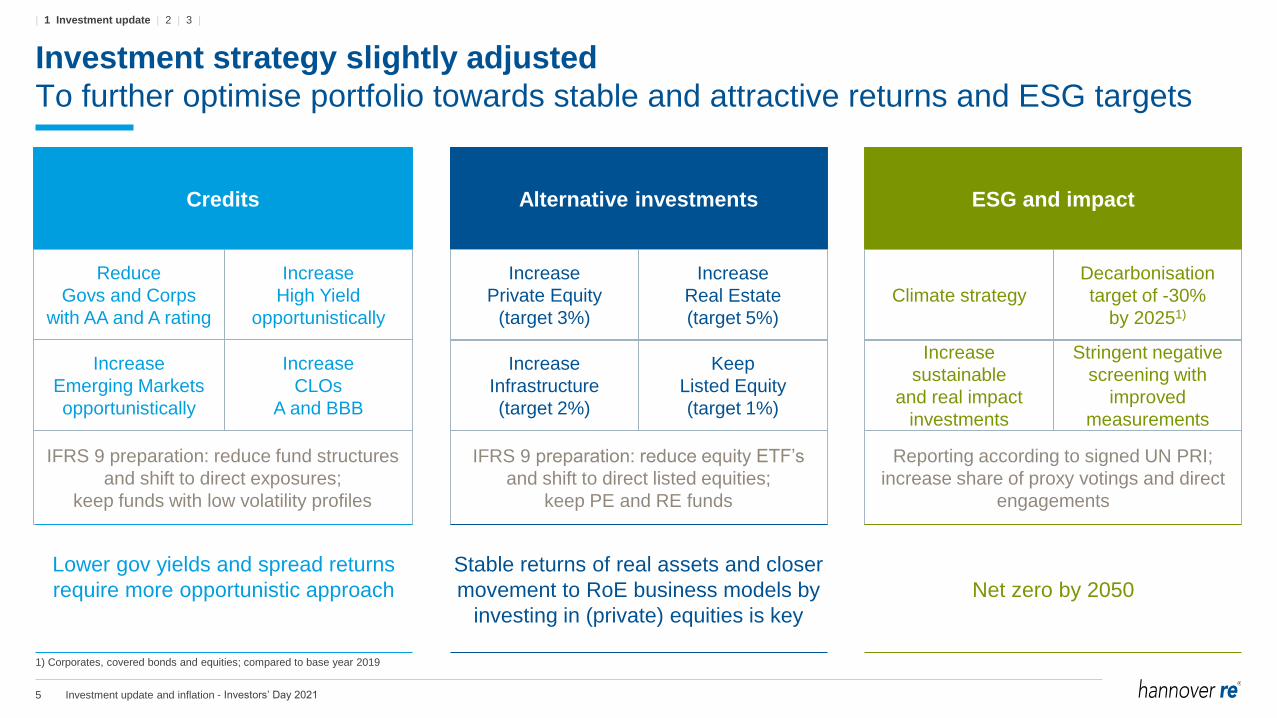
Investment strategy slightly adjusted
To further optimise portfolio towards stable and attractive returns and ESG targets
Credits ESG and impactAlternative investments
Reduce
Govs and Corps
with AA and A rating
IFRS 9 preparation: reduce fund structures
and shift to direct exposures;
keep funds with low volatility profiles
Increase
High Yield
opportunistically
Lower gov yields and spread returns
require more opportunistic approach Net zero by 2050
Increase
CLOs
A and BBB
Increase
Emerging Markets
opportunistically
Increase
Private Equity
(target 3%)
Increase
Real Estate
(target 5%)
Keep
Listed Equity
(target 1%)
Increase
Infrastructure
(target 2%)
Climate strategy
Decarbonisation
target of -30%
by 20251)
Stringent negative
screening with
improved
measurements
Increase
sustainable
and real impact
investments
1) Corporates, covered bonds and equities; compared to base year 2019
| 1 Investment update | 2 | 3 |
- Investors’ Day 2021

6 Investment update and inflation
Governments20%
Semi-governments
12%
Corporates32%
Pfandbriefe, Covered
Bonds, ABS5%
Private Equity16%
Real Assets3)
11%
Others4%
Short-term investments &
cash1%
EUR 698 m.
Asset allocation remains highly diversified and resilient
Strong ordinary returns with high contributions from alternative investments
1) Economic view based on market values without outstanding commitments for Private Equity and Alternative Real Estate as well as fixed-income investments of EUR 1,583.2 m. (EUR 1,275.6 m.) as at 30 June 2021
2) Of which Pfandbriefe and Covered Bonds = 63.3%
3) Before real estate-specific costs. Economic view based on market values as at 30 June 2021
Ordinary income split
(as per 1H/2021)
Asset allocation1)
Investment category 2017 2018 2019 2020 1H/2021
Fixed-income securities 87% 87% 87% 85% 85%
- Governments 30% 35% 35% 34% 32%
- Semi-governments 17% 16% 15% 15% 15%
- Corporates 32% 29% 31% 30% 32%
Investment grade 27% 25% 26% 25% 28%
Non-investment grade 5% 4% 4% 5% 4%
- Pfandbriefe, Covered bonds, ABS 8% 7% 7% 6% 6%
Equities 2% 2% 3% 3% 2%
- Listed equity <1% <1% <1% 1% 1%
- Private equity 2% 2% 2% 3% 3%
Real Assets 5% 6% 5% 5% 5%
Others 1% 1% 2% 3% 3%
Short-term investments & cash 4% 4% 3% 3% 3%
Total market values in bn. EUR 40.5 42.7 48.2 49.8 53.4
2)
| 1 Investment update | 2 | 3 |
- Investors’ Day 2021

7 Investment update and inflation
High-quality corporate bond portfolio
Expansion supported by strong AuM growth
AA12%
A28%
BBB46%
<BBB14%
AAA1% AA
12%
A31%
BBB42%
<BBB15%
AAA1% AA
11%
A31%
BBB44%
<BBB13%
31.12.2019 31.12.2020 30.06.2021
EUR 14,801 m. EUR 14,912 m. EUR 17,235 m.
| 1 Investment update | 2 | 3 |
- Investors’ Day 2021

8 Investment update and inflation
Volume and returns1) of main alternative asset strategies
Private Equity Real Estate Infrastructure Listed EquitiesEmerging Market
Debt
High Yield andCredit Funds
CollateralizedLoan Obligations
0
500
1000
1500
2000
2500
3000
3500
4000
4500
in m
. E
UR
5Y – IRR²)
13.6% - 17.1%
5Y – IRR²)
3.3% - 11.1%
Target-IRR²)
4% - 10%
1) Volumes as of 15 July 2021; returns as a 5Y average as of Q1/2021
2) Range due to several investment structures with different risk-return profiles
3) w/o HR-entities located in emerging markets
P&L Return
4.3%
P&L Return
6.8%
P&L Return
5.3%
Target-Return
~ 5% - 6%
3)
Alternative investments and credit enhancement
Well positioned to generate sustainable attractive returns to support RoI
| 1 Investment update | 2 | 3 |
- Investors’ Day 2021
9 Investment update and inflation
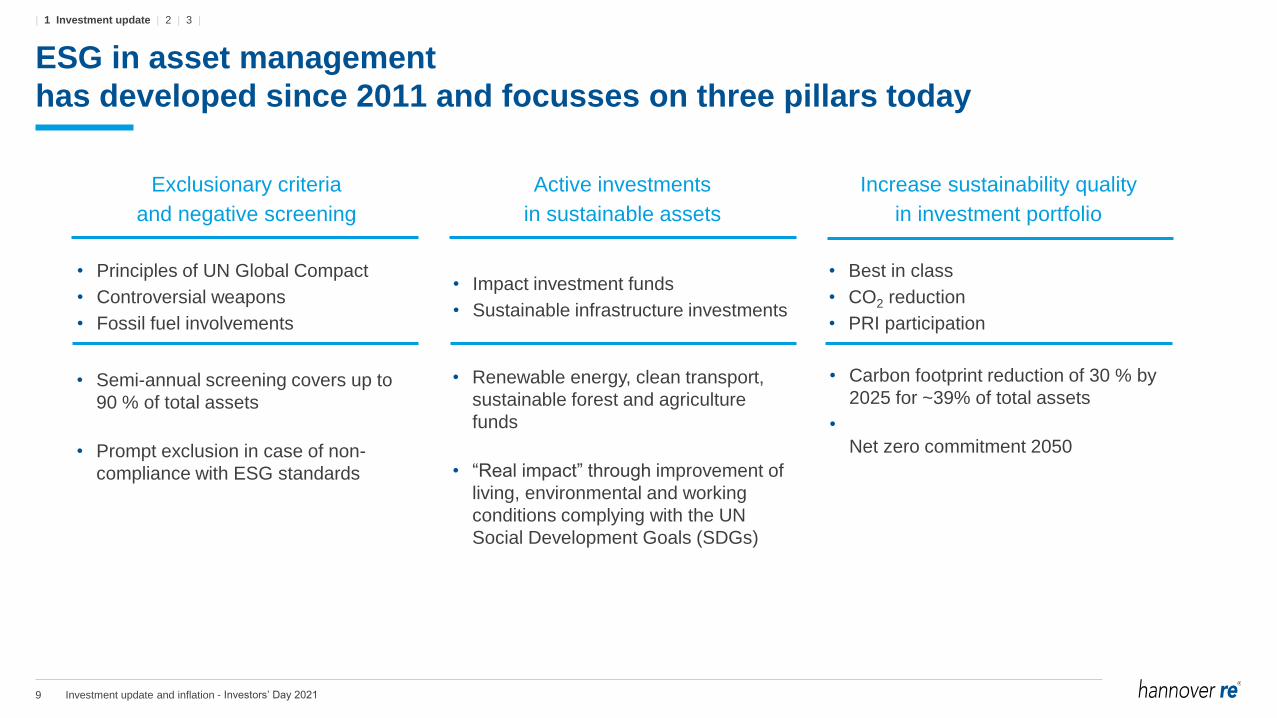
ESG in asset management
has developed since 2011 and focusses on three pillars today
Exclusionary criteria
and negative screening
Active investments
in sustainable assets
Increase sustainability quality
in investment portfolio
• Principles of UN Global Compact
• Controversial weapons
• Fossil fuel involvements
• Best in class
• CO2 reduction
• PRI participation
• Impact investment funds
• Sustainable infrastructure investments
• Semi-annual screening covers up to
90 % of total assets
• Prompt exclusion in case of non-
compliance with ESG standards
• Renewable energy, clean transport,
sustainable forest and agriculture
funds
• “Real impact” through improvement of
living, environmental and working
conditions complying with the UN
Social Development Goals (SDGs)
• Carbon footprint reduction of 30 % by
2025 for ~39% of total assets
•
Net zero commitment 2050
| 1 Investment update | 2 | 3 |
- Investors’ Day 2021
2 Focus topic: inflation

11 Investment update and inflation
Areas potentially impacted by inflation…
...but all actively addressed by effective measures
Pricing
Reserving
Large loss budgeting
Investments, admin. costs, etc.
| 1 | 2 Focus topic: inflation | 3 |
- Investors’ Day 2021
12 Investment update and inflation
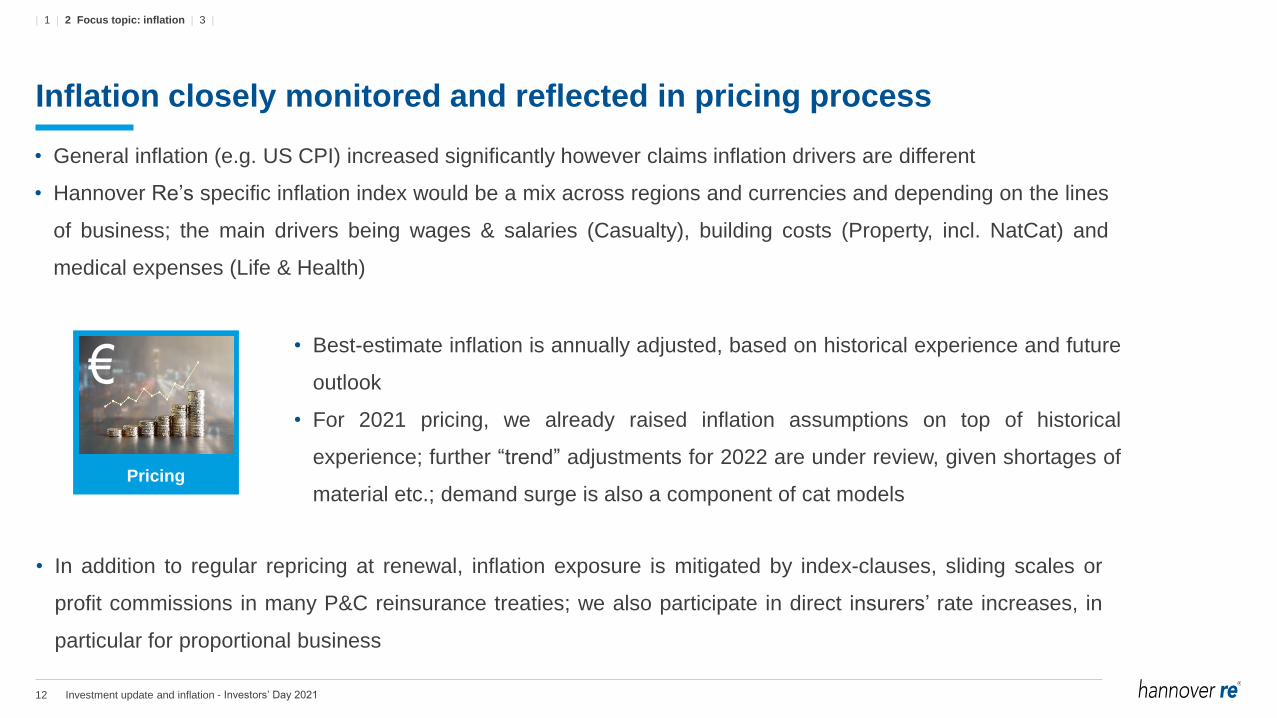
Inflation closely monitored and reflected in pricing process
Pricing
• Best-estimate inflation is annually adjusted, based on historical experience and future
outlook
• For 2021 pricing, we already raised inflation assumptions on top of historical
experience; further “trend” adjustments for 2022 are under review, given shortages of
material etc.; demand surge is also a component of cat models
• General inflation (e.g. US CPI) increased significantly however claims inflation drivers are different
• Hannover Re’s specific inflation index would be a mix across regions and currencies and depending on the lines
of business; the main drivers being wages & salaries (Casualty), building costs (Property, incl. NatCat) and
medical expenses (Life & Health)
• In addition to regular repricing at renewal, inflation exposure is mitigated by index-clauses, sliding scales or
profit commissions in many P&C reinsurance treaties; we also participate in direct insurers’ rate increases, in
particular for proportional business
| 1 | 2 Focus topic: inflation | 3 |
- Investors’ Day 2021

13 Investment update and inflation
Inflation also well considered in our strong reserving process
Reserving
• Reserving is based on average historical inflation; loadings are applied if future inflation is expected to deviate
significantly from past inflation
• Reserving particularly important for long-tail lines, as they are mainly affected by wage
and medical expense inflation; actual loss experience has been in line with
expectations, but potential loading at year-end 2021 currently under review
• Expected price increases on large losses are reflected in reserving process (e.g.
demand search, etc.)
• On top of the above material reserve buffers and conservative large loss budgets leave substantial room for
adverse developments
| 1 | 2 Focus topic: inflation | 3 |
- Investors’ Day 2021

14 Investment update and inflation
Average hedged inflation levels
• 1.57% EUR
• 2.25% USD
• 2.47% AUD
• 1.90% NZD
Market value of inflation-linked bonds
• EUR 2,191 m. (EUR)
• EUR 2,355 m. (USD)
• EUR 371 m. (AUD)
• EUR 19 m. (NZD)
Inflation-linked bonds provide additional protection
Sensitivity to inflation in EUR m.
Hedge level
Volu
me
Inflation expectation: +100 bps +468
Inflation expectation: -100 bps - 417
Inflation expectation: +400 bps +2,262
Figures as at 30 June 2021
• Portfolio of approx. 5 bn. EUR; duration between 6 and 9
years, mainly USD and EUR
• Nominal (government) bond with embedded inflation swap
- “fixed” payer leg = expected inflation at purchase date;
- “floating” leg = realised inflation until maturity of the ILBs
• Market value of the embedded swap reflects the realised
inflation (until reporting date) and changes of inflation
expectations (for remaining life of ILBs)
• Swap not to be separated in IFRS, i.e. market value changes
of swap are not visible in IFRS-P/L (less volatility)
• but realised YoY inflation feeds into the ordinary income of
ILBs for each reporting year
Accountin
gIn
flatio
n-lin
ked B
ond
(ILB
)
| 1 | 2 Focus topic: inflation | 3 |
- Investors’ Day 2021

15 Investment update and inflation
Key takeaways
Highly diversified and resilient investment portfolio
• Strategy adjusted for yield optimisation and ESG goals
• Ordinary income strong and stable earnings contributor
• Low yield environment challenging but manageable
Inflation risks remain manageable
• Inflation drivers closely monitored and mitigated by price
increases in renewals, index clauses, sliding scales and
through price increases in primary rates
• Conservative reserving approach and large loss
budgeting ensure sufficient buffers
• Inflation-linker used as proxy to further mitigate exposure
• Real assets, i.e. private equity, infrastructure, real estate
provide additional protection
| 1 | 2 | 3 Key takeaways |
- Investors’ Day 2021

16 Investment update and inflation
This presentation does not address the investment objectives or financial situation of any particular person or legal entity.
Investors should seek independent professional advice and perform their own analysis regarding the appropriateness of
investing in any of our securities.
While Hannover Re has endeavoured to include in this presentation information it believes to be reliable, complete and up-to-
date, the company does not make any representation or warranty, express or implied, as to the accuracy, completeness or
updated status of such information.
Some of the statements in this presentation may be forward-looking statements or statements of future expectations based on
currently available information. Such statements naturally are subject to risks and uncertainties. Factors such as the
development of general economic conditions, future market conditions, unusual catastrophic loss events, changes in the capital
markets and other circumstances may cause the actual events or results to be materially different from those anticipated by
such statements.
This presentation serves information purposes only and does not constitute or form part of an offer or solicitation to acquire,
subscribe to or dispose of, any of the securities of Hannover Re.
© Hannover Rück SE. All rights reserved.
Hannover Re is the registered service mark of Hannover Rück SE.
Disclaimer
- Investors’ Day 2021
Insights into P&C reinsuranceSpotlight on profitable growth
Sven Althoff, Member of the Executive Board
24th International Investors’ Day 2021
Hannover, 14 October 2021
2 Insights into P&C reinsurance
Key takeaways3
Hannover Re's positioning2
Market environment1
Agenda
- Investors’ Day 2021

1 Market environment

4 Insights into P&C reinsurance
Global economy back on track after Covid-19
Positive trends in the insurance sector as indicator for Hannover Re’s profitable path
Global GDP (real, Index: 2015 = 100)
90
100
110
120
130
140
2015 2016 2017 2018 2019 2020 2021 2022 2023 2024 2025
Regional GDP reaches pre-crisis level in…
2022
EMEA
2021
Americas
2021
APAC
2021 - 2025 forecast. Non-life primary insurance.
Source: IHS Markit, Marsh – Global Insurance Market Index – Global insurance composite pricing change (annual average, 2021: Q1 and Q2), own research and calculations
Global GWP (real, Index: 2015 = 100)
90
100
110
120
130
140
2015 2016 2017 2018 2019 2020 2021 2022 2023 2024 2025
Commercial insurance rates (real, Index: 2015 = 100)
90
100
110
120
130
140
2015 2016 2017 2018 2019 2020 2021
| 1 Market environment | 2 | 3 |
- Investors’ Day 2021

5 Insights into P&C reinsurance
Stable reinsurance capital meets growing demand
High-quality reinsurers such as Hannover Re will use this opportunity to drive profits
Reinsurance capital in bn. USD
493 514 516488
530 556 563
7281 89
97
9594 97565
595 605585
625650 660
2015 2016 2017 2018 2019 2020 1H/2021
Traditional Alternative
• Resilience of R/I capital despite Covid-19
• Moderate growth in traditional capital
benefits traditional reinsurers in light of the
ongoing flight to quality
• Alternative capital remains stable over
past three years compared to substantial
growth in traditional capital
Year-end (Q4) figures, except 2021. Average year-over-year growth rates.
Source: Aon – Reinsurance Market Outlook, Aon - Reinsurance Aggregate
+ ~2.6%
+ ~5.0%
+ ~2.2%
CAGR
| 1 Market environment | 2 | 3 |
- Investors’ Day 2021
6 Insights into P&C reinsurance
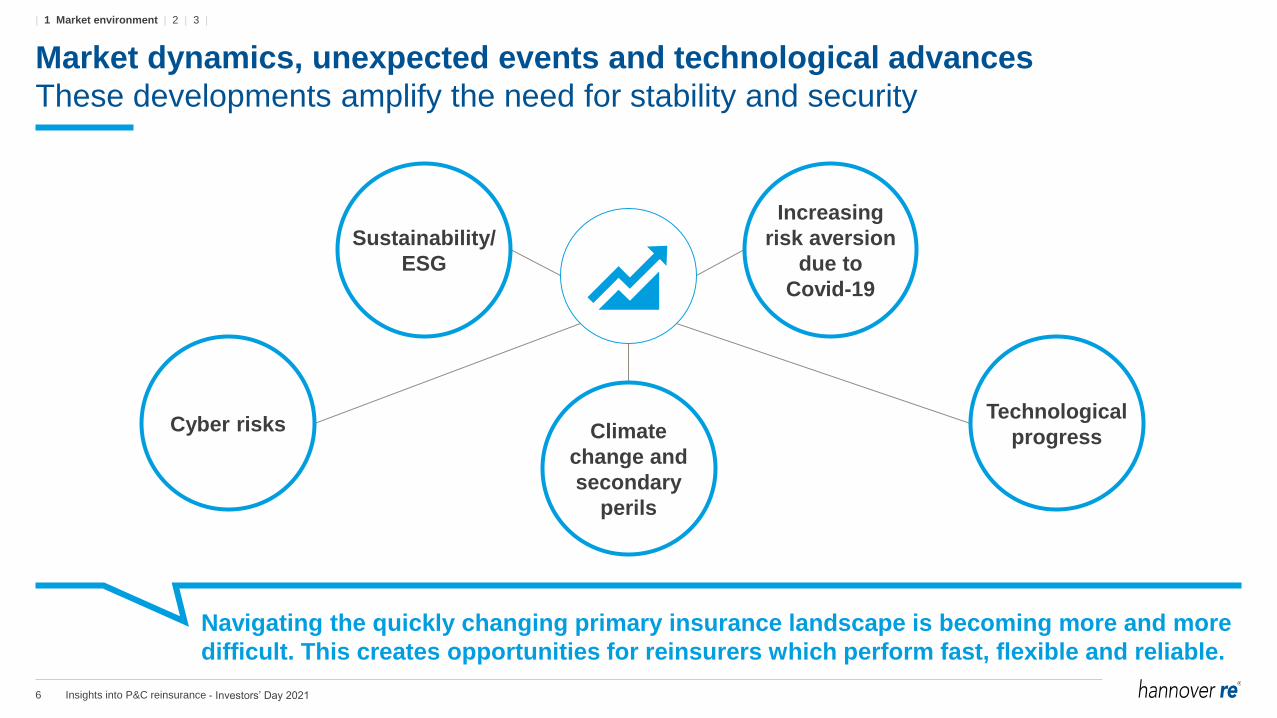
Market dynamics, unexpected events and technological advances
These developments amplify the need for stability and security
Climate
change and
secondary
perils
Technological
progressCyber risks
Sustainability/
ESG
Increasing
risk aversion
due to
Covid-19
Navigating the quickly changing primary insurance landscape is becoming more and more
difficult. This creates opportunities for reinsurers which perform fast, flexible and reliable.
| 1 Market environment | 2 | 3 |
- Investors’ Day 2021
7 Insights into P&C reinsurance
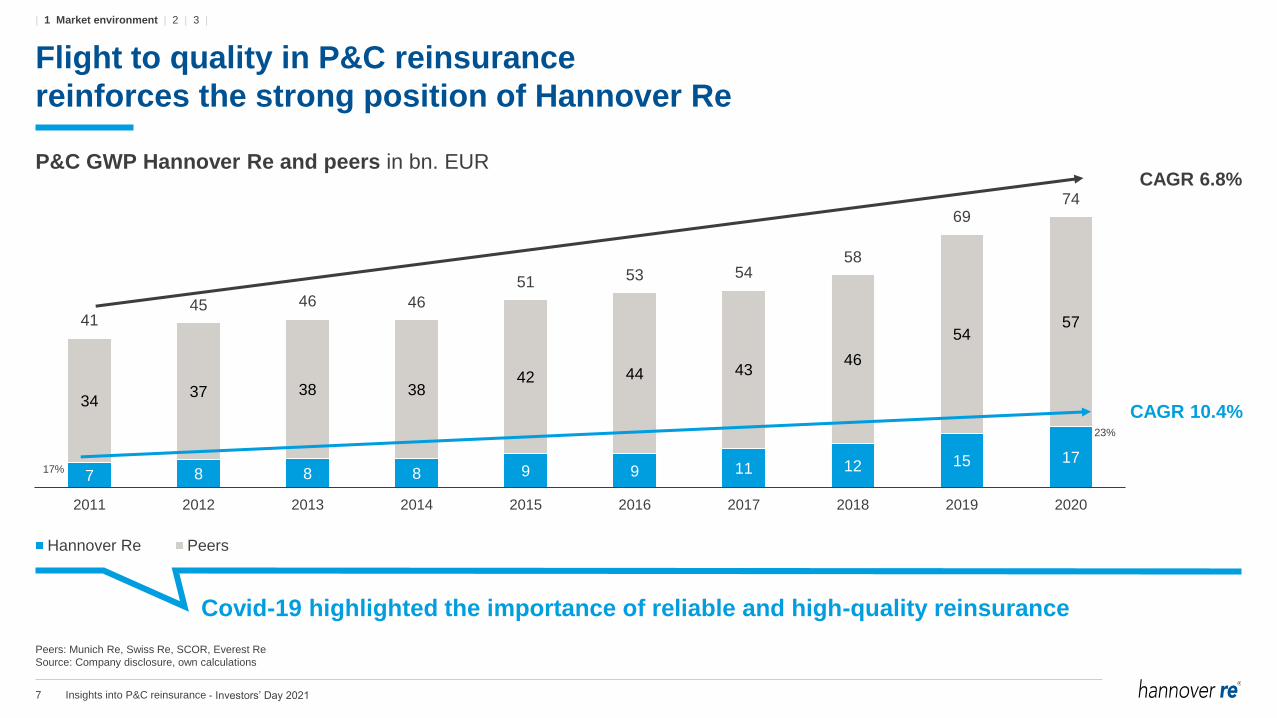
Flight to quality in P&C reinsurance
reinforces the strong position of Hannover Re
P&C GWP Hannover Re and peers in bn. EUR
7 8 8 8 9 9 11 12 15 17
3437 38 38
42 44 4346
545741
45 46 46
51 53 5458
6974
2011 2012 2013 2014 2015 2016 2017 2018 2019 2020
Hannover Re Peers
Peers: Munich Re, Swiss Re, SCOR, Everest Re
Source: Company disclosure, own calculations
17%
23%
CAGR 6.8%
CAGR 10.4%
Covid-19 highlighted the importance of reliable and high-quality reinsurance
| 1 Market environment | 2 | 3 |
- Investors’ Day 2021

8 Insights into P&C reinsurance
We have a very strong bottom-line focus
Our EBIT share is significantly higher than our premium share compared to peers
Hannover Re P&C – EBIT share and GWP share
16%
37%
26%
36%
2016 2017 2018 2019 2020
EBIT share GWP share
• Hannover Re is focused on earnings growth
• We have been able to efficiently use our premium volume to
deliver solid results
• Portfolio steering with a clear focus on profitability
• On this basis we strive to continuously grow
our top line profitably
141%
P&C reinsurance only. Source: Own calculation. Peers: Swiss Re, Munich Re, SCOR, Everest Re
Bottom-line focus visible when
comparing EBIT and GWP shares
| 1 Market environment | 2 | 3 |
- Investors’ Day 2021
9 Insights into P&C reinsurance
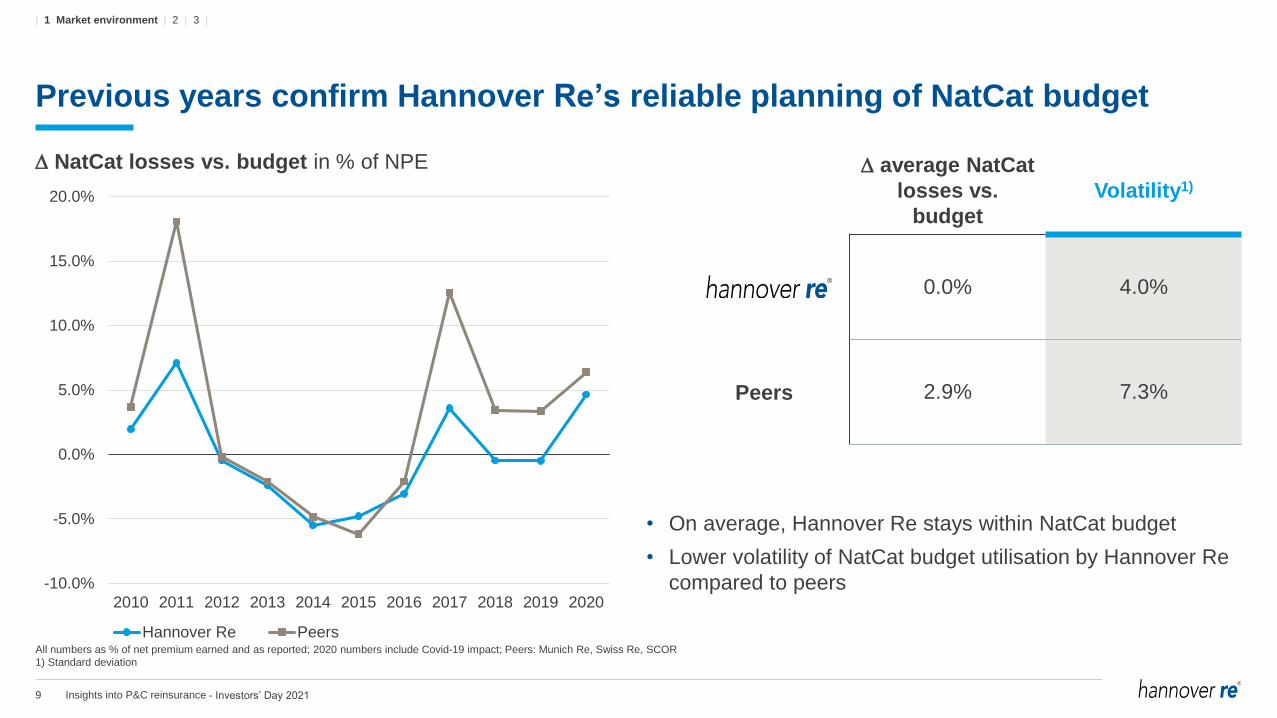
Previous years confirm Hannover Re’s reliable planning of NatCat budget
NatCat losses vs. budget in % of NPE
-10.0%
-5.0%
0.0%
5.0%
10.0%
15.0%
20.0%
2010 2011 2012 2013 2014 2015 2016 2017 2018 2019 2020
Hannover Re Peers
• On average, Hannover Re stays within NatCat budget
• Lower volatility of NatCat budget utilisation by Hannover Re
compared to peers
average NatCat
losses vs.
budget
Volatility1)
0.0% 4.0%
Peers 2.9% 7.3%
All numbers as % of net premium earned and as reported; 2020 numbers include Covid-19 impact; Peers: Munich Re, Swiss Re, SCOR
1) Standard deviation
| 1 Market environment | 2 | 3 |
- Investors’ Day 2021
2 Hannover Re’s positioning
11 Insights into P&C reinsurance
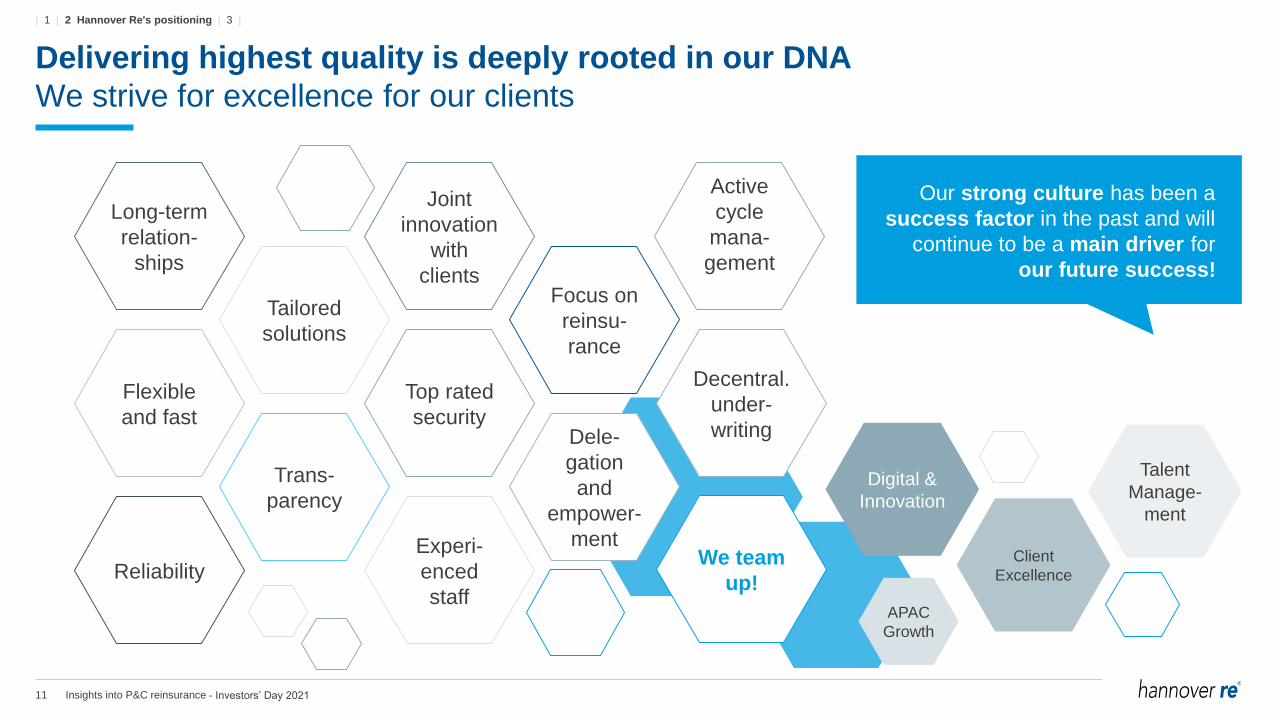
Delivering highest quality is deeply rooted in our DNA
We strive for excellence for our clients
Our strong culture has been a
success factor in the past and will
continue to be a main driver for
our future success!
Top rated
security
Experi-
enced
staff
Joint
innovation
with
clients
Tailored
solutions
Trans-
parency
Flexible
and fast
Reliability
Long-term
relation-
ships
Focus on
reinsu-
rance
Dele-
gation
and
empower-
mentWe team
up!
Active
cycle
mana-
gement
Digital &
Innovation
Talent
Manage-
ment
Client
Excellence
APAC
Growth
Decentral.
under-
writing
| 1 | 2 Hannover Re's positioning | 3 |
- Investors’ Day 2021

12 Insights into P&C reinsurance
Selected P&C strategy contributions
designed to strengthen our future readiness
Further expand our bottom line through
existing and new client relationships
• Customer Excellence
• Leadership position in specialty markets
• Enlarge our portfolio of captive clients
• Build on the strength of E+S Rück as “The
Reinsurer for Germany”
• Offering innovative products in growing
Latin American market
Continue building our position as innovation partner
for our clients
• Embed tailor-made solutions (including structured reinsurance
& ILS – e.g. cat. bonds & securitizations)
• Embed digital business (including insurtech partnerships and
partnerships with global technology firms)
• Foster data analytics and benefit from new sources/pools of
data
• Further increase activities in parametrics
• Increase private-public partnerships to close protection gap
Preferred
business
partner
Innovation
catalyst
| 1 | 2 Hannover Re's positioning | 3 |
- Investors’ Day 2021

13 Insights into P&C reinsurance
Selected P&C strategy contributions
Further strengthen tailor-made reinsurance solutions
Description
• Holistic approach to catalyse additional demand for
structured and traditional tailor-made reinsurance
solutions
• Efficient value creation by focusing on special services
Relevance
• Supporting our clients in their challenges related to
regulatory environments
• Offering focused services to create insurance
business growth for our clients
Target outcome
• Efficient knowledge transfer with clients creating
new transactions
• Creating additional value through services focused
on Telematics, NatCat and Cyber
• Working together through joint marketing activities
Positioning in our strategy map
Innovation
catalyst
| 1 | 2 Hannover Re's positioning | 3 |
- Investors’ Day 2021
14 Insights into P&C reinsurance
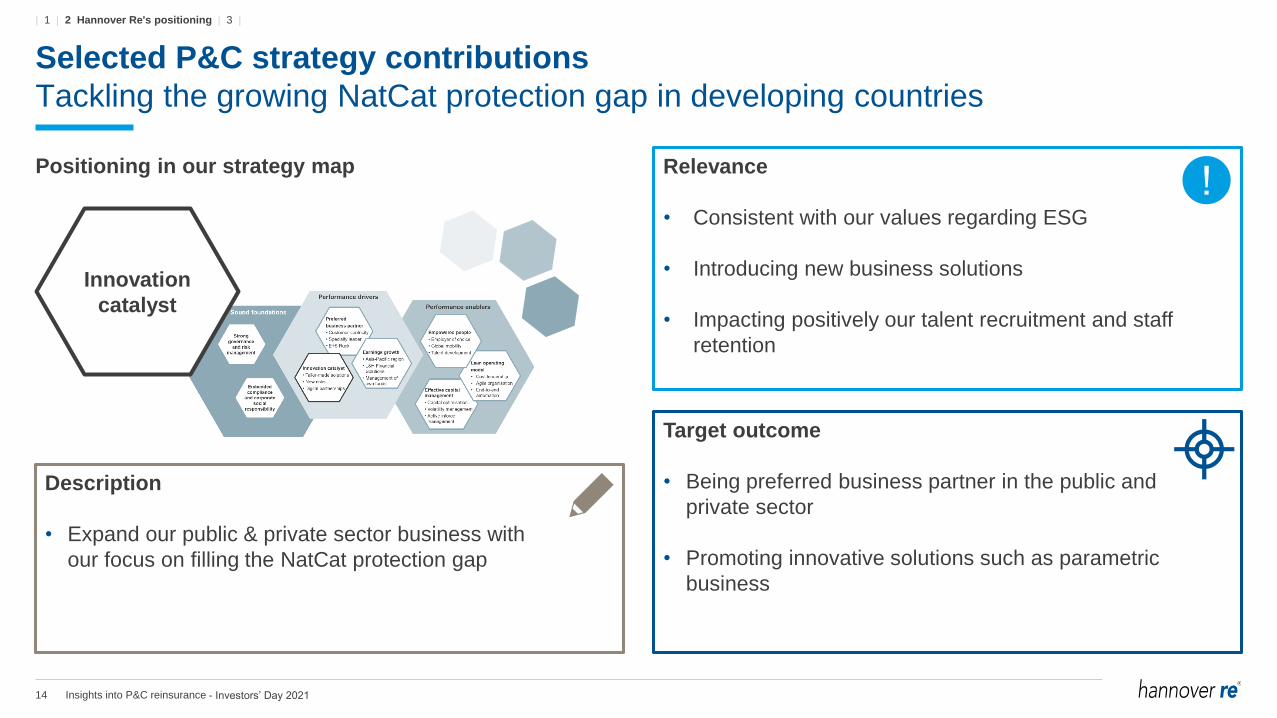
Selected P&C strategy contributions
Tackling the growing NatCat protection gap in developing countries
Description
• Expand our public & private sector business with
our focus on filling the NatCat protection gap
Relevance
• Consistent with our values regarding ESG
• Introducing new business solutions
• Impacting positively our talent recruitment and staff
retention
Target outcome
• Being preferred business partner in the public and
private sector
• Promoting innovative solutions such as parametric
business
Positioning in our strategy map
Innovation
catalyst
| 1 | 2 Hannover Re's positioning | 3 |
- Investors’ Day 2021
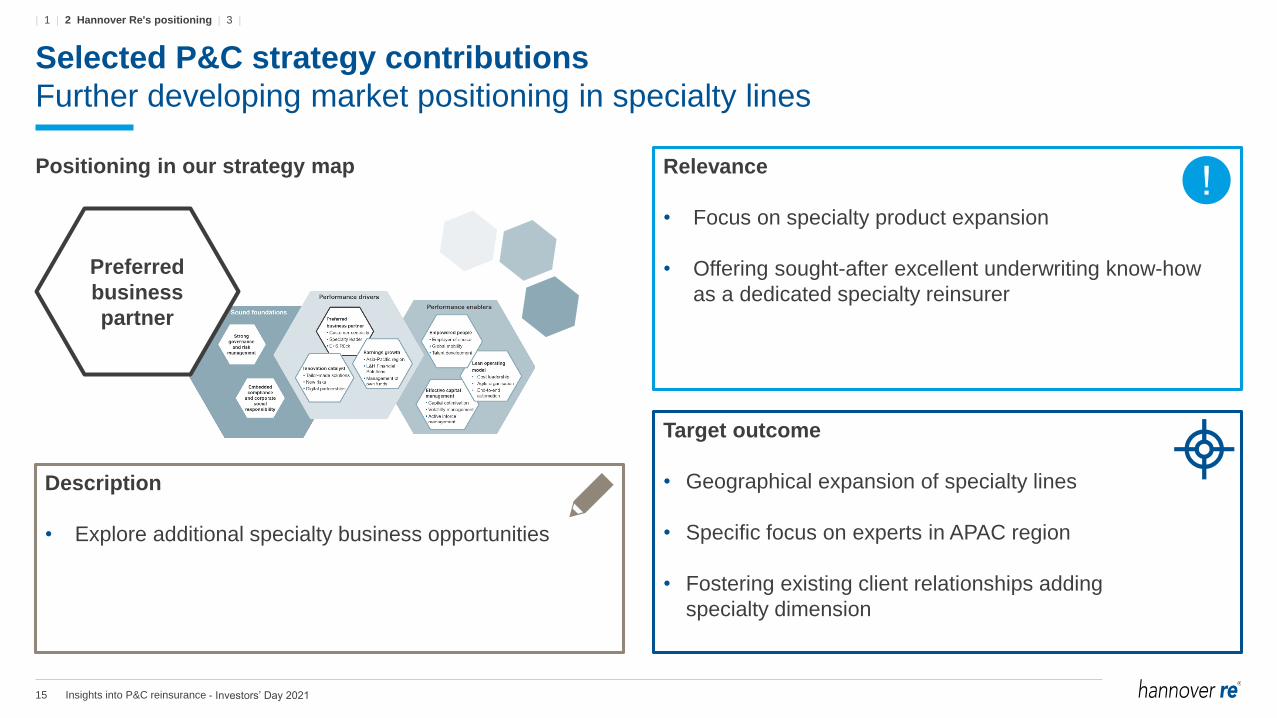
15 Insights into P&C reinsurance
Selected P&C strategy contributions
Further developing market positioning in specialty lines
Description
• Explore additional specialty business opportunities
Relevance
• Focus on specialty product expansion
• Offering sought-after excellent underwriting know-how
as a dedicated specialty reinsurer
Target outcome
• Geographical expansion of specialty lines
• Specific focus on experts in APAC region
• Fostering existing client relationships adding
specialty dimension
Positioning in our strategy map
Preferred
business
partner
| 1 | 2 Hannover Re's positioning | 3 |
- Investors’ Day 2021
16 Insights into P&C reinsurance
Selected P&C strategy contributions
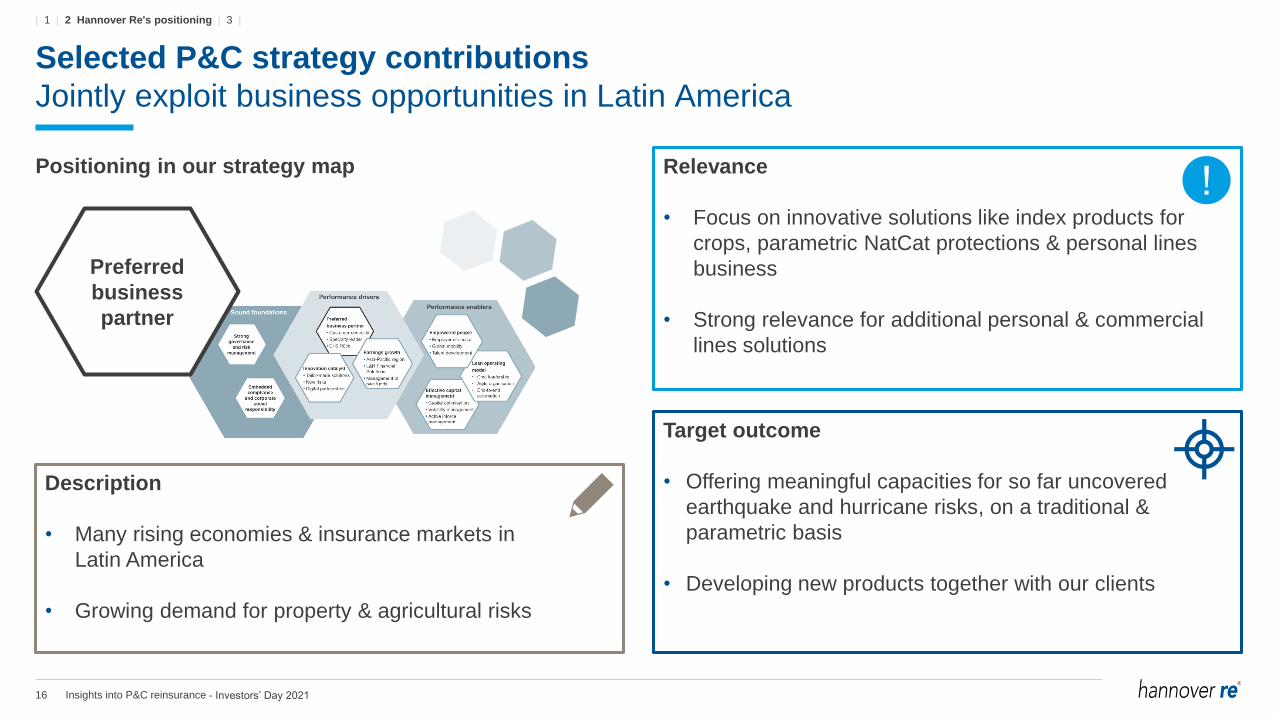
Jointly exploit business opportunities in Latin America
Description
• Many rising economies & insurance markets in
Latin America
• Growing demand for property & agricultural risks
Relevance
• Focus on innovative solutions like index products for
crops, parametric NatCat protections & personal lines
business
• Strong relevance for additional personal & commercial
lines solutions
Target outcome
• Offering meaningful capacities for so far uncovered
earthquake and hurricane risks, on a traditional &
parametric basis
• Developing new products together with our clients
Positioning in our strategy map
Preferred
business
partner
| 1 | 2 Hannover Re's positioning | 3 |
- Investors’ Day 2021

17 Insights into P&C reinsurance
5-year outlook: continued profitable growth
with good regional & product diversification
Growth assumptions by region (CAGR)
20A 22P 23P 24P 25P 26P
16.744
CAGR ca. 7%
P&C GWP in m. EUR
Americas mid to high single-digit
EMEA mid single-digit
APAC double-digit
Growth assumptions by line of business
(CAGR)
Property,
Casualty &
Motor
mid single-digit
Specialty mid to high single-digit
C/R target: ≤ 96%
| 1 | 2 Hannover Re's positioning | 3 |
- Investors’ Day 2021

3 Key takeaways
19 Insights into P&C reinsurance
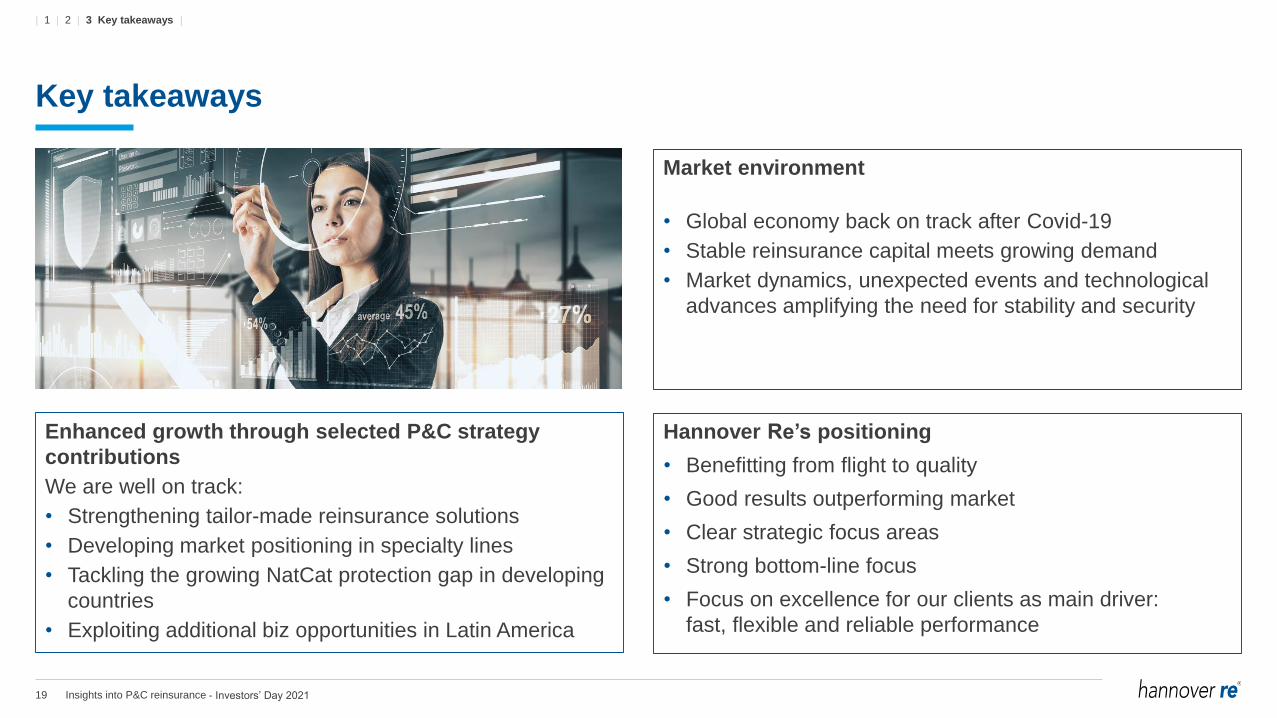
Key takeaways
Hannover Re’s positioning
• Benefitting from flight to quality
• Good results outperforming market
• Clear strategic focus areas
• Strong bottom-line focus
• Focus on excellence for our clients as main driver:
fast, flexible and reliable performance
Enhanced growth through selected P&C strategy
contributions
We are well on track:
• Strengthening tailor-made reinsurance solutions
• Developing market positioning in specialty lines
• Tackling the growing NatCat protection gap in developing
countries
• Exploiting additional biz opportunities in Latin America
Market environment
• Global economy back on track after Covid-19
• Stable reinsurance capital meets growing demand
• Market dynamics, unexpected events and technological
advances amplifying the need for stability and security
| 1 | 2 | 3 Key takeaways |
- Investors’ Day 2021

20 Insights into P&C reinsurance
This presentation does not address the investment objectives or financial situation of any particular person or legal entity.
Investors should seek independent professional advice and perform their own analysis regarding the appropriateness of
investing in any of our securities.
While Hannover Re has endeavoured to include in this presentation information it believes to be reliable, complete and up-to-
date, the company does not make any representation or warranty, express or implied, as to the accuracy, completeness or
updated status of such information.
Some of the statements in this presentation may be forward-looking statements or statements of future expectations based on
currently available information. Such statements naturally are subject to risks and uncertainties. Factors such as the
development of general economic conditions, future market conditions, unusual catastrophic loss events, changes in the capital
markets and other circumstances may cause the actual events or results to be materially different from those anticipated by
such statements.
This presentation serves information purposes only and does not constitute or form part of an offer or solicitation to acquire,
subscribe to or dispose of, any of the securities of Hannover Re.
© Hannover Rück SE. All rights reserved.
Hannover Re is the registered service mark of Hannover Rück SE.
Disclaimer
- Investors’ Day 2021

Insights into Life & Health reinsuranceSpotlight on longevity
Claude Chèvre, Member of the Executive Board
24th International Investors’ Day 2021
Hannover, 14 October 2021

2 Insights into Life & Health reinsurance
Key takeaways4
Life & Health earnings power3
Spotlight on longevity2
Introduction1
Agenda
- Investors’ Day 2021

3 Insights into Life & Health reinsurance
Key takeaways4
Life & Health earnings power3
Spotlight on longevity2
Introduction1
Agenda
Introduction

4 Insights into Life & Health reinsurance
423 137
Good performance in 2020
In each of the earnings growth drivers
119168
224319
397
2015 2016 2017 2018 2019 2020 2021 2022 2023
Normalised EBIT in m. EUR
+120 m.
Financial Solutions
67 56 46 61 90
2015 2016 2017 2018 2019 2020 2021 2022 2023
+50 m.
Normalised EBIT in m. EUR.
Asia
Normalised EBIT in m. EUR
Longevity
52 28 35 59 90
2015 2016 2017 2018 2019 2020 2021 2022 2023
+80 m.
Expected
2020E 2020A
427
E: Expected normalised A: Actual
2020E 2020A
102
2020E 2020A
110
172
Expected Expected
| 1 Introduction | 2 | 3 | 4 |

5 Insights into Life & Health reinsurance
Key takeaways4
Life & Health earnings power3
Spotlight on longevity2
Introduction1
Agenda
Spotlight on longevity
6 Insights into Life & Health reinsurance
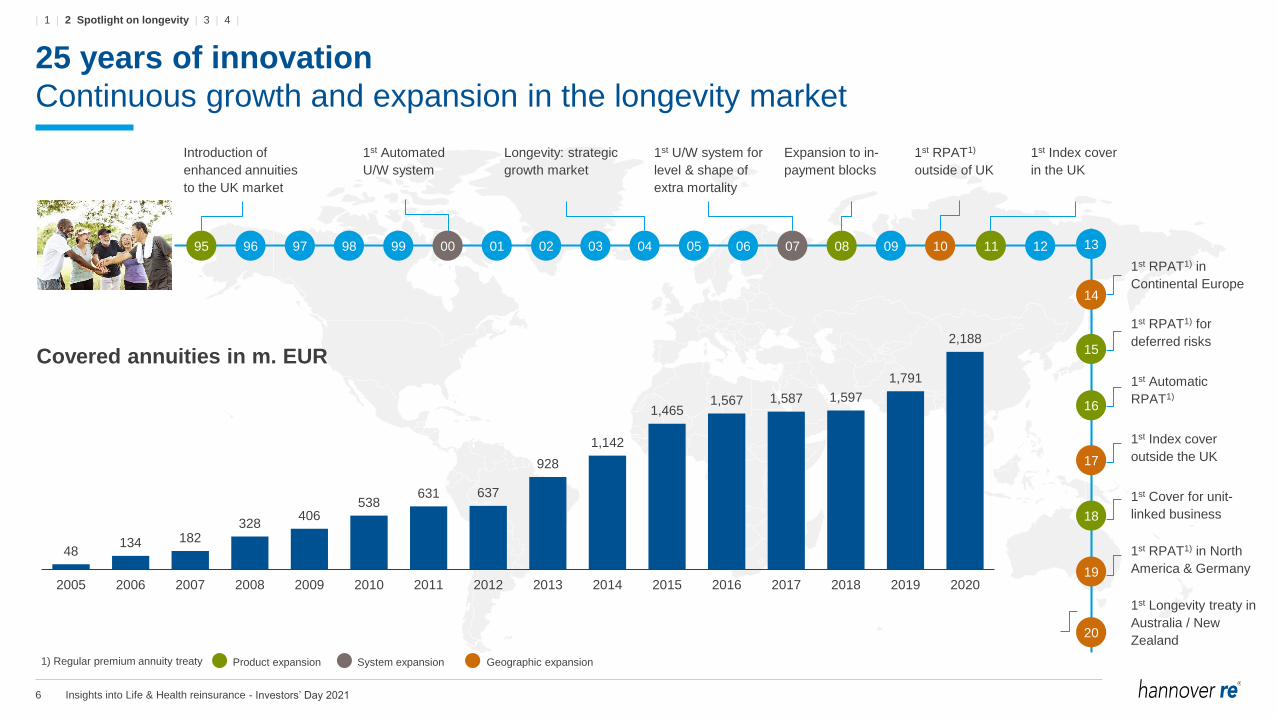
25 years of innovation
Continuous growth and expansion in the longevity market
13
14
15
16
17
18
19
20
Introduction of
enhanced annuities
to the UK market
1st Automated
U/W system
Longevity: strategic
growth market
1st U/W system for
level & shape of
extra mortality
1st RPAT1)
outside of UK
1st Index cover
in the UK
96 97 98 99 00 01 02 03 04 05 06 07 08 09 1095 11 12
1st RPAT1) in
Continental Europe
1st RPAT1) for
deferred risks
1st Automatic
RPAT1)
1st Index cover
outside the UK
1st Cover for unit-
linked business
1st RPAT1) in North
America & Germany
1st Longevity treaty in
Australia / New
Zealand
48134 182
328406
538631 637
928
1,142
1,4651,567 1,587 1,597
1,791
2,188
2005 2006 2007 2008 2009 2010 2011 2012 2013 2014 2015 2016 2017 2018 2019 2020
Covered annuities in m. EUR
Expansion to in-
payment blocks
Product expansion System expansion Geographic expansion 1) Regular premium annuity treaty
- Investors’ Day 2021
| 1 | 2 Spotlight on longevity | 3 | 4 |

7 Insights into Life & Health reinsurance
Regular premium annuity treaty
Currently the preferred option of our clients
Mechanics
Floating leg
Policyholder
Hannover ReCedant
Pension scheme
Regular payments
Transaction
Fixed leg
Involved parties
Floating leg
Actual annuity payments
Fixed leg
Expected annuity payments
including margin
Reinsurer pays difference
Cedant pays difference
Time
- Investors’ Day 2021
| 1 | 2 Spotlight on longevity | 3 | 4 |
8 Insights into Life & Health reinsurance
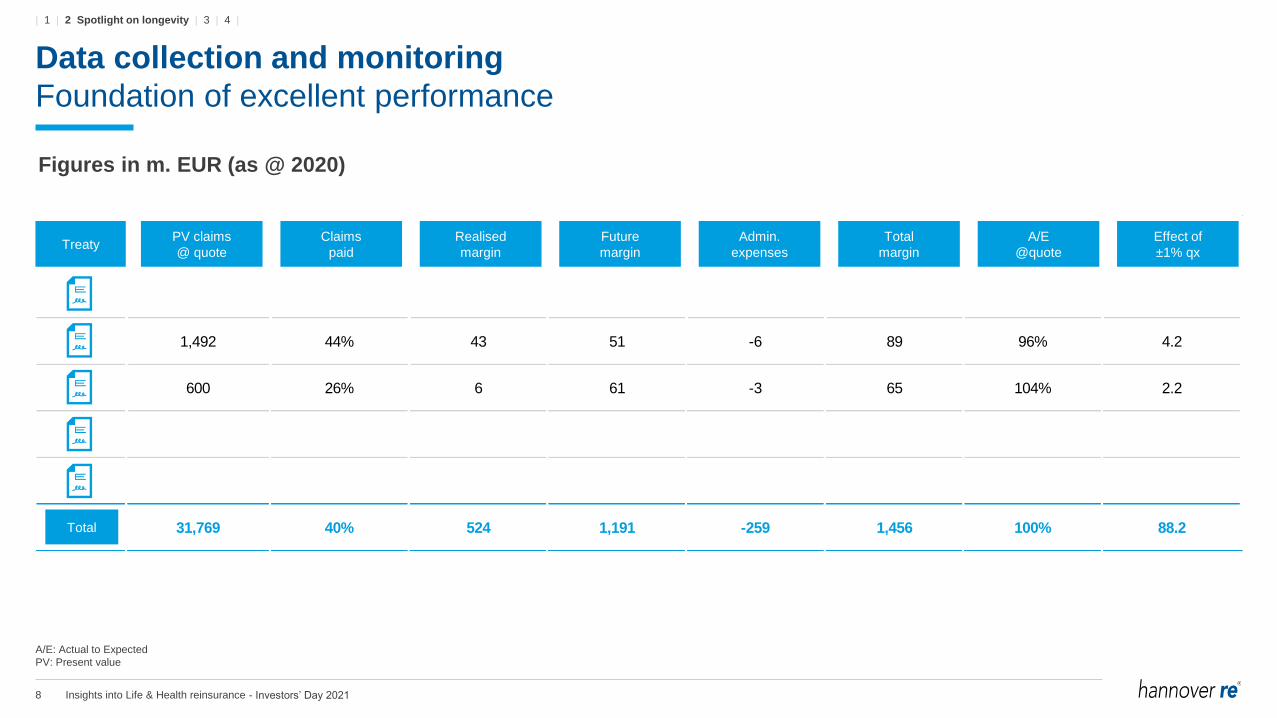
Treaty PV claims
@ quote
Claims
paid
Realised
margin
Future
margin
Admin.
expenses
Total
margin
A/E
@ quote
Effect of
±1% qx
1,492 44% 43 51 -6 89 96% 4.2
600 26% 6 61 -3 65 104% 2.2
Total 31,769 40% 524 1,191 -259 1,456 100% 88.2
Figures in m. EUR (as @ 2020)
A/E: Actual to Expected
PV: Present value
Data collection and monitoring
Foundation of excellent performance
TreatyPV claims
@ quote
Claims
paid
Realised
margin
Future
margin
Admin.
expenses
Total
margin
A/E
@quote
Effect of
±1% qx
Total
- Investors’ Day 2021
| 1 | 2 Spotlight on longevity | 3 | 4 |

9 Insights into Life & Health reinsurance
Mo
rta
lity
imp
rove
me
nts
Mortality improvements
Key ingredients of pricing and risk management
0%
20%
40%
60%
80%
100%
30 40 50 60 70 80 90 1000%
20%
40%
60%
80%
100%
60 70 80 90 100
Mortality in 2021
Best Estimate
+1% trend stress
-25% Mortality
Today’s 30-year-old males compared
to 2021 older counterparts
Today’s 60-year-old males compared
to 2021 older counterparts
2021 2031 2041 2051 2061 2071 2081 2091 2021 2031 2041 2051 2061
Mo
rta
lity
imp
rove
me
nts
Calendar year
Attained age
Mortality in 2021
Best estimate
+1% Trend stress
-25% Mortality stress
- Investors’ Day 2021
| 1 | 2 Spotlight on longevity | 3 | 4 |

10 Insights into Life & Health reinsurance
Key takeaways4
Life & Health earnings power3
Spotlight on longevity2
Introduction1
Agenda
L&H earnings power
11 Insights into Life & Health reinsurance
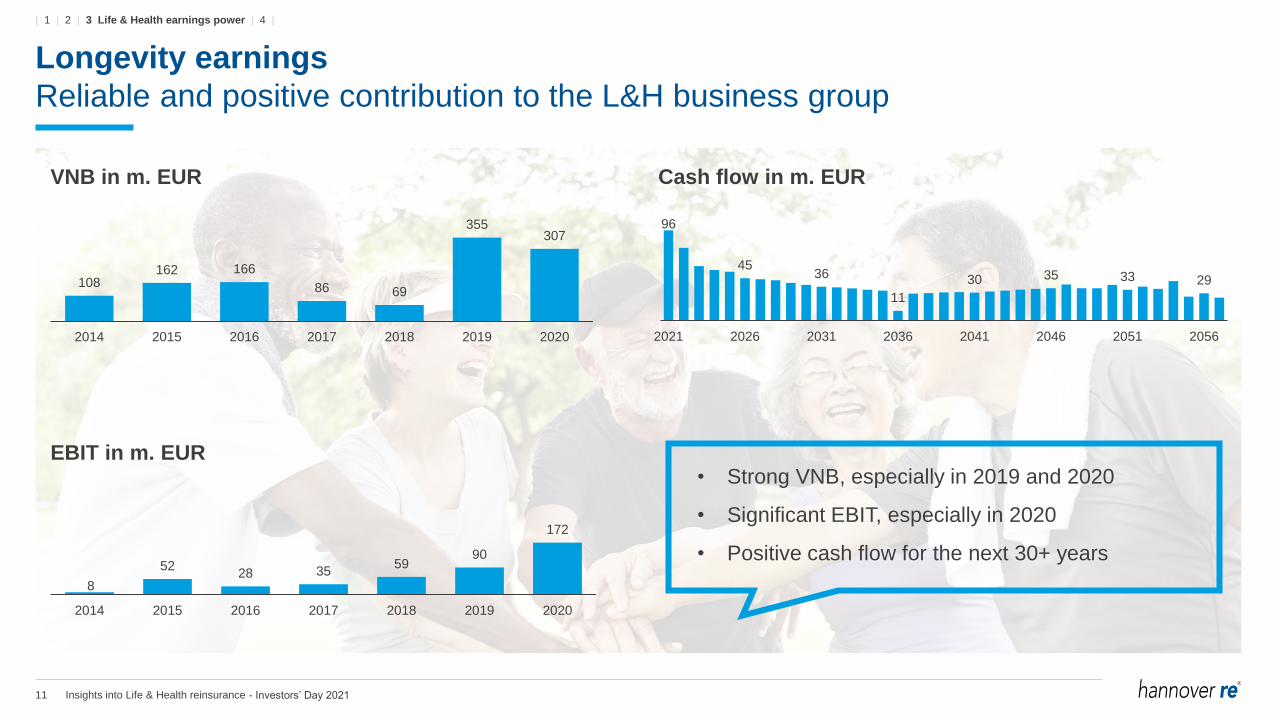
Longevity earnings
Reliable and positive contribution to the L&H business group
• Strong VNB, especially in 2019 and 2020
• Significant EBIT, especially in 2020
• Positive cash flow for the next 30+ years
108162 166
86 69
355307
2014 2015 2016 2017 2018 2019 2020
8
5228 35
5990
172
2014 2015 2016 2017 2018 2019 2020
VNB in m. EUR
EBIT in m. EUR
96
4536
11
30 35 33 29
2021 2026 2031 2036 2041 2046 2051 2056
Cash flow in m. EUR
- Investors’ Day 2021
| 1 | 2 | 3 Life & Health earnings power | 4 |

12 Insights into Life & Health reinsurance
321 343288
462 470502
600
2015 2016 2017 2018 2019 2020 2021 2022 2023 2024
Continuous growth of expected EBIT
Negatively impacted by COVID
Normalised EBIT in m. EUR.
Expected
385
Consolidated normalised EBIT
Expectation by 2024: EUR 600 m.
Underperformance
Outperformance
- Investors’ Day 2021
| 1 | 2 | 3 Life & Health earnings power | 4 |

13 Insights into Life & Health reinsurance
Key takeaways4
Life & Health earnings power3
Spotlight on longevity2
Introduction1
Agenda
Key takeaways
14 Insights into Life & Health reinsurance
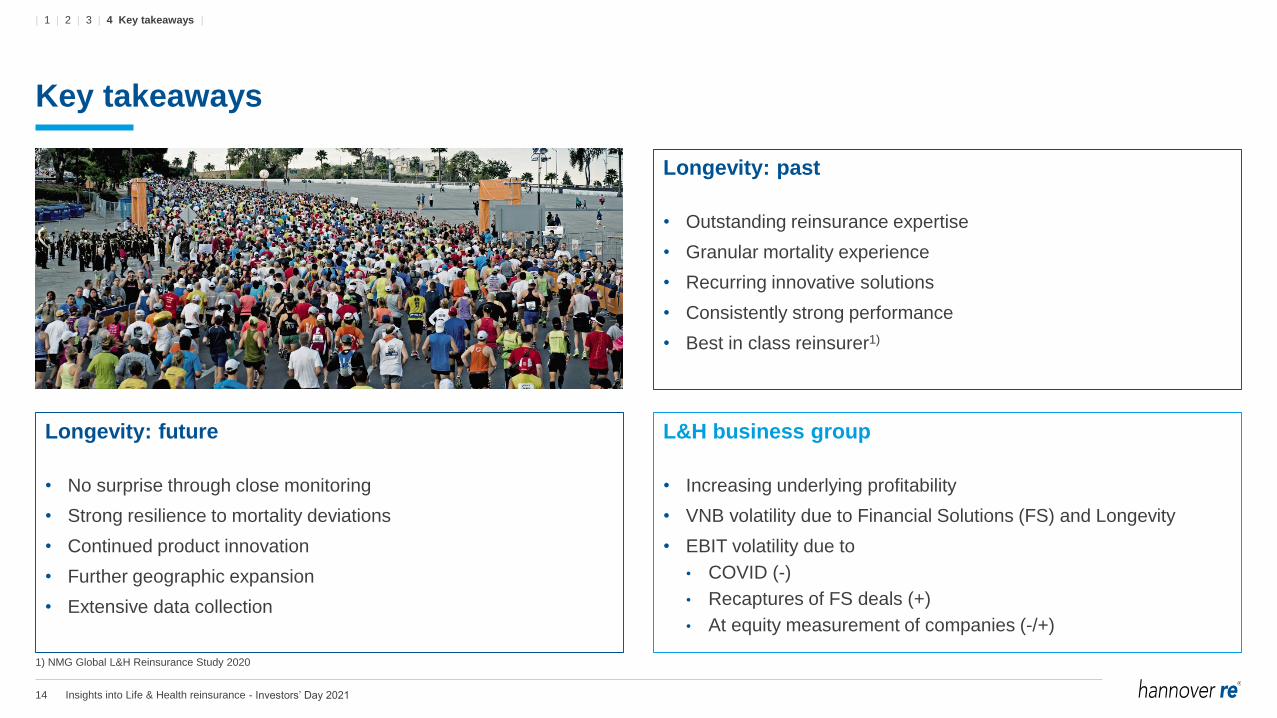
Key takeaways
Longevity: past
• Outstanding reinsurance expertise
• Granular mortality experience
• Recurring innovative solutions
• Consistently strong performance
• Best in class reinsurer1)
Longevity: future
• No surprise through close monitoring
• Strong resilience to mortality deviations
• Continued product innovation
• Further geographic expansion
• Extensive data collection
L&H business group
• Increasing underlying profitability
• VNB volatility due to Financial Solutions (FS) and Longevity
• EBIT volatility due to
• COVID (-)
• Recaptures of FS deals (+)
• At equity measurement of companies (-/+)
1) NMG Global L&H Reinsurance Study 2020
- Investors’ Day 2021
| 1 | 2 | 3 | 4 Key takeaways |

15 Insights into Life & Health reinsurance
This presentation does not address the investment objectives or financial situation of any particular person or legal entity.
Investors should seek independent professional advice and perform their own analysis regarding the appropriateness of
investing in any of our securities.
While Hannover Re has endeavoured to include in this presentation information it believes to be reliable, complete and up-to-
date, the company does not make any representation or warranty, express or implied, as to the accuracy, completeness or
updated status of such information.
Some of the statements in this presentation may be forward-looking statements or statements of future expectations based on
currently available information. Such statements naturally are subject to risks and uncertainties. Factors such as the
development of general economic conditions, future market conditions, unusual catastrophic loss events, changes in the capital
markets and other circumstances may cause the actual events or results to be materially different from those anticipated by
such statements.
This presentation serves information purposes only and does not costitute or form part of an offer or solicitation to acquire,
subscribe to or dispose of, any of the securities of Hannover Re.
© Hannover Rück SE. All rights reserved.
Hannover Re is the registered service mark of Hannover Rück SE.
Disclaimer
- Investors’ Day 2021
Concluding remarks
Jean-Jacques Henchoz, Chief Executive Officer
24th International Investors’ Day 2021
Hannover, 14 October 2021
2 Concluding remarks
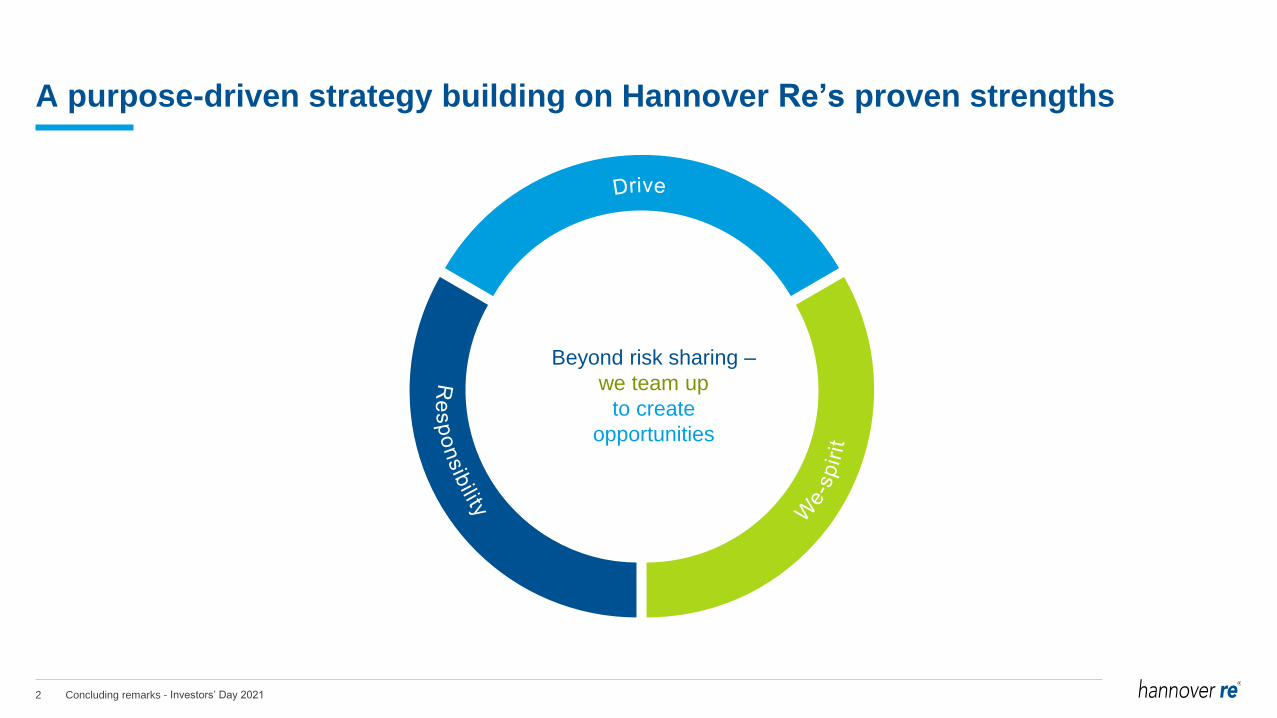
Beyond risk sharing –
we team up
to create
opportunities
A purpose-driven strategy building on Hannover Re’s proven strengths
- Investors’ Day 2021