14. Lecture WS 2007/08Bioinformatics III1 V14 Dynamic Cellular Processes John TysonBela Novak.
date post
21-Dec-2015Category
view
225download
0
23. Lecture WS 2007/08
Bioinformatics III 1
V23 Transcriptional Control in Halobacter salinarum
Leroy Hood Nitin Baliga
23. Lecture WS 2007/08
Bioinformatics III 2
What is the goal?Important goal of systems biology: understand how a simple genetic change or
environmental perturbation influences the behavior of an organism at the molecular
level and ultimately its phenotype.
High-throughput technologies to interrogate the transcriptome, proteome, protein-
protein, protein-DNA interactions etc present a powerful toolkit to accomplish this goal.
However, each of these individual data types captures an incomplete picture of global
cellular dynamics. Therefore, these data need to be integrated appropriately to
formulate a model that can quantitatively predict how the environment interacts with
cellular networks to effect changes in behavior.
Ultimate test of our understanding of a given system that will enable re-engineering of
cellular circuits: accurate prediction of its quantitative behavior.
Here: integrate experimental and computational approaches to construct a predictive
gene regulatory network model covering 80% of the transcriptome of Halobacterium
salinarum NRC-1, a free-living cell.
23. Lecture WS 2007/08
Bioinformatics III 3
Haliobacter salinarium NRC-1H. salinarum NRC-1 belongs to Archaea and lives at an environment of 4.5 M salt.
Therefore, it provides a unique window into molecular mechanisms underlying
fascinating response physiologies in extreme environments such as above boiling
temperatures and in deep sea ocean vents. Specifically, it can be expected to provide
insights into evolutionary adaptation for survival in high-salinity-induced low-water
activity, which precludes growth of most organisms.
Like most organisms it is also subject to daily and seasonal changes in many
environmental factors (EFs). One can expect it to have regulatory circuits that
effectively negotiate these complex and often stressful conditions. From a practical
standpoint, all these physiological capabilities are encoded in ca. 2400 nonredundant
genes in a very compact and easily manipulable 2.6 Mbp genome.
Task: discover and characterize a significant fraction of the gene regulatory network
associated with the intercoordination of physiological processes in this organism in
differing environmental and genetic backgrounds.
23. Lecture WS 2007/08
Bioinformatics III 4
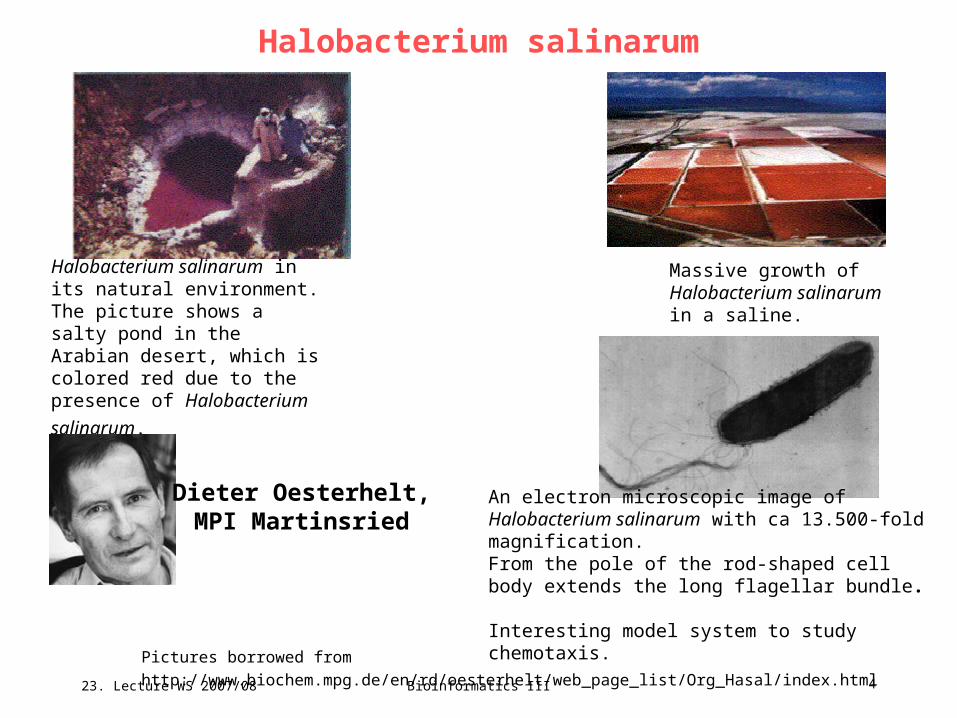
Halobacterium salinarum
Pictures borrowed from http://www.biochem.mpg.de/en/rd/oesterhelt/web_page_list/Org_Hasal/index.html
Halobacterium salinarum in its natural environment. The picture shows a salty pond in the Arabian desert, which is colored red due to the presence
of Halobacterium salinarum.
Massive growth of Halobacterium salinarum in a saline.
An electron microscopic image of Halobacterium salinarum with ca 13.500-fold magnification. From the pole of the rod-shaped cell body extends the long flagellar bundle.
Interesting model system to study chemotaxis.
Dieter Oesterhelt,MPI Martinsried
23. Lecture WS 2007/08
Bioinformatics III 5
Integrated approachApproach: - perturb the cells (genetically or environmentally), - characterize their growth and/or survival phenotype, - quantitatively measure steady-state and dynamic changes in mRNAs, - assimilate these changes into a network model that can recapitulate all observations,
and, - finally, experimentally validate hypotheses formulated from the model.
Realization:
This approach required the integrated development and implementation of
computational and experimental technologies and consisted of the following steps:
23. Lecture WS 2007/08
Bioinformatics III 6
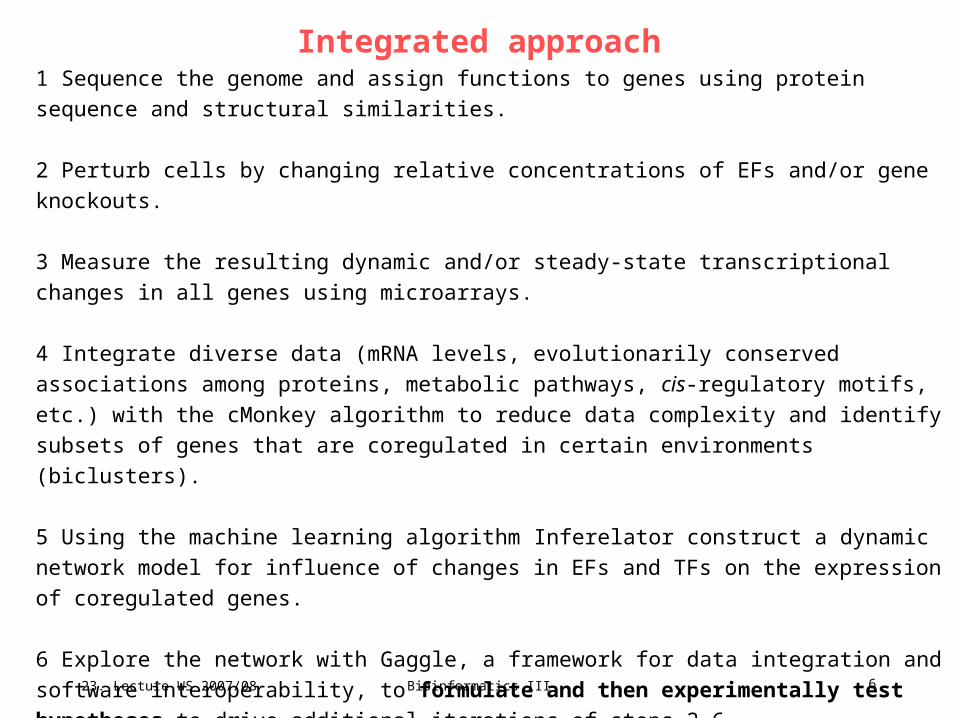
Integrated approach1 Sequence the genome and assign functions to genes using protein sequence and structural
similarities.
2 Perturb cells by changing relative concentrations of EFs and/or gene knockouts.
3 Measure the resulting dynamic and/or steady-state transcriptional changes in all genes using
microarrays.
4 Integrate diverse data (mRNA levels, evolutionarily conserved associations among proteins,
metabolic pathways, cis-regulatory motifs, etc.) with the cMonkey algorithm to reduce data
complexity and identify subsets of genes that are coregulated in certain environments
(biclusters).
5 Using the machine learning algorithm Inferelator construct a dynamic network model for
influence of changes in EFs and TFs on the expression of coregulated genes.
6 Explore the network with Gaggle, a framework for data integration and software
interoperability, to formulate and then experimentally test hypotheses to drive additional
iterations of steps 2–6.
23. Lecture WS 2007/08
Bioinformatics III 7
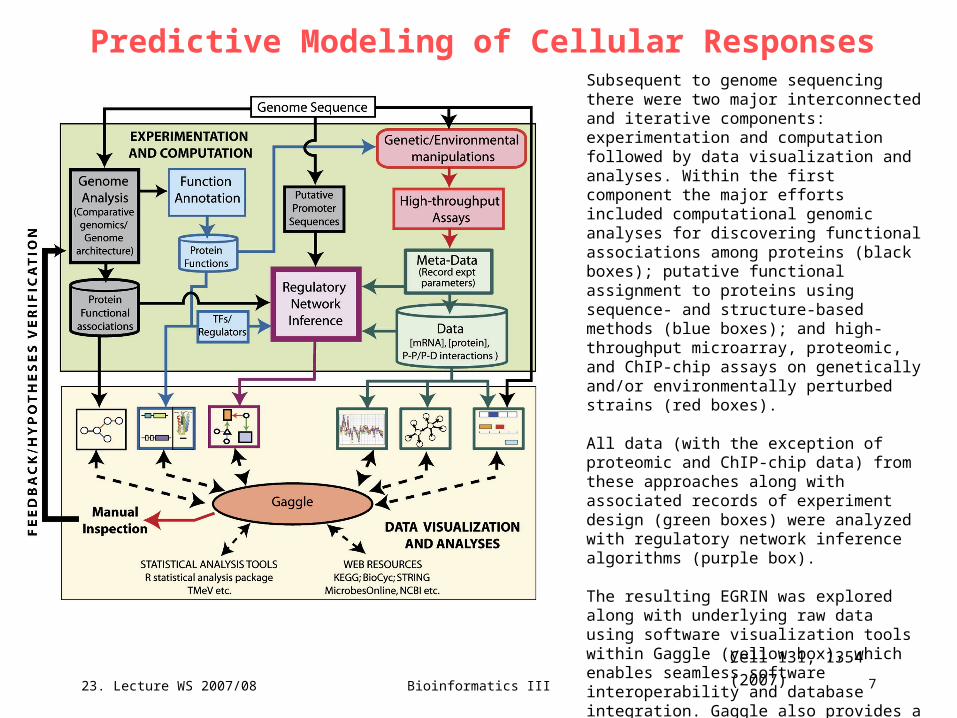
Predictive Modeling of Cellular ResponsesSubsequent to genome sequencing there were two major interconnected and iterative components: experimentation and computation followed by data visualization and analyses. Within the first component the major efforts included computational genomic analyses for discovering functional associations among proteins (black boxes); putative functional assignment to proteins using sequence- and structure-based methods (blue boxes); and high-throughput microarray, proteomic, and ChIP-chip assays on genetically and/or environmentally perturbed strains (red boxes).
All data (with the exception of proteomic and ChIP-chip data) from these approaches along with associated records of experiment design (green boxes) were analyzed with regulatory network inference algorithms (purple box).
The resulting EGRIN was explored along with underlying raw data using software visualization tools within Gaggle (yellow box), which enables seamless software interoperability and database integration. Gaggle also provides a cost-effective interface to third party tools and databases. This manual exploration and analysis enabled hypothesis formulation and provided feedback for additional iterations of systems analyses.
Cell 131, 1354 (2007)
23. Lecture WS 2007/08
Bioinformatics III 8
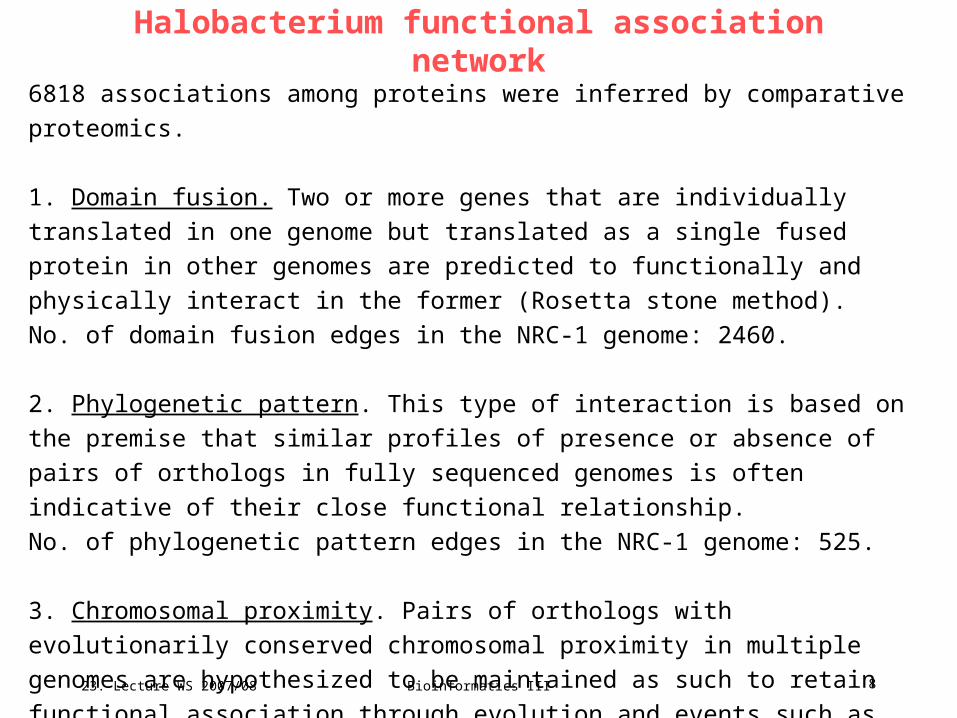
Halobacterium functional association network
6818 associations among proteins were inferred by comparative proteomics.
1. Domain fusion. Two or more genes that are individually translated in one genome
but translated as a single fused protein in other genomes are predicted to functionally
and physically interact in the former (Rosetta stone method).
No. of domain fusion edges in the NRC-1 genome: 2460.
2. Phylogenetic pattern. This type of interaction is based on the premise that similar
profiles of presence or absence of pairs of orthologs in fully sequenced genomes is
often indicative of their close functional relationship.
No. of phylogenetic pattern edges in the NRC-1 genome: 525.
3. Chromosomal proximity. Pairs of orthologs with evolutionarily conserved
chromosomal proximity in multiple genomes are hypothesized to be maintained as
such to retain functional association through evolution and events such as lateral gene
transfer.
No. of chromosomal proximity edges in the NRC-1 genome: 327.
23. Lecture WS 2007/08
Bioinformatics III 9
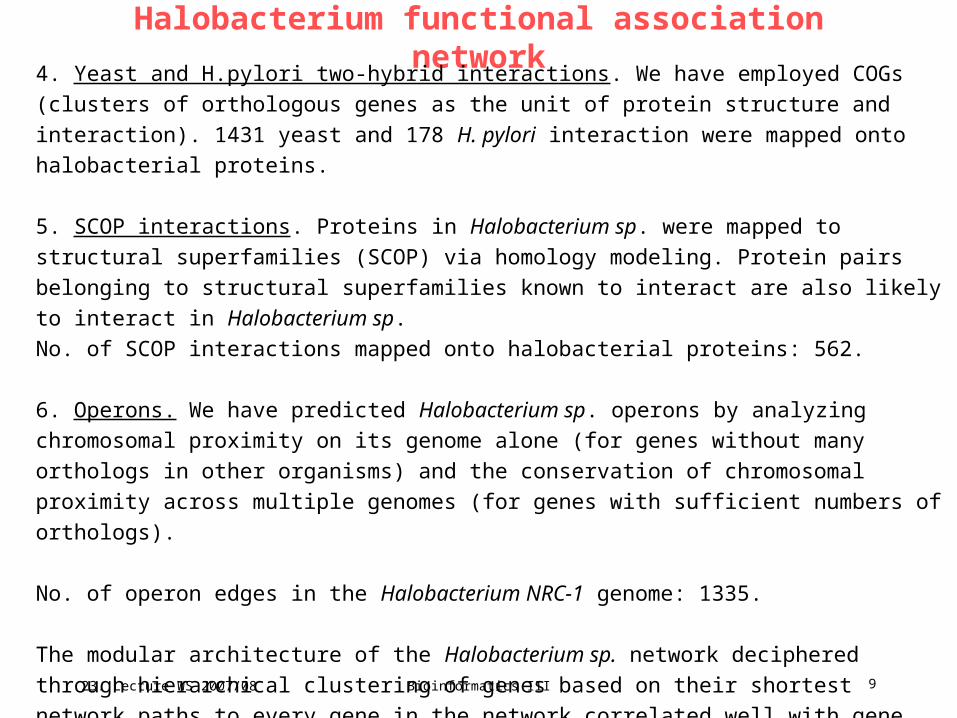
Halobacterium functional association network4. Yeast and H.pylori two-hybrid interactions. We have employed COGs (clusters of orthologous
genes as the unit of protein structure and interaction). 1431 yeast and 178 H. pylori interaction
were mapped onto halobacterial proteins.
5. SCOP interactions. Proteins in Halobacterium sp. were mapped to structural superfamilies
(SCOP) via homology modeling. Protein pairs belonging to structural superfamilies known to
interact are also likely to interact in Halobacterium sp.
No. of SCOP interactions mapped onto halobacterial proteins: 562.
6. Operons. We have predicted Halobacterium sp. operons by analyzing chromosomal proximity
on its genome alone (for genes without many orthologs in other organisms) and the conservation
of chromosomal proximity across multiple genomes (for genes with sufficient numbers of
orthologs).
No. of operon edges in the Halobacterium NRC-1 genome: 1335.
The modular architecture of the Halobacterium sp. network deciphered through hierarchical
clustering of genes based on their shortest network paths to every gene in the network correlated
well with gene functions with the modules often coinciding with sequential biochemical steps in
metabolic pathways.
23. Lecture WS 2007/08
Bioinformatics III 10
Assign protein functions
Cell 131, 1354 (2007)
1. Sequence the genome and assign functions to genes using protein sequence and
structural similarities.
Using primary sequence similarity of the H. salinarum proteins to characterized orthologs in
other organisms left a significant fraction (38%) of ~2,400 putative protein-coding genes
that could not be assigned any function.
To overcome this hurdle, we applied a more sensitive approach that incorporated functional
relationships among proteins from comparative genomics as well as protein structure
predictions to detect similarities at 3D level to proteins and protein domains in the protein
data bank (PDB). This resulted in a comprehensive parts list for which nearly 90% of all
predicted genes had some meaningful association with either a characterized protein, a
protein family or a structural fold.
Importantly, this re-annotation provided several putative regulators for designing targeted
perturbations, as well as for use as key input parameters for regulatory network inference in
subsequent steps. Specifically, through analysis of protein family signature or predicted
structural matches we were able to catalogue a list of 130 putative TFs, of which at least 14
are general transcription factors (six TATA-binding proteins (TBPs), seven Transcription
Factor B (TFB), and Transcription Factor E alpha-subunit orthologs), and the remainder
have matches to sequence-specific DNA-binding proteins.
23. Lecture WS 2007/08
Bioinformatics III 11
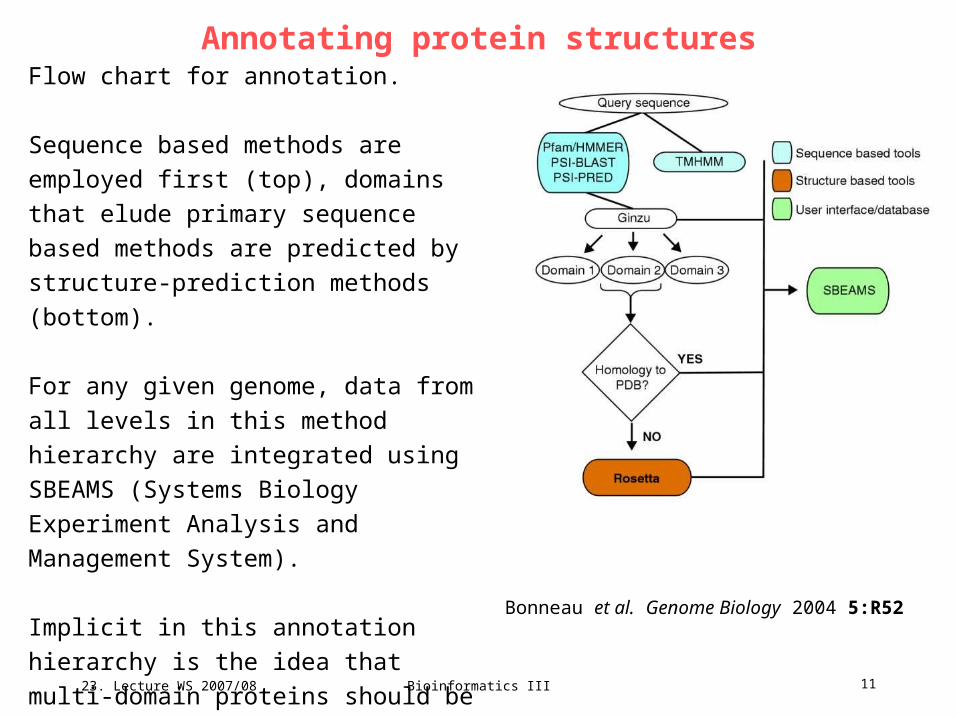
Annotating protein structuresFlow chart for annotation.
Sequence based methods are employed
first (top), domains that elude primary
sequence based methods are predicted by
structure-prediction methods (bottom).
For any given genome, data from all levels
in this method hierarchy are integrated using
SBEAMS (Systems Biology Experiment
Analysis and Management System).
Implicit in this annotation hierarchy is the
idea that multi-domain proteins should be
divided into domains as early as possible in
the annotation process. Bonneau et al. Genome Biology 2004 5:R52
23. Lecture WS 2007/08
Bioinformatics III 12
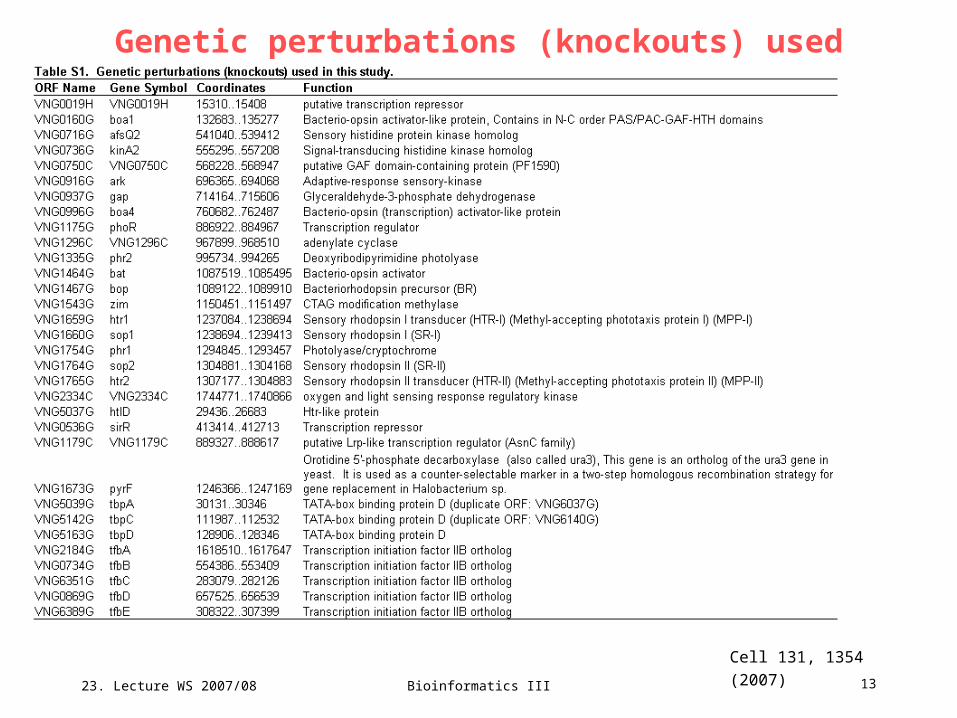
Collect transcriptional responsesCollectively analyze transcriptional responses to individual and combinatorial
perturbations in - 10 EFs including light, oxygen, UV radiation, gamma radiation, manganese (Mn),
iron (Fe), cobalt (Co), nickel (Ni), copper (Cu), and zinc (Zn) and - 32 genes including TFs, signal transducers, and metabolic enzymes.
Analyzing the microarray data classified 1929 of the total 2400 predicted genes into
300 biclusters that were often highly enriched in genes with known metabolic
processes.
Each of these biclusters represents a subset of genes that are potentially coregulated
in a defined set of environmental conditions.
We then constructed subcircuits that model expression changes in each of these
biclusters as a function of corresponding changes in 72 TFs and 9 EFs (although Co
was included as a potential predictor it did not make it into the final network).
23. Lecture WS 2007/08
Bioinformatics III 13
Genetic perturbations (knockouts) used
Cell 131, 1354 (2007)
23. Lecture WS 2007/08
Bioinformatics III 14
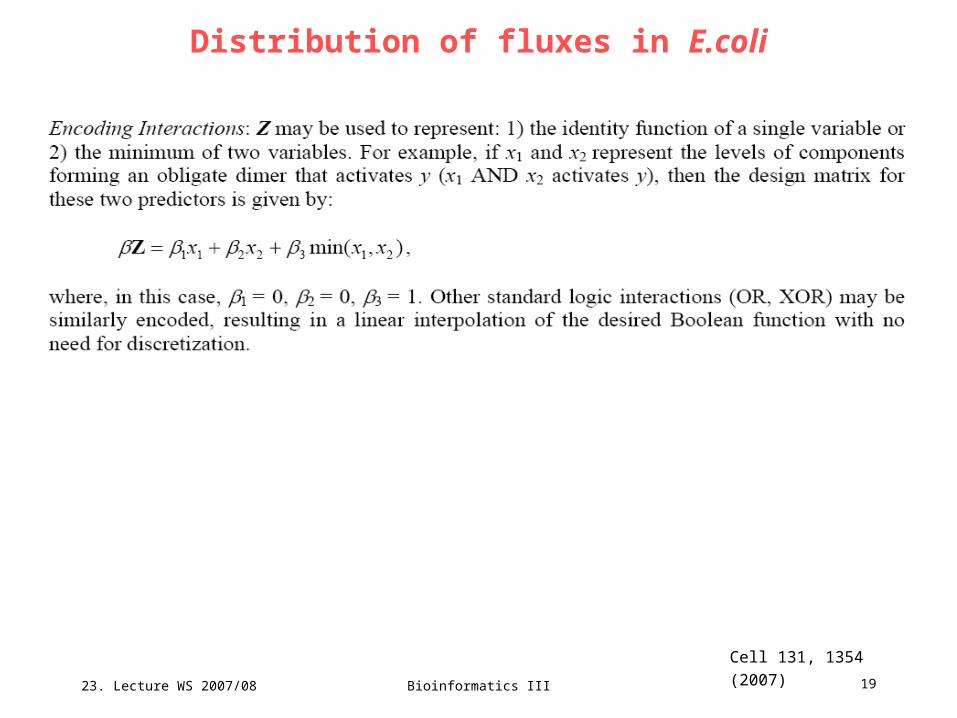
Distribution of fluxes in E.coli
Cell 131, 1354 (2007)
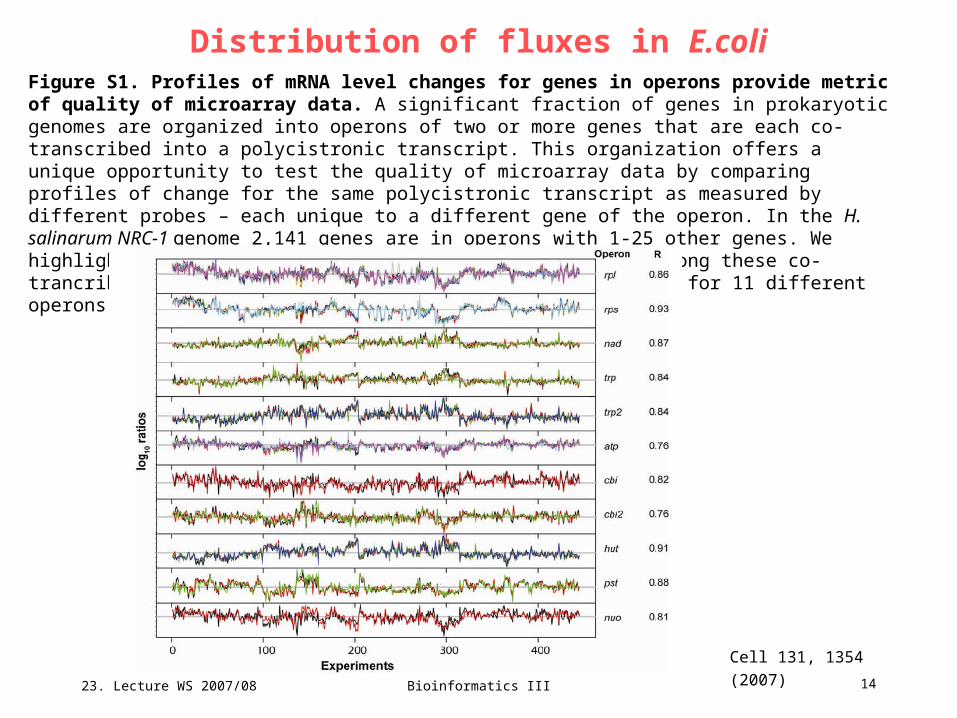
Figure S1. Profiles of mRNA level changes for genes in operons provide metric of quality of microarray data. A significant fraction of genes in prokaryotic genomes are organized into operons of two or more genes that are each co-transcribed into a polycistronic transcript. This organization offers a unique opportunity to test the quality of microarray data by comparing profiles of change for the same polycistronic transcript as measured by different probes – each unique to a different gene of the operon. In the H. salinarum NRC-1 genome 2,141 genes are in operons with 1-25 other genes. We highlight the high degree of transcriptional coherrence among these co-trancribed genes over >400 experiments by showing profiles for 11 different operons encoded at different loci around the genome.
23. Lecture WS 2007/08
Bioinformatics III 15
Co-clustering - cMonkey
Cell 131, 1354 (2007)
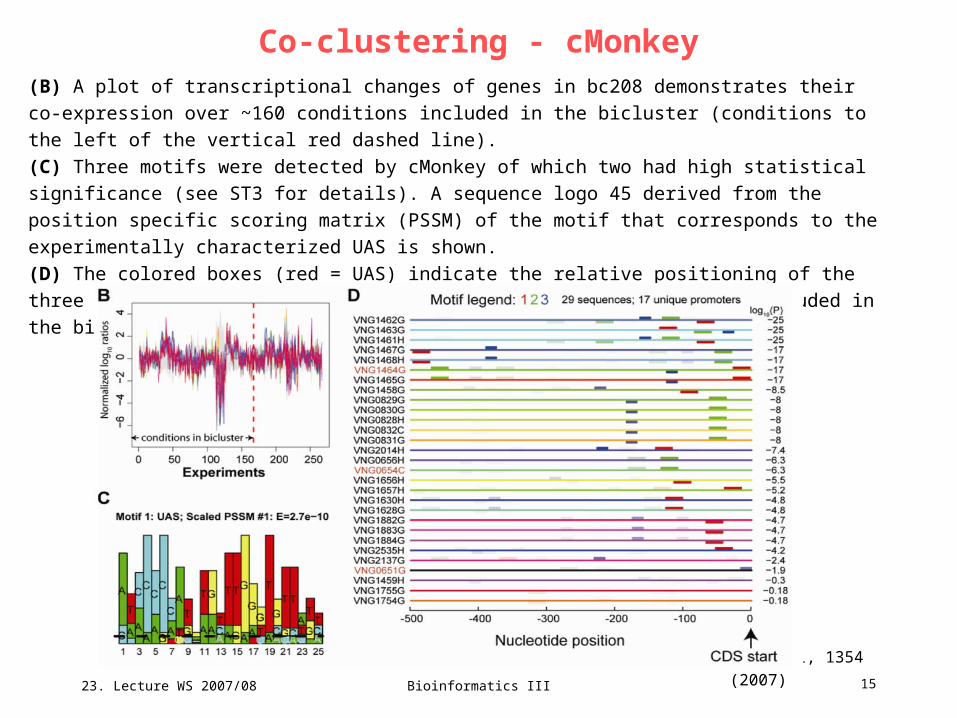
(B) A plot of transcriptional changes of genes in bc208 demonstrates their co-expression over ~160
conditions included in the bicluster (conditions to the left of the vertical red dashed line).
(C) Three motifs were detected by cMonkey of which two had high statistical significance (see ST3 for
details). A sequence logo 45 derived from the position specific scoring matrix (PSSM) of the motif that
corresponds to the experimentally characterized UAS is shown.
(D) The colored boxes (red = UAS) indicate the relative positioning of the three motifs detected
upstream to all genes in bc208. Regulators included in the bicluster are indicated in red font
(VNG1464G = Bat).

23. Lecture WS 2007/08
Bioinformatics III 16
Data integration
Cell 131, 1354 (2007)
Figure S2. Data integration using cMonkey extends knowledge of known processesthrough the discovery of new metabolic and regulatory relationshsips. (A) In bc208 containing a total of 29 genes, 7 are characterized phototrophy-associated genes with five known to constitute a regulon 2,41; 5 genes are characterized 42 DMSO respiration genes; 22 are organized into eight operons; two pairs of genes have similar phylogenetic 19 profiles 43; 7 are interconnected by their evolutionarily conserved chromosomal proximity 34 into three groups; two are connected by gene fusion 33; and none were interconnected by the KEGG metabolic network. Some genes were included purely on basis of their coexpression with other bicluster genes. The computational detection of the conserved UAS cis-regulatory motif 36,44 upstream to seven genes in addition to the five known phototrophy genes in bc208 has also helped extend membership of the this regulon.
23. Lecture WS 2007/08
Bioinformatics III 17
Inferelator algorithm for biclustering
Cell 131, 1354 (2007)
5. Use the machine learning algorithm Inferelator to discover the dynamic
influences of EFs and TFs on the expression of co-regulated genes within
biclusters.
Next, using the Inferelator algorithm, we discovered instances wherein individual
or combinatorial changes in the concentrations of certain TFs1 and/or EFs
(archived in the metainformation from step 3) temporally preceded average
transcriptional changes within a given bicluster or a gene. Briefly, the Inferelator
(a) selects parsimonious models (i.e. minimum number of regulatory influences
for each bicluster) that are predictive;
(b) explicitly includes the time dimension to discover causal influences; and
(c) models combinatorial logic i.e. interactions between EFs and TFs and
between pairs of TFs.
All of these represent reasonable assumptions about how biological networks are
constructed and operate and thus yield models that are more likely to
encapsulate true biological properties. In this specific case, 72 TFs and 10 EFs
were used as predictors (components that influence the expression of others).

23. Lecture WS 2007/08
Bioinformatics III 18
Distribution of fluxes in E.coli
Cell 131, 1354 (2007)
23. Lecture WS 2007/08
Bioinformatics III 19
Distribution of fluxes in E.coli
Cell 131, 1354 (2007)
23. Lecture WS 2007/08
Bioinformatics III 20
Distribution of fluxes in E.coli
Cell 131, 1354 (2007)
23. Lecture WS 2007/08
Bioinformatics III 21
EGRIN: environment and gene regulatory influence model
The resulting model is a set of equations that can take as input measured changes
in a few TFs and/or EFs to predict kinetic and steady-state transcriptional changes
in 80% of genes in this organism with an average (Pearson) correlation of 0.8 to
their actual measured changes.
Importantly, this predictive capability reduces significantly when the time component
is removed from the model, strongly suggesting that a significant fraction of the
influences have causal properties.
Although we provide evidence that some of the regulatory influences are mediated
directly via TF-DNA interactions, we expect that a large fraction, especially EF
influences, act indirectly, for example, via interactions with signal-transducing
environmental sensors.
23. Lecture WS 2007/08
Bioinformatics III 22
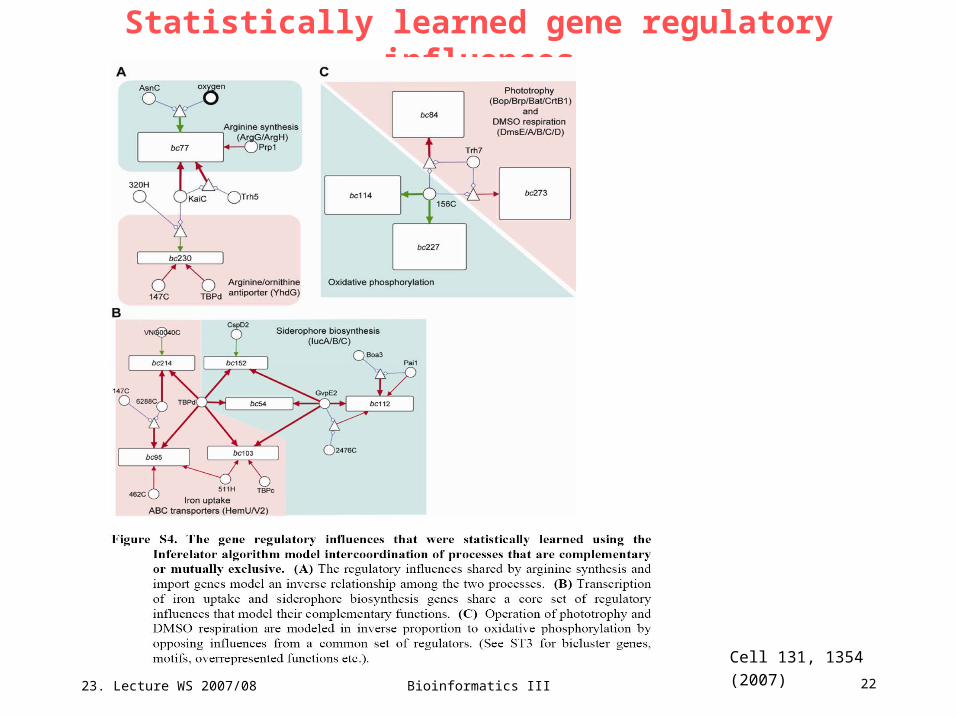
Statistically learned gene regulatory influences
Cell 131, 1354 (2007)
23. Lecture WS 2007/08
Bioinformatics III 23
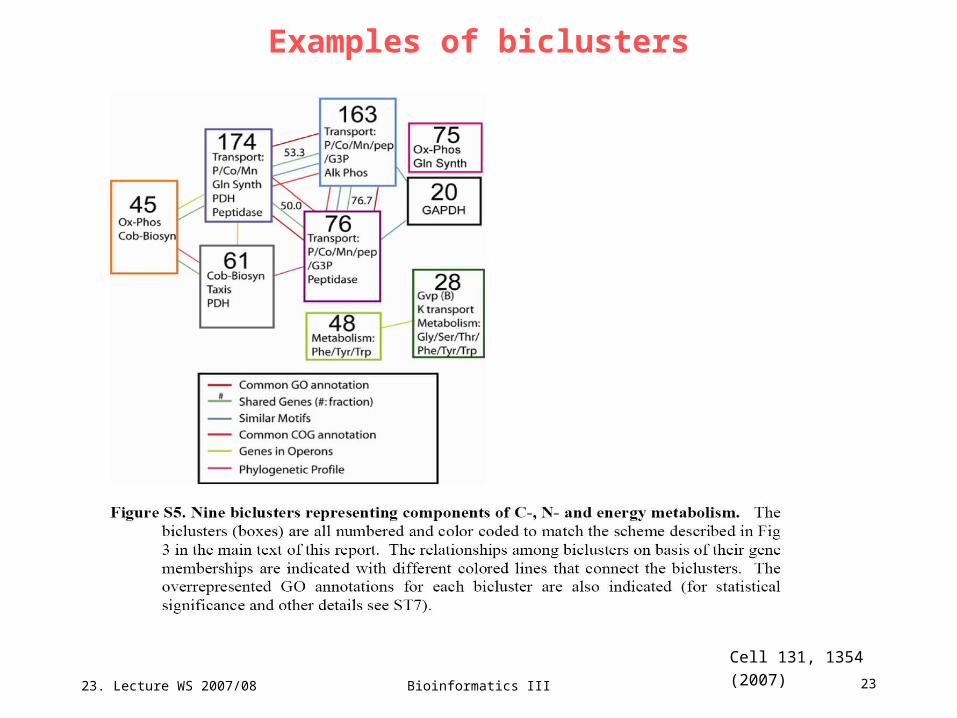
Examples of biclusters
Cell 131, 1354 (2007)
23. Lecture WS 2007/08
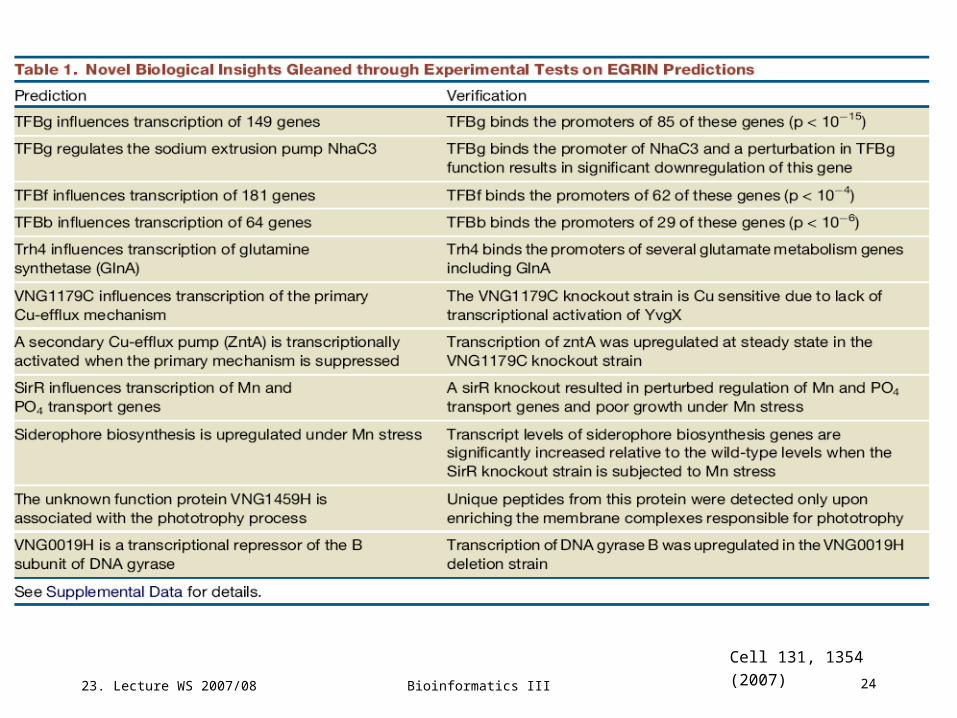
Bioinformatics III 24
Cell 131, 1354 (2007)
23. Lecture WS 2007/08
Bioinformatics III 25
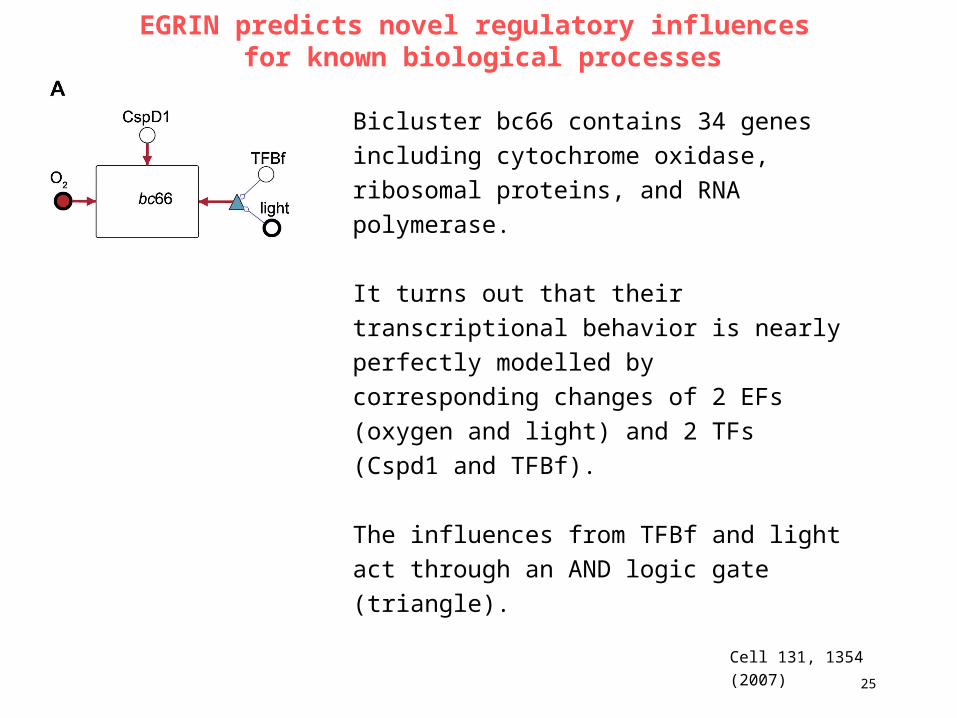
EGRIN predicts novel regulatory influences for known biological processes
Bicluster bc66 contains 34 genes including
cytochrome oxidase, ribosomal proteins, and
RNA polymerase.
It turns out that their transcriptional behavior is
nearly perfectly modelled by corresponding
changes of 2 EFs (oxygen and light) and 2
TFs (Cspd1 and TFBf).
The influences from TFBf and light act through
an AND logic gate (triangle).
Cell 131, 1354 (2007)
23. Lecture WS 2007/08
Bioinformatics III 26
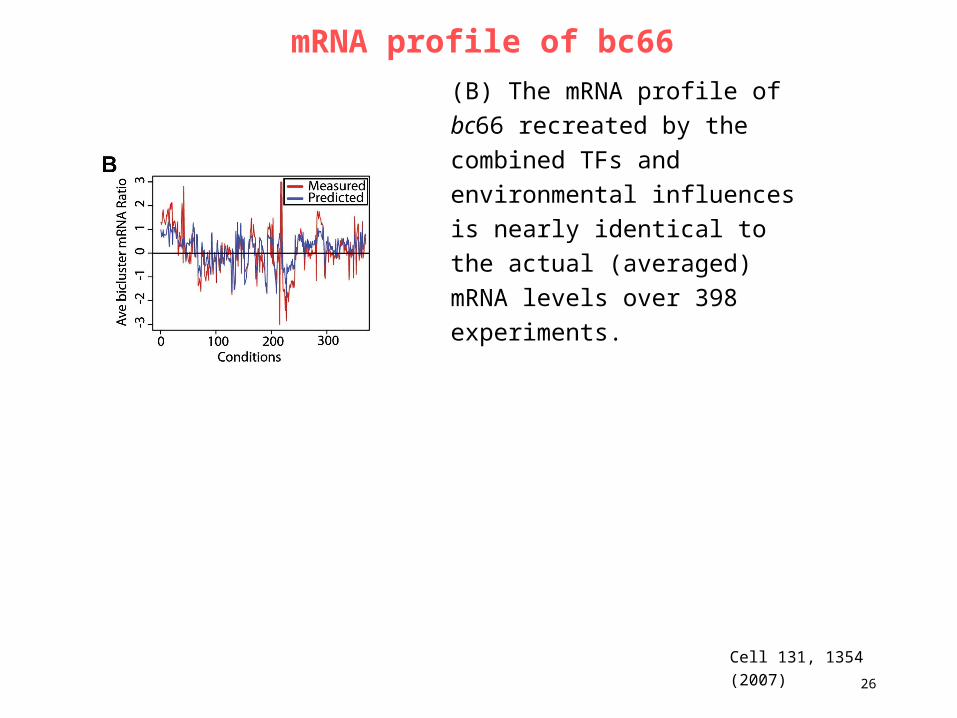
mRNA profile of bc66
Cell 131, 1354 (2007)
(B) The mRNA profile of bc66
recreated by the combined TFs
and environmental influences is
nearly identical to the actual
(averaged) mRNA levels over 398
experiments.
23. Lecture WS 2007/08
Bioinformatics III 27
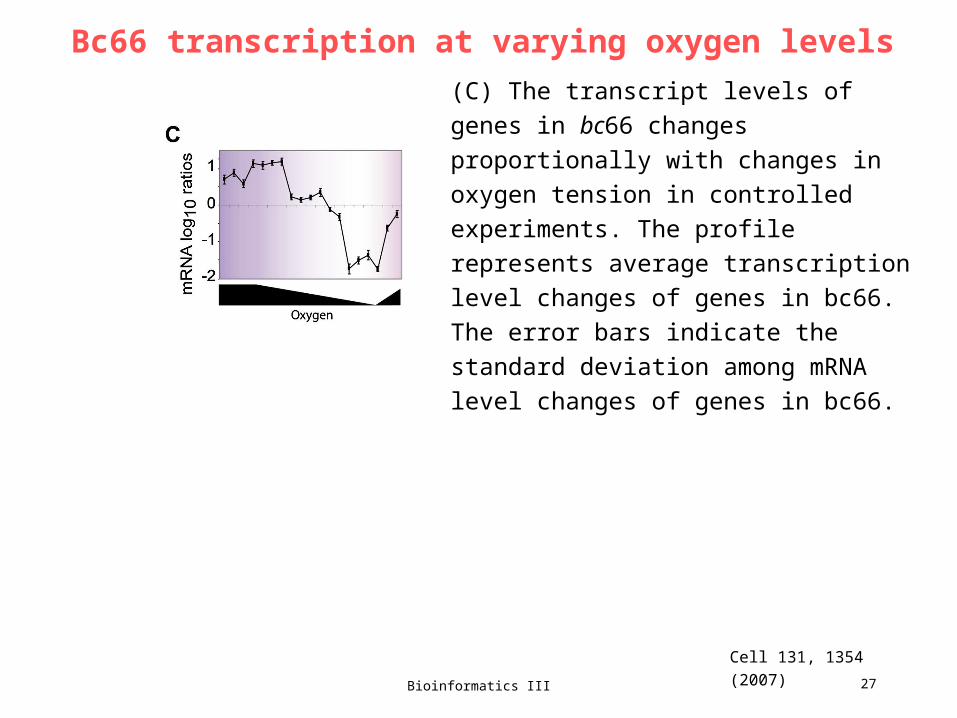
Bc66 transcription at varying oxygen levels
Cell 131, 1354 (2007)
(C) The transcript levels of genes in bc66
changes proportionally with changes in
oxygen tension in controlled experiments.
The profile represents average transcription
level changes of genes in bc66. The error
bars indicate the standard deviation among
mRNA level changes of genes in bc66.
23. Lecture WS 2007/08
Bioinformatics III 28
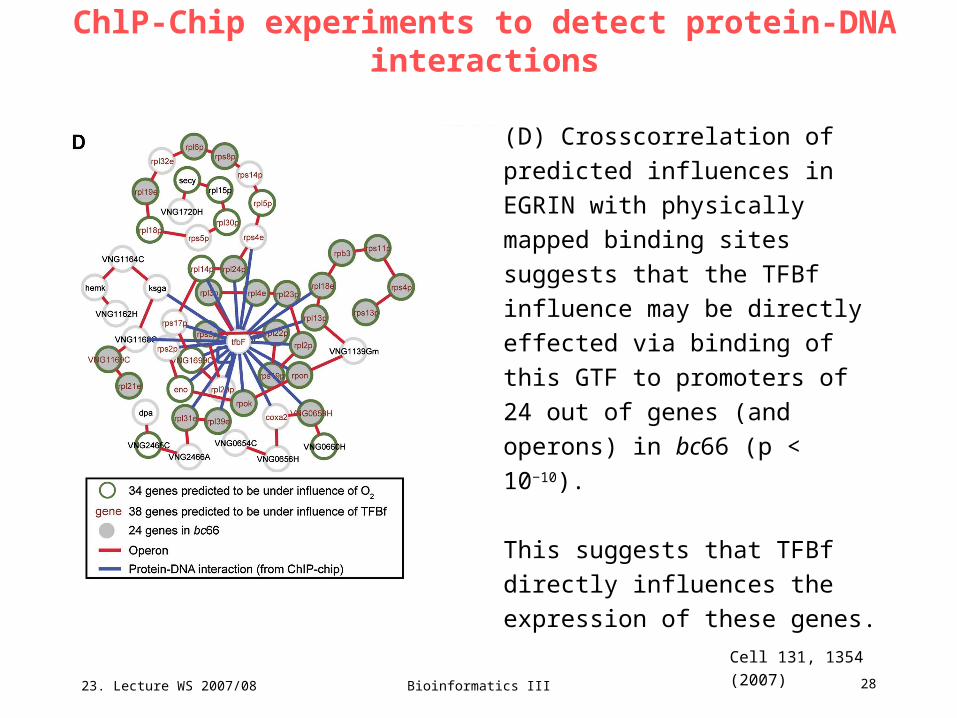
ChlP-Chip experiments to detect protein-DNA interactions
(D) Crosscorrelation of predicted
influences in EGRIN with physically
mapped binding sites suggests that
the TFBf influence may be directly
effected via binding of this GTF to
promoters of 24 out of genes (and
operons) in bc66 (p < 10−10).
This suggests that TFBf directly
influences the expression of these
genes.
Cell 131, 1354 (2007)
23. Lecture WS 2007/08
Bioinformatics III 29
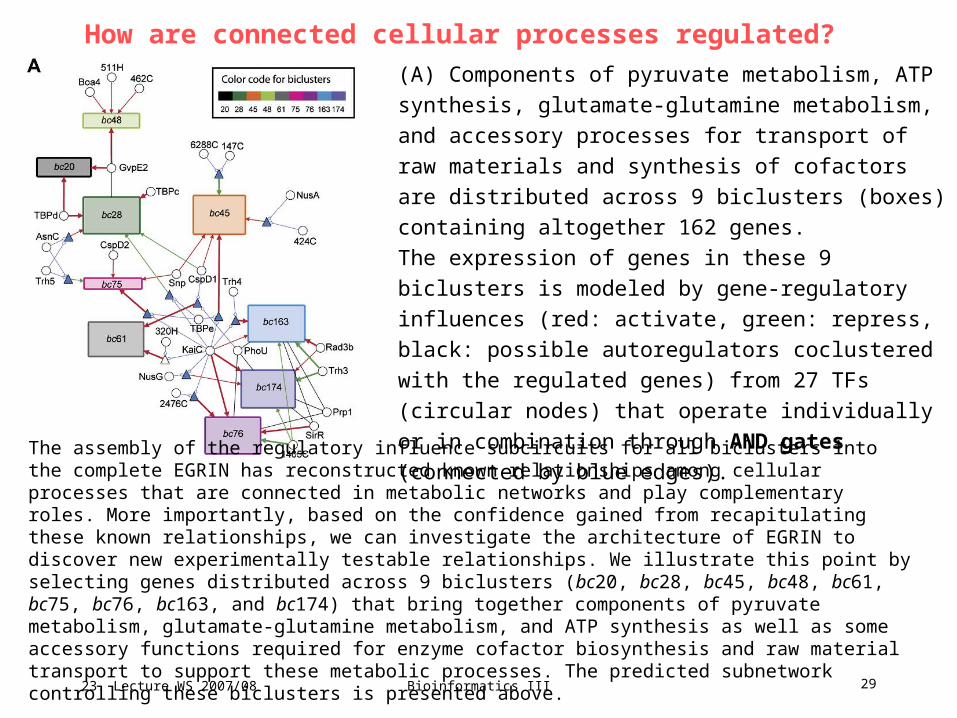
How are connected cellular processes regulated?
(A) Components of pyruvate metabolism, ATP synthesis,
glutamate-glutamine metabolism, and accessory
processes for transport of raw materials and synthesis of
cofactors are distributed across 9 biclusters (boxes)
containing altogether 162 genes.
The expression of genes in these 9 biclusters is modeled
by gene-regulatory influences (red: activate, green:
repress, black: possible autoregulators coclustered with
the regulated genes) from 27 TFs (circular nodes) that
operate individually or in combination through AND gates
(connected by blue edges).
The assembly of the regulatory influence subcircuits for all biclusters into the complete EGRIN has reconstructed known relationships among cellular processes that are connected in metabolic networks and play complementary roles. More importantly, based on the confidence gained from recapitulating these known relationships, we can investigate the architecture of EGRIN to discover new experimentally testable relationships. We illustrate this point by selecting genes distributed across 9 biclusters (bc20, bc28, bc45, bc48, bc61, bc75, bc76, bc163, and bc174) that bring together components of pyruvate metabolism, glutamate-glutamine metabolism, and ATP synthesis as well as some accessory functions required for enzyme cofactor biosynthesis and raw material transport to support these metabolic processes. The predicted subnetwork controlling these biclusters is presented above.

23. Lecture WS 2007/08
Bioinformatics III 30
Reconstruction of metabolic pathways(B) Metabolic pathways were
reconstructed on the basis of known
and putative functions of genes in the 9
biclusters.
Memberships of various enzymes or
enzyme subunits in each of the 9
biclusters in (A) are indicated with
color-coded bars next to each step in
the metabolic pathway (see key in
panel A for interpreting this color code).
23. Lecture WS 2007/08
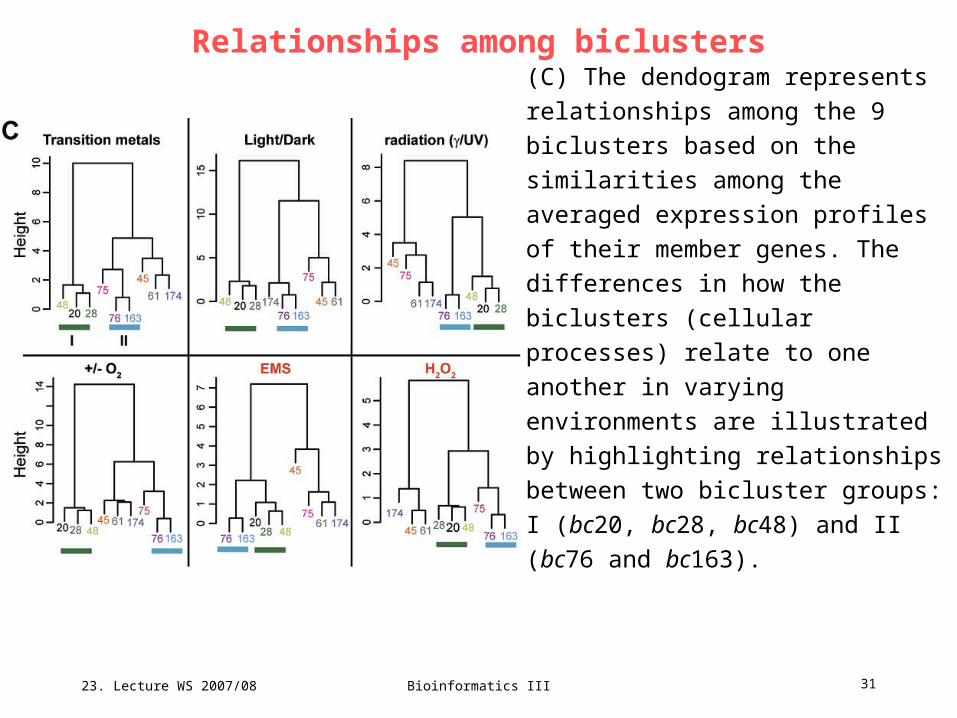
Bioinformatics III 31
Relationships among biclusters(C) The dendogram represents
relationships among the 9 biclusters
based on the similarities among the
averaged expression profiles of their
member genes. The differences in how
the biclusters (cellular processes) relate
to one another in varying environments
are illustrated by highlighting
relationships between two bicluster
groups: I (bc20, bc28, bc48) and II
(bc76 and bc163).

23. Lecture WS 2007/08
Bioinformatics III 32
Temporal changes of the network architecture(D) The incorporation of weighted regulatory
influences with an associated time constant
into EGRIN enables the architecture of the
network to change with the environment. As
a consequence of this, despite environment-
specified differences in relationships among
cellular processes (C) the same set of
regulatory influences acting on each
bicluster accurately models the averaged
transcriptional changes of its constituent
genes even for responses to new EF
perturbations (for example, responses to
EMS and H2O2).
Each of the nine graphs shows profiles of
predicted versus measured transcript level
changes in each individual bicluster in
environmental responses that were part of
the training set as well as 147 completely
new experiments.
23. Lecture WS 2007/08
Bioinformatics III 33
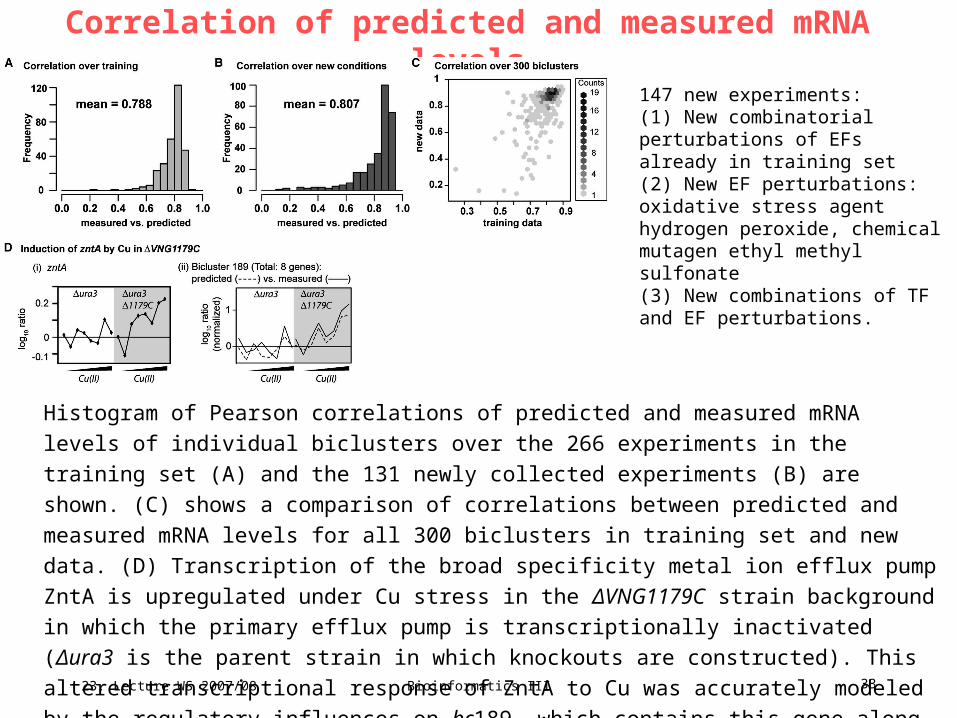
Correlation of predicted and measured mRNA levels
Histogram of Pearson correlations of predicted and measured mRNA levels of individual
biclusters over the 266 experiments in the training set (A) and the 131 newly collected
experiments (B) are shown. (C) shows a comparison of correlations between predicted and
measured mRNA levels for all 300 biclusters in training set and new data. (D) Transcription of
the broad specificity metal ion efflux pump ZntA is upregulated under Cu stress in the
ΔVNG1179C strain background in which the primary efflux pump is transcriptionally inactivated
(Δura3 is the parent strain in which knockouts are constructed). This altered transcriptional
response of ZntA to Cu was accurately modeled by the regulatory influences on bc189, which
contains this gene along with 7 other genes.
147 new experiments:(1) New combinatorial perturbations of EFs already in training set(2) New EF perturbations: oxidative stress agent hydrogen peroxide, chemical mutagen ethyl methyl sulfonate(3) New combinations of TF and EF perturbations.
23. Lecture WS 2007/08
Bioinformatics III 34
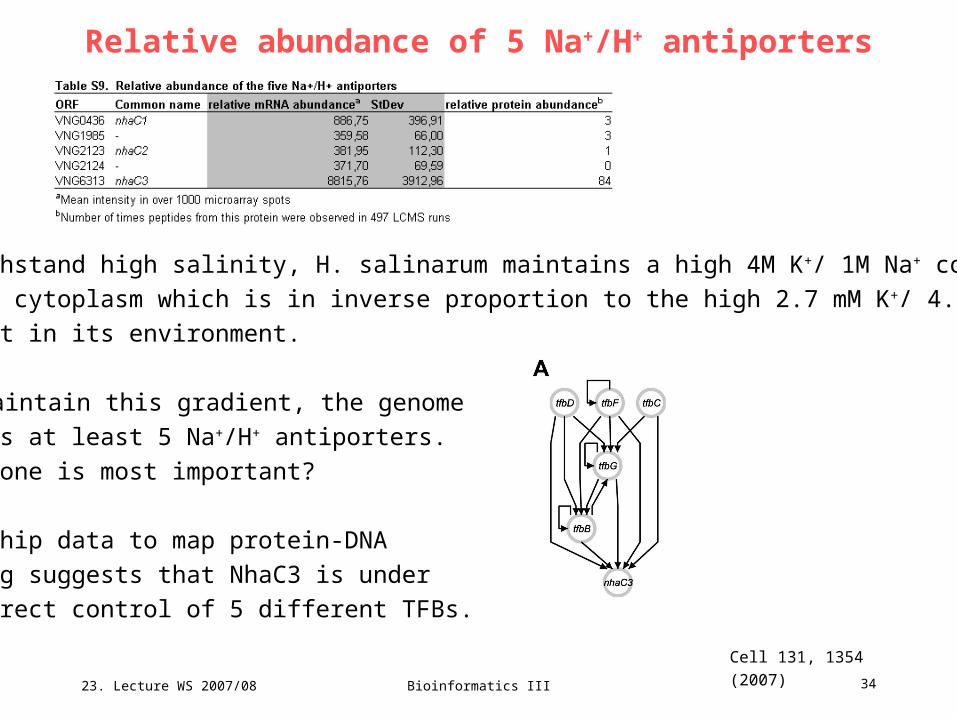
Relative abundance of 5 Na+/H+ antiporters
Cell 131, 1354 (2007)
To withstand high salinity, H. salinarum maintains a high 4M K+/ 1M Na+ content
in its cytoplasm which is in inverse proportion to the high 2.7 mM K+/ 4.3 M Na+
content in its environment.
To maintain this gradient, the genome
encodes at least 5 Na+/H+ antiporters.
Which one is most important?
ChlP-chip data to map protein-DNA
binding suggests that NhaC3 is under
the direct control of 5 different TFBs.
23. Lecture WS 2007/08
Bioinformatics III 35
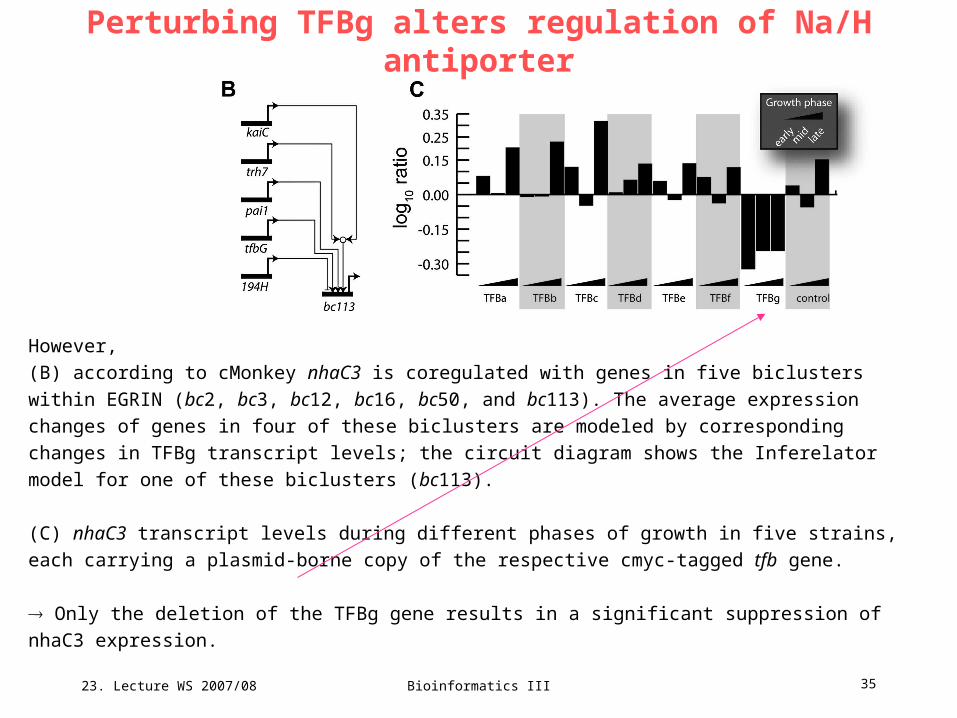
However,
(B) according to cMonkey nhaC3 is coregulated with genes in five biclusters within EGRIN (bc2, bc3, bc12,
bc16, bc50, and bc113). The average expression changes of genes in four of these biclusters are modeled
by corresponding changes in TFBg transcript levels; the circuit diagram shows the Inferelator model for
one of these biclusters (bc113).
(C) nhaC3 transcript levels during different phases of growth in five strains, each carrying a plasmid-borne
copy of the respective cmyc-tagged tfb gene.
Only the deletion of the TFBg gene results in a significant suppression of nhaC3 expression.
Perturbing TFBg alters regulation of Na/H antiporter
23. Lecture WS 2007/08
Bioinformatics III 36
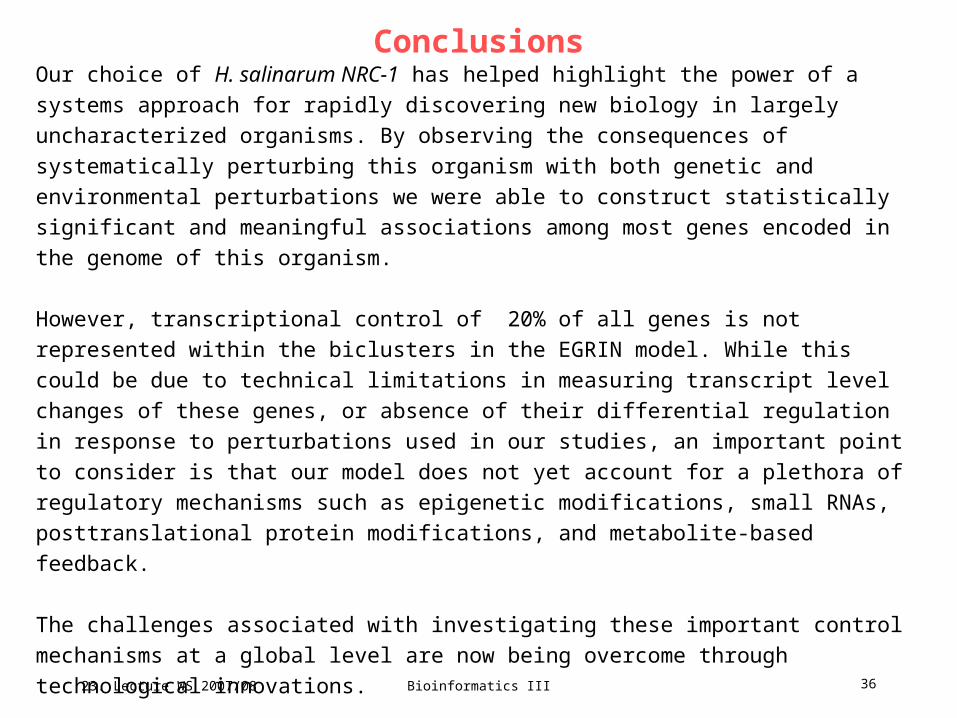
ConclusionsOur choice of H. salinarum NRC-1 has helped highlight the power of a systems approach for
rapidly discovering new biology in largely uncharacterized organisms. By observing the
consequences of systematically perturbing this organism with both genetic and environmental
perturbations we were able to construct statistically significant and meaningful associations
among most genes encoded in the genome of this organism.
However, transcriptional control of 20% of all genes is not represented within the biclusters in
the EGRIN model. While this could be due to technical limitations in measuring transcript level
changes of these genes, or absence of their differential regulation in response to
perturbations used in our studies, an important point to consider is that our model does not yet
account for a plethora of regulatory mechanisms such as epigenetic modifications, small
RNAs, posttranslational protein modifications, and metabolite-based feedback.
The challenges associated with investigating these important control mechanisms at a global
level are now being overcome through technological innovations.
Our approach to regulatory network inference is extensible to incorporate these new data
types and model their associated control mechanisms to eventually completely model the
entire regulatory circuit in this archaeon.
23. Lecture WS 2007/08
Bioinformatics III 37
ConclusionsIt took < 6 years to move from genome sequence to this level of understanding for a relatively
poorly studied organism. It would now be significantly quicker to implement the same approach
with a newly sequenced organism given that much of the scientific methods including
experimental procedures, algorithms, and software have been delineated through our study.
Will the potential for enormous complexity of a biological system will ever allow the construction
of a complete model of a cell? In this regard it has been favorably suggested, at least in the
context of metabolism, that despite this potential for complexity, a cell usually functions in one of
few dominant modes or states. We speculate that this natural property of a biological system
simplifies the problem to inferring gene regulatory models for its transitions among relatively few
states. In addition, as discussed earlier, the extensive connectivity within EF and biological
networks makes it tractable to effectively construct a comprehensive model of cellular responses
to changes in multiple EFs from a modest number of well-designed systematic perturbation
experiments.
We believe that this type of a model will hold true for environmental responses of all organisms
and, more importantly, that it should be possible to construct such models solely from EF
perturbation experiments. This will be especially valuable in context of organisms that currently
lack tools for genetic analysis.


![Microbial mobilization of rare earth elements (REE) from ......salinarum, Pseudomonas fluorescens, and Bacillus subtilis [12,13]. Recently published work demonstrated sorption of REE](https://static.fdocuments.us/doc/165x107/6103a0ca213b7d475057bfbf/microbial-mobilization-of-rare-earth-elements-ree-from-salinarum-pseudomonas.jpg)