23 June 2003 4:30 PM Session 2: Mesoscale Predictability I; 10th Mesoscale Conference; Portland, OR...
31
23 June 2003 4:30 PM 23 June 2003 4:30 PM Session 2: Mesoscale Predictability I; 10th Mesoscale Conference; Por Session 2: Mesoscale Predictability I; 10th Mesoscale Conference; Por tland, OR tland, OR Toward Short-Range Ensemble Prediction of Mesoscale Forecast Skill Eric P. Grimit Clifford F. Mass University of Washington Supported by: NWS Western Region/UCAR-COMET Student-Career Experience Program (SCEP) DoD Multi-Disciplinary University Research Initiative (MURI)
-
Upload
tiffany-dean -
Category
Documents
-
view
216 -
download
0
Transcript of 23 June 2003 4:30 PM Session 2: Mesoscale Predictability I; 10th Mesoscale Conference; Portland, OR...
23 June 2003 4:30 PM23 June 2003 4:30 PM Session 2: Mesoscale Predictability I; 10th Mesoscale Conference; Portland, ORSession 2: Mesoscale Predictability I; 10th Mesoscale Conference; Portland, OR
Toward Short-Range Ensemble Prediction of Mesoscale Forecast Skill
Eric P. GrimitClifford F. Mass
University of Washington
Supported by:NWS Western Region/UCAR-COMET Student-Career Experience Program (SCEP)
DoD Multi-Disciplinary University Research Initiative (MURI)

23 June 2003 4:30 PM23 June 2003 4:30 PM Session 2: Mesoscale Predictability I; 10th Mesoscale Conference; Portland, ORSession 2: Mesoscale Predictability I; 10th Mesoscale Conference; Portland, OR
Forecasting Forecast Error
Like any other scientific prediction or measurement, weather forecasts should be accompanied by error bounds, or a statement of uncertainty.
Forecast error changes from day-to-day,
and is dependent on:Atmospheric predictability – a function of
the sensitivity of the flow to:Magnitude/orientation of initial state errors
Numerical model errors / deficiencies
T2m = 3 °C ± 2 °C P(T2m < 0 °C) = 6.7 %

23 June 2003 4:30 PM23 June 2003 4:30 PM Session 2: Mesoscale Predictability I; 10th Mesoscale Conference; Portland, ORSession 2: Mesoscale Predictability I; 10th Mesoscale Conference; Portland, OR
Operational forecasters need this crucial information to know how much to trust model forecast guidance
Current uncertainty knowledge is partial, and largely subjective
End users could greatly benefit from knowing the expected forecast reliability
Allows sophisticated users to make optimal decisions in the face of uncertainty (economic cost-loss or utility)
Common users of weather forecasts – confidence index
Value of Forecast Error Prediction
ShowersLow 46°FHigh 54°F
FRI
88
AM ShowersLow 47°FHigh 57°F
SAT
55
Take protective action if: P(T2m < 0 °C) > cost/loss

23 June 2003 4:30 PM23 June 2003 4:30 PM Session 2: Mesoscale Predictability I; 10th Mesoscale Conference; Portland, ORSession 2: Mesoscale Predictability I; 10th Mesoscale Conference; Portland, OR
Probabilistic Weather Forecasts
One approach to estimating forecast uncertainty is to use a collection of different forecasts—an ensemble.
Ensemble weather forecasting diagnoses the sensitivity of the predicted flow to initial-state and model errors—provided they are well-sampled.
e
a
uc
j
tg
n
2 1 0 1 2 34
2
0
2
4
6
7
-2.96564
Core ,i 2
Cent ,1 2
32.5 ,Core ,i 1 Cent ,1 1
MM
TT
TT
12hforecast
36hforecast
24hforecast

23 June 2003 4:30 PM23 June 2003 4:30 PM Session 2: Mesoscale Predictability I; 10th Mesoscale Conference; Portland, ORSession 2: Mesoscale Predictability I; 10th Mesoscale Conference; Portland, OR
Probabilistic Weather Forecasts
Agreement/disagreement among ensemble member forecasts provides information about forecast certainty/uncertainty.
agreement disagreement
better forecast worse forecast
reliability reliability
use ensemble forecast variance as a predictor of forecast error

23 June 2003 4:30 PM23 June 2003 4:30 PM Session 2: Mesoscale Predictability I; 10th Mesoscale Conference; Portland, ORSession 2: Mesoscale Predictability I; 10th Mesoscale Conference; Portland, OR
Observed Error Predictions: A Disappointment
[c.f. Goerss 2000] [c.f. Hou et al. 2001][c.f. Hamill and Colucci 1998]
Tropical Cyclone Tracks SAMEX ’98 SREFsNCEP SREF Precipitation
Highly scattered relationship, thus low correlations
[c.f. Grimit and Mass 2002]
UW MM5 SREF 10-m Wind Direction
•Unique 5-member short-range ensemble developed in 2000 showed promise•Spread-error correlations near 0.6, higher for cases with extreme spread

23 June 2003 4:30 PM23 June 2003 4:30 PM Session 2: Mesoscale Predictability I; 10th Mesoscale Conference; Portland, ORSession 2: Mesoscale Predictability I; 10th Mesoscale Conference; Portland, OR
Definition of forecast errorError metric – user-dependencySpecifics of the forecast verification approach
Day-to-day forecast spread variability
An accurately forecast probability distribution is requiredIn practice, the PDF is not well forecast
Unaccounted for sources of uncertainty• Sub-grid scale processes
Under-sampling (distribution tails not well captured)Systematic forecast biases
Must find ways to extract flow-dependent uncertainty information from current (suboptimal) ensembles
Why Forecast Error Prediction is Limited
1- exp(-2)2(,|E|) = ; =std(ln )
2 1-exp(-2)2

23 June 2003 4:30 PM23 June 2003 4:30 PM Session 2: Mesoscale Predictability I; 10th Mesoscale Conference; Portland, ORSession 2: Mesoscale Predictability I; 10th Mesoscale Conference; Portland, OR
Project Goal
Develop a short-range forecast error prediction system using an imperfect mesoscale ensemble
short-range = 0 – 48 h
imperfect = suboptimal; cannot correctly forecast the true PDF
Estimate the upper-bound of forecast error predictability using a simple statistical model
Use existing UW MM5 SREF system – a unique resourceInitialized using an international collection of large-scale analysesSpatial resolution (12-km grid spacing)
Include spatially- and temporally-dependent forecast bias correction
Use temporal ensemble spread as a secondary predictor of forecast error, if viable
Test a variety of metrics of spread and error

23 June 2003 4:30 PM23 June 2003 4:30 PM Session 2: Mesoscale Predictability I; 10th Mesoscale Conference; Portland, ORSession 2: Mesoscale Predictability I; 10th Mesoscale Conference; Portland, OR
STD-AEM correlation STD-RMS correlationSimple Statistical Model Spread-Error Correlations
spreadSTD =Standard
Deviation
errorRMS= Root-Mean
Square errorAEM= Absolute Error
of the ensemble Mean

UW’s Ensemble of Ensembles
# of EF Initial Forecast Forecast Name Members Type Conditions Model(s) Cycle Domain
ACME 17 SMMA 8 Ind. Analyses, “Standard” 00Z 36km, 12km1 Centroid, MM58 Mirrors
ACMEcore 8 SMMA Independent “Standard” 00Z 36km, 12km Analyses MM5
ACMEcore+ 8 PMMA “ “ 8 MM5 00Z 36km, 12km variations
PME 8 MMMA “ “ 8 “native” 00Z, 12Z 36km large-scale
Hom
egro
wn
Impo
rted
ACME: Analysis-Centroid Mirroring Ensemble
PME: Poor Man’s Ensemble MM5: PSU/NCAR Mesoscale Modeling System Version 5
SMMA: Single Model Multi-Analysis
PMMA: Perturbed-model Multi-Analysis
MMMA: Multi-model Multi-Analysis

23 June 2003 4:30 PM23 June 2003 4:30 PM Session 2: Mesoscale Predictability I; 10th Mesoscale Conference; Portland, ORSession 2: Mesoscale Predictability I; 10th Mesoscale Conference; Portland, OR
Verification Data: Surface Observations
Network of surface observations from many different agencies
Observations are preferentially located in lower elevations and near urban centers.
Focus is on 10-m wind direction
More extensive coverage & greater # of reporting sites than SLP.
Greatly influenced by regional orography, mesoscale pressure pattern, and synoptic scale changes.
Systematic forecast biases in the other near-surface variables can dominate stochastic errors.
Will also use temperature and wind speed

ACMEcore Spread-Error Correlations for WDIR
Latest spread-error correlations are lower than in early MM5 ensemble work.
Observed STD-RMS correlations are higher than STD-AEM correlations.
ACMEcore forecast error predictability is comparable to the expected predictability, given a perfect ensemble (with the same spread variability).
Clear diurnal variation—affected by IC & MM5 biases?
Ensemble Size = 8 members
(AVN, CMC, ETA, GASP, JMA, NOGAPS, TCWB, UKMO)
Verification Period: Oct 2002 – Mar 2003(130 cases)
Verification Strategy: Interpolate Model to Observations
Variable: 10-m Wind Direction

ACMEcore+ Spread-Error Correlations for WDIR
Mixed-physics adds some useful spread, increasing spread-error correlations slightly, even though temporal spread variability decreases.
STD-RMS correlations are higher than and improve more than STD-AEM correlations.
Exceedance of expected and idealized correlations may be due to:
Simple model assumptions
Domain-averaging Ensemble Size = 8 members
(PLUS01, PLUS02, PLUS03, PLUS04, PLUS05, PLUS06, PLUS07, PLUS08)
Verification Period: Oct 2002 – Mar 2003(130 cases)
Verification Strategy: Interpolate Model to Observations
Variable: 10-m Wind Direction

23 June 2003 4:30 PM23 June 2003 4:30 PM Session 2: Mesoscale Predictability I; 10th Mesoscale Conference; Portland, ORSession 2: Mesoscale Predictability I; 10th Mesoscale Conference; Portland, OR
Spread-Error Correlations for Temperature
ACMEcore ACMEcore+

23 June 2003 4:30 PM23 June 2003 4:30 PM Session 2: Mesoscale Predictability I; 10th Mesoscale Conference; Portland, ORSession 2: Mesoscale Predictability I; 10th Mesoscale Conference; Portland, OR
Summary
Forecast error predictability depends largely on the definition of error itself.
User-dependent needs
Spread-error correlation is sensitive to the spread and error metrics
For mesoscale wind and temperature forecast errors, the UW MM5 SREF spread appears to be a viable predictor—especially using the multi-analysis, mixed-physics ensemble (ACMEcore+).
Incorporation of a simple method of forecast bias correction is expected to further improve spread-error correlations.
Temporal ensemble spread has not proven to be a consistently skillful secondary predictor of forecast error.

23 June 2003 4:30 PM23 June 2003 4:30 PM Session 2: Mesoscale Predictability I; 10th Mesoscale Conference; Portland, ORSession 2: Mesoscale Predictability I; 10th Mesoscale Conference; Portland, OR
“No forecast is complete without a forecast of forecast skill!”
-- H. Tennekes, 1987
QUESTIONS?
Websitehttp://www.atmos.washington.edu/~emm5rt/ensemble.cgi

23 June 2003 4:30 PM23 June 2003 4:30 PM Session 2: Mesoscale Predictability I; 10th Mesoscale Conference; Portland, ORSession 2: Mesoscale Predictability I; 10th Mesoscale Conference; Portland, OR
Extra Slides

23 June 2003 4:30 PM23 June 2003 4:30 PM Session 2: Mesoscale Predictability I; 10th Mesoscale Conference; Portland, ORSession 2: Mesoscale Predictability I; 10th Mesoscale Conference; Portland, OR
The Original Simple Stochastic Model
Spread-skill correlation depends on the time variation of spread
For constant spread day-to-day ( = 0), = 0
For large spread variability ( ), sqrt(2/) < 0.8
Assumes that E is the ensemble mean error, infinite ensemble
1- exp(-2)2(,|E|) = ; =std(ln )
2 1-exp(-2)2
(Houtekamer 1993)
Spread-Skill Correlation Theory
= ensemble standard deviation(spread)
= temporal spread variability E = ensemble forecast error(skill)

23 June 2003 4:30 PM23 June 2003 4:30 PM Session 2: Mesoscale Predictability I; 10th Mesoscale Conference; Portland, ORSession 2: Mesoscale Predictability I; 10th Mesoscale Conference; Portland, OR
1. Draw today’s “forecast uncertainty” from a log-normal distribution (Houtekamer 1993 model).
ln( ) ~ N( ln(f) ,
2. Create synthetic ensemble forecasts by drawing M values from the “true” distribution (perfect ensemble).
Fi ~ N( Z , ) ; i = 1,2,…,M
3. Draw the verifying observation from the same “true” distribution.
V ~ N( Z , )
4. Calculate ensemble spread and skill using varying metrics.
A Modified Simple Stochastic Model
Stochastically simulated ensemble forecasts at a single grid point with 50,000 realizations (cases)Assume perfect ensemble forecasts
• Assumed Gaussian statistics
• Varied:1) temporal spread
variability (2) finite ensemble
size (M)3) spread and skill
metrics

23 June 2003 4:30 PM23 June 2003 4:30 PM Session 2: Mesoscale Predictability I; 10th Mesoscale Conference; Portland, ORSession 2: Mesoscale Predictability I; 10th Mesoscale Conference; Portland, OR
What Measure of Skill?
STD is a better predictor of the average ensemble member error than of the ensemble mean error.
_
AEM = | E |
___
MAE = | E |
Different measures of ensemble variation in may be required to predict other measures of skill.
spreadSTD =Standard
Deviation
errorRMS= Root-Mean
Square errorMAE= Mean Absolute
ErrorAEM= Absolute Error
of the ensemble Mean
AEC= Absolute Error of a Control

23 June 2003 4:30 PM23 June 2003 4:30 PM Session 2: Mesoscale Predictability I; 10th Mesoscale Conference; Portland, ORSession 2: Mesoscale Predictability I; 10th Mesoscale Conference; Portland, OR
Multi-Analysis, Mixed Physics: ACMEcore+
vertical 36km 12km shallow SSTIC ID# Soil diffusion Cloud Microphysics Domain Domain cumulus Radiation Perturbation Land Use Table
MRF 5-Layer Y Simple Ice Kain-Fritsch Kain-Fritsch N cloud standard standard
avn plus01 MRF LSM Y Simple Ice Kain-Fritsch Kain-Fritsch Y RRTM SST_pert01 LANDUSE.TBL.plus1
cmcg plus02 MRF 5-Layer Y Reisner II (grpl), Skip4 Grell Grell N cloud SST_pert02 LANDUSE.TBL.plus2
eta plus03 Eta 5-Layer N Goddard Betts-Miller Grell Y RRTM SST_pert03 LANDUSE.TBL.plus3
gasp plus04 MRF LSM Y Shultz Betts-Miller Kain-Fritsch N RRTM SST_pert04 LANDUSE.TBL.plus4
jma plus05 Eta LSM N Reisner II (grpl), Skip4 Kain-Fritsch Kain-Fritsch Y cloud SST_pert05 LANDUSE.TBL.plus5
ngps plus06 Blackadar 5-Layer Y Shultz Grell Grell N RRTM SST_pert06 LANDUSE.TBL.plus6
tcwb plus07 Blackadar 5-Layer Y Goddard Betts-Miller Grell Y cloud SST_pert07 LANDUSE.TBL.plus7
ukmo plus08 Eta LSM N Reisner I (mx-phs) Kain-Fritsch Kain-Fritsch N cloud SST_pert08 LANDUSE.TBL.plus8
Perturbations to:
1) Moisture Availability
2) Albedo
3) Roughness Length
ACMEcore+
CumulusPBL
ACME
see Eckel (2003) for further details

Using Lagged-Centroid Forecasts
Advantages:
Run-to-run consistency of the best deterministic forecast estimate of “truth” (without any weighting)
Less sensitive to a single member’s temporal variability
Yields mesoscale spread[equal weighting of lagged forecasts]
Temporal (Lagged) Ensemble
2 1 0 1 2 34
2
0
2
4
6
7
-2.96564
Core ,i 2
Cent ,1 2
32.5 ,Core ,i 1 Cent ,1 1
cT
M
T
Analysis Region
48h forecast Region

23 June 2003 4:30 PM23 June 2003 4:30 PM Session 2: Mesoscale Predictability I; 10th Mesoscale Conference; Portland, ORSession 2: Mesoscale Predictability I; 10th Mesoscale Conference; Portland, OR
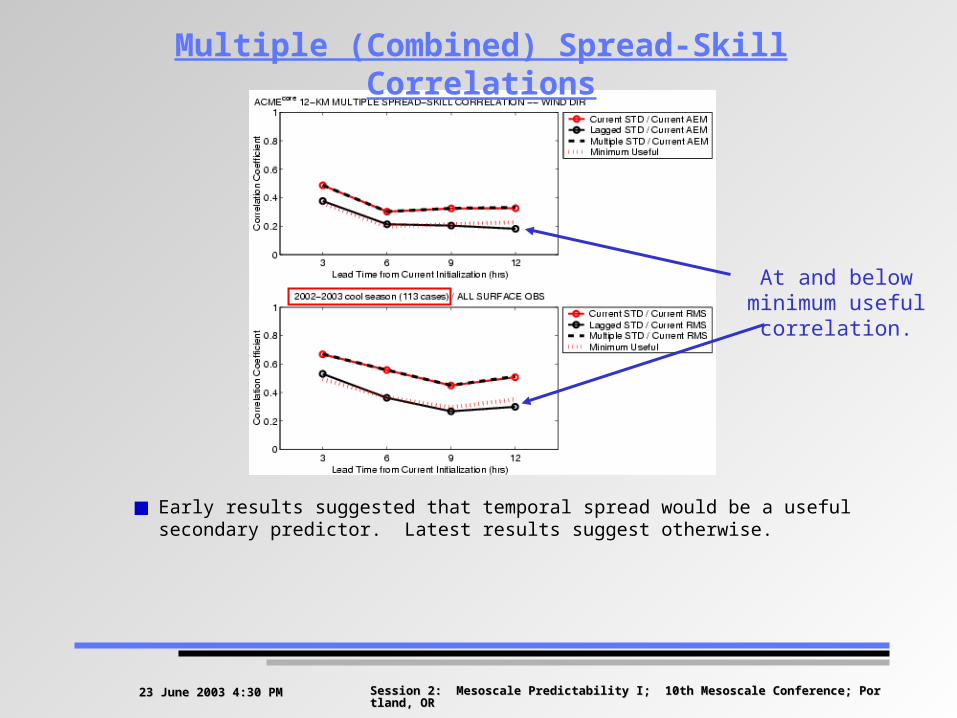
Multiple (Combined) Spread-Skill Correlations
23 June 2003 4:30 PM23 June 2003 4:30 PM Session 2: Mesoscale Predictability I; 10th Mesoscale Conference; Portland, ORSession 2: Mesoscale Predictability I; 10th Mesoscale Conference; Portland, OR
At and below minimum useful correlation.
Multiple (Combined) Spread-Skill Correlations
Early results suggested that temporal spread would be a useful secondary predictor. Latest results suggest otherwise.

23 June 2003 4:30 PM23 June 2003 4:30 PM Session 2: Mesoscale Predictability I; 10th Mesoscale Conference; Portland, ORSession 2: Mesoscale Predictability I; 10th Mesoscale Conference; Portland, OR
Verification Data: Mesoscale Gridded Analysis
Reduced concern about impacts of observational errors on results, if observation and grid-based spread-skill relationships are qualitatively similar.
Use Rapid Update Cycle 20-km (RUC20) analysis as “gridded truth” for MM5 ensemble verification and calibration.
Smooth 12-km MM5 ensemble forecasts to RUC20 grid.
Improved analysis could be used in the future.

23 June 2003 4:30 PM23 June 2003 4:30 PM Session 2: Mesoscale Predictability I; 10th Mesoscale Conference; Portland, ORSession 2: Mesoscale Predictability I; 10th Mesoscale Conference; Portland, OR

23 June 2003 4:30 PM23 June 2003 4:30 PM Session 2: Mesoscale Predictability I; 10th Mesoscale Conference; Portland, ORSession 2: Mesoscale Predictability I; 10th Mesoscale Conference; Portland, OR

23 June 2003 4:30 PM23 June 2003 4:30 PM Session 2: Mesoscale Predictability I; 10th Mesoscale Conference; Portland, ORSession 2: Mesoscale Predictability I; 10th Mesoscale Conference; Portland, OR

TrainingPeriod
Bias-correctedForecast Period
TrainingPeriod
Bias-correctedForecast Period
TrainingPeriod
Bias-correctedForecast Period
N
n nji
tjitji o
f
Nb
1 ,
,,,,
1 N number of forecast cases fi,j,t forecast at location (i, j ) and lead time (t)oi,j verification
1) Calculate bias at every location and lead time using previous forecasts/verifications
2) Post-process current forecast using calculated bias:
tji
tjitji b
ff
,,
,,*,, fi,j,t bias-corrected forecast at location (i, j ) and lead time (t)*
November December January
February March
3 1 1 1 1 1 1 1 1 1 1 2 2 2 2 2 2 2 2 2 2 3 1 1 1 1 1 1 1 1 1 1 2 2 2 2 2 2 2 2 2 2 3 3 1 1 1 1 11 1 2 3 4 5 6 7 8 9 0 1 2 3 4 5 6 7 8 9 0 1 2 3 4 5 6 7 8 9 0 1 2 3 4 5 6 7 8 9 0 1 2 3 4 5 6 7 8 9 0 1 2 3 4 5 6 7 8 9 0 1 1 2 3 4 5 6 7 8 9 0 1 2 3 4
1 1 1 1 1 2 2 2 2 2 2 2 2 2 2 3 3 1 1 1 1 1 1 1 1 1 1 2 2 2 2 2 2 2 2 2 1 1 1 1 1 1 1 1 1 1 2 2 2 2 2 2 2 2 2 25 6 7 8 9 0 1 2 3 4 5 6 7 8 9 0 1 1 2 3 4 5 6 7 8 9 0 1 2 3 4 5 6 7 8 9 0 1 2 3 4 5 6 7 8 1 2 3 4 5 6 7 8 9 0 1 2 3 4 5 6 7 8 9 0 1 2 3 4 5 6 7 8 9
Simple Bias CorrectionOverall goal is to correct the majority of the bias in each member forecast, while using shortest possible training period
Will be performed separately using both observations and the RUC20 analysis as verifications

23 June 2003 4:30 PM23 June 2003 4:30 PM Session 2: Mesoscale Predictability I; 10th Mesoscale Conference; Portland, ORSession 2: Mesoscale Predictability I; 10th Mesoscale Conference; Portland, OR
spreadSTD =Standard DeviationENT*=Statistical EntropyMOD*=Mode Population
errorAEM= Absolute Error of
the ensemble MeanMAE= Mean Absolute
ErrorIGN*= Ignorance
* = binned quantity

23 June 2003 4:30 PM23 June 2003 4:30 PM Session 2: Mesoscale Predictability I; 10th Mesoscale Conference; Portland, ORSession 2: Mesoscale Predictability I; 10th Mesoscale Conference; Portland, OR
spreadSTD =Standard DeviationENT*=Statistical EntropyMOD*=Mode Population
skillSuccess = 0 / 1
* = binned quantity