
.227.1047Y The Astrophysical Journal, 227:1047-1058, 1979 ...
12
197 9ApJ. . .227.1047Y The Astrophysical Journal, 227:1047-1058, 1979 February 1 © 1979. The American Astronomical Society. All rights reserved. Printed in U.S.A. THE SOLAR-CYCLE PERIOD-AMPLITUDE RELATION AS EVIDENCE OF HYSTERESIS OF THE SOLAR-CYCLE NONLINEAR MAGNETIC OSCILLATION AND THE LONG-TERM (55 YEAR) CYCLIC MODULATION Hirokazu Yoshimura* High Altitude Observatory, National Center for Atmospheric Research,f Boulder Received 1978 June 16; accepted 1978 August 11 ABSTRACT A new dynamical model of the solar cycle has predicted that the cycle should have a hysteretic nature: the behavior of each 11 year cycle should depend on previous cycles. In the light of this new understanding of the dynamical mechanism of the solar cycle, Waldmeier’s (hypothetical) law was examined as a yet unexplained characteristic of the cycle by studying the observed sunspot frequency curve. Contrary to this hypothetical law, however, it was found that sunspot cycle curves did not form a single-parameter family characterized by the maximum amplitude of the cycle. The evolutionary trajectories in period-amplitude phase space verified the hysteretic nature of the observed cycle and revealed long-term (55 year instead of the previously claimed 80 year) periodic modulations, called here 55 year grand cycles. Each 55 year grand cycle forms a loop in the phase space, and the characteristics of each 11 year cycle depend on its position in the ascending or descending phase of the grand cycle. This new law was analyzed by the non- linear multiple-period dynamo oscillation model which has predicted the hysteretic nature. The era from cycle 11 to cycle 15 turned out to be an anomalous one characterized by alternating amplitudes for odd and even cycles. Cycles 16-20 seem to constitute one grand cycle. If this is true, cycle 21 would be the beginning of another grand maximum and the model predicts that its duration would be short. Subject headings: hydrodynamics — hydromagnetics — Sun: activity — Sun: sunspots I. INTRODUCTION a) Waldmeier’s {Hypothetical) Law Over the many centuries since sunspots were dis- covered by naked eye and telescope, their frequency of appearance on the solar surface has been recorded and compiled painstakingly by a number of observers. The sunspot relative number, devised by Wolf as a systematic way of recording the sunspot frequency, has been regarded as a good parameter of the overall evolution of the magnetic oscillation of the Sun, i.e., the solar cycle (see Waldmeier 1948, 1961, for his- torical references). From these painstaking daily ob- servations of sunspots, the sunspot frequency curve has been constructed as the time series of the sunspot relative number. As recent development of the dynamo theory has improved our understanding of the dynamics of the solar cycle, the sunspot frequency curve is recognized anew as an important source of information concerning the fluid motions of the solar dynamo as well as concerning the magnetic evolution of the Sun itself. The curve gives us two basic parameters of the oscillation : period and maximum amplitude. A vague relation between these two parameters was noticed * On leave of absence from Department of Astronomy, University of Tokyo. t The National Center for Atmospheric Research is sponsored by the National Science Foundation. by Wolf (1861) as early as the mid-nineteenth century; the shorter the period, the larger the amplitude. But the nature of this relation was not fully understood, nor was its dynamical meaning. In order to understand it empirically, two approaches were taken. The first postulated that integration of the frequency curve over one period—that is, the area of the curve over one cycle—yields a constant, which implies that the total number of sunspots over one cycle is constant for every cycle. This, however, proved to be wrong (Wolf 1877). Soon afterward, a similar relation between the maximum amplitude and time of rise was found (Halm 1902). Since this relation is much clearer than that between period and maximum ampli- tude, Waldmeier (1934a, b) tried to describe the relation by a single formula, assuming a one-to-one correspondence between the two quantities. These two approaches culminated in the study of Waldmeier (1935), who formulated a hypothetical law about characteristics of the sunspot frequency curve: (i) between the maximum amplitude and the time of rise of a cycle, there is a one-to-one relation which can be expressed by mathematical formulae (one formula each for odd- and even-numbered cycles); and (ii) the evolution of the sunspot frequency curve after maximum can be determined uniquely by the maximum amplitude. These two characteristics led him to the conclusion that the family of sunspot frequency curves is a single-parameter family with 1047 © American Astronomical Society • Provided by the NASA Astrophysics Data System
Transcript of .227.1047Y The Astrophysical Journal, 227:1047-1058, 1979 ...
197
9ApJ
. . .
227.
1047
Y
The Astrophysical Journal, 227:1047-1058, 1979 February 1 © 1979. The American Astronomical Society. All rights reserved. Printed in U.S.A.
THE SOLAR-CYCLE PERIOD-AMPLITUDE RELATION AS EVIDENCE OF HYSTERESIS OF THE SOLAR-CYCLE NONLINEAR MAGNETIC OSCILLATION AND THE
LONG-TERM (55 YEAR) CYCLIC MODULATION
Hirokazu Yoshimura* High Altitude Observatory, National Center for Atmospheric Research,f Boulder
Received 1978 June 16; accepted 1978 August 11
ABSTRACT
A new dynamical model of the solar cycle has predicted that the cycle should have a hysteretic nature: the behavior of each 11 year cycle should depend on previous cycles. In the light of this new understanding of the dynamical mechanism of the solar cycle, Waldmeier’s (hypothetical) law was examined as a yet unexplained characteristic of the cycle by studying the observed sunspot frequency curve. Contrary to this hypothetical law, however, it was found that sunspot cycle curves did not form a single-parameter family characterized by the maximum amplitude of the cycle. The evolutionary trajectories in period-amplitude phase space verified the hysteretic nature of the observed cycle and revealed long-term (55 year instead of the previously claimed 80 year) periodic modulations, called here 55 year grand cycles. Each 55 year grand cycle forms a loop in the phase space, and the characteristics of each 11 year cycle depend on its position in the ascending or descending phase of the grand cycle. This new law was analyzed by the non- linear multiple-period dynamo oscillation model which has predicted the hysteretic nature. The era from cycle 11 to cycle 15 turned out to be an anomalous one characterized by alternating amplitudes for odd and even cycles. Cycles 16-20 seem to constitute one grand cycle. If this is true, cycle 21 would be the beginning of another grand maximum and the model predicts that its duration would be short. Subject headings: hydrodynamics — hydromagnetics — Sun: activity — Sun: sunspots
I. INTRODUCTION
a) Waldmeier’s {Hypothetical) Law
Over the many centuries since sunspots were dis- covered by naked eye and telescope, their frequency of appearance on the solar surface has been recorded and compiled painstakingly by a number of observers. The sunspot relative number, devised by Wolf as a systematic way of recording the sunspot frequency, has been regarded as a good parameter of the overall evolution of the magnetic oscillation of the Sun, i.e., the solar cycle (see Waldmeier 1948, 1961, for his- torical references). From these painstaking daily ob- servations of sunspots, the sunspot frequency curve has been constructed as the time series of the sunspot relative number. As recent development of the dynamo theory has improved our understanding of the dynamics of the solar cycle, the sunspot frequency curve is recognized anew as an important source of information concerning the fluid motions of the solar dynamo as well as concerning the magnetic evolution of the Sun itself.
The curve gives us two basic parameters of the oscillation : period and maximum amplitude. A vague relation between these two parameters was noticed
* On leave of absence from Department of Astronomy, University of Tokyo.
t The National Center for Atmospheric Research is sponsored by the National Science Foundation.
by Wolf (1861) as early as the mid-nineteenth century; the shorter the period, the larger the amplitude. But the nature of this relation was not fully understood, nor was its dynamical meaning. In order to understand it empirically, two approaches were taken. The first postulated that integration of the frequency curve over one period—that is, the area of the curve over one cycle—yields a constant, which implies that the total number of sunspots over one cycle is constant for every cycle. This, however, proved to be wrong (Wolf 1877). Soon afterward, a similar relation between the maximum amplitude and time of rise was found (Halm 1902). Since this relation is much clearer than that between period and maximum ampli- tude, Waldmeier (1934a, b) tried to describe the relation by a single formula, assuming a one-to-one correspondence between the two quantities.
These two approaches culminated in the study of Waldmeier (1935), who formulated a hypothetical law about characteristics of the sunspot frequency curve: (i) between the maximum amplitude and the time of rise of a cycle, there is a one-to-one relation which can be expressed by mathematical formulae (one formula each for odd- and even-numbered cycles); and (ii) the evolution of the sunspot frequency curve after maximum can be determined uniquely by the maximum amplitude. These two characteristics led him to the conclusion that the family of sunspot frequency curves is a single-parameter family with
1047
© American Astronomical Society • Provided by the NASA Astrophysics Data System

197
9ApJ
. . .
227.
1047
Y
1048 YOSHIMURA
maximum amplitude as the parameter. As secondary characteristics, he claimed that (1) the area below the sunspot frequency curve from minimum to maximum is constant, while the area from maximum to minimum is proportional to the maximum amplitude of the cycle, and (2) the ratio of time of rise to time of fall is a monotonie function of the maximum amplitude and tends toward 1 as the amplitude becomes smaller. This view concerning the basic nature of the solar cycle persisted for a long time (see, e.g., de Jager 1959; Waldmeier 1955).
This law was guided by Waldmeier’s “eruption hypothesis,” which was developed in response to the “superposition hypothesis” of Wolf (1859, 1877; Korteweg 1883). The latter was an endeavor to repre- sent the sunspot frequency curve by a small number of sinusoidal curves and thus was related to a Fourier expansion of the curve. The former, on the contrary, regarded the basic oscillation component of the curve as nonsinusoidal because the eruptive nature of solar activity could deform the shape of the basic oscillation component. Although Wolf’s hypothesis did not hold true, the same way of thinking still exists; it is exempli- fied by power spectrum analysis of the sunspot fre- quency curve in attempts to detect oscillation components other than that of 11 years. However, as the arguments implied by Waldmeier’s “eruption hypothesis” show, deformation of the curve of the basic oscillation component would give rise to false components if the curve were analyzed by Fourier (or power spectrum) methods. Hence true under- standing of the long-term modulation of the basic 11 year cycle should be based on some method other than power spectrum analysis.
Waldmeier’s study concerned two fundamental properties of the solar cycle, i.e., the basic profile of one cycle, especially its period-amplitude relation, and the long-term behavior of the solar cycle. The purposes of this paper are to analyze these properties in the light of modern understanding of the basic dynamo mechanism by which the solar cycle is driven in the solar convection zone and to propose a new way of looking at the sunspot frequency curve.
b) Dynamical Understandings of the Mechanism of the Solar Cycle
According to the recently developed dynamical theory of the solar cycle driven by global convection and differential rotation (Yoshimura 1972, 1975a, 6, 1978a, fe, c), the period of the solar cycle is related to the strength (speed) of the dynamo process, which, in turn, is related to the magnitude of the gradient of differential rotation, the magnitude of the global convection, and the speed of rotation which deforms the flow of the convection. The amplitude of the oscillation, on the other hand, is determined by a nonlinear process which limits the amplitude of the oscillation. In the case of the Sun, two possible candidates for this nonlinear process have been proposed. One is the eruption of the magnetic field from the system, which takes place only when the
field strength exceeds some critical value (Yoshimura 1975a). The other is the nonlinear effect of the mag- netic field on the dynamo process (Yoshimura 1978a, è, c). The former is now regarded as respon- sible mainly for the profile of the sunspot curve within one cycle (Yoshimura 1975a), and the latter as respon- sible for the long-term evolution of the envelope of the oscillation. Both processes thus are important for understanding the mechanism of the solar cycle and will be discussed in §§ III, IV, and V.
Recently a nonlinear dynamo model was studied that can simulate a long-term, periodic modulation of the basic 11 year oscillation (Yoshimura 1978c). According to this dynamo theory, the period, as well as the amplitude, is not constant in time. It is also closely related to the phase of the long-term modula- tion. In other words, the period and the amplitude are closely related to each other. One of the intriguing aspects of the relation is that it is not a one-to-one relation. Rather it depends on whether the cycle under consideration is in the ascending or the descend- ing phase of the long-term modulation. More spe- cifically, the period should be short (long) in the ascending (descending) phase, while amplitude may be the same in both phases. Thus the sunspot curves should not be a single-parameter family uniquely characterized by the amplitude. This contradicts Waldmeier’s law.
II. HYSTERESIS TRAJECTORY IN A PERIOD-AMPLITUDE DIAGRAM OF THE SOLAR CYCLE
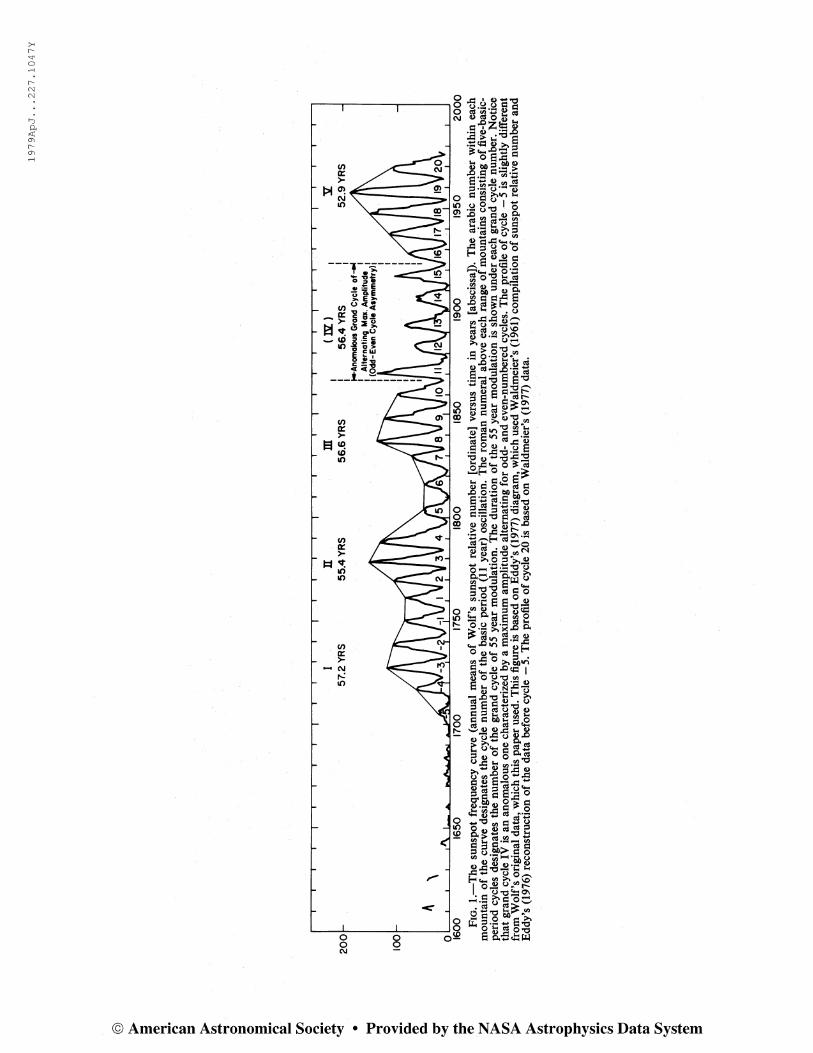
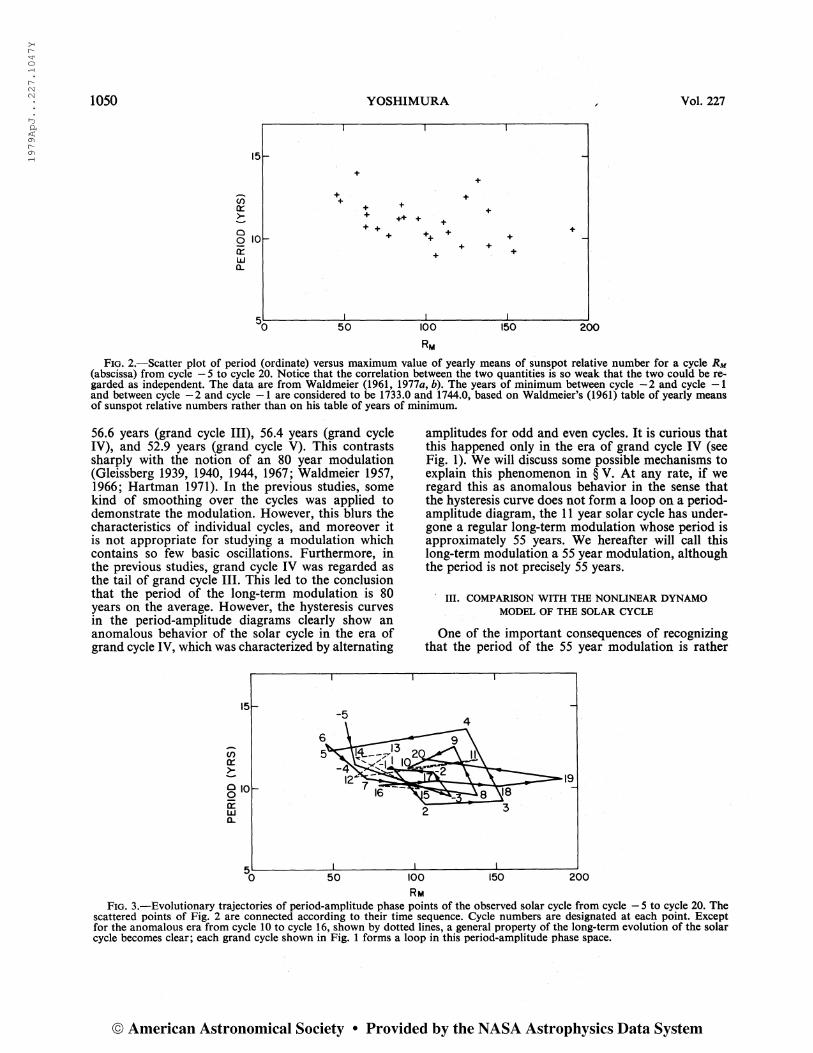
Under circumstances such as those described in § I, we examine the original sunspot frequency curve, which is shown in Figure 1. Figure 2 is a scatter plot of the period and amplitude of the curve from cycle — 5 to cycle 20. (The cycle before cycle 1 is designated as cycle — 1 for convenience.) The scatter is large and there seems to be no simple relation between the two. Waldmeier (1935), instead of analyzing this relation directly, concentrated on the relation between the time of rise and the amplitude, which has a better correlation (§IV). However, when we examine the time sequence and trajectory of points in the period- amplitude diagram, a basic property of the long-term evolution of the solar cycle appears clearly. The first step in depicting this property is shown in Figure 3. The time sequence is shown by connecting consecutive points. The trajectories from cycle —5 to cycle 10 and from cycle 16 to cycle 20 are indicated by broad lines to stress the basic feature. Then the charac- teristics of the long-term evolution emerge. When the cycle ascends to a grand maximum of the long-term modulation, the period becomes shorter. After the maximum, the period becomes longer. Thus the period is longer in the descending phase than in the ascending phase of the modulation. This situation is more clearly described in Figure 4, where each modulation is separated from the others.
One of the striking features of Figure 4 is that each modulation, which we call a grand cycle here- after, has an approximately constant time interval: 57.2 years (grand cycle I), 55.4 years (grand cycle II),
© American Astronomical Society • Provided by the NASA Astrophysics Data System
197
9ApJ
. . .
227.
1047
Y
American Astronomical Society • Provided by the NASA Astrophysics Data System
197
9ApJ
. . .
227.
1047
Y
1050 YOSHIMURA Vol. 227
Rm Fig. 2.—Scatter plot of period (ordinate) versus maximum value of yearly means of sunspot relative number for a cycle RM
(abscissa) from cycle — 5 to cycle 20. Notice that the correlation between the two quantities is so weak that the two could be re- garded as independent. The data are from Waldmeier (1961, 1911 a, £). The years of minimum between cycle —2 and cycle — 1 and between cycle —2 and cycle — 1 are considered to be 1733.0 and 1744.0, based on Waldmeier’s (1961) table of yearly means of sunspot relative numbers rather than on his table of years of minimum.
56.6 years (grand cycle III), 56.4 years (grand cycle IV), and 52.9 years (grand cycle V). This contrasts sharply with the notion of an 80 year modulation (Gleissberg 1939, 1940, 1944, 1967 ; Waldmeier 1957, 1966; Hartman 1971). In the previous studies, some kind of smoothing over the cycles was applied to demonstrate the modulation. However, this blurs the characteristics of individual cycles, and moreover it is not appropriate for studying a modulation which contains so few basic oscillations. Furthermore, in the previous studies, grand cycle IV was regarded as the tail of grand cycle III. This led to the conclusion that the period of the long-term modulation is 80 years on the average. However, the hysteresis curves in the period-amplitude diagrams clearly show an anomalous behavior of the solar cycle in the era of grand cycle IV, which was characterized by alternating
amplitudes for odd and even cycles. It is curious that this happened only in the era of grand cycle IV (see Fig. 1). We will discuss some possible mechanisms to explain this phenomenon in § V. At any rate, if we regard this as anomalous behavior in the sense that the hysteresis curve does not form a loop on a period- amplitude diagram, the 11 year solar cycle has under- gone a regular long-term modulation whose period is approximately 55 years. We hereafter will call this long-term modulation a 55 year modulation, although the period is not precisely 55 years.
III. COMPARISON WITH THE NONLINEAR DYNAMO MODEL OF THE SOLAR CYCLE
One of the important consequences of recognizing that the period of the 55 year modulation is rather
Fig. 3.—Evolutionary trajectories of period-amplitude phase points of the observed solar cycle from cycle — 5 to cycle 20. The scattered points of Fig. 2 are connected according to their time sequence. Cycle numbers are designated at each point. Except for the anomalous era from cycle 10 to cycle 16, shown by dotted lines, a general property of the long-term evolution of the solar cycle becomes clear; each grand cycle shown in Fig. 1 forms a loop in this period-amplitude phase space.
© American Astronomical Society • Provided by the NASA Astrophysics Data System

197
9ApJ
. . .
227.
1047
Y
No. 3, 1979 SOLAR-CYCLE PERIOD-AMPLITUDE RELATION 1051
Rm Fig. 4.—Similar to Fig. 3 but each loop of grand cycle is
separated out from others. Abscissa is RM and ordinate is period in years. Grand cycle IV should be regarded as anomalous.
stable and regular and does not fluctuate much is that grand cycle V has now ended and a new grand cycle is starting. This can provide a basis for predicting solar activity over the next 55 years. Another consequence is that the theoretical model of the multiple-period nonlinear oscillation of the solar cycle (with a rather constant delay-time parameter for the time-delayed feedback mechanism) can be applied directly to the real case of the Sun and can be used as a diagnostic tool to study its internal mechanisms (§ I and Yoshimura 1978c). Studying the theory side by side with observations would reveal to us some important but subtle parameters in the observed phenomena which are useful in understanding the mechanisms of the Sun.
Still another consequence is that the delay time in the feedback process of the magnetic field on the dynamo is rather constant and does not fluctuate as wildly as the notion of 80 year modulation requires. Hence the time-delayed feedback process may be a regular process of the Sun.
Figure 5 shows the theoretically predicted behavior of the magnetic oscillations of the Sun corresponding to the solar cycle. The governing equation of the solar- cycle model is the dynamo equation which describes the magnetohydrodynamic actions of the nonaxisym- metric global convective waves running longitudinally (the global convection) and of the differential rotation (the equatorial acceleration) in a three-dimensional
o o o o o o o o o o o Fig. 5.—Eight cases of evolution of the erupted energy produced by the solar-cycle dynamo model with a time-delayed non-
linear feedback process (Yoshimura 1978c). The abscissa is the time step of the numerical integration from 0 to 5000 steps, spanning approximately 500 years. The number at the top left of each diagram is the delay-time parameter: from top to bottom, case A (195 steps, 18.7 yr); case B (197 steps, 18.9 yr); case C (200 steps, 19.2 yr); case D (201 steps, 19.3 yr); case E (203 steps, 19.5 yr); case F (205 steps, 19.7 yr); case G (208 steps, 20.0 yr); case H (210 steps, 20.2 yr).
© American Astronomical Society • Provided by the NASA Astrophysics Data System

197
9ApJ
. . .
227.
1047
Y
1052
200 r- ^ r
Û O a: LÜ £L Q Z < LÜ (o cc
100 -
LÜ 2
oo JL _L _L _L
0.5 MAXIMUM AMPLITUDE
Fig. 6a
1.0
Vol. 227
MAXIMUM AMPLITUDE Fig. 66
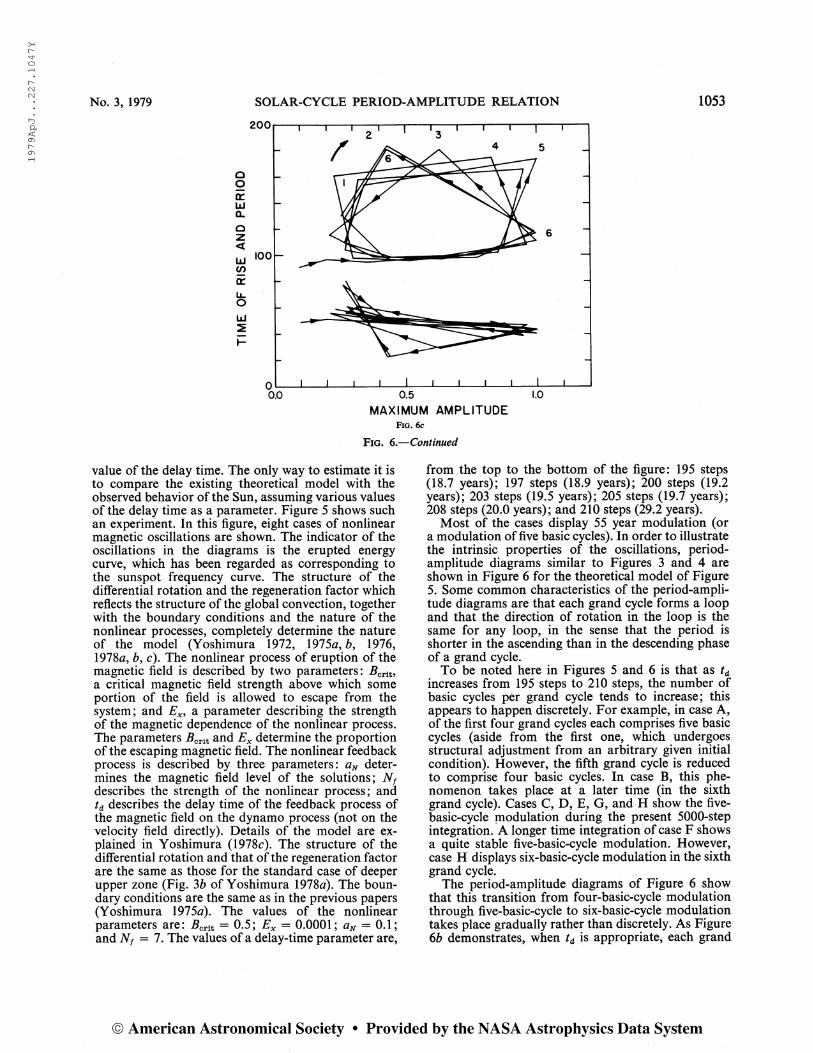
Fig. 6—(a) Period-amplitude diagram {upper) and time of rise and amplitude diagram {lower) of a nonlinear dynamo wave magnetic oscillation driven by the differential rotation and the global convection for case C of Fig. 5 (delay time, 200 steps). The abscissa is the maximum amplitude of one cycle normalized by the maximum value of the oscillation over the entire span of time integration. The ordinate is the period and time of rise of one cycle in the number of steps of the numerical integration, {b) Similar to Fig. 6a but for case F (delay time, 205 steps), (c) Similar to Fig. 6a, but for case H (delay time, 210 steps). The numbers at the corners indicate the number of 55 year grand cycles of case H of Fig. 5. Note that the loop of the grand cycle rotates clockwise and that grand cycle V has 6 basic 11 year cycles in it.
spherical shell. The magnetic field under consideration is the general (axisymmetric) magnetic field. The dynamo equation is thus the equation averaged over longitude (Yoshimura 1972^, 1975a, b, 1978a, Z>, c).
A crucial mechanism for the long-term (55 year) modulation is the time-delayed feedback of the general
magnetic field on the dynamo process. Since it takes time for the general magnetic field to modify the fluid flows and their associated fields which drive the dynamo process, the resulting modification of the dynamo process takes place with some time delay. However, at present no model exists to estimate the
© American Astronomical Society • Provided by the NASA Astrophysics Data System
197
9ApJ
. . .
227.
1047
Y
No. 3, 1979 SOLAR-CYCLE PERIOD-AMPLITUDE RELATION 1053
0.0 0.5 1.0 MAXIMUM AMPLITUDE
Fro. 6c Fig. 6.—Continued
value of the delay time. The only way to estimate it is to compare the existing theoretical model with the observed behavior of the Sun, assuming various values of the delay time as a parameter. Figure 5 shows such an experiment. In this figure, eight cases of nonlinear magnetic oscillations are shown. The indicator of the oscillations in the diagrams is the erupted energy curve, which has been regarded as corresponding to the sunspot frequency curve. The structure of the differential rotation and the regeneration factor which reflects the structure of the global convection, together with the boundary conditions and the nature of the nonlinear processes, completely determine the nature of the model (Yoshimura 1972, 1975a, è, 1976, 1978a, b, c). The nonlinear process of eruption of the magnetic field is described by two parameters: i?crit> a critical magnetic field strength above which some portion of the field is allowed to escape from the system; and Ex, a parameter describing the strength of the magnetic dependence of the nonlinear process. The parameters £crit and Ex determine the proportion of the escaping magnetic field. The nonlinear feedback process is described by three parameters: aN deter- mines the magnetic field level of the solutions; Nf describes the strength of the nonlinear process; and td describes the delay time of the feedback process of the magnetic field on the dynamo process (not on the velocity field directly). Details of the model are ex- plained in Yoshimura (1978c). The structure of the differential rotation and that of the regeneration factor are the same as those for the standard case of deeper upper zone (Fig. 36 of Yoshimura 1978a). The boun- dary conditions are the same as in the previous papers (Yoshimura 1975a). The values of the nonlinear parameters are: Bcvit = 0.5; Ex = 0.0001; aN = 0.1; and Nf = 7. The values of a delay-time parameter are,
from the top to the bottom of the figure: 195 steps (18.7 years); 197 steps (18.9 years); 200 steps (19.2 years); 203 steps (19.5 years); 205 steps (19.7 years); 208 steps (20.0 years); and 210 steps (29.2 years).
Most of the cases display 55 year modulation (or a modulation of five basic cycles). In order to illustrate the intrinsic properties of the oscillations, period- amplitude diagrams similar to Figures 3 and 4 are shown in Figure 6 for the theoretical model of Figure 5. Some common characteristics of the period-ampli- tude diagrams are that each grand cycle forms a loop and that the direction of rotation in the loop is the same for any loop, in the sense that the period is shorter in the ascending than in the descending phase of a grand cycle.
To be noted here in Figures 5 and 6 is that as td increases from 195 steps to 210 steps, the number of basic cycles per grand cycle tends to increase; this appears to happen discretely. For example, in case A, of the first four grand cycles each comprises five basic cycles (aside from the first one, which undergoes structural adjustment from an arbitrary given initial condition). However, the fifth grand cycle is reduced to comprise four basic cycles. In case B, this phe- nomenon takes place at a later time (in the sixth grand cycle). Cases C, D, E, G, and H show the five- basic-cycle modulation during the present 5000-step integration. A longer time integration of case F shows a quite stable five-basic-cycle modulation. However, case H displays six-basic-cycle modulation in the sixth grand cycle.
The period-amplitude diagrams of Figure 6 show that this transition from four-basic-cycle modulation through five-basic-cycle to six-basic-cycle modulation takes place gradually rather than discretely. As Figure 66 demonstrates, when td is appropriate, each grand
© American Astronomical Society • Provided by the NASA Astrophysics Data System
197
9ApJ
. . .
227.
1047
Y
1054 YOSHIMURA Vol. 227
cycle has a similar or the same trajectory in the period-amplitude diagram. However, when td is shorter (Fig. 6d) or larger (Fig. 6c), the shape of the trajectory (loop) begins to rotate. When the value of td is sufficiently larger (smaller) than the standard value, the rotation is rapid enough, and thus at some point (at sixth grand cycle in case H of Figs. 5 and 6c), a different number of basic cycles constitute one grand cycle. In this sense, the behavior of the nonlinear oscillation in the period-amplitude diagram can be an important source of information for understanding the internal dynamics of the system.
An interesting phenomenon in relation to the property of the nonlinear dynamo system described above is that double-peak cycles (cycles with double peaks—or with shoulders in the evolutionary profile of the cycle when a double peak is not clear—but with no field reversals) tend to occur or occur exclusively within one grand cycle right after the basic cycle having maximum amplitude. A close examination of Figure 1 or the original sunspot frequency curves shows that cycles 4, 9, and 20 were likely to be such double-peak cycles (or cycles with shoulders in the falling phase of the cycle). (See also Gnevyshev 1967.)
Especially in cycle 20, activities on the surface were observed to have persisted for a long time after the cycle passed its maximum. This may have been related to the phenomenon described above, i.e., the internal structure of the magnetic field under the surface may have been of such a nature as is characteristic of only this kind of double-peak cycle. Note also in the theoretical models that a clear double-peak cycle occurs after the maximum phase of a sharply increas- ing grand cycle, as cases B, C, G, and H of Figure 5 show. Grand cycle V (double-peak cycle 20 after sharply increasing cycles 16, 17, 18, and 19) seems to be such a case (Fig. 1).
IV. RELATION BETWEEN TIME OF RISE AND AMPLITUDE
In the lower parts of the diagrams in Figure 6, evolutionary trajectories in the time of rise and
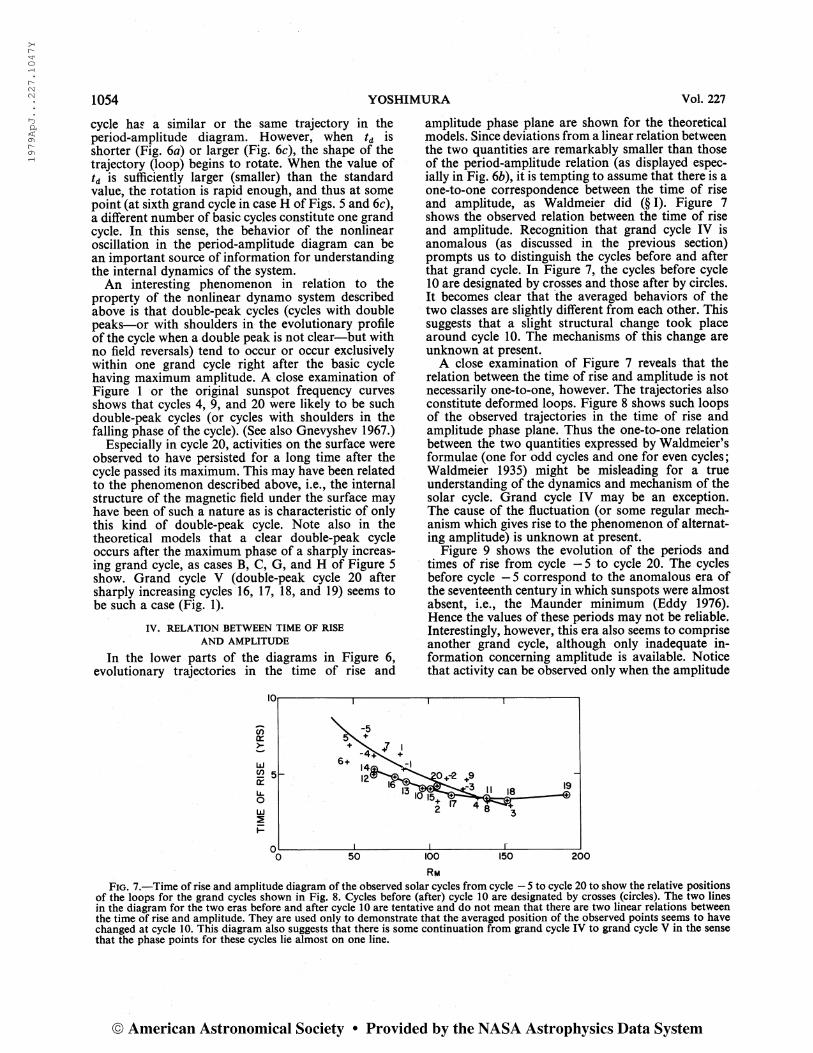
amplitude phase plane are shown for the theoretical models. Since deviations from a linear relation between the two quantities are remarkably smaller than those of the period-amplitude relation (as displayed espec- ially in Fig. 66), it is tempting to assume that there is a one-to-one correspondence between the time of rise and amplitude, as Waldmeier did (§1). Figure 7 shows the observed relation between the time of rise and amplitude. Recognition that grand cycle IV is anomalous (as discussed in the previous section) prompts us to distinguish the cycles before and after that grand cycle. In Figure 7, the cycles before cycle 10 are designated by crosses and those after by circles. It becomes clear that the averaged behaviors of the two classes are slightly different from each other. This suggests that a slight structural change took place around cycle 10. The mechanisms of this change are unknown at present.
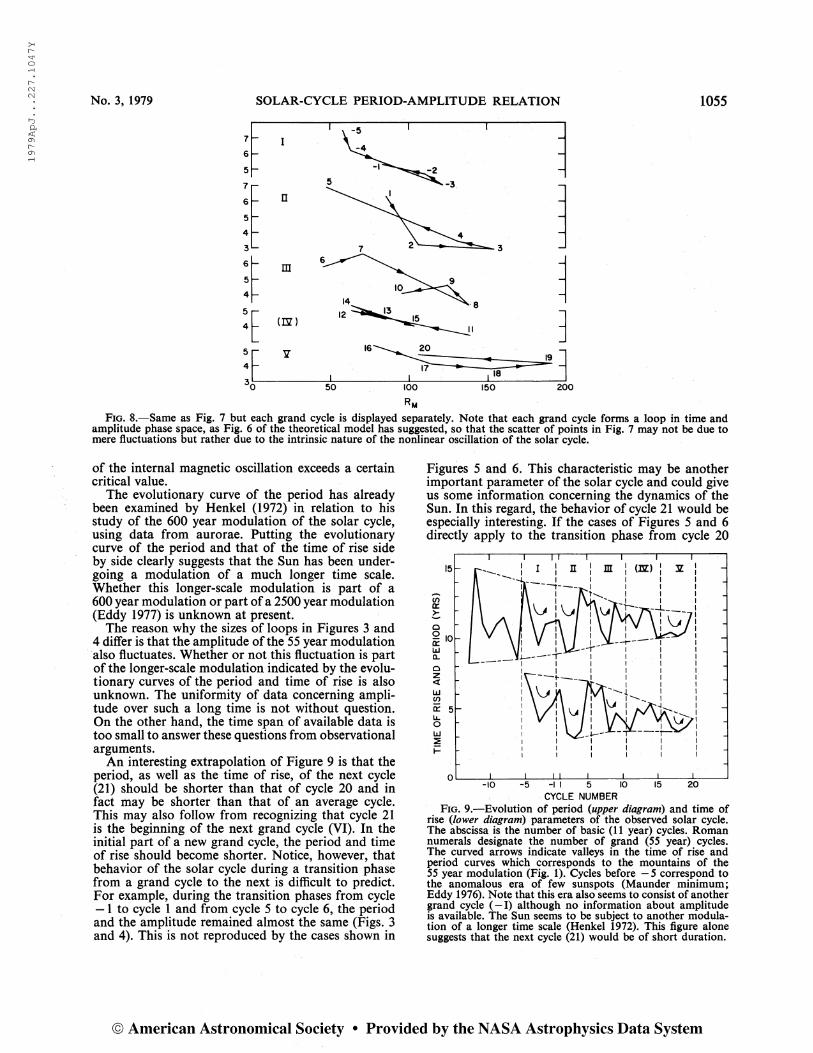
A close examination of Figure 7 reveals that the relation between the time of rise and amplitude is not necessarily one-to-one, however. The trajectories also constitute deformed loops. Figure 8 shows such loops of the observed trajectories in the time of rise and amplitude phase plane. Thus the one-to-one relation between the two quantities expressed by Waldmeier’s formulae (one for odd cycles and one for even cycles; Waldmeier 1935) might be misleading for a true understanding of the dynamics and mechanism of the solar cycle. Grand cycle IV may be an exception. The cause of the fluctuation (or some regular mech- anism which gives rise to the phenomenon of alternat- ing amplitude) is unknown at present.
Figure 9 shows the evolution of the periods and times of rise from cycle —5 to cycle 20. The cycles before cycle — 5 correspond to the anomalous era of the seventeenth century in which sunspots were almost absent, i.e., the Maunder minimum (Eddy 1976). Hence the values of these periods may not be reliable. Interestingly, however, this era also seems to comprise another grand cycle, although only inadequate in- formation concerning amplitude is available. Notice that activity can be observed only when the amplitude
Fig. 7.—Time of rise and amplitude diagram of the observed solar cycles from cycle — 5 to cycle 20 to show the relative positions of the loops for the grand cycles shown in Fig. 8. Cycles before (after) cycle 10 are designated by crosses (circles). The two lines in the diagram for the two eras before and after cycle 10 are tentative and do not mean that there are two linear relations between the time of rise and amplitude. They are used only to demonstrate that the averaged position of the observed points seems to have changed at cycle 10. This diagram also suggests that there is some continuation from grand cycle IV to grand cycle V in the sense that the phase points for these cycles lie almost on one line.
© American Astronomical Society • Provided by the NASA Astrophysics Data System
197
9ApJ
. . .
227.
1047
Y
No. 3, 1979 SOLAR-CYCLE PERIOD-AMPLITUDE RELATION 1055
Rm Fig. 8.—Same as Fig. 7 but each grand cycle is displayed separately. Note that each grand cycle forms a loop in time and
amplitude phase space, as Fig. 6 of the theoretical model has suggested, so that the scatter of points in Fig. 7 may not be due to mere fluctuations but rather due to the intrinsic nature of the nonlinear oscillation of the solar cycle.
of the internal magnetic oscillation exceeds a certain critical value.
The evolutionary curve of the period has already been examined by Henkel (1972) in relation to his study of the 600 year modulation of the solar cycle, using data from aurorae. Putting the evolutionary curve of the period and that of the time of rise side by side clearly suggests that the Sun has been under- going a modulation of a much longer time scale. Whether this longer-scale modulation is part of a 600 year modulation or part of a 2500 year modulation (Eddy 1977) is unknown at present.
The reason why the sizes of loops in Figures 3 and 4 differ is that the amplitude of the 55 year modulation also fluctuates. Whether or not this fluctuation is part of the longer-scale modulation indicated by the evolu- tionary curves of the period and time of rise is also unknown. The uniformity of data concerning ampli- tude over such a long time is not without question. On the other hand, the time span of available data is too small to answer these questions from observational arguments.
An interesting extrapolation of Figure 9 is that the period, as well as the time of rise, of the next cycle (21) should be shorter than that of cycle 20 and in fact may be shorter than that of an average cycle. This may also follow from recognizing that cycle 21 is the beginning of the next grand cycle (VI). In the initial part of a new grand cycle, the period and time of rise should become shorter. Notice, however, that behavior of the solar cycle during a transition phase from a grand cycle to the next is difficult to predict. For example, during the transition phases from cycle — 1 to cycle 1 and from cycle 5 to cycle 6, the period and the amplitude remained almost the same (Figs. 3 and 4). This is not reproduced by the cases shown in
Figures 5 and 6. This characteristic may be another important parameter of the solar cycle and could give us some information concerning the dynamics of the Sun. In this regard, the behavior of cycle 21 would be especially interesting. If the cases of Figures 5 and 6 directly apply to the transition phase from cycle 20
Fig. 9.—Evolution of period {upper diagram) and time of rise (lower diagram) parameters of the observed solar cycle. The abscissa is the number of basic (11 year) cycles. Roman numerals designate the number of grand (55 year) cycles. The curved arrows indicate valleys in the time of rise and period curves which corresponds to the mountains of the 55 year modulation (Fig. 1). Cycles before — 5 correspond to the anomalous era of few sunspots (Maunder minimum; Eddy 1976). Note that this era also seems to consist of another grand cycle ( — 1) although no information about amplitude is available. The Sun seems to be subject to another modula- tion of a longer time scale (Henkel 1972). This figure alone suggests that the next cycle (21) would be of short duration.
© American Astronomical Society • Provided by the NASA Astrophysics Data System

197
9ApJ
. . .
227.
1047
Y
1056 YOSHIMURA Vol. 227
to cycle 21, the period of cycle 21 should be shorter than that of cycle 20 and the amplitude of cycle 21 should be comparable to or shorter than that of cycle 20. These predictions, however, are subject to possible unexpected fluctuations such as those in grand cycle IV. Moreover, the grand cycles of Figures 5 and 6 are not subject to other longer time scale modulations, though these can theoretically be incorporated in the models (Yoshimura 1978c). Grand cycles in the future will be very interesting to study with respect to our understanding of the internal dynamics of the Sun. They should constitute the beginning of a new era rising from the anomalous era of grand cycle IV and could possibly be the beginning of another longer time scale (600 years or 2500 years) modulation.
v. DISCUSSION
We have seen a new way of understanding the period-amplitude relation of the solar cycle (i.e., to study the trajectories in a period-amplitude diagram which form hysteresis loops in association with the 55 year modulation of the solar cycle) that replaces the previous hypothetical law of Waldmeier. We have also seen that this new period-amplitude relation is compatible with the theoretical model of the solar cycle driven by the differential rotation and the global convective waves with the time-delayed feed- back process.
Waldmeier’s hypothetical law played an important role in the historical development of our understand- ing of the basic mechanism of the solar cycle. At a time when the eruptive nature of the magnetic field was unknown, it brought about the new concept of the eruptive nature of the solar cycle whose basic con- stituents are active regions. Although the law is invalid in itself now, it still has heuristic meaning in the sense that the basic profile of one solar cycle is not a sinusoidal curve or a simple combination of sinusoidal curves. Hence, as discussed in § I, we should be very careful in evaluating the meaning of the power spectrum analysis of the sunspot frequency curve.
Although the basic period-amplitude relation is determined by the dynamo and its nonlinear feedback processes, the nonlinear eruptive process plays an important role in the formation of the evolutionary profiles of individual cycles of the sunspot frequency curve. It can shift the position of the maximum phase within a cycle. If the position of the maximum phase in one cycle is set by a proportional relation—in other words, if the time of rise and period are pro- portional to each other—then the relation between time of rise and amplitude should be similar to that between period and amplitude, i.e., their trajectories should form similar loops. However, the relation between the time of rise and amplitude is such that it could almost be represented by a single formula (Fig. 7), indicating a one-to-one correspondence be- tween the two, just as Waldmeier (1935) conjectured. This means that the time of rise stays short compared with the lengthening period even when the amplitude becomes smaller (Figs. 2, 6, 7). Such a phenomenon
might be related to the eruptive nature of solar mag- netic activity. The nonlinear eruption process has already been incorporated in the theoretical model studied here (Yoshimura 1975a, 1978a). This may be why the model can simulate the basic characteristics of the period-amplitude relation as well as those of the relation between time of rise and amplitude (Figs. 5, 6). Close examination of the observed trajectories (Figs. 7, 8) and the theoretically predicted trajectories (Fig. 6) has shown, however, that the trajectories of the time of rise and amplitude phase points also form loops, although the loops are different and not so conspicuous as those of the period-amplitude phase points. This suggests that there is no one-to-one cor- respondence between the time of rise and amplitude and that they should be understood in the context of the long-term (55 year) modulational evolution of the solar cycle.
The period of the long-term modulation may not be persistent in time. For example, an analysis of the records of sunspots observed by eye in China from 43 B.c. through a.d. 1638 (Ancient Sunspot Research Group 1976) indicates that the period was 62 years (six-basic-cycle modulation). This suggests that after the anomalous era of the seventeenth century the period of the modulation may have become shorter than that of the modulation before the era. It indicates also that the structure and the dynamics of the Sun have changed over the last 2000 years.
In order to support the idea of an 80 year modula- tion (or 88 year, i.e., eight basic cycles), Waldmeier (1957, 1971) analyzed various characteristics of the north-south hemispheric asymmetry of the activity and showed that the characteristics also underwent an eight-basic-cycle modulation. The time scale given by the north-south asymmetry, however, indicates a characteristic time scale for the interaction process between the two hemispheres that is not directly related to the time scale of the main dynamo and its feedback processes. The analysis of Waldmeier (1957, 1971) should give us information concerning the two- hemispheric interaction process. Also, interestingly, it can give us information on the mechanism of the anomalous grand cycle IV, since that cycle constitutes a major part of the data which Waldmeier (1957, 1971) analyzed.
In this paper, some problems have emerged to be solved in the future. One problem is to find the mechanisms responsible for the anomalous grand cycle IV (Fig. 1). The behavior of this grand cycle is too regular to be due to some kind of random fluctua- tion; the maximum amplitude alternated from odd (even) cycle to even (odd) cycle. If this behavior can be regarded as another modulation with a period of two basic cycles (instead of five), it can be simulated if a delay time of a few years (instead of 20 years) is assumed in the time-delayed feedback process (§ III and Yoshimura 1978c). However, it is not known why the delay time should be small only in this anomalous era. The magnetic field configuration should have been different from that in other ordinary grand cycles.
© American Astronomical Society • Provided by the NASA Astrophysics Data System
197
9ApJ
. . .
227.
1047
Y
No. 3, 1979 SOLAR-CYCLE PERIOD-AMPLITUDE RELATION 1057
One possibility is that the delay-time contribution function (Yoshimura 1978c), which describes the con- tribution of a past magnetic field to the dynamo pro- cess at the epoch under consideration, has a broad profile from 0 to well over 20 years and that some particular time scale becomes predominant depending on the structure and the dynamics of the dynamo zone. Another possibility is that the polar field did not reverse its polarity and that this field, penetrating deep into the lower part of the convection zone, gives rise to asymmetry in the activity level for odd and even cycles. That is, if global convection is con- centrated near the equator, the dynamo-driven mag- netic field reverses its polarity only near the equator. The polar field remains without any polarity reversals. Thus cycles whose toroidal field polarity in the low latitudes matches that of the polar field can be stronger than other nonmatched cycles. In this way an odd-even-cycle asymmetry arises. These situations are conceivable and in fact can be realized in the solution of the dynamo model (Yoshimura 1975a).
The second problem is to find and understand the mechanism(s) by which the maximum amplitudes of the grand cycles themselves fluctuate (Fig. 1). It is not known whether this is due to fluctuations of the dynamics responsible for the dynamo or whether it is a part of a higher-order modulation, as Figure 9 suggests (see also Yoshimura 1978c).
The third problem is related to the possibility that the structure of the convection zone and/or the dy- namics of the magnetic field may have changed around cycles 10 and 11 (Fig. 7). This should be related to the first problem of the existence of the anomalous period IV. When we compare grand cycles I, II, and III with grand cycle V, we notice a clear difference between the two cases. In the first three grand cycles, the largest two basic (11 year) cycles around the maximum of a grand cycle had similar amplitudes (Fig. 1), while grand cycle V rose rapidly to a maximum (cycle 19) and dropped off quickly (cycle 20). The first case is similar to case E of Figure 5 (delay time, 203 steps) and case F (205 steps), and the second case could correspond to case C (200 steps) or case H (210 steps); the difference between case C and case H can be recognized only by examining several successive grand cycles. The difference could be due to different time scales in the feedback process which might have been caused by structural and/or dynamical changes in
the Sun. (The anomalous grand cycle IV can also be reproduced in the model if the delay time is sig- nificantly smaller than that of other grand cycles, as discussed above.) In any case, these mechanisms sug- gest some change of structure and/or dynamics of the dynamo zone. In this context, it is interesting to note that the differential rotation seems to have been different in grand cycle IV (cycles 13, 14, 15) from that in grand cycle V (Eddy et al. 1978).
The fourth problem is to find some ways to extend the present data of about 380 years for which period and amplitude information for the basic (11 year) cycle is available. In order to study and understand the nature and characteristics of the higher-order modulations, period, amplitude, and their combined behavior in period-amplitude phase space are im- portant, as this study has shown. Data concerning period or amplitude alone over a long period of time in the past have been studied independently, using other indices of the solar activity (e.g., Henkel 1972; Eddy 1977). Continued sunspot observation in the future will be extremely important for efforts to detect and understand the changes of the structure and dynamics of the Sun.
It is a pleasure for the author to express his sincere gratitude on this occasion to Professor Shingo Nagasawa for introducing him to the various phe- nomena of the solar cycle in his lectures of 1969.
He would also like to thank Dr. Robert F. Howard for informing him of the determined values of max- imum amplitude, period, and time of rise of cycle 20 (Waldmeier 1977a, b), which made the loop of grand cycle V clearly recognizable, and for sending him a copy of the Waldmeier article (Waldmeier 1935). He is grateful to Dr. John A. Eddy for permission to use his diagram of sunspot frequency as the basis for Figure 1 of the present paper. Drs. Max Waldmeier, John A. Eddy, Robert F. Howard, Bernard R. Durney, and Peter A. Gilman kindly read the manu- script before publication and made helpful comments on the paper. It is also a pleasure for the author to thank Dr. Gordon Newkirk for giving him an oppor- tunity to visit the National Center for Atmospheric Research for a year. The computational part of this work was done on NCAR’s CRAY-1 and Control Data 7600 computers.
REFERENCES Ancient Sunspot Research Group. 1916, Acta Astr. Sínica,
17, 217 (transi. Chinese Astr., 1, 347). de Jager, C. 1959, Handbuch der Physik, 52, 322. Eddy, J. A. 1976, Science, 192, 1189. . 1977, Climatic Change, 1, 193. Eddy, J. A., Noyes, R. W., Wolbach, J., and Boornazian, A. A.
1978, paper to be presented at 152d Meeting of AAS. Gleissberg, W. 1939, Observatory, 62, 158. . 1940, Gazette Astr., 27, 15. . 1944, Terr. Magn. Atmos. Elec., 44, 247. . 1967, Solar Phys., 2, 231. Gnevyshev, M. N. 1967, Solar Phys., 1, 107. Halm, J. 1902, Ann. Royal Observatory Edinburgh, 1, 97. Hartman, R. 1971, Solar Phys., 21, 246. Henkel, R. 1972, Solar Phys., 25, 498.
Korteweg, D. J. 1883, Sitzungs bericht der kaiserlichen Akademie der Wissenschaften, Math.-Nature Krasse, Vol. 88, § II.
Waldmeier, M. 1934a, Verh. Schweizerischen Natur for sehenden Gesellschaft, p. 297. -. 19346, Arch. Sei. Phys. et Nat. Geneva, 16, 288. . 1935, Astr. Mitt. Eidg. Sternwarte Zurich, No. 83. —. 1948, Astr. Mitt. Eidg. Sternwarte Zurich, No. 152. —. 1955, Ergebnisse und Probleme der Sonnenforschung
(2d ed.; Leibniz: Akademie Verlagsgesellschaft). -. 1957, Astr. Mitt. Eidg. Sternwarte Zurich, No. 209. —. 1961, The Sunspot-Activity in the Years 1610-1960
(Zurich: Schultheis). . 1966, Astr. Mitt. Eidg. Sternwarte Zurich, No. 274. . 1971, Solar Phys., 20, 332.
© American Astronomical Society • Provided by the NASA Astrophysics Data System
197
9ApJ
. . .
227.
1047
Y
1058 YOSHIMURA
Waldmeier, M. 1977a, Astr. Mitt. Eidg. Sternwarte Zurich, No. 346. -. 1911b, Astr. Mitt. Eidg. Sternwarte Zurich, No. 355. Wolf, R. 1859, Astr. Mitt. Eidg. Sternwarte Zurich, No. 8. — . 1861, Astr. Mitt. Eidg. Sternwarte Zurich, No. 12. . 1877, Astr. Mitt. Eidg. Sternwarte Zurich, No. 17. Yoshimura, H. 1972, Ap. J., 178, 803.
Yoshimura, H. 1975a, Ap. J. Suppl., 29, 467. -. 19756, Ap. J., 201, 740. . 1976, Solar Phys., 52, 41. . 1978a, Ap. J., 220, 692. . 19786, Ap. J., 221, 1088. -. 1978c, Ap. J., 226, 706.
Hirokazu Yoshimura: Department of Astronomy, Faculty of Science, University of Tokyo, Tokyo, Japan 113
© American Astronomical Society • Provided by the NASA Astrophysics Data System

![arXiv:0709.4488v1 [astro-ph] 27 Sep 2007The Astrophysical Journal, 666:1024–1047, 2007 September 10 ABSTRACT We present an algorithm to identify the type of an SN spectrum and to](https://static.fdocuments.us/doc/165x107/610758dbfeae655f0b69f1e4/arxiv07094488v1-astro-ph-27-sep-2007-the-astrophysical-journal-6661024a1047.jpg)


![1047 bae[1]](https://static.fdocuments.us/doc/165x107/5562973cd8b42abb398b4d64/1047-bae1.jpg)