2251
55
Overseas Development Institute Assessing Business Development Impact A Management Framework for Improved Economic and Socio-Economic Performance Reporting bdp Programme on Business and Development Performance
-
Upload
prince-mcgershon -
Category
Economy & Finance
-
view
116 -
download
3
Transcript of 2251

Overseas Development Institute
Assessing Business Development Impact
A Management Framework for Improved Economic and Socio-Economic Performance Reporting
bdpProgramme on Business
and Development Performance

Assessing Business
Development Impact: A Management Framework for Improved
Economic and Socio-Economic Performance Reporting
April 2008
This report updates an earlier ODI report ‘Bridging the Economic Benefits Gap: A Management Framework for Improved Economic and Socio-Economic Performance Reporting by Energy Companies’
by Dr Michael Warner, ODI, October 2004 and funded by BP plc
Updated by Karen Ellis Business and Development Performance Programme
Overseas Development Institute 111 Westminster Bridge Road
London SE1 7JD, UK
www.odi.org.uk/business
The views in this paper reflect those of the author alone.
ISBN 978-0-85003-870-5
© Overseas Development Institute 2008
All rights reserved. No part of this publication may be reproduced, stored in a retrieval system, or transmitted in any form or by any means, electronic, mechanical, photocopying, recording or otherwise,
without the prior written permission of the publishers.
Cover photographs: Gold mining at Siguiri Prefecture, Guinea (L. Lartigue, USAID); tea workers in Sri Lanka (Dennis Hurd); logging in Central African Republic (JG Collomb, World Resources Institute); silk
workers in China (Andrew Hitchcock).

Table of Contents
Executive Summary ............................................................................... i
1. Introduction ................................................................................. 1 1.1 Purpose..................................................................................................... 1
1.2 Objectives ................................................................................................. 1
1.3 Approach................................................................................................... 2
2. Context For The Report: The Economic Benefits Gap In The Energy Sector ......................................................................... 3
2.1 A ‘Shift’ in Geography ................................................................................ 3 2.1.1 The Geography of Profits .................................................................................3 2.1.2 Overview of the Economic Benefits Gap...........................................................4
2.1.3 Weaknesses in Current Economic and Socio-Economic Reporting ....................8
2.1.5 Beyond Cash Value Added ............................................................................13
2.1.6 Trends in Investor Analysis............................................................................14
2.1.7 Conclusions ..................................................................................................15
2.2 A ‘Drift’ in Comprehension....................................................................... 16 2.2.1 Dislocation of the Hydro-Carbons Industry from Society.................................16
2.2.2 One-Dimensional Financial Disclosure...........................................................18
3. Overcoming the Challenges to Reporting Economic and Socio-Economic Performance ...................................................... 19
3.1 Introduction ............................................................................................ 19
3.2 Reporting the Public Policy Context for Doing Business ........................... 20
3.3 Tracking Socio-Economic Benefits through the Financial Accounts .......... 21
3.4 Meaningfulness of the Information Disclosed.......................................... 22
3.5 Prohibitive Costs of Benefits Reporting.................................................... 23
3.6 Risks to Business of Benefits Reporting................................................... 24
4. A Framework for Reporting Economic and Socio-Economic Performance............................................................................... 27
4.1 Introduction ............................................................................................ 27
4.2 Applications ............................................................................................ 27
4.3 Scoping ................................................................................................... 27
4.4 Individual Reporting Registers ................................................................. 33
4.5 Risk Control ............................................................................................. 35
5. Analysis and Conclusions ........................................................... 39 5.1 Designing a Systematic Framework for Reporting Economic and
Socio-Economic Performance .................................................................. 39 5.1.1 Scoping ........................................................................................................39 5.1.2 Reporting Register.........................................................................................40 5.1.3 Risk Assessment ...........................................................................................41
5.2 Lessons Learned from Compiling ‘Reporting Registers’ ............................ 42
5.3 Conclusion .............................................................................................. 44

Figures, Boxes and Tables
Fig 1 Schematic Representation of the Economic ‘Benefits Gap’ in Upstream Oil and Gas Development ........................................................................ 7
Fig 2 Building Blocks of a Management Framework for Economic and Socio-Economic Performance Reporting .......................................................................................... 19
Fig 3a Business Context (constraints/incentives) ............................................................. 20
Fig 3b Financial Figures.................................................................................................... 21
Fig 3c Internal Management Data and External Priorities.................................................. 22
Fig 3d Scoping Exercise ................................................................................................... 23
Fig 3e Automated Information-Gathering and Interpretation............................................. 24
Fig 3f Controlling the ‘Risks’ of Reporting ........................................................................ 25
Fig 3g External Roles ....................................................................................................... 26
Fig 4 Country Economic and Socio-Economic Contributions of Multi-National Energy Companies: an applicat on of the framework for online performance reporting....... 28 i
Fig 5 Controlling the Risks of Economic and Socio-Economic Reporting .......................... 35
Fig 6a Reporting Register Example 1: Contributions to Export Led Economic Growth through Payments to Government and Third-Parties............................................................ 36
Fig 6b Reporting Register Example 2: Contributions of a Gas Condensate Project to the Country's Energy Needs ......................................................................................... 37
Fig 6c Reporting Register Example 3: Contributions to the National Economy through Expenditure with Local Contractors and Suppliers.................................................. 38
Box A Categories for Economic and Socio-Economic Reporting .......................................... ii
Box B Economic and Socio-Economic Connectivity between Energy Companies and their Host Society Explored in the Study.......................................................................... iii
Box 1 The Importance of Local Content in Securing New Business ..................................... 8
Box 2 The Global Reporting Initiative (GRI) G3 Economic Indicators ................................... 9
Box 3 Initiatives That Have Sought to Deepen Economic and Socio-Economic Reporting .. 13
Box 4 Categories for Socio-Economic and Economic Reporting ........................................ 32
Table 1 Checklist of Economic and Socio-Economic Reporting Categories and Themes for Integrated Oil and Gas Companies......................................................................... 29
Assessing Business Development Impact: A Management Framework for Improved Economic and Socio-Economic Performance Reporting
Executive Summary
This report presents a methodology for assessing business development impact, and
outlines a management framework for gathering, interpreting and reporting
information on development performance, and managing associated risks. The
methodology has been implemented in the oil and gas sector, but most aspects are
relevant for other sectors, and the framework can be adapted for wider application.
Persistent Challenges to Reporting Economic Performance
The study upon which this report is based reviewed a number of initiatives in the
area of corporate economic and socio-economic benefits analysis and reporting,
including the OECD Multi-National Enterprise and UN Global Compact principles, the
Dow Jones Sustainability and FTSE4GOOD rating indices, the GRI 2002 Sustainability
Reporting Guidelines, and the IFC method for assessing project economic impact.
The study concluded that the discipline of economic impact reporting is not well
evolved, and suffers from a number of persistent challenges. These include:
weak analysis and reporting of the commercial and public policy constraints and
incentives that frame business strategy, and thus provide justification, or not, for
a company’s economic and socio-economic performance;
a tendency at Group level towards reporting aggregated economic information
that rapidly becomes meaningless to country-level stakeholders, and which fails
to focus attention on those particular operations material to the earnings of the
Group as a whole due to specific short-term political risks or unprotected long-
term growth opportunities;
a bias towards reporting Cash Value Added (CVA) and the breakdown thereof in
the form of dividends, taxes, employee wages and benefits, re-invested earnings
and charitable giving, and their presentation as indicators of an economic rate of
return – a practice that, particularly in low- income and poorly governed
countries, fails to account for extreme inequalities in economic benefits
distribution;
a dependency on gathering economic and socio-economic performance data
from high-cost, stand-alone studies and surveys;
a lack of attention to reporting the significance of economic performance in the
context of the specific economic and social priorities of the host society, be that
i
Assessing Business Development Impact: A Management Framework for Improved Economic and Socio-Economic Performance Reporting
national economic development targets, the economic and social policies of
local district authorities, the livelihood aspirations of communities or the
economic interests of civil society groups; and
the potentially adverse commercial consequences for energy businesses arising
from continuous performance improvements with respect to some of those
indicators chosen as the basis for economic reporting, such as wage levels, rate
of local staff succession or use of local suppliers.
A Management Framework for Improved
Economic Benefits Reporting
)
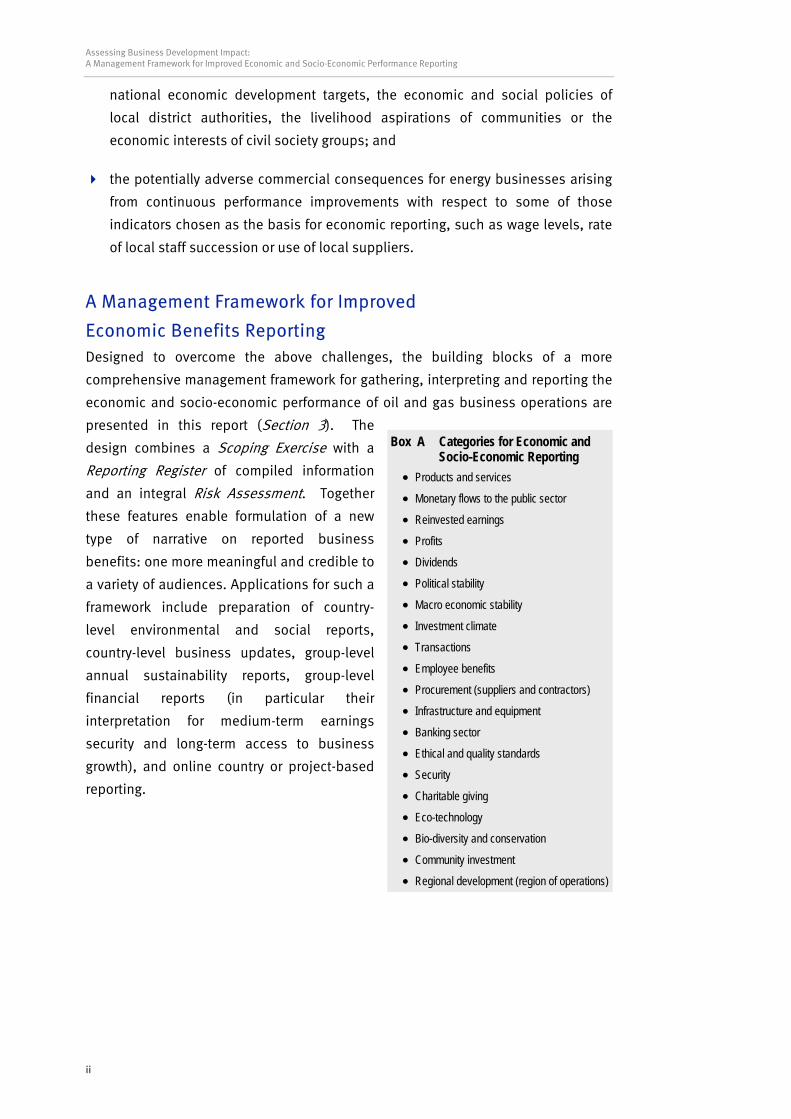
Designed to overcome the above challenges, the building blocks of a more
comprehensive management framework for gathering, interpreting and reporting the
economic and socio-economic performance of oil and gas business operations are
presented in this report (Section 3). The
design combines a Scoping Exercise with a
Reporting Register of compiled information
and an integral Risk Assessment. Together
these features enable formulation of a new
type of narrative on reported business
benefits: one more meaningful and credible to
a variety of audiences. Applications for such a
framework include preparation of country-
level environmental and social reports,
country-level business updates, group-level
annual sustainability reports, group-level
financial reports (in particular their
interpretation for medium-term earnings
security and long-term access to business
growth), and online country or project-based
reporting.
ii
Box A Categories for Economic and Socio-Economic Reporting
• Products and services
• Monetary flows to the public sector
• Reinvested earnings
• Profits
• Dividends
• Political stability
• Macro economic stability ate • Investment clim
• Transactions
• Employee benefits
• Procurement (suppliers and contractors)
equipment
d quality standards
ation
• Regional development (region of operations
• Infrastructure and
• Banking sector
• Ethical an
• Security
• Charitable giving
• Eco-technology
• Bio-diversity and conserv
• Community investment

Assessing Business Development Impact: A Management Framework for Improved Economic and Socio-Economic Performance Reporting
Business-to-Host Society Connectivity As part of the proposed framework, a checklist is used to aid the initial scoping of
economic and socio-economic impacts to report. The main category headings in this
checklist are presented in Box A. A further 80 sub-categories are identified in the
report. During site visits undertaken for the study upon which this report is based,
the checklist was used to explore in more detail a number of areas of economic and
socio-economic connectivity between energy companies and their host society (see
Box B overleaf).
FT
s
r
e
g
Box B Economic and Socio-Economic Connectivity between Energy Companies and their HostSociety Explored in the Study
Upstream – oil and gas developments • the contribution of oil or gas field developments to the provision of affordable gas and electricity supplies in-country; • contributions of the business to macro-economic stability through payments to a state oil fund; • meeting the local content requirements of production-sharing agreements; • the potential for a positive effect on local financial institutions from the business passing financial transactions through
domestic banks; • indirect tax payments to government from national and foreign employees working for local contractors and
subcontractors; • the contribution of the business to skills enhancement through engagement with training and education institutions; • diffusion of ethical and health and safety standards to contractors and suppliers; • economic and socio-economic impacts of a business’s community investment programmes. Downstream – refining, retail marketing, chemicals and renewables • contributions to economic development in underdeveloped countries from crude oil sourcing decisions; • employment opportunities in depressed local markets; • innovation in service stations, eg convenience stores; • local employment and the local economic multiplier effect of service stations; • operator support to develop domestic businesses; • impact of oil tax collected by service stations on the economy, eg in meeting of pension requirements; • charitable contributions; and
• energy businesses as leaders in research and development for clean fuel and eco-efficient technology, eg withinrefinery and retail operations.
indings he study concluded that an effective management framework for economic and
ocio-economic performance reporting needs to (i) be integrated with existing
eporting procedures, (ii) be cost-effective, (iii) promote prioritisation in the choice of
conomic and socio-economic impacts to report, and (iv) guide the systematic
athering of information. Specific conclusions arising from this study are as follows:
The risks to shareholders associated with the shift in geography of corporate
growth centres towards poor and politically unstable countries, combined with a
iii

Assessing Business Development Impact: A Management Framework for Improved Economic and Socio-Economic Performance Reporting
drift in comprehension of the mutuality of benefits between downstream
manufacturing/retail businesses and wider society, suggests a move away from
the global corporate reporting of economic performance based on generic,
aggregated financial indicators or isolated qualitative ‘good news stories.’
Needed is a move towards the reporting of highest-priority, location-specific
economic and socio-economic connectivity (or potential connectivity) between
the energy business and society, reflecting genuine host country stakeholder
concerns and goals.
The checklist of economic and socio-economic performance themes and
categories presented in this report offers an opportunity to broaden the range of
economic benefits reporting beyond the conventions of charitable giving,
community investment and breakdown of Cash Value Added (CVA).
Countering the persistent challenges to effective economic and socio-economic
performance reporting outlined in this report requires the collation of five types
of information, and their formulation into a suite of individual Reporting
Registers: (i) the business context – competitive realities, legal and regulatory
requirements, public policy stipulations and incentives that frame business
decisions and determine whether a company has overall control or only partial
influence over the economic benefits stream generated by its operations; (ii)
financial data – indicators that describe financial performance in relation to
economic and socio-economic impacts and that can be tracked through the
standard accounts (Income Statement, Balance Sheet, Cash Flow); (iii) non-
financial management data that is readily accessible and that will enhance the
reported narrative; (iv) external stakeholder priorities – benchmarks or targets
reflecting external stakeholder concerns and goals that can be referenced to
interpret the relevance of the company’s performance to the intended audience;
and (v) external roles – actions to be taken by entities outside the immediate
business to embed, enhance or sustain the socio-economic or economic gains
contributed by the company.
Within each individual Reporting Register, all quantitative data should, as far as
practicable, be linked directly to the relevant financial and other management
system so that the figures can be called up ‘on command.’ For data-sets that
currently require costly freestanding surveys, such as soliciting the geography
and/or ownership profile of suppliers, ways need to be found to automate the
data-gathering process: for example by inserting new reporting clauses into the
contracts of the main engineering, procurement, construction and asset
maintenance contractors.
iv
Assessing Business Development Impact: A Management Framework for Improved Economic and Socio-Economic Performance Reporting
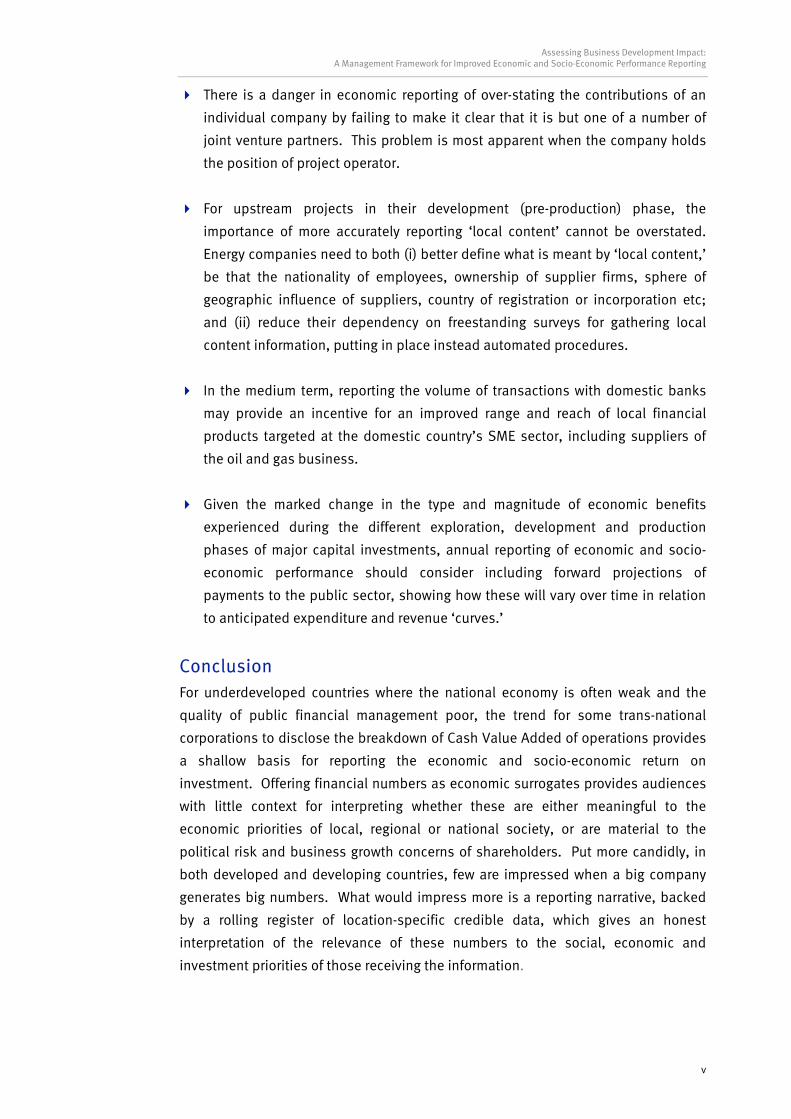
There is a danger in economic reporting of over-stating the contributions of an
individual company by failing to make it clear that it is but one of a number of
joint venture partners. This problem is most apparent when the company holds
the position of project operator.
For upstream projects in their development (pre-production) phase, the
importance of more accurately reporting ‘local content’ cannot be overstated.
Energy companies need to both (i) better define what is meant by ‘local content,’
be that the nationality of employees, ownership of supplier firms, sphere of
geographic influence of suppliers, country of registration or incorporation etc;
and (ii) reduce their dependency on freestanding surveys for gathering local
content information, putting in place instead automated procedures.
In the medium term, reporting the volume of transactions with domestic banks
may provide an incentive for an improved range and reach of local financial
products targeted at the domestic country’s SME sector, including suppliers of
the oil and gas business.
Given the marked change in the type and magnitude of economic benefits
experienced during the different exploration, development and production
phases of major capital investments, annual reporting of economic and socio-
economic performance should consider including forward projections of
payments to the public sector, showing how these will vary over time in relation
to anticipated expenditure and revenue ‘curves.’
Conclusion For underdeveloped countries where the national economy is often weak and the
quality of public financial management poor, the trend for some trans-national
corporations to disclose the breakdown of Cash Value Added of operations provides
a shallow basis for reporting the economic and socio-economic return on
investment. Offering financial numbers as economic surrogates provides audiences
with little context for interpreting whether these are either meaningful to the
economic priorities of local, regional or national society, or are material to the
political risk and business growth concerns of shareholders. Put more candidly, in
both developed and developing countries, few are impressed when a big company
generates big numbers. What would impress more is a reporting narrative, backed
by a rolling register of location-specific credible data, which gives an honest
interpretation of the relevance of these numbers to the social, economic and
investment priorities of those receiving the information.
v


Assessing Business Development Impact: A Management Framework for Improved Economic and Socio-Economic Performance Reporting
1. Introduction
1.1 Purpose
This report presents a methodology for assessing business development impact, and
outlines a management framework for gathering, interpreting and reporting
information on development performance, and managing associated risks3. The
methodology has been implemented in the oil and gas sector, but most aspects are
relevant for other sectors, and the framework can be adapted for wider application.
The study falls under the programme on Business and Development Performance at
the Overseas Development Institute, which focuses on developing the tools, policies
and incentive mechanisms needed to improve the development impact of business.4
1.2 Objectives The objectives of the study upon which this report was based were fivefold, exploring
ways to:
facilitate the systematic reporting of the positive economic and socio-economic
performance of energy companies at the operational, country and corporate
levels;
strengthen the linkage between the reporting of financial performance and
reporting of economic and socio-economic performance;
provide external stakeholders with a ‘lens’ through which to interpret
performance in the context of the economic and socio-economic priorities of the
host society;
automate data-gathering processes to support low-cost annual (or quarterly)
reporting of socio-economic performance; and
identify and fill existing gaps in reporting by major energy companies in order
that future external communications present the ‘whole’ impact of a business on
the host society, enhancing the capacity of observers to make informed opinions
about trade-offs and the mutuality of benefits.
3 This report updates an earlier ODI report ‘Bridging the Economic Benefits Gap: A Management Framework for Improved Economic and Socio-Economic Performance Reporting by Energy Companies’ ODI, October 2004. 4 For details of the programme, see www.odi.org.uk/business
1

Assessing Business Development Impact: A Management Framework for Improved Economic and Socio-Economic Performance Reporting
1.3 Approach The study upon which this report is based reviewed a number of initiatives in the
area of corporate economic and socio-economic benefits analysis and reporting,
including the Global Reporting Initiative, FTSE4GOOD, Dow Jones Sustainability
Indices, OECD MNE guidelines, and the International Finance Corporation’s
Economic Valuation Method and Sustainability Framework. In addition, during the
study period a rolling series of discussions took place with a major energy company
at corporate level and site visits were undertaken to one upstream operation in a
developing country, and one downstream operation in a developed country. These
discussions involved access to a wide range of expertise including finance, tax,
legal, human resources, procurement, communications and community investment.
2

Assessing Business Development Impact: A Management Framework for Improved Economic and Socio-Economic Performance Reporting
2. Context For The Report: The Economic Benefits Gap In The Energy Sector
The need to strengthen the internal capacity within energy companies to report
economic and socio-economic performance is underpinned by two principal drivers.
The first has to do with a ‘shift’ in the geography of profits towards developing
countries, the second with the ‘drift’ in comprehension of stakeholders in the
developed world about the overall role of the hydro-carbons business within society.
2.1 A ‘Shift’ in Geography 2.1.1 The Geography of Profits
,
“We suggest that the greatest challenge of corporate responsibility today lies with
company
activities in developing countries, for three reasons: globalisation means that more
Western companies have operations or supply chains in developing countries than
previously; companies operating in developing countries often face acute problems
associated with poverty disease, corruption, conflict and the abuse of human
rights…; governments of developing countries are often unable or unwilling to
provide the strong regulatory supervision that guides and constrains company
activity in rich countries.”
Insight Investment (2003) Defining Global Business Principles, p4
An increasingly sizable portion of the near-term future profits of multi-national
integrated5 oil and gas companies, such as BP, Royal Dutch Shell, ExxonMobile,
ChevronTexaco and Total, will come from oil and gas field developments located in
low-income or low-middle-income developing countries. For Shell, this includes:
China, Nigeria, Philippines, Venezuela, Kazakhstan and Brunei. For BP: Azerbaijan,
Indonesia, Angola and Trinidad and Tobago. And for ExxonMobil: Equatorial Guinea,
Cameroon, Chad, Nigeria, Angola, Papua New Guinea and Indonesia. Further, over
the longer term, in line with the dual trends of economic growth in emerging
economies (eg China, India, Malaysia) and economic growth and energy security
considerations in developed nations, these companies are likely to diversify into
other underdeveloped regions.
5 ie combining upstream with mid and downstream operations.
3

Assessing Business Development Impact: A Management Framework for Improved Economic and Socio-Economic Performance Reporting
Operating in such regions requires consideration of a wide range of societal
characteristics not present in, or far less pronounced than in, conventional operating
environments. These include, inter alia, unstable political regimes, weak
economies, volatile exchange rates, low education levels and skills capacity,
underdeveloped supply chains, poor local infrastructure, chronic poverty within the
wider population, weak institutions and regulatory enforcement, severe
environmental degradation, corruption and, in some cases, violent conflict. These
‘alien’ business environments are not exactly new to the oil and gas ‘supermajors’.
What is new is the recent emergence of three coincident features of the hydro-
carbons sector:
the high relative proportion of corporate profits derived from operations in low
and middle-income countries;
heightened corporate awareness of the reputational risks of doing business in
underdeveloped regions in relation to two sets of external stakeholders: (a)
institutional and commercial investors, with respect both to short-term
operational risks and to long-term access to growth opportunities; and (b)
special interest groups, in particular with respect to the responsible
management of community and human rights issues; and
the growing politicisation of the upstream hydro-carbon industry within the
country of operations.
Further analysis of the geographic spread of current, near-term and future profits is
clearly warranted but lies outside the scope of this report. More useful at this stage
is to offer a summary of some of the reputational and political risks inherent in a
business growth strategy targeted at mineral resources located in developing
countries, and of the way in which these risks act as an incentive for businesses to
enhance the public reporting of their economic and socio-economic performance.
2 1.2 Overview of the Economic Benefits Gap .
“The long-term prosperity of companies ultimately rests upon a favourable and
stable political, legal and regulatory climate. If broad political opinion turns against
them, the very core of their business can be endangered.”
Insight Investment (2003) Defining Global Business Principles, p246
6 See: www.insightinvestment.com/documents/responsibility/GBP_project_report.pdf
4

Assessing Business Development Impact: A Management Framework for Improved Economic and Socio-Economic Performance Reporting
There is now evidence of the reality of the ‘oil curse’7 in developing countries, which
in turn is creating pressures both in-country and internationally for increased
transparency in public sector fiscal management and in the payments by oil
companies of resource rents. These political pressures are compounded by the
transnational nature of the oil industry, vulnerable as it is to the charge by domestic
political forces (be they right or wrong) that foreign-owned companies are exploiting
nationally-owned resources. Further, the increased interest in corporate social
responsibility issues has focused more on the contribution of the business to local
and regional economic and social development. This is in contrast with many
western countries, where the emphasis is on environmental protection, labour
standards and corporate governance.
Stimulated by the media, the combined effect of these pressures has been to raise
expectations, among both the general population and those living in oil and gas-
producing regions, of the need for the host nation to be seen as receiving its ‘fair
share’ of the benefits from oil and gas investments. Although equally true across
other sectors – water, power, mining, transportation – it is in the high-profile capital-
intensive hydro-carbons (and other extractive industries) sector where in-country
popular support for foreign direct investment is fast becoming ‘business critical.’
It seems no longer sufficient for foreign investors and operators to assume that the
general population (or, more specifically, the population living in oil production or
transportation regions) will perceive there to be connectivity between investments in
upstream oil and gas projects, and public sector efforts to redistribute resource rents
through expenditure frameworks (poverty-focused or otherwise). Nor should it be
taken as given that company-driven localised community investment programmes
will successfully bridge the gap between the expectations of local people for
immediate benefits, and the delays in revenue redistribution to the oil-producing
region. A study by the World Bank as part of the Extractive Industries Review,8 found
that “all stakeholder groups recognise that the distribution of benefits and costs is
the crucial issue in EI [Extractive Industries],” and yet the “…IFC [along with other
development banks and many companies] typically has not calculated shares
accruing to different levels of government or accruing direct to local communities.”9
There is in short, an economic ‘benefits gap’. Figure 1, overleaf, shows
schematically how this gap emerges. In the context of upstream oil and gas field
development, first, the interim local economic benefits of the construction phase are
7 Auty, R. and Mikesell, R. (2000) Sustainable Development in Mineral Economics. Oxford University Press. Karl, T. L. (1997) The Paradox of Plenty: Oil Booms and Petro-States, Studies in International Political Economy, No. 26, University of California Press. Gelb, A. (1998) Oil Windfalls: Blessing or Curse, World Bank Research Publication. Washington DC: World Bank. 8 OED/OEG (2001) Extractive Industries Review, Internal World Bank Group Assessment, Annex D, IFC Experience, p81 9 ibid, p82
5

Assessing Business Development Impact: A Management Framework for Improved Economic and Socio-Economic Performance Reporting
often limited, owing to the short-term nature of employment opportunities and
technical constraints on employment and supply chain access for local people and
firms arising from a low level of capacity.
Second, there is the time delay between the end of the period of construction-related
opportunities and the advent of improvements in public services arising from the
distribution of production revenues, a delay accentuated by the extended capital
expenditure cost-recovery period integral to many upstream capital investment
projects.
Third, even when revenues have accrued within central government, the correct
proportion may not return to the operating provinces: either because the legislation
is not in place; for fiscal priorities such as international debt repayments; or as a
result of inefficiencies, mis-management or corruption in expenditure management
at the national or provincial level.10
Fourth, where redistribution to the provinces is forthcoming, this may simply be used
to satisfy existing, recurrent, administrative expenditure, rather than to develop new
or enhanced public services.
Fifth, community investment throughout the life of the project tends to be targeted at
only a few directly affected people, fuelling inter-community jealousies. And finally,
the dominance of central government – partly in an effort to manage the economic
volatility of revenues caused by fluctuating commodity prices – means that
municipal and provincial governments receive relatively low levels of direct local tax
receipts from the investments.
There is evidence that in some countries this economic ‘benefits gap’ has already
been recognised at the public policy level, as demonstrated, for example, by the
emergence of attempts to achieve harmonisation of ‘local content’ requirements
across oil-producing African countries11 and elevated ‘local content’ clauses in the
recent production sharing contracts, as in Trinidad and Tobago (see Box 1).
10 ibid 11 For example the African Association of Petroleum Producers (APPA) is preparing an initiative to entrench local content provisions in upstream laws enacted across the continent (Upstream newspaper, 14th May 2004).
6

Assessing Business Development Impact: A Management Framework for Improved Economic and Socio-Economic Performance Reporting
Figure 1 Schematic Representation of the Economic ‘Benefits Gap’ in Upstream Oil and Gas Development
profit oil - state
profit oil - International Oil companies
Signatory payment
Income/profit tax - central governmentCost recovery and tax waivers
profit oil - National Oil Company/central government
profit oil - re-distributed to oil producing regions
CapEx
OpEx
5 – 10 yrs 3 – 10 yrs 20 years +
• No revenues, signatory payments not distributed
• Minimal direct employment
• Short-term (sometimes corrupt) supplier and sub-contractor opportunities, with high technical/skill barriers to entry
• Narrowly focused community investment
• Delays in revenue distribution
• Inefficiencies in public expenditure management and distribution (central govt and provincial)
• Limited employment and supply chain opportunities
• Unsustainable community development projects
• Operational infrastructure isolated from local population
Bene
fits G
apCa
pital
flows
-
+
Gove
rnme
nt Re
ceipt
s
Also evident internationally is the plethora of academic papers and roundtable
initiatives12 on the ways in which states can better manage and distribute petroleum
revenues to, inter alia:
prevent ‘Dutch Disease’ (eg through precautionary extra-budgetary oil funds);
smooth out the inherent price volatility of the oil market (eg through hedging and other
futures strategies);
bring forward the timing of revenue streams into government (eg through elevated
signatory and bonus payments and social funds);
enhance the impact of revenue-sharing with oil-producing regions (eg through the
phasing of field development infrastructure with regional infrastructure development
plans and industrial zoning).
12 For example: Daniel, P. (2004) Petroleum Revenue Management: An Overview, World Bank, ESMAP Programme, draft. Clark, A. and Clark F. (1999) The New Reality of Mineral Development: Social and Cultural Issues in Asia and the Pacific Nations, Resources Policy, 25, 3. Publish What You Pay – www.publishwhatyoupay.org Extractive Industries Transparency Initiative – www2.dfid.gov.uk/news/files/extractiveindustries.asp
7

Assessing Business Development Impact: A Management Framework for Improved Economic and Socio-Economic Performance Reporting
Despite these initiatives though, domestic
political pressures are mounting in many
countries, and the consequences of oil and
gas investments failing to meet national,
regional and local economic expectations may
be far reaching. Already, investment in the
mining and minerals sector in the Philippines
– which suffers many of the same criticisms
and challenges as does upstream onshore oil
and gas development such as a lack of local
economic benefit and poor record on
sustainability – has all but been halted by the
political actions of national NGOs. Currently
only two foreign operators are active in the
country. Ten other major foreign operations
have closed or been suspended since 1997,
and the industry’s contribution to export
earnings has fallen from a high of 25% to less
than 2%.13 With the equity-holding rights of
all foreign-owned investments under legal
challenge by national NGOs at the highest
judicial level, there is a very real risk that the
gas sector may be next.14
Box 1 The Importance of Local Content in Securing New Business
In 2003 the Government of Trinidad and Tobago signed a Production Sharing Contract (PSC) with BHP Billiton and its co-venturers, TotalFinaElf, Talisman and British Gas.
“We in Trinidad and Tobago appreciate and welcome the high level of interest shown by the international community in our local energy sector. My challenge to you though, our partner, is to join with us to also invest in and build our local capability. It is critical that we invest in our people, skills and local businesses that support the energy value chain. If our growth scenario is to materialise, it is important for us to invest in local content now.
“Currently, the Ministry is reviewing many of the issues involved in ensuring that guidelines for minimum local content in projects and activities are met and that procedures are developed to ensure compliance. Although there is presently collaboration between the state and some private companies on this matter there is a definite need for more coordination and an aggressive approach by companies. It requires a greater cooperation between government, industry, educational institutions and local businesses.”12
…one year later…
“Let me firstly congratulate BHP Billiton and their partners in Block 2(C) Total and Talisman for the confidence they are demonstrating in the ability of local contractors and suppliers to meet their fabrication needs. As your development plans have progressed, I am pleased to note that Damus will be the local supplier for this contract, a marvellous opportunity for a local company to build capacity on the fabrication side of the energy industry. It is hoped that other local contractors will benefit from such transfers of technology and knowledge in the long run and I expect that this BHP Billiton initiative will be the first of many more to come. It is the view of the Government of Trinidad and Tobago that such partnerships are critical to its overall goal of sustainable development as the country moves towards realising developed country status by the year 2020.
“Ladies and Gentlemen, one of the key challenges facing the Government of Trinidad and Tobago is the equitable distribution of the country’s wealth to the benefit of the widest cross-section of its citizens. …In this context, the Government of Trinidad and Tobago views the creation of local expertise in the energy sector which is transferable to other sectors of the economy, as critical to building local human resource capacity. In addition, the Government will institute measures to ensure that a significant portion of capital expenditure investment in the energy sector is channelled into the local for economy. …the Government of Trinidad and Tobago has identified several strategies as the means of achieving this goal. Amongst these are increasing the productive capacity of local business for both domestic and export markets as well as increasing local enterprises’ share in projects with heavy capital inflows from Foreign Direct Investment.”13
Hon Eric Williams, Minister of Energy and Energy Industries
2.1.3 Weaknesses in Current Economic and
Socio-Economic Reporting
At the operating level in many low-income
countries, a general absence of domestic
regulation requiring companies to report on
their economic, environmental, and social
performance (also know as the triple bottom
line) has led many major multinational
companies to turn to international ethical standards for guidance. Most commonly
used are the United Nations Global Compact principles (human rights, labour, the
environment and anti-corruption), the International Labour Organization core
conventions (human and labour rights), AA1000 Assurance Standard (sustainability
13 Hubo, C. (2003) Exploring Alignment between the Social and Environmental Practices of Mining Industry and Public Sector Development Priorities in The Philippines, Working Paper, World Bank, CSR Practices Unit. 14 In February 2003 the Supreme Court of the Philippines declared illegal the right for foreign companies to hold more than 60% equity in a joint venture. The decision was not limited to the mining and minerals sector but in theory affects all industries. At the time of writing the ruling was being challenged. www.energy.gov.tt/documentlibrary.incLinks.asp?Linkid=101 www.energy.gov.tt/documentlibrary/incLinks.asp?Linkid=196
8

Assessing Business Development Impact: A Management Framework for Improved Economic and Socio-Economic Performance Reporting
Box 2 The Global Reporting Initiative (GRI) G3 Economic Indicators
Economic Performance
Cor
e
EC1
Direct economic value generated and distributed, including revenues, operating costs, employee compensation, donations and other community investments, retained earnings, and payments to capital providers and governments.
Cor
e EC2 Financial implications and other risks and opportunities for the organization’s activities due to climate change.
Cor
e EC3 Coverage of the organization’s defined benefit plan obligations.
Cor
e EC4 Significant financial assistance received from government
Market presence
Add
ition
al
EC5 Range of ratios of standard entry level wage compared to local minimum wage at significant locations of operation.
Cor
e EC6 Policy, practices, and proportion of spending on locally-based suppliers at significant locations of operation.
Cor
e EC7 Procedures for local hiring and proportion of senior management hired from the local community at locations of significant operation.
Indirect economic impacts
Cor
e
EC8 Development and impact of infrastructure investments and services provided primarily for public benefit through commercial, inkind, or pro bono engagement.
Add
ition
al
EC9 Understanding and describing significant indirect economic impacts, including the extent of impacts.
performance including social,
environmental and economic), and
ISO14001 (environmental management).
There is also an array of sector or process
specific standards that are used by
companies to measure their economic,
environmental, and social impacts.
Clear and transparent reporting of
performance underpins these and other
standards, and has become in itself a tool
to tell a story about a company’s
contribution to sustainable growth,
poverty reduction and human
development issues.15
One of the most widely accepted
frameworks for reporting sustainability is
the Global Reporting Initiative (GRI). The
cornerstone of the GRI framework is the
Sustainability Reporting Guidelines, the
third and most recent version of which –
known as the G3 Guidelines – was
published in 2006. Other components of
the framework include Sector
Supplements (unique indicators for
industry sectors, developed in 2005-06)
and Protocols (detailed reporting
guidance, 2006) and National Annexes
(unique country-level information, due to
be developed in 2008).16 The GRI G3 economic indicators are listed in Box 2.
Sustainability reports based on the GRI framework can be used to benchmark
organizational performance with respect to laws, norms, codes, performance
standards and voluntary initiatives; demonstrate organizational commitment to
sustainable development; and compare organizational performance over time. GRI
promotes and develops this standardized approach to reporting to stimulate
demand for sustainability information – which will benefit reporting organizations
and those who use report information alike.
15 Slater, A (2004) GRI’s Economic Performance Indicators: Measuring Impacts One Stakeholder at a Time. Amsterdam: Global Reporting Initiative http://www.globalreporting.org/NR/rdonlyres/E782C8D3-5B6B-435F-8826-F48DAFBD26A0/0/SlaterEconomicPerformanceIndicators.pdf 16 http://www.globalreporting.org/AboutGRI/WhatWeDo
9

Assessing Business Development Impact: A Management Framework for Improved Economic and Socio-Economic Performance Reporting
Over the past five to ten years, these standards have played a part in helping some
multi-national energy companies frame their own operational ‘safeguard’ policies
and practices (ie the prevention or mitigation of social and environmental harm and
of corporate governance risks) in areas such as labour rights, human rights,
environmental management, ethical sourcing, bribery and corruption.
The various existing reporting initiatives are under constant development and
refinement. Indeed, there is room for further work to provide a more detailed
methodology for assessing some kinds of economic impacts, and incorporate some
of the additional analytical dimensions that are discussed in this report, for example
in relation to the economic and socio-economic distribution of benefits, and the
economic multiplier performance of investments.
To date many companies have focused reporting of their development contribution
on community investment programmes and measures of Cash Value Added (CVA).
This leaves companies exposed for at least two reasons. Firstly, community (or
social) investment programmes, although often rationalised as a form of operational
risk management, tend to have little to do with core business activities, instead
playing a role as a form of global reputational assurance.17 Reporting financial
contributions to community investment programmes may satisfy to some extent
institutional ethical investors and international community development NGOs that
companies are doing ‘something’ to build a relationship with society, but it is
unlikely to provide sufficient information to persuade the wider domestic political
audience that, in the country as a whole, the business is a positive force for social
and economic development.
Further, as proportionate expenditure on community investment increases,
institutional investors have a new concern – that this expenditure might begin to
materially affect overall earnings. As one anonymous ethical investment analyst
recently explained, “What is most important is not to prove that community
investment programmes realise local benefits, but that this expenditure is ‘cost
neutral,’ ie does not adversely affect the overall financial performance of the
business.”
Secondly, with respect to the reporting of Cash Value Added (CVA), in economically
poor and poorly governed countries such information is limited as a means of
providing assurance to investors and ‘credible witnesses’ (media, NGOs, opinion
formers etc) that the investment is generating an adequate rate of economic return.18
17 There are of course exceptions, such as in Nigeria, where there is a strategic attempt to link investment in community development to reductions in crude oil deferment. SPDC (2003) People and the Environment AnnualReport, Port Harcourt: Shell Petroleum Development Company, Nigeria 18 It seems likely that accountants were influential in the selection and design of the GRI economic indicators, which might explain the promotion of indicators that present figures taken directly from the financial accounts (principally from the profit and loss account/income statement) as surrogates of economic benefit.
10

Assessing Business Development Impact: A Management Framework for Improved Economic and Socio-Economic Performance Reporting
Although in theory the financial value added (the difference between the costs of raw
materials and payments to suppliers) is available for distribution to employees,
governments, investors and local communities, in the upstream oil and gas business
in developing countries obstacles to the equitable distribution of this value are
many. For example:
in many low-income countries, public sector finance suffers from institutional
weaknesses, and may be ineffective in managing the volatility of resource rents
in relation to exchange rate stability, or in allocating revenues to public
expenditure priorities, including development or poverty reduction programmes
targeted at the region of operations;
dividends tend to return to the equity holders of the joint venture partners, who,
other than the ubiquitous national oil company partner, are frequently
‘incorporated’ outside the host country;
the economic value added to society from capital expenditure during the
development phase of upstream investments may be constrained by technical
limits that act as barriers to local people realising employment opportunities or
to supply chain entry for local firms;
with regard to operational expenditure, once operating the upstream oil and gas
business is rarely employment intensive and the same supply chain constraints
often apply; and
the positive economic impact of tax allowances that encourage e-investment in
new ‘expansion’ projects, can be undermined if companies intentionally
schedule their expansion programmes to minimise tax payments on a rolling
basis.
r
To be meaningful to stakeholders living within the host society, overall figures on
contribution need to be given context so that their relevant magnitude and
significance can be gauged. What is also needed is to know how overall figures
break down at the country level and over time, and the significance of this
breakdown to the country or audience in question. For example, is the majority of
this expenditure during the development phase of an oil or gas field project, and
does it represent 5% or 0.005% of GDP? What proportion of expenditure was made
through firms who employ people living within the oil or gas producing region; and
within this, what proportion provides direct or indirect (supplier-related) employment
benefits to directly affected communities?
11

Assessing Business Development Impact: A Management Framework for Improved Economic and Socio-Economic Performance Reporting
Returning to the example of the GRI economic indicators, it is understood that the
issue of ‘significance’ in the reporting of economic impacts did arise during initial
discussions to define the GRI 2002 economic indicators.19 Indeed, progress was
made in incorporating supplementary information that would provide some broader
economic context to the financial numbers. For example, the 2002 indicator EC2 on
revenues (which in the G3 version, is split between EC1 and EC3) suggests
companies report not only the financial figure for net sales of products and services
but also report market share and sales for countries where national sales represent
more than 5% of a country’s GDP. One can thus argue that the principle of reporting
the economic significance of financial performance does underpin some of the GRI
economic indicators. More though, could perhaps be done to extend this idea of
reporting the significance of financial figures to take account of the interests of
different stakeholder groups and of the distributional effects of economic impacts.
2002 indicator EC13 on indirect economic impacts makes a start in this direction,
and further progress has been made in the equivalent EC9 in the G3 version,20 but it
is not considered a ‘core’ indicator, and is still a narrative and mostly qualitative
indicator. The management framework presented in Section 4 of this report offers
some ideas to improve reporting of the significance and distribution of positive
economic impacts.
The gaps in identified in the GRI 2002 economic indicators explain in part the new
sectoral focus of the GRI in developing the G3 indicators with sector supplements
and national annexes. As these discussions move forward, a clear distinction is
needed between the use of financial figures as economic surrogates and the
interpretation of these numbers in terms of their distribution as benefits across
society. But, linking economic benefits reporting to the financial accounts is
important, and should be retained, not least because it helps to inform the
commercial business case for the company’s efforts in this arena. Where more effort
is needed is in interpreting the significance of these numbers in terms of their
contribution to public policy targets for national or local economic development, and
in terms of the way in which economic benefits are distributed to different parties at
the local, provincial, national and international levels.
In summary, countries where economic development is poor and the public sector
inefficient, disclosure of Cash Value Added provides a shallow basis for reporting the
economic and socio-economic rate of investment return. Offering financial numbers
as economic surrogates provides audiences little context for interpreting either
whether these are meaningful to the priorities of local, regional or national society,
or whether they reflect well on the short or long-term status of the business. Put
more candidly, few are impressed when a big company generates big numbers.
19 A. Henriques, pers comm., Sept 2004 20 Global Reporting Initiative G3 Indicator changes http://www.globalreporting.org/NR/rdonlyres/8F4781CA-BB96-4B68-8FBD-A1CC3AA0E353/563/IndicatorChanges_G2DraftG3_FinalG4.xls
12

Assessing Business Development Impact: A Management Framework for Improved Economic and Socio-Economic Performance Reporting
What impresses more is an honest
interpretation of the relevance of these
numbers to the social, economic and
investment priorities of those receiving
the information. A number of other
initiatives point to the need for reporting
a deeper analysis of the components of
Cash Value Added. These are given in
Box 3.
Box 3 Initiatives That Have Sought to Deepen Economic and Socio-Economic Reporting
• the IFC economic framework for assessing development
impact – a valuation model promoted by the International Finance Corporation which uses a stakeholder-orientated approach to measure the economic additionality of private sector investment. The framework measures, for example: the economic benefits of staff training; technology and skills transfer to local supplies and contractors; effects of supplier and distribution networks; local market development; and the multiplier effect on local trade through procurement (IFC (2002) Results on the Ground – www2.ifc.org/economics/pubs/results.htm)
• the Sustainability Framework of the International Finance
Corporation, which offers a means to rank companies against a suite of environmental, governance and socio-economic performance standards. With regard to socio-economic performance, companies achieve the highest level of ranking only if they have a wide influence in driving best practices in the areas of local economic growth and SME development, and/or enter into public-private policy dialogue relating to revenue management and improvements in the legal framework for revenue-sharing that leads to results in substantive change at the national level (IFC (2003) Measuring Sustainability: a Framework for Private Sector Investments – www2.ifc.org/sustainability/docs/measuring_sustainability.pdf)
• the World Bank CSR-Public Sector Diagnostic Framework,
which includes monetary flows to the public sector, employment and human resource development, technology transfer, and procurement and supply-chain management (Corporate Social Responsibility Practice, World Bank – www.worldbank.org/privatesector/csr/prac_work_prog.htm)
• studies on the role of public sector in incentivising foreign direct
investment point to the main benefits of FDI, including: improvements in balance of payments, growth in domestic savings and investment, transfer of input technology and skills, job creation, environmental benefits, stability in foreign inflows of funds and higher export growth (for example, Mehta and Dugal (2003) ABC of FDI, pub, India: CUTS)
• a framework for ‘pro-poor’ investment framework developed
by Emerging Markets Economics for the UK Department for International Development. This looks at the contribution of business in three ways: (i) conventional economic growth, in the form of ‘revenues-less-expenditure’ on wages, depreciation, interest, tax and profit; (ii) socio-economic benefits, in the form of business activity that inherently contributes to social inclusion and social development arising from, inter alia, the geographic location of business activity, the extent of market penetration, the effect of distribution channels, the types of labour requirements, local business linkages and local multiplier effects, revenues reinvestment in the local area, and the redistribution of taxation; and (iii) socially responsible business practices, such as goods and services designed for low-income consumers, social investment and charitable giving (including partnerships with local communities), efforts to maximise local content through procurement and sub-contracting, and employment policies that favour the disadvantaged (DFID – www.dfid.gov.uk search: ‘pro poor investment’)
2.1.5 Beyond Cash Value Added
The focus on a breakdown of Cash Value
Added is further limited by the omission
of other ways in which upstream oil and
gas development businesses interact
with the development priorities of poor
countries. Areas of reporting that could
benefit from a ‘widening’ of the current
focus of economic reporting on CVA
include the performance of the business
in contributing to:
macro-economic stability;
an improved foreign investment
climate;
a stable and predictable tax base;
direct product and services utility
(mobility, lighting, energy, product
R&D eg solar);
the indirect impact of products and
services on public services: health,
education etc;
the transfer of ethical and quality
standards to subsidiary company
shareholders and suppliers/ contractors;
13

Assessing Business Development Impact: A Management Framework for Improved Economic and Socio-Economic Performance Reporting
operational infrastructure that provides a public service (eg certain facilities
access roads or port facilities, or PPP arrangements for dual-purpose power
generation or water supply); and
community investment activities that contribute to regional and national level
development, such as in the area of economic planning.
Overall, it would seem fair to conclude that international standards for reporting the
economic and socio-economic benefits of business in the context of the
development priorities of poor countries could be improved.
2.1.6 Trends in Investor Analysis
There is though perhaps a more fundamental change taking place in the field of
corporate reporting than working up new economic indicators. Institutional portfolio
investors have for some time relied on Socially Responsible Investment (SRI)
information for companies reporting their performance against aggregated generic
indices, which are applied to all business operations regardless of whether they are
operating, sourcing or marketing in developed or developing countries. The way in
which the GRI, FTSE4GOOD, and Dow Jones sustainability indices have been applied
are cases in point. As companies move into developing countries, and social and
economic issues become more important, some SRI fund managers21 are beginning
to find that the benefits of being able to compare companies directly against a
common set of indicators are outweighed by the limitations of such ‘comparability’
as a means of informing investors of their true exposure to reputational and
commercial risks.22
SRI fund managers and in-house corporate governance analysts have responded to
these shortcomings by increasing their direct ‘engagement’ with companies at the
corporate level. These face-to-face visits focus on pre-selected environmental, social
and governance topics allowing, in theory, the analyst to gather information on the
areas of highest commercial risk or opportunity, and provide a level of confidence
that the risks are being properly managed and the opportunities realised.
This is the theory. In practice it seems that at present the emphasis in ‘engagement’
strategies remains centred on generalised topics rather than specific risk events or
opportunities at specific locations and that might have a bearing on a company’s
revenues, profitability or cash flow or its long-term business growth. Further,
engagement strategies tend to be built around the more mainstream environmental
and social issues of the day: global warming, human rights (child labour), and
21 Personal experience of the author. 22 Beyond the recognised shift in the geography of earnings, another possible cause of this change of heart in the investment community could in part be the introduction of the mandatory ‘Live Risk Register’ for UK-listed companies, which profiles location-specific commercial and non-commercial risks.
14

Assessing Business Development Impact: A Management Framework for Improved Economic and Socio-Economic Performance Reporting
community (social) investment. Direct engagement on a company’s performance in
contributing to the broad sweep of economic and socio-economic benefits in relation
specifically to its developing country operations seems not to have materialised in
any depth.
Despite these limitations, the strategy of institutional investors to extend their
analysis from simply the comparison of companies against aggregated generic
indicators, to direct engagement on particular issues, is of significance. It is
arguably symptomatic of a broadening of the basis for fund management decision-
making in relation to governance issues from the use of aggregated Group-level
information, towards the use of information on operation-specific, short-term
operational risks and long-term growth prospects, material to the commercial
fortunes of the Group as a whole. There is hope then that before long fund managers
with energy companies in their portfolios will begin to assess whether future returns
for their clients (such as the large pension funds) might not be tied in part to the
domestic political and social acceptability of the upstream hydro-carbons industry in
the Group’s main growth centres. Where this is thought to be the case, an
engagement strategy will be needed that focuses discussion not only on whether, as
a whole, the Group has policies and systems in place to assess and mitigate the
conventional range of potentially adverse environmental and social impacts of oil
and gas operations, but how individual operations are contributing to the
distribution of in-country economic and socio-economic benefits.
To be more specific, it is quite likely therefore that in the near future engagement
with corporations by investor analysts will require evidence of the ways in which
‘high-risk’ or ‘high opportunity’ subsidiaries, joint ventures or country businesses are
contributing to regional and national economic and socio-economic development
priorities. Those subsidiaries, joint ventures etc that can demonstrate that they are
systematically gathering, reporting, and continually enhancing their economic and
socio-economic performance in relation to the priorities of the host government and
those living in operating regions, are likely to be rewarded by the mainstream
investor community.
2.1.7 Conclusions
Within many of the world’s multi-national integrated oil and gas companies, the
geographic shift of growth centres towards underdeveloped countries and regions in
Africa, Asia and Latin America carries new risks for both near-term earnings and long-
term access to business opportunities. Expanding the business principally through
upstream developments in developing economies demands not only external
investor confidence but also broad in-country political support. The greater the
reported mutuality between, on the one hand, the internal returns on oil and gas
15

Assessing Business Development Impact: A Management Framework for Improved Economic and Socio-Economic Performance Reporting
investments and, on the other, in-country economic and socio-economic
development benefits at the local, provincial and national level, the more likely it is
that this political support will be maintained and shareholders satisfied.
However, delivering and reporting enhanced economic and socio-economic
performance is not easy. Oil and gas production in low-income countries and
regions brings about an array of complex commercial, political and governance
challenges. These serve as barriers to achieving connectivity between the activities
of the business and tangible economic and socio-economic benefits within society.
Identifying where exactly this connectivity lies, or might be developed, and finding
meaningful and credible ways to report business performance against it, is the focus
of subsequent sections of this report.
2.2 A ‘Drift’ in Comprehension The discussion thus far has centred on upstream investments in developing
countries. In downstream manufacturing industries (chemicals, refining) and retail
operations (lubricants, fuel, convenience stores etc) located in more developed
countries, the drivers for socio-economic reporting still exist, though they are
arguably perhaps less urgent. The drivers fall into two categories:
the attention of the media to negative ‘issues’ in the industry; and
the one-dimensional reporting of financial accounts.
Here the economic ‘benefits gap’ is more one of perception, with a drift in
comprehension in the connectivity between the internal activities of downstream
energy companies and their economic impact on wider society.
2.2.1 Dislocation of the Hydro-Carbons Industry from Society
The first driver for change in external reporting is the dislocation in perception
between the general public and the industry, brought about in large part by the
attention of the media to ‘negative issues.’ Over the last ten years, four sets of
issues have come to and continue to dominate:
redundancy in declining oil-producing regions (eg in Aberdeen, Scotland with
respect to the operations in the North Sea), or in regions where oil refinery
operations are losing business to new refineries built in developing countries;
fuel station prices, for example ‘the pump wars’ in the UK in 2000;
16

Assessing Business Development Impact: A Management Framework for Improved Economic and Socio-Economic Performance Reporting
global warming and renewable energy, as noted in John Browne (CEO of BP plc)
in his Stanford 1997 address acknowledging a “link between the concen ation
of carbon dioxide and the increase in temperature;” and
tr
tax exemptions and avoidance vehicles, such as foreign sales corporations
(FSCs), home country tax credits, tax waivers for mergers and acquisitions etc.
The argument put forward in this report is that the focus by the media on the
negative perceptions of the industry has begun to cause a dislocation in the minds
of some opinion-formers. The concern is for a drift in comprehension in terms of a
linkage between the internal activities of the downstream hydro-carbons business
and its external economic impact on wider society. For example, few in the media
report on oil and gas companies as ‘energy’ businesses contributing to mobility,
lighting and heating; or on the ways in which these products in turn contribute to
improvements in almost every aspect of modern life, from health care to education;
or on these companies as innovators in areas such as eco-efficiency technology,
lubricants, solar panels and convenience stores.
As with economic and socio-economic reporting at the operational level in
developing countries, a dedicated framework for reporting that identifies, prioritises
and fuels a narrative on the economic and socio-economic performance of
downstream operations is needed to ‘reconnect’ the business with society.
Currently, there seems to be an absence of a systematised approach to reporting the
positive economic impacts of the hydro-carbons industry at a global or country level,
or the ways in which positive economic impacts might be assessed in the wider
context of the industry’s short and long-term adverse environmental, economic and
social impacts. It should be noted, however, that the management framework for
economic and socio-economic reporting presented in this report makes no attempt
to judge the possible trade-offs between the positive economic contributions of the
business and its adverse impacts, such as against bio-diversity issues, climate
change, health and safety incidents, or localised adverse economic ‘boomtown’
impacts. Indeed, it is difficult to conceive of a credible methodology that would
calculate and report the overall external ‘net benefit’ of an investment on society.
This said, finding a way defensibly and honestly to report the economic and socio-
economic benefits of business will go some way to informing discussions with both
internal and external stakeholders as to where the trade-offs, particularly the socio-
economic trade-offs, might lie.
17

Assessing Business Development Impact: A Management Framework for Improved Economic and Socio-Economic Performance Reporting
2.2.2 One-Dimensional Financial Disclosure
As with reporting on business performance for upstream operations in developing
countries, disclosure of the company’s financial accounts for downstream
operations in developed countries remains the principal source of external
information reporting on broader economic performance. The problem is that the
interpretation is one-dimensional, focusing on what the figures mean only in direct
commercial terms. There is very little interpretation of the financial numbers – opex,
capex, corporate tax, employee and R&D expenditures etc – in terms of the socio-
economic consequences of the business’s financial performance.
The same is true for businesses in developing countries, though this may be
changing. Some operations in poor countries and regions are beginning publicly to
disclose aspects of their socio-economic performance alongside their financial
performance. This includes reporting against local content, payments to
government, human resource development, and community investment.
Nevertheless, it is clear that more work is needed to address shortcomings in
economic and socio-economic reporting for operations in both developed and
developing nations. The framework for reporting described in this study may offer a
starting point. Other work is also needed to clarify the precise pathways through
which core business activities contribute to society, especially with respect to the
impact of integrated oil and gas businesses as ‘energy’ companies.
18

Assessing Business Development Impact: A Management Framework for Improved Economic and Socio-Economic Performance Reporting
3. Overcoming the Challenges to Reporting Economic and Socio-Economic Performance
3.1 Introduction As indicated in Section 2, there have been various attempts, both external and
internal to the major multi-national oil and gas companies, to improve economic and
socio-economic corporate reporting. Among the external initiatives are the
aforementioned Global Reporting Initiative (GRI), IFC Economic Valuation Model, and
the DFID programme on measuring the impact of business on poverty. The internal
initiatives undertaken by energy companies are many. These generally include
annual corporate sustainability or corporate citizen reports; health, safety,
environmental and community reports at the operational level; and disclosed
financial information at the operational and corporate level.
Each of these efforts has met with varying levels of success. Described below are
ideas learned from these efforts for overcoming the main challenges to reporting
economic and socio-economic performance. The ideas form part of a broader
management framework for economic benefits reporting described in Section 4 and
summarised below in Figure 2.
Figure 2 Building Blocks of a Management Framework for Economic and Socio-Economic Performance Reporting
Review sources of information on external stakeholder socio-economic performance priorities
Review sources of information on external stakeholder socio-economic performance priorities
Independent panel reports
Media/published reports
Review internal business priorities for socio-economic performance reporting
Review internal business priorities for socio-economic performance reporting
Socio-Economic Performance ‘Themes’
Socio-Economic Performance ‘Themes’
Reporting ‘narrative’, and main information
requirements
Reporting ‘narrative’, and main information
requirements
Information-gathering already automated and accessible
New automated information-gathering
Annual accounts
Country reports
Management data
Government policy
Scop
ingRe
portin
g Reg
ister
Stakeholder focus groups
Risks and controls
Business context (constraints/ incentives)
Financial figures Other internal management data
External stakeholder priorities (interpretation)
External roles for others in society suggested by the reporting
Internal interviews
Commercial strategies
External opinion formers
19

Assessing Business Development Impact: A Management Framework for Improved Economic and Socio-Economic Performance Reporting
3.2 Reporting the Public Policy Context for Doing Business In compiling this report, many of the company staff interviewed cited the constraints
they were under as an energy business to being able to enhance their economic and
socio-economic contributes to wider society. These included the terms of
transactions with government and national oil companies, for example in relation
with the timing of payments of resource rents; the wider policy context for upstream
development, such as the strategy of the government for export-led economic
growth; or the reality of competition in a global free market which limits the room for
companies to take unilateral actions that might raise costs or reduce returns. The
problem with omitting to report these higher-level legal, contractual, policy and
business constraints is that much of the economic and socio-economic performance
currently reported ‘appears’ to external stakeholders to reflect internal business
decisions and priorities, when in fact these decisions are shaped by forces outside
the control of the business.
An example would be Kazakhstan. Here, the government has adopted an oil-based,
export-led, economic development strategy, supplying markets in Europe in order to
reduce their dependency on Russian supplies. Criticism levelled at oil companies
operating in Kazakhstan for not investing in economic value-adding facilities such as
refineries, distribution etc, would therefore seem misdirected. Companies do make
a choice about where they operate, but are rarely involved in the economic growth
policies of sovereign governments.
What is needed, therefore,
is an approach to
economic and socio-
economic benefits
reporting that provides an
upfront explanation of the
main regulatory and public
sector policy constraints
and incentives acting on
the business, and the
strategies adopted by the
business to work within
these limits. This aspect
of the draft framework is ‘loca
20
(
ted
Figure 3a Business Context (constraints/incentives)
0
Review sources of information on external stakeholder socio-economic performance priorities
Review sources of information on external stakeholder socio-economic performance priorities
Independent panel reports
Media/published reports
Review internal priorities for socio-economic performance reporting
Review internal priorities for socio-economic performance reporting
Socio-Economic Performance ‘Themes’
Socio-Economic Performance ‘Themes’
Reporting ‘narrative’, and main information
requirements
Reporting ‘narrative’, and main information
requirements
Information-gathering already automated and accessible
New automated information-gathering
Annual accounts
Country reports
Management data
Government policy
Scop
ingRe
portin
g Reg
ister
Stakeholder focus groups
Risks and controls
Business context
(constraints/ incentives)
Business context
constraints/ incentives)
Financial figures Other internal management data
External stakeholder priorities (interpretation)
Roles for others in society suggested by the reporting
Internal interviews
Commercial strategies
External opinion formers
’ in Figure 3a. For detail refer back to Figure 2.

Assessing Business Development Impact: A Management Framework for Improved Economic and Socio-Economic Performance Reporting
3.3 Tracking Socio-Economic Benefits through the Financial
Accounts More so than the external disclosure of localised community investment
programmes, reporting the wider economic and socio-economic contributions of
energy companies at the regional and national levels will need to be closely tracked
in financial terms by each business. Internal assurances will be needed that the
information reported is defensible, and that any targets set for improving
performance over time, in particular those which might lead to modifications to core
business practices such as sub-contracting or facilities maintenance, reinforce rather
than undermine core business objectives (see Section 3.6 on managing the risks of
reporting).
To meet these requirements, the draft framework for socio-economic performance
reporting proposed in this report draws on recent thinking in Benefits Realisation.23
This is the process of tracking the deployment of a company’s resources and
expenditure to assure compatibility between the outcomes of an activity and the
original strategic business objectives that lay behind the deployment decision. In
the case of reporting economic and socio-economic benefits, this means, for
example, tracking improvements in localising the use of sub-contractors, so that not
only socio-economic improvements are recorded (eg increased local employment
opportunities and economic multiplier effects) but also the consequent operational
expenditure savings in contracting costs to the operating company.
s
Such ‘benefits tracking’ will be easier to sustain over time, and more likely to point
towards a ‘win-win’ outcome for the business and wider society (ie delivery of a
‘mutuality’ of benefit for internal and external stakeholders) if the process of
gathering data for reporting is linked to the mainstream financial accounting and
management data systems (see Figure 3b). This will mean working with specific line
items in the existin
financial accounts (P&L
Cash Flow or Balanc
Sheet) and drawing o
related data managemen
systems. The approac
has the added attractio
of ensuring that, a
guidance for benefit
reporting evolves it wi
be truly integrated wit
23 Warner, M. (2003) Putting the SLondon: Overseas Development Inwww.odi.org.uk/PPPG/activities/
g
,
e
n
t
h
n
s
s
ll
h
ustastit
coun
Figure 3b Financial Figure
17
Review sources of information on external stakeholder socio-economic performance priorities
Review sources of information on external stakeholder socio-economic performance priorities
Independent panel reports
Media/published reports
Review internal priorities for socio-economic performance reporting
Review internal priorities for socio-economic performance reporting
Socio-Economic Performance ‘Themes’
Socio-Economic Performance ‘Themes’
Reporting ‘narrative’, and main information
requirements
Reporting ‘narrative’, and main information
requirements
Information gathering already automated and accessible
New automated information gathering
Annual accounts
Country reports
Management data
Government policy
Scop
ingRe
portin
g Reg
ister
Stakeholder focus groups
Risks and controls
Business context (constraints/ incentives)
Other internal management data
External stakeholder priorities (interpretation)
Roles for others in society suggested by the reporting
Internal interviews
Commercial strategies
External opinion formers
Financial figures
Financial figures
inable Development Performance of Companies on the Balance Sheet.
ute – try_level/odpci/c3software/BalanceSheet.pdf
21

Assessing Business Development Impact: A Management Framework for Improved Economic and Socio-Economic Performance Reporting
the business, helping to make ‘triple bottom line’ reporting a reality, and to prevent
the principle of ‘mutuality’ being narrowly interpreted as a bolt-on, unconnected with
the reporting of internal financial returns.
3.4 Meaningfulness of the Information Disclosed As discussed earlier, the indicators adopted under existing initiatives usually offer
little context within which to judge whether the value cited is significant in terms of
its contribution to some economic or social priority in society. In other words, the
‘magnitude’ of the variable is reported, but less so its ‘significance’.
The draft framework for
reporting developed in this
study seeks to stimulate the
disclosure not only of
financial information but
also of additional
‘interpretive’ information
(see Figure 3c). This
interpretive data takes two
forms:
internal (non-financial)
management
information, such as the
number of employees,
proportion of nationals ver
and
sus
external contextual information
proportion of average national
proportion of total number of lo
In addition, and as noted, Cash
indicators can be a poor reflection
development priorities of poor co
deepening of the choice of theme
needed: one which allows for a c
business in terms of the developm
achieve this, the framework prom
compilation of information for r
22
Figure 3c Internal Management Data and External Priorities
17
Review sources of information on external stakeholder socio-economic performance priorities
Review sources of information on external stakeholder socio-economic performance priorities
Independent panel reports
Media/published reports
Review internal priorities for socio-economic performance reporting
Review internal priorities for socio-economic performance reporting
Socio-Economic Performance ‘Themes’
Socio-Economic Performance ‘Themes’
Reporting ‘narrative’, and main information
requirements
Reporting ‘narrative’, and main information
requirements
Information-gathering already automated and accessible
New automated information-gathering
Annual accounts
Country reports
Management data
Government policy
Scop
ingRe
portin
g Reg
ister
Stakeholder focus groups
Risks and controls
Business context (constraints/ incentives)
Financial figures Roles for others in society suggested by the reporting
Internal interviews
Commercial strategies
External opinion formers
External stakeholder priorities
(interpretation)
External stakeholder priorities
(interpretation)
Other internal management
data
Other internal management
data
expats, or proportion of employees living locally;
, such as reporting average skill-based wages as
wages, or number of employees living locally as
cal unemployed.
Value Added and other conventional economic
of the economic contribution of business to the
untries or local societies. A broadening and
s for economic and socio-economic reporting is
loser fit with the activities and impacts of the
ent agenda of the host country and region. To
otes an early ‘scoping’ exercise to guide the
eporting towards those economic and socio-

Assessing Business Development Impact: A Management Framework for Improved Economic and Socio-Economic Performance Reporting
economic benefits that are a priority (see Figure 3d). The proposed scoping exercise
is not limited to solicitation of benefit priorities from external stakeholders only.
It also encourages the
views of internal staff to
be taken into account,
inviting comment on the
areas in which they
believe the business adds
or could add value to
wider society.
Socio-Economic Performance ‘Themes’
Socio-Economic Performance ‘Themes’
Reporting ‘narrative’, and main information
requirements
Reporting ‘narrative’, and main information
requirements
Information-gathering already automated and accessible
New automated information-gathering
Scop
ingRe
portin
g Reg
ister
Stakeholder focus groups
Risks and controls
Business context (constraints/ incentives)
Financial figures Other internal management data
External stakeholder priorities (interpretation)
Roles for others in society suggested by the reporting
Internal interviewsInternal
interviews
Commercial strategies
Commercial strategies
Review sources of information on
external stakeholder socio-economic
performance priorities
Review sources of information on
external stakeholder socio-economic
performance priorities
Independent panel reportsIndependent panel reports
Media/published reports
Media/published reports
Country reportsCountry reports
Government policy
Government policy
External opinion formers
External opinion formers
Review internal priorities for socio-
economic performance
reporting
Review internal priorities for socio-
economic performance
reporting
Management data
Management data
Annual accountsAnnual
accounts
Figure 3d Scoping Exercise
3.5 Prohibitive Costs of Benefits Reporting Both Shell’s experience with country ‘location reports,’ and the recent surveys
undertaken by Emerging Market Economics for the UK Department for International
Development (DFID) on economic impact reporting in the context of poverty
reduction, show that the costs of economic reporting are not insignificant. Detailed
costings were not available for this study, but most likely run into tens of thousands
of pounds for consultants’ fees plus substantial man hours of internal staff time in
finding or compiling the requested information. Because economic benefits
reporting is not systematised within companies, much of the information has to be
collected through stand-alone surveys or requests for specific information not readily
available within existing databases. According to the site visits conducted for this
study, informational areas particularly lacking with regard to economic and socio-
economic benefits reporting include:
the impact of procurement strategies and supply chain management on
generating economic multiplier effects at the community, municipal and
provincial level;
the effect of capital expenditure on improving local and regional infrastructure;
the impact of products and services on consumers, eg in terms of utility, mobility
etc; and
the impact of operations on local institutions and the legal framework, such as
the effect of stability clauses and international arbitration within production-
sharing contracts.
23

Assessing Business Development Impact: A Management Framework for Improved Economic and Socio-Economic Performance Reporting
For benefits reporting to
become a reality, ways are
needed to reduce the
current dependency on
free-standing surveys and
to move towards
automated data-gathering
and interpretation.
Integration of benefits
reporting with existing
financial reporting is one
way to achieve this,
combined with the use of
‘softer’ management data
to provide interpretation. Furt
introduced into the contracts o
for example requiring informati
of employees, training hours co
Interpreting these data in the
stakeholder priorities is more c
the effectiveness of the aforem
matters,’ as well as accessing
and human development targe
Finance Ministry, World Bank,24
It is worth noting that the upfr
three to five years, or at disc
because it is unlikely that, with
policy environment, the basic b
will change significantly.
3.6 Risks to BusinessIt became clear during the prog
economic benefits carried var
problem is that many of the e
‘directional.’ For example, if a c
making the implicit statement
economic performance of the
24 World Bank Data and Statistics – www.w25 United Nations Human Development Indi
24
Figure 3e Automated Information-Gathering and Interpretation
her, new quarterly reporting requirements could be
f the main engineering and procurement contractors,
on on the registered location of suppliers, nationality
ntributed and technologies transferred.
17
Review sources of information on external stakeholder socio-economic performance priorities
Review sources of information on external stakeholder socio-economic performance priorities
Independent panel reports
Media/published reports
Review internal priorities for socio-economic performance reporting
Review internal priorities for socio-economic performance reporting
Socio-Economic Performance ‘Themes’
Socio-Economic Performance ‘Themes’
Reporting ‘narrative’, and main information
requirements
Reporting ‘narrative’, and main information
requirements
Information-gathering already automated
and accessible
Information-gathering already automated
and accessible
New automated information-gathering
New automated information-gathering
Annual accounts
Country reports
Management data
Government policy
Scop
ingRe
portin
g Reg
ister
Stakeholder focus groups
Risks and controls
Business context (constraints/ incentives)
Financial figures Other internal management data
External stakeholder priorities (interpretation)
Roles for others in society suggested by the reporting
Internal interviews
Commercial strategies
External opinion formers
context of public policy incentives and external
hallenging. Success will depend to a large degree on
entioned scoping exercise in identifying ‘what really
national and international data on macro-economic
ts and indicators available from sources such as the
United Nations25 etc.
ont scoping exercise need only be undertaken every
rete junctures in the life of an investment. This is
in time frames of three to five years, the broad public
usiness strategy or the external stakeholder priorities
of Benefits Reporting ress of this study that reporting economic and socio-
ying degrees of risk to the company. The basic
conomic benefits likely to be reported are implicitly
ompany reports the nationality of its employees, it is
that the more nationals employed, the better the
company. Depending on the skills levels of the
orldbank.org/data ctors – http://www.undp.org/hdr2003/indicator/index_indicators.html

Assessing Business Development Impact: A Management Framework for Improved Economic and Socio-Economic Performance Reporting
available labour pool, improving performance in this area may actually carry
commercial risks. Likewise, by reporting third-party spend on suppliers contracted
from the local region, the company is running the risk that it will, over time, promote
procurement of sub-standard materials and unreliable contractors.
One can see that in the future, as a deeper and wider range of economic and socio-
economic themes are reported year on year and become a de facto performance
target, improvements in performance might actually work against the short to
medium-term commercial interests of the business (notwithstanding the fact that
they might concurrently contribute positively to the company’s reputational and
compliance interests).
The study looked at three
ways of controlling these
reporting ‘risks.’ First, the
scoping exercise,
suggested as a way to
focus on benefit themes
and indicators ‘that
matter,’ now includes a risk
grading column identifying
reporting themes and
information carrying
commercial, compliance or
reputational risks. Second,
explicit ‘control’ measures can
Third, it is recommended th
benefits incorporate an advo
others’ – government agencie
shaping policy or regulatory st
company and share the burd
performance.
With regard to the latter of th
supermajors are actively engag
and public sector authorities t
aimed at improving the rele
investment programmes, the ap
the cost burden and sharing
maximising local content, wid
and national institutions, and c
Figure 3f Controlling the ‘Risks’ of Reporting
be identified to reduce risks to acceptable levels.
at the reporting of economic and socio-economic
cacy component, identifying the possible ‘role for
s, international donors, international NGOs etc – in
andards, or working in partnership to incentivise the
ens of continued enhancement of socio-economic
17
Review sources of information on external stakeholder socio-economic performance priorities
Review sources of information on external stakeholder socio-economic performance priorities
Independent panel reports
Media/published reports
Review internal priorities for socio-economic performance reporting
Review internal priorities for socio-economic performance reporting
Socio-Economic Performance ‘Themes’
Socio-Economic Performance ‘Themes’
Reporting ‘narrative’, and main information
requirements
Reporting ‘narrative’, and main information
requirements
Information-gathering already automated and accessible
New automated information-gathering
Annual accounts
Country reports
Management data
Government policy
Scop
ingRe
portin
g Reg
ister
Stakeholder focus groups
Risks and controls
Risks and controls
Business context (constraints/ incentives)
Financial figures Other internal management data
External stakeholder priorities (interpretation)
Roles for others in society suggested by the reporting
Internal interviews
Commercial strategies
External opinion formers
ese roles (partnerships), BP, Shell and the other oil
ed in developing strategic alliances with civil society
o manage social and environmental issues. Initially
vance and sustainability of short-term community
proach is now being applied with the aim of reducing
the risks of wider economic benefits, such as
ening training opportunities, building local, regional
ontributing to local and regional infrastructure.
25

Assessing Business Development Impact: A Management Framework for Improved Economic and Socio-Economic Performance Reporting
Examples from within
the BP Group include
the Regional
Development Planning
Forum initiated by
BPXC in Casanare,
Colombia, and the
Diversified Growth
Strategy of BP’s
Tangguh LNG project
in the Berau-Bintuni
Bay region of West
Papua, Indonesia.
Both of these are partner
public authority parties
sustainability to the econ
to the region of operat
transparent and effective
latter by stimulating econ
is deemed unsustainab
anticipated pressures.
26
ship
, an
omi
ions
pub
om
le)
Figure 3g External Roles
17
Review sources of information on external stakeholder socio-economic performance priorities
Review sources of information on external stakeholder socio-economic performance priorities
Independent panel reports
Media/published reports
Review internal priorities for socio-economic performance reporting
Review internal priorities for socio-economic performance reporting
Socio-Economic Performance ‘Themes’
Socio-Economic Performance ‘Themes’
Reporting ‘narrative’, and main information
requirements
Reporting ‘narrative’, and main information
requirements
Information gathering already automated and accessible
New automated information gathering
Annual accounts
Country reports
Management data
Government policy
Scop
ingRe
portin
g Reg
ister
Stakeholder focus groups
Risks and controls
Business context (constraints/ incentives)
Financial figures Other internal management data
External stakeholder priorities (interpretation)Roles for others in
society suggested by the reporting
Roles for others in society suggested by the reporting
Internal interviews
Commercial strategies
External opinion formers
-based initiatives involving a range of civil society and
d both seek to scale up and provide long-term
c and socio-economic benefits brought by the company
. The former aims to achieve this through more
lic sector management of oil production revenues; the
ic growth, not immediately adjacent to facilities (which
but in regional towns able to accommodate the

Assessing Business Development Impact: A Management Framework for Improved Economic and Socio-Economic Performance Reporting
4. A Framework for Reporting Economic and Socio-Economic Performance
4.1 Introduction Designed in part to overcome the persistent challenges to meaningful economic and
socio-economic performance reporting, the building blocks of a framework for
gathering, interpreting and reporting the economic and socio-economic benefits of
energy companies is presented as Figure 2 (page 19). Its main applications are
discussed in this section, along with a description of the ways in which the scoping
exercise might be carried out in practice, the importance of compiling different types
of information into Reporting Registers, and a method for managing the inherent
risks.
4.2 Applications
Above all, the framework is intended to broaden external reporting within energy
companies in a manner that makes more explicit the positive linkage between core
business activities and the economic and socio-economic priorities of the host
society.
The framework is intended to be applicable first and foremost at the country
operational level, for example to inform quarterly business reports or the preparation
of annual country-level social and environmental reports. With regard to corporate
reporting, the utility of this will emerge over time. For example, it could be used to
generate a generic set of economic and socio-economic indicators that could be
aggregated across operations, such as in the areas of payments to government, local
content and training.
It could also be applied to generate a global map (accessible online or in hard copy)
showing how oil and gas operations around the world contribute to the economic
and socio-economic performance of the country in which they operate. As illustrated
overleaf in Figure 4, ‘drop-down’ boxes would allow the user to look at the overall
scope of economic and socio-economic reporting for a particular country, as well as
to access detailed data for each of the prioritised ‘benefit’ themes.
4.3 Scoping An evolving checklist of potential positive economic and socio-economic reporting
categories and themes for the hydro-carbons industry is presented overleaf in Table 1.
27
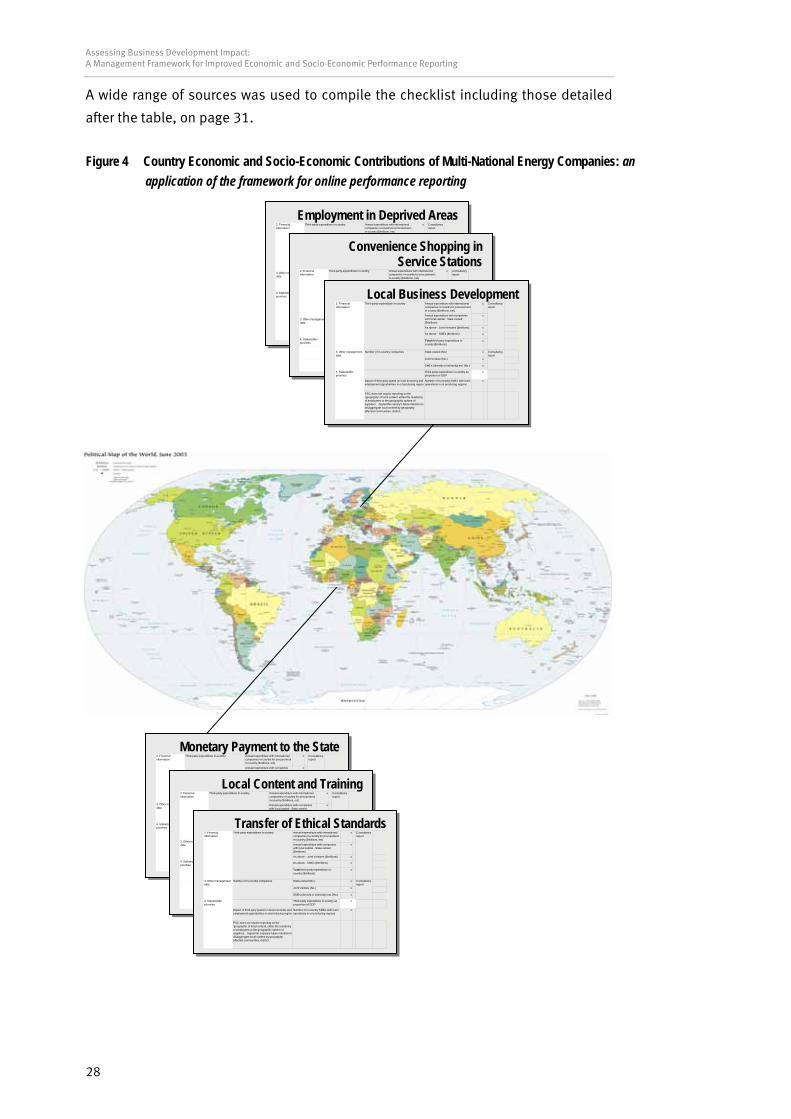
Assessing Business Development Impact: A Management Framework for Improved Economic and Socio-Economic Performance Reporting
A wide range of sources was used to compile the checklist including those detailed
after the table, on page 31.
Figure 4 Country Economic and Socio-Economic Contributions of Multi-National Energy Companies: an application of the framework for online performance reporting
Employment in Deprived Areas
Annual expenditure with international xThird-party expenditure in-country Consultancy companies in-country for procurement in-country ($millions, est)
Total third-party expendit
State-owned (No.) x
Joint Venture (No.) x
Impact of third-pary employment opportun operations in oil producing regions
PSC does not require reporting on the 'geography' of local content, either the residency of employees or the geographic sphere of suppliers. Signal the copany's future intention to disaggregate local content by geography: affected communities, district,
2. Financial information
Number of in-country companies 3. Other management data
Consulreport
report
4. Stakeholder priorities
Annual expenditure with companies with local capital - State owned ($millions)
x
As above - Joint Ventures ($millions) x
As above - SMEs ($millions) x
ure in - x
tancy
country ($millions)
SMEs (directly or indirectly) est. (No.) x
Third-party expenditure in-country as proportion of GDP
x
umber of in-country SMEs with main xspend on local economy and ities in oil producing region
N
Convenience Shopping in Service Stations
Annual expenditure with international companies in-country for procurement in-country ($millions, est)
x
Total third-party expenditure in -country ($millions)
x
State-owned (No.) x
Joint Venture (No.) x
SMEs (directly or indirectly) est. (No.) x
Third-party expenditure in-country as proportion of GDP
x
Impact of third-pary spend on local economy and employment opportunities in oil producing region
Number of in-country SMEs with main operations in oil producing regions
x
PSC does not require reporting on the 'geography' of local content, either the residency of employees or the geographic sphere of
Annual expenditure with companies with local capital - State owned ($millions)
x
As above - Joint Ventures ($millions) x
As above - SMEs ($millions) x
suppliers Signal the copany's future intention to
Third-party expenditure in-country 2. Financial information
Number of in-country companies 3. Other management data
Consultancy report
Consultancy report
4. Stakeholder priorities
Local Business Development Annual expenditure with international xhird-party expenditure in-country Consultancy companies in-country for procurement in-country ($millions, est)
Annual expenditure with companies with local capital - State owned ($millions)
x
As above - Joint Ventures ($millions) x
As above - SMEs ($millions x
Total third-party expenditur -country ($millions)
x
State-owned (No.) x
Joint Venture (No.) x
SMEs (directly or indirectly) est. (No.) x
Third-party expenditure in-country as proportion of GDP
x
Impact of third-pary spend on local economy and employment opportunities in oil producing region
Number of in-country SMEs with main operations in oil producing regions
x
PSC does not require reporting on the 'geography' of local content, either the residency of employees or the geographic sphere of suppliers. Signal the copany's future intention to disaggregate local content by geography: affected communities, district,
T2. Financial information
Number of in-country companies 3. Other management data
Consultancy report
report
4. Stakeholder priorities
)
e in
Monetary Payment to the State Annual expenditure with international xThird-party expenditure in-country Consultancy companies in-country for procurement in-country ($millions, est)
Annual expenditure with companies x
country ($millions)
State-owned (No.) x
Impact of third-pary spend on local economy and employment opportunities in oil producing region
Number of in-country SMoperations in oil producing regions
x
PSC does not require reporting on the 'geography' of local content, either the residency of employees or the geographic sphere of suppliers. Signal the copany's future intention to disaggregate local content by geography: affected communities, district,
2. Financial information
Number of in-country companies 3. Other management data
Consultancy report
report
4. Stakeholder priorities
with local capital - State owned ($millions)
As above - Joint Ventures ($millions) x
As above - SMEs ($millions) x
Total third-party expenditure in - x
Joint Venture (No.) x
SMEs (directly or indirectly) est. (No.) x
Third-party expenditure in-country as proportion of GDP
x
Es with main
Local Content and Training Annual expenditure with international companies in-country for procurement in-country ($millions, est)
Annual expenditure with companies with local capital - State owned
x
count
State-owned (No.) x
Joint Venture (No.) x
SMEs (directly or indirectly) est. (No.) x
Third-party expenditure in-country as proportion of GDP
x
Impact of third-pary spend on local economy and employment opportunities in oil producing region
Number of in-country SMEs with main operations in oil producing regions
x
PSC does not require reporting on the 'geography' of local content, either the residency of employees or the geographic sphere of suppliers. Signal the copany's future intention to disaggregate local content by geography: affected communities, district,
Third-part2. Financial information
Number of in-country companies 3. Other management data
Consultancy report
report
4. Stakeholder priorities
xy expenditure in-country Consultancy
($millions)
As above - Joint Ventures ($millions) x
As above - SMEs ($millions) x
Total third-party expenditure in -ry ($millions)
x
Transfer of Ethical Standards Annual expenditure with international xhird-party expenditure in-country Consultancy companies in-country for procurement in-country ($millions, est)
Annual expenditure with companies with local capital - State owned ($millions)
x
As above - Joint Ventures ($millions) x
As above - SMEs ($millions) x
Total third-party expenditure in -country ($millions)
x
State-owned (No.) x
Joint Venture (No.) x
SMEs (directly or indirectly) est. (No.) x
Third-party expenditure in-country as proportion of GDP
x
Impact of third-pary spend on local economy and employment opportunities in oil producing region
Number of in-country SMEs with main operations in oil producing regions
x
PSC does not require reporting on the 'geography' of local content, either the residency of employees or the geographic sphere of suppliers. Signal the copany's future intention to disaggregate local content by geography: affected communities, district,
T2. Financial information
Number of in-country companies 3. Other management data
Consultancy report
report
4. Stakeholder priorities
28

Assessing Business Development Impact: A Management Framework for Improved Economic and Socio-Economic Performance Reporting
Table 1 Checklist of Economic and Socio-Economic Reporting Categories and Themes for Integrated Oil and Gas Companies (with template for identifying Stakeholder Interests)
Stakeholder Groups Discrete business or JVs Internal Stakeholders External Stakeholders
Reporting Categories
Reporting Themes
Bu
sines
s inv
estor
s/fina
ncier
s
Spon
sorin
g mini
stry
Emplo
yees
Supp
liers
and
contr
actor
s
Institu
tiona
l inve
stors
Custo
mers
and e
nd-
user
s
Affec
ted co
mmun
ities
Civil
socie
ty – i
n-co
untry
Civil
socie
ty –
inter
natio
nal
Publi
c sec
tor –
loc
al/re
giona
l
Publi
c sec
tor –
centr
al go
vern
ment
Inter
natio
nal
deve
lopme
nt
Country/region source of raw materials/supplies
End-user utility of products and services – fuel, mobility, lighting, convenience
Market penetration and product diffusion Product and service taxes
Products and services
Research and development Signatory and bonus payments Social funds Royalty payments Profit oil Cost recovery Profit tax Withholdings from foreign sub-contractors Tax credits Indirect taxes – contactors and sub-contractors (profit tax)
Indirect taxes – income tax paid by national employees and foreign employees working for contractors and sub-contractors
Monetary payments to the public sector
Indirect tax – social security contributions paid by national employees working for contractors and sub-contractors
Reinvested earnings
Location of reinvested earnings
Profits General division of allocations Joint ventures/subsidiaries Dividends Corporate level Involvement of government institutions in international processes
Transparency in revenue flows Development of capacity to manage revenues at national/regional level
Development/reform of government institutions
Strengthening the ‘rule of law’, eg hierarchy of legal norms, international arbitration
Political Stability and Governance
Disclosure of project documents Balance of payments/terms of trade Economic
growth/stability Export growth Direct effects on regulatory stability– (tax regime, compliance requirements
Investment competitiveness – availability of domestic financing
International competitiveness – appropriate skills and knowledge
Investment climate
International competitiveness – capacity of domestic companies
29

Assessing Business Development Impact: A Management Framework for Improved Economic and Socio-Economic Performance Reporting
Stakeholder Groups Discrete
business or JVs Internal Stakeholders External Stakeholders
Reporting Categories
Reporting Themes
Bu
sines
s inv
estor
s/fina
ncier
s
Spon
sorin
g mini
stry
Emplo
yees
Supp
liers
and
contr
actor
s
Institu
tiona
l inve
stors
Custo
mers
and e
nd-
user
s
Affec
ted co
mmun
ities
Civil
socie
ty – i
n-co
untry
Civil
socie
ty –
inter
natio
nal
Publi
c sec
tor –
loc
al/re
giona
l
Publi
c sec
tor –
centr
al go
vern
ment
Inter
natio
nal
deve
lopme
nt
Intangible economic benefits of PSC/concession arrangements, eg local content, training
Transaction design effects on regulatory stability (tax, compliance, NOCs ‘backing-in’ etc)
NOC – IOC transactions
Benefits arising from conditionality of project financing, eg ‘Equator Principles’, development finance
Salaries and wages Training and human resource development
Local content and staff succession
Employees
Other employee benefits Local content Technology transfer Skills transfer Local market/business development
Suppliers and contractors
Local economic multiplier effect Operational infrastructure that provides a public service, eg roads, power, health, education, telecommunications, water and sanitation
Infrastructure and equipment
Operational equipment that provides a public service, eg office equipment, vehicles
Cash deposited in local, region and national banks
Domestic banking sector
Debts to local, regional and national banks
Effects on subsidiary company shareholders
Effects on suppliers and contractors
Ethical and quality standards (HSE and social)
Effects on regulatory regimes
Employees Security Wider society Cash Charitable
giving In-kind Eco efficiency Eco technology Renewables
Bio-diversity Innovation – bio-diversity/conservation Community content/employment Community business development Community infrastructure
Social investment in affected communities Community institutions and human
resource development
Regional content/employment Regional business development Regional infrastructure
Regional development (region of operations) Regional institutions and human resource
development
30

Assessing Business Development Impact: A Management Framework for Improved Economic and Socio-Economic Performance Reporting
discussions at staff level from Shell Int and BP plc;
lessons learned from field visits undertaken with Shell in London and the
Philippines; AMEC in the Philippines; Balfour Beatty in Indonesia; and with two
BP country operations;
various BP and Shell Location Reports;
the Shell Report (2003) on sustainable development;
the BP Environmental and Social Review Annual Report (2002) and Sustainability
Report (2003);
BP disclosed financial accounts (country and group levels);
sample Production Sharing Agreement (AICO 1996, Azerbaijan);26
World Bank Extractive Industries Review;27
International Finance Corporation ‘Sustainability Framework;’28
International Finance Corporation ‘Economic Valuation Method;’29
CSR standards, principles and indices: GRI, OECD MNE Guidelines, Global
Compact, FTSE4GOOD and Dow Jones Sustainability Index;
other corporate annual sustainability reports (Shell, Unilever, Rio Tinto, Anglo
American);
World Bank CSR-Public Sector Diagnostic and Appraisal Tool;30
Poverty Reduction Strategy Papers (various);
United Nations Millennium Development Goals;31
various literature on the impact of foreign direct investment.32
26 See – www.caspiandevelopmentandexport.com/Downloads/SHA/Eng/agmt1/SD%20PSA_final.pdf 27 See – World Bank (2003) Extractive Industries Review: Striking a Better Balance, Final Report. Washington DC: World Bank – www.eireview.org/EIR%20Final%20Report/Volume%20I%20Final/Volume%20I%20Final.pdf 28 IFC (2003) Measuring Sustainability: a Framework for Private Sector Investments – www2.ifc.org/sustainability/docs/measuring_sustainability.pdf29 IFC (2002) Results on the Ground. Washington DC: International Finance Corporation – www2.ifc.org/economics/pubs/results.htm30 World Bank (2004) CSR-Public Sector Diagnostic and Appraisal Tool. Washington DC: World Bank, CSR Practices –www.worldbank.org/privatesector/csr/diag_tool.htm 31 UNDP (2003) Human Development Report 2003 – Millennium Development Goals: A compact among nations to end human poverty. New York: United Nations Development Programme – www.undp.org/hdr2003 32 including: Te Velde, D. & Morrissey, O. (2001) Foreign Direct Investment and Poverty, Proposal to DFID. London: Overseas Development Institute; UNCTAD (2001a) World Investment Report 2001 – Promoting Linkages. Geneva: United Nations Conference on Trade and Development. UNCTAD (2001b) FDI in Least Developed Countries at a Glance. Geneva: United Nations Conference on Trade and Development; Rodrik (1999) Making Openness Work: The New Global Economy and the Developing Countries. Washington DC: Overseas Development Council; Borensztein, E., De Gregorio, J. & Lee, J-W. (1998) “How Does Foreign Direct Investment Affect Economic Growth?”, Journal of International Economics, 45, pp. 115-135; Berman, E. & Machin, S. (2000) Skilled-Based Technology Transfer: Evidence of Factor-Biased Technological Change in Developing Countries. Boston: Boston University, Dept. of Economics.
31

Assessing Business Development Impact: A Management Framework for Improved Economic and Socio-Economic Performance Reporting
The checklist can be used in a variety of ways: (i) as a guide to review sources of
information on external stakeholder socio-economic performance priorities (reports
of independent panels, media reports, government policy, country social and
environmental reports etc); (ii) as the basis for a discussion with external
stakeholders to identify and prioritise the most critical economic and socio-
economic contributions of a company; or (iii) as a point of reference for discussions
with internal company staff on what they consider to be the priorities for socio-
economic and economic reporting. The main categories in the checklist are listed
given in Box 4.
Box 4 Categories for Socio-Economic and Economic Reporting
• Products and services • Monetary flows to the public sector • Reinvested earnings • Profits • Dividends • Political stability
lity •
The checklist also provides an opportunity for the user to indicate which discrete
business entity (company or JV) is relevant to
which reporting theme, as well as which themes
are of interest to which types of stakeholders: be
they internal business stakeholders (investors,
sponsoring ministry, employees or suppliers); or
external stakeholders (institutional investors;
customers and end-users; directly affected
communities; civil society – in-country; civil
society – international; public –
local/regional/national; and official development
agencies).
Macro-economic stabi• Investment climate
nsactions • NOC-IOC tra• Employees • Procurement (suppliers and contractors)
equipment
• d quality standards (HSE and
y
• Regional development (region of operations)
• Infrastructure and • Banking sector
Ethical ansocial)
• Security • Charitable giving• Eco-technolog• Bio-diversity • Community investment
Drawing on the results of discussions with staff
from upstream and downstream operations, the
narratives on economic performance for which
reporting registers have been explored in this
study include:
Upstream – oil and gas project developments
the contribution of oil or gas field
developments to the provision of affordable
gas and electricity supplies in-country;
contributions of the business to macro-economic stability through the payments
to the state oil fund;
contributions of the business to export-led economic growth in-country through
payments to government and suppliers;
32

Assessing Business Development Impact: A Management Framework for Improved Economic and Socio-Economic Performance Reporting
compliance with the local content requirements of production-sharing
agreements/contracts;
the potential for a positive effect on local financial institutions from the business
passing its financial transactions through domestic banks;
indirect tax payments to government through national and foreign employees
working for contractors and subcontractors;
contribution of the business to skills enhancement through engagement with
training and education institutions;
diffusion of ethical and health and safety standards to contractors and suppliers;
and
economic and socio-economic impacts of the business’s community investment
programmes.
Downstream – refining, retail marketing, chemicals and renewables
contributions to economic development in underdeveloped countries from crude
oil sourcing decisions;
employment opportunities in depressed local markets;
innovation in service stations, eg convenience stores;
local employment and the local economic multiplier effect of service stations;
support to develop domestic businesses, eg major and minor suppliers;
the impact of oil tax colleted by service stations on economy, eg in meeting of
pension requirements;
charitable contributions; and
the business as a market leader in research and development for clean fuel
technology and eco-efficient technology within refinery operations.
4.4 Individual Reporting Registers A rationale was provided in Section 3 for the reporting of economic and socio-
economic performance to be informed by the compilation of five types of
information, as follows:
the business context – competitive realities, legal and regulatory requirements,
and public policy stipulations and incentives that frame business decisions and
determine whether a company has control or influence over the economic
benefits stream generated by its operations;
33

Assessing Business Development Impact: A Management Framework for Improved Economic and Socio-Economic Performance Reporting
financial numbers – a financial indicator that will help describe performance
with respect to the theme and that is readily tracked through some aspect of the
financial accounts (P&L, cash flow or Balance Sheet);
non-financial management data that is readily accessible (now or in the near
future), and which will enhance reporting;
external stakeholder priorities – benchmarks or targets reflecting external
stakeholder priorities, which can be used to interpret the relevance of the
company’s performance, eg regulatory compliance requirements; public sector
policy targets; national international development targets (such as within
PRSPs); policies and targets in regional or provincial economic development
plans; etc and
external roles – suggested actions to be taken by non company parties –
government service providers and regulatory authorities, trade union
movements, NGOs, community groups, international development agencies etc –
to embed, enhance or sustain the socio-economic or economic gains contributed
by the company.
It is suggested that the five types of information are gathered together into a single
Reporting Register. Three illustrations of completed registers are given as follows:
Figure 6a – contributions to export-led economic growth through payments to
government and third parties;
Figure 6b – contributions of a discrete gas condensate project to the country’s
energy needs; and
Figure 6c – contributions to the national economy through expenditure with local
contractors and suppliers.
In each register, quantitative and qualitative data need to be subdivided. Where a
single figure (monetary or otherwise) is used, this is allocated to the relevant year of
reporting (2002, 2003 etc) and a direct link made between this and the origins of the
figure in the company’s financial or management databases. Such figures need to
be located in their own dedicated column.
It is this register that then provides the information required by those within the
company or at corporate level to prepare ‘narratives’ on economic and socio-
economic performance for public disclosure. As demonstrated in Figure 4, the
register can also provide a direct source of information for an online ‘visualisation’ of
a company’s economic and socio-economic performance around the world.
34
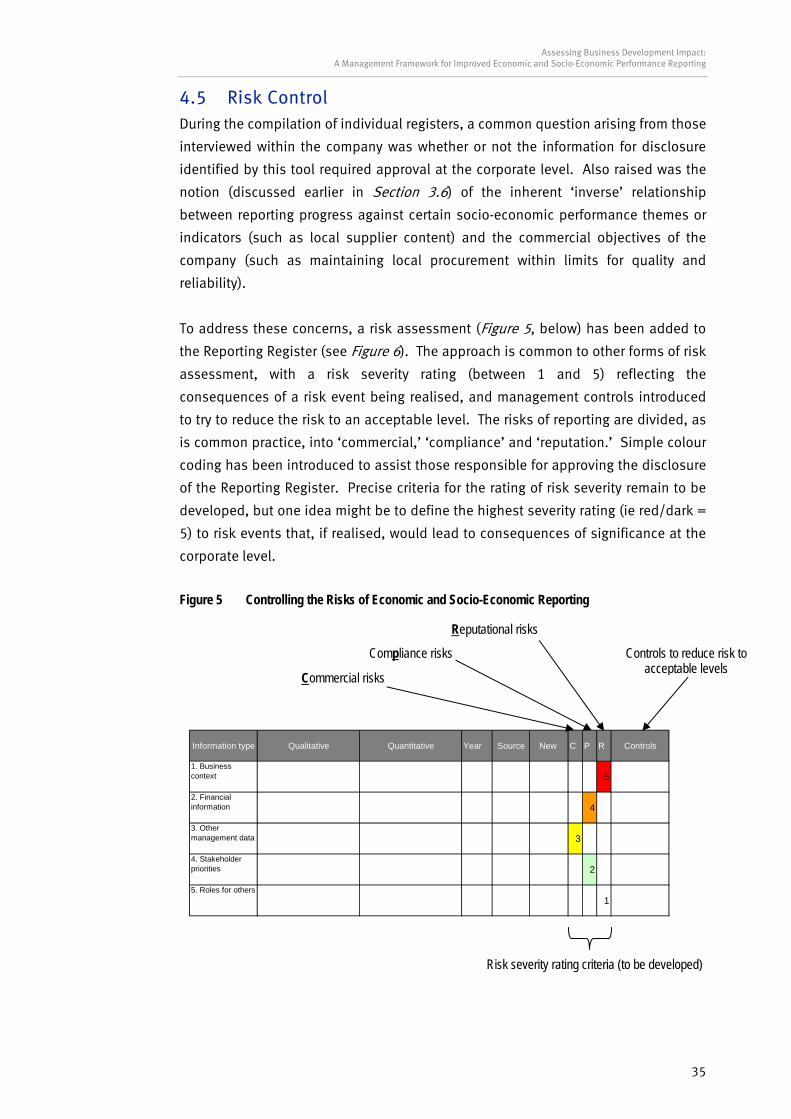
Assessing Business Development Impact: A Management Framework for Improved Economic and Socio-Economic Performance Reporting
Information type Qualitative Quantitative Year Source New C P R
1. Business context 5
2. Financial information 4
3. Other management data 3
4. Stakeholder priorities 2
5. Roles for others1
Commercial risks
Compliance risks
4.5 Risk Control
To address these concerns, a risk assessment (Figure 5, below) has been added to
the Reporting Register (see Figure 6). The approach is common to other forms of risk
assessment, with a risk severity rating (between 1 and 5) reflecting the
consequences of a risk event being realised, and management controls introduced
to try to reduce the risk to an acceptable level. The risks of reporting are divided, as
is common practice, into ‘commercial,’ ‘compliance’ and ‘reputation.’ Simple colour
coding has been introduced to assist those responsible for approving the disclosure
of the Reporting Register. Precise criteria for the rating of risk severity remain to be
developed, but one idea might be to define the highest severity rating (ie red/dark =
5) to risk events that, if realised, would lead to consequences of significance at the
corporate level.
During the compilation of individual registers, a common question arising from those
interviewed within the company was whether or not the information for disclosure
identified by this tool required approval at the corporate level. Also raised was the
notion (discussed earlier in Section 3.6) of the inherent ‘inverse’ relationship
between reporting progress against certain socio-economic performance themes or
indicators (such as local supplier content) and the commercial objectives of the
company (such as maintaining local procurement within limits for quality and
reliability).
Figure 5 Controlling the Risks of Economic and Socio-Economic Reporting
Reputational risks
Risk severity rating criteria
Controls to reduce risk toacceptable levels
35
Controls
(to be developed)

36
Information type Qualitative Quantitative 2003 Source New C P Controls
GDP-PPP ($) per capita (2002)
x World Bank
1 1 2
Large variability in different GDP estimates. Cross-check with other credible sources and adjust.
GDP ($million) (est 2002) x World Bank
1 1 1
Other contributions ($million) = operators' corporate tax + tarrifs + National Oil Company (NOC) profit oil + operators' local employee payroll + operators' tax payments of expatriates)
x Consultants report P&L of country operations
2 1 1
Set-up costs for automating total operators' contributions
Country operations' total contributions as % of total GDP-PPP
x
1 1 3
Of figure not as high as might be expected, report 'projected' contributions
4. Stakeholder priorities
Local consumers in fear of 'dutch disease' raising local prices, eg retail goods, construction, restaurants.
Inflation rate for consumer prices (2002)
x Index Mundi
1 1 1
5. External Roles State oil fund management and its relation to public expenditure needs to take account of potential for 'Dutch disease'
1 1 3
Refer to other country examples of effective state oil fund management
Info
rmat
ion
alre
ady
gath
ered
Macro Economic Stability
Country level operation R
State has adopted an oil-based, export-led, economic development strategy, supplying markets in Europe as part of their wider energy security strategy and oil sourcing diversification. Current GDP ranking of country is xth place.
1. Business context
1
xThird-party expenditure in-country ($millions)
Export growth
New
info
rmat
ion
requ
ired
Com
mer
cial
Com
p lia
nce
Rep
utat
iona
l
Risks of Reporting
Socio-Economic Performance 'Narrative'
Discrete operation,
businesses or JVs
2. Financial information
Country business operations contribute significantly to total GDP (though both captial expenditure and payments to government). Projections are for this figure to increase markedly.
Figure 6a Reporting Register Example 1: Contributions to Export Led Economic Growth through Payments to Government and Third-Parties
ThemeReporting Categories Risk Controls
Set-up costs for amending or introducing new 'local content' reporting requirements within main EPC and O&M contracts
Supply Chain Management
P&Ls of main contractors
2 1

37
Information type Qualitative Quantitative 2006 C P Controls
1. Business context Stage 1 projected to deliver first gas to market before winter of 2006. Small proportion of gas market will be internal to country for power generation.
x JV Business Plan
Ministry of Finance; Ministry of Energy 1 1 1
2. Financial information
Projected sales in-country in yr of peak production ($millions)
x JV Business Plan
1 1 3
Report @ 25% to reflect stake in JV, and prevent double counting with other JV partners
3. Other management data
Projected gas output of project at peak production, proportionate to projected output to be secured for in-country market in same yr (bbl)
x JV Business Plan
Ministry of Finance; Ministry of Energy
1 1 3
Report @ 25% to reflect stake in JV, and prevent double counting with other JV partners
4. Stakeholder priorities
Affordable and reliable source of electricity to residential and commercial properties in rural towns and peri-urban areas of main cities, plus critical electricity supplies for health, transport and education.
x 2002 Company country-level environmental report
Poverty Reduction Strategy Paper 1 1 1
5. External Roles Inward investment stimulation needed to develop downstream gas industry in-country relevant to household and public service power requirements, including removal of electricity transmission bottlenecks.
x Finance Ministry; Ministry of Energy 1 1 1
Info
rmat
ion
alre
ady
gath
ered
ThemeReporting Categories
Products and Services
End-user utility of products and services
Com
mer
cial
Com
plia
nce
Rep
utat
iona
l
Risks of Reporting
Gas and condensate development project
Socio-Economic Performance 'Narrative'
Discrete operation,
businesses or JVs
Figure 6b Reporting Register Example 2: Contributions of a Gas Condensate Project to the Country's Energy Needs
Source R
Risk Controls
New
info
rmat
ion
requ
ired

38
Information type Qualitative Quantitative 2003 Source New C P Controls
1. Business context Production Sharing Contract requires preference to local suppliers (equipment, materials, machinery, vehicles etc), defined as firms registered and incorporated in the country, "so long as suppliers are competitive on price, quality and availability".
PSC
2
Check possible anomaly between operaator's definition of 'local' supplier (part equity owned by nationals) and PSC definition (registered and incorporated in the country of operations).
Annual expenditure with international companies in-country for procurement in-country ($millions, est)
x3 1 1
Annual expenditure with companies with local capital - State owned ($millions)
x3 1 1
As above - Joint Ventures ($millions) x 3 1 1
As above - SMEs ($millions) x 3 1 1
Total third-party expenditure in -country ($millions)
x3 1 1
State-owned (No.) x 1 1 1
Joint Venture (No.) x 1 1 1
SMEs (directly or indirectly) est. (No.) x 3 1 1
Third-party expenditure in-country as proportion of GDP
x1 1 1
Impact of third-pary spend on local economy and employment opportunities in oil producing region
Number of in-country SMEs with main operations in oil producing regions
x3 1 1
If reported figure is based on dedicated survey of SMEs, then see above.
PSC does not require reporting on the 'geography' of local content, either the residency of employees or the geographic sphere of suppliers. Signal the copany's future intention to disaggregate local content by geography: affected communities, district,
1 1 4
This reporting may set a precedent for the corporation as a whole. Seek corporate level approval to move to geographic reporting of local content.
5. External Roles Future PSCs need to be more specific about the definition of 'local content', and ensure performance targets are within 'technical' limits so as not to delay project schedules.
1 1 1
Local content - suppliers and local multiplier effect
Country operationsR
Third-party expenditure in-country 2. Financial information
Number of in-country companies 3. Other management data
Consultancy report
Socio-Economic Performance 'Narrative' Risk Controls
New
info
rmat
ion
requ
ired
Com
mer
cial
Com
p lia
nce
Rep
utat
iona
l
Risks of Reporting
Figure 6c Reporting Register Example 3: Contributions to the National Economy through Expenditure with Local Contractors and Suppliers
Consultancy report
4. Stakeholder priorities
Info
rmat
ion
alre
ady
gath
ered
ThemeReporting Categories
Discrete businesses or
JVs
Current figures depend on consultant-based surveys of main procurement adn construction contractors. This runs risk of having to repeat costly surveys. Control future costs by amending or introducing new 'local content' reporting requirements as condit
Procurement (suppliers and contractors)

Assessing Business Development Impact: A Management Framework for Improved Economic and Socio-Economic Performance Reporting
5. Analysis and Conclusions
Analysis of the suggested framework for benefits reporting, and of the experience of
compiling Reporting Registers for individual economic and socio-economic themes,
is provided below along with the main conclusions of the study.
5.1 Designing a Systematic Framework for Reporting Economic
and Socio-Economic Performance The experience of compiling reporting registers suggests the need for a management
framework that is integrated with existing reporting procedures, promotes systematic
and ‘high priority’ reporting, and is cost-effective. Suggestions for the building
blocks of such a framework are shown in Figure 2, page 19. The proposed design
combines a scoping exercise with a register of compiled information and an integral
risk assessment. These then act as inputs into the formulation of a more meaningful
and credible ‘narrative’ for disclosure. Conclusions on the design of the framework
are given below.
5.1.1 Scoping
1. The risks to shareholders associated with the shift in geography of corporate
growth centres towards poor and unstable countries, combined with the drift in
comprehension of the mutuality of benefits between downstream
manufacturing/retail businesses and wider society, suggest a move away from
the global corporate reporting of economic performance based on generic,
aggregated, financial indicators or isolated qualitative ‘stories,’ towards the
reporting of high-priority, location-specific, economic and socio-economic
impacts that reflect stakeholder concerns and reveal the genuine connectivity
between the energy business and society.
2. To achieve this change in emphasis, a systematic ‘scoping’ exercise is required
at the country and/or project level, with the aim of prioritising the themes for
economic and socio-economic performance reporting, such that the choice is
credible to both internal (business) and external (wider society) stakeholders.
3. The checklist of economic and socio-economic performance themes and
categories presented in this report (Section 4) offers a starting point first for
broadening, then for narrowing, the range of benefits reporting beyond the
39

Assessing Business Development Impact: A Management Framework for Improved Economic and Socio-Economic Performance Reporting
conventions of charitable giving, community investment, and breakdown of Cash
Value Added (CVA).
4. Such a scoping exercise need only be undertaken once every three to five years,
or at discrete junctures in the life of an investment. Outside of this timeframe, it
is unlikely that the public policy environment, the basic business strategy, or the
external stakeholder priorities will have changed significantly.
5.1.2 Reporting Registe r
5. Recent experimentation by a number of UK-listed companies and independent
bodies around economic and socio-economic reporting shows that the discipline
suffers from a number of persistent challenges. These include: (i) weak reporting
of the commercial and public policy constraints and incentives that act on
business decisions; (ii) poor tracking of socio-economic benefits over time
through the financial accounts; (iii) a tendency towards aggregating economic
information across operations that rapidly becomes meaningless to external
stakeholders in the context of the priorities of the host society; (iv) a bias
towards reporting Cash Value Added (CVA), and the breakdown thereof, as
indicators of the rate of economic return – a practice that, particularly in low
income and poorly governed countries, fails to take account of the distribution of
economic benefits; (v) a dependency on economic and socio-economic
performance reporting of high-cost stand-alone surveys; and (vi) the medium-
term commercial risks to the business of reporting certain economic benefits if
these lead to demands for continuous improvement.
6. To counter these challenges, effective economic and socio-economic
performance reporting requires the collation of five types of information.
Bringing these together into a single Reporting Register would foster the rapid
formulation of a benefits ‘narrative’ more credible and meaningful to its
audience. The five types of information are:
(i) the business context – business strategies, legal and regulatory
requirements, public policy constraints and incentives etc;
(ii) financial – some financial indicators that describe performance with
respect to the socio-economic or economic theme and that can be
tracked through the financial accounts (P&L, cash flow or Balance Sheet);
(iii) non-financial management data that is readily accessible (now or in the
near future), which will enhance the narrative;
(iv) external stakeholder priorities – benchmarks or targets reflecting
external stakeholder priorities that can be used to interpret the relevance
of the company’s performance, eg regulatory compliance requirements,
40

Assessing Business Development Impact: A Management Framework for Improved Economic and Socio-Economic Performance Reporting
public sector policy targets, national international development targets
(such as within PRSPs), policies and targets contained within regional or
provincial economic development plans, etc; and
(v) external roles – actions to be taken by entities outside the immediate
business to embed, enhance or sustain the socio-economic or economic
gains contributed by the company.
7. Within each individual Reporting Register, all quantitative data should, as far as
practicable, be linked directly to the relevant financial and other management
system, so that the figures can be called up ‘on command.’ For datasets that
currently require costly freestanding surveys (such as soliciting the geography
and/or ownership profile of suppliers), ways need to be found of automating the
data-gathering process; for example, inserting new reporting clauses into the
contracts of the main engineering, procurement, construction and maintenance
contractors.
8. The design of a Reporting Register that successfully brings the first three types of
information together – ie business context, and financial and management data
– should draw on recent thinking in ‘Benefits Realisation’ – ie the process of
closely tracking the deployment of a company’s resources and expenditure to
assure compatibility over time between the outcomes of an activity and the
original strategic business objectives that lay behind the deployment decision.
This approach will ensure that the narrative reported externally is integrated with
core business, guiding managers, and external stakeholders alike towards
genuine mutuality (‘win-win’) benefits for the business and wider society,
preventing the principle of mutuality becoming embedded as a ‘bolt-on’,
unconnected with the reporting of commercial returns.
5.1.3 Risk Assessment
9. During this study, concerns raised by operational staff over (a) the release of
commercially sensitive information, and (b) the inherent ‘inverse relationship’
between certain socio-economic performance themes (such as labour wages and
local content preferences) and the short-term commercial objectives of the
company (such as employee costs and supplier reliability), suggests the addition
of a risk assessment to the Reporting Register. For this, one can draw on
conventional ‘project’ risk assessment techniques: introducing pre-defined risk
severity rating criteria to classify the different commercial, compliance and
reputational risks that would be realised were different types of economic and
socio-economic information to be reported. As demonstrated in this study,
41

Assessing Business Development Impact: A Management Framework for Improved Economic and Socio-Economic Performance Reporting
control measures can then be introduced to try to reduce the risks to acceptable
levels.
5.2 Lessons Learned from Compiling ‘Reporting Registers’ Some of the lessons learned from compiling reporting registers as part of the study
are described below.
10. With regard to contextual information, to some extent companies’ country-based
websites do contain some reference to the constraints and incentives acting on
the business associated with commercial strategies, regulation and public sector
policies. However, this information is patchy at best, and rarely aligned either
with the financial or management data needed to support reporting on economic
and socio-economic impact or performance, nor with benchmarks or targets
reflecting external stakeholder priorities.
11. Finding credible benchmarks or targets that reflect external stakeholder
priorities, against which business performance can be interpreted, is limited by
the quality and accessibility of meaningful public sector survey information. For
example, it may not always be possible to access reliable information about
medium-term expenditure priorities for the allocation of resources from state oil
funds; figures for unemployment rates in the immediate vicinity of refineries may
not be readily available. When reporting, such limitations should be openly
acknowledged. In addition, every effort should be made to find some
alternative, generalised, benchmarks, eg PRSP priorities or regional
unemployment figures, respectively. Further, under the heading ‘external roles,’
identification should be made of what actions need to be taken, and by whom, in
order for more meaningful targets to be established that can better help the
company measure and report its economic performance. For example, support
might be voiced by the company for those engaged in transparency initiatives
that encourage not only the notion of ‘publish what you pay,’ but also publish
‘what you received’ and ‘what you spend.’33
12. For countries where macro-economic indicators are weak, and the quality of
public financial management poor, the trend in some trans-national corporations
of disclosing the breakdown of Cash Value Added provides a shallow basis for
reporting the economic and socio-economic rate of investment return. Offering
financial numbers as economic surrogates provides audiences with little context
for interpreting whether these are either meaningful to the priorities of local,
33 For example the new direction of the Extractive Industries Transparency Initiative – www2.dfid.gov.uk/news/files/extractiveindustries.asp
42

Assessing Business Development Impact: A Management Framework for Improved Economic and Socio-Economic Performance Reporting
regional or national society, or reflect well on the status of the business. Put
more candidly, few are impressed when a big company generates big numbers.
What impresses more is an honest interpretation of the relevance of these
numbers in the context of the social, economic and investment priorities of those
receiving the information.
13. With energy companies that are operators of upstream investments, there is a
possible danger of overstating the economic contributions of the company by
failing to make it clear that they are but ‘one’ of a number of joint venture
partners. The economic themes particularly vulnerable to this misperception are
payments of resource rents to the public sector and third-party spend during
project development. One way to reduce the likelihood of external criticism in
this area is to apply a simple ‘divisor,’ particularly to any financial figures, such
as one proportionate to the equity share of the operator within the joint venture.
14. It seems justified, however, for individual project operators to claim full credit for
economic and socio-economic impacts where these are the direct result of
management decisions taken as the operator. These might include actions
taken, for example, to raise environmental, health and safety standards through
the supply chain, or to sustain or broaden the benefits of community investment
programmes.
15. For upstream projects in their development (pre-production) phase, the
importance of accurately reporting ‘local content’ – for example, in the form of
payments to employees and third parties – cannot be overstated. It is frequently
the case that during the construction of field developments or transportation
infrastructure, micro and meso economic impacts are at their highest. With the
bulk of revenue flows to the state dependent upon the start of production and
with cost recovery periods and tax waivers commonplace, unless the
opportunities for direct and indirect employment can be fully realised during the
construction phase, there is the danger of a perception that little positive
economic development or other benefits will be apparent in the operating region
for a number of years. This study suggests that energy companies need both to:
(a) define better what is meant by ‘local content,’ be that the nationality of
employees, ownership of supplier firms, sphere of geographic influence of
suppliers, country of registration or incorporation etc; and (b) reduce their
dependency on freestanding surveys for gathering local content information,
putting in place instead automated procedures.
43

Assessing Business Development Impact: A Management Framework for Improved Economic and Socio-Economic Performance Reporting
16. Given the marked change in the type and magnitude of economic benefits
experienced during the exploration, development and production phases of
major capital investments, it might be appropriate to include in the annual
reporting of economic and socio-economic performance some forward
projections of payments to the public sector, showing how these will vary over
time in relation to anticipated expenditure and revenue ‘curves.’
17. In the medium term, reporting the volume of transactions with domestic banks
may provide an incentive for improving the range and reach of financial products
available to the domestic SME sector, including suppliers to the operator.
Clearly, if volumes are to increase over time, such that this effect is realised,
there will be a need for increased security and guarantees. With respect to
reporting, this security could be expressed in the narrative as, for example, a role
for international development finance institutions.
18. For upstream operations in more politically and economically developed
countries, improvements could be made in reporting the ‘business context’ for
economic and socio-economic performance. The commercial and competitive
realities of mature markets, the increasingly stringent legal and regulatory
requirements imposed on companies, and public policy incentives such as tax
concessions for acquisitions and mergers, all play a part in shaping the room
available for energy companies to enhance their economic and socio-economic
performance. As far as practicable, the most prominent constraints and
incentives acting on the business need to be reported.
5.3 Conclusion For underdeveloped countries where economic performance is generally weak and
the quality of public financial management poor, the trend of some trans-national
corporations to disclose the breakdown of Cash Value Added of operations provides
a shallow basis for reporting the economic and socio-economic rate of investment
return. Offering financial numbers as economic surrogates provides audiences with
little context for interpreting whether these are either meaningful to the economic
priorities of local, regional or national society, or are material to the political risk and
business growth concerns of shareholders. Put more candidly, in both developed
and developing countries, few are impressed when a big company generates big
numbers. What would impress more is a reporting narrative, backed by a rolling
register of location-specific credible data, which gives an honest interpretation of the
relevance of these numbers to the social, economic and investment priorities of
those receiving the information.
44

ISBN 978-0-85003-870-5
Overseas Development Institute111 Westminster Bridge RoadLondon SE1 7JD
Tel: +44 (0)20 7922 0300Fax: +44 (0)20 7922 0399Email: [email protected]: www.odi.org.uk/business
Overseas Development Institute