22 Zarhin Street Ra’anana 43662, Israel Tel: (972) 9 762...
52
creating opportunities through innovation annual report 2005
Transcript of 22 Zarhin Street Ra’anana 43662, Israel Tel: (972) 9 762...

w w w . m t s i n t . c o m
creating opportunitiesthrough innovation
annual report 2005MER Telemanagement Solutions Ltd.22 Zarhin StreetRa’anana 43662, IsraelTel: (972) 9 762 1777Fax: (972) 9 746 [email protected]
North AmericaMTS IntegraTRAK Inc.12600 SE 38th Street, Suite 250Bellevue, WA 98006, USATel: (1) 425 401–1000Fax: (1) 425 401–1700
18-35 River Road, 2nd floorFair Lawn, NJ 07410, USATel: (1) 201-421-2260Fax: (1) [email protected]
Asia & Pacific RimMTS Asia Ltd.Room b-4, 8/F Kwong loong tai Bldg.1016-1018 tai nan west street,Cheung sha wan,Kowloon, Hong KongTel: (852) 2413—2802Fax: (852) 2413—[email protected]
South AmericaTABS Brasil Ltda.Fidencio Ramos Street100 11º floorVila Olímpia, São Paulo, BrasilTel: (55) 11 2124–0174Fax: (55) 11 2124–[email protected]
EuropeJARAGA B.V.Rapenburgerstraat 204,1011 MN Amsterdam, HollandTel: (31) 20–778–4141Fax: (31) 20–330–5444
Des
ign
& Pr
oduc
tion:
Stu
dio
Dia
na C
hurg
es. C
opyw
riter
: Arie
l Mar
ketin
g.
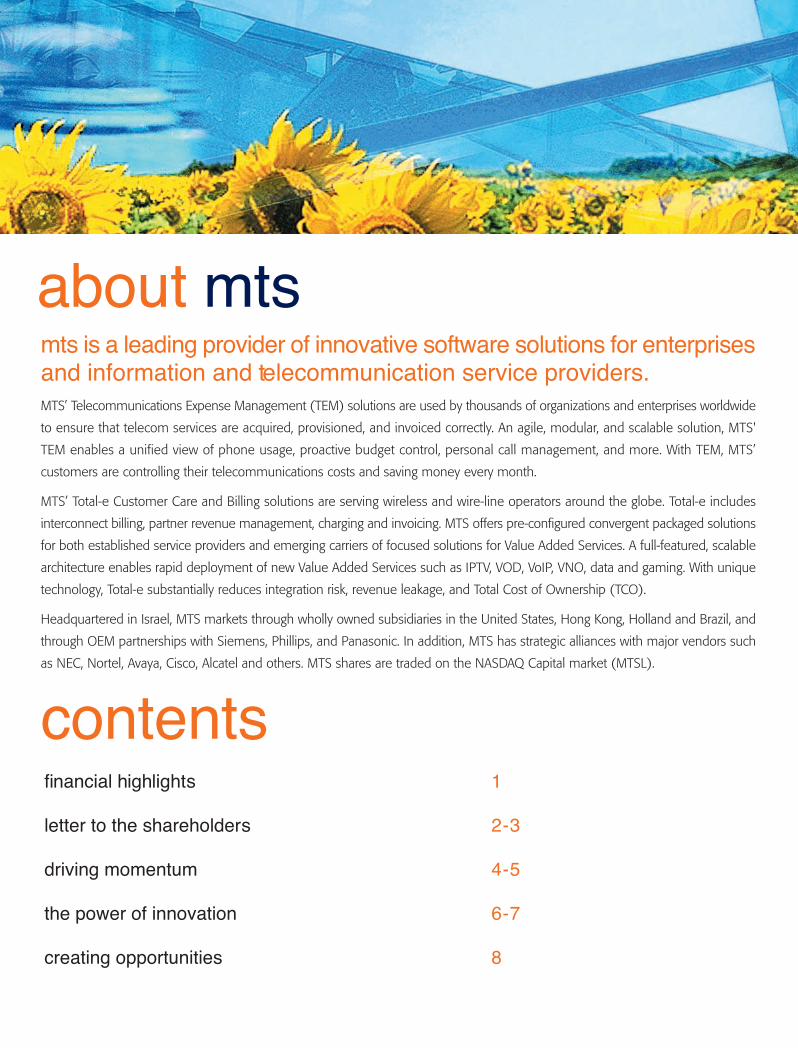
mts is a leading provider of innovative software solutions for enterprisesand information and telecommunication service providers.MTS’ Telecommunications Expense Management (TEM) solutions are used by thousands of organizations and enterprises worldwide
to ensure that telecom services are acquired, provisioned, and invoiced correctly. An agile, modular, and scalable solution, MTS'
TEM enables a unified view of phone usage, proactive budget control, personal call management, and more. With TEM, MTS’
customers are controlling their telecommunications costs and saving money every month.
MTS’ Total-e Customer Care and Billing solutions are serving wireless and wire-line operators around the globe. Total-e includes
interconnect billing, partner revenue management, charging and invoicing. MTS offers pre-configured convergent packaged solutions
for both established service providers and emerging carriers of focused solutions for Value Added Services. A full-featured, scalable
architecture enables rapid deployment of new Value Added Services such as IPTV, VOD, VoIP, VNO, data and gaming. With unique
technology, Total-e substantially reduces integration risk, revenue leakage, and Total Cost of Ownership (TCO).
Headquartered in Israel, MTS markets through wholly owned subsidiaries in the United States, Hong Kong, Holland and Brazil, and
through OEM partnerships with Siemens, Phillips, and Panasonic. In addition, MTS has strategic alliances with major vendors such
as NEC, Nortel, Avaya, Cisco, Alcatel and others. MTS shares are traded on the NASDAQ Capital market (MTSL).
financial highlights 1
letter to the shareholders 2-3
driving momentum 4-5
the power of innovation 6-7
creating opportunities 8
about mts
contents
w w w . m t s i n t . c o m

financial highlights
1
$ 9,230
$ 7,381
$ 1,825
($ 190)
$ 87
$ 0,02
4,628
statement of income data(in thousands, except share data)
Revenues
Gross profit
Research and development, net
Operating loss
Net income (loss)
Diluted earnings (loss) per share
Average number of shares (in thousands)
$ 9,787
$ 7,891
$ 2,127
($ 48)
$ 130
$ 0,03
4,710
2001 2002 2003
$ 10,725
$ 8,173
$ 3,562
($ 2,243)
($ 2,554)
($ 0,53)
4,826
2004
$ 9,413
$ 6,599
$ 2,362
($ 4,164)
($ 4,127)
($ 0,89)
4,634
2005
$ 11,563
$ 7,761
$ 4,395
($ 4,261)
($ 4,216)
($ 0,83)
5,092
in thousands U.S. dollars
-3,000
3,000
2,000
1,000
0
-1,000
-2,000
Q2 04 Q3 04 Q4 04 Q1 05 Q2 05
4,000
Q3 05 Q4 05
revenues net loss backlog
1,992
2,4852,600
2,700
2,800 3,000 3,000
-929-717
-2,000 -2,000
-1,100
-700
-300
500
1,000
2,000
1,500
2,600

2005 was a year of outstanding growth for MTS. We began to reap the benefits of our strategicexpansion into the Service Provider market, aggressive investment in product development,and rigorous cost and expense management.
In 2005, we launched two innovative products for both of our main markets: enterprises, andtelecommunications service providers. Forging into new territories, we added many customersand partners, and their positive response is evidence that we have the right products to meetthe needs of our markets moving forward.
In close cooperation with our partners, we are providing dramatic return on investment to theworld’s leading enterprises, organizations, and service providers. Over the coming year, weintend to realize the full potential of our current product lines while continuing to look to thefuture to strengthen our market position.
2005 financial resultsIn 2005, MTS realized a substantial increase in revenues. We
added customers while increasing deal sizes and winning
prestigious accounts, and we signed agreements with new strategic
partners that are already generating business for MTS around the
globe. We launched new products in both of our key markets,
consolidating our leadership position in Telecommunications
Expense Management, and gaining significant traction with
Communications Service Providers.
Revenues for the year were $11.56 million, compared to $9.41
million for the full year 2004. Six quarters of revenue growth
culminated in a very strong fourth quarter, where revenues rose
20% year-over-year to $3.01 million. At the same time, we
maintained our cost and expense management discipline and
nearly met our goal of break-even on the bottom line, reporting
a slight loss of $335,000 in Q4.
MTS ended the fourth quarter with a healthy, accumulated backlog
of orders of approximately $2.6 million. The backlog represents
orders booked by the Company but not yet recognized as revenue
through the end of 2005. This backlog is a further indicator of
the growing demand for our products and the strength of our
sales operation.
To enable us to continue to build strong foundations for future
growth, we raised $2.6 million (net of 200,000 issuance expenses)
through a private placement with institutional and private investors.
We continued to build our product development team, while
carefully managing costs and expenses, resulting in record
performance during the fourth quarter.
dear shareholders,
Chaim Mer, Chairman of the Board Eytan Bar, President and CEO
2

strengthening our leadership inthe enterpriseThis year, we launched our Invoice Management Solution, an
important addition to the Telecommunications Expense
Management Suite. Invoice Management enables organizations
to compare the invoices received from their service providers to
their agreements and actual usage. The solution automatically
uncovers discrepancies, saving money as well as valuable human
resources from the very first month of deployment.
With the introduction of Invoice Management, we made a number
of sales to existing accounts, proving that the market needs
modular, scalable solutions that can be adapted to meet both
current and future needs.
Some sales highlights include four international banks – in
Switzerland, Hong Kong and the US – that selected MTS to help
them analyze why their telecom expenses are so high. Using our
TEM solution, these banks will be able to save money directly by
preventing billing errors, improving operations costs and resource
utilization. In addition, TEM will help them to improve their vendor
and partner relations. We also deployed TEM at a major global
system integrator, an important international cosmetics company,
a convention center, some major US city governments, large
educational institutions, and many others.
Looking ahead, we developed patent-pending new mobile
technology that will power the next module of our
Telecommunications Expense Management Suite. We are confident
that our customers will be as excited about this new development
as we are.
gaining traction in the serviceprovider marketThis year we made impressive gains with service providers as
the acquisition of TeleKnowledge’s operation continued to provide
an effective launching pad for MTS to penetrate this important
sector.
We launched our improved Interconnect Billing Solution to enable
service providers to manage their interconnect relationships. The
new solution received a very positive response and has already
been installed at a major Israeli service provider. We also began
cooperation with one of the largest providers of converged
networking solutions to offer turn-key solutions for 3G Mobile,
fixed and interconnect billing to carriers. Initially, this manufacturer
ordered MTS billing solutions for three African carriers that provide
mobile fixed-wireless and long-distance billing to their subscribers.
We are very pleased that our partner has already added another
three carriers and expects to add more in other countries during
2006.
In addition, we won a new contract with a large national Spanish
carrier, and additional operators in Europe and the United States.
We believe that the momentum will continue, as Total-e, the MTS
billing solution, provides the right solution for today’s service
provider market: reliability and scalability combined with support
for the latest services and business models.
a year of opportunityWe believe that 2006 is a year of opportunity for MTS. During
the past two years, we laid down solid foundations for future
growth. New products and partners are already in place and
generating sales. We have unprecedented ability to generate
large deals and participate in significant projects in both of our
core markets.
MTS’ target market segments – enterprises and service providers
– continue to represent significant growth opportunities, driven
in large part by our customers’ need to reduce telecommunications
expenses and improve efficiency. The work we did in the past
years to enhance and introduce superior products, as well as the
partner relationships we have cultivated over the years with OEMs
and worldwide distributors and resellers convince us that we are
well positioned to capture significant opportunities in the market
moving forward.
Our mission is to enable our customers to constantly improve
efficiency and productivity through modular enhancements to a
solid software infrastructure. We are committed to providing
demonstrable value for our customers so that they will continue
to look to us to meet their needs.
Chaim Mer,Chairman of the Board
Eytan Bar,President and CEO
3

partnering for successPartners are our primary sales engine and we work with them
closely to ensure that every project is a success. Our partners
include Siemens, NEC, Airspan, Avaya, Philips, Cisco, Nortel,
Ericsson and leading global telecom solution providers.
2005 was an important year for building winning partnerships.
We strengthened our relationship with our long-time partner
Siemens, which began selling our next-generation TEM Suite into
large projects this year. We also embarked on an important new
relationship with a leading global provider of converged network
solutions that is already bearing fruit, bringing our Total-e Customer
Care and Billing solution into carriers in emerging markets
throughout Asia and Africa.
delivering value to many industriesIn 2005, we were pleased to announce additional sales in the
educational sector. MTS Telecommunications Expense Management
solutions are used by thousands of customers in a large number
of industries including healthcare, government, utilities, and
banking.
driving momentum
“MTS Telecommunications
Expense Management helps our
customers to save money and
increase organizational efficiency
every month. We recommend
MTS with confidence.”
- Mr. Werner WildhoferHead of the Project Management Department,AVAYA Germany
4

Every organization can derive dramatic benefits from TEM, and
those benefits increase exponentially according to the size of the
organization and the number of telecom vendors. With our new
Invoice Management application, we have an opportunity to
provide additional value to our existing customer base, which we
will fully leverage during the coming year.
penetrating new marketsWith our entry into Customer Care and Billing solutions, we have
successfully penetrated new markets in Africa, Asia, Central and
South America. We believe that service providers in emerging
markets will be an important sales driver moving forward. Our
results this year have shown that we have the right solution for
this group, thanks to a winning combination of rapid
implementation, advanced functionality, and built-in partner and
customer billing capabilities.
5

dramatically reducing the cost ofbusiness communicationsTelecommunications is the third largest line-expense for most
businesses. MTS' Telecommunications Expense Management
(TEM) Suite enables organizations to control spending with a
comprehensive, modular solution that can be adapted to the
needs of every size and type of enterprise. With over 20 years
of sales and thousands of satisfied customers worldwide, MTS
solutions have a proven track record of helping businesses,
institutions, and governments save money and valuable resources.
a new way to eliminate expensivebilling errorsThis year, MTS introduced Invoice Management, the latest addition
to the TEM Suite. Invoice Management helps companies
automatically compare bills to actual agreements and service
usage. Research shows that businesses typically overpay service
providers 8-20% per month. This is not surprising, given that the
number of service providers is constantly rising, and each has its
own terms and pricing plans. MTS Invoice Management delivers
a rapid return on investment, immediately uncovering billing errors
and providing organizations with a means to effectively resolve
invoice disputes with service providers.
the power of innovation
"Having an experienced partnerlike MTS provide its know-howin telecom billing solutionsassures Airspan customers thatthey are receiving the best valuefor their money."
- Alex Paz, Vice President,Airspan AS.TONE Business Development
6

advanced solutions for informationand telecommunications serviceprovidersTo stay competitive, service providers are introducing a wide
variety of advanced new services. This requires a flexible customer
care and billing platform that can grow with the business. MTS
Total-e is a multi-purpose billing solution for advanced
communications services including VoIP, WiFi, Internet, voice,
content and gaming. With customizable pre-packaged solutions,
MTS combines the benefits of high quality comprehensive solutions
with rapid deployment and launch times. A unique converged
solution, Total-e is ideally suited for new carriers in emerging
markets as well as for established carriers with legacy systems.
helping providers to billinterconnect trafficTotal-e’s new Interconnect Billing solution enables service providers
to automate their interconnect traffic effectively. In a deregulated
world, the number of interconnect relationships reaches hundreds
of service providers with thousands of variable rates.
MTS enables providers to manage the entire relationship with a
partner, from selling wholesale minutes, to monitoring contracts
and supporting multiple currencies. An important part of a complete
billing solution, Interconnect is based on MTS' in-depth industry
experience accumulated through numerous projects, and the
company’s solid investment in product development.
7

creating opportunitiesgrowing with the marketAnalysts predict that communications services will continue toconverge, with one provider offering “triple-play” and “quadruple-play” solutions. This will come to pass through a combination ofinfrastructure and partnerships. Furthermore, to support a widerange of services including entertainment and content, serviceproviders will need to support a wider and wider range of businessmodels. We are convinced that Total-e is the right solution tomeet these needs, and that demand will continue to grow overthe coming years.
In the enterprise market, the cost of communications servicescontinues to rise with increased use of mobile phones and mobiledata. Enterprises are now actively seeking ways to curtail telecomexpenses and MTS’ Telecommunications Expense Managementsolution is an ideal way to make this happen.
commitment to excellenceWe work hard to ensure the satisfaction of our customers andpartners. It is our mission to deliver demonstrable return oninvestment through the very best technology and solutions. Repeatbusiness and growing deal sizes are evidence that our efforts arepaying off.
investing in the futureThrough our investment in new products, technologies, andpartnerships, 2005 laid down the foundations for future growth.In 2006, we will focus on building sales while continuing to leadour markets into the future.
8

operating and financial review and prospects
A. Operating Results
The following discussion of our results of operations should be read together with our consolidated financial statements
and the related notes, which appear elsewhere in this annual report. The following discussion contains forward-looking
statements that reflect our current plans, estimates and beliefs and involve risks and uncertainties. Our actual results may
differ materially from those discussed in the forward-looking statements. Factors that could cause or contribute to such
differences include those discussed below and elsewhere in this annual report.
Overview We design, develop, market and support a comprehensive line of telecommunication management and customer care
& billing solutions that enable business organizations and other enterprises to improve the efficiency and performance
of all IP operations, and to significantly reduce associated costs. Our products include call accounting and management
products, fault management systems and Web-based management solutions for converged voice, voice over Internet
Protocol, IP data and video and CC&B solution. These products are designed to provide telecommunication and information
technology managers with tools to reduce communication costs, recover charges payable by third parties, detect and report
the abuse and misuse of telephone networks, monitor and detect hardware and software faults in telecommunications
networks and generate telecommunications usage information for use in the management of an enterprise. We were
among the first to offer PC-based call accounting systems when we introduced our TABS product in 1985. To date, over
70,000 TABS call accounting systems have been sold to end-users in more than 80 countries. In the service provider and
carrier market, our billing solutions provide for retail billing, interconnect billing and partner revenue management.
GeneralOur consolidated financial statements are stated in U.S. dollars and prepared in accordance with generally accepted
accounting principles in the United States. Transactions and balances originally denominated in U.S. dollars are presented
at their original amounts. Transactions and balances in other currencies are remeasured into U.S. dollars in accordance
with the principles set forth in Financial Accounting Standards Board Statement No. 52. The majority of our sales are
made outside Israel in United States dollars. In addition, substantial portions of our costs are incurred in U.S. dollars.
Since the U.S. dollar is the primary currency of the economic environment in which we and certain of our subsidiaries
operate, the dollar is our functional and reporting currency and, accordingly, monetary accounts maintained in currencies
other than the dollar are remeasured using the foreign exchange rate at the balance sheet date. Operational accounts
and non-monetary balance sheet accounts are measured and recorded at the exchange rate in effect at the date
of the transaction. The financial statements of certain subsidiaries and an affiliate, whose functional currency is not
the dollar, have been translated into U.S. dollars. All balance sheet accounts have been translated using the exchange rates
in effect at the balance sheet date. Statement of operations amounts has been translated using the average exchange rate
for the period. The resulting translation adjustments are reported as a component of shareholders’ equity in accumulated
other comprehensive income (loss).
Discussion of Critical Accounting Policies and EstimatesThe preparation of financial statements in conformity with generally accepted accounting principles requires us to
make estimates and assumptions that affect the reported amounts of assets and liabilities and disclosure of contingent
assets and liabilities at the date of the financial statements and the reported amounts of revenues and expenses during
the reporting period. Actual results could differ from those estimates and the use of different assumptions would likely
result in materially different results of operations.
Critical accounting policies are those that are both most important to the portrayal of a company’s financial position and
results of operations, and require management’s most difficult, subjective or complex judgments. Although not all of our
significant accounting policies require management to make difficult, subjective or complex judgments or estimates,
the following policies and estimates are those that we deem most critical:
MTS annual report 2005 9

Revenue Recognition. We account for our revenue in accordance with the provisions of SOP No. 97–2, “Software Revenue Recognition,” issued by the American Institute of Certified Public Accountants and as amended by SOP No. 98–9 and related interpretations. When an arrangement does not require significant production, modification or customization of software or does not contain services considered to be essential to the functionality of the software, revenue is recognized when the following four criteria are met:
Persuasive evidence of an arrangement exists. We require evidence of an agreement with a customer specifying the terms and conditions of the products or services to be delivered typically in the form of a purchase order;
Delivery has occurred. For software licenses, delivery takes place when the software is installed on site or remotely or is shipped via mail on a compact disc or server. For services, delivery takes place as the services are provided;
The fee is fixed or determinable. Fees are fixed or determinable if they are not subject to a refund or cancellation and do not have payment terms that exceed our standard payment terms.
Collection is probable. We perform a credit review of all customers with significant transactions to determine whether a customer is credit worthy and collection is probable.
In general, revenue for transactions that do not involve software customization or services considered essential to the functionality of the software is recognized as follows: (i) software license fees for sales through OEMs are recognized upon receipt of license activity or royalty reports; (ii) all other software license fees are recognized upon delivery of the software; (iii) software maintenance and technical support are recognized ratably over the contract term; and (iv) consulting, training and other similar services are recognized as the services are performed.
We exercise judgment and use estimates in connection with the determination of the amount of product software license and services revenues to be recognized in each accounting period. If the fee due from the customer is not fixed or determinable, revenue is recognized as payments become due from the customer. If collection is not considered probable, revenue is recognized when the fee is collected. We record a provision to operating expenses for bad debts resulting from customers’ inability to pay for the products or services they have received. These estimates are based on historical bad debt expense, analyses of credit memo data, and other known factors, such as bankruptcy. If the historical data we use to calculate these estimates do not accurately reflect future returns or bad debts, adjustments to these reserves may be required that would increase or decrease revenue or net income.
Many of our software arrangements involve multiple elements. Such elements typically include any or all of the following: software licenses, software maintenance, technical support and training services. For multiple-element arrangements that do not involve significant modification or customization of the software and do not involve services that are considered essential to the functionality of the software, we allocate value to each undelivered element based on vendor specific objective evidence, or VSOE, of the fair value of each undelivered element in the arrangement, in accordance with the “residual method” prescribed by SOP No. 98-9, “Modification of SOP No. 97–2, Software Revenue Recognition With Respect to Certain Transactions.” The VSOE used by us to allocate the sales price to support services and maintenance is based on the renewal rate charged when these elements are sold separately. License revenues are recorded based on the residual method. Under the residual method, revenue is recognized for the delivered elements when (1) there is VSOE of the fair values of all the undelivered elements, and (2) all revenue recognition criteria of SOP No. 97-2, as amended, as described above, are satisfied. Under the residual method any discount in the arrangement is allocated to the delivered element.
Revenues from billing products which involve significant customization of our software to customer specific specifications are recognized in accordance with SOP No. 81–1, “Accounting for Performance of Construction-Type and Certain Production-Type Contracts,” using contract accounting on a percentage of completion method, over the period from signing of the license through to customer acceptance in accordance with the “input method.” The amount of revenue recognized is based on the total license fees under the license agreement and the percentage to completion achieved. The percentage to completion is measured by monitoring progress using records of actual costs incurred to date in the project compared with the total estimated project requirement. Estimates of total project requirements are based on prior experience of customization, delivery and acceptance of the same or similar technology and are reviewed and updated regularly by management.
Where arrangements recognized according to SOP No. 81-1 involve maintenance and support services, revenues are recognized according to Emerging Issues Task Force, or EITF, Issue No. 00–21, “Revenues Arrangements with Multiply Deliveries,” or EITF 00-21. According to EITF 00–21, a multiple-element arrangement (an arrangement that involves the delivery or performance of multiple products, services and/or rights to use assets) is separated into more than one unit of accounting, if the functionality of the delivered element is not dependent on the undelivered element, there is VSOE of fair value of the undelivered element and delivery of the delivered element represents the culmination of the earnings process for this element. We have established VSOE for maintenance and support services based on the renewal rate charged when these elements are sold separately and therefore the arrangement consideration is allocated to maintenance and support services based on their relative VSOE.
After delivery, if uncertainty exists about customer acceptance of the software, license revenue is not recognized until acceptance. Provisions for estimated losses on uncompleted contracts are made in the period in which such losses are first
•
•
•
•
10 MTS annual report 2005

determined, in the amount of the estimated loss on the entire contract. As of December 31, 2005, no such estimated losses were identified.
Estimated gross profit or loss from long-term contracts may change due to changes in estimates resulting from differences between actual performance and original forecasts. Such changes in estimated gross profit are recorded in results of operations when they are reasonably determinable by management, on a cumulative catch-up basis.
We believe that the use of the percentage of completion method is appropriate as we have the ability to make reasonably dependable estimates of the extent of progress towards completion, contract revenues and contract costs. In addition, contracts executed include provisions that clearly specify the enforceable rights regarding services to be provided and received by the parties to the contracts, the consideration to be exchanged and the manner and terms of settlement. In all cases we expect to perform our contractual obligations and our licensees are expected to satisfy their obligations under the contract.
Allowances for Doubtful Accounts. We perform ongoing credit evaluations of our customers’ financial condition and we require collateral as deemed necessary. We maintain allowances for doubtful accounts for estimated losses resulting from the inability of our customers to make payments. In judging the adequacy of the allowance for doubtful accounts, we consider multiple factors including the aging of our receivables, historical bad debt experience and the general economic environment. Management applies considerable judgment in assessing the realization of receivables, including assessing the probability of collection and the current credit worthiness of each customer. If the financial condition of our customers were to deteriorate, resulting in an impairment of their ability to make payments, additional allowances may be required.
Income Taxes. Estimates and judgments are required in the calculation of certain tax liabilities and in the determination of the recoverability of certain of the deferred tax assets, which arise from net operating losses tax carryforwards and temporary differences between the tax and financial statement recognition of revenue and expense. SFAS No. 109, “Accounting for Income Taxes,” also requires that the deferred tax assets be reduced by a valuation allowance, if based on the weight of available evidence, it is more likely than not that some portion or all of the recorded deferred tax assets will not be realized in future periods.
In evaluating our ability to recover our deferred tax assets, in full or in part, we consider all available positive and negative evidence including our past operating results, the existence of cumulative losses in the most recent fiscal years and our forecast of future taxable income on a jurisdiction by jurisdiction basis. In determining future taxable income, we are responsible for assumptions utilized, including the amount of Israeli and international pre-tax operating income, the reversal of temporary differences and the implementation of feasible and prudent tax planning strategies. These assumptions require significant judgment about the forecasts of future taxable income and are consistent with the plans and estimates we use to manage the underlying businesses.
Based on estimates of future taxable profits and losses in certain foreign tax jurisdictions, we determined that a valuation allowance of $2.0 million was required for tax loss carryforwards and other temporary differences as of December 31, 2005. If these estimates prove inaccurate, a change in the valuation allowance could be required in the future.
Contingencies. We are involved in legal proceedings and other claims from time to time. We are required to assess the likelihood of any adverse judgments or outcomes to these matters, as well as potential ranges of probable losses. A determination of the amount of reserves required, if any, for any contingencies are made after careful analysis of each individual claim. The required reserves may change due to future developments in each matter or changes in approach, such as a change in the settlement strategy in dealing with any contingencies, which may result in higher net loss. If actual results are not consistent with our assumptions and judgments, we may be exposed to gains or losses that could be material.
Impairment of long-lived assets. We review our long-lived assets and certain identifiable intangible assets for impairment whenever events or changes in circumstances indicate that the carrying value may not be recoverable. Factors that could indicate an impairment include significant underperformance of the asset as compared to historical or projected future operating results, significant changes in the actual or intended use of the asset, or significant negative industry or economic trends. When we determine that the carrying value of an asset may not be recoverable, the related estimated future undiscounted cash flows expected to result from the use and eventual disposition of the asset are compared to the carrying value of the asset. If the sum of the estimated undiscounted future cash flows is less than the carrying amount, we record an impairment charge based on the difference between the carrying value of the asset and its fair value, which we estimate based on discounted expected future cash flows. In determining whether an asset is impaired, we must make assumptions regarding recoverability of costs, estimated future cash flows from the asset, intended use of the asset and other related factors. If these estimates or their related assumptions change, we may be required to record impairment charges for these assets. As of December 31, 2005, no impairment losses have been identified.
Goodwill. Goodwill represents excess of the costs over the net assets of business acquired. Goodwill from acquisitions made prior to July 1, 2001 was amortized until December 31, 2001 by the straight-line method over 10 years. Goodwill acquired in a business combination on or after July 1, 2001 is not amortized.
Effective January 1, 2002, we adopted SFAS No. 142. SFAS No. 142 requires goodwill to be tested for impairment on adoption and at least annually thereafter, and written down when impaired, rather than being amortized as previous accounting
MTS annual report 2005 11

standards required. Goodwill attributable to each of our reporting units is tested for impairment by comparing the fair value of each reporting unit with its carrying value. Fair value is determined using discounted cash flows. Significant estimates used in the methodologies include estimates of future cash flows, future short-term and long-term growth rates, and weighted average cost of capital for each of the reportable units. We have selected September 30 as the date we will perform our annual goodwill impairment tests. The annual goodwill impairment test for 2005 was prepared for us by an independent consulting firm. As of December 31, 2005, no impairment was required. Any changes in our key assumptions could result in an impairment charge and such a change could have a material adverse affect on our financial position and results of operations
Results of OperationsThe following table for the periods indicated, presents certain financial data expressed as a percentage of total revenues:
Year Ended December 31, 2003 2004 2005
Revenues:
Products sales 75.2% 75.1% 66.0%
Services 24.8 24.9 34.0
Total Revenues 100.0 100.0 100.0
Cost of revenues
Products sales 16.5 25.6 25.7
Services 3.5 4.3 7.2
Total cost of revenues 20.0 29.9 32.9
Gross profit 80.0 70.1 67.1
Selling and marketing expenses 42.5 66.9 41.5
Research and development, net costs 19.8 25.1 38.0
General and administrative expenses 19.8 22.3 24.5
Operating loss (2.1) (44.2) (36.9)
Financial income, net 1.4 0.8 0.5
Loss before taxes on income (0.7) (43.4) (36.4)
Taxes on income 2.1 2.8 0.1
Net loss before equity in earnings of affiliate (2.8) (46.2) (36.5)
Equity in earning of affiliate 3.7 2.4 0.0
Net income (loss) 0.9% (43.8)% (36.5)%
Years Ended December 31, 2005 and 2004Revenues from Products and Services. Revenues consist primarily of software license fees sales, hardware sales and revenues from services, including service bureau, maintenance, training, professional services and support. Revenues increased by 22.8% to $11.56 million in 2005 from $9.41 million in 2004. In 2005, the revenues from our wholly owned U.S. subsidiary, MTS IntegraTRAK, increased by 22% from 2004 and accounted for 52.3% of our total revenues. The increase in revenues in 2005 is primarily attributable to revenues from billing solutions that were based on the technology that we acquired from Teleknowledge and revenues from sales of our new telemanagement solutions. We anticipate that our revenues will slightly increase in 2006.
Cost of Revenues from Products and Services. Cost of revenues consists primarily of (i) production costs (including hardware, media, packaging, freight and documentation); (ii) certain royalties and licenses payable to third parties (including the Office of the Chief Scientist of the Ministry of Industry and Trade of the State of Israel), (iii) professional services costs; and (iv) warranty and support costs for up to one year for end-users and up to 15 months for our OEM distributors. Cost of revenues increased by 35.1% to $3.80 million in 2005 from $2.81 million in 2004. This increase in cost of revenues in 2005 corresponds with the increase in revenues and is primarily a result of the change in our product mix from “shelf products” to customized telecommunications equipment manufacturer products and billing solutions.
12 MTS annual report 2005

Research and Development, net. Research and development expenses consist primarily of salaries of employees engaged in on-going research and development activities, outsourcing subcontractor development and other related costs, net of grants that were approved by the Office of the Chief Scientist. Research and development costs increased by 86.1% to $4.40 million in 2005 (net of the grant from the Office of the Chief Scientist in the amount of $130,000) from $2.36 million in 2004 (after the capitalization of $386,000 of software development costs). Total research and development expenses increased in 2005 primarily due to the continued integration of Teleknowledge’s research and development group, as well as to our continuing investment in product development. We expect that our research and development expenses will remain at the same level in 2006.
Selling and Marketing. Selling and marketing expenses consist primarily of costs relating to sales representatives and their travel expenses, trade shows and marketing exhibitions, advertising and presales support. Selling and marketing expenses decreased by 23.9% to $4.80 million in 2005 from $6.30 million in 2004. This decrease in selling and marketing expenses in 2005 is primarily attributable to our focus on investing in growth markets and targeted geographic areas, as well as our ability to form partnerships with leading OEMs and vendors for various initiatives.
General and Administrative. General and administrative expenses consist primarily of compensation costs for administration, finance and general management personnel, professional fees and office maintenance and administrative costs. General and administrative expenses increased by 34.7% to $2.83 million in 2005 from $2.10 million in 2004. This increase in general and administrative expenses in 2005 is primarily attributable to the increase in our overall activity.
Financial Income, net. Financial income, net consists primarily gains on marketable securities, interest income on bank deposits, bank commissions, bank interest and foreign currency translation adjustments. Financial income, net decreased by 32.1% to $53,000 in 2005 from $78,000 in 2004. In 2005, our interest income was negatively affected by the decrease in our holdings of cash and cash equivalents and by foreign currency translation adjustments expenses. These expenses were offset in part by gains on marketable securities, net in the amount of $81,000.
Taxes on Income. In 2005, our taxes on income were $10,000 as compared to $266,000 in 2004. Most of our taxes in 2004 were the result of our provision for the Israeli tax authorities’ demand for tax payment for the 1997-1999 period. We have made a provision in our financial statements for this tax demand for the amount deemed probable.
Equity in Results of Affiliate. We recognize income and loss from the operations of our 50%-owned affiliate, Jusan S.A. In 2005 and 2004, we recognized income of $2,000 and $225,000, respectively.
Years Ended December 31, 2004 and 2003Revenues. Revenues increased by 2.0% to $9.41 million in 2004 from $9.23 million in 2003. In 2004, the revenues from our wholly owned U.S. subsidiary, MTS IntegraTRAK, increased by 0.7% from 2003 and accounted for 52.6% of our total revenues.
Cost of Revenues. Cost of revenues increased by 52.2% to $2.81 million in 2004 from $1.85 million in 2003. The increase in cost of revenues in 2004 is principally as a result of the significant number of new employees recruitments in professional services and technical support departments and their travel expenditures.
Research and Development. Research and development costs increased by 29% to $2.36 million (after the capitalization of $0.4 million of software development costs) from $1.83 million in 2003. Total research and development expenses increased in 2004 primarily due to the increase of our research and development activity including the recruitment of new employees in that department and outsourcing additional subcontractors for development.
Selling and Marketing. Selling and marketing expenses were $6.30 million in 2004, an increase of approximately 60.9% from $3.92 million in 2003. The increase in selling and marketing expenses in 2004 is primarily attributable to the increase in our personnel globally across our sales division.
General and Administrative. General and administrative expenses increased by 14.8% to $2.10 million in 2004 from $1.83 million in 2003 as we increased our overall activity.
Financial Income, Net. Financial income decreased by 37% to $78,000 in 2004 from $130,000 in 2003. During the four years ended December 31, 2004 our interest income was negatively affected by the prevailing low interest rates in both the United States and in Israel and the decrease in the total cash and cash equivalents held by us.
Taxes on Income. In 2004, our taxes on income were $266,000 as compared to $198,000 in 2003. Most of our taxes in 2004 were the result of our provision for the Israeli tax authorities’ demand for tax payment for the 1997–1999 period. Most of our taxes in 2003 were the result of our realization of a deferred tax assets according to our accounting policy. During 2003, we realized a tax benefit of $80,000 from a tax return received from the Spanish tax authorities.
Equity in Results of Affiliate. We recognize income and loss from the operations of our 50%-owned affiliate, Jusan S.A. In 2004 and 2003, we recognized income of $225,000 and $345,000, respectively.
MTS annual report 2005 13

Quarterly Results of Operations The following tables set forth certain unaudited quarterly financial information for the two years ended December 31, 2005. The data has been prepared on a basis consistent with our audited consolidated financial statements included elsewhere in this annual report and include all necessary adjustments, consisting only of normal recurring adjustments, that we consider necessary for a fair presentation. The operating results for any quarter are not necessarily indicative of results for any future periods.
Three months ended 2004 2005
Mar. 31, Jun. 30, Sept. 30, Dec. 31, Mar. 31, Jun. 30, Sept. 30, Dec. 31,
Revenues $2,359 $1,992 $2,485 $2,577 $2,726 $2,812 $3,013 $3,012
Cost of revenues 541 506 674 1,093 887 1,006 1,061 848
Gross profit 1,818 1,486 1,811 1,484 1,839 1,806 1,952 2,164
Selling and marketing 1,125 1,397 1,762 2,016 1,527 1,370 984 916Research and development, net 534 569 414 845 1,294 1,030 1,118 953General and administrative 397 489 533 682 1,045 677 588 520
Operating expenses 2,056 2,455 2,709 3,543 3,866 3,077 2,690 2,389
Operating loss (238) (969) (898) (2,059) (2,027) (1,271) (738) (225)Financial income (expense), net (4) (7) 42 47 21 83 (6) (45)
Other income (loss), net — — — — — — (2) 2
Loss before taxes on income (242) (976) (856) (2,012) (2,006) (1,188) (746) (268)
Taxes on income — 2 1 263 — — — 10
Net loss before equity in results of affiliate (242) (978) (857) (2,275) (2,006) (1,188) (746) (278)
Equity in results of affiliate 46 49 140 (10) (28) 39 48 (57)
Net loss $(196) $(929) $(717) $(2,285) $(2,034) $(1,149) $(698) $(335)
Basic and diluted net loss per share $ (0.04) $(0.20) $(0.15) $(0.50) $(0.44) $(0.24) $(0.13) $(0.06)Weighted average number of ordinary
shares used in computing basic and diluted net loss per share 4,624,804 4,633,471 4,638,004 4,638,004 4,638,004 4,712,561 5,306,565 5,724,504
Revenues 100.0% 100.0% 100.0% 100.0% 100.0% 100.0% 100.0% 100.0%
Cost of revenues 22.9 25.4 27.1 42.4 32.5 35.8 35.2 28.2
Gross profit 77.1 74.6 72.9 57.6 67.5 64.2 64.8 71.8
Selling and marketing 47.7 70.1 70.9 78.2 56.0 48.7 32.7 30.4Research and development, net 22.6 28.6 16.7 32.8 47.5 36.6 37.1 31.6General and administrative 16.8 24.5 21.4 26.5 38.3 24.1 19.5 17.3
Operating expenses 87.2 123.2 109.0 137.5 141.8 109.4 89.3 79.3
Operating loss (10.1) (48.6) (36.1) (79.9) (74.3) (45.2) (24.5) (7.5)Financial income (expense), net (0.2) (0.4) 1.7 1.8 0.8 3.0 (0.2) (1.5)
Other income (loss), net — — — — — — (0.1) 0.1
Loss before taxes on income (10.3) (49.0) (34.4) (78.1) (73.5) (42.2) (24.8) (8.9)
Taxes on income — 0.1 — 10.2 — — — 0.3
Net loss before equity in results of affiliate (10.3) (49.1) (34.4) (88.3) (73.5) (42.2) (24.8) (9.2)
Equity in results of affiliate 1.9 2.5 5.5 (0.4) (1.0) 1.4 1.6 (1.9)
Net loss (8.3)% (46.6)% (28.9)% (88.7)% (74.6)% (40.8)% (23.2)% (11.1)%
14 MTS annual report 2005

B. Liquidity and Capital Resources On December 31, 2005, we had $3.2 million in cash and cash equivalents, $132,000 in marketable securities and working capital of $2.1 million as compared to $3.8 million in cash and cash equivalents, $1.1 million in marketable securities and working capital of $2.8 million on December 31, 2004. The decrease in working capital in 2005 is primarily due to our cash decrease during the year as a result of losses and research and development expenses associated with the integration of the Teleknowledge activity.
On August 10, 2005, we raised $2.8 million (before issuance costs) in a private placement of 937,500 ordinary shares to institutional and private investors, including our President, Mr. Eytan Bar. The investors, other than Mr. Bar, paid $3.00 per share for the ordinary shares purchased in the private placement. Mr. Bar purchased 14,000 shares at $3.88 per share, the closing price of our ordinary shares on the day prior to the closing of the private placement. The private placement also involved the acquisition by the investors of warrants to purchase an aggregate of 375,000 ordinary shares at an exercise price of $4.00 per share (subject to anti-dilution adjustments), exercisable from February 10, 2006 until August 10, 2009. Each investor, including Mr. Eytan Bar, received warrants to purchase two ordinary shares for each five ordinary shares purchased. To date, no warrants have been exercised.
One of the principal factors affecting our working capital is the payment cycle on our sales. Any material change in the current aging of our accounts receivable could have an adverse effect on our working capital.
Our operations used $4.4 million during the year ended December 31, 2005, compared to $2.6 million that was used during the year ended December 31, 2004. The use of our funds in 2005 was primarily due to our research and development expenses associated with the integration of the Teleknowledge activity, as well as to our continuing investment in product development.
In December 2000, we publicly announced our stock repurchase program, under which our officers were authorized to repurchase up to 300,000 of our ordinary shares. In May 2003, our Board of Directors increased the number of shares to be repurchased to 600,000 ordinary shares. Through December 31, 2004, we repurchased an aggregate 395,410 ordinary shares, at a total cost of $486,000. We did not continue this program during 2005 and based on our current financial situation, we do not expect to repurchase any shares during 2006. We cancelled 384,610 of the repurchased ordinary shares.
We currently do not have significant capital spending or purchase commitments, but we expect to continue to engage in capital spending consistent with the level of our operations. We anticipate that our cash on hand and cash flow from operations will be sufficient to meet our working capital and capital expenditure requirements for at least 12 months. However, if we do not generate sufficient cash from operations, we may be required to obtain additional financing or to reduce level of expenditure. There can be no assurance that such financing will be available in the future, or, if available, will be on terms satisfactory to us.
SeasonalityOur operating results are generally not characterized by a seasonal pattern except that our volume of sales in Europe are generally lower in the summer months.
Off-Balance Sheet ArrangementsWe are not a party to any material off-balance sheet arrangements. In addition, we have no unconsolidated special purpose financing or partnership entities that are likely to create material contingent obligations.
MTS annual report 2005 15

index
report of independent registered public accounting firm 17
consolidated balance sheets 18–19
consolidated statements of operations 20
statements of changes in shareholders’ equity 21
consolidated statements of cash flows 22–23
notes to consolidated financial statements 24–47
16 MTS annual report 2005

report of independent registered public accounting firmTo the Shareholders of MER Telemanagement Solutions Ltd.
We have audited the accompanying consolidated balance sheets of Mer Telemanagement Solutions Ltd. (“the Company”) and its subsidiaries as of December 31, 2004 and 2005, and the related consolidated statements of operations, changes in shareholders’ equity and cash flows for each of the three years in the period ended December 31, 2005. These financial statements are the responsibility of the Company’s management. Our responsibility is to express an opinion on these financial statements based on our audits. We did not audit the financial statements of Jusan SA, a 50% owned affiliate for the years ended December 31, 2004 and 2005, in which the Company’s investments totaled $ 2,119 thousand and $ 1,615 thousand as of December 31, 2004 and 2005, respectively and the Company’s equity in its revenues in 2004 and 2005 constitutes $ 225 thousand and $ 2 thousand, respectively . Those statements were audited by other auditors whose reports have been furnished to us and our opinion, insofar as it relates to amounts emanating from the financial statements of such investee companies, is based solely on the reports of the other auditors.
We conducted our audits in accordance with the standards of the Public Company Accounting Oversight Board (United States). Those standards require that we plan and perform the audit to obtain reasonable assurance about whether the financial statements are free of material misstatement. We were not engaged to perform an audit of the Company’s internal control over financial reporting. Our audits included consideration of internal control over financial reporting as a basis for designing audit procedures that are appropriate in the circumstances, but not for the purpose of expressing an opinion on the effectiveness of the Company’s internal control over financial reporting. Accordingly, we express no such opinion. An audit also includes examining, on a test basis, evidence supporting the amounts and disclosures in the financial statements, assessing the accounting principles used and significant estimates made by management, and evaluating the overall financial statement presentation. We believe that our audits and the reports of other auditors provide a reasonable basis for our opinion.
In our opinion, based on our audits and the reports of the other auditors, the consolidated financial statements referred to above present fairly, in all material respects, the consolidated financial position of the Company and its subsidiaries as of December 31, 2004 and 2005, and the consolidated results of their operations and their cash flows for each of the three years in the period ended December 31, 2005, in conformity with accounting principles generally accepted in the United States.
Tel-Aviv, Israel KOST FORER GABBAY & KASIERERFebruary 7, 2006 A Member of Ernst & Young Global
MTS annual report 2005 17

Consolidated balance sheets
creating opportunities through innovation
consolidated balance sheets U.S. dollars in thousands
December 31, 2004 2005
Assets
Current assets:Cash and cash equivalents $ 3,814 $ 3,191
Marketable securities (Note 3) 1,057 132
Trade receivables (net of allowance for doubtful accounts of $ 370 and $ 402
at December 31, 2004 and 2005, respectively) 1,348 1,895
Unbilled receivables — 104
Other accounts receivable and prepaid expenses (Note 4) 391 491
Inventories (Note 5) 178 181
Total current assets 6,788 5,994
Long-term assets:Investments in an affiliate (Note 6) 2,119 1,615
Long-term loans, net of current maturities (Note 7) 45 3
Severance pay fund 535 478
Other investments (Note 8) 373 347
Total long-term assets 3,072 2,443
Property and equipment, net (Note 9) 581 571
Other assets:Goodwill (Note 10a) 3,415 3,700
Other intangible assets, net (Note 10b) 1,394 993
Deferred income taxes (Note 13) 73 115
Total other assets 4,882 4,808
Total assets $ 15,323 $ 13,816
The accompanying notes are an integral part of the consolidated financial statements.
18 MTS annual report 2005

Consolidated balance sheets
consolidated balance sheets U.S. dollars in thousands (except share and per share data)
December 31, 2004 2005
Liabilities and shareholders’ equity
Current liabilities:Trade payables $ 719 $ 735
Accrued expenses and other liabilities (Note 11) 2,042 2,306
Deferred revenues 1,254 888
Total current liabilities 4,015 3,929
Long-term liabilities:Accrued severance pay 651 713
Total long-term liabilities 651 713
Commitments and contingent liabilities (note 12)
Shareholders’ equity (Note 15): Share capital —
Ordinary shares of NIS 0.01 par value — Authorized: 12,000,000 shares at
December 31, 2004 and 2005; Issued: 4,648,804 and 5,744,304 shares at
December 31, 2004 and 2005, respectively; Outstanding: 4,638,004 and 5,733,504
shares at December 31, 2004 and 2005, respectively 14 17
Additional paid-in capital 12,879 15,966
Treasury shares (10,800 Ordinary shares at December 31, 2004 and 2005) (29) (29)
Deferred stock compensation (208) (142)
Accumulated other comprehensive income (loss) 348 (75)
Accumulated deficit (2,347) (6,563)
Total shareholders’ equity 10,657 9,174
Total liabilities and shareholders’ equity $ 15,323 $ 13,816
The accompanying notes are an integral part of the consolidated financial statements.
MTS annual report 2005 19

creating opportunities through innovation
Consolidated statements of operations
consolidated statements of operations U.S. dollars in thousands (except share and per share data)
Year ended December 31, 2003 2004 2005
Revenues (Note 16):
Product sales $ 6,944 $ 7,070 $ 7,628
Services 2,286 2,343 3,935
Total revenues 9,230 9,413 11,563
Cost of revenues:
Product sales 1,523 2,407 2,968
Services 326 407 834
Total cost of revenues 1,849 2,814 3,802
Gross profit 7,381 6,599 7,761
Operating expenses:
Research and development, net 1,825 2,362 4,395
Selling and marketing 3,916 6,300 4,797
General and administrative 1,830 2,101 2,830
Total operating expenses 7,571 10,763 12,022
Operating loss (190) (4,164) (4,261)
Financial income, net 131 78 53
Loss before taxes on income (60) (4,086) (4,208)
Taxes on income (Note 13) 198 266 10
Loss before equity in earnings of affiliate (258) (4,352) (4,218)
Equity in earnings of affiliate 345 225 2
Net income (loss) $ 87 $ (4,127) $ (4,216)
Net earnings (loss) per share:
Basic and diluted net earnings (loss) per Ordinary share $ 0.02 $ (0.89) $ (0.83)
Weighted average number of Ordinary shares used in computing basic
net earnings (loss) per share 4,617,099 4,634,413 5,092,117
Weighted average number of Ordinary shares used in computing diluted
net earnings (loss) per share 4,628,249 4,634,413 5,092,117
The accompanying notes are an integral part of the consolidated financial statements.
20 MTS annual report 2005

Statements of changes in shareholders’ equity
consolidated statements of changesin shareholders’ equity U.S. dollars in thousands
Share capitalAdditional
paid-in capital Treasury shares
Deferred stock compensation
Accumulated other
comprehensive income (loss)
Accumulated earnings
deficit)
Total comprehensive
income (loss)
Total shareholders’
equityNumber Amount
Balance as of January 1, 2003 4,621,648 $ 15 $ 12,846 $ (330) $ — $ (211) $ 1,693 $ 14,013
Exercise of options 133,333 *) — — — — — — *) —
Employee stock based compensation — — 223 — (223) — — —
Amortization of deferred stock compensation — — — — 213 — — 213
Retirement of treasury shares (130,510) (1) (456) 457 — — — —
Purchase of treasury shares — — — (147) — — — (147)
Other comprehensive income:
Unrealized gains on available-for-sale marketable securities, net — — — — — 109 — $ 109 109
Foreign currency translation adjustments — — — — — 196 — 196 196
Loss from cash flows hedging transaction — — — — — (7) — (7) (7)
Total other comprehensive income 298
Net income — — — — — — 87 87 87
Total comprehensive income $ 385
Balance as of December 31, 2003 4,624,471 14 12,613 (20) (10) 87 1,780 14,464
Exercise of options 17,333 *) — 2 — — — — 2
Employee stock based compensation — — 264 — (264) — — —
Amortization of deferred stock compensation — — — — 66 — — 66
Purchase of treasury shares (3,800) — — (9) — — — (9)
Other comprehensive loss: —
Unrealized gains on available-for-sale marketable securities, net — — — — — 83 — $ 83 83
Foreign currency translation adjustments — — — — — 171 — 171 171
Gain from cash flows hedging transaction — — — — — 7 — 7 7
Total other comprehensive loss — 261
Net loss — — — — — — (4,127) (4,127) (4,127)
Total comprehensive loss $ (3,866)
Balance as of December 31, 2004 4,638,004 14 12,879 (29) (208) 348 (2,347) 10,657
Issuance of shares, net 937,500 2 2,623 — — — — 2,625
Exercise of options 158,000 1 308 — — — — 309
Stock based compensation related to warrants issued to non employees — — 156 — — — — 156
Amortization of deferred stock compensation — — — — 66 — — 66
Other comprehensive loss:
Unrealized losses on available-for-sale marketable securities, net — — — — — (76) — $ (76) (76)
Foreign currency translation adjustments — — — — — (347) — (347) (347)
Total other comprehensive loss (423)
Net loss — — — — — — (4,216) (4,216) (4,216)
Total comprehensive loss $ (4,639)
Balance as of December 31, 2005 5,733,504 $ 17 $ 15,966 $ (29) $ (142) $ (75) $ (6,563) $ 9,174
Accumulated unrealized gains from available-for-sale marketable securities $ 10
Accumulated foreign currency translation adjustments (85)
$ (75)
*) Represents an amount lower than $ 1.The accompanying notes are an integral part of the consolidated financial statements.
MTS annual report 2005 21

creating opportunities through innovation
Consolidated statements of cash flows
consolidated statements of cash flows U.S. dollars in thousands
Year ended December 31, 2003 2004 2005
Cash flows from operating activities:Net income (loss) $ 87 $ (4,127) $ (4,216)Adjustments required to reconcile net income (loss) to net cash provided
by (used in) operating activities:
Gains on sale of available-for-sale marketable securities (6) — (77)
Loss on sale of property and equipment 39 1 —
Impairment of other investments — — 27
Equity in earnings of affiliate (345) (225) (2)
Depreciation and amortization 401 399 655
Deferred income taxes, net 23 33 10
Employee stock-based compensation 213 66 66
Stock based compensation related to warrants issued to non employees — — 156
Accrued severance pay, net (47) 2 119
Decrease (increase) in trade receivables and unbilled receivables (132) 144 (672)
Decrease (increase) in other accounts receivable and prepaid expenses (89) 175 (99)
Decrease (increase) in inventories 47 15 (3)
Increase in trade payables 43 326 16
Increase (decrease) in accrued expenses and other liabilities (99) 611 (46)
Increase (decrease) in deferred revenues 35 (41) (366)
Increase in related parties, net 51 20 15
Others (7) — —
Net cash provided by (used in) operating activities 163 (2,621) (4,417)
Cash flows from investing activities:Proceeds from sale of property and equipment 5 22 7
Purchase of property and equipment (171) (293) (251)
Capitalization of research and development costs — (386) —
Investment in lease deposits — (5) (26)
Investment in available-for-sale marketable securities (969) (220) (163)
Proceeds from sale of available-for-sale marketable securities 318 891 1,089
Proceeds from redemption of held-to-maturity marketable securities 275 — —
Acquisition of certain assets and liabilities of Teleknowledge (a) — (2,445) (21)
Dividend from an affiliate 100 136 195
Others 16 50 63
Net cash provided by (used in) investing activities (375) (2,230) 893
The accompanying notes are an integral part of the consolidated financial statements.
22 MTS annual report 2005

Consolidated statements of cash flows
consolidated statements of cash flows U.S. dollars in thousands
Year ended December 31, 2003 2004 2005
Cash flows from financing activities: Repayment of long-term loans (8) (8) —
Proceeds from issuance of shares and warrants, net — — 2,625
Proceeds from exercise of options and warrants *) — 2 281
Purchase of treasury shares (147) (9) —
Net cash provided by (used in) financing activities (155) (15) 2,906
Effect of exchange rate changes on cash and cash equivalents (11) (4) (5)
Decrease in cash and cash equivalents (378) (4,870) (623)
Cash and cash equivalents at the beginning of the year 9,062 8,684 3,814
Cash and cash equivalents at the end of the year $ 8,684 $ 3,814 $ 3,191
Supplemental disclosure of cash flows activities:Cash paid during the year for:
Interest $ 1 $ 1 $ 3
Income taxes $ 49 $ 25 $ 17
(a) In conjunction with the acquisition, the fair values of assets acquired
and liabilities assumed at the date of acquisition were as follows
(see Note 1c):
Working capital (excluding cash and cash equivalents) $ 24 $ —Estimated fair value of assets acquired and liabilities assumed at the
acquisition date:
Property and equipment 40 —
Goodwill 1,391 21
Developed technology 690 —
Customer relationship 300 —
$ 2,445 $ 21
(b) Supplemental disclosure of non-cash activities:Earnout in respect of Teleknowledge acquisition $ — $ — $ 264
*) Represents an amount lower than $ 1.
The accompanying notes are an integral part of the consolidated financial statements.
MTS annual report 2005 23

creating opportunities through innovation
Notes to consolidated financial statements
U.S. Dollars in thousands (except share data)
note 1: generala. Mer Telemanagement Solutions Ltd. (“the Company” or “MTS”) was incorporated on December 27, 1995. MTS and its subsidiaries (“the Group”) design, develop, market and support a comprehensive line of telecommunication management and customer care & billing (“CC&B”) solutions that enable business organizations and other enterprises to improve the efficiency and performance of all IP operations, and reduce associated costs. The Group products include call accounting and management products, fault management systems and web based management solutions for converged voice, voice over Internet Protocol, IP data and video and CC&B solutions. As for MTS’s subsidiaries, see Note 18.
b. MTS’s products are designed to provide telecommunication and information technology managers with tools to reduce communication costs, recover charges payable by third parties, and to detect and prevent abuse and misuse of telephone networks including fault telecommunication usage.
The Group markets its products worldwide through distributors, business telephone switching systems manufacturers and vendors and its direct sales force. Several international private automatic branch exchange (“PBX”) manufacturers market the Group’s products as part of their PBX selling efforts or on an Original Equipment Manufacturer (“OEM”) basis. The Group is highly dependent upon the active marketing and distribution of its OEM’s. If the Group is unable to effectively manage and maintain a relationship with its OEM or any event negatively affecting such dealer’s financial condition, could cause a material adverse effect on the Group’s results of operations and financial position. In 2003, 2004 and 2005, one major customer generated 40%, 38% and 36% of the Group’s revenues, respectively.
Certain components and subassemblies included in the Group’s products are obtained from a single source or a limited group of suppliers and subcontractors. If such supplier fails to deliver the necessary components or subassemblies, the Company may be required to seek alternative sources of supply. A change in supplier could result in manufacturing delays, which could cause a possible loss of sales and, consequently, could adversely affect the Company’s results of operations and financial position.
MTS’s shares are listed for trade on the Nasdaq Capital Market.
c. On December 30, 2004, the Company and Teleknowledge Group Ltd. (“Teleknowledge”) consummated an Assets Purchase Agreement (“the Agreement”). TeleKnowledge is a leading provider of carrier-class billing and rating solutions. The integration of Teleknowledge’s billing solution enables MTS to offer an end-to-end customer care and billing solution. Under the terms of the Agreement, the Company acquired certain assets and liabilities of Teleknowledge for the following consideration:
1. An initial consideration of $ 2,374 in cash.
2. Additional contingent consideration of up to an amount of $ 3,650, based on post acquisition revenue performance
(calculated as 10% of renewal maintenance fees and 20% of all other revenues from sales which included Teleknowledge
products), over a period of three years. Such payments will be recorded as additional goodwill, during the contingency
period, when actual revenue performance will be evaluated (see Note 10a). In 2005, an additional consideration of $285K
was recorded, in accordance with the agreement.
3. In addition, the Company incurred transaction costs totaling $ 71.
Prior to the acquisition, MTS and Teleknowledge had an OEM relationship. The commercial arrangements and transactions were settled before the date of the acquisition.
The acquisition was accounted for under the purchase method of accounting in accordance with SFAS 141, “Business Combination” (“SFAS 141”). Accordingly, the purchase price has been allocated to the assets acquired and the liabilities assumed based on the estimated fair value at the date of acquisition. The excess of the purchase price over the estimated fair value of the net assets acquired has been recorded as goodwill.
Based upon a valuation of the tangible and intangible assets acquired and the liabilities assumed, the Company has allocated the total cost of the acquisition to Teleknowledge’s net assets at the date of acquisition, as follows:
24 MTS annual report 2005

Notes to consolidated financial statements
U.S. Dollars in thousands (except share data)
Trade receivables $ 100
Property and equipment 40
Intangible assets:
Developed technology (four-year useful life) 690
Customer relationship (six-year useful life) 300
Goodwill 1,676
Total assets acquired 2,806
Liabilities assumed – Deferred revenues (76)
Net assets acquired $ 2,730
The valuation of the Company’s developed technology was based on the income approach, which reflects the future economic benefits from Teleknowledge products. The value assigned to customer relationship was based on the cost approach. Under this approach, the customer relationship was valued by calculating the savings realized by the Company through obtaining a pre-existing customer relationship of Teleknowledge.
Pro forma results:
The following unaudited proforma information does not purport to represent what the Company’s results of operations would have been had the acquisitions occurred on January 1, 2003 and 2004, nor does it purport to represent the results of operations of the Company for any future period.
Year ended December 31, 2003 2004
Revenues $ 10,128 $ 10,542
Net loss from continuing operations $ (10,247) $ *) (4,931)
Basic and diluted net loss per share for continuing operations $ (2.22) $ (1.06)
Weighted average number of Ordinary shares in computation of basic and diluted net
loss per share 4,617,099 4,634,413
*) Net of capital gain from sale of Teleknowledge to MTS.
note 2: significant accounting policiesThe consolidated financial statements have been prepared in accordance with accounting principles generally accepted in the United States (“U.S. GAAP”).
a. Use of estimates:The preparation of financial statements in conformity with generally accepted accounting principles requires management to make estimates and assumptions that affect the amounts reported in the financial statements and accompanying notes. Actual results could differ from those estimates.
b. Financial statements in U.S. dollars:The majority of the revenues of the Company and certain of its subsidiaries are generated in or linked to the U.S. dollar (“dollar”). In addition, a substantial portion of the Company’s and certain of its subsidiaries’ costs is incurred in dollars. Company’s management believes that the dollar is the currency of the primary economic environment in which the Company
MTS annual report 2005 25

creating opportunities through innovation
U.S. Dollars in thousands (except share data)
Notes to consolidated financial statements
and certain of its subsidiaries operate. Thus, the functional and reporting currency of the Company and certain of its subsidiaries is the dollar.
Accordingly, monetary accounts maintained in currencies other than the dollar are remeasured into dollars in accordance with SFAS No. 52, “Foreign Currency Translation”. All transaction gains and losses of the remeasurement of monetary balance sheet items are reflected in the consolidated statements of operations as financial income or expenses, as appropriate. Foreign currency translation differences for the years ended December 31, 2003, 2004 and 2005, were $ (11), $ 19 and $ (11) respectively, and recorded financial income (expenses).
For those foreign subsidiaries and affiliates, whose functional currency has been determined to be their local currency, assets and liabilities are translated at the year end exchange rates and statements of operations items are translated at the average exchange rate prevailing during the period. The resulting translation adjustments are recorded as a separate component of accumulated other comprehensive income (loss) in shareholders’ equity.
c. Principles of consolidation:The consolidated financial statements include the accounts of MTS and its wholly-owned subsidiaries. Intercompany transactions and balances, including profits from intercompany sales not yet realized outside the Group, have been eliminated upon consolidation.
d. Cash equivalents:The Company considers all short-term highly liquid investments that are readily convertible to cash with original maturities of three months or less to be cash equivalents.
e. Marketable securities:The Company accounts for investments in debt and equity securities (other than those accounted for under the equity method of accounting) in accordance with Statement of Financial Accounting Standard No. 115, “Accounting for Certain Investments in Debt and Equity Securities” (“SFAS No. 115”).
Management determines the classification of investments in marketable debt and equity securities at the time of purchase and reevaluates such designations as of each balance sheet date.
As of December 31, 2005 and 2004, all marketable securities were designated as available-for-sale. Accordingly, these securities are stated at fair value, with unrealized gains and losses reported in accumulated other comprehensive income (loss), a separate component of shareholders’ equity, net of taxes. Realized gains and losses on sales of investments, as determined on a specific identification basis, are included in the consolidated statement of operations.
f. Inventories:Inventories are stated at the lower of cost or market value. Inventory write-offs are provided to cover risks arising from slow moving items, technological obsolescence, excess inventories and for market prices lower than cost. Cost is determined as follows: raw materials — using the “first in, first out” method. Finished products are recorded on the basis of direct manufacturing costs with the addition of allocable indirect manufacturing costs.
g. Investments in an affiliate:In these financial statements, the affiliated company is Jusan S.A., a company held at a rate of 50% (which is not a subsidiary), where the Company can exercise significant influence over the operating and financial policy of the affiliate.
The investment in the affiliate is accounted for by the equity method, in accordance with Accounting Principle Board Opinion No.18, “The Equity Method of Accounting for Investments in Common Stock”, (“APB No.18”). Profits on intercompany sales, not realized through sales to third parties, were eliminated. The excess of the purchase price over the fair value of net tangible assets acquired has been attributed to goodwill.
Goodwill is reviewed annually (or more frequently if circumstances indicate impairment has occurred) for impairment in accordance with the provisions of Statement of Financial Accounting Standard No. 142, “Goodwill and Other Intangible Assets” (“SFAS No. 142”).
26 MTS annual report 2005

Notes to consolidated financial statements
U.S. Dollars in thousands (except share data)
Under APB 18, an impairment of value of an investment accounted for under the equity method, which is other than a temporary decline, should be recognized as a realized loss, establishing a new carrying value for the investment. Factors the Company considers in making this evaluation include: the length of time and the extent to which the market value has been lower than cost, the financial condition and near-term prospects of the issuer, including cash flows of the investee and any specific events which may influence the operations of the issuer and the intent and ability of the Company to retain its investments for a period of time sufficient to allow for any anticipated recovery in market value. A current fair value of an investment that is less than its carrying amount may indicate an impairment of value of the investment. No impairment losses were recorded during 2005.
h. Investment in other companies:The investment in these companies is stated at cost, since the Group does not have the ability to exercise significant influence over operating and financial policies of those investments. The Company’s investments in other companies are reviewed for impairment whenever events or changes in circumstances indicate that the carrying amount of an investment may not be recoverable, in accordance with APB No.18. As of December 31, 2005, based on management’s most recent analyses, impairment losses in the amount of $ 27 have been identified and recorded.
i. Property and equipment:Property and equipment are stated at cost, net of accumulated depreciation. Depreciation is calculated using the straight-line method, over the estimated useful lives of the assets, at the following annual depreciation rates:
%
Computers and peripheral equipment 33
Office furniture and equipment 6–20
Motor vehicles 15
Leasehold improvements Shorter of useful life or lease term
j. Impairment of long-lived assets:The Company’s long-lived assets and certain identifiable intangibles are reviewed for impairment in accordance with Statement of Financial Accounting Standard No. 144, “Accounting for the Impairment or Disposal of Long-Lived Assets” (“SFAS No. 144”), whenever events or changes in circumstances indicate that the carrying amount of an asset may not be recoverable. Recoverability of assets to be held and used is measured by a comparison of the carrying amount of an asset to the future undiscounted cash flows expected to be generated by the assets. If such assets are considered to be impaired, the impairment to be recognized is measured by the amount by which the carrying amount of the assets exceeds the fair value of the assets. As of December 31, 2005, no impairment losses have been identified.
k. Goodwill: Goodwill represents excess of costs over the fair value of net assets of business acquired. Under SFAS 142, goodwill acquired in a business combination on or after July 1, 2001 is not amortized. FAS No. 142 requires goodwill to be tested for impairment on adoption and at least annually thereafter or between annual tests in certain circumstances, and written down when impaired, rather than being amortized as previous accounting standards required. Goodwill attributable to each of the reporting units is tested for impairment by comparing the fair value of each reporting unit with its carrying value. Fair value is determined using discounted cash flows, market multiples and market capitalization. Significant estimates used in the methodologies include estimates of future cash flows, future short-term and long-term growth rates, weighted average cost of capital and estimates of market multiples for each of the reportable units. As of December 31, 2005 no impairment losses have been identified (see also Note 10a).
l. Intangible assets:Intangible assets are amortized over their useful lives using a method of amortization that reflects the pattern in which the economic benefits of the intangible assets are consumed or otherwise used up, in accordance with SFAS 142. Developed
MTS annual report 2005 27

creating opportunities through innovation
Notes to consolidated financial statements
U.S. Dollars in thousands (except share data)
technology is amortized over a weighted average of four years and customer relationship is amortized over a period of six years. As for capitalized software costs, see n below.
m. Revenue recognition:The Company generates revenues mainly from licensing the rights to use its software products. In 2005, pursuant to the acquisition of Teleknowledge, the Company began generating revenues also from billing software license that require significant customization. The Company also generates revenues from rendering maintenance, service bureau, support and training. The Company sells its products directly to end-users and indirectly through resellers and OEM’s (who are considered end users).
Revenues from software license agreements are recognized when all criteria outlined in Statement of Position No. 97—2, “Software Revenue Recognition” (“SOP No. 97–2”) as amended are met. Revenue from license fees is recognized when persuasive evidence of an agreement exists, delivery of the product has occurred, no significant obligations with regard to implementation remain, the fee is fixed or determinable and collectibility is probable. The Company does not grant a right of return to its customers.
Where software arrangements involve multiple elements, revenue is allocated to each undelivered element based on vendor specific objective evidence (“VSOE”) of the fair values of each undelivered element in the arrangement, in accordance with the “residual method” prescribed by SOP No. 98–9, “Modification of SOP No. 97–2, Software Revenue Recognition With Respect to Certain Transactions”. The VSOE used by the Company to allocate the sales price to support services and maintenance is based on the renewal rate charged when these elements are sold separately. License revenues are recorded based on the residual method. Under the residual method, revenue is recognized for the delivered elements when (1) there is VSOE of the fair values of all the undelivered elements, and (2) all revenue recognition criteria of SOP No. 97–2, as amended, are satisfied. Under the residual method any discount in the arrangement is allocated to the delivered element.
Revenues from billing products which involve significant customization of the Company’s software to customer specific specifications are recognized in accordance with Statement of Position 81–1, “Accounting for Performance of Construction-Type and Certain Production-Type Contracts”, using contract accounting on a percentage of completion method, over the period from signing of the license through to customer acceptance in accordance with the “Input Method”. The amount of revenue recognized is based on the total arrangement and the percentage to completion achieved. The percentage to completion is measured by monitoring progress using records of actual costs incurred to date in the project compared with the total estimated project requirement. Estimates of total project requirements are based on prior experience of customization, delivery and acceptance of the same or similar technology and are reviewed and updated regularly by management.
After delivery, if uncertainty exists about customer acceptance of the software, license revenue is not recognized until acceptance. In the years ended December 31, 2003, 2004 and 2005, the Company recognized revenues in accordance with SOP 81–1 in the amount of $0, $0 and $ 1,118, respectively, included as part of product sales in the Company’s statement of operations. Provisions for estimated losses on uncompleted contracts are made in the period in which such losses are first determined, in the amount of the estimated loss on the entire contract. As of December 31, 2005, no such estimated losses were identified.
Estimated gross profit or loss from long-term contracts may change due to changes in estimates resulting from differences between actual performance and original forecasts. Such changes in estimated gross profit are recorded in results of operations when they are reasonably determinable by management, on a cumulative catch-up basis.
The Company believes that the use of the percentage of completion method is appropriate as the Company has the ability to make reasonably dependable estimates of the extent of progress towards completion, contract revenues and contract costs. In addition, contracts executed include provisions that clearly specify the enforceable rights regarding services to be provided and received by the parties to the contracts, the consideration to be exchanged and the manner and terms of settlement. In all cases the Company expects to perform its contractual obligations and its licensees are expected to satisfy their obligations under the contract.
Where arrangements recognized according to SOP 81–1 involve maintenance and support services, revenues are recognized according to Emerging Issues Task Force (“EITF”), Issue No. 00–21 “Revenue Arrangement with Multiple Deliverables” (“EITF 00–21”).
28 MTS annual report 2005
Notes to consolidated financial statements
U.S. Dollars in thousands (except share data)
According to EITF 00—21 a multiple-element arrangement (an arrangement that involves the delivery or performance of multiple products, services and/or rights to use assets) is separated into more than one unit of accounting, if the functionality of the delivered element is not dependent on the undelivered element, there is vendor-specific objective evidence (VSOE) of fair value of the undelivered element and delivery of the delivered element(s) represents the culmination of the earnings process for this element. The Company has established VSOE for maintenance and support services based on the renewal rate charged when these elements are sold separately and therefore, the arrangement consideration is allocated to maintenance and support services based on their relative VSOE.
SOP 97–2 specifies that extended payment terms in a licensing arrangement may indicate that the license fees are not deemed to be fixed or determinable. If the fee is not fixed or determinable, or if collection is not considered probable, revenue is recognized as payments become due from the customer, provided that all other revenue recognition criteria have been met. SOP 97–2 specifies that if a company has a standard business practice of using extended payment terms in licensing arrangements and has a history of successfully collecting the license fees under the original terms of the licensing arrangement without making concessions, the company should recognize the license fees when all other SOP 92–7 revenue recognition criteria are met. The Company has concluded that for certain arrangements with extended payment terms, the “fixed or determinable” presumption has been overcome and license fees have been recognized upon meeting the remaining SOP 97–2 revenue recognition criteria.
Revenues from maintenance and support services are recognized over the term of the maintenance and support agreement on a straight line basis.
Deferred revenues include unearned amounts received under maintenance and support contracts, not yet recognized as revenues.
n. Research and development costs:Statement of Financial Accounting Standards No. 86, “Accounting for the Costs of Computer Software to be Sold, Leased or Otherwise Marketed” (“SFAS No. 86”), requires capitalization of certain software development costs subsequent to the establishment of technological feasibility. Based on the Company’s and its subsidiaries’ product development process, technological feasibility is established upon completion of a working model.
Research and development costs incurred in the process of developing product improvements or new products, are generally charged to expenses as incurred, net of grants received from the Office of the Chief Scientist of Israel’s Ministry of Industry, Trade and Labor (see Note 12b).
Significant costs incurred by the Company and its subsidiaries between completion of the working model and the point at which the product is ready for general release, have been capitalized.
Capitalized software costs are amortized by the greater of the amount computed using the: 1) ratio that current gross revenues from sales of the software to the total of current and anticipated future gross revenues from sales of that software, or 2) the straight-line method over the estimated useful life of the product (three years). The Company assesses the recoverability of this intangible asset on a regular basis by determining whether the amortization of the asset over its remaining life can be recovered through undiscounted future operating cash flows from the specific software product sold. Based on its most recent analyses, management believes that no impairment of capitalized software development costs exists as of December 31, 2005.
o. Government grants:Royalty-bearing grants from the Government of Israel for funding certain approved research and development projects are recognized at the time the Company is entitled to such grants, on the basis of the related costs incurred and recorded as a deduction of research and development costs. Research and development grants amounted $ 0, $ 0 and $ 130 in 2003, 2004 and 2005, respectively. Total royalties accrued or paid amounted to $ 146, $ 181 and $ 198 in 2003, 2004 and 2005, respectively and were recorded as part of the cost of goods sold.
p. Income taxes:The Company accounts for income taxes, in accordance with Statement of Financial Accounting Standard No. 109, “Accounting for Income Taxes” (“SFAS No. 109”). This statement prescribes the use of the liability method whereby deferred tax assets
MTS annual report 2005 29

creating opportunities through innovation
Notes to consolidated financial statements
U.S. Dollars in thousands (except share data)
and liability account balances are determined based on differences between financial reporting and tax bases of assets and liabilities and are measured using the enacted tax rates and laws that will be in effect when the differences are expected to reverse. Valuation allowances are provided to reduce deferred tax assets to their estimated realizable value.
q. Accounting for stock-based compensation:The Company has elected to follow Accounting Principles Board Opinion No. 25, “Accounting for Stock Issued to Employees” (“APB No. 25”) and FASB Interpretation No. 44, “Accounting for Certain Transactions Involving Stock Compensation” (“FIN No. 44”) in accounting for its employee stock option plans. Under APB No. 25, when the exercise price of the Company’s stock options is less than the market price of the underlying shares on the date of grant, compensation expense is recognized.
The Company adopted the disclosure provisions of Financial Accounting Standards Board Statement No. 148, “Accounting for Stock-Based Compensation — Transition and Disclosure” (“SFAS No. 148”), which amended certain provisions of SFAS 123 to provide alternative methods of transition for an entity that voluntarily changes to the fair value based method of accounting for stock-based employee compensation, effective as of the beginning 2003. The Company continues to apply the provisions of APB No. 25, in accounting for stock-based compensation.
Pro forma information regarding the Company’s net income (loss) and net earnings (loss) per share is required by SFAS No. 123 and has been determined as if the Company had accounted for its employee stock options under the fair value method prescribed by SFAS No. 123. SFAS No. 123 requires use of an option valuation model to measure the fair value of the options at the measurement date.
The fair value for options granted in 2003, 2004 and 2005 is amortized over their vesting period and estimated at the date of grant using a Black-Scholes options pricing model with the following weighted average assumptions:
Year ended December 31, 2003 2004 2005
Dividend 0% 0% 0%
Average risk-free interest rates 2% 2% 3.9%
Average expected life (in years) 2.5 2.2 4.0
Volatility 71.8% 71.8% 56.9%
Pro forma information under SFAS No. 123, is as follows:
Year ended December 31, 2003 2004 2005
Net income (loss) available to Ordinary shares, as reported $ 87 $ (4,127) $ (4,216)
Add: Stock-based employee compensation — intrinsic value 213 66 66
Deduct: Stock-based compensation expense determined under fair value
method for all awards, net of related tax effect(346) (274) (264)
Pro forma net loss $ (46) $ (4,335) $ (4,414)
Basic and diluted net earnings (loss) per share, as reported $ 0.02 $ (0.89) $ (0.83)
Basic and diluted net loss per share, pro forma $ — $ (0.94) $ (0.87)
The Company applies Statement of Financial Accounting Standard No. 123, “Accounting for Stock-Based Compensation” (“SFAS No. 123”) and Emerging Issues Task Force No. 96–18 (“EITF No. 96–18”), “Accounting for Equity Instruments That are Issued to Other Than Employees for Acquiring, or in Conjunction with Selling, Goods or Services” with respect to options issued to non-employees.
30 MTS annual report 2005
Notes to consolidated financial statements
U.S. Dollars in thousands (except share data)
r. Warranty costs:The Company provides free warranty for up to 15 months for the “OEM” distributors. A provision is recorded for probable costs in connection with these services based on the Company’s experience.
The Company estimates the costs that may be incurred under its basic limited warranty and records a liability in the amount of such costs at the time product revenue is recognized. Factors that affect the Company’s warranty liability include the number of sold units, historical and anticipated rates of warranty claims, and cost per claim. The Company periodically assesses the adequacy of its recorded warranty liabilities and adjusts the amounts as necessary.
No changes to the provision have been recorded during 2005.
s. Fair value of financial instruments:The following methods and assumptions were used by the Group in estimating its fair value disclosures for financial instruments:
The carrying amounts of cash and cash equivalents, trade receivables, other accounts receivable, short-term bank credit and trade payables approximate their fair value, due to the short-term maturity of such instruments.
The fair value for marketable securities is based on quoted market prices (see Note 3).
t. Severance pay:The Company’s liability for severance pay is calculated pursuant to Israel’s Severance Pay Law based on the most recent salary of the employees multiplied by the number of years of employment, as of the balance sheet date. Employees are entitled to one month’s salary for each year of employment or a portion thereof. The Company’s liability for all of its employees is fully provided by monthly deposits with insurance policies and by an accrual. The value of these policies is recorded as an asset in the Company’s balance sheet.
The deposited funds may be withdrawn only upon the fulfillment of the obligation pursuant to Israel’s Severance Pay Law or labor agreements. The value of the deposited funds is based on the cash surrendered value of these policies, and includes immaterial profits.
Severance expense for the years ended December 31, 2003, 2004 and 2005 amounted to approximately $ 121, $ 344 and $ 585, respectively.
u. Concentrations of credit risk:Financial instruments that potentially subject the Company to concentrations of credit risk consist principally of cash and cash equivalents, trade receivables, marketable securities and long-term loans.
Cash and cash equivalents are deposited with major banks in Israel and major banks in United States. Such deposits in the U.S. may be in excess of insured limit and are not insured in other jurisdictions. Management believes that the financial institutions that hold the Company’s investments are financially sound, and accordingly, minimal credit risk exists with respect to these investments.
The trade receivables of the Company are mainly derived from sales to customers in the U.S. and Europe (see Note 16). The Company performs ongoing credit evaluations of its customers. In certain circumstances, the Company may require letters of credit, other collateral or additional guarantees. The allowance for doubtful accounts is determined with respect to specific debts that are doubtful of collection according to management estimates.
The Company’s marketable securities include investments in equity securities and Israeli government securities. Management believes that the portfolio is well diversified, and accordingly, minimal credit risk exists with respect to these marketable securities.
The Company’s long-term loans include a loan granted to the purchaser of Silverbyte Ltd. shares. The Company has received check in regard of all outstanding amounts and accordingly management believes that minimal credit risk exists with respect to this loan.
MTS annual report 2005 31

creating opportunities through innovation
Notes to consolidated financial statements
U.S. Dollars in thousands (except share data)
The Company has no off-balance-sheet concentration of credit risk such as foreign exchange contracts, option contracts or other foreign hedging arrangements.
v. Basic and diluted net earnings (loss) per share:Basic net earnings (loss) per share is computed based on the weighted average number of Ordinary shares outstanding during each year. Diluted net earnings (loss) per share is computed based on the weighted average number of Ordinary shares outstanding during each year, plus potential Ordinary shares considered outstanding during the year, in accordance with Statement of Financial Accounting Standard No. 128, “Earnings Per Share” (“SFAS No. 128”).
The total number of shares related to the outstanding options excluded from the calculation of diluted net earnings (loss) per share was 766,141, 667,101 and 1,011,584 for the years ended December 31, 2003, 2004 and 2005, respectively.
w. Reclassification:Certain amounts from prior years have been reclassified to conform to current period presentation.
u. Impact of recently issued accounting standards:In May 2005, the FASB issued Statement of Financial Accounting Standard No. 154 (“SFAS No. 154”), “Accounting Changes and Error Corrections”, a replacement of APB No. 20, “Accounting Changes” and SFAS No. 3, “Reporting Accounting Changes in Interim Financial Statements”. SFAS No. 154 provides guidance on the accounting for and reporting of accounting changes and error corrections. APB No. 20 previously required that most voluntary changes in accounting principles be recognized by including in net income for the period of change the cumulative effect of changing to the new accounting principle. SFAS No. 154 requires retroactive application to prior periods’ financial statements of a voluntary change in accounting principles unless it is impracticable. SFAS No. 154 is effective for accounting changes and corrections of errors made in fiscal years beginning after December 15, 2005.
On December 16, 2004, the Financial Accounting Standards Board (FASB) issued FASB Statement No. 123 (revised 2004), “Share-Based Payment”, which is a revision of FASB Statement No. 123, “Accounting for Stock-Based Compensation”. Statement 123(R) supersedes APB Opinion No. 25, Accounting for Stock Issued to Employees, and amends FASB Statement No. 95, “Statement of Cash Flows”. Generally, the approach in Statement 123(R) is similar to the approach described in Statement 123.
However, Statement 123(R) requires all share-based payments to employees, including grants of employee stock options, to be recognized in the income statement based on their fair values. Pro forma disclosure is no longer an alternative. Statement 123(R) permits public companies to adopt its requirements using one of two methods: A “modified prospective” method in which compensation cost is recognized beginning with the effective date (a) based on the requirements of Statement 123(R) for all share-based payments granted after the effective date and (b) based on the requirements of Statement 123 for all awards granted to employees prior to the effective date of Statement 123(R) that remain unvested on the effective date.
A “modified retrospective” method which includes the requirements of the modified prospective method described above, but also permits entities to restate based on the amounts previously recognized under Statement 123 for purposes of pro forma disclosures either (a) all prior periods presented or (b) prior interim periods of the year of adoption.
The Company expects to adopt Statement 123(R), effective January 1, 2006 using the modified-prospective method.
As permitted by Statement 123, the Company currently accounts for share-based payments to employees using Opinion 25’s intrinsic value method and, as such, generally recognizes no compensation cost for employee stock options. In addition, non-compensatory plans under APB 25 will be considered compensatory for Statement 123(R) purposes. Accordingly, the adoption of Statement 123(R)’s fair value method will have an impact on the Company’s result of operations, although it will have no material impact on the Company overall financial position. Had the Company adopted Statement 123(R) in prior periods, the impact of that standard would have approximated the impact of Statement 123 as described in the disclosure of pro forma net loss and loss per share in q above.
In March 2005, the SEC released SEC Staff Accounting Bulletin No. 107, “Share Based Payment” (“SAB 107”). SAB 107 provides the SEC’s staff position regarding the application of FAS 123(R) and contains interpretive guidance relating to the interaction between FAS 123(R) and certain SEC rules and regulations, and also provides the SEC staff’s view regarding the valuation
32 MTS annual report 2005

Notes to consolidated financial statements
U.S. Dollars in thousands (except share data)
of share-based payment arrangements for public companies. SAB 107 highlights the importance of disclosures made relating to the accounting for share-based payment transactions. The Company is currently reviewing the effect of SAB 107; however it does not believe that SAB 107 will have a material effect on its financial position, results of operations or cash flows.
In November 2005, the FASB released FASB Staff Position Nos. FAS 115–1 and FAS 124–1, “The Meaning of Other-Than-Temporary Impairment and Its Application to Certain Investments” (“FSP 115–1”), which effectively replaces EITF Issue No. 03–1. FSP 115–1 contains a three-step model for evaluating impairments and carries forward the disclosure requirements in EITF Issue No. 03–1 pertaining to securities in an unrealized loss position. Under the model, any security in an unrealized loss position is considered impaired; an evaluation is made to determine whether the impairment is other-than-temporary; and, if an impairment is considered other-than-temporary, a realized loss is recognized to write the security’s cost or amortized cost basis down to fair value.
FSP 115–1 references existing other-than-temporary impairment guidance for determining when an impairment is other-than-temporary and clarifies that subsequent to the recognition of an other-than-temporary impairment loss for debt securities, an investor shall account for the security using the constant effective yield method. FSP 115–1 is effective for reporting periods beginning after December 15, 2005, with earlier application permitted. The Company adopted FSP 115–1 upon issuance. The Company does not expect that the adoption will have a material effect on the Company’s consolidated financial condition or results of operations.
note 3: marketable securitiesThe following is a summary of the Company’s investment in marketable securities:
December 31, 2004 December 31, 2005
Amortized cost
Gross unrealized
gains
Gross unrealized
lossesFair market
valueAmortized
cost
Gross unrealized
gains
Gross unrealized
lossesFair market
value
Available-for-sale:Mutual funds $ 506 $ 60 $ — $ 566 $ — $ — $ — $ —
Equity securities 25 8 — 33 35 12 (5) 42
Corporate bonds 368 8 — 376 — — — —
Israeli Government debts 72 10 — 82 87 4 (1) 90
$ 971 $ 86 $ — $ 1,057 $ 122 $ 16 $ (6) $ 132
The gross realized gains on sales of available-for-sale securities totaled $6, $ 0 and $ 77 in 2003, 2004 and 2005, respectively, recorded in financial income. The net adjustment to unrealized holding gains (losses) on available-for-sale securities included as a separate component of shareholders’ equity, “Accumulated other comprehensive gains (losses)” amounted to $ 109, $ 83 and $ (76) in 2003, 2004 and 2005, respectively.
The amortized cost and fair value of debt and marketable equity securities as of December 31, 2005, by contractual maturity, are shown below.
December 31, 2005 Amortized cost Fair market value
Matures in one year $ 40 $ 40
Matures after one year through five years 47 50
Equity securities – No definite maturity date 35 42
Total $ 122 $ 132
MTS annual report 2005 33

creating opportunities through innovation
Notes to consolidated financial statements
U.S. Dollars in thousands (except share data)
note 4: other accounts receivable and prepaid expenses
December 31, 2004 2005
Grants receivable from the Office of the Chief Scientist $ — $ 130
Government authorities 117 75
Prepaid expenses 149 142
Deferred income taxes (1) 66 14
Others 59 130
$ 391 $ 491
(1) See Note 13f.
note 5: inventories
December 31, 2004 2005
Raw materials $ 76 $ 58
Finished products 102 123
$ 178 $ 181
The Company periodically assesses its inventory valuation in accordance with its revenues forecasts, technological obsolescence, and the market conditions. Marked down inventory that is expected to be sold at a price lower than the carrying value is not material.
note 6: investments in affiliate
a. Composed as follows:
December 31, 2004 2005
Investment in Jusan S.A. (50% owned)
Equity, net (1) $ 2,084 $ 1,580
Goodwill 35 35
$ 2,119 $ 1,615
(1) Investment as of purchase date $ 1,171 $ 1,171
Foreign currency translation adjustments 316 —
Retained earnings (Net of dividends) 597 409
$ 2,084 $ 1,580
Dividend received from Jusan S.A. during the year $ 136 $ 195
34 MTS annual report 2005

Notes to consolidated financial statements
U.S. Dollars in thousands (except share data)
b. Summarized financial information of Jusan S.A. (50% owned):
December 31, 2004 2005
Current assets $ 5,552 $ 4,177
Non-current assets $ 68 $ 45
Current liabilities $ (1,438) $ (1,057)
Year ended December 31, 2003 2004 2005
Revenues $ 6,049 $ 6,892 $ 5,682
Gross profit $ 3,079 $ 3,158 $ 2,530
Net income $ 594 $ 444 $ 4
note 7: long-term loan, net of current maturitiesThe Company’s long term loans include a loan granted to the purchaser of Silverbyte Ltd. shares which were sold by the Company in July, 2000. The loan will be fully repaid in April 2007.
a. Composed as follows:
December 31, 2004 2005
Loan to others in NIS — unlinked (1) $ 84 $ 21
Less — current maturities (2) 39 18
$ 45 $ 3
(1) The weighted average interest rate for the years ended December 31, 2005 and 2004 is 7.65%.
(2) Included in other accounts receivable.
b. As of December 31, 2005, the aggregate annual maturities of long-term loans are as follows:
2006 (current maturities) $ 18
2007 3
$ 21
MTS annual report 2005 35

creating opportunities through innovation
Notes to consolidated financial statements
U.S. Dollars in thousands (except share data)
note 8: other investments
December 31, 2004 2005
Long-term leasing deposits (1) $ 26 $ 27
Investment in other companies 347 320
$ 373 $ 347
(1) Linked to the Israeli CPI.
note 9: property and equipment
December 31, 2004 2005
Cost:Computers and peripheral equipment $ 2,838 $ 3,022
Office furniture and equipment 558 566
Motor vehicles 62 48
Leasehold improvements 112 140
3,570 3,776
Accumulated depreciation: 2,989 3,205
Depreciated cost $ 581 $ 571
The depreciation expense for the years ended December 31, 2003, 2004 and 2005 amounted to $ 247, $ 211 and $ 254, respectively.
note 10: goodwill and other intangible assets
a. Goodwill:The changes in the carrying amount of goodwill for the year ended December 31, 2005 are as follows:
Balance as of January 1, 2004 $ 2,024
Goodwill acquired during 2004 (see Note 1) 1,391
Balance as of December 31, 2004 3,415Additional consideration in conjunction with TK acquisition based on post-contract billing revenues,
see Note 1(c) 285
Balance as of December 31, 2005 $ 3,700
36 MTS annual report 2005

Notes to consolidated financial statements
U.S. Dollars in thousands (except share data)
b. Other intangibles consist of the following:
December 31, 2004 2005
Cost:Development technology $ 1,440 $ 1,440
Capitalized software development costs 386 386
Customer relationship 300 300
Accumulated amartization 2,126 2,126
Development technology 700 923
Capitalized software development costs 32 160
Customer relationship — 50
732 1,133
Amortized cost $ 1,394 $ 993
Intangible assets resulted from acquisitions of IntegraTrak, the Company’s U.S. subsidiary and TeleKnowledge (see Note 1c).
c. Amortization expenses amounted to $ 154, $ 188 and $ 401 for each of the years ended December 31, 2003, 2004 and 2005, respectively.
d. Estimated amortization expenses for:
Year ended December 31,
2006 $ 352
2007 319
2008 222
2009 50
2010 50
$ 993
note 11: accrued expenses and other liabilities
December 31, 2004 2005
Employees and payroll accruals $ 799 $ 991
Income tax payable 330 291
Accrued expenses 647 760
Customer advances 204 187
Related parties 62 77
$ 2,042 $ 2,306
MTS annual report 2005 37

creating opportunities through innovation
Notes to consolidated financial statements
U.S. Dollars in thousands (except share data)
note 12: commitments and contingent liabilities
a. Lease commitments:The facilities of the Company and its subsidiaries are rented under operating leases for periods ending September 2006 through February 2008.
Future minimum lease commitments under non-cancelable operating leases as of December 31, 2005 are as follows:
2006 $ 384
2007 17
2008 1
$ 402
Lease expenses for the years ended December 31, 2003, 2004 and 2005 were approximately $ 372, $ 334 and $ 489, respectively.
b. Royalty commitments:1. The Company is committed to pay royalties to the Office of the Chief Scientist of the Ministry of Trade (“OCS”) of the Government of Israel on proceeds from sales of products resulting from the research and development projects in which the Government participated. In the event that development of a specific product in which the OCS participated is successful, the Company will be obligated to repay the grants through royalty payments at the rate of 3% to 5% based on the sales of the Company, up to 100%–150% of the grants received linked to the dollar. As of December 31, 2005, the Company has a contingent liability to pay royalties in the amount of $ 9,094. The obligation to pay these royalties is contingent upon actual sales of the products and, in the absence of such sales, no payment is required.
The Company has paid or accrued royalties in its cost of revenues relating to the repayment of such grants in the amount of $ 146, $ 181 and $ 198 for the years ended December 31, 2003, 2004 and 2005, respectively.
2. The Israeli Government, through the Fund for Encouragement of Marketing Activities, awarded the Company grants for participation in foreign marketing expenses. The Company is committed to pay royalties at the rate of 3% of the increase in export sales, up to the amount of the grants received linked to the U.S. dollar. As of December 31, 2005, the Company has a contingent obligation to pay royalties in the amount of $ 259.
Prior to the year 2003, the Company accrued royalties in its sales and marketing expenses relating to the repayment of such grants in the amount of $129. No additional accrual was provided during the years ended December 31, 2003, 2004 and 2005, respectively.
c. Claims and demands:1. In April 2000, the Tax Authorities in Israel issued to the Company a demand for a tax payment, for the period of 1997—1999, in the amount of approximately NIS 6,000 thousand ($ 1,303).
The Company has appealed to the Israeli Tel Aviv district court in respect of the abovementioned tax demand. The Company believes that certain defenses can be raised against the demand of the tax authorities. The Company believes that the outcome of this matter will not have a material adverse effect on its financial position or results of operations. The Company has provided a provision for the amount considered probable.
2. On April 18, 2005, Amdocs (Israel) Ltd. and Amdocs Ltd. (“the plaintiffs”) filed a complaint with the Tel-Aviv District Court against the Company, its Chief Executive Officer and others (“the Defendants”) alleging, among other things, that professional and commercial information belonging to the plaintiffs was transferred to the defendants for use in the Company’s activity. The plaintiffs are seeking an injunction prohibiting the defendants from making any use of the information and trade secrets that were allegedly transferred, injunctions requiring the return of such information and estimated damages of NIS 14,775 thousand (approximately $ 3,210).
38 MTS annual report 2005

Notes to consolidated financial statements
U.S. Dollars in thousands (except share data)
On June 27, 2005, the defendants filed a statement of defense, in which the defendants claim that the factual and legal allegations by the plaintiffs are baseless, and the causes of action and relief requested are without merit.
Due to the preliminary stage of the litigation, the Company and its legal advisors cannot currently assess its outcome or a possible adverse effect on the Company’s financial position or results of operations.
There were no further developments in respect to the claim through February 2006.
3. On November 22, 2005, the Company received a letter from one of its customer’s legal counsel alleging, among other things, that the Company materially breached the agreement that was entered into with the customer on March 9, 2005, as subsequently amended on June 6, 2005. The customer is seeking full repayment of the amounts that were paid by him under the agreement, in the amount of $ 100 plus interest and indemnification for damages that he claims to have suffered as a result of our alleged breach. On February 19, 2006, the Company submitted a response letter to the customer in which it denied these allegations and claimed that the customer’s refusal to fulfill his contractual undertakings constitute a breach of the agreement and entitles the Company to remedies under applicable law. The Company cannot currently assess the outcome of this claim or its adverse effect on the Company’s financial position or results of operations.
d. Guarantees:1. The Company provided a bank guarantee through April 2007 in the amount of $ 60 to secure its obligations under one of its leasing agreement.
2. The Company provided a bank guarantee through February 2007 in the amount of $ 55 in favor of one of its customers to secure its obligations under the agreement that was signed by the parties.
note 13: taxes on income
a. Tax benefits under the Law for the Encouragement of Capital Investments, 1959 (“the Law”):
MTS was granted the status of an “Approved Enterprise” under the Law in respect of several capital expenditure programs. Income derived from the “Approved Enterprise” is tax-exempt for a period of two years, commencing with the year the Company earns taxable income, and subject to corporate tax at the rate of 10%–25% (depending on the rate of foreign holdings in the Company), for additional periods of five to eight years.
The period of tax benefits detailed above is subject to a limit of the earlier of 12 years from the commencement of production or 14 years from receiving the approval.
Tax exempt income attribute to the “Approved Enterprise” cannot be distributed to shareholders without subjecting the Company to taxes except upon complete liquidation of the Company. Out of the Company’s retained earnings as of December 31, 2005 approximately $ 2,250 are tax exempt. If such tax exempt income is distributed in a manner other than upon the complete liquidation of the Company, it would be taxed at the reduced corporate tax rate applicable to such profits (between 10%–25%) and an income tax liability of up to approximately $ 562 would be included as of December 31, 2005. The Company’s board of directors has determined that it would not distribute any amounts of its undistributed tax exempt income as dividend. The Company intends to reinvest the amount of its tax exempt income.
On April 1, 2005, an amendment to the Investment Law came into effect (“the Amendment”) and has significantly changed the provisions of the Investment Law. The Amendment limits the scope of enterprises which may be approved by the Investment Center by setting criteria for the approval of a facility as an “Approved Enterprise”, such as provisions generally requiring that at least 25% of the “Approved Enterprise” income will be derived from export. Additionally, the Amendment enacted major changes in the manner in which tax benefits are awarded under the Investment Law so that companies no longer require Investment Center approval in order to qualify for tax benefits.
MTS annual report 2005 39

creating opportunities through innovation
Notes to consolidated financial statements
U.S. Dollars in thousands (except share data)
In addition, the Investment Law provides that terms and benefits included in any certificate of approval already granted will remain subject to the provisions of the law as they were on the date of such approval. Therefore the Company’s existing “Approved Enterprise” will generally not be subject to the provisions of the Amendment.
Should MTS and its Israeli subsidiary derive income from sources other than the “Approved Enterprise” during the relevant period of benefits, such income will be taxable at the regular corporate tax rate of 34%, which will be reduced to 31% in 2006, and will be further reduced to 29% in 2007, 27% in 2008, 26% in 2009 and 25% in 2010.
Since MTS is operating more than one “Approved Enterprise” program and since part of its taxable income is not entitled to tax benefits under the abovementioned law and is taxed at the regular corporate tax rate, its effective tax rate is the result of a weighted combination of the various applicable rate and tax exemptions, and the computation is made for income derived from each program on the basis of formulas specified in the law and in the approvals.
b. Measurement of results for tax purposes under the Income Tax (Inflationary Adjustments) Law, 1985:
Results for tax purposes are measured in terms of earnings in NIS after certain adjustments for increases in the Israeli Consumer Price Index (“CPI”). As explained in Note 2b, the financial statements are presented in dollars. The difference between the annual change in the CPI and in the NIS/dollar exchange rate causes a further difference between taxable income and the income before taxes presented in the financial statements. In accordance with paragraph 9(f) of SFAS 109, MTS and its Israeli subsidiary have not provided for deferred income taxes on the difference between the functional currency and the tax bases of assets and liabilities.
c. Tax benefits under the Law for the Encouragement of Industry (Taxation), 1969:MTS is currently qualified as an “industrial company” under the above law and, as such, is entitled to certain tax benefits, mainly accelerated depreciation of machinery and equipment, as prescribed by regulations published under the Inflationary Adjustments Law, the right to claim public issuance expenses and amortization of intangible property rights as a deduction for tax purposes.
d. Net operating losses carryforwards:As of December 31, 2005, the Company and its subsidiaries in Israel, Asia and U.S. have an estimated total amount of available carryforward tax losses of $ 8,750, $ 506 and $ 366, respectively to offset against future taxable profits.
The operating tax loss carryforwards in Israel and in Hong Kong (Asia) may be offset indefinitely against operating income.
MTS IntegraTrak is subject to U.S. income taxes and has a net operating loss carryforward amounting to approximately $ 366 as of December 31, 2005, which expires in the years 2015 to 2020. Utilization of the U.S. net operating losses may be subject to substantial annual limitation due to the “change in ownership” provisions of the Internal Revenue Code of 1986 and similar state provisions. The annual limitation may result in the expiration of net operating losses before utilization.
e. Tax assessments:Regarding the claim from the tax authorities in Israel, see Note 12c(1). The Company has received final tax assessments until the 1996 tax year.
f. Deferred income taxes:Deferred taxes reflect the net tax effects of temporary differences between the carrying amounts of assets and liabilities for financial reporting purposes and the amounts used for income tax purposes. Significant components of the Company’s deferred tax liabilities and assets are as follows:
40 MTS annual report 2005

Notes to consolidated financial statements
U.S. Dollars in thousands (except share data)
December 31, 2004 2005
Tax loss carryforward of the Company $ 1,291 $ 1,985
Allowances for doubtful accounts and accruals for employee benefits 122 57
In respect of marketable securities 76 47
Capitalized software and other intangible assets-liability (36) (208)
Capitalized software and other intangible assets 129 76
Other 190 208
Net deferred tax asset before valuation allowance 1,772 2,165
Valuation allowance (1,633) (2,036)
Net deferred income taxes $ 139 $ 129
Presented as follows:
Current assets — foreign $ 66 $ 14
Other assets — foreign $ 73 $ 115
MTS and certain of its subsidiaries have provided valuation allowances in respect of deferred tax assets resulting from tax loss carryforward and other temporary differences, since they have a history of losses over the past years. Management currently believes that it is more likely than not that part of the deferred tax regarding the loss carryforward in the Company and other temporary differences will not be realized in the foreseeable future.
g. A reconciliation between the theoretical tax expense, assuming all income is taxed at the statutory tax rate applicable to income of the Company and the actual tax expense as reported in the statements of operations, is as follows:
Year ended December 31, 2003 2004 2005
Loss before taxes as reported in the statements of operations $ (60) $ (4,086) $ (4,208)
Tax rates 36% 35% 34%
Theoretical tax benefit $ (22) $ (1,430) $ (1,431)
Increase in taxes resulting from:
Effect of different tax rates — 2 38
Tax adjustment in respect of inflation in Israel and others (22) 12 (17)
Utilization of carryforward tax losses for which valuation allowance was provided (86) (21) —
Non-deductible expenses and tax exempt income 9 — 10
Taxes and deferred taxes in respect of previous years 175 256 (21)
Deferred taxes for which valuation allowance was provided 144 1,447 1,431
Taxes on income as reported in the statements of operations $ 198 $ 266 $ 10
MTS annual report 2005 41

creating opportunities through innovation
Notes to consolidated financial statements
U.S. Dollars in thousands (except share data)
h. Loss before income taxes is comprised as follows:
Year ended December 31, 2003 2004 2005
Domestic $ (312) $ (3,918) $ (4,042)
Foreign 252 (168) (166)
$ (60) $ (4,086) $ (4,208)
i. Taxes on income are comprised as follows:
Year ended December 31, 2003 2004 2005
Current taxes $ — $ 10 $ —
Deferred taxes 23 33 10
Taxes and deferred taxes in respect of previous years 175 223 —
$ 198 $ 266 $ 10
Domestic $ 322 $ 256 $ —
Foreign (124) 10 10
$ 198 $ 266 $ 10
note 14: related parties transactions and balancesa. On November 8, 1999, the Board of Directors and the audit committee approved, subject to the shareholders’ approval, an increase in the monthly salary of the Chairman of the Board of Directors from $ 5 to $ 7 per month and the grant of options to purchase 98,824 Ordinary shares. The options were granted to him at his request in lieu of salary for the 12 month period ending December 31, 2000. The exercise price of the options is $ 6 per share, expected dividend yield is 0%, and the risk free interest rate is 6%. The options will vest ratably over an eight-month period beginning January 1, 2000 and will terminate five years from the date of grant. The options were forfeited by the end of the year 2004.
b. The wife of the Chairman of the Board of Directors provides ongoing legal services to the Company and receives a monthly retainer of $ 5. The conditions for retaining her services were approved by the Company’s Board of Directors and audit committee.
c. Mr. Isaac Ben-Bassat, a director and one of the Company’s major shareholders, receives an annual fee of approximately $ 8,400 and a per meeting attendance fee of $300 in connection with his service as a director of the Company.
d. MTS’s subsidiaries, MTS Asia Ltd. and MTS IntegraTRAK, entered into an agreement with C. Mer, pursuant to which they distribute and support certain of C. Mer’s (company under common control) products and provide certain services on behalf of C. Mer. Generally, C. Mer compensates MTS Asia Ltd. for these activities at cost plus 10% and compensates MTS IntegraTRAK at cost plus 5%.
e. In 2004 and 2005, the balance with C. Mer reflects short-term debt and other receivables. Due to the short-term nature, no interest was charged by or paid to C. Mer through December 31, 2004 and 2005.
42 MTS annual report 2005

Notes to consolidated financial statements
U.S. Dollars in thousands (except share data)
f. Transactions with related parties were as follows:
Year ended December 31, 2003 2004 2005
Sales through related parties $ 28 $ 15 $ —
Amounts charged by related parties:
Cost of revenues $ 34 $ 32 $ 8
Research and development — — 34
Selling and marketing — — 3
General and administrative 5 7 5
$ 39 $ 39 $ 50
Amounts charged by MTS Integra TRAK and MTS Asia to related parties:
Selling and marketing $ — $ 18 $ —
Payments from (repayments to) the related parties, net $ (48) $ 20 $ (80)
d. Amounts due from an affiliate:
December 31, 2004 2005
Jusan S.A $ (21) $ (18)
note 15: shareholders’ equity
a. Share capital:The Ordinary shares entitle their holders the right to receive notice to participate and vote in general meetings of MTS and the right to receive cash dividends, if declared.
b. Private placement agreement:On August 10, 2005, the Company has entered into definitive agreements with institutional and private investors for a private placement of Ordinary shares and warrants to purchase Ordinary shares that has raised $ 2,625 (net of issuance costs of approximately $ 200).
Pursuant to the agreements, MTS has issued an aggregate 937,500 Ordinary shares at $ 3.00 per share. In addition, the Company provided the investors with warrants to purchase an aggregate 375,000 additional Ordinary shares of MTS at an exercise price of $ 4.00 per share. Each investor received warrants to purchase two Ordinary shares for each five Ordinary shares purchased. The warrants will become exercisable six months after their issuance and will expire within three and a half years after they become exercisable.
According to the agreement the Company could issue to investors unregistered shares upon exercise of their warrants, such issuance is under the Company’s control. In accordance with Emerging Issues Task Force No. 00–19, “Accounting for Derivative Financial Instruments Indexed to, and Potentially Settled in, a Company’s Own Stock”, the warrants were classified as equity.
MTS annual report 2005 43

creating opportunities through innovation
Notes to consolidated financial statements
U.S. Dollars in thousands (except share data)
c. Share Option Plan:MTS has authorized, through its 1996 Incentive Share Option plan, the grant of options to officers, management, employees and directors of MTS or any subsidiary of up to 1,900,000 of MTS’s Ordinary shares. Up to 1,500,000 options shall be granted under the option plan pursuant to section 102 of the Israel Income Tax Ordinance (the “Old Plan”). Any option, which is canceled or forfeited before expiration, will become available for future grants.
Each option granted under the Plan is exercisable until the earlier of five years from the date of the grant of the option or the expiration dates of the option plan. The exercise price of the options granted under the plans may not be less than the nominal value of the shares into which such options were exercised. The options vest primarily gradually over three or four years of employment.
In 2003, Section 102 of the Israeli Income Tax Ordinance was amended effective as of January 1, 2003. Therefore MTS has rolled-over the remaining options available at that time to be granted under a new plan that conforms with the newly amended provisions of Section 102 of the Israel Income Tax Ordinance. The Incentive Share Option Plan will terminate in 2013, unless cancelled earlier by MTS’s board of directors.
As of December 31, 2005, 449,625 options are available for future grant.
Summary of MTS’s stock options activity (except options to non-employees) and related information for the three years ended December 31, 2003, 2004 and 2005, is as follows:
Optionsavailablefor grant
Number of options
outstandingOptions
exercisable
Weightedaverage
exercise price
Balance as of January 1, 2003 1,001,170 757,580 $ 3.32
Options granted (434,500) 434,500 $ 1.85
Options exercised — (133,333) $ —
Options forfeited 260,106 (260,106) $ 2.91
Options exercisable at December 31, 2003 355,413 $ 3.68
Balance as of December 31, 2003 826,776 798,641 $ 2.85
Options granted (226,000) 226,000 $ 2.29
Options exercised — (17,333) $ 0.08
Options forfeited 251,708 (251,708) $ 4.62
Options forfeited from old plan (180,459) — $ —
Options exercisable at December 31, 2004 301,812 $ 2.01
Balance as of December 31, 2004 672,025 755,600 $ 2.11
Options granted (365,000) 365,000 $ 3.56
Options exercised — (158,000) $ 1.97
Options forfeited 222,600 (222,600) $ 2.39
Deduct options granted to non-employees (80,000) — $ 3.33
Options forfeited from Old Plan — (14,500)
Options exercisable at December 31, 2005 255,962 $ 2.16
Balance as of December 31, 2005 449,625 725,500 $ 2.66
44 MTS annual report 2005

Notes to consolidated financial statements
U.S. Dollars in thousands (except share data)
The options outstanding as of December 31, 2005 have been separated into ranges of exercise prices, as follows:
Exercise price
Options outstanding as of
December 31, 2005
Weighted average remaining
contractual life (in years)
Weighted average exercise price Options exercisable
Weighted average exercise price of
exercisable options
$ 0.93–1.3 30,000 0.39 $ 1.18 30,000 $ 1.18
$ 1.844 250,000 1.94 $ 1.844 129,477 $ 1.844
$ 2.2–2.35 113,500 2.73 $ 2.27 36,251 $ 2.28
$ 2.9–2.95 26,000 1.95 $ 2.91 22,791 $ 2.9
$ 3.27–3.4 121,500 3.44 $ 3.34 17,214 $ 3.3
$ 3.49 57,500 3.34 $ 3.49 11,920 $ 3.49
$ 3.87 127,000 3.74 $ 3.87 8,309 $ 3.87
725,500 $ 2.66 255,962 $ 2.16
d. The weighted average fair value of options granted during 2003, 2004 and 2005, whose exercise price equals the fair value of the stock on the date of grant, was $ 1.20, $ 0.781 and $ 1.70 per option, respectively.
During 2003, 2004 and 2005, the Company granted 434,500, 226,000 and 365,000 options respectively at a weighted average exercise price of $ 1.85, $ 2.29 and $ 3.56 per share (the fair market value of the shares on the date of grant), respectively.
The Company has recorded deferred stock compensation expense for options issued in 2003 with an exercise price below the fair market value of the shares; at a weighted average exercise price of $ 1.844 and a weighted average fair value of $ 1.844, the deferred stock compensation expense has been amortized and recorded as compensation expense ratably over the vesting period of the options. Compensation expense of approximately $ 60, $ 66 and $ 66 was recognized during 2003, 2004 and 2005, respectively.
During 2003, the Company reduced the exercise price of 83,000 options to zero resulting in a compensation expense of approximately $ 153.
e. Options and warrants to non-employees:
Issuance date In connection with
Number of options
grantedOptions
exercisedOptions
exercisable
Options forfeited or
expiredExercise price
per shareExercisable
through
January 2000 Advisory Board 98,824 — 98,824 98,824 $ 6.000 December 2004
February 2001 Service provider 25,000 — 25,000 — $ 5.625 February 2006
January 2005 Service provider 70,000 — 70,000 — $ 3.250 January 2008
May 2005 Service provider 10,000 — 10,000 — $ 3.490 May 2010
August 2005 Service provider 37,000 — — — $ 4.000 August 2009
September 2005 Service provider 10,000 — 660 — $ 3.870 September 2010
December 2005 Service provider 100,000 — 6,575 — $ 3.120 December 2006
350,824 — 211,059 98,824
The Company had accounted for its options to non-employees under the fair value method of SFAS No. 123 and EITF 96–18. The fair value for these options was estimated at the measurement date using the Black-Scholes option-pricing model with the
MTS annual report 2005 45

creating opportunities through innovation
Notes to consolidated financial statements
U.S. Dollars in thousands (except share data)
following weighted-average assumptions for 2005: risk-free interest rates of 4.06%, dividend yields of 0%, volatility factors of the expected market price of the Company’s Ordinary shares of 52.37% and a contractual life of 3.3 years.
Compensation expenses related to the granting of stock options to consultants amounted to $ 0, $ 0 and $ 156 for the years ended December 31, 2003, 2004 and 2005, respectively.
f. Treasury shares:During 2003, 2004 and 2005, the Company purchased 130,510, 3,800 and 0 treasury shares in consideration of $ 147, $ 9 and $ 0, respectively, according to the stock repurchase program, which authorized the Company’s officers to repurchase up to 600,000 Ordinary shares of MTS and was approved by the Company’s Board of Directors.
During 2003, MTS cancelled $457 of its treasury shares, which represent 384,610 Ordinary shares.
g. Dividends:Dividends, if any, will be paid in NIS. Dividends paid to shareholders outside Israel will be converted into dollars, on the basis of the exchange rate prevailing at the date of payment.
note 16: geogaphic information and major customers and productsThe Company adopted Statement of Financial Accounting Standard No. 131, “Disclosures About Segments of an Enterprise and Related Information” (“SFAS No. 131”). The Company operates in one reportable segment (see Note 1 for a brief description of the Company’s business). The total revenues are attributed to geographic areas based on the location of the customer.
The following is a summary of revenues within geographic areas based on end customer location and long-lived assets:
Year ended December 31, 2003 2004 2005
Revenues from sales:United States $ 4,917 $ 4,967 $ 6,043
Germany 1,826 1,724 2,059
Holland 924 798 747
Others 1,563 1,924 2,714
$ 9,230 $ 9,413 $ 11,563
Total revenues from external customers divided on the basis of the Company’s product lines are as follows:
Year ended December 31, 2004 2005
TABS $ 9,220 $ 7,454
Application suits 193 2,603
Billing products — 1,506
$ 9,413 $ 11,563
46 MTS annual report 2005

Notes to consolidated financial statements
U.S. Dollars in thousands (except share data)
Long-lived assets:
Year ended December 31, 2004 2005
Israel $ 3,103 $ 3,013
United States 2,244 2,194
Others 43 57
$ 5,390 $ 5,264
note 17: subsidiaries and affiliates
Percentage of ownershipJurisdiction of incorporation
Subsidiaries:
MTS IntegraTRAK Inc. 100% Delaware
MER Fifth Avenue Realty Inc. (a subsidiary of MTS IntegraTRAK Inc.) *) 100% New York
MTS Asia Ltd. 100% Hong Kong
Telegent Ltd. *) 100% Israel
Jaraga B.V. 100% The Netherlands
Verdura B.V. (a subsidiary of Jaraga B.V.) *) 100% The Netherlands
Voltera Technologies V.O.F. (a partnership held 99% by Jaraga B.V. and 1%
by Verdura B.V.) *) 100% The Netherlands
Bohera B.V. (a subsidiary of Jaraga B.V.) *) 100% The Netherlands
Tabs Brazil Ltd. (a subsidiary of Jaraga B.V.) 100% Brazil
Affiliate:
Jusan S.A. (a subsidiary of Jaraga B.V.) 50% Spain
*) Inactive, or having immaterial activity.
MTS annual report 2005 47

Board of Directors
Mr. Chaim Mer, ChairmanMr. Isaac Ben-Bassat, DirectorMr. Steven J. Glusband, DirectorMr. Alon Aginsky, DirectorDr. Yehoshua Gleitman, DirectorDr. Orna Berry, DirectorMr. Yaacov Goldman, Director
Officers
Mr. Eytan Bar, President & CEOMr. Shlomi Hagai, Corporate COO & CFOMr. Hanoch Magid, VP Marketing & Sales EMEAMr. Eric Fay, VP Sales North America
International
MER Telemanagement Solutions Ltd.22 Zarhin StreetRa’anana 43662, IsraelTel: (972) 9 762 1777Fax: (972) 9 746 [email protected]
North America
MTS IntegraTRAK Inc.12600 SE 38th Street, Suite 250Bellevue, WA 98006, USATel: (1) 425 401–1000Fax: (1) 425 401–1700
18–35 River Road, 2nd floorFair Lawn, NJ 07410, USATel: (1) 201-421-2260Fax: (1) [email protected]
Asia & Pacific Rim
MTS Asia Ltd.Room b–4, 8/F Kwong loong tai Bldg.1016–1018 tai nan west street,Cheung sha wan,Kowloon, Hong KongTel: (852) 2413–2802Fax: (852) 2413–[email protected]
Europe
JARAGA B.V.Rapenburgerstraat 204,1011 MN Amsterdam, HollandTel: (31) 20–778–4141Fax: (31) 20–330–5444
South America
TABS Brasil Ltda.Fidencio Ramos Street100 11º floorVila Olímpia, São Paulo, BrasilTel: (55) 11 2124–0174Fax: (55) 11 2124–[email protected]
Investors and Information
Transfer Agent and RegistrarAmerican Stock Transfer & Trust Company59 Maiden LaneNew York, NY 10038, USA
US Legal CounselCarter, Ledyard & Milburn2 Wall StreetNew York, NY 10005, USATel: (1) 212 732–3200Fax: (1) 212 732–3232
Independent AuditorKost, Forer, Gabbay & KasiererMember of Ernst & Young Global3 Aminadav StreetTel-Aviv 61575, IsraelTel: (972) 3 623–2535Fax: (972) 3 562–2555
Stock Exchange ListingNasdaq Capital MarketSymbol: MTSL
Form 20–FCopies of MTS‘s Annual Report on Form 20–F as filed with the Securities and Exchange Commission may be obtained by shareholders without charge upon written request to:Mr. Shlomi HagaiMTS Ltd.22 Zarhin StreetRa’anana 43662, Israel
Investors RelationsFinancial Access Ltd 7 Jabotinsky St.Ramat Gan 52520, IsraelTel: (972) 3 575-7081Fax: (972) 3 575-7083
Annual Meeting
The Annual Meeting of Shareholders will be held on Friday, July 28, 2006 at 10:00am at the Company’s offices, 22 Zarhin Street, Ra’anana, Israel.
corporate directory
© All rights reserved to MER Telemanagement Solutions Ltd.
48 MTS annual report 2005

Des
ign
& Pr
oduc
tion:
Stu
dio
Dia
na C
hurg
es. C
opyw
riter
: Arie
l Mar
ketin
g.
mts is a leading provider of innovative software solutions for enterprisesand information and telecommunication service providers.MTS’ Telecommunications Expense Management (TEM) solutions are used by thousands of organizations and enterprises worldwide
to ensure that telecom services are acquired, provisioned, and invoiced correctly. An agile, modular, and scalable solution, MTS'
TEM enables a unified view of phone usage, proactive budget control, personal call management, and more. With TEM, MTS’
customers are controlling their telecommunications costs and saving money every month.
MTS’ Total-e Customer Care and Billing solutions are serving wireless and wire-line operators around the globe. Total-e includes
interconnect billing, partner revenue management, charging and invoicing. MTS offers pre-configured convergent packaged solutions
for both established service providers and emerging carriers of focused solutions for Value Added Services. A full-featured, scalable
architecture enables rapid deployment of new Value Added Services such as IPTV, VOD, VoIP, VNO, data and gaming. With unique
technology, Total-e substantially reduces integration risk, revenue leakage, and Total Cost of Ownership (TCO).
Headquartered in Israel, MTS markets through wholly owned subsidiaries in the United States, Hong Kong, Holland and Brazil, and
through OEM partnerships with Siemens, Phillips, and Panasonic. In addition, MTS has strategic alliances with major vendors such
as NEC, Nortel, Avaya, Cisco, Alcatel and others. MTS shares are traded on the NASDAQ Capital market (MTSL).
financial highlights 1
letter to the shareholders 2-3
driving momentum 4-5
the power of innovation 6-7
creating opportunities 8
about mts
contents
w w w . m t s i n t . c o m

w w w . m t s i n t . c o m
creating opportunitiesthrough innovation
annual report 2005MER Telemanagement Solutions Ltd.22 Zarhin StreetRa’anana 43662, IsraelTel: (972) 9 762 1777Fax: (972) 9 746 [email protected]
North AmericaMTS IntegraTRAK Inc.12600 SE 38th Street, Suite 250Bellevue, WA 98006, USATel: (1) 425 401–1000Fax: (1) 425 401–1700
18-35 River Road, 2nd floorFair Lawn, NJ 07410, USATel: (1) 201-421-2260Fax: (1) [email protected]
Asia & Pacific RimMTS Asia Ltd.Room b-4, 8/F Kwong loong tai Bldg.1016-1018 tai nan west street,Cheung sha wan,Kowloon, Hong KongTel: (852) 2413—2802Fax: (852) 2413—[email protected]
South AmericaTABS Brasil Ltda.Fidencio Ramos Street100 11º floorVila Olímpia, São Paulo, BrasilTel: (55) 11 2124–0174Fax: (55) 11 2124–[email protected]
EuropeJARAGA B.V.Rapenburgerstraat 204,1011 MN Amsterdam, HollandTel: (31) 20–778–4141Fax: (31) 20–330–5444