22 MONITORING JOBS AND INFLATION © 2012 Pearson Addison-Wesley.
50
-
date post
22-Dec-2015 -
Category
Documents
-
view
216 -
download
0
Transcript of 22 MONITORING JOBS AND INFLATION © 2012 Pearson Addison-Wesley.


22MONITORING JOBSAND INFLATION

© 2012 Pearson Addison-Wesley

© 2012 Pearson Addison-Wesley
Employment and Unemployment
Why Unemployment Is a Problem
Unemployment results in
Lost incomes and production
Lost human capital

© 2012 Pearson Addison-Wesley
Employment and Unemployment
Population Survey
The population is divided into two groups:
1. The working-age population—the number of people aged 16 years and older who are not in jail, hospital, or some other institution
2. People too young to work (under 16 years of age) or institutionalized

© 2012 Pearson Addison-Wesley
Employment and Unemployment
The working-age population is divided into two groups:
1. People in the labor force
2. People not in the labor force
The labor force is the sum of employed and unemployed workers.

© 2012 Pearson Addison-Wesley
Employment and Unemployment
To be counted as unemployed, a person must be in one of the following three categories:
1. Without work but has made specific efforts to find a job within the previous four weeks
2. Waiting to be called back to a job from which he or she has been laid off
3. Waiting to start a new job within 30 days

© 2012 Pearson Addison-Wesley
Employment and Unemployment
Figure 22.1 shows the labor force categories. In June 2010:
Population: 309.6 million
Working-age population: 237.7 million
Labor force: 153.7 million
Employment: 139.1 million
Unemployment: 14.6 million

© 2012 Pearson Addison-Wesley
Employment and Unemployment
Three Labor Market Indicators
The unemployment rate
The employment-to-population ratio
The labor force participation rate

© 2012 Pearson Addison-Wesley
Employment and Unemployment
The Unemployment Rate
The unemployment rate is the percentage of the labor force that is unemployed.
The unemployment rate is (Number of people unemployed ÷ labor force) 100.
In June 2010, the labor force was 153.7 million and 14.6 million were unemployed, so the unemployment rate was 9.5 percent.

© 2012 Pearson Addison-Wesley
Employment and Unemployment
Figure 22.2 shows the unemployment rate: 1980–2010.
The unemployment rate increases in a recession.

© 2012 Pearson Addison-Wesley
Employment and Unemployment
The Employment-to-Population Ratio
The employment-to-population ratio is the percentage of the working-age population who have jobs.
The employment-to-population ratio is (Employment ÷ Working-age population) 100.
In June 2010, the employment was 139.1 million and the working-age population was 237.7 million.
The employment-to-population ratio was 58.5 percent.

© 2012 Pearson Addison-Wesley
Employment and Unemployment
The Labor Force Participation Rate
The labor force participation rate is the percentage of the working-age population who are members of the labor force.
The labor force participation rate is (Labor force ÷ Working-age population) 100.
In 2008, the labor force was 154.6 million and the working-age population was 233.8 million.
The labor force participation rate was 66.1 percent.

© 2012 Pearson Addison-Wesley
Employment and Unemployment
Figure 22.3 shows the labor force participation rate and employment-to-population ratio both trend upward before 2000 and downward after 2000.

© 2012 Pearson Addison-Wesley
Employment and Unemployment
Other Definitions of Unemployment
The purpose of the unemployment rate is to measure the underutilization of labor resources.
But the official measure is an imperfect measure because it excludes
Marginally attached workers
Part-time workers who want full-time jobs

© 2012 Pearson Addison-Wesley
Employment and Unemployment
Marginally Attached Workers
A marginally attached worker is a person who currently is neither working nor looking for work but has indicated that he or she wants and is available for a job and has looked for work sometime in the recent past.
A discouraged worker is a marginally attached worker who has stopped looking for a job because of repeated failure to find one.

© 2012 Pearson Addison-Wesley
Employment and Unemployment
Part-Time Workers Who Want Full-Time Jobs
Many part-time workers want to work part time, but some part-time workers would like full-time jobs and can’t find them.
In the official statistics, these workers are called economic part-time workers and they are partly unemployed.

© 2012 Pearson Addison-Wesley
Employment and Unemployment
Alternative Measures of Unemployment
The BLS reports six alternative measures of the unemployment rate: two narrower than the official measure and three broader ones.
The narrower measures, U-1 and U-2
The broader measures, U-4, U-5, and U-6

© 2012 Pearson Addison-Wesley
Figure 22.4 shows six alternative measures.
U-1: Those unemployed for 15 or more weeks
U-2: Unemployed job losers
U-3: The official unemployment rate
Employment and Unemployment

© 2012 Pearson Addison-Wesley
Employment and Unemployment
Broader measures are
U-4: U-3 + Discouraged workers
U-5: U-4 + Marginally attached workers
U-6: U-4 + Part-time workers who want full-time jobs

© 2012 Pearson Addison-Wesley
Unemployment and Full Employment
Unemployment can be classified into three types:
Frictional unemployment
Structural unemployment
Cyclical unemployment

© 2012 Pearson Addison-Wesley
Unemployment and Full Employment
Frictional Unemployment
Frictional unemployment is unemployment that arises from normal labor market turnover.
Frictional unemployment is a permanent and healthy phenomenon of a growing economy.

© 2012 Pearson Addison-Wesley
Unemployment and Full Employment
Structural Unemployment
Structural unemployment is unemployment created by changes in technology and foreign competition that change the skills needed to perform jobs or the locations of jobs.

© 2012 Pearson Addison-Wesley
Unemployment and Full Employment
Cyclical Unemployment
Cyclical unemployment is the higher than normal unemployment at a business cycle trough and lower than normal unemployment at a business cycle peak.
A worker laid off because the economy is in a recession and is then rehired when the expansion begins experiences cycle unemployment.

© 2012 Pearson Addison-Wesley
Unemployment and Full Employment
“Natural” Unemployment
Natural unemployment is the unemployment that arises from frictions and structural change when there is no cyclical unemployment.
Natural unemployment is all frictional and structural unemployment.
The natural unemployment rate is natural unemployment as a percentage of labor force.

© 2012 Pearson Addison-Wesley
Unemployment and Full Employment
Full employment is defines as the situation in which the unemployment rate equals the natural unemployment rate.
When the economy is at full employment, there is no cyclical unemployment or, equivalently, all unemployment is frictional and structural.

© 2012 Pearson Addison-Wesley
The natural unemployment rate changes over time and is influenced by many factors.
Key factors are
The age distribution of the population
The scale of structural change
The real wage rate
Unemployment benefits
Unemployment and Full Employment

© 2012 Pearson Addison-Wesley
Figure 22.5 shows the output gap and …
the fluctuations of unemployment around the natural rate.
Unemployment and Full Employment

© 2012 Pearson Addison-Wesley
Price Level, Inflation, and Deflation
The price level is the average level of prices and the value of money.
A persistently rising price level is called inflation.
A persistently falling price level is called deflation.

© 2012 Pearson Addison-Wesley
Why Inflation and Deflation Are Problems
Low, steady, and anticipated inflation or deflation is not a problem.
Unpredictable inflation or deflation is a problem because it
Redistributes income and wealth
Lowers real GDP and employment
Diverts resources from production
Price Level, Inflation, and Deflation

© 2012 Pearson Addison-Wesley
Unpredictable changes in the inflation rate redistribute income in arbitrary ways between employers and workers and between borrowers and lenders.
A high inflation rate is a problem because it diverts resources from productive activities to inflation forecasting.
From a social perspective, this waste of resources is a cost of inflation.
At its worse, inflation becomes hyperinflation—an inflation rate that is so rapid that workers are paid twice a day because money loses its value so quickly.
Price Level, Inflation, and Deflation

© 2012 Pearson Addison-Wesley
Price Level, Inflation, and Deflation
The Consumer Price Index
The Consumer Price Index, or CPI, measures the average of the prices paid by urban consumers for a “fixed” basket of consumer goods and services.

© 2012 Pearson Addison-Wesley
Price Level, Inflation, and Deflation
Reading the CPI Numbers
The CPI is defined to equal 100 for the reference base period.
Currently, the reference base period is 19821984.
That is, for the average of the 36 months from January 1982 through December 1984, the CPI equals 100.
In June 2010, the CPI was 218.
This number tells us that the average of the prices paid by urban consumers for a fixed basket of goods was 118 percent higher in June 2010 than it was during 19821984.

© 2012 Pearson Addison-Wesley
Price Level, Inflation, and Deflation
Constructing the CPI
Constructing the CPI involves three stages:
Selecting the CPI basket
Conducting a monthly price survey
Calculating the CPI

© 2012 Pearson Addison-Wesley
Price Level, Inflation, and Deflation
The CPI Basket
The CPI basket is based on a Consumer Expenditure Survey.
The CPI basket today is based on data collected in the Consumer Expenditure Survey of 2008.

© 2012 Pearson Addison-Wesley
Price Level, Inflation, and Deflation
Figure 22.6 illustrates the CPI basket.
Housing is the largest component.
Transportation and food and beverages are the next largest components.
The remaining components account for 26 percent of the basket.

© 2012 Pearson Addison-Wesley
Price Level, Inflation, and Deflation
The Monthly Price Survey
Every month, BLS employees check the prices of the 80,000 goods in the CPI basket in 30 metropolitan areas.
Calculating the CPI
1. Find the cost of the CPI basket at base-period prices.
2. Find the cost of the CPI basket at current-period prices.
3. Calculate the CPI for the current period.

© 2012 Pearson Addison-Wesley
Price Level and Inflation
Let’s work an example of the CPI calculation.
In a simple economy, people consume only oranges and haircuts.
The CPI basket is 10 oranges and 5 haircuts.
The table also shows the prices in the base period.
The cost of the CPI basket in the base period was $50.

© 2012 Pearson Addison-Wesley
Price Level and Inflation
Table 22.1(b) shows the fixed CPI basket of goods.
It also shows the prices in the current period.
The cost of the CPI basket at current-period prices is $70.

© 2012 Pearson Addison-Wesley
Price Level, Inflation, and Deflation
The CPI is calculated using the formula:
CPI = (Cost of basket at current-period prices ÷ Cost of basket at base-period prices) 100.
Using the numbers for the simple example,
CPI = ($70 ÷ $50) 100 = 140.
The CPI is 40 percent higher in the current period than it was in the base period.

© 2012 Pearson Addison-Wesley
Price Level, Inflation, and Deflation
Measuring the Inflation Rate
The major purpose of the CPI is to measure inflation.
The inflation rate is the percentage change in the price level from one year to the next.
The inflation formula is:
Inflation rate = [(CPI this year – CPI last year) ÷ CPI last year] 100.

© 2012 Pearson Addison-Wesley
Price Level, Inflation, and Deflation
Figure 22.7 shows the relationship between the price level and the inflation rate.
Figure 22.7(a) shows the CPI from 1970 to 2010.

© 2012 Pearson Addison-Wesley
Price Level, Inflation, and Deflation
Figure 22.7(b) shows that the inflation rate is
High when the price level is rising rapidly and
Low when the price level is rising slowly.

© 2012 Pearson Addison-Wesley
Price Level, Inflation, and Deflation
The Biased CPI
The CPI might overstate the true inflation for four reasons:
New goods bias
Quality change bias
Commodity substitution bias
Outlet substitution bias

© 2012 Pearson Addison-Wesley
Price Level, Inflation, and Deflation
New Goods Bias
New goods that were not available in the base year appear and, if they are more expensive than the goods they replace, they put an upward bias into the CPI.
Quality Change Bias
Quality improvements occur every year. Part of the rise in the price is payment for improved quality and is not inflation.
The CPI counts all the price rise as inflation.
© 2012 Pearson Addison-Wesley
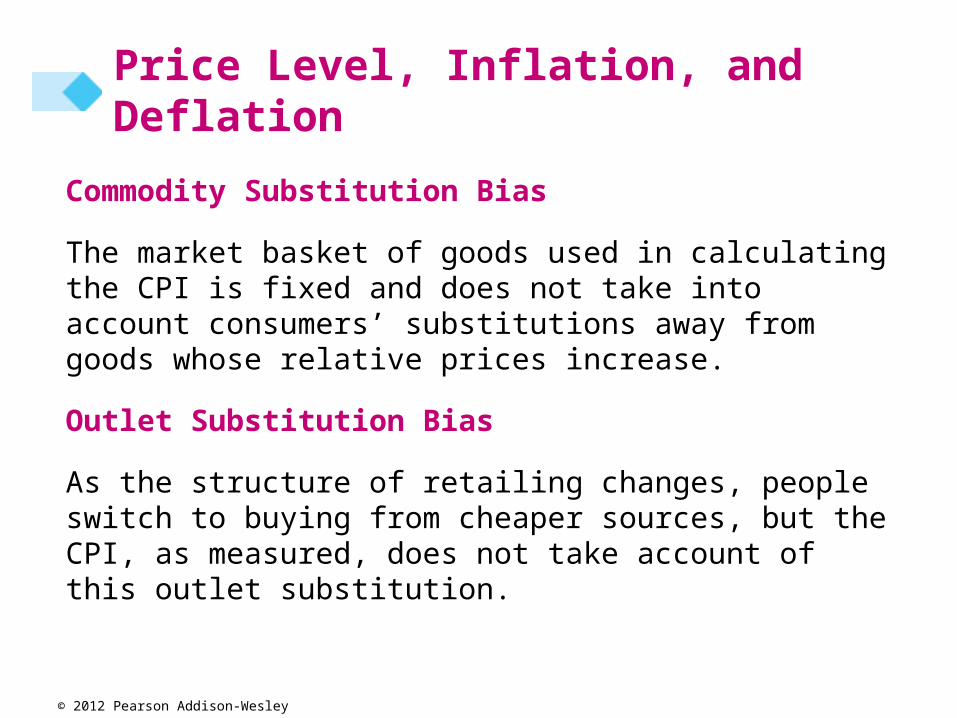
Price Level, Inflation, and Deflation
Commodity Substitution Bias
The market basket of goods used in calculating the CPI is fixed and does not take into account consumers’ substitutions away from goods whose relative prices increase.
Outlet Substitution Bias
As the structure of retailing changes, people switch to buying from cheaper sources, but the CPI, as measured, does not take account of this outlet substitution.

© 2012 Pearson Addison-Wesley
Price Level, Inflation, and Deflation
Alternative Price Indexes
Alternative measures of the price level are
Chained CPI
Personal consumption expenditure deflator
GPD deflator

© 2012 Pearson Addison-Wesley
Price Level, Inflation, and Deflation
Personal Consumption Expenditure Deflator
The PCE deflator equals
(Nominal consumption expenditure ÷ Real consumption expenditure) 100
PCE deflator is a broader measure of the price level than the CPI because it includes all consumption expenditure.
GDP Deflator
GDP deflator is like the PCE deflator except it includes the prices of all goods and services that are counted in GDP.

© 2012 Pearson Addison-Wesley
Price Level, Inflation, and Deflation
Core Inflation Rate
The core inflation rate is the CPI inflation rate excluding the volatile elements (of food and fuel).
The core inflation rate attempts to reveal the underlying inflation trend.
© 2012 Pearson Addison-Wesley
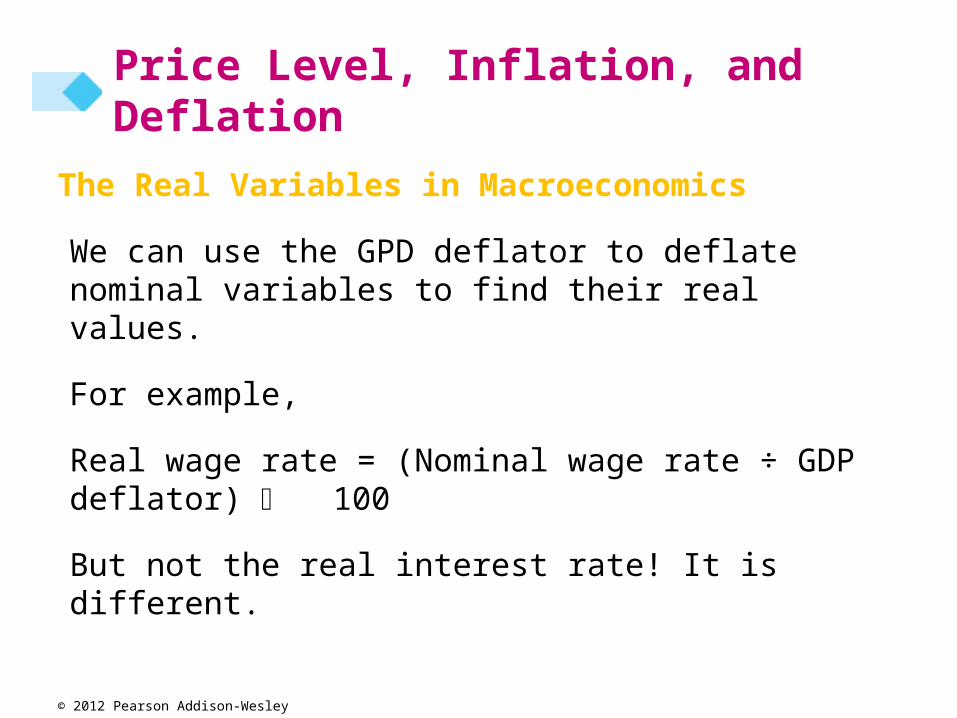
Price Level, Inflation, and Deflation
The Real Variables in Macroeconomics
We can use the GPD deflator to deflate nominal variables to find their real values.
For example,
Real wage rate = (Nominal wage rate ÷ GDP deflator) 100
But not the real interest rate! It is different.