
22 March2010 India Daily
33
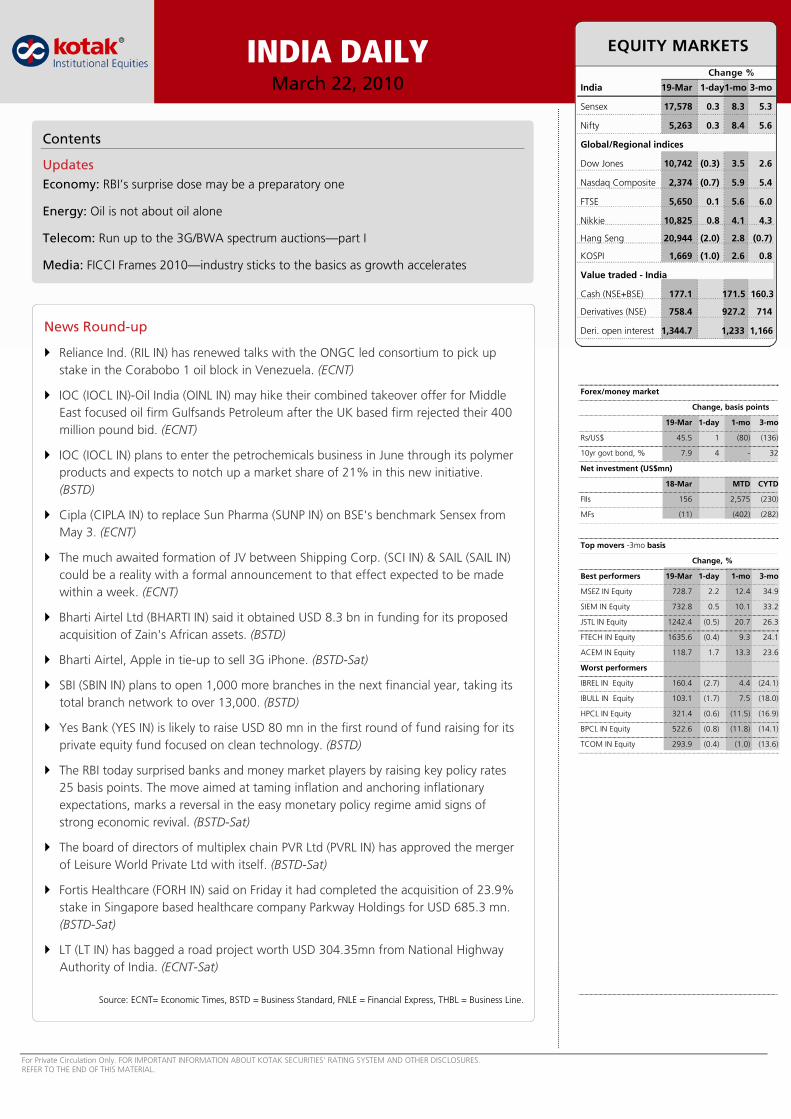
For Private Circulation Only. FOR IMPORTANT INFORMATION ABOUT KOTAK SECURITIES’ RATING SYSTEM AND OTHER DISCLOSURES. REFER TO THE END OF THIS MATERIAL. INDIA DAILY March 22, 2010 India 19-Mar 1-day1-mo 3-mo Sensex 17,578 0.3 8.3 5.3 Nifty 5,263 0.3 8.4 5.6 Global/Regional indices Dow Jones 10,742 (0.3) 3.5 2.6 Nasdaq Composite 2,374 (0.7) 5.9 5.4 FTSE 5,650 0.1 5.6 6.0 Nikkie 10,825 0.8 4.1 4.3 Hang Seng 20,944 (2.0) 2.8 (0.7) KOSPI 1,669 (1.0) 2.6 0.8 Value traded - India Cash (NSE+BSE) 177.1 171.5 160.3 Derivatives (NSE) 758.4 927.2 714 Deri. open interest 1,344.7 1,233 1,166 Forex/money market Change, basis points 19-Mar 1-day 1-mo 3-mo Rs/US$ 45.5 1 (80) (136) 10yr govt bond, % 7.9 4 - 32 Net investment (US$mn) 18-Mar MTD CYTD FIIs 156 2,575 (230) MFs (11) (402) (282) Top movers -3mo basis Change, % Best performers 19-Mar 1-day 1-mo 3-mo MSEZ IN Equity 728.7 2.2 12.4 34.9 SIEM IN Equity 732.8 0.5 10.1 33.2 JSTL IN Equity 1242.4 (0.5) 20.7 26.3 FTECH IN Equity 1635.6 (0.4) 9.3 24.1 ACEM IN Equity 118.7 1.7 13.3 23.6 Worst performers IBREL IN Equity 160.4 (2.7) 4.4 (24.1) IBULL IN Equity 103.1 (1.7) 7.5 (18.0) HPCL IN Equity 321.4 (0.6) (11.5) (16.9) BPCL IN Equity 522.6 (0.8) (11.8) (14.1) TCOM IN Equity 293.9 (0.4) (1.0) (13.6) Contents Updates Economy: RBI’s surprise dose may be a preparatory one Energy: Oil is not about oil alone Telecom: Run up to the 3G/BWA spectrum auctions—part I Media: FICCI Frames 2010—industry sticks to the basics as growth accelerates News Round-up Reliance Ind. (RIL IN) has renewed talks with the ONGC led consortium to pick up stake in the Corabobo 1 oil block in Venezuela. (ECNT) IOC (IOCL IN)-Oil India (OINL IN) may hike their combined takeover offer for Middle East focused oil firm Gulfsands Petroleum after the UK based firm rejected their 400 million pound bid. (ECNT) IOC (IOCL IN) plans to enter the petrochemicals business in June through its polymer products and expects to notch up a market share of 21% in this new initiative. (BSTD) Cipla (CIPLA IN) to replace Sun Pharma (SUNP IN) on BSE's benchmark Sensex from May 3. (ECNT) The much awaited formation of JV between Shipping Corp. (SCI IN) & SAIL (SAIL IN) could be a reality with a formal announcement to that effect expected to be made within a week. (ECNT) Bharti Airtel Ltd (BHARTI IN) said it obtained USD 8.3 bn in funding for its proposed acquisition of Zain's African assets. (BSTD) Bharti Airtel, Apple in tie-up to sell 3G iPhone. (BSTD-Sat) SBI (SBIN IN) plans to open 1,000 more branches in the next financial year, taking its total branch network to over 13,000. (BSTD) Yes Bank (YES IN) is likely to raise USD 80 mn in the first round of fund raising for its private equity fund focused on clean technology. (BSTD) The RBI today surprised banks and money market players by raising key policy rates 25 basis points. The move aimed at taming inflation and anchoring inflationary expectations, marks a reversal in the easy monetary policy regime amid signs of strong economic revival. (BSTD-Sat) The board of directors of multiplex chain PVR Ltd (PVRL IN) has approved the merger of Leisure World Private Ltd with itself. (BSTD-Sat) Fortis Healthcare (FORH IN) said on Friday it had completed the acquisition of 23.9% stake in Singapore based healthcare company Parkway Holdings for USD 685.3 mn. (BSTD-Sat) LT (LT IN) has bagged a road project worth USD 304.35mn from National Highway Authority of India. (ECNT-Sat) Source: ECNT= Economic Times, BSTD = Business Standard, FNLE = Financial Express, THBL = Business Line.
-
Upload
yateesh-wahaal -
Category
Documents
-
view
612 -
download
5
description
kotak report on telecom
Transcript of 22 March2010 India Daily
For Private Circulation Only. FOR IMPORTANT INFORMATION ABOUT KOTAK SECURITIES’ RATING SYSTEM AND OTHER DISCLOSURES. REFER TO THE END OF THIS MATERIAL.
INDIA DAILYMarch 22, 2010 India 19-Mar 1-day1-mo 3-mo
Sensex 17,578 0.3 8.3 5.3 Nifty 5,263 0.3 8.4 5.6 Global/Regional indices
Dow Jones 10,742 (0.3) 3.5 2.6 Nasdaq Composite 2,374 (0.7) 5.9 5.4
FTSE 5,650 0.1 5.6 6.0
Nikkie 10,825 0.8 4.1 4.3
Hang Seng 20,944 (2.0) 2.8 (0.7)
KOSPI 1,669 (1.0) 2.6 0.8 Value traded - India
Cash (NSE+BSE) 177.1 171.5 160.3
Derivatives (NSE) 758.4 927.2 714
Deri. open interest 1,344.7 1,233 1,166
Forex/money market
Change, basis points
19-Mar 1-day 1-mo 3-mo
Rs/US$ 45.5 1 (80) (136)
10yr govt bond, % 7.9 4 - 32
Net investment (US$mn)
18-Mar MTD CYTD
FIIs 156 2,575 (230)
MFs (11) (402) (282)
Top movers -3mo basis
Change, %
Best performers 19-Mar 1-day 1-mo 3-mo
MSEZ IN Equity 728.7 2.2 12.4 34.9
SIEM IN Equity 732.8 0.5 10.1 33.2
JSTL IN Equity 1242.4 (0.5) 20.7 26.3
FTECH IN Equity 1635.6 (0.4) 9.3 24.1
ACEM IN Equity 118.7 1.7 13.3 23.6
Worst performers
IBREL IN Equity 160.4 (2.7) 4.4 (24.1)
IBULL IN Equity 103.1 (1.7) 7.5 (18.0)
HPCL IN Equity 321.4 (0.6) (11.5) (16.9)
BPCL IN Equity 522.6 (0.8) (11.8) (14.1)
TCOM IN Equity 293.9 (0.4) (1.0) (13.6)
Contents
Updates Economy: RBI’s surprise dose may be a preparatory one
Energy: Oil is not about oil alone
Telecom: Run up to the 3G/BWA spectrum auctions—part I
Media: FICCI Frames 2010—industry sticks to the basics as growth accelerates
News Round-up
Reliance Ind. (RIL IN) has renewed talks with the ONGC led consortium to pick up stake in the Corabobo 1 oil block in Venezuela. (ECNT)
IOC (IOCL IN)-Oil India (OINL IN) may hike their combined takeover offer for Middle East focused oil firm Gulfsands Petroleum after the UK based firm rejected their 400 million pound bid. (ECNT)
IOC (IOCL IN) plans to enter the petrochemicals business in June through its polymer products and expects to notch up a market share of 21% in this new initiative. (BSTD)
Cipla (CIPLA IN) to replace Sun Pharma (SUNP IN) on BSE's benchmark Sensex from May 3. (ECNT)
The much awaited formation of JV between Shipping Corp. (SCI IN) & SAIL (SAIL IN) could be a reality with a formal announcement to that effect expected to be made within a week. (ECNT)
Bharti Airtel Ltd (BHARTI IN) said it obtained USD 8.3 bn in funding for its proposed acquisition of Zain's African assets. (BSTD)
Bharti Airtel, Apple in tie-up to sell 3G iPhone. (BSTD-Sat)
SBI (SBIN IN) plans to open 1,000 more branches in the next financial year, taking its total branch network to over 13,000. (BSTD)
Yes Bank (YES IN) is likely to raise USD 80 mn in the first round of fund raising for its private equity fund focused on clean technology. (BSTD)
The RBI today surprised banks and money market players by raising key policy rates 25 basis points. The move aimed at taming inflation and anchoring inflationary expectations, marks a reversal in the easy monetary policy regime amid signs of strong economic revival. (BSTD-Sat)
The board of directors of multiplex chain PVR Ltd (PVRL IN) has approved the merger of Leisure World Private Ltd with itself. (BSTD-Sat)
Fortis Healthcare (FORH IN) said on Friday it had completed the acquisition of 23.9% stake in Singapore based healthcare company Parkway Holdings for USD 685.3 mn. (BSTD-Sat)
LT (LT IN) has bagged a road project worth USD 304.35mn from National Highway Authority of India. (ECNT-Sat)
Source: ECNT= Economic Times, BSTD = Business Standard, FNLE = Financial Express, THBL = Business Line.
For private Circulation Only. FOR IMPORTANT INFORMATION ABOUT KOTAK SECURITIES’ RATING SYSTEM AND OTHER DISCLOSURES,REFER TO THE END OF THIS MATERIAL.
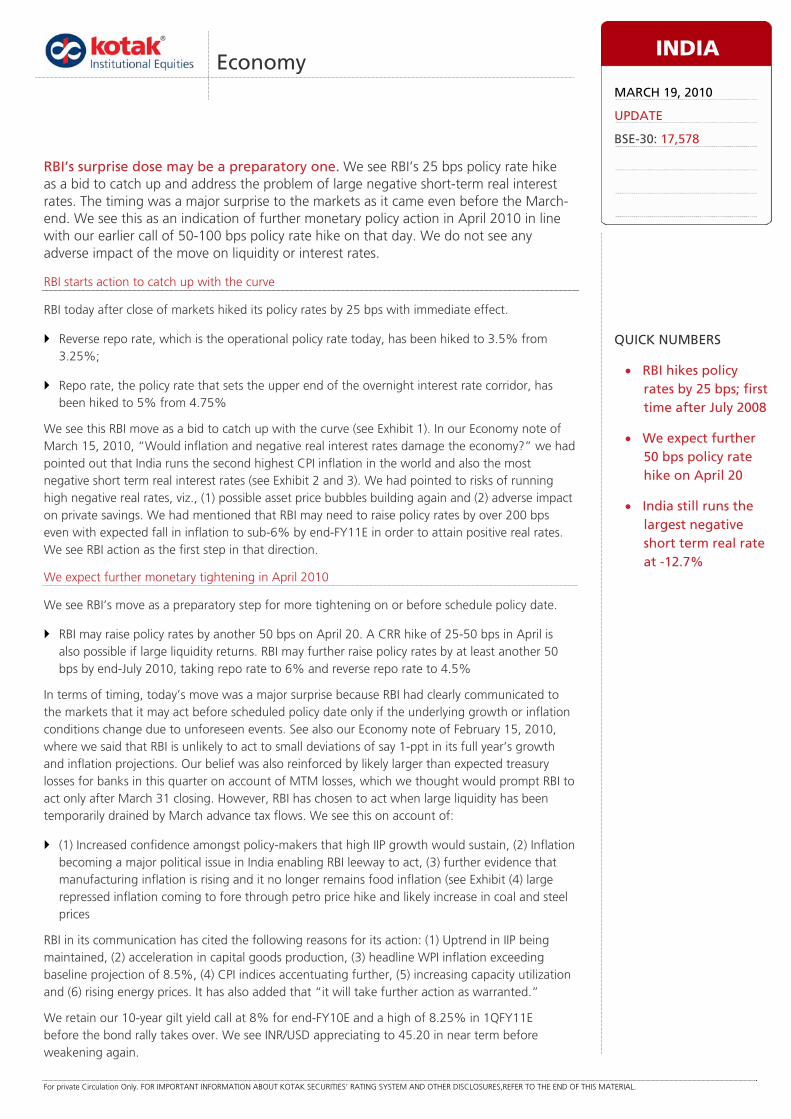
RBI starts action to catch up with the curve
RBI today after close of markets hiked its policy rates by 25 bps with immediate effect.
Reverse repo rate, which is the operational policy rate today, has been hiked to 3.5% from 3.25%;
Repo rate, the policy rate that sets the upper end of the overnight interest rate corridor, has been hiked to 5% from 4.75%
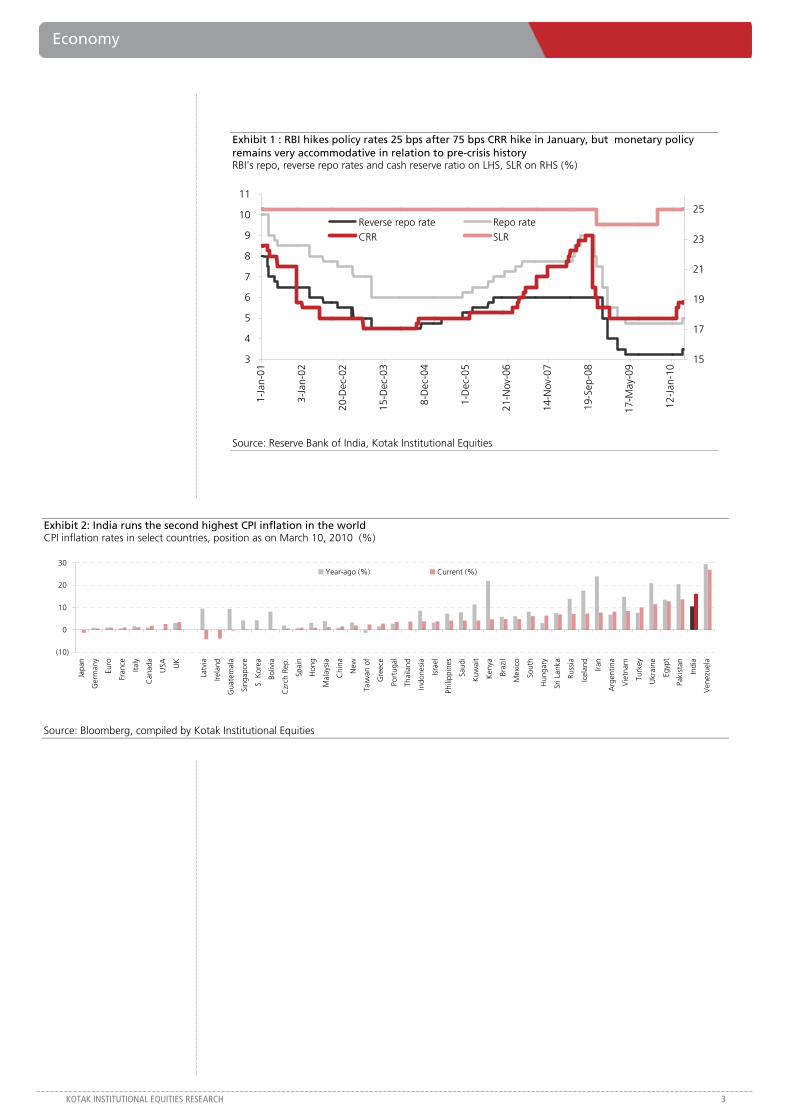
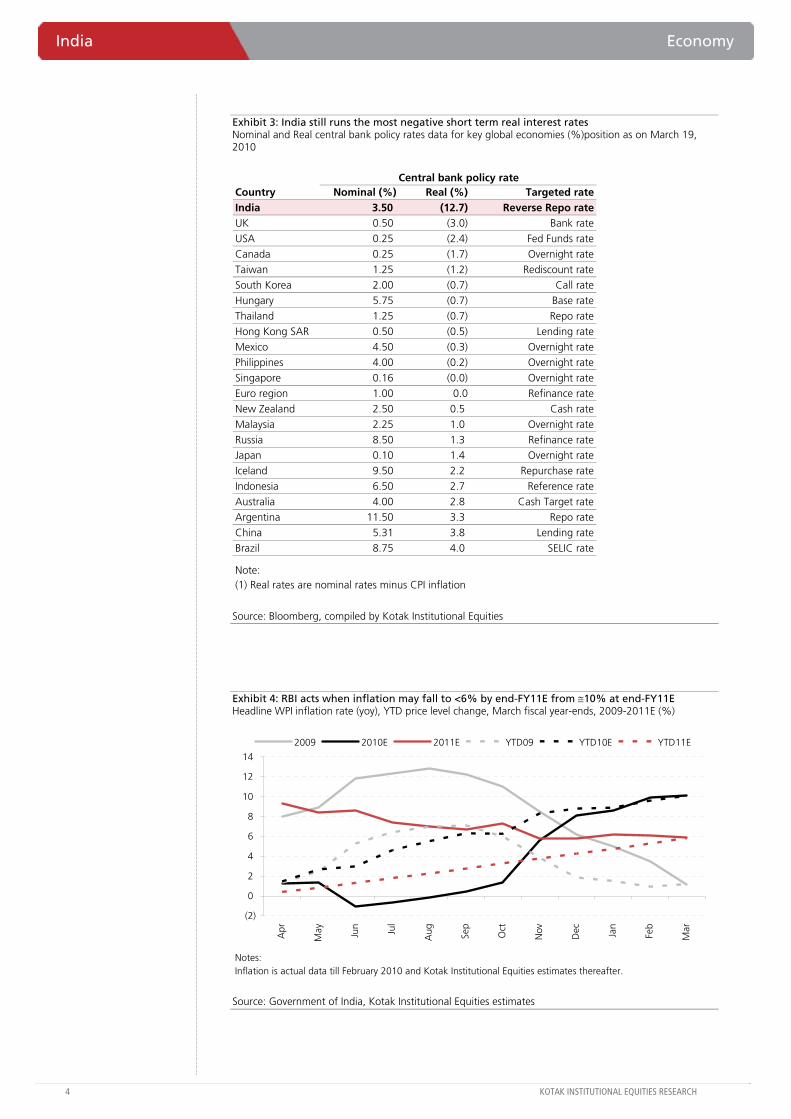
We see this RBI move as a bid to catch up with the curve (see Exhibit 1). In our Economy note of March 15, 2010, “Would inflation and negative real interest rates damage the economy?” we had pointed out that India runs the second highest CPI inflation in the world and also the most negative short term real interest rates (see Exhibit 2 and 3). We had pointed to risks of running high negative real rates, viz., (1) possible asset price bubbles building again and (2) adverse impact on private savings. We had mentioned that RBI may need to raise policy rates by over 200 bps even with expected fall in inflation to sub-6% by end-FY11E in order to attain positive real rates. We see RBI action as the first step in that direction.
We expect further monetary tightening in April 2010
We see RBI’s move as a preparatory step for more tightening on or before schedule policy date.
RBI may raise policy rates by another 50 bps on April 20. A CRR hike of 25-50 bps in April is also possible if large liquidity returns. RBI may further raise policy rates by at least another 50 bps by end-July 2010, taking repo rate to 6% and reverse repo rate to 4.5%
In terms of timing, today’s move was a major surprise because RBI had clearly communicated to the markets that it may act before scheduled policy date only if the underlying growth or inflation conditions change due to unforeseen events. See also our Economy note of February 15, 2010, where we said that RBI is unlikely to act to small deviations of say 1-ppt in its full year’s growth and inflation projections. Our belief was also reinforced by likely larger than expected treasury losses for banks in this quarter on account of MTM losses, which we thought would prompt RBI to act only after March 31 closing. However, RBI has chosen to act when large liquidity has been temporarily drained by March advance tax flows. We see this on account of:
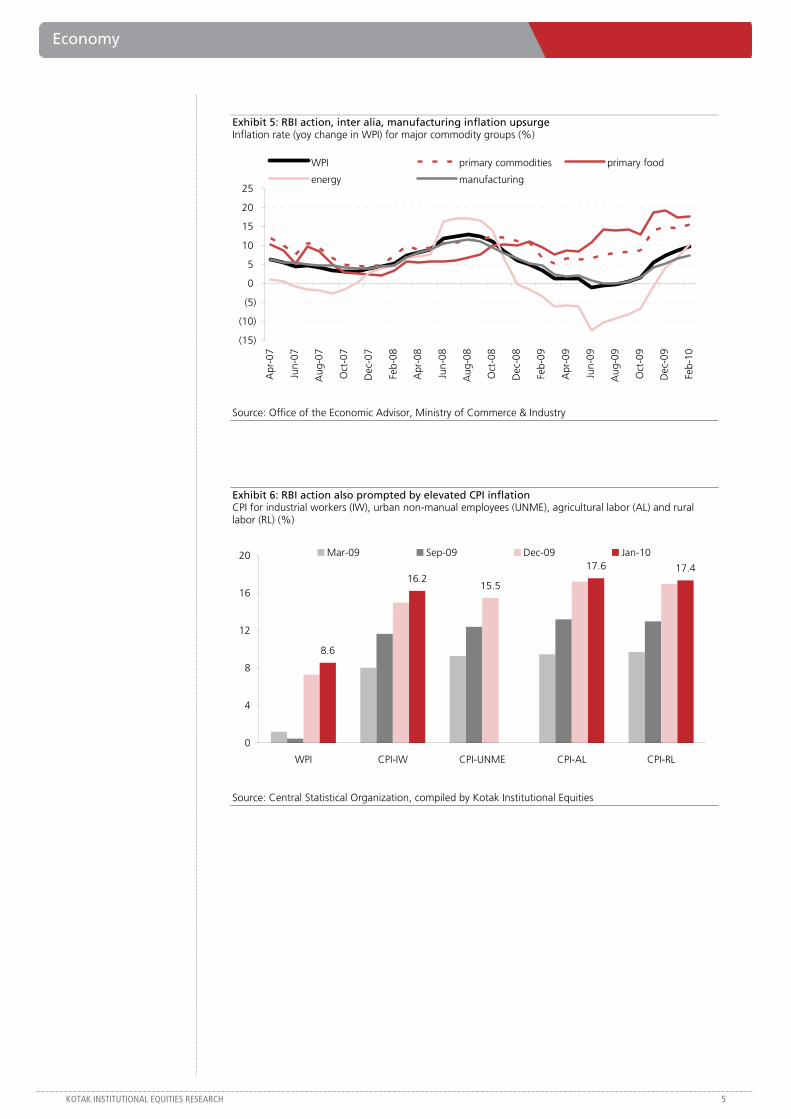
(1) Increased confidence amongst policy-makers that high IIP growth would sustain, (2) Inflation becoming a major political issue in India enabling RBI leeway to act, (3) further evidence that manufacturing inflation is rising and it no longer remains food inflation (see Exhibit (4) large repressed inflation coming to fore through petro price hike and likely increase in coal and steel prices
RBI in its communication has cited the following reasons for its action: (1) Uptrend in IIP being maintained, (2) acceleration in capital goods production, (3) headline WPI inflation exceeding baseline projection of 8.5%, (4) CPI indices accentuating further, (5) increasing capacity utilization and (6) rising energy prices. It has also added that “it will take further action as warranted.”
We retain our 10-year gilt yield call at 8% for end-FY10E and a high of 8.25% in 1QFY11E before the bond rally takes over. We see INR/USD appreciating to 45.20 in near term before weakening again.
Economy.dot
Economy
RBI’s surprise dose may be a preparatory one. We see RBI’s 25 bps policy rate hike as a bid to catch up and address the problem of large negative short-term real interest rates. The timing was a major surprise to the markets as it came even before the March-end. We see this as an indication of further monetary policy action in April 2010 in line with our earlier call of 50-100 bps policy rate hike on that day. We do not see any adverse impact of the move on liquidity or interest rates.
INDIA
MARCH 19, 2010
UPDATE
BSE-30: 17,578
QUICK NUMBERS
• RBI hikes policy rates by 25 bps; first time after July 2008
• We expect further 50 bps policy rate hike on April 20
• India still runs the largest negative short term real rate at -12.7%
Economy
KOTAK INSTITUTIONAL EQUITIES RESEARCH 3
Exhibit 1 : RBI hikes policy rates 25 bps after 75 bps CRR hike in January, but monetary policy remains very accommodative in relation to pre-crisis history RBI's repo, reverse repo rates and cash reserve ratio on LHS, SLR on RHS (%)
3
4
5
6
7
8
9
10
11
1-Ja
n-01
3-Ja
n-02
20-D
ec-0
2
15-D
ec-0
3
8-D
ec-0
4
1-D
ec-0
5
21-N
ov-0
6
14-N
ov-0
7
19-S
ep-0
8
17-M
ay-0
9
12-J
an-1
0
15
17
19
21
23
25Reverse repo rate Repo rateCRR SLR
Source: Reserve Bank of India, Kotak Institutional Equities
Exhibit 2: India runs the second highest CPI inflation in the world CPI inflation rates in select countries, position as on March 10, 2010 (%)
(10)
0
10
20
30
Japa
n
Ger
man
y
Euro
Fran
ce
Italy
Can
ada
USA U
K
Latv
ia
Irela
nd
Gua
tem
ala
Sing
apor
e
S. K
orea
Boliv
ia
Czr
ch R
ep.
Spai
n
Hon
g
Mal
aysi
a
Chi
na
New
Taiw
an o
f
Gre
ece
Port
ugal
Thai
land
Indo
nesi
a
Isra
el
Phili
ppin
es
Saud
i
Kuw
ait
Ken
ya
Braz
il
Mex
ico
Sout
h
Hun
gary
Sri L
anka
Russ
ia
Icel
and
Iran
Arg
entin
a
Vie
tnam
Turk
ey
Ukr
aine
Egyp
t
Paki
stan
Indi
a
Ven
ezue
la
Year-ago (%) Current (%)
Source: Bloomberg, compiled by Kotak Institutional Equities
India Economy
4 KOTAK INSTITUTIONAL EQUITIES RESEARCH
Exhibit 3: India still runs the most negative short term real interest rates Nominal and Real central bank policy rates data for key global economies (%)position as on March 19, 2010
Central bank policy rateCountry Nominal (%) Real (%) Targeted rateIndia 3.50 (12.7) Reverse Repo rateUK 0.50 (3.0) Bank rateUSA 0.25 (2.4) Fed Funds rateCanada 0.25 (1.7) Overnight rateTaiwan 1.25 (1.2) Rediscount rateSouth Korea 2.00 (0.7) Call rateHungary 5.75 (0.7) Base rateThailand 1.25 (0.7) Repo rateHong Kong SAR 0.50 (0.5) Lending rateMexico 4.50 (0.3) Overnight ratePhilippines 4.00 (0.2) Overnight rateSingapore 0.16 (0.0) Overnight rateEuro region 1.00 0.0 Refinance rateNew Zealand 2.50 0.5 Cash rateMalaysia 2.25 1.0 Overnight rateRussia 8.50 1.3 Refinance rateJapan 0.10 1.4 Overnight rateIceland 9.50 2.2 Repurchase rateIndonesia 6.50 2.7 Reference rateAustralia 4.00 2.8 Cash Target rateArgentina 11.50 3.3 Repo rateChina 5.31 3.8 Lending rateBrazil 8.75 4.0 SELIC rate
Note: (1) Real rates are nominal rates minus CPI inflation
Source: Bloomberg, compiled by Kotak Institutional Equities
Exhibit 4: RBI acts when inflation may fall to <6% by end-FY11E from ≅10% at end-FY11E Headline WPI inflation rate (yoy), YTD price level change, March fiscal year-ends, 2009-2011E (%)
Notes:Inflation is actual data till February 2010 and Kotak Institutional Equities estimates thereafter.
(2)
0
2
4
6
8
10
12
14
Apr
May Jun Jul
Aug Sep
Oct
Nov
Dec Jan
Feb
Mar
2009 2010E 2011E YTD09 YTD10E YTD11E
Source: Government of India, Kotak Institutional Equities estimates
Economy
KOTAK INSTITUTIONAL EQUITIES RESEARCH 5
Exhibit 5: RBI action, inter alia, manufacturing inflation upsurge Inflation rate (yoy change in WPI) for major commodity groups (%)
(15)
(10)
(5)
0
5
10
15
20
25
Apr
-07
Jun-
07
Aug
-07
Oct
-07
Dec
-07
Feb-
08
Apr
-08
Jun-
08
Aug
-08
Oct
-08
Dec
-08
Feb-
09
Apr
-09
Jun-
09
Aug
-09
Oct
-09
Dec
-09
Feb-
10
WPI primary commodities primary food
energy manufacturing
Source: Office of the Economic Advisor, Ministry of Commerce & Industry
Exhibit 6: RBI action also prompted by elevated CPI inflation CPI for industrial workers (IW), urban non-manual employees (UNME), agricultural labor (AL) and rural labor (RL) (%)
8.6
16.217.6 17.4
15.5
0
4
8
12
16
20
WPI CPI-IW CPI-UNME CPI-AL CPI-RL
Mar-09 Sep-09 Dec-09 Jan-10
Source: Central Statistical Organization, compiled by Kotak Institutional Equities
For private Circulation Only. FOR IMPORTANT INFORMATION ABOUT KOTAK SECURITIES’ RATING SYSTEM AND OTHER DISCLOSURES, REFER TO THE END OF THIS MATERIAL.
Crude firms up while natural gas prices decline; it all boils down to speculation, it would appear
Crude prices have risen over the past few weeks (+8% since February 1, 2010) upon expectations of (1) strong demand recovery in CY2010E, (2) long-term supply-demand imbalance due to declining OPEC spare capacity and (3) a decline in US product inventories. However, natural gas prices have corrected 24% over the same period, probably on account of winter heating demand tapering off and signs of a large surplus in autumn. We understand the different usages of oil and gas but the 3X pricing differential is a puzzle, especially as refining capacity and availability of auto fuels is not an issue and short-term fundamentals of crude appear weak.
Dollar movement, speculation can ward off weak fundamentals, only for a while
Oil optimists point to the increase in long-dated crude prices to justify their bullish stance on crude oil prices. However, the rapid changes in long-dated prices in sync with near-month prices suggest that long-dated prices do not accurately assess long-term crude oil prices. In fact, they move up or down based on near-month prices. Also, the synchronized movement of crude futures with movement in the US dollar (DXY Index) and stock markets suggests that there is a strong link between the three markets and speculation in crude futures based on movements in the DXY and stock markets.
Short-term and long-term views on oil no longer about oil alone
In our view, the short-term and medium-term fundamentals of crude oil do not support the current level of crude oil prices. There is ample OPEC spare capacity, global inventories are comfortable and supply of alternative energy is rising sharply in CY2010E. However, speculation and DXY may have an equally big bearing on short-term crude prices. In the long term, crude will have to contend with alternative energy sources—the potential of which is difficult to even fathom at this point. In our view, it is practically impossible to factor in so many complex developments on both the demand and supply side to make any accurate assessments of long-term prices; we doubt any modeling can accurately forecast technological advancements in both conventional and non-conventional hydrocarbons and alternative fuels; a few of them would be destructive in nature.
Shale gas is becoming increasingly conventional
Our preliminary study of shale gas suggests that this can be a destructive force for the conventional energy world. The technology for extracting shale gas is fairly common now, resources are abundant across the world and F&D (US$1.7/mn BTU average over the past two years) and production costs (about U$0.9/mn BTU in CY2009) are in line with those of conventional gas; in fact, as the area benefits from economies of scale with more proven reserves and as conventional resources dwindle, the cost curve may shift in favor of shale gas.
tl
Energy India
Oil is not about oil alone. We continue to be puzzled by the continued strength in crude oil prices despite its weak short-term fundamentals. Meanwhile, natural gas prices continue to correct sharply, probably cramped by concerns of surplus in the peak storage season given the rising production of non-conventional gas in the US. Optimists looking at long-dated prices to support their positive thesis may have to contend with this new and unexpected source of energy that could wreck crude oil’s fundamentals.
CAUTIOUS
MARCH 22, 2010
UPDATE
BSE-30: 17,578
QUICK NUMBERS
• Oil-gas price parity ratio at 3.5X currently in the US
• OPEC spare capacity at around 6 mn b/d in CY2010-11E
• Shale gas F&D cost at US$1.7/mn BTU and production cost (without transportation, taxes) at US$0.9/mn BTU
Energy India
KOTAK INSTITUTIONAL EQUITIES RESEARCH 7
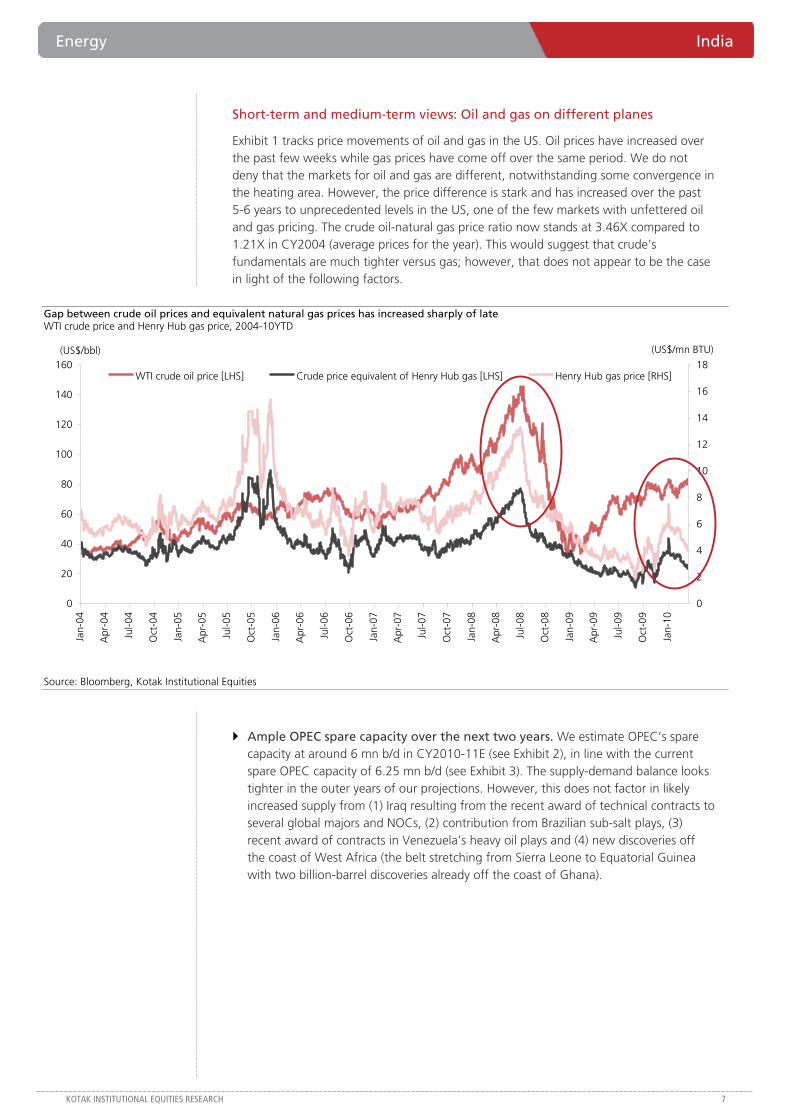
Short-term and medium-term views: Oil and gas on different planes
Exhibit 1 tracks price movements of oil and gas in the US. Oil prices have increased over the past few weeks while gas prices have come off over the same period. We do not deny that the markets for oil and gas are different, notwithstanding some convergence in the heating area. However, the price difference is stark and has increased over the past 5-6 years to unprecedented levels in the US, one of the few markets with unfettered oil and gas pricing. The crude oil-natural gas price ratio now stands at 3.46X compared to 1.21X in CY2004 (average prices for the year). This would suggest that crude’s fundamentals are much tighter versus gas; however, that does not appear to be the case in light of the following factors.
Gap between crude oil prices and equivalent natural gas prices has increased sharply of late WTI crude price and Henry Hub gas price, 2004-10YTD
0
20
40
60
80
100
120
140
160
Jan-
04
Apr
-04
Jul-0
4
Oct
-04
Jan-
05
Apr
-05
Jul-0
5
Oct
-05
Jan-
06
Apr
-06
Jul-0
6
Oct
-06
Jan-
07
Apr
-07
Jul-0
7
Oct
-07
Jan-
08
Apr
-08
Jul-0
8
Oct
-08
Jan-
09
Apr
-09
Jul-0
9
Oct
-09
Jan-
10
0
2
4
6
8
10
12
14
16
18WTI crude oil price [LHS] Crude price equivalent of Henry Hub gas [LHS] Henry Hub gas price [RHS]
(US$/bbl) (US$/mn BTU)
Source: Bloomberg, Kotak Institutional Equities
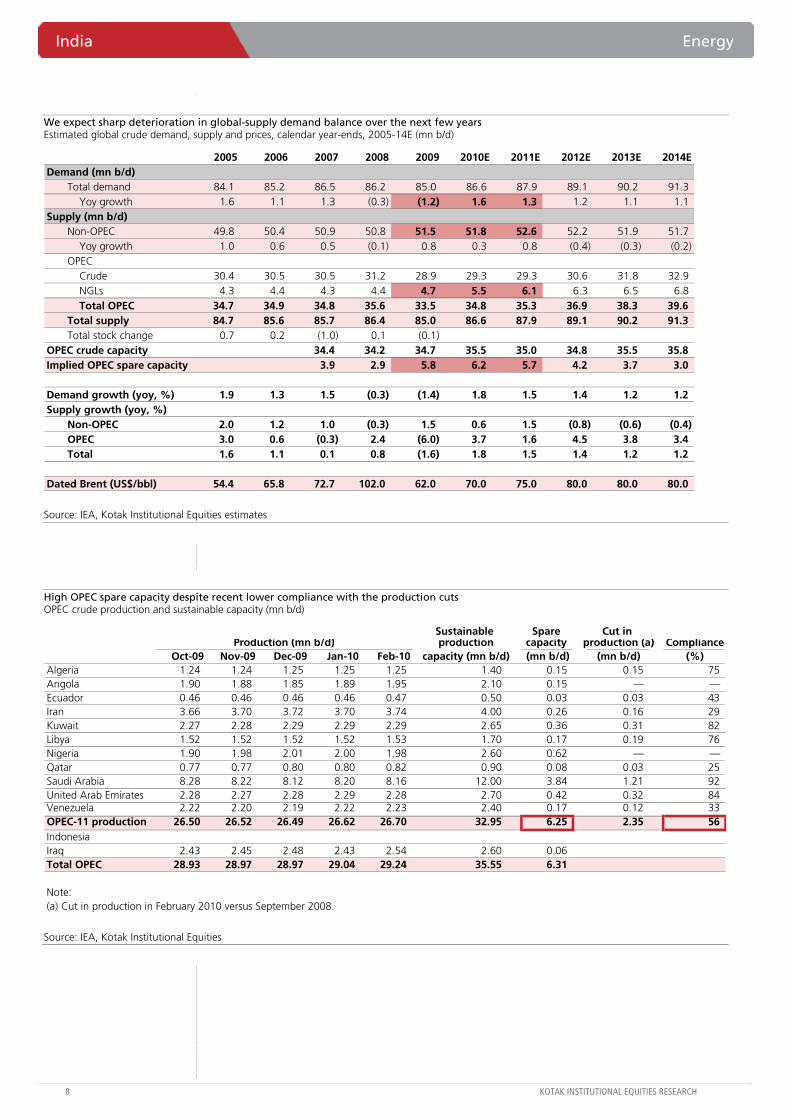
Ample OPEC spare capacity over the next two years. We estimate OPEC’s spare capacity at around 6 mn b/d in CY2010-11E (see Exhibit 2), in line with the current spare OPEC capacity of 6.25 mn b/d (see Exhibit 3). The supply-demand balance looks tighter in the outer years of our projections. However, this does not factor in likely increased supply from (1) Iraq resulting from the recent award of technical contracts to several global majors and NOCs, (2) contribution from Brazilian sub-salt plays, (3) recent award of contracts in Venezuela’s heavy oil plays and (4) new discoveries off the coast of West Africa (the belt stretching from Sierra Leone to Equatorial Guinea with two billion-barrel discoveries already off the coast of Ghana).
India Energy
8 KOTAK INSTITUTIONAL EQUITIES RESEARCH
We expect sharp deterioration in global-supply demand balance over the next few years Estimated global crude demand, supply and prices, calendar year-ends, 2005-14E (mn b/d)
2005 2006 2007 2008 2009 2010E 2011E 2012E 2013E 2014EDemand (mn b/d)
Total demand 84.1 85.2 86.5 86.2 85.0 86.6 87.9 89.1 90.2 91.3Yoy growth 1.6 1.1 1.3 (0.3) (1.2) 1.6 1.3 1.2 1.1 1.1
Supply (mn b/d)Non-OPEC 49.8 50.4 50.9 50.8 51.5 51.8 52.6 52.2 51.9 51.7
Yoy growth 1.0 0.6 0.5 (0.1) 0.8 0.3 0.8 (0.4) (0.3) (0.2)OPEC
Crude 30.4 30.5 30.5 31.2 28.9 29.3 29.3 30.6 31.8 32.9NGLs 4.3 4.4 4.3 4.4 4.7 5.5 6.1 6.3 6.5 6.8Total OPEC 34.7 34.9 34.8 35.6 33.5 34.8 35.3 36.9 38.3 39.6
Total supply 84.7 85.6 85.7 86.4 85.0 86.6 87.9 89.1 90.2 91.3Total stock change 0.7 0.2 (1.0) 0.1 (0.1)
OPEC crude capacity 34.4 34.2 34.7 35.5 35.0 34.8 35.5 35.8Implied OPEC spare capacity 3.9 2.9 5.8 6.2 5.7 4.2 3.7 3.0
Demand growth (yoy, %) 1.9 1.3 1.5 (0.3) (1.4) 1.8 1.5 1.4 1.2 1.2Supply growth (yoy, %)
Non-OPEC 2.0 1.2 1.0 (0.3) 1.5 0.6 1.5 (0.8) (0.6) (0.4)OPEC 3.0 0.6 (0.3) 2.4 (6.0) 3.7 1.6 4.5 3.8 3.4Total 1.6 1.1 0.1 0.8 (1.6) 1.8 1.5 1.4 1.2 1.2
Dated Brent (US$/bbl) 54.4 65.8 72.7 102.0 62.0 70.0 75.0 80.0 80.0 80.0
Source: IEA, Kotak Institutional Equities estimates
High OPEC spare capacity despite recent lower compliance with the production cuts OPEC crude production and sustainable capacity (mn b/d)
Sustainable Spare Cut in Production (mn b/d) production capacity production (a) Compliance
Oct-09 Nov-09 Dec-09 Jan-10 Feb-10 capacity (mn b/d) (mn b/d) (mn b/d) (%)Algeria 1.24 1.24 1.25 1.25 1.25 1.40 0.15 0.15 75 Angola 1.90 1.88 1.85 1.89 1.95 2.10 0.15 — —Ecuador 0.46 0.46 0.46 0.46 0.47 0.50 0.03 0.03 43 Iran 3.66 3.70 3.72 3.70 3.74 4.00 0.26 0.16 29 Kuwait 2.27 2.28 2.29 2.29 2.29 2.65 0.36 0.31 82 Libya 1.52 1.52 1.52 1.52 1.53 1.70 0.17 0.19 76 Nigeria 1.90 1.98 2.01 2.00 1.98 2.60 0.62 — —Qatar 0.77 0.77 0.80 0.80 0.82 0.90 0.08 0.03 25 Saudi Arabia 8.28 8.22 8.12 8.20 8.16 12.00 3.84 1.21 92 United Arab Emirates 2.28 2.27 2.28 2.29 2.28 2.70 0.42 0.32 84 Venezuela 2.22 2.20 2.19 2.22 2.23 2.40 0.17 0.12 33 OPEC-11 production 26.50 26.52 26.49 26.62 26.70 32.95 6.25 2.35 56 IndonesiaIraq 2.43 2.45 2.48 2.43 2.54 2.60 0.06 Total OPEC 28.93 28.97 28.97 29.04 29.24 35.55 6.31
Note:(a) Cut in production in February 2010 versus September 2008.
Source: IEA, Kotak Institutional Equities
Energy India
KOTAK INSTITUTIONAL EQUITIES RESEARCH 9
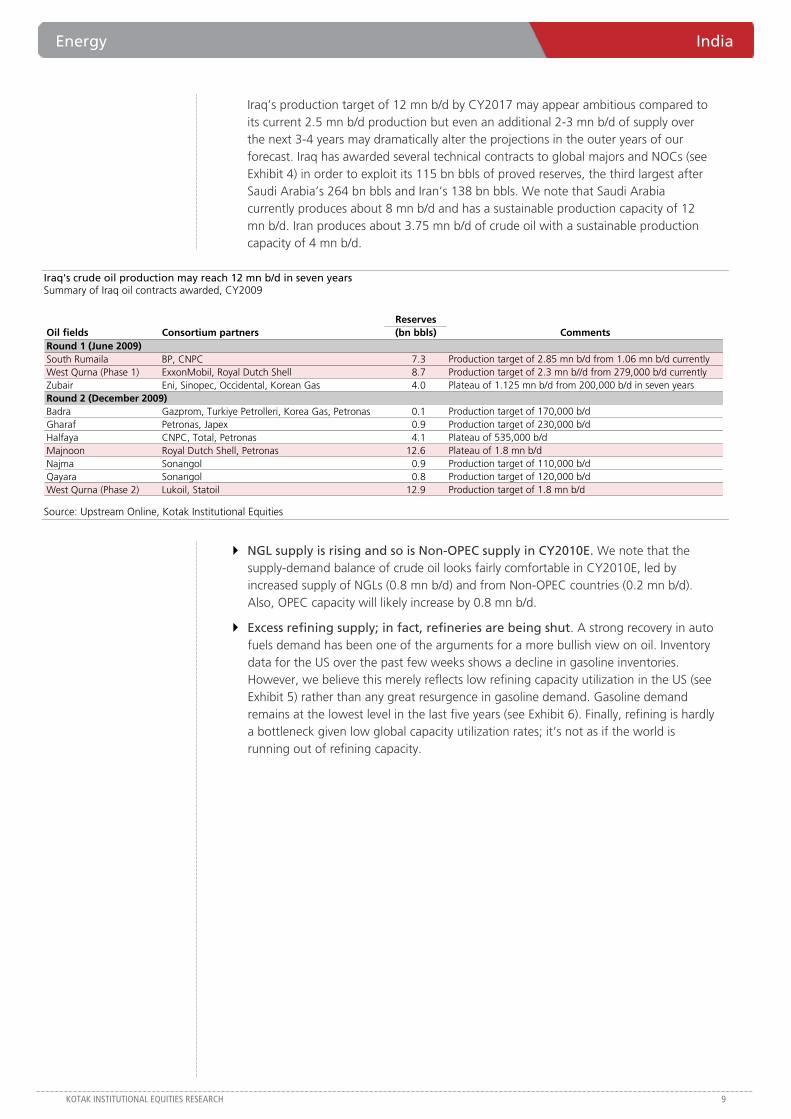
Iraq’s production target of 12 mn b/d by CY2017 may appear ambitious compared to its current 2.5 mn b/d production but even an additional 2-3 mn b/d of supply over the next 3-4 years may dramatically alter the projections in the outer years of our forecast. Iraq has awarded several technical contracts to global majors and NOCs (see Exhibit 4) in order to exploit its 115 bn bbls of proved reserves, the third largest after Saudi Arabia’s 264 bn bbls and Iran’s 138 bn bbls. We note that Saudi Arabia currently produces about 8 mn b/d and has a sustainable production capacity of 12 mn b/d. Iran produces about 3.75 mn b/d of crude oil with a sustainable production capacity of 4 mn b/d.
Iraq's crude oil production may reach 12 mn b/d in seven years Summary of Iraq oil contracts awarded, CY2009
ReservesOil fields Consortium partners (bn bbls) CommentsRound 1 (June 2009)South Rumaila BP, CNPC 7.3 Production target of 2.85 mn b/d from 1.06 mn b/d currentlyWest Qurna (Phase 1) ExxonMobil, Royal Dutch Shell 8.7 Production target of 2.3 mn b//d from 279,000 b/d currentlyZubair Eni, Sinopec, Occidental, Korean Gas 4.0 Plateau of 1.125 mn b/d from 200,000 b/d in seven yearsRound 2 (December 2009)Badra Gazprom, Turkiye Petrolleri, Korea Gas, Petronas 0.1 Production target of 170,000 b/dGharaf Petronas, Japex 0.9 Production target of 230,000 b/dHalfaya CNPC, Total, Petronas 4.1 Plateau of 535,000 b/dMajnoon Royal Dutch Shell, Petronas 12.6 Plateau of 1.8 mn b/dNajma Sonangol 0.9 Production target of 110,000 b/dQayara Sonangol 0.8 Production target of 120,000 b/dWest Qurna (Phase 2) Lukoil, Statoil 12.9 Production target of 1.8 mn b/d
Source: Upstream Online, Kotak Institutional Equities
NGL supply is rising and so is Non-OPEC supply in CY2010E. We note that the supply-demand balance of crude oil looks fairly comfortable in CY2010E, led by increased supply of NGLs (0.8 mn b/d) and from Non-OPEC countries (0.2 mn b/d). Also, OPEC capacity will likely increase by 0.8 mn b/d.
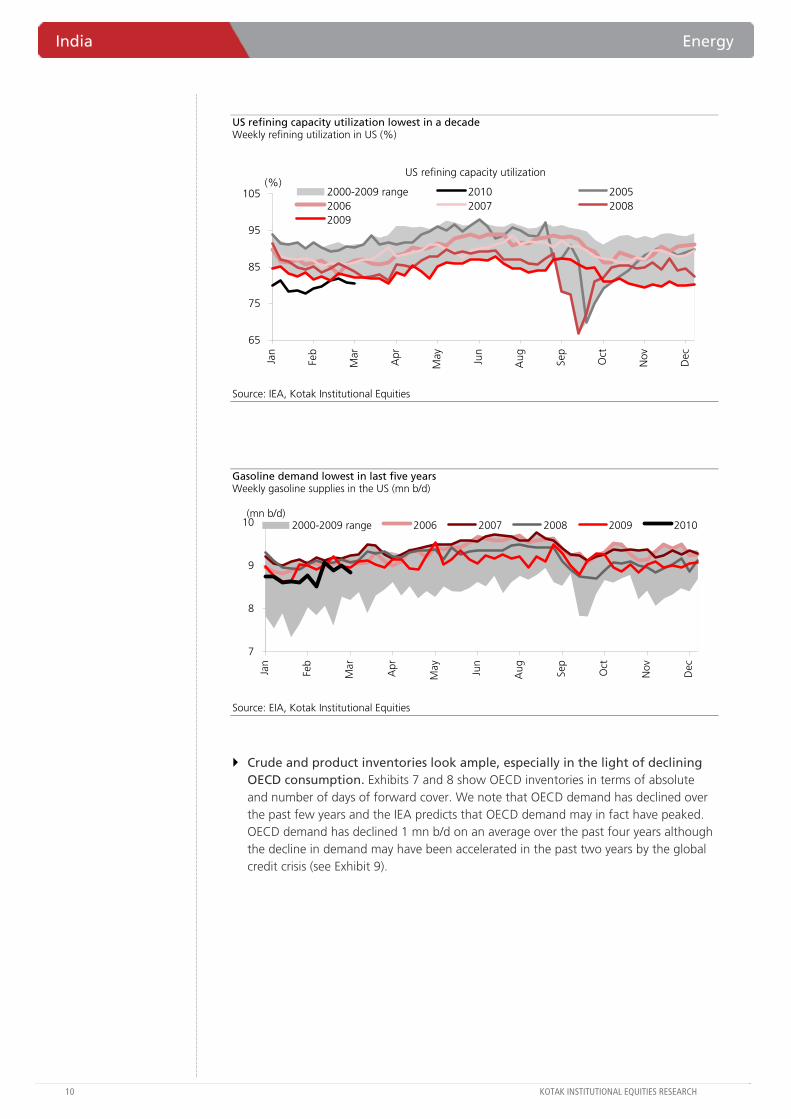
Excess refining supply; in fact, refineries are being shut. A strong recovery in auto fuels demand has been one of the arguments for a more bullish view on oil. Inventory data for the US over the past few weeks shows a decline in gasoline inventories. However, we believe this merely reflects low refining capacity utilization in the US (see Exhibit 5) rather than any great resurgence in gasoline demand. Gasoline demand remains at the lowest level in the last five years (see Exhibit 6). Finally, refining is hardly a bottleneck given low global capacity utilization rates; it’s not as if the world is running out of refining capacity.
India Energy
10 KOTAK INSTITUTIONAL EQUITIES RESEARCH
US refining capacity utilization lowest in a decade Weekly refining utilization in US (%)
US refining capacity utilization
65
75
85
95
105
Jan
Feb
Mar
Apr
May Jun
Aug Se
p
Oct
Nov
Dec
(%)2000-2009 range 2010 20052006 2007 20082009
Source: IEA, Kotak Institutional Equities
Gasoline demand lowest in last five years Weekly gasoline supplies in the US (mn b/d)
7
8
9
10
Jan
Feb
Mar
Apr
May Jun
Aug Sep
Oct
Nov
Dec
(mn b/d)2000-2009 range 2006 2007 2008 2009 2010
Source: EIA, Kotak Institutional Equities
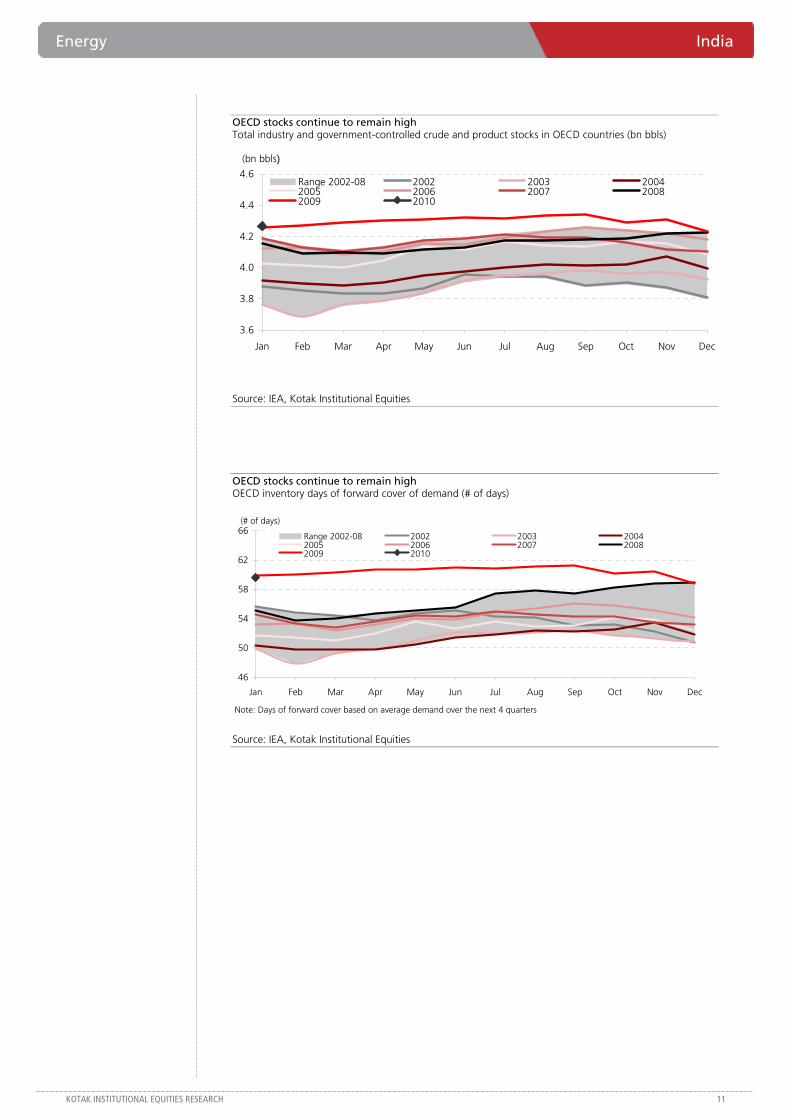
Crude and product inventories look ample, especially in the light of declining OECD consumption. Exhibits 7 and 8 show OECD inventories in terms of absolute and number of days of forward cover. We note that OECD demand has declined over the past few years and the IEA predicts that OECD demand may in fact have peaked. OECD demand has declined 1 mn b/d on an average over the past four years although the decline in demand may have been accelerated in the past two years by the global credit crisis (see Exhibit 9).
Energy India
KOTAK INSTITUTIONAL EQUITIES RESEARCH 11
OECD stocks continue to remain high Total industry and government-controlled crude and product stocks in OECD countries (bn bbls)
3.6
3.8
4.0
4.2
4.4
4.6
Jan Feb Mar Apr May Jun Jul Aug Sep Oct Nov Dec
Range 2002-08 2002 2003 20042005 2006 2007 20082009 2010
(bn bbls)
Source: IEA, Kotak Institutional Equities
OECD stocks continue to remain high OECD inventory days of forward cover of demand (# of days)
Note: Days of forward cover based on average demand over the next 4 quarters
(# of days)
46
50
54
58
62
66
Jan Feb Mar Apr May Jun Jul Aug Sep Oct Nov Dec
Range 2002-08 2002 2003 20042005 2006 2007 20082009 2010
Source: IEA, Kotak Institutional Equities
India Energy
12 KOTAK INSTITUTIONAL EQUITIES RESEARCH
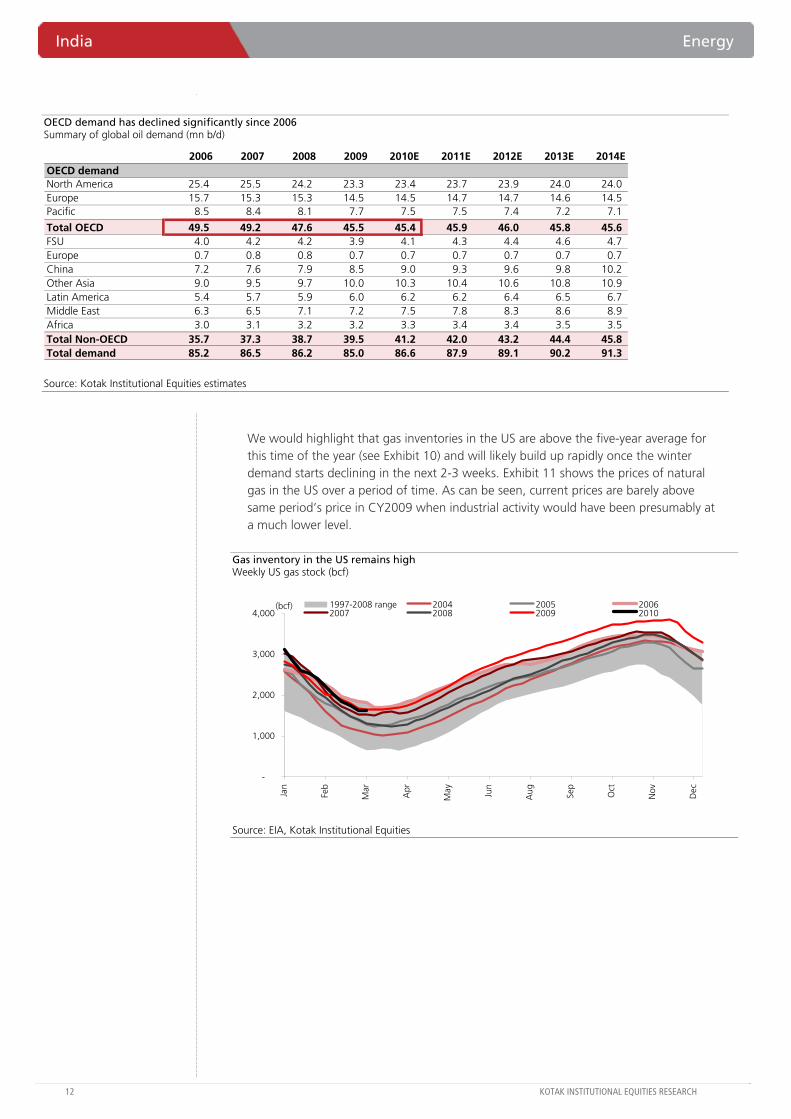
OECD demand has declined significantly since 2006 Summary of global oil demand (mn b/d)
2006 2007 2008 2009 2010E 2011E 2012E 2013E 2014EOECD demandNorth America 25.4 25.5 24.2 23.3 23.4 23.7 23.9 24.0 24.0 Europe 15.7 15.3 15.3 14.5 14.5 14.7 14.7 14.6 14.5 Pacific 8.5 8.4 8.1 7.7 7.5 7.5 7.4 7.2 7.1
Total OECD 49.5 49.2 47.6 45.5 45.4 45.9 46.0 45.8 45.6 FSU 4.0 4.2 4.2 3.9 4.1 4.3 4.4 4.6 4.7 Europe 0.7 0.8 0.8 0.7 0.7 0.7 0.7 0.7 0.7 China 7.2 7.6 7.9 8.5 9.0 9.3 9.6 9.8 10.2 Other Asia 9.0 9.5 9.7 10.0 10.3 10.4 10.6 10.8 10.9 Latin America 5.4 5.7 5.9 6.0 6.2 6.2 6.4 6.5 6.7 Middle East 6.3 6.5 7.1 7.2 7.5 7.8 8.3 8.6 8.9 Africa 3.0 3.1 3.2 3.2 3.3 3.4 3.4 3.5 3.5 Total Non-OECD 35.7 37.3 38.7 39.5 41.2 42.0 43.2 44.4 45.8 Total demand 85.2 86.5 86.2 85.0 86.6 87.9 89.1 90.2 91.3
Source: Kotak Institutional Equities estimates
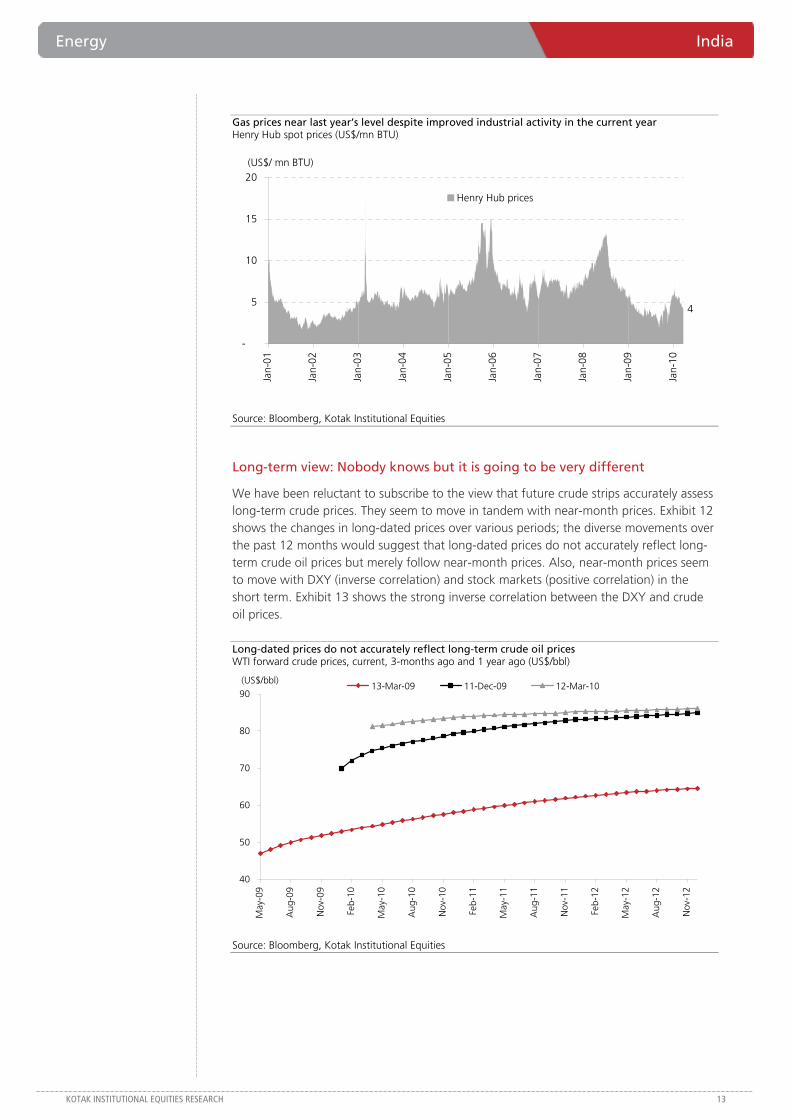
We would highlight that gas inventories in the US are above the five-year average for this time of the year (see Exhibit 10) and will likely build up rapidly once the winter demand starts declining in the next 2-3 weeks. Exhibit 11 shows the prices of natural gas in the US over a period of time. As can be seen, current prices are barely above same period’s price in CY2009 when industrial activity would have been presumably at a much lower level.
Gas inventory in the US remains high Weekly US gas stock (bcf)
-
1,000
2,000
3,000
4,000
Jan
Feb
Mar
Apr
May Jun
Aug Se
p
Oct
Nov
Dec
(bcf) 1997-2008 range 2004 2005 20062007 2008 2009 2010
Source: EIA, Kotak Institutional Equities
Energy India
KOTAK INSTITUTIONAL EQUITIES RESEARCH 13
Gas prices near last year’s level despite improved industrial activity in the current year Henry Hub spot prices (US$/mn BTU)
-
5
10
15
20
Jan-
01
Jan-
02
Jan-
03
Jan-
04
Jan-
05
Jan-
06
Jan-
07
Jan-
08
Jan-
09
Jan-
10
Henry Hub prices
4
(US$/ mn BTU)
Source: Bloomberg, Kotak Institutional Equities
Long-term view: Nobody knows but it is going to be very different
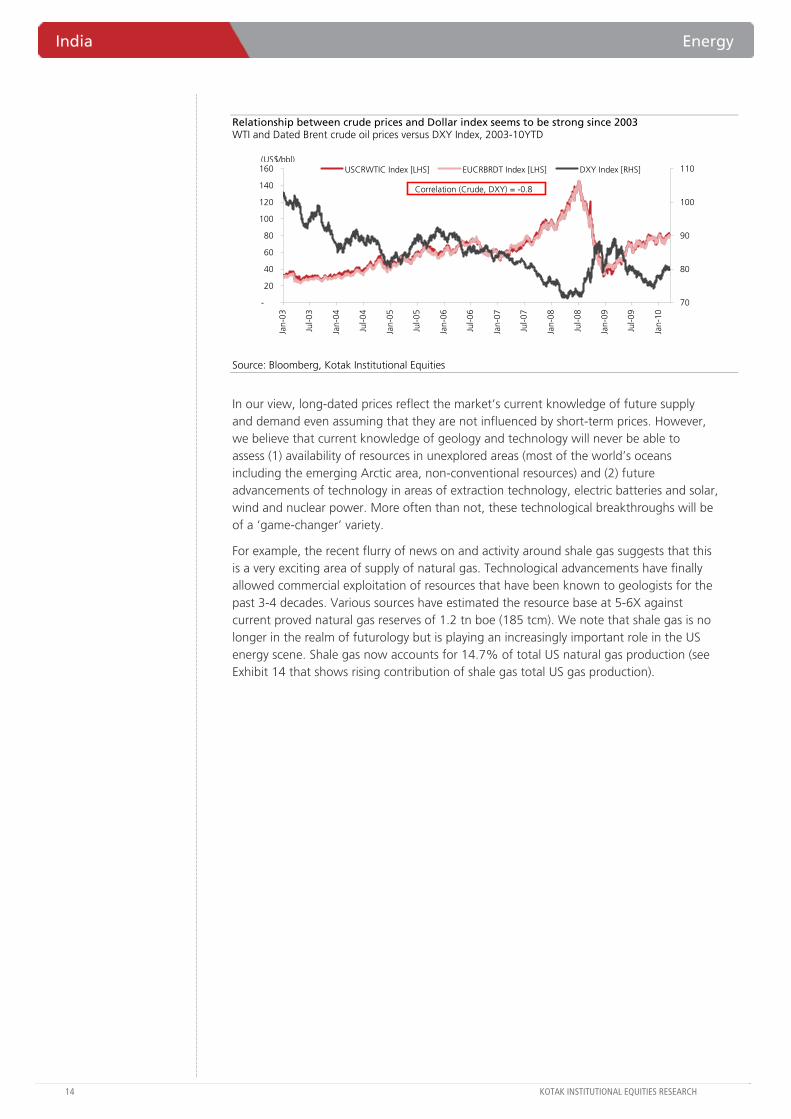
We have been reluctant to subscribe to the view that future crude strips accurately assess long-term crude prices. They seem to move in tandem with near-month prices. Exhibit 12 shows the changes in long-dated prices over various periods; the diverse movements over the past 12 months would suggest that long-dated prices do not accurately reflect long-term crude oil prices but merely follow near-month prices. Also, near-month prices seem to move with DXY (inverse correlation) and stock markets (positive correlation) in the short term. Exhibit 13 shows the strong inverse correlation between the DXY and crude oil prices.
Long-dated prices do not accurately reflect long-term crude oil prices WTI forward crude prices, current, 3-months ago and 1 year ago (US$/bbl)
40
50
60
70
80
90
May
-09
Aug
-09
Nov
-09
Feb-
10
May
-10
Aug
-10
Nov
-10
Feb-
11
May
-11
Aug
-11
Nov
-11
Feb-
12
May
-12
Aug
-12
Nov
-12
13-Mar-09 11-Dec-09 12-Mar-10(US$/bbl)
Source: Bloomberg, Kotak Institutional Equities
India Energy
14 KOTAK INSTITUTIONAL EQUITIES RESEARCH
Relationship between crude prices and Dollar index seems to be strong since 2003 WTI and Dated Brent crude oil prices versus DXY Index, 2003-10YTD
-
20
40
60
80
100
120
140
160
Jan-
03
Jul-0
3
Jan-
04
Jul-0
4
Jan-
05
Jul-0
5
Jan-
06
Jul-0
6
Jan-
07
Jul-0
7
Jan-
08
Jul-0
8
Jan-
09
Jul-0
9
Jan-
10
70
80
90
100
110USCRWTIC Index [LHS] EUCRBRDT Index [LHS] DXY Index [RHS]
Correlation (Crude, DXY) = -0.8
(US$/bbl)
Source: Bloomberg, Kotak Institutional Equities
In our view, long-dated prices reflect the market’s current knowledge of future supply and demand even assuming that they are not influenced by short-term prices. However, we believe that current knowledge of geology and technology will never be able to assess (1) availability of resources in unexplored areas (most of the world’s oceans including the emerging Arctic area, non-conventional resources) and (2) future advancements of technology in areas of extraction technology, electric batteries and solar, wind and nuclear power. More often than not, these technological breakthroughs will be of a ‘game-changer’ variety.
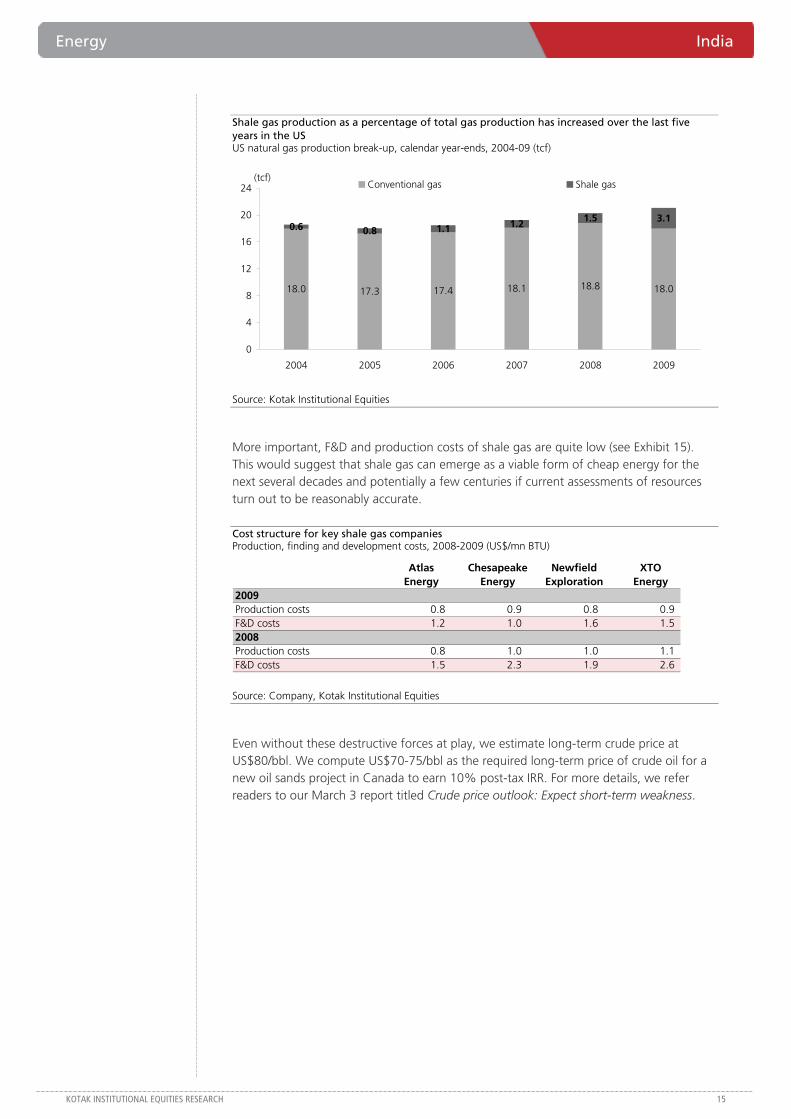
For example, the recent flurry of news on and activity around shale gas suggests that this is a very exciting area of supply of natural gas. Technological advancements have finally allowed commercial exploitation of resources that have been known to geologists for the past 3-4 decades. Various sources have estimated the resource base at 5-6X against current proved natural gas reserves of 1.2 tn boe (185 tcm). We note that shale gas is no longer in the realm of futurology but is playing an increasingly important role in the US energy scene. Shale gas now accounts for 14.7% of total US natural gas production (see Exhibit 14 that shows rising contribution of shale gas total US gas production).
Energy India
KOTAK INSTITUTIONAL EQUITIES RESEARCH 15
Shale gas production as a percentage of total gas production has increased over the last five years in the US US natural gas production break-up, calendar year-ends, 2004-09 (tcf)
18.0 17.3 17.4 18.1 18.8 18.0
0.6 0.8 1.1 1.2 1.5 3.1
0
4
8
12
16
20
24
2004 2005 2006 2007 2008 2009
Conventional gas Shale gas(tcf)
Source: Kotak Institutional Equities
More important, F&D and production costs of shale gas are quite low (see Exhibit 15). This would suggest that shale gas can emerge as a viable form of cheap energy for the next several decades and potentially a few centuries if current assessments of resources turn out to be reasonably accurate.
Cost structure for key shale gas companies Production, finding and development costs, 2008-2009 (US$/mn BTU)
Atlas Chesapeake Newfield XTOEnergy Energy Exploration Energy
2009Production costs 0.8 0.9 0.8 0.9 F&D costs 1.2 1.0 1.6 1.5 2008Production costs 0.8 1.0 1.0 1.1 F&D costs 1.5 2.3 1.9 2.6
Source: Company, Kotak Institutional Equities
Even without these destructive forces at play, we estimate long-term crude price at US$80/bbl. We compute US$70-75/bbl as the required long-term price of crude oil for a new oil sands project in Canada to earn 10% post-tax IRR. For more details, we refer readers to our March 3 report titled Crude price outlook: Expect short-term weakness.
For private Circulation Only. FOR IMPORTANT INFORMATION ABOUT KOTAK SECURITIES’ RATING SYSTEM AND OTHER DISCLOSURES, REFER TO THE END OF THIS MATERIAL.
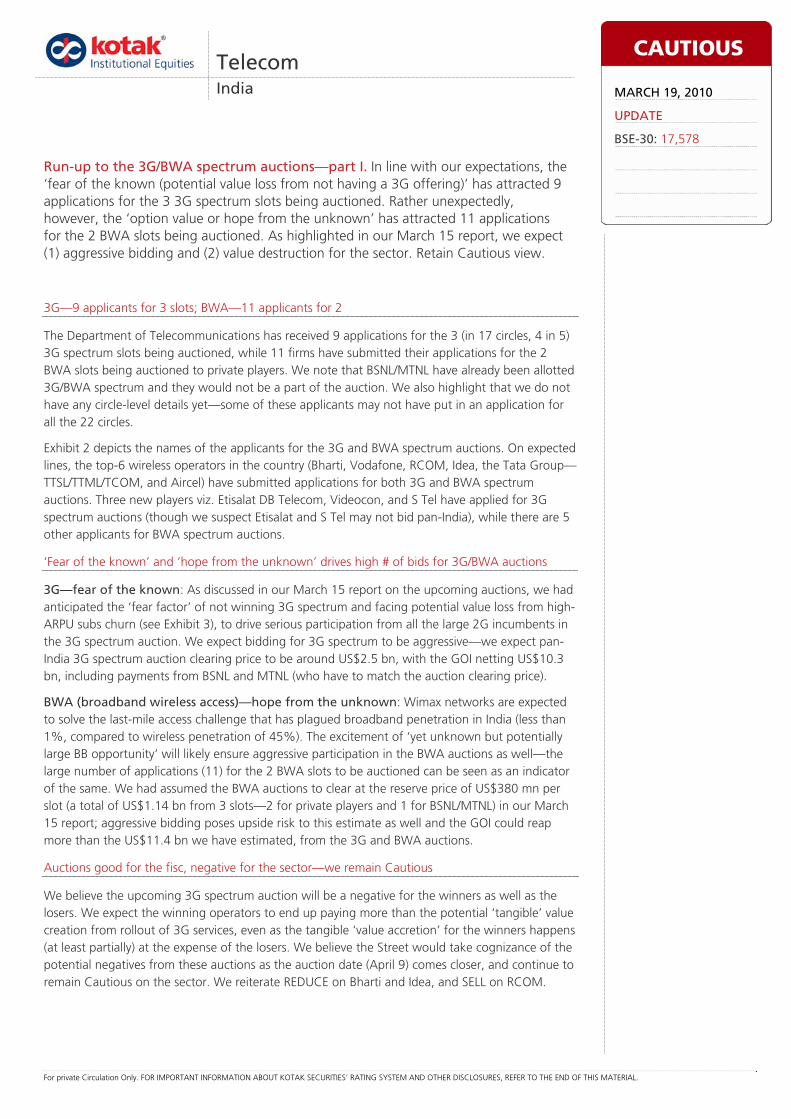
3G—9 applicants for 3 slots; BWA—11 applicants for 2
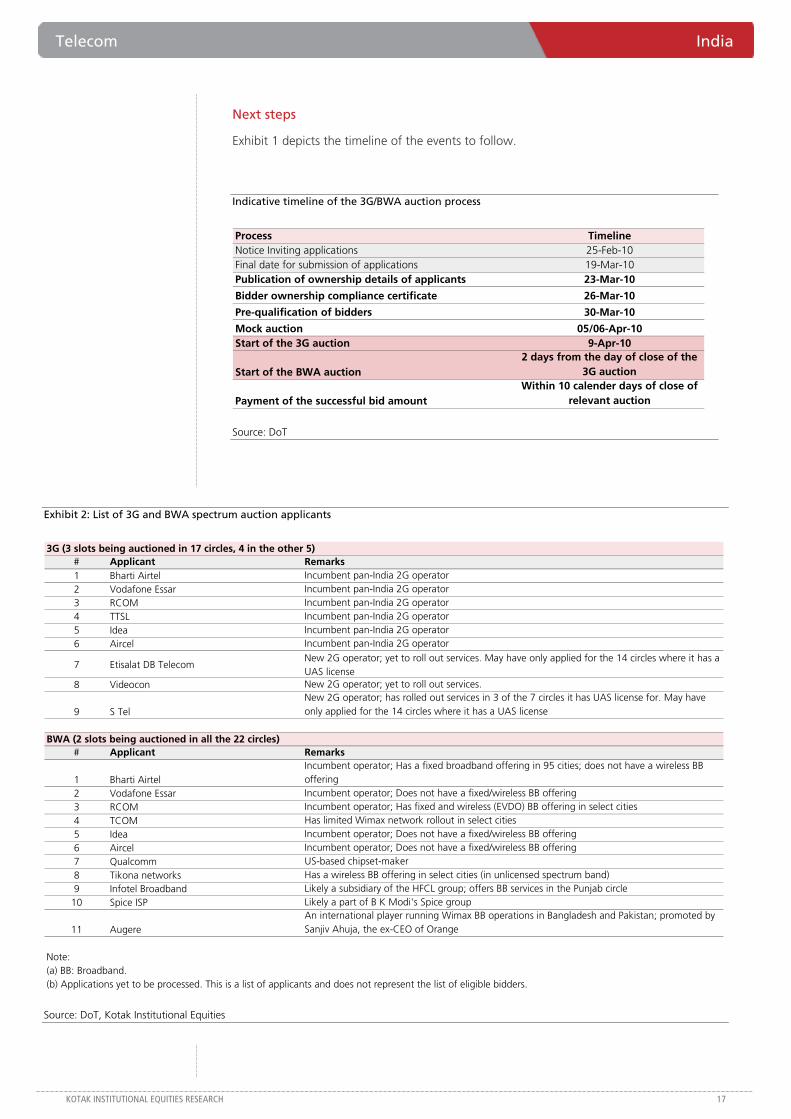
The Department of Telecommunications has received 9 applications for the 3 (in 17 circles, 4 in 5) 3G spectrum slots being auctioned, while 11 firms have submitted their applications for the 2 BWA slots being auctioned to private players. We note that BSNL/MTNL have already been allotted 3G/BWA spectrum and they would not be a part of the auction. We also highlight that we do not have any circle-level details yet—some of these applicants may not have put in an application for all the 22 circles.
Exhibit 2 depicts the names of the applicants for the 3G and BWA spectrum auctions. On expected lines, the top-6 wireless operators in the country (Bharti, Vodafone, RCOM, Idea, the Tata Group—TTSL/TTML/TCOM, and Aircel) have submitted applications for both 3G and BWA spectrum auctions. Three new players viz. Etisalat DB Telecom, Videocon, and S Tel have applied for 3G spectrum auctions (though we suspect Etisalat and S Tel may not bid pan-India), while there are 5 other applicants for BWA spectrum auctions.
‘Fear of the known’ and ‘hope from the unknown’ drives high # of bids for 3G/BWA auctions
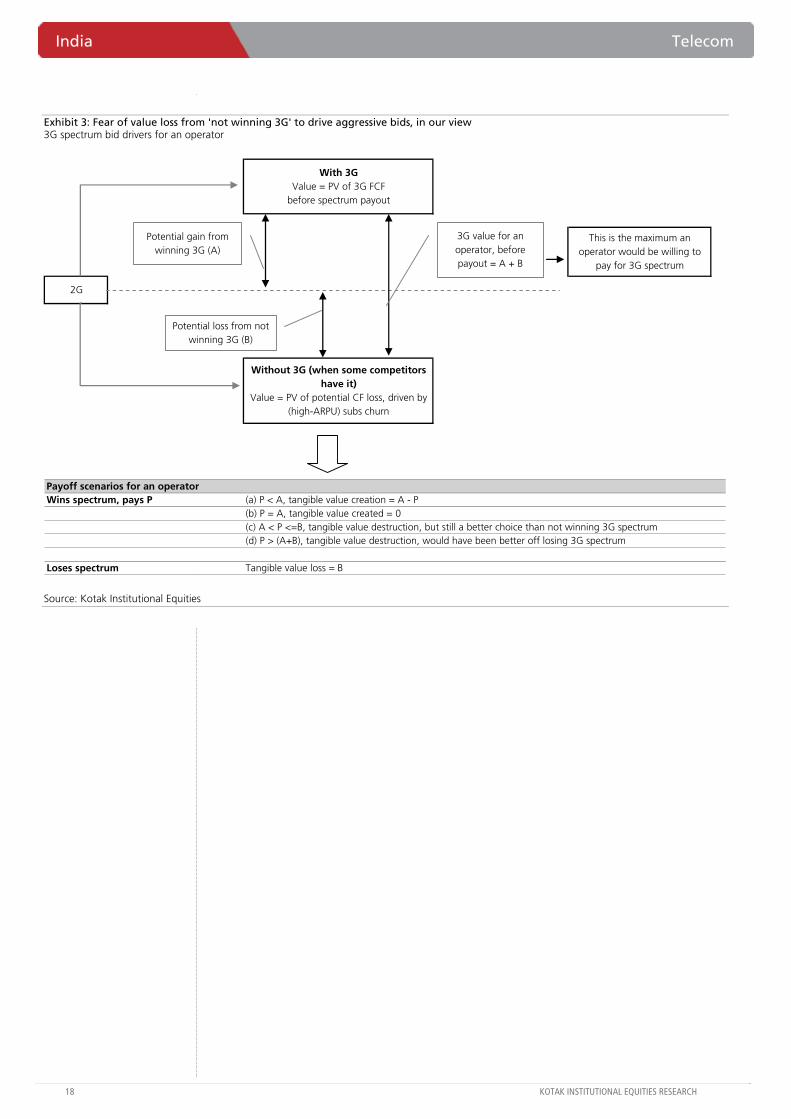
3G—fear of the known: As discussed in our March 15 report on the upcoming auctions, we had anticipated the ‘fear factor’ of not winning 3G spectrum and facing potential value loss from high-ARPU subs churn (see Exhibit 3), to drive serious participation from all the large 2G incumbents in the 3G spectrum auction. We expect bidding for 3G spectrum to be aggressive—we expect pan-India 3G spectrum auction clearing price to be around US$2.5 bn, with the GOI netting US$10.3 bn, including payments from BSNL and MTNL (who have to match the auction clearing price).
BWA (broadband wireless access)—hope from the unknown: Wimax networks are expected to solve the last-mile access challenge that has plagued broadband penetration in India (less than 1%, compared to wireless penetration of 45%). The excitement of ‘yet unknown but potentially large BB opportunity’ will likely ensure aggressive participation in the BWA auctions as well—the large number of applications (11) for the 2 BWA slots to be auctioned can be seen as an indicator of the same. We had assumed the BWA auctions to clear at the reserve price of US$380 mn per slot (a total of US$1.14 bn from 3 slots—2 for private players and 1 for BSNL/MTNL) in our March 15 report; aggressive bidding poses upside risk to this estimate as well and the GOI could reap more than the US$11.4 bn we have estimated, from the 3G and BWA auctions.
Auctions good for the fisc, negative for the sector—we remain Cautious
We believe the upcoming 3G spectrum auction will be a negative for the winners as well as the losers. We expect the winning operators to end up paying more than the potential ‘tangible’ value creation from rollout of 3G services, even as the tangible ‘value accretion’ for the winners happens (at least partially) at the expense of the losers. We believe the Street would take cognizance of the potential negatives from these auctions as the auction date (April 9) comes closer, and continue to remain Cautious on the sector. We reiterate REDUCE on Bharti and Idea, and SELL on RCOM.
Telecom India
Run-up to the 3G/BWA spectrum auctions—part I. In line with our expectations, the ‘fear of the known (potential value loss from not having a 3G offering)’ has attracted 9 applications for the 3 3G spectrum slots being auctioned. Rather unexpectedly, however, the ‘option value or hope from the unknown’ has attracted 11 applications for the 2 BWA slots being auctioned. As highlighted in our March 15 report, we expect (1) aggressive bidding and (2) value destruction for the sector. Retain Cautious view.
CAUTIOUS
MARCH 19, 2010
UPDATE
BSE-30: 17,578
Telecom India
KOTAK INSTITUTIONAL EQUITIES RESEARCH 17
Next steps
Exhibit 1 depicts the timeline of the events to follow.
Indicative timeline of the 3G/BWA auction process
Process TimelineNotice Inviting applications 25-Feb-10Final date for submission of applications 19-Mar-10Publication of ownership details of applicants 23-Mar-10
Bidder ownership compliance certificate 26-Mar-10
Pre-qualification of bidders 30-Mar-10
Mock auction 05/06-Apr-10Start of the 3G auction 9-Apr-10
Start of the BWA auction2 days from the day of close of the
3G auction
Payment of the successful bid amount Within 10 calender days of close of
relevant auction
Source: DoT
Exhibit 2: List of 3G and BWA spectrum auction applicants
3G (3 slots being auctioned in 17 circles, 4 in the other 5)# Applicant Remarks1 Bharti Airtel Incumbent pan-India 2G operator2 Vodafone Essar Incumbent pan-India 2G operator3 RCOM Incumbent pan-India 2G operator4 TTSL Incumbent pan-India 2G operator5 Idea Incumbent pan-India 2G operator6 Aircel Incumbent pan-India 2G operator
7 Etisalat DB TelecomNew 2G operator; yet to roll out services. May have only applied for the 14 circles where it has a UAS license
8 Videocon New 2G operator; yet to roll out services.
9 S TelNew 2G operator; has rolled out services in 3 of the 7 circles it has UAS license for. May have only applied for the 14 circles where it has a UAS license
BWA (2 slots being auctioned in all the 22 circles)# Applicant Remarks
1 Bharti AirtelIncumbent operator; Has a fixed broadband offering in 95 cities; does not have a wireless BB offering
2 Vodafone Essar Incumbent operator; Does not have a fixed/wireless BB offering3 RCOM Incumbent operator; Has fixed and wireless (EVDO) BB offering in select cities4 TCOM Has limited Wimax network rollout in select cities5 Idea Incumbent operator; Does not have a fixed/wireless BB offering6 Aircel Incumbent operator; Does not have a fixed/wireless BB offering7 Qualcomm US-based chipset-maker8 Tikona networks Has a wireless BB offering in select cities (in unlicensed spectrum band)9 Infotel Broadband Likely a subsidiary of the HFCL group; offers BB services in the Punjab circle
10 Spice ISP Likely a part of B K Modi's Spice group
11 AugereAn international player running Wimax BB operations in Bangladesh and Pakistan; promoted by Sanjiv Ahuja, the ex-CEO of Orange
Note:(a) BB: Broadband.(b) Applications yet to be processed. This is a list of applicants and does not represent the list of eligible bidders.
Source: DoT, Kotak Institutional Equities
India Telecom
18 KOTAK INSTITUTIONAL EQUITIES RESEARCH
Exhibit 3: Fear of value loss from 'not winning 3G' to drive aggressive bids, in our view 3G spectrum bid drivers for an operator
Payoff scenarios for an operatorWins spectrum, pays P (a) P < A, tangible value creation = A - P
(b) P = A, tangible value created = 0(c) A < P <=B, tangible value destruction, but still a better choice than not winning 3G spectrum(d) P > (A+B), tangible value destruction, would have been better off losing 3G spectrum
Loses spectrum Tangible value loss = B
Without 3G (when some competitors have it)
Value = PV of potential CF loss, driven by (high-ARPU) subs churn
2G
With 3GValue = PV of 3G FCF
before spectrum payout
This is the maximum an operator would be willing to
pay for 3G spectrum
Potential gain from winning 3G (A)
Potential loss from not winning 3G (B)
3G value for an operator, before payout = A + B
Source: Kotak Institutional Equities
Telecom India
KOTAK INSTITUTIONAL EQUITIES RESEARCH 19
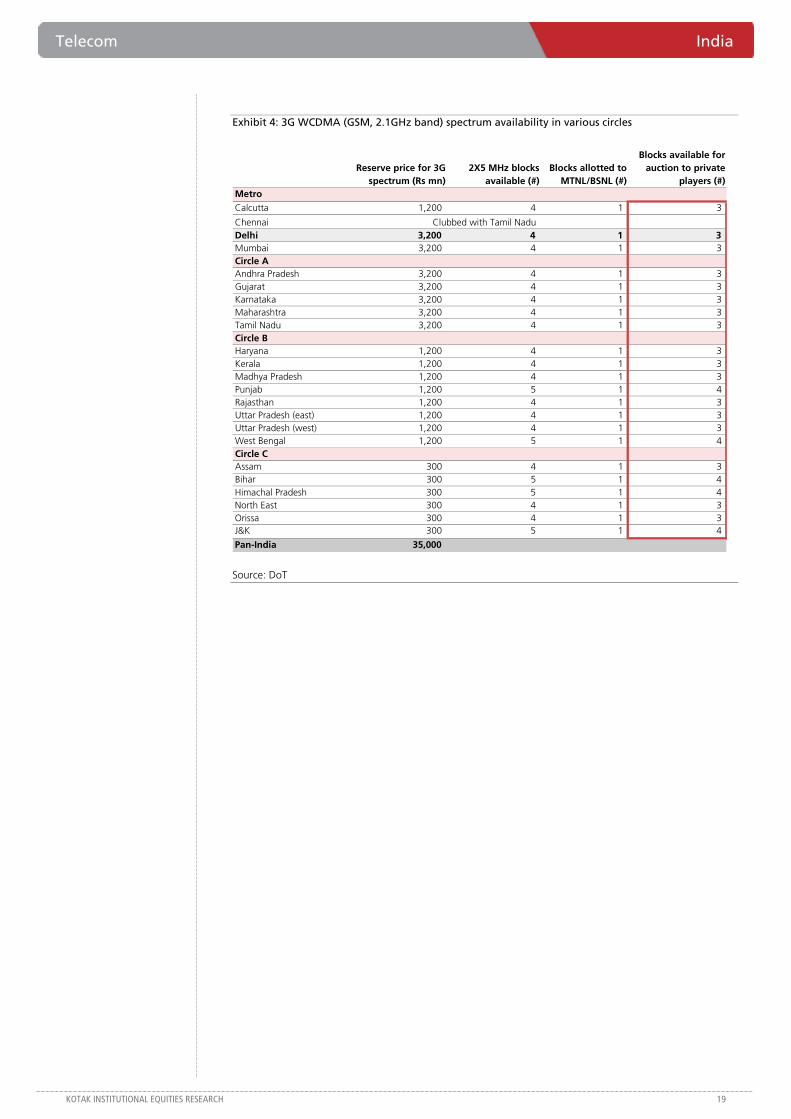
Exhibit 4: 3G WCDMA (GSM, 2.1GHz band) spectrum availability in various circles
Reserve price for 3G spectrum (Rs mn)
2X5 MHz blocks available (#)
Blocks allotted to MTNL/BSNL (#)
Blocks available for auction to private
players (#)MetroCalcutta 1,200 4 1 3
ChennaiDelhi 3,200 4 1 3 Mumbai 3,200 4 1 3 Circle AAndhra Pradesh 3,200 4 1 3 Gujarat 3,200 4 1 3 Karnataka 3,200 4 1 3 Maharashtra 3,200 4 1 3 Tamil Nadu 3,200 4 1 3 Circle BHaryana 1,200 4 1 3 Kerala 1,200 4 1 3 Madhya Pradesh 1,200 4 1 3 Punjab 1,200 5 1 4 Rajasthan 1,200 4 1 3 Uttar Pradesh (east) 1,200 4 1 3 Uttar Pradesh (west) 1,200 4 1 3 West Bengal 1,200 5 1 4 Circle CAssam 300 4 1 3 Bihar 300 5 1 4 Himachal Pradesh 300 5 1 4 North East 300 4 1 3 Orissa 300 4 1 3 J&K 300 5 1 4
Pan-India 35,000
Clubbed with Tamil Nadu
Source: DoT
India Telecom
20 KOTAK INSTITUTIONAL EQUITIES RESEARCH
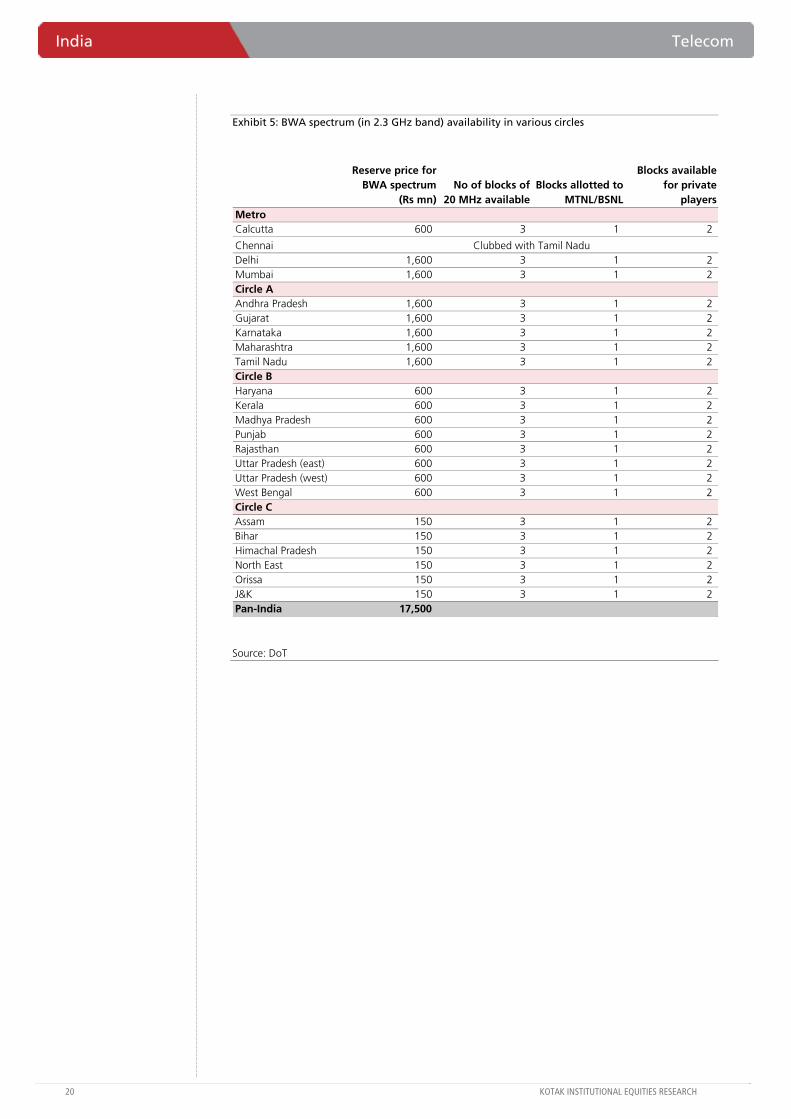
Exhibit 5: BWA spectrum (in 2.3 GHz band) availability in various circles
Reserve price for BWA spectrum
(Rs mn)No of blocks of
20 MHz availableBlocks allotted to
MTNL/BSNL
Blocks available for private
playersMetroCalcutta 600 3 1 2
ChennaiDelhi 1,600 3 1 2 Mumbai 1,600 3 1 2 Circle AAndhra Pradesh 1,600 3 1 2 Gujarat 1,600 3 1 2 Karnataka 1,600 3 1 2 Maharashtra 1,600 3 1 2 Tamil Nadu 1,600 3 1 2 Circle BHaryana 600 3 1 2 Kerala 600 3 1 2 Madhya Pradesh 600 3 1 2 Punjab 600 3 1 2 Rajasthan 600 3 1 2 Uttar Pradesh (east) 600 3 1 2 Uttar Pradesh (west) 600 3 1 2 West Bengal 600 3 1 2 Circle CAssam 150 3 1 2 Bihar 150 3 1 2 Himachal Pradesh 150 3 1 2 North East 150 3 1 2 Orissa 150 3 1 2 J&K 150 3 1 2 Pan-India 17,500
Clubbed with Tamil Nadu
Source: DoT
Telecom India
KOTAK INSTITUTIONAL EQUITIES RESEARCH 21
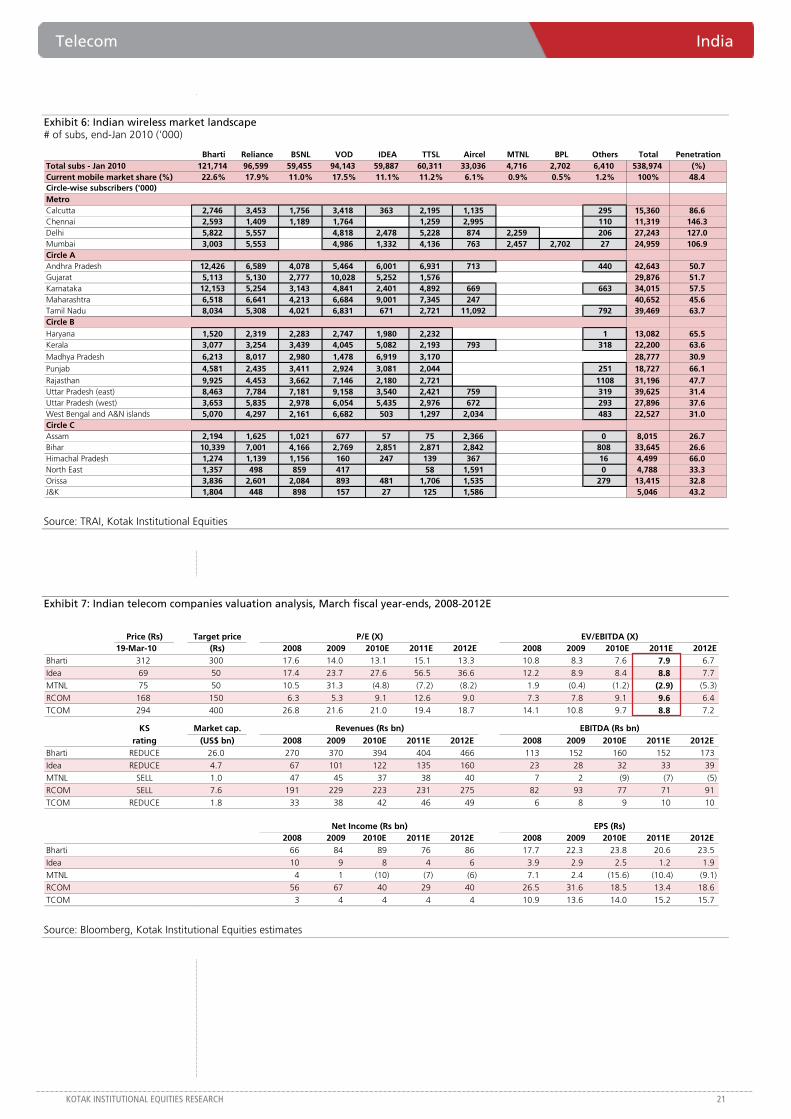
Exhibit 6: Indian wireless market landscape # of subs, end-Jan 2010 ('000)
Bharti Reliance BSNL VOD IDEA TTSL Aircel MTNL BPL Others Total PenetrationTotal subs - Jan 2010 121,714 96,599 59,455 94,143 59,887 60,311 33,036 4,716 2,702 6,410 538,974 (%)Current mobile market share (%) 22.6% 17.9% 11.0% 17.5% 11.1% 11.2% 6.1% 0.9% 0.5% 1.2% 100% 48.4Circle-wise subscribers ('000)MetroCalcutta 2,746 3,453 1,756 3,418 363 2,195 1,135 295 15,360 86.6Chennai 2,593 1,409 1,189 1,764 1,259 2,995 110 11,319 146.3Delhi 5,822 5,557 4,818 2,478 5,228 874 2,259 206 27,243 127.0Mumbai 3,003 5,553 4,986 1,332 4,136 763 2,457 2,702 27 24,959 106.9Circle AAndhra Pradesh 12,426 6,589 4,078 5,464 6,001 6,931 713 440 42,643 50.7Gujarat 5,113 5,130 2,777 10,028 5,252 1,576 29,876 51.7Karnataka 12,153 5,254 3,143 4,841 2,401 4,892 669 663 34,015 57.5Maharashtra 6,518 6,641 4,213 6,684 9,001 7,345 247 40,652 45.6Tamil Nadu 8,034 5,308 4,021 6,831 671 2,721 11,092 792 39,469 63.7Circle BHaryana 1,520 2,319 2,283 2,747 1,980 2,232 1 13,082 65.5Kerala 3,077 3,254 3,439 4,045 5,082 2,193 793 318 22,200 63.6Madhya Pradesh 6,213 8,017 2,980 1,478 6,919 3,170 28,777 30.9Punjab 4,581 2,435 3,411 2,924 3,081 2,044 251 18,727 66.1Rajasthan 9,925 4,453 3,662 7,146 2,180 2,721 1108 31,196 47.7Uttar Pradesh (east) 8,463 7,784 7,181 9,158 3,540 2,421 759 319 39,625 31.4Uttar Pradesh (west) 3,653 5,835 2,978 6,054 5,435 2,976 672 293 27,896 37.6West Bengal and A&N islands 5,070 4,297 2,161 6,682 503 1,297 2,034 483 22,527 31.0Circle CAssam 2,194 1,625 1,021 677 57 75 2,366 0 8,015 26.7Bihar 10,339 7,001 4,166 2,769 2,851 2,871 2,842 808 33,645 26.6Himachal Pradesh 1,274 1,139 1,156 160 247 139 367 16 4,499 66.0North East 1,357 498 859 417 58 1,591 0 4,788 33.3Orissa 3,836 2,601 2,084 893 481 1,706 1,535 279 13,415 32.8J&K 1,804 448 898 157 27 125 1,586 5,046 43.2
Source: TRAI, Kotak Institutional Equities
Exhibit 7: Indian telecom companies valuation analysis, March fiscal year-ends, 2008-2012E
Price (Rs) Target price P/E (X) EV/EBITDA (X)19-Mar-10 (Rs) 2008 2009 2010E 2011E 2012E 2008 2009 2010E 2011E 2012E
Bharti 312 300 17.6 14.0 13.1 15.1 13.3 10.8 8.3 7.6 7.9 6.7 Idea 69 50 17.4 23.7 27.6 56.5 36.6 12.2 8.9 8.4 8.8 7.7 MTNL 75 50 10.5 31.3 (4.8) (7.2) (8.2) 1.9 (0.4) (1.2) (2.9) (5.3) RCOM 168 150 6.3 5.3 9.1 12.6 9.0 7.3 7.8 9.1 9.6 6.4 TCOM 294 400 26.8 21.6 21.0 19.4 18.7 14.1 10.8 9.7 8.8 7.2
KS Market cap. Revenues (Rs bn) EBITDA (Rs bn)rating (US$ bn) 2008 2009 2010E 2011E 2012E 2008 2009 2010E 2011E 2012E
Bharti REDUCE 26.0 270 370 394 404 466 113 152 160 152 173 Idea REDUCE 4.7 67 101 122 135 160 23 28 32 33 39 MTNL SELL 1.0 47 45 37 38 40 7 2 (9) (7) (5) RCOM SELL 7.6 191 229 223 231 275 82 93 77 71 91 TCOM REDUCE 1.8 33 38 42 46 49 6 8 9 10 10
Net Income (Rs bn) EPS (Rs)2008 2009 2010E 2011E 2012E 2008 2009 2010E 2011E 2012E
Bharti 66 84 89 76 86 17.7 22.3 23.8 20.6 23.5 Idea 10 9 8 4 6 3.9 2.9 2.5 1.2 1.9 MTNL 4 1 (10) (7) (6) 7.1 2.4 (15.6) (10.4) (9.1) RCOM 56 67 40 29 40 26.5 31.6 18.5 13.4 18.6 TCOM 3 4 4 4 4 10.9 13.6 14.0 15.2 15.7
Source: Bloomberg, Kotak Institutional Equities estimates
For private Circulation Only. FOR IMPORTANT INFORMATION ABOUT KOTAK SECURITIES’ RATING SYSTEM AND OTHER DISCLOSURES, REFER TO THE END OF THIS MATERIAL.
Key trends that continue to benefit media industry—digitization and regionalization
Digitization continues to remain a positive driver for the media industry across segments whether C&S TV (DTH and digital cable) or films (Digital Cinema). Digitization has been instrumental in (1) expanding the reach of media industry in India, (2) helping remove the capacity bottlenecks, (3) improving the transparency levels and (4) improving the engagement level with the consumer given wider content choice and improved quality. The penetration of digital media in India continues at a fast pace with revenue traction for C&S broadcasters and distributors as well as film producers, distributors and exhibitors.
Regionalization also continues with advertisers (and media industry) willing to tap into semi-urban and rural markets with rising disposable income and changing consumption patterns (more discretionary spends). The untapped potential and latent demand is incrementally driving goods and services industries (telecom for example) and media platforms to these markets. However, we also caution that the extraordinary growth phase may normalize over time given (1) regionalization has been going on for almost 5-7 years now and (2) regional markets are high-volume but low-value markets and thus, with limited potential.
Key trends that have potentially exhausted their utility—consolidation phase may be over
The Indian media industry went through a phase of introspection and consolidation over the last one year given the slowdown in the Indian economy. Comprehensive cost control in the core business and closure of unviable businesses were the key drivers of the industry during this period. The players that were able to weather the downturn emerged stronger even as weak players exited the market. However, we believe the consolidation phase may be nearly over though we do not believe impending competition/expansion may be negative (unless it leads to severe fragmentation) given (1) focus on creativity and innovation (2) to help expand the market and (3) stronger players expanding in new markets.
Key trends that threaten the traditional media industry in India—convergence/new media
Even as we welcome the growth of new media—Internet and mobile—in India, we can’t help but notice (1) the resultant audience fragmentation and (2) the limited success of traditional media brands on new media. It is a peculiar catch-22 situation the traditional media industry finds itself in with (1) limited choice but to embrace new media as consumers do so but (2) lack of clear monetization models on new media and (3) limited success (8 of the top 10 websites in India are global, the 2 local websites are unprofitable) with investments so far. We do not expect new media to be a threat to traditional media in India for the near-to-medium term (3-10 years) given the growth potential for all media forms in India. However, these are issues the traditional media may do well to address sooner rather than later.
Media India
FICCI Frames 2010—industry sticks to the basics as growth accelerates. Continued realistic expectations were the key takeaway from FICCI Frames 2010, the flagship Indian media industry convention. Even as the industry recovers from the slowdown in CY2009, it was heartening to witness continued focus on the basics—(1) core business profitability, (2) monetization across revenue streams, (3) innovation and creativity as well as (4) renewed investment for profitable growth of media.
NEUTRAL
MARCH 19, 2010
UPDATE
BSE-30: 17,519
Media India
KOTAK INSTITUTIONAL EQUITIES RESEARCH 23
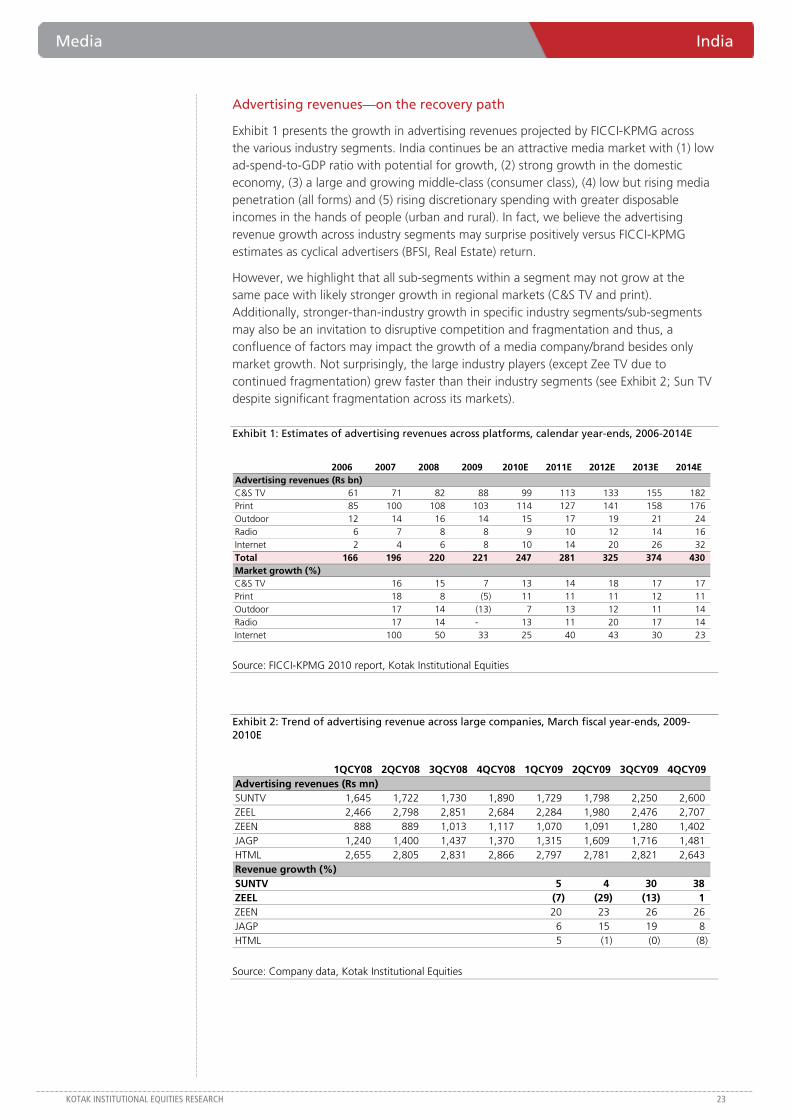
Advertising revenues—on the recovery path
Exhibit 1 presents the growth in advertising revenues projected by FICCI-KPMG across the various industry segments. India continues be an attractive media market with (1) low ad-spend-to-GDP ratio with potential for growth, (2) strong growth in the domestic economy, (3) a large and growing middle-class (consumer class), (4) low but rising media penetration (all forms) and (5) rising discretionary spending with greater disposable incomes in the hands of people (urban and rural). In fact, we believe the advertising revenue growth across industry segments may surprise positively versus FICCI-KPMG estimates as cyclical advertisers (BFSI, Real Estate) return.
However, we highlight that all sub-segments within a segment may not grow at the same pace with likely stronger growth in regional markets (C&S TV and print). Additionally, stronger-than-industry growth in specific industry segments/sub-segments may also be an invitation to disruptive competition and fragmentation and thus, a confluence of factors may impact the growth of a media company/brand besides only market growth. Not surprisingly, the large industry players (except Zee TV due to continued fragmentation) grew faster than their industry segments (see Exhibit 2; Sun TV despite significant fragmentation across its markets).
Exhibit 1: Estimates of advertising revenues across platforms, calendar year-ends, 2006-2014E
2006 2007 2008 2009 2010E 2011E 2012E 2013E 2014EAdvertising revenues (Rs bn)C&S TV 61 71 82 88 99 113 133 155 182 Print 85 100 108 103 114 127 141 158 176 Outdoor 12 14 16 14 15 17 19 21 24 Radio 6 7 8 8 9 10 12 14 16 Internet 2 4 6 8 10 14 20 26 32 Total 166 196 220 221 247 281 325 374 430 Market growth (%)C&S TV 16 15 7 13 14 18 17 17 Print 18 8 (5) 11 11 11 12 11 Outdoor 17 14 (13) 7 13 12 11 14 Radio 17 14 - 13 11 20 17 14 Internet 100 50 33 25 40 43 30 23
Source: FICCI-KPMG 2010 report, Kotak Institutional Equities
Exhibit 2: Trend of advertising revenue across large companies, March fiscal year-ends, 2009-2010E
1QCY08 2QCY08 3QCY08 4QCY08 1QCY09 2QCY09 3QCY09 4QCY09Advertising revenues (Rs mn)SUNTV 1,645 1,722 1,730 1,890 1,729 1,798 2,250 2,600 ZEEL 2,466 2,798 2,851 2,684 2,284 1,980 2,476 2,707 ZEEN 888 889 1,013 1,117 1,070 1,091 1,280 1,402 JAGP 1,240 1,400 1,437 1,370 1,315 1,609 1,716 1,481 HTML 2,655 2,805 2,831 2,866 2,797 2,781 2,821 2,643 Revenue growth (%)SUNTV 5 4 30 38 ZEEL (7) (29) (13) 1 ZEEN 20 23 26 26 JAGP 6 15 19 8 HTML 5 (1) (0) (8)
Source: Company data, Kotak Institutional Equities
India Media
24 KOTAK INSTITUTIONAL EQUITIES RESEARCH
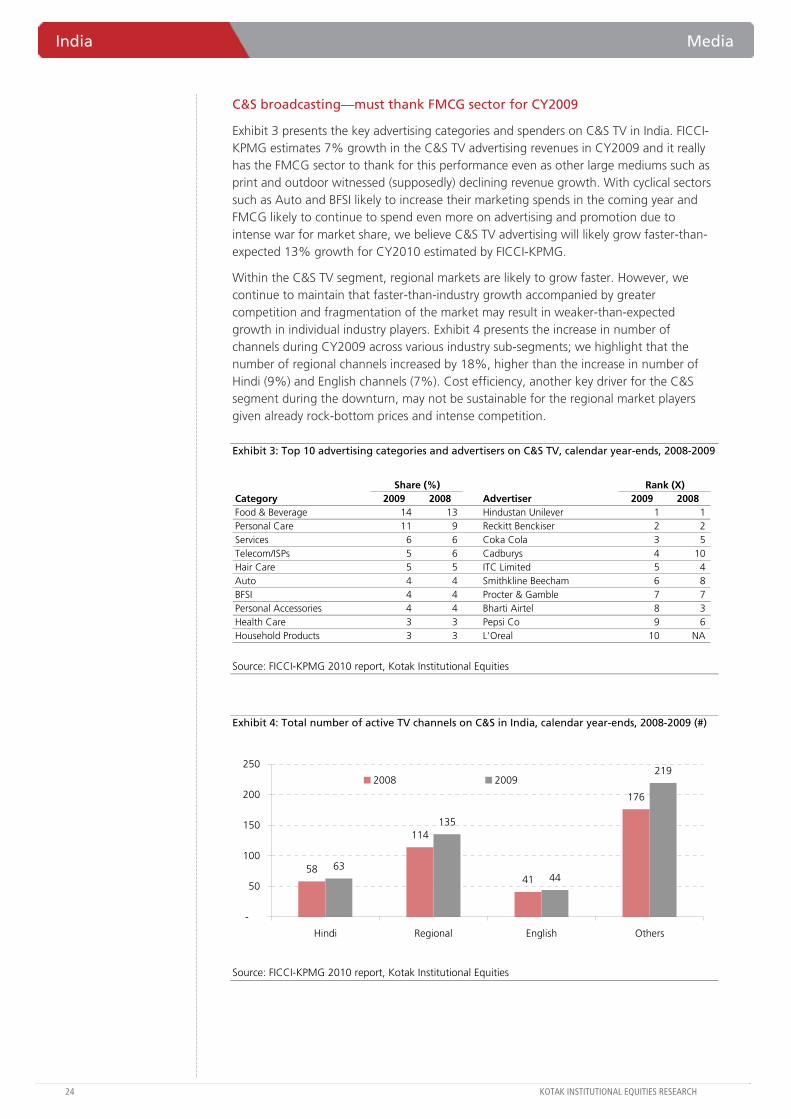
C&S broadcasting—must thank FMCG sector for CY2009
Exhibit 3 presents the key advertising categories and spenders on C&S TV in India. FICCI-KPMG estimates 7% growth in the C&S TV advertising revenues in CY2009 and it really has the FMCG sector to thank for this performance even as other large mediums such as print and outdoor witnessed (supposedly) declining revenue growth. With cyclical sectors such as Auto and BFSI likely to increase their marketing spends in the coming year and FMCG likely to continue to spend even more on advertising and promotion due to intense war for market share, we believe C&S TV advertising will likely grow faster-than-expected 13% growth for CY2010 estimated by FICCI-KPMG.
Within the C&S TV segment, regional markets are likely to grow faster. However, we continue to maintain that faster-than-industry growth accompanied by greater competition and fragmentation of the market may result in weaker-than-expected growth in individual industry players. Exhibit 4 presents the increase in number of channels during CY2009 across various industry sub-segments; we highlight that the number of regional channels increased by 18%, higher than the increase in number of Hindi (9%) and English channels (7%). Cost efficiency, another key driver for the C&S segment during the downturn, may not be sustainable for the regional market players given already rock-bottom prices and intense competition.
Exhibit 3: Top 10 advertising categories and advertisers on C&S TV, calendar year-ends, 2008-2009
Share (%) Rank (X)Category 2009 2008 Advertiser 2009 2008Food & Beverage 14 13 Hindustan Unilever 1 1 Personal Care 11 9 Reckitt Benckiser 2 2 Services 6 6 Coka Cola 3 5 Telecom/ISPs 5 6 Cadburys 4 10 Hair Care 5 5 ITC Limited 5 4 Auto 4 4 Smithkline Beecham 6 8 BFSI 4 4 Procter & Gamble 7 7 Personal Accessories 4 4 Bharti Airtel 8 3 Health Care 3 3 Pepsi Co 9 6 Household Products 3 3 L'Oreal 10 NA
Source: FICCI-KPMG 2010 report, Kotak Institutional Equities
Exhibit 4: Total number of active TV channels on C&S in India, calendar year-ends, 2008-2009 (#)
58
114
41
176
63
135
44
219
-
50
100
150
200
250
Hindi Regional English Others
2008 2009
Source: FICCI-KPMG 2010 report, Kotak Institutional Equities
Media India
KOTAK INSTITUTIONAL EQUITIES RESEARCH 25
C&S distribution—waiting for profitability as growth soars
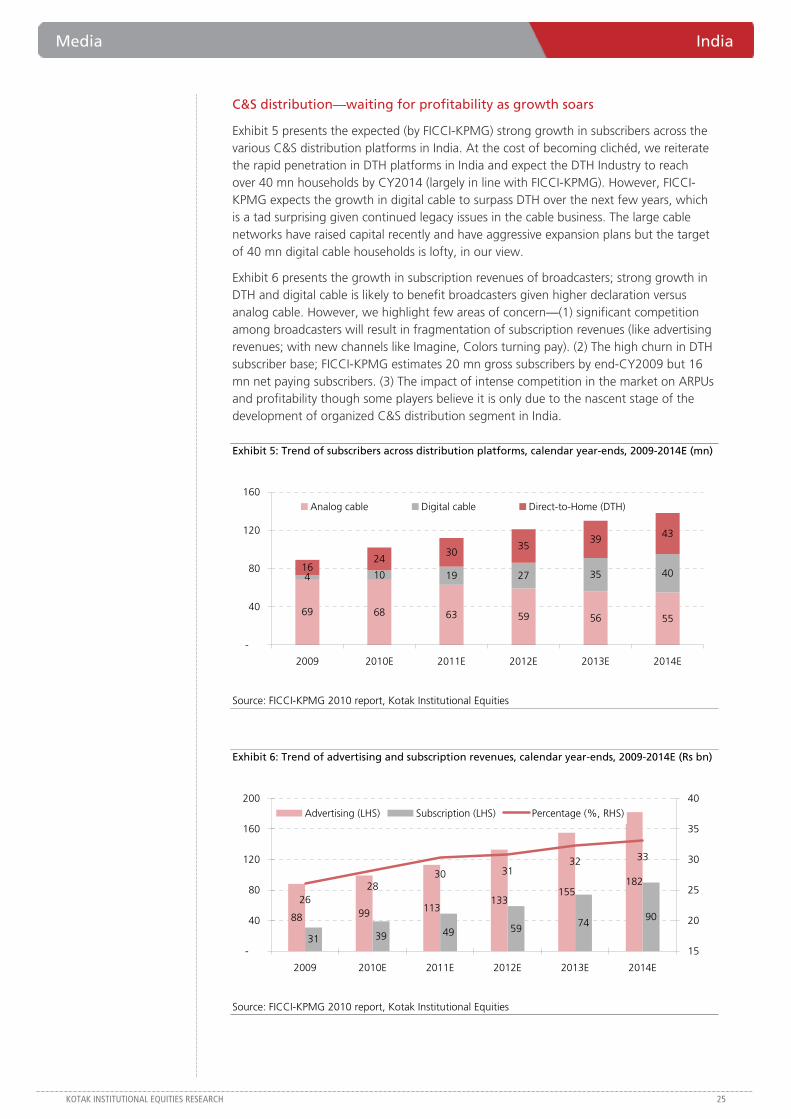
Exhibit 5 presents the expected (by FICCI-KPMG) strong growth in subscribers across the various C&S distribution platforms in India. At the cost of becoming clichéd, we reiterate the rapid penetration in DTH platforms in India and expect the DTH Industry to reach over 40 mn households by CY2014 (largely in line with FICCI-KPMG). However, FICCI-KPMG expects the growth in digital cable to surpass DTH over the next few years, which is a tad surprising given continued legacy issues in the cable business. The large cable networks have raised capital recently and have aggressive expansion plans but the target of 40 mn digital cable households is lofty, in our view.
Exhibit 6 presents the growth in subscription revenues of broadcasters; strong growth in DTH and digital cable is likely to benefit broadcasters given higher declaration versus analog cable. However, we highlight few areas of concern—(1) significant competition among broadcasters will result in fragmentation of subscription revenues (like advertising revenues; with new channels like Imagine, Colors turning pay). (2) The high churn in DTH subscriber base; FICCI-KPMG estimates 20 mn gross subscribers by end-CY2009 but 16 mn net paying subscribers. (3) The impact of intense competition in the market on ARPUs and profitability though some players believe it is only due to the nascent stage of the development of organized C&S distribution segment in India.
Exhibit 5: Trend of subscribers across distribution platforms, calendar year-ends, 2009-2014E (mn)
69 68 63 59 56 55
4 10 19 27 35 401624
3035
39 43
-
40
80
120
160
2009 2010E 2011E 2012E 2013E 2014E
Analog cable Digital cable Direct-to-Home (DTH)
Source: FICCI-KPMG 2010 report, Kotak Institutional Equities
Exhibit 6: Trend of advertising and subscription revenues, calendar year-ends, 2009-2014E (Rs bn)
88 99 113133
155182
31 39 49 59 7490
2628
30 3132 33
-
40
80
120
160
200
2009 2010E 2011E 2012E 2013E 2014E
15
20
25
30
35
40Advertising (LHS) Subscription (LHS) Percentage (%, RHS)
Source: FICCI-KPMG 2010 report, Kotak Institutional Equities
India Media
26 KOTAK INSTITUTIONAL EQUITIES RESEARCH
Print—Regional (including Hindi) in limelight as English suffers
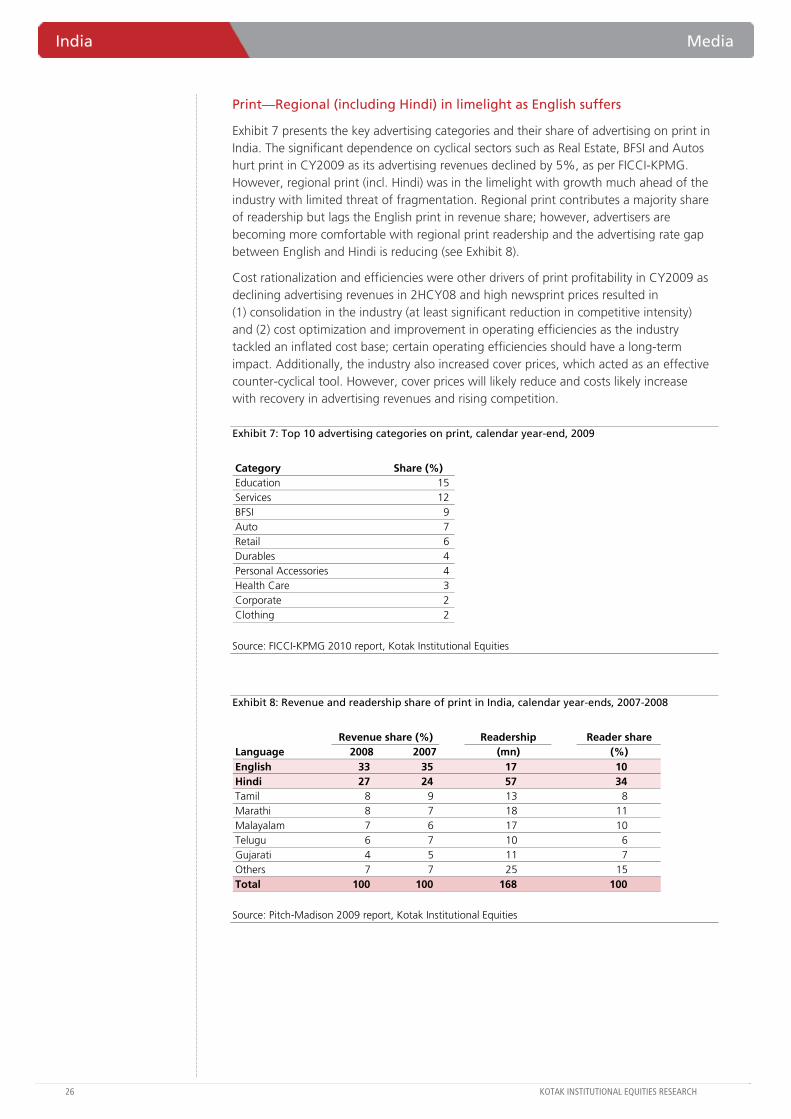
Exhibit 7 presents the key advertising categories and their share of advertising on print in India. The significant dependence on cyclical sectors such as Real Estate, BFSI and Autos hurt print in CY2009 as its advertising revenues declined by 5%, as per FICCI-KPMG. However, regional print (incl. Hindi) was in the limelight with growth much ahead of the industry with limited threat of fragmentation. Regional print contributes a majority share of readership but lags the English print in revenue share; however, advertisers are becoming more comfortable with regional print readership and the advertising rate gap between English and Hindi is reducing (see Exhibit 8).
Cost rationalization and efficiencies were other drivers of print profitability in CY2009 as declining advertising revenues in 2HCY08 and high newsprint prices resulted in (1) consolidation in the industry (at least significant reduction in competitive intensity) and (2) cost optimization and improvement in operating efficiencies as the industry tackled an inflated cost base; certain operating efficiencies should have a long-term impact. Additionally, the industry also increased cover prices, which acted as an effective counter-cyclical tool. However, cover prices will likely reduce and costs likely increase with recovery in advertising revenues and rising competition.
Exhibit 7: Top 10 advertising categories on print, calendar year-end, 2009
Category Share (%)Education 15 Services 12 BFSI 9 Auto 7 Retail 6 Durables 4 Personal Accessories 4 Health Care 3 Corporate 2 Clothing 2
Source: FICCI-KPMG 2010 report, Kotak Institutional Equities
Exhibit 8: Revenue and readership share of print in India, calendar year-ends, 2007-2008
Revenue share (%) Readership Reader shareLanguage 2008 2007 (mn) (%)English 33 35 17 10 Hindi 27 24 57 34 Tamil 8 9 13 8 Marathi 8 7 18 11 Malayalam 7 6 17 10 Telugu 6 7 10 6 Gujarati 4 5 11 7 Others 7 7 25 15 Total 100 100 168 100
Source: Pitch-Madison 2009 report, Kotak Institutional Equities
Media India
KOTAK INSTITUTIONAL EQUITIES RESEARCH 27
Films—strong beginning post forgettable CY2009
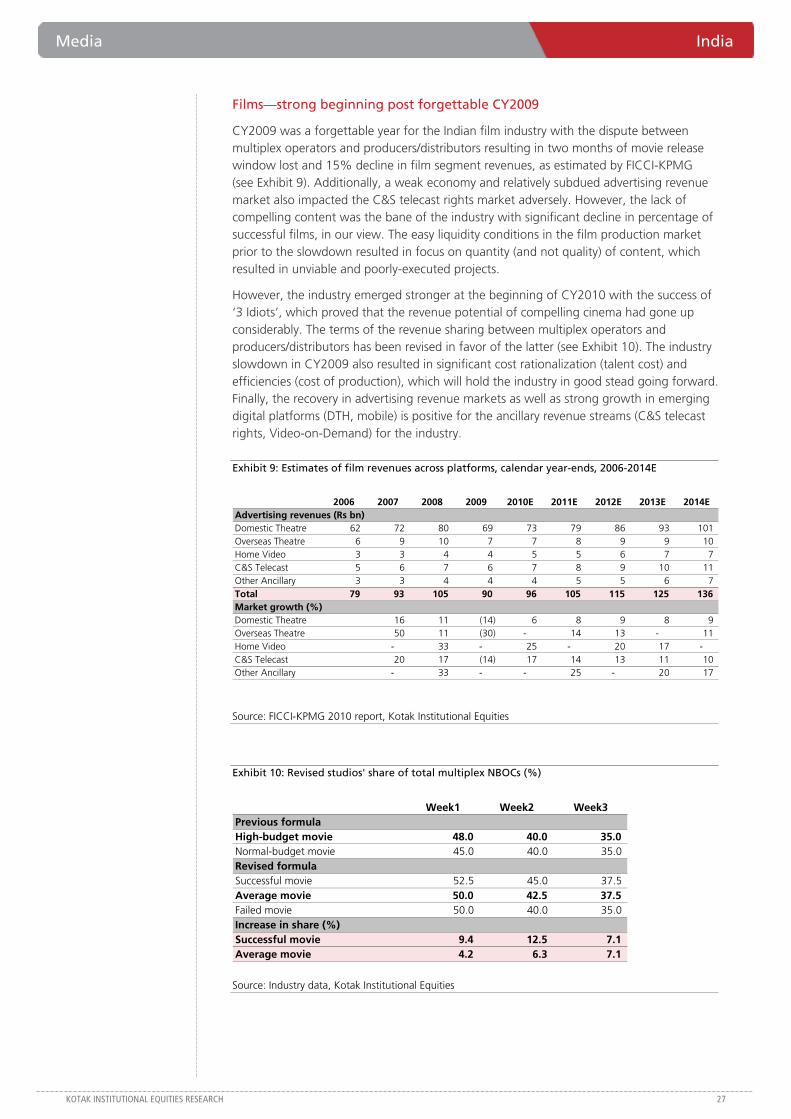
CY2009 was a forgettable year for the Indian film industry with the dispute between multiplex operators and producers/distributors resulting in two months of movie release window lost and 15% decline in film segment revenues, as estimated by FICCI-KPMG (see Exhibit 9). Additionally, a weak economy and relatively subdued advertising revenue market also impacted the C&S telecast rights market adversely. However, the lack of compelling content was the bane of the industry with significant decline in percentage of successful films, in our view. The easy liquidity conditions in the film production market prior to the slowdown resulted in focus on quantity (and not quality) of content, which resulted in unviable and poorly-executed projects.
However, the industry emerged stronger at the beginning of CY2010 with the success of ‘3 Idiots’, which proved that the revenue potential of compelling cinema had gone up considerably. The terms of the revenue sharing between multiplex operators and producers/distributors has been revised in favor of the latter (see Exhibit 10). The industry slowdown in CY2009 also resulted in significant cost rationalization (talent cost) and efficiencies (cost of production), which will hold the industry in good stead going forward. Finally, the recovery in advertising revenue markets as well as strong growth in emerging digital platforms (DTH, mobile) is positive for the ancillary revenue streams (C&S telecast rights, Video-on-Demand) for the industry.
Exhibit 9: Estimates of film revenues across platforms, calendar year-ends, 2006-2014E
2006 2007 2008 2009 2010E 2011E 2012E 2013E 2014EAdvertising revenues (Rs bn)Domestic Theatre 62 72 80 69 73 79 86 93 101 Overseas Theatre 6 9 10 7 7 8 9 9 10 Home Video 3 3 4 4 5 5 6 7 7 C&S Telecast 5 6 7 6 7 8 9 10 11 Other Ancillary 3 3 4 4 4 5 5 6 7 Total 79 93 105 90 96 105 115 125 136 Market growth (%)Domestic Theatre 16 11 (14) 6 8 9 8 9 Overseas Theatre 50 11 (30) - 14 13 - 11 Home Video - 33 - 25 - 20 17 - C&S Telecast 20 17 (14) 17 14 13 11 10 Other Ancillary - 33 - - 25 - 20 17
Source: FICCI-KPMG 2010 report, Kotak Institutional Equities
Exhibit 10: Revised studios' share of total multiplex NBOCs (%)
Week1 Week2 Week3Previous formulaHigh-budget movie 48.0 40.0 35.0 Normal-budget movie 45.0 40.0 35.0 Revised formulaSuccessful movie 52.5 45.0 37.5 Average movie 50.0 42.5 37.5 Failed movie 50.0 40.0 35.0 Increase in share (%)Successful movie 9.4 12.5 7.1 Average movie 4.2 6.3 7.1
Source: Industry data, Kotak Institutional Equities
India Media
28 KOTAK INSTITUTIONAL EQUITIES RESEARCH
Internet—threat or opportunity?
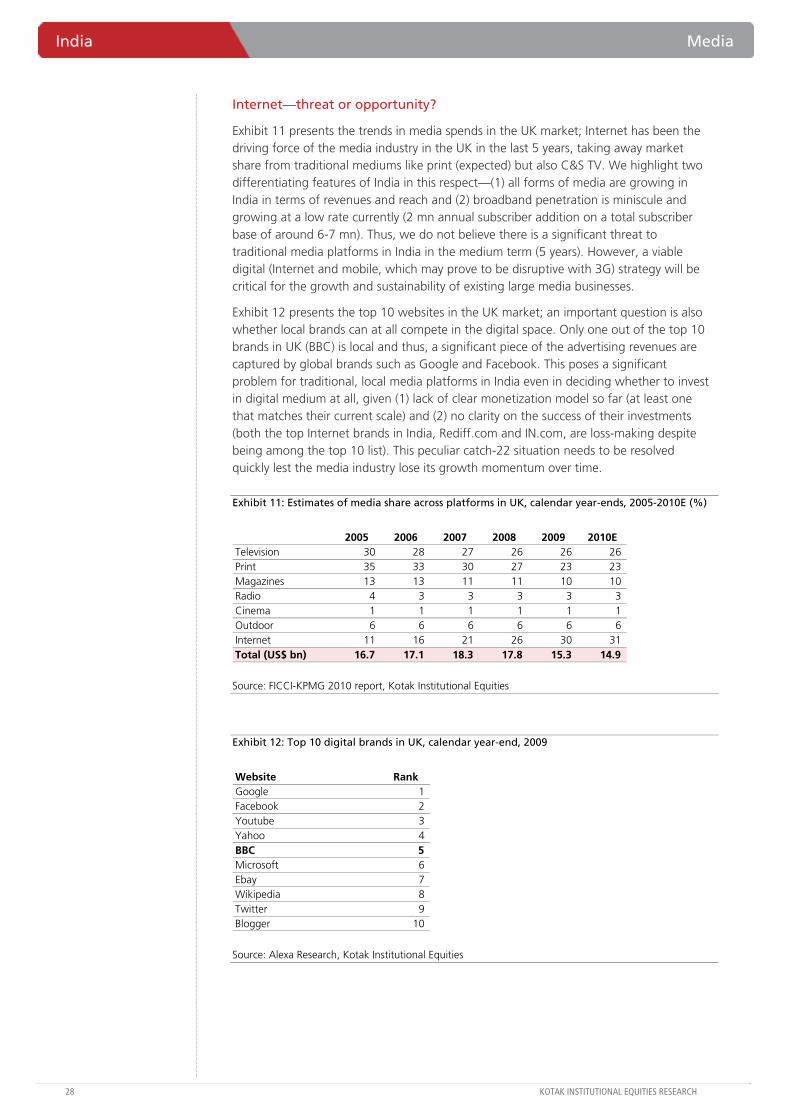
Exhibit 11 presents the trends in media spends in the UK market; Internet has been the driving force of the media industry in the UK in the last 5 years, taking away market share from traditional mediums like print (expected) but also C&S TV. We highlight two differentiating features of India in this respect—(1) all forms of media are growing in India in terms of revenues and reach and (2) broadband penetration is miniscule and growing at a low rate currently (2 mn annual subscriber addition on a total subscriber base of around 6-7 mn). Thus, we do not believe there is a significant threat to traditional media platforms in India in the medium term (5 years). However, a viable digital (Internet and mobile, which may prove to be disruptive with 3G) strategy will be critical for the growth and sustainability of existing large media businesses.
Exhibit 12 presents the top 10 websites in the UK market; an important question is also whether local brands can at all compete in the digital space. Only one out of the top 10 brands in UK (BBC) is local and thus, a significant piece of the advertising revenues are captured by global brands such as Google and Facebook. This poses a significant problem for traditional, local media platforms in India even in deciding whether to invest in digital medium at all, given (1) lack of clear monetization model so far (at least one that matches their current scale) and (2) no clarity on the success of their investments (both the top Internet brands in India, Rediff.com and IN.com, are loss-making despite being among the top 10 list). This peculiar catch-22 situation needs to be resolved quickly lest the media industry lose its growth momentum over time.
Exhibit 11: Estimates of media share across platforms in UK, calendar year-ends, 2005-2010E (%)
2005 2006 2007 2008 2009 2010ETelevision 30 28 27 26 26 26 Print 35 33 30 27 23 23 Magazines 13 13 11 11 10 10 Radio 4 3 3 3 3 3 Cinema 1 1 1 1 1 1 Outdoor 6 6 6 6 6 6 Internet 11 16 21 26 30 31 Total (US$ bn) 16.7 17.1 18.3 17.8 15.3 14.9
Source: FICCI-KPMG 2010 report, Kotak Institutional Equities
Exhibit 12: Top 10 digital brands in UK, calendar year-end, 2009
Website RankGoogle 1 Facebook 2 Youtube 3 Yahoo 4 BBC 5 Microsoft 6 Ebay 7 Wikipedia 8 Twitter 9 Blogger 10
Source: Alexa Research, Kotak Institutional Equities

In
dia D
aily Sum
mary - M
arch 22, 2010
29
KOTAK IN
STITUTIO
NAL EQ
UITIES RESEARCH
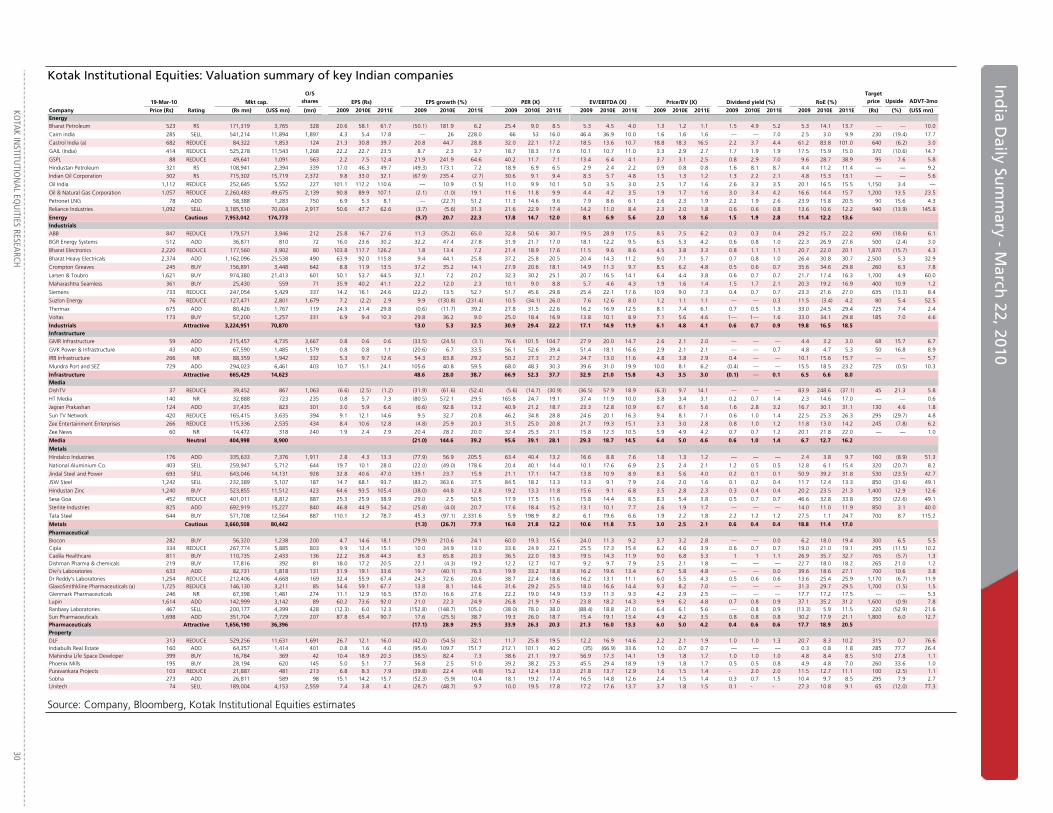
Kotak Institutional Equities: Valuation summary of key Indian companies
19-Mar-10 Mkt cap.
O/S shares EPS (Rs) EPS growth (%) PER (X)
Company Price (Rs) Rating (Rs mn) (US$ mn) (mn) 2009 2010E 2011E 2009 2010E 2011E 2009 2010E 2011EAutomobilesAshok Leyland 54 ADD 71,905 1,580 1,330 1.5 3.1 3.9 (57.8) 105.8 24.5 35.3 17.2 13.8
Bajaj Auto 1,865 ADD 269,820 5,929 145 45.2 110.7 137.9 (13.4) 144.8 24.5 41.2 16.8 13.5
Hero Honda 1,968 SELL 393,050 8,638 200 64.2 108.3 121.5 32.4 68.8 12.1 30.7 18.2 16.2
Mahindra & Mahindra 1,073 ADD 316,391 6,953 295 30.0 64.4 72.7 (19.8) 114.5 12.8 35.8 16.7 14.8
Maruti Suzuki 1,429 REDUCE 413,068 9,077 289 42.2 85.1 90.9 (29.6) 101.7 6.9 33.9 16.8 15.7
Tata Motors 784 ADD 447,667 9,838 571 10.0 26.3 30.1 (78.2) 162.7 14.4 78.2 29.8 26.0
Automobiles Cautious 1,911,900 42,015 (30.7) 115.2 14.3 41.0 19.0 16.7 Banks/Financial InstitutionsAndhra Bank 101 BUY 48,743 1,071 485 13.5 19.4 14.7 13.5 44.1 (24.4) 7.5 5.2 6.8
Axis Bank 1,156 ADD 439,288 9,654 380 50.6 63.3 74.5 56.9 25.1 17.7 22.9 18.3 15.5
Bank of Baroda 615 BUY 224,891 4,942 366 60.9 75.0 77.2 55.1 23.1 2.9 10.1 8.2 8.0
Bank of India 326 REDUCE 171,632 3,772 526 57.2 38.9 47.8 40.7 (32.0) 22.9 5.7 8.4 6.8
Canara Bank 408 ADD 167,178 3,674 410 50.5 75.2 69.7 32.4 48.8 (7.3) 8.1 5.4 5.9
Corporation Bank 443 BUY 63,486 1,395 143 62.3 71.1 65.0 21.5 14.1 (8.5) 7.1 6.2 6.8
Federal Bank 258 BUY 44,058 968 171 29.3 30.6 38.0 (14.8) 4.5 24.1 8.8 8.4 6.8
HDFC 2,694 ADD 766,436 16,843 284 80.2 98.5 115.4 (6.4) 22.7 17.2 33.6 27.4 23.3
HDFC Bank 1,820 BUY 822,679 18,079 452 52.8 64.8 84.4 17.6 22.8 30.2 34.5 28.1 21.6
ICICI Bank 957 REDUCE 1,064,917 23,402 1,113 33.8 37.3 47.0 (15.4) 10.6 26.0 28.3 25.6 20.3
IDFC 164 REDUCE 212,879 4,678 1,295 5.8 8.4 9.1 1.9 45.4 8.0 28.4 19.5 18.1
India Infoline 121 BUY 37,634 827 312 5.1 7.7 9.2 (8.7) 50.4 19.2 23.6 15.7 13.2
Indian Bank 171 BUY 73,512 1,615 430 28.0 34.2 34.7 24.1 22.4 1.4 6.1 5.0 4.9
Indian Overseas Bank 89 BUY 48,215 1,060 545 24.3 22.7 13.3 10.3 (6.9) (41.1) 3.6 3.9 6.6
J&K Bank 662 BUY 32,085 705 48 84.5 105.5 112.3 13.8 24.8 6.4 7.8 6.3 5.9
LIC Housing Finance 818 ADD 73,617 1,618 90 62.5 82.6 77.4 37.3 32.0 (6.2) 13.1 9.9 10.6
Mahindra & Mahindra Financial 369 BUY 35,328 776 96 22.4 31.9 37.2 7.5 42.2 16.5 16.5 11.6 9.9
Oriental Bank of Commerce 296 REDUCE 74,072 1,628 251 36.1 41.3 47.7 51.4 14.3 15.5 8.2 7.2 6.2
PFC 259 SELL 297,330 6,534 1,148 13.3 19.7 21.4 17.4 47.7 8.6 19.4 13.2 12.1
Punjab National Bank 962 BUY 303,384 6,667 315 98.0 116.4 124.7 50.9 18.7 7.2 9.8 8.3 7.7
Reliance Capital 795 ADD 195,660 4,300 246 39.3 17.7 17.5 (5.6) (55.1) (1.1) 20.2 45.0 45.5
Shriram Transport 507 ADD 117,414 2,580 232 30.1 36.6 48.3 56.7 21.6 32.0 16.9 13.9 10.5
SREI 72 NR 8,379 184 116 7.0 8.3 7.9 (24.7) 17.8 (4.8) 10.2 8.7 9.1
State Bank of India 2,058 BUY 1,306,869 28,719 635 143.7 154.8 174.4 34.8 7.7 12.7 14.3 13.3 11.8
Union Bank 273 BUY 137,746 3,027 505 34.2 37.9 38.7 24.5 11.0 2.0 8.0 7.2 7.0
Banks/Financial Institutions Attractive 6,981,952 153,433 27.0 15.3 10.4 16.0 13.9 12.6 CementACC 979 SELL 183,859 4,040 188 56.3 83.2 53.2 (12.2) 47.9 (36.1) 17.4 11.8 18.4 Ambuja Cements 119 SELL 180,706 3,971 1,522 7.2 8.0 6.9 (5.0) 11.4 (13.5) 16.5 14.8 17.2 Grasim Industries 2,914 REDUCE 267,148 5,871 92 238.6 297.3 289.2 (16.2) 24.6 (2.7) 12.2 9.8 10.1
India Cements 128 SELL 36,024 792 282 17.8 13.7 12.4 n/a (23.1) (9.1) 7.2 9.3 10.3
Shree Cement 2,241 BUY 78,082 1,716 35 174.8 267.3 228.9 93.8 52.9 (14.4) 12.8 8.4 9.8
UltraTech Cement 1,122 SELL 139,734 3,071 124 78.8 90.1 64.5 (3.1) 14.3 (28.4) 14.2 12.5 17.4
Cement Neutral 885,553 19,461 (8.0) 23.6 (16.2) 13.8 11.1 13.3 Consumer productsAsian Paints 1,994 BUY 191,302 4,204 96 38.6 72.9 83.4 (1.7) 88.8 14.4 51.7 27.4 23.9 Colgate-Palmolive (India) 715 REDUCE 97,174 2,135 136 21.6 29.4 33.4 26.3 36.2 13.8 33.1 24.3 21.4 Dabur India 164 BUY 142,159 3,124 866 4.5 5.8 7.0 17.0 27.6 21.2 36.3 28.4 23.5 GlaxoSmithkline Consumer (a) 1,518 ADD 63,832 1,403 42 44.8 55.3 70.3 15.8 23.6 27.0 33.9 27.4 21.6 Godrej Consumer Products 270 ADD 69,741 1,533 258 6.7 10.8 12.4 (5.3) 62.0 14.3 40.4 24.9 21.8 Hindustan Unilever 229 REDUCE 498,988 10,966 2,179 9.5 10.3 10.6 19.0 7.8 3.2 24.1 22.3 21.6 ITC 261 BUY 984,738 21,640 3,769 8.7 10.5 12.3 2.8 21.7 16.8 30.2 24.8 21.2 Jyothy Laboratories 173 ADD 12,518 275 73 5.5 9.7 12.1 (12.9) 75.4 24.4 31.2 17.8 14.3 Nestle India (a) 2,646 ADD 255,150 5,607 96 58.6 76.7 92.2 31.0 30.8 20.3 45.2 34.5 28.7 Tata Tea 950 BUY 58,732 1,291 62 53.7 56.9 69.7 14.7 6.1 22.3 17.7 16.7 13.6 Consumer products Attractive 2,374,333 52,177 10.7 23.3 14.2 30.9 25.0 21.9 ConstructionsIVRCL 169 BUY 45,071 990 267 8.5 7.9 9.7 7.4 (6.4) 22.1 19.9 21.3 17.4 Nagarjuna Construction Co. 159 BUY 40,746 895 257 6.7 8.6 10.5 (6.3) 28.5 21.7 23.6 18.4 15.1 Punj Lloyd 174 REDUCE 58,983 1,296 339 (7.2) 9.8 14.0 (172.4) (236.1) 42.8 (24.1) 17.7 12.4 Sadbhav Engineering 1,293 BUY 16,166 355 13 51.1 53.4 73.0 26.2 4.4 36.8 25.3 24.2 17.7
Construction Attractive 160,965 3,537 (70.6) 280.3 31.4 73.5 19.3 14.7
EV/EBITDA (X) Price/BV (X) RoE (%)
Target price Upside ADVT-3mo
2009 2010E 2011E 2009 2010E 2011E 2009 2010E 2011E 2009 2010E 2011E (Rs) (%) (US$ mn)
19.0 11.5 8.9 1.9 1.8 1.6 1.9 1.9 1.9 6.2 12.1 12.4 55 1.8 5.2
21.6 10.4 9.0 14.4 8.7 5.7 1.1 1.1 1.1 37.7 64.0 50.4 1,930 3.5 12.1
18.5 11.6 10.0 10.0 7.0 5.2 1.0 1.1 1.1 36.4 45.4 37.1 1,700 (13.6) 18.3
25.0 10.8 9.7 6.0 4.0 3.2 0.9 0.9 0.9 17.1 28.6 23.9 1,230 14.6 26.1
20.3 9.5 8.5 4.3 3.5 2.9 0.2 0.3 0.3 13.5 23.0 20.0 1,350 (5.5) 25.1
27.8 15.2 13.3 3.4 2.6 2.3 0.7 0.7 0.7 4.4 9.9 9.7 810 3.4 84.6
22.5 11.7 10.2 5.1 3.8 3.2 0.8 0.8 0.8 12.4 20.2 19.0
— — — 1.3 1.1 1.0 4.5 3.9 2.9 18.9 23.5 15.3 125 24.4 2.7
— — — 4.3 2.8 2.4 0.8 1.1 1.3 19.1 18.4 17.5 1,160 0.3 48.8
— — — 2.0 1.7 1.4 1.5 1.8 1.9 21.4 22.0 19.1 650 5.6 10.9
— — — 1.5 1.3 1.1 2.4 1.7 2.0 29.2 16.2 17.3 360 10.3 5.6
— — — 1.7 1.3 1.1 2.0 2.0 2.5 18.3 22.8 17.8 470 15.3 4.4
— — — 1.3 1.1 1.0 2.8 3.2 3.0 19.6 19.3 15.5 540 22.0 0.5
— — — 1.0 0.9 0.8 1.9 2.0 2.5 12.1 11.5 13.0 340 32.0 3.2
— — — 5.8 5.3 4.7 1.1 1.3 1.5 18.2 19.7 20.3 2,700 0.2 41.1
— — — 5.5 3.9 3.4 0.5 0.7 0.9 16.9 16.1 16.7 1,800 (1.1) 37.4
— — — 2.1 2.0 1.9 1.1 1.3 1.6 7.8 8.2 9.8 910 (4.9) 92.4
— — — 3.5 3.0 2.7 0.7 0.9 0.9 12.9 16.4 15.6 145 (11.8) 17.9
— — — 3.1 2.5 2.0 2.1 2.7 1.8 11.9 17.6 18.7 170 40.8 5.3
— — — 1.3 1.1 0.9 2.9 3.5 3.5 22.9 23.3 20.0 230 34.5 2.0
— — — 0.8 0.7 0.6 5.9 4.2 4.7 22.1 16.1 8.6 150 69.5 2.4
— — — 1.4 1.2 1.1 2.6 3.2 3.4 16.7 18.1 16.9 700 5.8 0.7
— — — 3.7 2.2 2.0 1.6 2.2 2.2 26.2 26.2 19.8 925 13.1 12.5
— — — 2.5 2.1 1.9 1.5 2.2 2.5 15.4 19.3 19.6 415 12.4 0.8
— — — 1.2 1.1 1.0 2.5 2.8 3.3 13.7 13.3 14.0 280 (5.3) 4.2
— — — 2.7 2.4 2.1 1.5 1.9 2.1 18.9 18.4 17.6 210 (18.9) 3.4
— — — 2.3 1.9 1.6 2.0 2.4 2.6 25.8 25.2 22.5 1,020 6.0 6.7
— — — 2.9 2.8 2.6 0.7 0.3 0.3 15.3 6.3 5.9 875 10.1 48.1
— — — 5.2 3.0 2.7 0.9 2.2 2.9 29.6 26.5 25.1 500 (1.4) 4.0
— — — 0.8 0.7 0.7 1.4 1.7 1.7 12.8 11.1 10.5 115 59.6 4.8
— — — 2.3 2.0 1.8 1.4 1.5 1.6 17.1 15.9 15.8 2,400 16.6 99.6
— — — 2.0 1.6 1.3 1.8 2.0 2.1 27.2 24.4 20.7 350 28.3 4.0
— — — 2.6 2.2 1.9 1.3 1.5 1.7 16.1 15.8 15.4
8.8 6.4 8.1 3.5 2.9 2.6 2.4 2.4 2.4 24.7 29.3 17.1 800 (18.3) 11.2 9.0 8.3 8.7 3.0 2.6 2.3 2.5 1.6 1.8 19.7 19.3 14.7 92 (22.5) 6.4 6.9 5.1 5.1 2.3 1.9 1.6 1.1 1.1 1.2 21.1 21.4 17.6 2,500 (14.2) 12.4
5.1 5.4 5.6 1.0 0.9 0.8 1.4 1.7 2.5 14.8 10.5 9.0 100 (21.6) 4.7
8.4 5.1 4.7 6.5 3.7 2.7 0.4 0.5 0.5 65.7 56.1 31.8 2,400 7.1 0.8
8.3 6.8 8.3 3.2 2.6 2.3 0.5 0.7 0.7 31.1 27.3 16.2 900 (19.8) 5.8
7.7 6.0 6.5 2.8 2.3 2.0 1.5 1.4 1.5 20.0 20.5 15.0
30.9 17.2 14.8 16.7 13.6 11.2 0.9 2.0 2.3 36.6 57.2 53.4 2,100 5.3 2.5 27.4 19.9 16.6 44.9 40.2 35.8 2.1 3.3 3.7 155.1 174.5 177.3 700 (2.0) 1.7 27.9 20.6 16.5 17.3 13.5 11.0 1.1 1.8 2.2 55.3 53.9 52.2 200 21.9 2.7 19.9 15.6 12.9 8.3 7.2 6.3 1.0 1.5 2.3 26.8 28.4 31.4 1,500 (1.2) 0.9 27.9 18.0 15.1 12.2 7.1 5.9 1.5 1.5 1.5 46.9 36.2 29.6 270 (0.1) 1.2 18.2 15.4 15.0 24.2 24.1 23.9 3.8 4.5 4.6 112.4 108.4 111.2 220 (3.9) 18.3 18.5 15.0 13.1 6.7 5.9 5.2 1.4 1.7 2.1 25.3 27.0 27.6 280 7.2 26.0 21.2 12.8 9.2 3.4 3.0 2.6 1.4 1.7 2.0 10.7 16.4 19.0 200 15.9 0.5 28.8 23.2 20.0 53.9 43.6 35.5 1.6 2.1 2.5 126.7 139.6 136.3 3,000 13.4 2.3 10.6 9.0 7.5 1.2 1.2 1.1 1.8 2.0 2.4 9.4 9.4 10.8 1,200 26.3 2.7 20.4 16.1 14.1 9.2 8.1 7.2 1.9 2.4 2.8 29.9 32.4 32.9
14.0 11.7 9.6 2.5 2.2 2.0 0.2 0.2 0.2 13.2 11.0 12.0 185 9.6 15.7 13.9 10.3 9.1 2.4 1.8 1.7 0.6 1.0 1.3 9.4 11.3 11.6 180 13.4 3.5 19.6 8.7 7.0 2.4 1.7 1.5 0.1 0.2 0.4 (8.6) 11.2 12.9 205 17.8 18.6 16.6 12.7 10.1 4.6 3.9 3.2 0.3 0.4 0.5 18.0 16.1 18.3 1,400 8.3 0.4
16.0 10.0 8.3 2.5 2.0 1.8 0.3 0.5 0.6 3.5 10.2 12.0
Dividend yield (%)
Source: Company, Bloomberg, Kotak Institutional Equities estimates
KO
TAK INSTITU
TION
AL EQU
ITIES RESEARCH 30
In
dia D
aily Sum
mary - M
arch 2
Ind
ia Daily Su
mm
ary - March
22, 2010 Kotak Institutional Equities: Valuation summary of key Indian companies
19-Mar-10 Mkt cap.
O/S shares EPS (Rs) EPS growth (%) PER (X)
Company Price (Rs) Rating (Rs mn) (US$ mn) (mn) 2009 2010E 2011E 2009 2010E 2011E 2009 2010E 2011EEnergyBharat Petroleum 523 RS 171,319 3,765 328 20.6 58.1 61.7 (50.1) 181.9 6.2 25.4 9.0 8.5
Cairn india 285 SELL 541,214 11,894 1,897 4.3 5.4 17.8 — 26 228.0 66 53 16.0
Castrol India (a) 682 REDUCE 84,322 1,853 124 21.3 30.8 39.7 20.8 44.7 28.8 32.0 22.1 17.2
GAIL (India) 414 REDUCE 525,278 11,543 1,268 22.2 22.7 23.5 8.7 2.3 3.7 18.7 18.3 17.6
GSPL 88 REDUCE 49,641 1,091 563 2.2 7.5 12.4 21.9 241.9 64.6 40.2 11.7 7.1
Hindustan Petroleum 321 RS 108,941 2,394 339 17.0 46.3 49.7 (49.3) 173.1 7.2 18.9 6.9 6.5
Indian Oil Corporation 302 RS 715,302 15,719 2,372 9.8 33.0 32.1 (67.9) 235.4 (2.7) 30.6 9.1 9.4
Oil India 1,112 REDUCE 252,645 5,552 227 101.1 112.2 110.6 — 10.9 (1.5) 11.0 9.9 10.1
Oil & Natural Gas Corporation 1,057 REDUCE 2,260,483 49,675 2,139 90.8 89.9 107.1 (2.1) (1.0) 19.1 11.6 11.8 9.9
Petronet LNG 78 ADD 58,388 1,283 750 6.9 5.3 8.1 — (22.7) 51.2 11.3 14.6 9.6
Reliance Industries 1,092 SELL 3,185,510 70,004 2,917 50.6 47.7 62.6 (3.7) (5.6) 31.3 21.6 22.9 17.4
Energy Cautious 7,953,042 174,773 (9.7) 20.7 22.3 17.8 14.7 12.0 IndustrialsABB 847 REDUCE 179,571 3,946 212 25.8 16.7 27.6 11.3 (35.2) 65.0 32.8 50.6 30.7
BGR Energy Systems 512 ADD 36,871 810 72 16.0 23.6 30.2 32.2 47.4 27.8 31.9 21.7 17.0
Bharat Electronics 2,220 REDUCE 177,560 3,902 80 103.8 117.7 126.2 1.8 13.4 7.2 21.4 18.9 17.6
Bharat Heavy Electricals 2,374 ADD 1,162,096 25,538 490 63.9 92.0 115.8 9.4 44.1 25.8 37.2 25.8 20.5
Crompton Greaves 245 BUY 156,891 3,448 642 8.8 11.9 13.5 37.2 35.2 14.1 27.9 20.6 18.1
Larsen & Toubro 1,621 BUY 974,380 21,413 601 50.1 53.7 64.5 32.1 7.2 20.2 32.3 30.2 25.1
Maharashtra Seamless 361 BUY 25,430 559 71 35.9 40.2 41.1 22.2 12.0 2.3 10.1 9.0 8.8
Siemens 733 REDUCE 247,054 5,429 337 14.2 16.1 24.6 (22.2) 13.5 52.7 51.7 45.6 29.8
Suzlon Energy 76 REDUCE 127,471 2,801 1,679 7.2 (2.2) 2.9 9.9 (130.8) (231.4) 10.5 (34.1) 26.0
Thermax 675 ADD 80,426 1,767 119 24.3 21.4 29.8 (0.6) (11.7) 39.2 27.8 31.5 22.6
Voltas 173 BUY 57,200 1,257 331 6.9 9.4 10.3 29.8 36.2 9.0 25.0 18.4 16.9
Industrials Attractive 3,224,951 70,870 13.0 5.3 32.5 30.9 29.4 22.2 InfrastructureGMR Infrastructure 59 ADD 215,457 4,735 3,667 0.8 0.6 0.6 (33.5) (24.5) (3.1) 76.6 101.5 104.7
GVK Power & Infrastructure 43 ADD 67,590 1,485 1,579 0.8 0.8 1.1 (20.6) 6.7 33.5 56.1 52.6 39.4
IRB Infrastructure 266 NR 88,359 1,942 332 5.3 9.7 12.6 54.3 83.8 29.2 50.2 27.3 21.2
Mundra Port and SEZ 729 ADD 294,023 6,461 403 10.7 15.1 24.1 105.6 40.8 59.5 68.0 48.3 30.3
Infrastructure Attractive 665,429 14,623 48.6 28.0 38.7 66.9 52.3 37.7 MediaDishTV 37 REDUCE 39,452 867 1,063 (6.6) (2.5) (1.2) (31.9) (61.6) (52.4) (5.6) (14.7) (30.9)
HT Media 140 NR 32,888 723 235 0.8 5.7 7.3 (80.5) 572.1 29.5 165.8 24.7 19.1
Jagran Prakashan 124 ADD 37,435 823 301 3.0 5.9 6.6 (6.6) 92.8 13.2 40.9 21.2 18.7
Sun TV Network 420 REDUCE 165,415 3,635 394 9.1 12.1 14.6 9.5 32.7 20.8 46.2 34.8 28.8
Zee Entertainment Enterprises 266 REDUCE 115,336 2,535 434 8.4 10.6 12.8 (4.8) 25.9 20.3 31.5 25.0 20.8
Zee News 60 NR 14,472 318 240 1.9 2.4 2.9 20.4 28.2 20.0 32.4 25.3 21.1
Media Neutral 404,998 8,900 (21.0) 144.6 39.2 95.6 39.1 28.1
Metals
Hindalco Industries 176 ADD 335,633 7,376 1,911 2.8 4.3 13.3 (77.9) 56.9 205.5 63.4 40.4 13.2
National Aluminium Co. 403 SELL 259,947 5,712 644 19.7 10.1 28.0 (22.0) (49.0) 178.6 20.4 40.1 14.4
Jindal Steel and Power 693 SELL 643,046 14,131 928 32.8 40.6 47.0 139.1 23.7 15.9 21.1 17.1 14.7
JSW Steel 1,242 SELL 232,389 5,107 187 14.7 68.1 93.7 (83.2) 363.6 37.5 84.5 18.2 13.3
Hindustan Zinc 1,240 BUY 523,855 11,512 423 64.6 93.5 105.4 (38.0) 44.8 12.8 19.2 13.3 11.8
Sesa Goa 452 REDUCE 401,011 8,812 887 25.3 25.9 38.9 29.0 2.5 50.5 17.9 17.5 11.6
Sterlite Industries 825 ADD 692,919 15,227 840 46.8 44.9 54.2 (25.8) (4.0) 20.7 17.6 18.4 15.2
Tata Steel 644 BUY 571,708 12,564 887 110.1 3.2 78.7 45.3 (97.1) 2,331.6 5.9 198.9 8.2
Metals Cautious 3,660,508 80,442 (1.3) (26.7) 77.9 16.0 21.8 12.2
PharmaceuticalBiocon 282 BUY 56,320 1,238 200 4.7 14.6 18.1 (79.9) 210.6 24.1 60.0 19.3 15.6 Cipla 334 REDUCE 267,774 5,885 803 9.9 13.4 15.1 10.0 34.9 13.0 33.6 24.9 22.1 Cadila Healthcare 811 BUY 110,735 2,433 136 22.2 36.8 44.3 8.3 65.8 20.3 36.5 22.0 18.3 Dishman Pharma & chemicals 219 BUY 17,816 392 81 18.0 17.2 20.5 22.1 (4.3) 19.2 12.2 12.7 10.7 Divi's Laboratories 633 ADD 82,731 1,818 131 31.9 19.1 33.6 19.7 (40.1) 76.3 19.9 33.2 18.8 Dr Reddy's Laboratories 1,254 REDUCE 212,406 4,668 169 32.4 55.9 67.4 24.3 72.6 20.6 38.7 22.4 18.6 GlaxoSmithkline Pharmaceuticals (a) 1,725 REDUCE 146,130 3,211 85 54.6 59.1 67.7 13.8 8.1 14.6 31.6 29.2 25.5 Glenmark Pharmaceuticals 246 NR 67,398 1,481 274 11.1 12.9 16.5 (57.0) 16.6 27.6 22.2 19.0 14.9 Lupin 1,614 ADD 142,999 3,142 89 60.2 73.6 92.0 21.0 22.3 24.9 26.8 21.9 17.6 Ranbaxy Laboratories 467 SELL 200,177 4,399 428 (12.3) 6.0 12.3 (152.8) (148.7) 105.0 (38.0) 78.0 38.0 Sun Pharmaceuticals 1,698 ADD 351,704 7,729 207 87.8 65.4 90.7 17.6 (25.5) 38.7 19.3 26.0 18.7 Pharmaceuticals Attractive 1,656,190 36,396 (17.1) 28.9 29.5 33.9 26.3 20.3 PropertyDLF 313 REDUCE 529,256 11,631 1,691 26.7 12.1 16.0 (42.0) (54.5) 32.1 11.7 25.8 19.5 Indiabulls Real Estate 160 ADD 64,357 1,414 401 0.8 1.6 4.0 (95.4) 109.7 151.7 212.1 101.1 40.2 Mahindra Life Space Developer 399 BUY 16,784 369 42 10.4 18.9 20.3 (38.5) 82.4 7.3 38.6 21.1 19.7 Phoenix Mills 195 BUY 28,194 620 145 5.0 5.1 7.7 56.8 2.5 51.0 39.2 38.2 25.3 Puravankara Projects 103 REDUCE 21,887 481 213 6.8 8.3 7.9 (39.8) 22.4 (4.8) 15.2 12.4 13.0 Sobha 273 ADD 26,811 589 98 15.1 14.2 15.7 (52.3) (5.9) 10.4 18.1 19.2 17.4 Unitech 74 SELL 189,004 4,153 2,559 7.4 3.8 4.1 (28.7) (48.7) 9.7 10.0 19.5 17.8
EV/EBITDA (X) Price/BV (X) RoE (%)
Target price Upside ADVT-3mo
2009 2010E 2011E 2009 2010E 2011E 2009 2010E 2011E 2009 2010E 2011E (Rs) (%) (US$ mn)
5.3 4.5 4.0 1.3 1.2 1.1 1.5 4.9 5.2 5.3 14.1 13.7 — — 10.0
46.4 36.9 10.0 1.6 1.6 1.6 — — 7.0 2.5 3.0 9.9 230 (19.4) 17.7
18.5 13.6 10.7 18.8 18.3 16.5 2.2 3.7 4.4 61.2 83.8 101.0 640 (6.2) 3.0
10.1 10.7 11.0 3.3 2.9 2.7 1.7 1.9 1.9 17.5 15.9 15.0 370 (10.6) 14.7
13.4 6.4 4.1 3.7 3.1 2.5 0.8 2.9 7.0 9.6 28.7 38.9 95 7.6 5.8
2.9 2.4 2.2 0.9 0.8 0.8 1.6 8.1 8.7 4.4 11.2 11.4 — — 9.2
8.3 5.7 4.8 1.5 1.3 1.2 1.3 2.2 2.1 4.8 15.3 13.1 — — 5.6
5.0 3.5 3.0 2.5 1.7 1.6 2.6 3.3 3.5 20.1 16.5 15.5 1,150 3.4 —
4.4 4.2 3.5 1.9 1.7 1.6 3.0 3.4 4.2 16.6 14.4 15.7 1,200 13.5 23.5
7.9 8.6 6.1 2.6 2.3 1.9 2.2 1.9 2.6 23.9 15.8 20.5 90 15.6 4.3
14.2 11.0 8.4 2.3 2.0 1.8 0.6 0.6 0.8 13.6 10.6 12.2 940 (13.9) 145.8
8.1 6.9 5.6 2.0 1.8 1.6 1.5 1.9 2.8 11.4 12.2 13.6
19.5 28.9 17.5 8.5 7.5 6.2 0.3 0.3 0.4 29.2 15.7 22.2 690 (18.6) 6.1
18.1 12.2 9.5 6.5 5.3 4.2 0.6 0.8 1.0 22.3 26.9 27.6 500 (2.4) 3.0
11.5 9.6 8.6 4.5 3.8 3.3 0.8 1.1 1.1 20.7 22.0 20.1 1,870 (15.7) 4.3
20.4 14.3 11.2 9.0 7.1 5.7 0.7 0.8 1.0 26.4 30.8 30.7 2,500 5.3 32.9
14.9 11.3 9.7 8.5 6.2 4.8 0.5 0.6 0.7 35.6 34.6 29.8 260 6.3 7.8
20.7 16.5 14.1 6.4 4.4 3.8 0.6 0.7 0.7 21.7 17.4 16.3 1,700 4.9 60.0
5.7 4.6 4.3 1.9 1.6 1.4 1.5 1.7 2.1 20.3 19.2 16.9 400 10.9 1.2
25.4 22.1 17.6 10.9 9.0 7.3 0.4 0.7 0.7 23.3 21.6 27.0 635 (13.3) 8.4
7.6 12.6 8.0 1.2 1.1 1.1 — — 0.3 11.5 (3.4) 4.2 80 5.4 52.5
16.2 16.9 12.5 8.1 7.4 6.1 0.7 0.5 1.3 33.0 24.5 29.4 725 7.4 2.4
13.8 10.1 8.9 7.1 5.6 4.6 1— 1— 1.6 33.0 34.1 29.8 185 7.0 4.6
17.1 14.9 11.9 6.1 4.8 4.1 0.6 0.7 0.9 19.8 16.5 18.5
27.9 20.0 14.7 2.6 2.1 2.0 — — — 4.4 3.2 3.0 68 15.7 6.7
51.4 18.1 16.6 2.9 2.1 2.1 — — 0.7 4.8 4.7 5.3 50 16.8 8.9
24.7 13.0 11.6 4.8 3.8 2.9 0.4 — — 10.1 15.6 15.7 — — 5.7
39.6 31.0 19.9 10.0 8.1 6.2 (0.4) — — 15.5 18.5 23.2 725 (0.5) 10.3
32.9 21.0 15.8 4.3 3.5 3.0 (0.1) — 0.1 6.5 6.6 8.0
(36.5) 57.9 18.9 (6.3) 9.7 14.1 — — — 83.9 248.6 (37.1) 45 21.3 5.8
37.4 11.9 10.0 3.8 3.4 3.1 0.2 0.7 1.4 2.3 14.6 17.0 — — 0.6
23.3 12.8 10.9 6.7 6.1 5.6 1.6 2.8 3.2 16.7 30.1 31.1 130 4.6 1.8
24.6 20.1 16.3 9.4 8.1 7.1 0.6 1.0 1.4 22.5 25.3 26.3 295 (29.7) 4.8
21.7 19.3 15.1 3.3 3.0 2.8 0.8 1.0 1.2 11.8 13.0 14.2 245 (7.8) 6.2
15.8 12.3 10.5 5.9 4.9 4.2 0.7 0.7 1.2 20.1 21.8 22.0 — — 1.0
29.3 18.7 14.5 6.4 5.0 4.6 0.6 1.0 1.4 6.7 12.7 16.2
16.6 8.8 7.6 1.8 1.3 1.2 — — — 2.4 3.8 9.7 160 (8.9) 51.3
10.1 17.6 6.9 2.5 2.4 2.1 1.2 0.5 0.5 12.8 6.1 15.4 320 (20.7) 8.2
13.8 10.9 8.9 8.3 5.6 4.0 0.2 0.1 0.1 50.9 39.2 31.8 530 (23.5) 42.7
13.3 9.1 7.9 2.6 2.0 1.6 0.1 0.2 0.4 11.7 12.4 13.3 850 (31.6) 49.1
15.6 9.1 6.8 3.5 2.8 2.3 0.3 0.4 0.4 20.2 23.5 21.3 1,400 12.9 12.6
15.8 14.4 8.5 8.3 5.4 3.8 0.5 0.7 0.7 46.6 32.8 33.8 350 (22.6) 49.1
13.1 10.1 7.7 2.6 1.9 1.7 — — — 14.0 11.0 11.9 850 3.1 40.0
6.1 19.6 6.6 1.9 2.2 1.8 2.2 1.2 1.2 27.5 1.1 24.7 700 8.7 115.2
10.6 11.8 7.5 3.0 2.5 2.1 0.6 0.4 0.4 18.8 11.4 17.0
24.0 11.3 9.2 3.7 3.2 2.8 — — 0.0 6.2 18.0 19.4 300 6.5 5.5 25.5 17.3 15.4 6.2 4.6 3.9 0.6 0.7 0.7 19.0 21.0 19.1 295 (11.5) 10.2 19.5 14.3 11.9 9.0 6.8 5.3 1 1 1.1 26.9 35.7 32.7 765 (5.7) 1.3 9.2 9.7 7.9 2.5 2.1 1.8 — — — 22.7 18.0 18.2 265 21.0 1.2
16.2 19.6 13.4 6.7 5.8 4.8 — — 0.0 39.6 18.6 27.1 700 10.6 3.8 16.2 13.1 11.1 6.0 5.5 4.3 0.5 0.6 0.6 13.6 25.4 25.9 1,170 (6.7) 11.9 18.0 16.6 14.4 9.3 8.2 7.0 — — — 31.3 29.7 29.5 1,700 (1.5) 1.5 13.9 11.3 9.3 4.2 2.9 2.5 — — — 17.7 17.2 17.5 — — 5.3 23.8 18.2 14.3 9.9 6.2 4.8 0.7 0.8 0.9 37.1 35.2 31.2 1,600 (0.9) 7.8
(88.4) 18.8 21.0 6.4 6.1 5.6 — 0.8 0.9 (13.3) 5.9 11.5 220 (52.9) 21.6 15.4 19.1 13.4 4.9 4.2 3.5 0.8 0.8 0.8 30.2 17.9 21.1 1,800 6.0 12.7 21.3 16.0 13.3 6.0 5.0 4.2 0.4 0.6 0.6 17.7 18.9 20.5
12.2 16.9 14.6 2.2 2.1 1.9 1.0 1.0 1.3 20.7 8.3 10.2 315 0.7 76.6 (35) (66.9) 33.6 1.0 0.7 0.7 — — — 0.3 0.8 1.8 285 77.7 26.4
56.9 17.3 14.1 1.9 1.8 1.7 1.0 1.0 1.0 4.8 8.4 8.5 510 27.8 1.1 45.5 29.4 18.9 1.9 1.8 1.7 0.5 0.5 0.8 4.9 4.8 7.0 260 33.6 1.0 21.8 13.7 12.9 1.6 1.5 1.4 - 2.0 2.0 11.5 12.7 11.1 100 (2.5) 1.1 16.5 14.8 12.6 2.4 1.5 1.4 0.3 0.7 1.5 10.4 9.7 8.5 295 7.9 2.7 17.2 17.6 13.7 3.7 1.8 1.5 0.1 - - 27.3 10.8 9.1 65 (12.0) 77.3
Dividend yield (%)
Source: Company, Bloomberg, Kotak Institutional Equities estimates
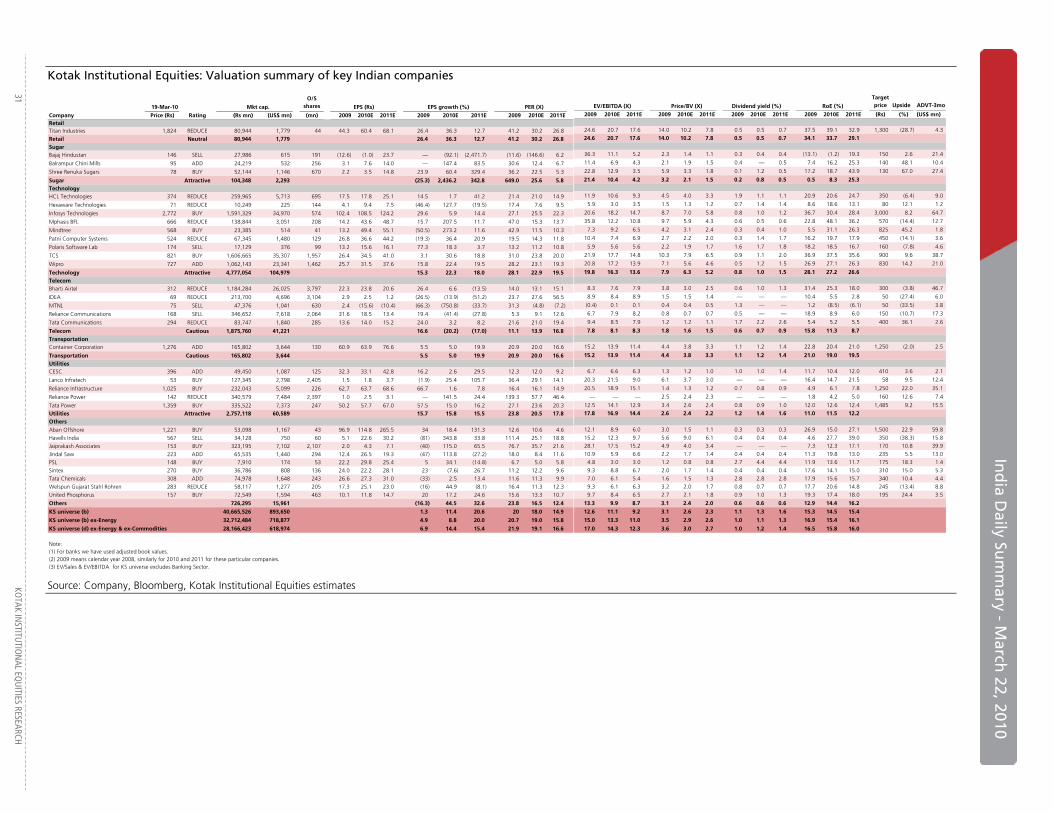
In
dia D
aily Sum
mary - M
arch 22, 2010
31
KOTAK IN
STITUTIO
NAL EQ
UITIES RESEARCH
Kotak Institutional Equities: Valuation summary of key Indian companies
19-Mar-10 Mkt cap.
O/S shares EPS (Rs) EPS growth (%) PER (X)
Company Price (Rs) Rating (Rs mn) (US$ mn) (mn) 2009 2010E 2011E 2009 2010E 2011E 2009 2010E 2011ERetailTitan Industries 1,824 REDUCE 80,944 1,779 44 44.3 60.4 68.1 26.4 36.3 12.7 41.2 30.2 26.8 Retail Neutral 80,944 1,779 26.4 36.3 12.7 41.2 30.2 26.8 SugarBajaj Hindustan 146 SELL 27,986 615 191 (12.6) (1.0) 23.7 — (92.1) (2,471.7) (11.6) (146.6) 6.2
Balrampur Chini Mills 95 ADD 24,219 532 256 3.1 7.6 14.0 — 147.4 83.5 30.6 12.4 6.7
Shree Renuka Sugars 78 BUY 52,144 1,146 670 2.2 3.5 14.8 23.9 60.4 329.4 36.2 22.5 5.3
Sugar Attractive 104,348 2,293 (25.3) 2,436.2 342.8 649.0 25.6 5.8 TechnologyHCL Technologies 374 REDUCE 259,965 5,713 695 17.5 17.8 25.1 14.5 1.7 41.2 21.4 21.0 14.9
Hexaware Technologies 71 REDUCE 10,249 225 144 4.1 9.4 7.5 (46.4) 127.7 (19.5) 17.4 7.6 9.5
Infosys Technologies 2,772 BUY 1,591,329 34,970 574 102.4 108.5 124.2 29.6 5.9 14.4 27.1 25.5 22.3
Mphasis BFL 666 REDUCE 138,844 3,051 208 14.2 43.6 48.7 15.7 207.5 11.7 47.0 15.3 13.7
Mindtree 568 BUY 23,385 514 41 13.2 49.4 55.1 (50.5) 273.2 11.6 42.9 11.5 10.3
Patni Computer Systems 524 REDUCE 67,345 1,480 129 26.8 36.6 44.2 (19.3) 36.4 20.9 19.5 14.3 11.8
Polaris Software Lab 174 SELL 17,129 376 99 13.2 15.6 16.1 77.3 18.3 3.7 13.2 11.2 10.8
TCS 821 BUY 1,606,665 35,307 1,957 26.4 34.5 41.0 3.1 30.6 18.8 31.0 23.8 20.0
Wipro 727 ADD 1,062,143 23,341 1,462 25.7 31.5 37.6 15.8 22.4 19.5 28.2 23.1 19.3
Technology Attractive 4,777,054 104,979 15.3 22.3 18.0 28.1 22.9 19.5 TelecomBharti Airtel 312 REDUCE 1,184,284 26,025 3,797 22.3 23.8 20.6 26.4 6.6 (13.5) 14.0 13.1 15.1
IDEA 69 REDUCE 213,700 4,696 3,104 2.9 2.5 1.2 (26.5) (13.9) (51.2) 23.7 27.6 56.5
MTNL 75 SELL 47,376 1,041 630 2.4 (15.6) (10.4) (66.3) (750.8) (33.7) 31.3 (4.8) (7.2)
Reliance Communications 168 SELL 346,652 7,618 2,064 31.6 18.5 13.4 19.4 (41.4) (27.8) 5.3 9.1 12.6
Tata Communications 294 REDUCE 83,747 1,840 285 13.6 14.0 15.2 24.0 3.2 8.2 21.6 21.0 19.4
Telecom Cautious 1,875,760 41,221 16.6 (20.2) (17.0) 11.1 13.9 16.8 TransportationContainer Corporation 1,276 ADD 165,802 3,644 130 60.9 63.9 76.6 5.5 5.0 19.9 20.9 20.0 16.6
Transportation Cautious 165,802 3,644 5.5 5.0 19.9 20.9 20.0 16.6 UtilitiesCESC 396 ADD 49,450 1,087 125 32.3 33.1 42.8 16.2 2.6 29.5 12.3 12.0 9.2
Lanco Infratech 53 BUY 127,345 2,798 2,405 1.5 1.8 3.7 (1.9) 25.4 105.7 36.4 29.1 14.1
Reliance Infrastructure 1,025 BUY 232,043 5,099 226 62.7 63.7 68.6 66.7 1.6 7.8 16.4 16.1 14.9
Reliance Power 142 REDUCE 340,579 7,484 2,397 1.0 2.5 3.1 — 141.5 24.4 139.3 57.7 46.4
Tata Power 1,359 BUY 335,522 7,373 247 50.2 57.7 67.0 57.5 15.0 16.2 27.1 23.6 20.3 Utilities Attractive 2,757,118 60,589 15.7 15.8 15.5 23.8 20.5 17.8 OthersAban Offshore 1,221 BUY 53,098 1,167 43 96.9 114.8 265.5 34 18.4 131.3 12.6 10.6 4.6 Havells India 567 SELL 34,128 750 60 5.1 22.6 30.2 (81) 343.8 33.8 111.4 25.1 18.8 Jaiprakash Associates 153 BUY 323,195 7,102 2,107 2.0 4.3 7.1 (40) 115.0 65.5 76.7 35.7 21.6 Jindal Saw 223 ADD 65,535 1,440 294 12.4 26.5 19.3 (47) 113.8 (27.2) 18.0 8.4 11.6 PSL 148 BUY 7,910 174 53 22.2 29.8 25.4 5 34.1 (14.8) 6.7 5.0 5.8 Sintex 270 BUY 36,786 808 136 24.0 22.2 28.1 23 (7.6) 26.7 11.2 12.2 9.6 Tata Chemicals 308 ADD 74,978 1,648 243 26.6 27.3 31.0 (33) 2.5 13.4 11.6 11.3 9.9 Welspun Gujarat Stahl Rohren 283 REDUCE 58,117 1,277 205 17.3 25.1 23.0 (16) 44.9 (8.1) 16.4 11.3 12.3 United Phosphorus 157 BUY 72,549 1,594 463 10.1 11.8 14.7 20 17.2 24.6 15.6 13.3 10.7
Others 726,295 15,961 (16.3) 44.5 32.6 23.8 16.5 12.4
KS universe (b) 40,665,526 893,650 1.3 11.4 20.6 20 18.0 14.9
KS universe (b) ex-Energy 32,712,484 718,877 4.9 8.8 20.0 20.7 19.0 15.8
KS universe (d) ex-Energy & ex-Commodities 28,166,423 618,974 6.9 14.4 15.4 21.9 19.1 16.6
Note:(1) For banks we have used adjusted book values.(2) 2009 means calendar year 2008, similarly for 2010 and 2011 for these particular companies.(3) EV/Sales & EV/EBITDA for KS universe excludes Banking Sector.
EV/EBITDA (X) Price/BV (X) RoE (%)
Target price Upside ADVT-3mo
2009 2010E 2011E 2009 2010E 2011E 2009 2010E 2011E 2009 2010E 2011E (Rs) (%) (US$ mn)
24.6 20.7 17.6 14.0 10.2 7.8 0.5 0.5 0.7 37.5 39.1 32.9 1,300 (28.7) 4.3 24.6 20.7 17.6 14.0 10.2 7.8 0.5 0.5 0.7 34.1 33.7 29.1
36.3 11.1 5.2 2.3 1.4 1.1 0.3 0.4 0.4 (13.1) (1.2) 19.3 150 2.6 21.4
11.4 6.9 4.3 2.1 1.9 1.5 0.4 — 0.5 7.4 16.2 25.3 140 48.1 10.4
22.8 12.9 3.5 5.9 3.3 1.8 0.1 1.2 0.5 17.2 18.7 43.9 130 67.0 27.4
21.4 10.4 4.2 3.2 2.1 1.5 0.2 0.8 0.5 0.5 8.3 25.3
11.9 10.6 9.3 4.5 4.0 3.3 1.9 1.1 1.1 20.9 20.6 24.7 350 (6.4) 9.0
5.9 3.0 3.5 1.5 1.3 1.2 0.7 1.4 1.4 8.6 18.6 13.1 80 12.1 1.2
20.6 18.2 14.7 8.7 7.0 5.8 0.8 1.0 1.2 36.7 30.4 28.4 3,000 8.2 64.7
35.8 12.2 10.8 9.7 5.9 4.3 0.6 0.5 0.6 22.8 48.1 36.2 570 (14.4) 12.7
7.3 9.2 6.5 4.2 3.1 2.4 0.3 0.4 1.0 5.5 31.1 26.3 825 45.2 1.8
10.4 7.4 6.9 2.7 2.2 2.0 0.3 1.4 1.7 16.2 19.7 17.9 450 (14.1) 3.6
5.9 5.6 5.6 2.2 1.9 1.7 1.6 1.7 1.8 18.2 18.5 16.7 160 (7.8) 4.6
21.9 17.7 14.8 10.3 7.9 6.5 0.9 1.1 2.0 36.9 37.5 35.6 900 9.6 38.7
20.8 17.2 13.9 7.1 5.6 4.6 0.5 1.2 1.5 26.9 27.1 26.3 830 14.2 21.0
19.8 16.3 13.6 7.9 6.3 5.2 0.8 1.0 1.5 28.1 27.2 26.6
8.3 7.6 7.9 3.8 3.0 2.5 0.6 1.0 1.3 31.4 25.3 18.0 300 (3.8) 46.7
8.9 8.4 8.9 1.5 1.5 1.4 — — — 10.4 5.5 2.8 50 (27.4) 6.0
(0.4) 0.1 0.1 0.4 0.4 0.5 1.3 — — 1.2 (8.5) (6.1) 50 (33.5) 3.8
6.7 7.9 8.2 0.8 0.7 0.7 0.5 — — 18.9 8.9 6.0 150 (10.7) 17.3
9.4 8.5 7.9 1.2 1.2 1.1 1.7 2.2 2.6 5.4 5.2 5.5 400 36.1 2.6
7.8 8.1 8.3 1.8 1.6 1.5 0.6 0.7 0.9 15.8 11.3 8.7
15.2 13.9 11.4 4.4 3.8 3.3 1.1 1.2 1.4 22.8 20.4 21.0 1,250 (2.0) 2.5
15.2 13.9 11.4 4.4 3.8 3.3 1.1 1.2 1.4 21.0 19.0 19.5
6.7 6.6 6.3 1.3 1.2 1.0 1.0 1.0 1.4 11.7 10.4 12.0 410 3.6 2.1
20.3 21.5 9.0 6.1 3.7 3.0 — — — 16.4 14.7 21.5 58 9.5 12.4
20.5 18.9 15.1 1.4 1.3 1.2 0.7 0.8 0.9 4.9 6.1 7.8 1,250 22.0 35.1
— — — 2.5 2.4 2.3 — — — 1.8 4.2 5.0 160 12.6 7.4
12.5 14.1 12.9 3.4 2.6 2.4 0.8 0.9 1.0 12.0 12.6 12.4 1,485 9.2 15.5 17.8 16.9 14.4 2.6 2.4 2.2 1.2 1.4 1.6 11.0 11.5 12.2
12.1 8.9 6.0 3.0 1.5 1.1 0.3 0.3 0.3 26.9 15.0 27.1 1,500 22.9 59.8 15.2 12.3 9.7 5.6 9.0 6.1 0.4 0.4 0.4 4.6 27.7 39.0 350 (38.3) 15.8 28.1 17.5 15.2 4.9 4.0 3.4 — — — 7.3 12.3 17.1 170 10.8 39.9 10.9 5.9 6.6 2.2 1.7 1.4 0.4 0.4 0.4 11.3 19.8 13.0 235 5.5 13.0
4.8 3.0 3.0 1.2 0.8 0.8 2.7 4.4 4.4 11.9 13.6 11.7 175 18.3 1.4
9.3 8.8 6.7 2.0 1.7 1.4 0.4 0.4 0.4 17.6 14.1 15.0 310 15.0 5.3 7.0 6.1 5.4 1.6 1.5 1.3 2.8 2.8 2.8 17.9 15.6 15.7 340 10.4 4.4 9.3 6.1 6.3 3.2 2.0 1.7 0.8 0.7 0.7 17.7 20.6 14.8 245 (13.4) 8.8 9.7 8.4 6.5 2.7 2.1 1.8 0.9 1.0 1.3 19.3 17.4 18.0 195 24.4 3.5
13.3 9.9 8.7 3.1 2.4 2.0 0.6 0.6 0.6 12.9 14.4 16.2
12.6 11.1 9.2 3.1 2.6 2.3 1.1 1.3 1.6 15.3 14.5 15.4
15.0 13.3 11.0 3.5 2.9 2.6 1.0 1.1 1.3 16.9 15.4 16.1
17.0 14.3 12.3 3.6 3.0 2.7 1.0 1.2 1.4 16.5 15.8 16.0
Dividend yield (%)
Source: Company, Bloomberg, Kotak Institutional Equities estimates
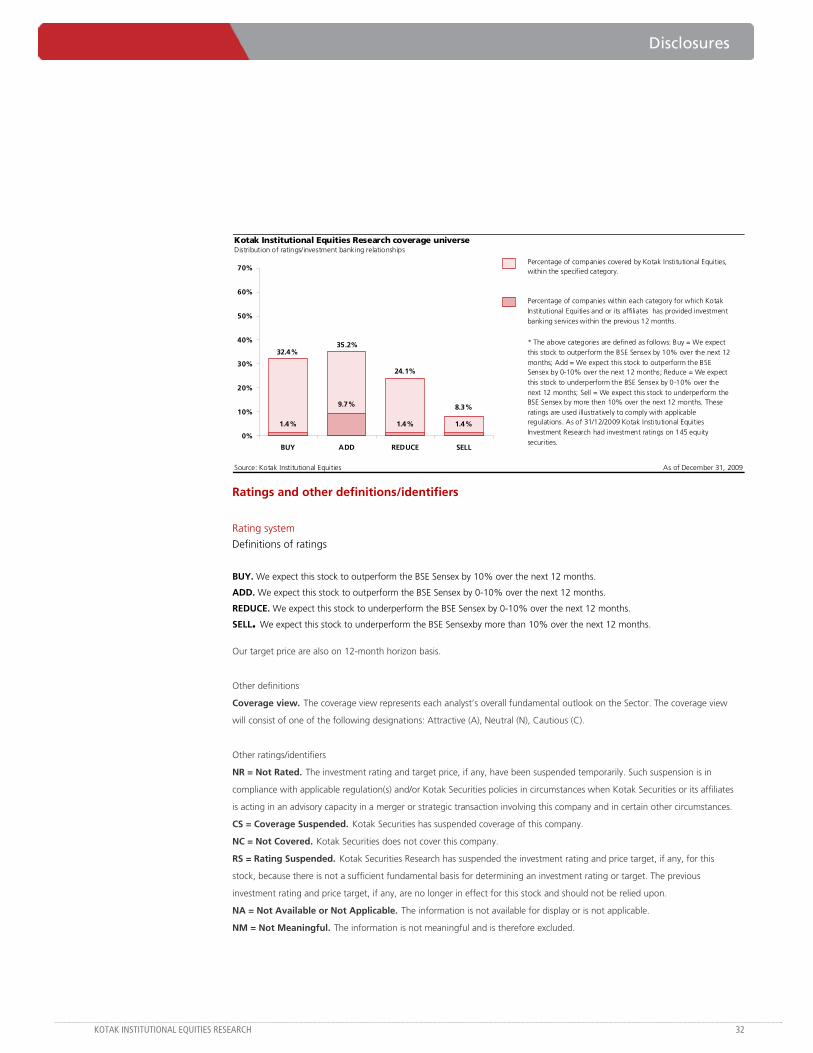
Disclosures
KOTAK INSTITUTIONAL EQUITIES RESEARCH 32
Kotak Institutional Equities Research coverage universeDistribution of ratings/investment banking relationships
Source: Kotak Institutional Equities As of December 31, 2009
* The above categories are defined as follows: Buy = We expect this stock to outperform the BSE Sensex by 10% over the next 12 months; Add = We expect this stock to outperform the BSE Sensex by 0-10% over the next 12 months; Reduce = We expect this stock to underperform the BSE Sensex by 0-10% over the next 12 months; Sell = We expect this stock to underperform the BSE Sensex by more then 10% over the next 12 months. These ratings are used illustratively to comply with applicable regulations. As of 31/12/2009 Kotak Institutional Equities Investment Research had investment ratings on 145 equity securities.
Percentage of companies covered by Kotak Institutional Equities, within the specified category.
Percentage of companies within each category for which Kotak Institutional Equities and or its affiliates has provided investment banking services within the previous 12 months.
8.3%
32.4%35.2%
24.1%
1.4%
9.7%
1.4% 1.4%
0%
10%
20%
30%
40%
50%
60%
70%
BUY ADD REDUCE SELL
Ratings and other definitions/identifiers
Rating system
Definitions of ratings
BUY. We expect this stock to outperform the BSE Sensex by 10% over the next 12 months.
ADD. We expect this stock to outperform the BSE Sensex by 0-10% over the next 12 months.
REDUCE. We expect this stock to underperform the BSE Sensex by 0-10% over the next 12 months.
SELL. We expect this stock to underperform the BSE Sensexby more than 10% over the next 12 months.
Our target price are also on 12-month horizon basis. Other definitions Coverage view. The coverage view represents each analyst’s overall fundamental outlook on the Sector. The coverage view
will consist of one of the following designations: Attractive (A), Neutral (N), Cautious (C). Other ratings/identifiers NR = Not Rated. The investment rating and target price, if any, have been suspended temporarily. Such suspension is in
compliance with applicable regulation(s) and/or Kotak Securities policies in circumstances when Kotak Securities or its affiliates
is acting in an advisory capacity in a merger or strategic transaction involving this company and in certain other circumstances. CS = Coverage Suspended. Kotak Securities has suspended coverage of this company. NC = Not Covered. Kotak Securities does not cover this company. RS = Rating Suspended. Kotak Securities Research has suspended the investment rating and price target, if any, for this
stock, because there is not a sufficient fundamental basis for determining an investment rating or target. The previous
investment rating and price target, if any, are no longer in effect for this stock and should not be relied upon. NA = Not Available or Not Applicable. The information is not available for display or is not applicable. NM = Not Meaningful. The information is not meaningful and is therefore excluded.
Corporate Office Overseas Offices
Kotak Securities Ltd.
Bakhtawar, 1st Floor
229, Nariman Point
Mumbai 400 021, India
Tel: +91-22-6634-1100
Kotak Mahindra (UK) Ltd
6th Floor, Portsoken House
155-157 The Minories
London EC 3N 1 LS
Tel: +44-20-7977-6900 / 6940
Kotak Mahindra Inc
50 Main Street, Suite No.310
Westchester Financial Centre
White Plains, New York 10606
Tel:+1-914-997-6120
Copyright 2010 Kotak Institutional Equities (Kotak Securities Limited). All rights reserved.
Kotak Securities Limited and its affiliates are a full-service, integrated investment banking, investment management, brokerage and financing group. We along with our affiliates are leading underwriter of securities and participants in virtually all securities trading markets in India. We and our affiliates have investment banking and other business relationships with a significant percentage of the companies covered by our Investment Research Department. Our research professionals provide important input into our investment banking and other business selection processes. Investors should assume that Kotak Securities Limited and/or its affiliates are seeking or will seek investment banking or other business from the company or companies that are the subject of this material and that the research professionals who were involved in preparing this material may participate in the solicitation of such business. Our research professionals are paid in part based on the profitability of Kotak Securities Limited, which include earnings from investment banking and other business. Kotak Securities Limited generally prohibits its analysts, persons reporting to analysts, and members of their households from maintaining a financial interest in the securities or derivatives of any companies that the analysts cover. Additionally, Kotak Securities Limited generally prohibits its analysts and persons reporting to analysts from serving as an officer, director, or advisory board member of any companies that the analysts cover. Our salespeople, traders, and other professionals may provide oral or written market commentary or trading strategies to our clients that reflect opinions that are contrary to the opinions expressed herein, and our proprietary trading and investing businesses may make investment decisions that are inconsistent with the recommendations expressed herein. In reviewing these materials, you should be aware that any or all of the foregoing, among other things, may give rise to real or potential conflicts of interest. Additionally, other important information regarding our relationships with the company or companies that are the subject of this material is provided herein.
This material should not be construed as an offer to sell or the solicitation of an offer to buy any security in any jurisdiction where such an offer or solicitation would be illegal. We are not soliciting any action based on this material. It is for the general information of clients of Kotak Securities Limited. It does not constitute a personal recommendation or take into account the particular investment objectives, financial situations, or needs of individual clients. Before acting on any advice or recommendation in this material, clients should consider whether it is suitable for their particular circumstances and, if necessary, seek professional advice. The price and value of the investments referred to in this material and the income from them may go down as well as up, and investors may realize losses on any investments. Past performance is not a guide for future performance, future returns are not guaranteed and a loss of original capital may occur. Kotak Securities Limited does not provide tax advise to its clients, and all investors are strongly advised to consult with their tax advisers regarding any potential investment.
Certain transactions -including those involving futures, options, and other derivatives as well as non-investment-grade securities - give rise to substantial risk and are not suitable for all investors. The material is based on information that we consider reliable, but we do not represent that it is accurate or complete, and it should not be relied on as such. Opinions expressed are our current opinions as of the date appearing on this material only. We endeavor to update on a reasonable basis the information discussed in this material, but regulatory, compliance, or other reasons may prevent us from doing so. We and our affiliates, officers, directors, and employees, including persons involved in the preparation or issuance of this material, may from time to time have “long” or “short” positions in, act as principal in, and buy or sell the securities or derivatives thereof of companies mentioned herein. For the purpose of calculating whether Kotak Securities Limited and its affiliates holds beneficially owns or controls, including the right to vote for directors, 1% of more of the equity shares of the subject issuer of a research report, the holdings does not include accounts managed by Kotak Mahindra Mutual Fund.Kotak Securities Limited and its non US affiliates may, to the extent permissible under applicable laws, have acted on or used this research to the extent that it relates to non US issuers, prior to or immediately following its publication. Foreign currency denominated securities are subject to fluctuations in exchange rates that could have an adverse effect on the value or price of or income derived from the investment. In addition , investors in securities such as ADRs, the value of which are influenced by foreign currencies affectively assume currency risk. In addition options involve risks and are not suitable for all investors. Please ensure that you have read and understood the current derivatives risk disclosure document before entering into any derivative transactions.
This report has not been prepared by Kotak Mahindra Inc. (KMInc). However KMInc has reviewed the report and, in so far as it includes current or historical information, it is believed to be reliable, although its accuracy and completeness cannot be guaranteed. Any reference to Kotak Securities Limited shall also be deemed to mean and include Kotak Mahindra Inc.