

2.2 Analysing Motion Graph
25
Chapter 2 Forces and Motion 2.2 Analysing Motion Graph
Transcript of 2.2 Analysing Motion Graph

Chapter 2 Forces and Motion
2.2 Analysing Motion Graph

There are two main types of linear motion graphs
1.Displacement – Time graph2.Velocity – Time graph
2.2 Analysing Motion Graph

http://www.youtube.com/watch?v=x2ve5yucNPQ
02:30
2.2 Analysing Motion Graph

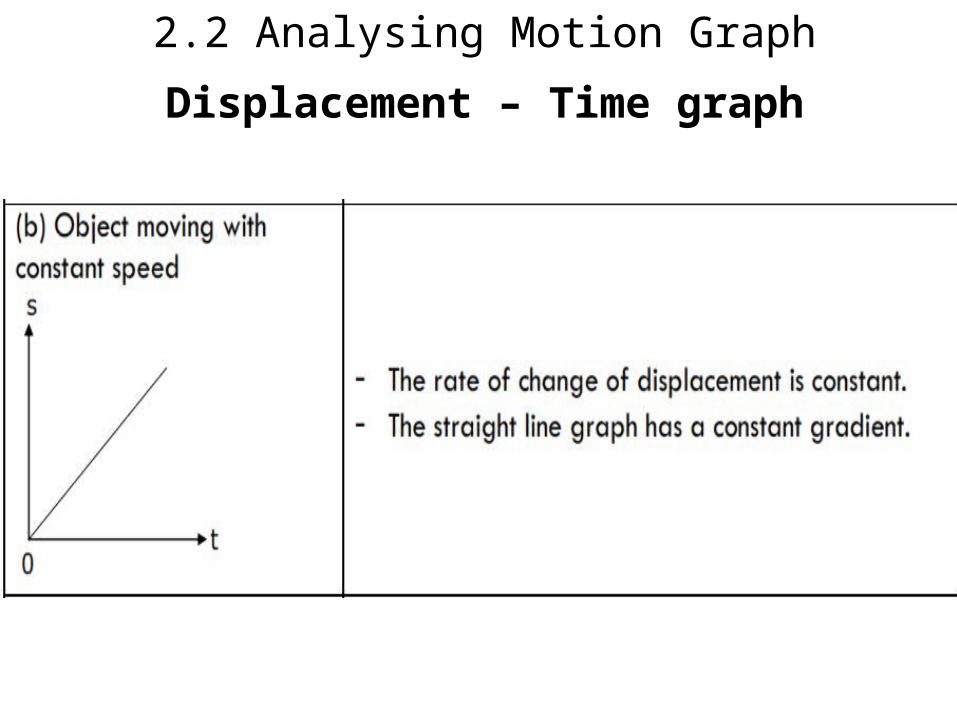
2.2 Analysing Motion GraphDisplacement – Time graph

2.2 Analysing Motion GraphDisplacement – Time graph
Gradient of the graph = velocity of the
object

2.2 Analysing Motion GraphDisplacement – Time graph
1-s m 0.5s 200m 100
Gradient
Isection For
xy
For section II, gradient = 0, which means the velocity at this moment is zero.
1-s m 0.5s 200m 100
Gradient
IIIsection For
xy
The negative sign shows the direction ofThe motion is opposite to the original direction. (Velocity is a vector quantity)

2.2 Analysing Motion GraphDisplacement – Time graph
2.2 Analysing Motion GraphDisplacement – Time graph

2.2 Analysing Motion GraphDisplacement – Time graph

2.2 Analysing Motion GraphDisplacement – Time graph

2.2 Analysing Motion GraphDisplacement – Time graph
A particle starts to move to the north at time, t=0 s. The displacement-time graph above shows the particle moving from its original position from a tree.

(a) What is the displacement of the particle from the tree at the start
of its motion?(b) What is the velocity of the particle from t = 2 s to t = 6 s?(c) For how long did the particle move southwards?(d) At what time did the particle pass the position of the tree?
2.2 Analysing Motion GraphDisplacement – Time graph

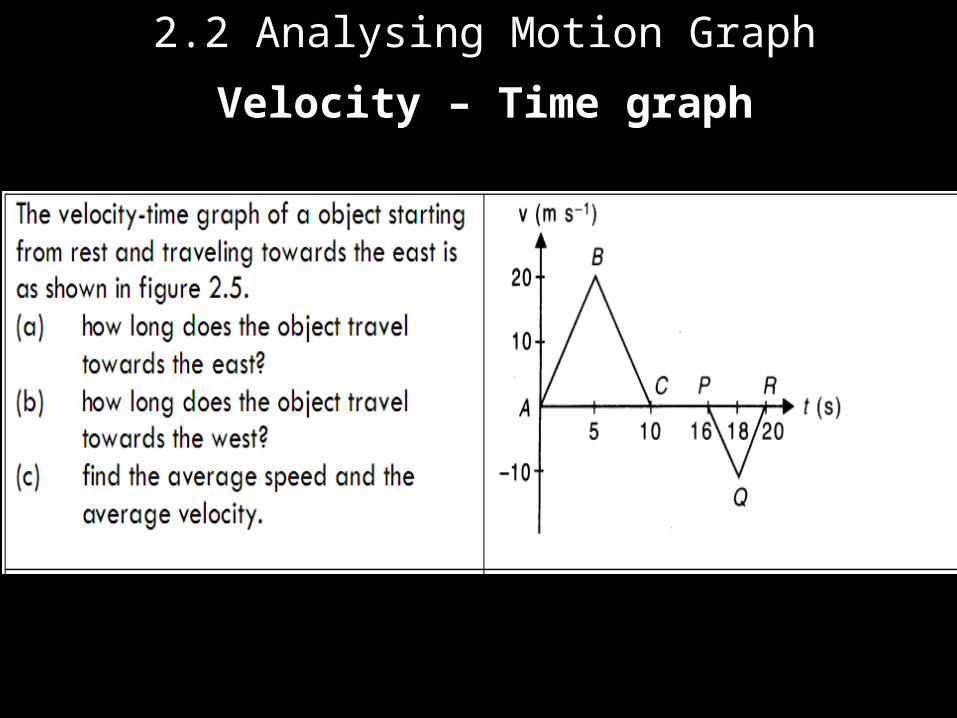
2.2 Analysing Motion GraphVelocity – Time graph
60 m/s

2.2 Analysing Motion GraphVelocity – Time graph
Gradient of the graph = acceleration of
the object

2.2 Analysing Motion GraphVelocity – Time graph
For section II, gradient = 0, which means the car travels at a constant velocity from 20 s to 40 s.
The negative sign indicates a deceleration.
2-
1-
s m 3s 20
s m )060(
Gradient
Isection For
xy
2-
1-
s m 3s 20
s m )600(
Gradient
IIIsection For
xy

2.2 Analysing Motion GraphVelocity – Time graph
Area under the graph = distance travelled

2.2 Analysing Motion GraphVelocity – Time graph

2.2 Analysing Motion GraphVelocity – Time graph

2.2 Analysing Motion GraphVelocity – Time graph
2.2 Analysing Motion GraphVelocity – Time graph

2.2 Analysing Motion GraphVelocity – Time graph

2.2 Analysing Motion Graph

2.2 Analysing Motion Graph

2.2 Analysing Motion Graph
The moving man


![0 Highway Dimension and Provably Efficient … Dimension and Provably Efficient Shortest Path Algorithms ... Graphs and Networks; G.2.2 [Graph Theory]: Graph ... Bauer et al. 2011;](https://static.fdocuments.us/doc/165x107/5b009b417f8b9a256b9041c2/0-highway-dimension-and-provably-efcient-dimension-and-provably-efcient.jpg)


