21LohLymphoLeukemia - UCSF Medical Education · – No trisomy 4/10 or TEL-AML1 unless...
16
6/5/10 1 Acute lymphoblastic leukemia Approaches to risk stratification Mignon Loh, MD Associate Professor of Pediatrics University of California, San Francisco Years From Study Entry Estimated Survival Percentage Improved Survival in Childhood ALL by Study Era 0 20 40 60 80 100 0 2 4 6 8 10 12 1996-2000 (n=3421) 1989-1995 (n=5121) 1983-1988 (n=3711) 1978-1983 (n=2984) 1975-1977 (n=1313) 1972-1975 (n=936) 1970-1972 (n=499) 1968-1970 (n=402) WHO WILL BE CURED?
Transcript of 21LohLymphoLeukemia - UCSF Medical Education · – No trisomy 4/10 or TEL-AML1 unless...

6/5/10
1
Acute lymphoblastic leukemia Approaches to risk stratification
Mignon Loh, MD Associate Professor of Pediatrics
University of California, San Francisco
Years From Study Entry
Est
imat
ed S
urvi
val P
erce
ntag
e
Improved Survival in Childhood ALL by Study Era
0
20
40
60
80
100
0 2 4 6 8 10 12
1996-2000(n=3421)
1989-1995(n=5121)
1983-1988(n=3711)
1978-1983(n=2984)
1975-1977(n=1313)
1972-1975(n=936)
1970-1972(n=499)
1968-1970(n=402)
WHO WILL BE CURED?

6/5/10
2
AND WHO WILL FAIL?
Why is it important to cure ALL the first time around?
Survival after relapse stratified by time to relapse in 1961 pts who relapsed on legacy CCG trials during 1988-2002
Nguyen, et. al, Leukemia Sept. 2008
Current strategies for curing ALL
• Risk groups at diagnosis determine intensity of therapy. – Identify patients destined to relapse in
order to intensify therapy. – Identify patients who will do well with less
intensive therapy to spare acute toxicities and late effects.

6/5/10
3
Why is it important not to overtreat ALL?
• Acute side effects (infections, thrombosis, etc.) are a substantial burden of therapy
• Survivors experience substantial late effects – 62.3% have at least one chronic condition – 27% have a grade 3 or 4 condition
Oeffinger K, NEJM 2006 (15): 1572
Oeffinger et al. 2006
Why is it important not to overtreat ALL?
ALL – “Core Biology”
Real-Time Reference Laboratory System for Risk-Based Classification
Assessment of the Components of Cure
HOST TUMOR
THERAPY
Minimal Residual Disease
Expression Arrays
Genetic Polymorphisms
Drug Metabolism
Proteomics
Courtesy of Bill Carroll

6/5/10
4
Clinical markers for risk stratification
• NCI/Rome risk criteria – Age at diagnosis – Presenting WBC
• B precursor vs. T-cell disease • Prognostic genetic factors
– TT (Trisomy 4, 10, 17) – TEL/AML1, t(12;21) – BCR/ABL, t(9;22) – MLL/AF4, t(4;11) – Hypodiploidy (<44 chromosomes)
• Response to induction therapy
Classification of ALL-AALL03B1
• NCI Risk Group
• Chromosome Number • Trisomy 4, 10, 17 • Hypodiploidy
• Translocations • TEL/AML1 • BCR/ABL • MLL rearranged
• Early Treatment Response
Standard Risk
High Risk
Very High Risk
Low Risk
0 1 2 3 4 5 6 7 8 9 10 11 12 13 14 15 0
20
40
60
80
100
Prob
ability
TEL-‐AML (n =176)
Years Followed
t(4;11) (n = 44)
t(9;22) (n=132)
t(1;19) (n = 139)
Trisomies 4,10,17 (n = 746)
B-‐precursor ALL
Genotype Correlates with Outcome: Children’s Oncology Group Genotype correlates with outcome-legacy
COG data

6/5/10
5
Pro
babi
lity
Ploidy is associated with outcome
0 2 4 6 8 10 12 14 16 0
20
40
60
80
100
Years Followed
4 Yr EFS (%) SE (%) Hypodiploid 47.5 5.8 t(9;22) 29.1 4.1 All Others 77.9 0.6
All Others (n=6590)
<45 x-somes or DI <0.81 (n=82)
t(9;22) (n=132)
AALL03B1
• Eligibility – Age < 30 years – >25% lymphoblasts in marrow – Immunophenotype consistent with ALL – Previously untreated
• Accrual is 2000 patients/year – 213 COG institutions enroll on AALL03B1 – 64% of B-precursor patients are NCI SR (Age < 10 years and WBC < 50K)
Suspected ALL"
• Immunophenotype"
• Cytogenetics "• FISH for trisomies 4, 10, 17"• FISH for BCR-ABL, MLL-AF4, TEL-AML1 "
Marrow/blood samples submitted to Reference Labs for: !• Immunophenotype "• DNA Index"
• Host polymorphisms (optional)"• Cell Banking (optional)"
Local InsNtuNon
Reference Laboratories
Standard Risk B-‐precursor ALL
High Risk B-‐precursor ALL
T-‐cell ALL
Treatment IniNated
Infant ALL
COG ALL ClassificaPon Study: AALL03B1

6/5/10
6
Risk stratification-end induction End induction: Refinement of
initial risk group assignment
Standard Risk-Low
Standard Risk-Avg
Standard Risk-High
Very High Risk
High Risk
High Risk B-
precursor AALL0232
T-cell ALL
AALL0434
Standard Risk B-
precursor AALL0331
Infant ALL
AALL0631
Response variables used for risk stratification
• Rapid Early Response (RER) defined by: – M1 marrow by day 8/15 AND
– End induction (day 29) MRD <0.1% determined by flow cytometry
• Extended induction delivered to patients with >1% MRD or M2 marrow on day 29
– Follow-up MRD and marrow assessment on day 43
Tumor Tumor
Dx
d29
MRD Sensitivity 1/1000 - 1/10,000 24 hr turn around
28.6% of patients positive; Median .069%
Courtesy of Michael Borowitz, MD
Residual Disease Monitoring at End Induction: Flow Cytometry
6/5/10
7
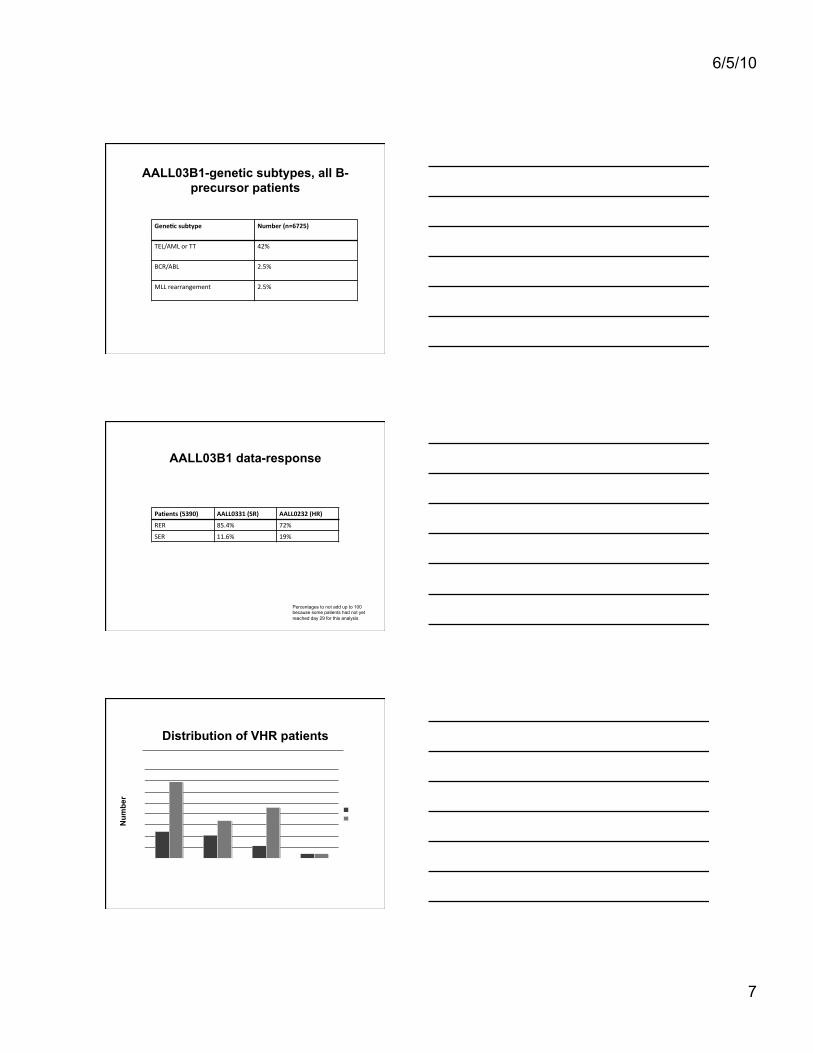
AALL03B1-genetic subtypes, all B-precursor patients
GeneNc subtype Number (n=6725)
TEL/AML or TT 42%
BCR/ABL 2.5%
MLL rearrangement 2.5%
AALL03B1 data-response
PaNents (5390) AALL0331 (SR) AALL0232 (HR)
RER 85.4% 72%
SER 11.6% 19%
Percentages to not add up to 100 because some patients had not yet reached day 29 for this analysis
Distribution of VHR patients
0
10
20
30
40
50
60
70
80
BCR/ABL+ Hypodiploid InductionFailure
SER/MLL
SR
HRNum
ber

6/5/10
8
Can we improve upon current risk stratification?
What is improved risk stratification? A. Improve EFS
B. Decrease morbidity
Variable Hazard
Ratio p-value
Day 29 MRD > 0.01% 4.3 <0.0001 NCI risk group 2.3 <0.0001 Trisomies 4 and 10 0.6 0.0005 Day 8 PB MRD > 0.01% 1.5 0.018 TEL-AML1 0.8 0.15
Day 8 M1 bone marrow 1.0 0.79
Key prognostic variables From POG 9900 series
Borowitz et al., Blood 2008

6/5/10
9
0 1 2 3 4 5 6
0.0
0.2
0.4
0.6
0.8
1.0
Years
Even
t-fre
e su
rviv
al p
roba
bilit
y
1: Day 28 <0.01% (n=1588) 2: Day 28 0.01-0.1% (n=175) 3: Day 28 >0.1% (n=208)
P < 0.0001
88±1%
59±5%
43±5%
5 y EFS
End Induction BM MRD is Highly Prognostic: COG P9900 Borowitz M et al., Blood 2008 Apr 3
51% of events are in the MRD negative group
MRD threshold for AALL03B1
Planned MRD threshold for 2nd generation COG ALL trials
Day 8 PB MRD is Highly Prognostic: COG P9900 Borowitz M et al., Blood 2008 Apr 3
0 1 2 3 4 5 6
0.0
0.2
0.4
0.6
0.8
1.0
Years
Even
t-fre
e su
rviv
al p
roba
bilit
y
1: MRD < 0.01% (n=603) 2: 0.01% < MRD ≤ 0.1% (n=341) 3: 0.1% < MRD ≤ 1.0% (n=501) 4: 1.0% < MRD ≤ 10.0% (n=373) 5: MRD > 10% (n=116)
P < 0.0001
90±2% 5 yr EFS
Only 16% of events occur in the MRD negative group
What additional measurements could we use to identify patients at high risk of relapse…or increased morbidity?
Germline SNPs
Relling, et. al, JAMA 2009

6/5/10
10
0%
10%
20%
30%
40%
50%
60%
70%
80%
90%
1 2 3
%SNP-1> 10%
SNP-1 and MRD (9904 + 9905)
MRD<0.01% 0.01—1% >1%
Percen
t PaNen
t of SNP-‐1> or <%
MRD-‐negaNve paNents alone
P=0.014
% SNP-‐1> 10% % SNP-‐1<10%
• MRD status distribuPon did not differ in % SNP-‐1 ancestry (> or < 10%) • % SNP-‐1 ancestry is associated with relapse even in MRD-‐negaPve paPents
Yang and Relling, et. al 2010
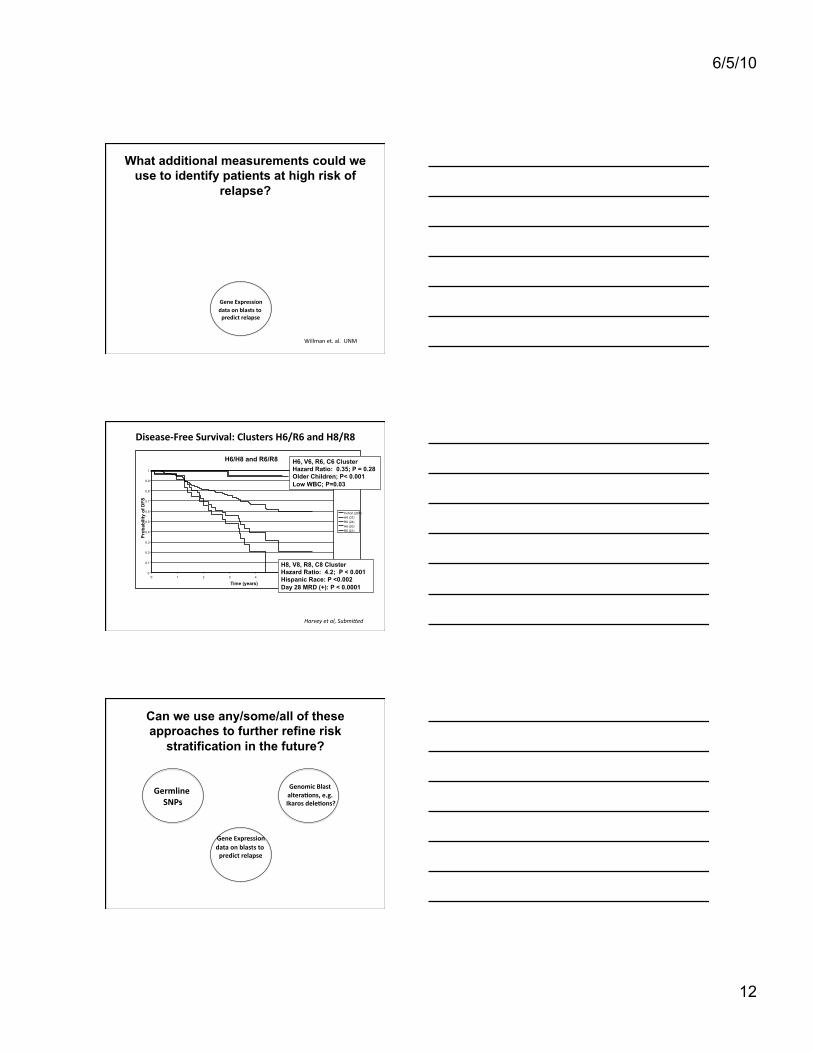
What additional measurements could we use to identify patients at high risk
of relapse?
Genomic Blast alteraPons, e.g.
Ikaros delePons or JAK lesions or High
CRLF2?
Mullighan, et. al, NEJM, 2009
Childhood Cancer TARGET* Initiative: High Risk ALL Pilot Project
*Therapeutically Applicable Research to Generate Effective Treatments
• Discover candidate therapeutic targets by identifying genes that are consistently mutated in lymphoblasts from patients with HR-ALL
• “Team science” approach to COG P9906 samples – COG: Stephen Hunger (Chair), William Carroll, Mini Devidas,
Greg Reaman, Mignon Loh – Labs: Charles Mullighan, Jim Downing, Mary Relling, Cheryl
Willman – NCI Office of Cancer Genomics: Daniela Gerhard – NCI Cancer Diagnosis Program: James Jacobson – NCI Cancer Therapy Evaluation Program: Malcolm Smith – NCI caBIG: Jinghui Zhang

6/5/10
11
High Risk Childhood ALL TARGET Initiative: COG P9906 Study Population
• Trial conducted by POG/COG from 3/00-4/03 • Identical ABFM therapy for all pts • High risk pt population:
– Higher WBC & older age – ~50% DFS on earlier trials
• No pts with Ph+, hypodiploid, or induction failure • Few pts with “favorable” biological subtypes:
– No trisomy 4/10 or TEL-AML1 unless CNS/testicular+ • 276 enrolled, 271 eligible
Lesions associated with poor outcome
Gene Importance score
P9906 IKZF1 (Ikaros) -32.39
BTLA -6.095
EBF1 -5.332
St Jude IKZF1 (Ikaros) -18.724
St Jude – all cases
0 5 10 15 Years
P=0.0002
1 2 3 4 5 6 Years
P<0.0001
IKZF1 mut
no IKZF1 mut
P9906
IKZF1 mut
no IKZF1 mut
0
20
40
60
80
100
Even
t (%
)
0
20
40
60
80
100
Even
t (%
)
0 5 10 15 Years
St Jude - no BCR-ABL1 P=0.01
IKZF1 mut
no IKZF1 mut
0
20
40
60
80
100
Even
t (%
)
Mullighan, NEJM 2008
Pseudokinase Kinase
Mullighan et al. 2009
JAK mutations occur in 10% of high risk ALL patients
6/5/10
12
What additional measurements could we use to identify patients at high risk of
relapse?
Gene Expression data on blasts to predict relapse
Willman et. al. UNM
Disease-‐Free Survival: Clusters H6/R6 and H8/R8
H6/H8 and R6/R8
0 0.1 0.2 0.3 0.4 0.5 0.6 0.7 0.8 0.9
1
0 1 2 3 4 5 6 7 Time (years)
Prob
abili
ty o
f DFS
Cohort (207) H8 (37) R8 (24) H6 (20) R6 (21)
H6, V6, R6, C6 Cluster Hazard Ratio: 0.35; P = 0.28 Older Children; P< 0.001 Low WBC; P=0.03
H8, V8, R8, C8 Cluster Hazard Ratio: 4.2; P < 0.001 Hispanic Race: P <0.002 Day 28 MRD (+): P < 0.0001
Harvey et al, Submi:ed
Can we use any/some/all of these approaches to further refine risk
stratification in the future?
Gene Expression data on blasts to predict relapse
Germline SNPs
Genomic Blast alteraNons, e.g. Ikaros deleNons?

6/5/10
13
…and will there ever be a time when we can integrate these approaches?
Gene Expression data on blasts to predict
relapse
Germline SNPs Genomic Blast
alteraNons, e.g. Ikaros deleNons?
3 yo self reported white male Standard Risk Lacks favorable genePc risk factors Day 29 MRD neg.
3 yo male with PC SNP-‐1 ethnicity > 10%, + Ikaros and JAK2 mutaPon and R8 cluster-‐-‐assigned to EHR with JAK2 inhibitor therapy
COG ALL – How do we improve outcome?
• Optimizing established therapies will not improve outcomes in the highest risk subsets; novel or targeted therapies are required. We will determine if: – Nelarabine improves EFS for patients with T-ALL (AALL0434) – Lestaurtinib (FLT3 inhibitor) improves EFS for infants with MLL-
rearrangements (AALL0631) – Dasatinib in an intensive chemotherapy platform results in a >
60% EFS without SCT in Ph+ ALL subsets (AALL0622) – Clofarabine-based intensification improves EFS for B-precursor
patients at highest risk for relapse
Overview-ALL0031
Frontline Induction/Consolidation (4 weeks)
Consolidation Block 1 Consolidation Block 2
Reinduction 1 & 2 Intensification 1 & 2 Maintenance 1 & 2
HSCT HLA-matched sibling/relative
1 Ag mismatched exclude HLA-DR
Entry on AALL0031
6/5/10
14
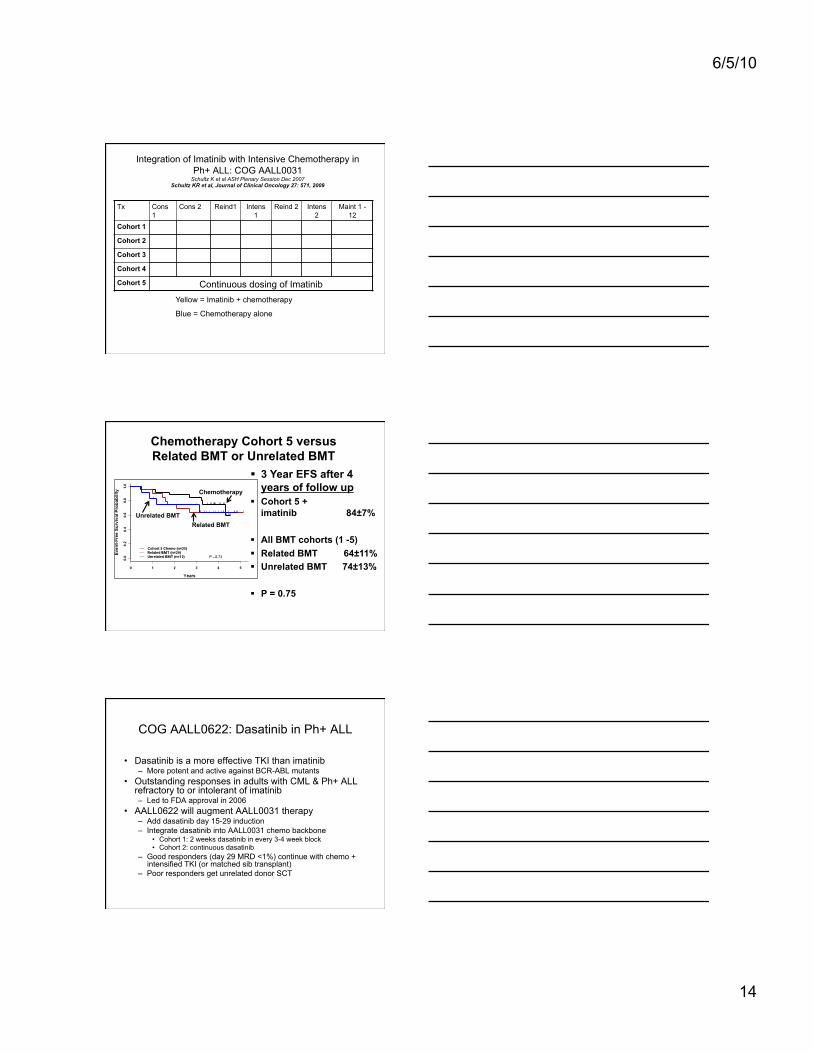
Integration of Imatinib with Intensive Chemotherapy in Ph+ ALL: COG AALL0031
Schultz K et al ASH Plenary Session Dec 2007 Schultz KR et al, Journal of Clinical Oncology 27: 571, 2009
Tx Cons 1
Cons 2 Reind1 Intens 1
Reind 2 Intens 2
Maint 1 - 12
Cohort 1
Cohort 2
Cohort 3
Cohort 4
Cohort 5 Continuous dosing of Imatinib Yellow = Imatinib + chemotherapy
Blue = Chemotherapy alone
Chemotherapy Cohort 5 versus Related BMT or Unrelated BMT
3 Year EFS after 4 years of follow up
Cohort 5 + imatinib 84±7%
All BMT cohorts (1 -5) Related BMT 64±11% Unrelated BMT 74±13%
P = 0.75
Chemotherapy
Unrelated BMT Related BMT
COG AALL0622: Dasatinib in Ph+ ALL
• Dasatinib is a more effective TKI than imatinib – More potent and active against BCR-ABL mutants
• Outstanding responses in adults with CML & Ph+ ALL refractory to or intolerant of imatinib – Led to FDA approval in 2006
• AALL0622 will augment AALL0031 therapy – Add dasatinib day 15-29 induction – Integrate dasatinib into AALL0031 chemo backbone
• Cohort 1: 2 weeks dasatinib in every 3-4 week block • Cohort 2: continuous dasatinib
– Good responders (day 29 MRD <1%) continue with chemo + intensified TKI (or matched sib transplant)
– Poor responders get unrelated donor SCT

6/5/10
15
New Drugs
• No new drugs have been incorporated into standard of care front line ALL therapy since 1970s – New drugs needed for VHR groups such as poor early
responders and relapsed pts
• Sometimes there is a clear molecular target and drug prioritization and testing is “easy” – BCR-ABL and TKI therapy
• More commonly there is no definite target, it is hard to pick the right drug to test, and we lack biological endpoints – Leading candidates ready now for testing are clofarabine and
epratuzumab
ADVL1011
• Phase I trial of JAK inhibitor therapy for relapsed/refractory leukemia and MPN to open this spring
• Starting dose will be 100% of currently used adult dose
• Correlative biology trials will determine target inhibition, reduction of allele burden, etc.
Summary
• We’ve come a long, long way in curing ALL
• We’ve got a long, long way to go for patients who fail currently available therapy
6/5/10
16
Acknowledgements
• Steve Hunger • Bill Carroll • Elizabeth Raetz • Jim Whitlock • Naomi Winick • Mini Devidas, Lead ALL Study Statistician • The ALL Committee and Reference laboratories • COG Investigators