2.1.3 DISTRIBUTED GENERATION/FUEL CELLS Technology …
550
2.1.3 DISTRIBUTED GENERATION/FUEL CELLS Technology Description The ultimate goal of this technology is to develop fuel cell and/or hybrid systems that use natural gas or hydrogen (from coal, natural gas, or other sources) for highly efficient power generation. This also includes standalone applications of small to medium gas turbine systems, as well as advanced turbine systems for cogeneration application. Near-zero CO 2 emissions could be achieved with the integration of CO 2 capture. System Concepts • Hybrid systems that combine fuel cells and gas turbines to create a high-efficiency power module with near-zero emissions for central power or grid support applications. • Unique fuel cell turbine hybrid cycles that incorporate intercoolers, humidified air cycles, and high- pressure ratios to achieve the highest efficiency. • High-efficiency coproduction (electricity and hydrogen) energy systems, utilizing waste heat for making hydrogen from natural gas. • Integration in the long term of CO 2 capture technologies with all of the above systems. • Integration of fuel cells with other heat engines (reciprocating engines, Stirling engines, etc.) to create highly efficient and clean power modules. • Fuel cell systems, including high- and low-temperature units. Representative Technologies • Low- and high-temperature fuel cells. • Optimized gas turbines with higher-pressure ratios, intercoolers, oil-less bearings. • Smart control systems. • Hydrogen separation membranes. • Natural gas reforming. • CO 2 capture. • Membrane separators for air, hydrogen, and CO 2. • Ultra-high temperature steam turbines. Technology Status/Applications • Two different fuel cell turbine hybrid power systems (300 kW) have been designed, built, and operated (Siemens Westinghouse and FuelCell Energy Inc.). Both prototype systems logged more than 6,000 hours of operation each and achieved efficiencies of approximately 52% with near-zero emissions. U.S. Climate Change Technology Program – Technology Options for the Near and Long Term August 2005 – Page 2.1-7
Transcript of 2.1.3 DISTRIBUTED GENERATION/FUEL CELLS Technology …

2.1.3 DISTRIBUTED GENERATION/FUEL CELLS Technology Description
The ultimate goal of this technology is to develop fuel cell and/or hybrid systems that use natural gas or hydrogen (from coal, natural gas, or other sources) for highly efficient power generation. This also includes standalone applications of small to medium gas turbine systems, as well as advanced turbine systems for cogeneration application. Near-zero CO2 emissions could be achieved with the integration of CO2 capture. System Concepts • Hybrid systems that combine fuel cells and gas turbines to create a high-efficiency power module with
near-zero emissions for central power or grid support applications. • Unique fuel cell turbine hybrid cycles that incorporate intercoolers, humidified air cycles, and high-
pressure ratios to achieve the highest efficiency. • High-efficiency coproduction (electricity and hydrogen) energy systems, utilizing waste heat for making
hydrogen from natural gas. • Integration in the long term of CO2 capture technologies with all of the above systems. • Integration of fuel cells with other heat engines (reciprocating engines, Stirling engines, etc.) to create
highly efficient and clean power modules. • Fuel cell systems, including high- and low-temperature units. Representative Technologies • Low- and high-temperature fuel cells. • Optimized gas turbines with higher-pressure ratios, intercoolers, oil-less bearings. • Smart control systems. • Hydrogen separation membranes. • Natural gas reforming. • CO2 capture. • Membrane separators for air, hydrogen, and CO2. • Ultra-high temperature steam turbines. Technology Status/Applications • Two different fuel cell turbine hybrid power systems (300 kW) have been designed, built, and operated
(Siemens Westinghouse and FuelCell Energy Inc.). Both prototype systems logged more than 6,000 hours of operation each and achieved efficiencies of approximately 52% with near-zero emissions.
U.S. Climate Change Technology Program – Technology Options for the Near and Long Term August 2005 – Page 2.1-7

• The Solid State Energy Conversion Alliance (SECA) is in the fourth year of an eight-year program to develop low-cost (< $400 / kW) fuel cell modules for stand-alone and hybrid applications.
• High-temperature fuel cells – such as molten carbonate and tubular solid oxide – are engaged in commercial-scale demonstration tests, but not yet competitively on the market.
• Various elements of high-performance cycles need to be developed to integrate long-term CO2 capture, membrane separation, optimized turbines, low-cost high-performance SECA fuel cells, and ultra-high temperature steam turbines need extensive development.
Current Research, Development, and Demonstration RD&D Goals • By 2010, demonstrate a gas-aggregated FC module larger than 250 kW that can run on coal syngas, while
also reducing the costs of the Solid-State Energy Conversion Alliance fuel cell power system to $400/kW. • By 2012-2015, the program aims to (1) demonstrate a megawatt-class hybrid system at FutureGen with an
overall system efficiency of 50% on coal syngas, (2) demonstrate integrated fuel cell and turbine systems achieving efficiencies of 55% on coal; and (3) integrate optimized turbine systems into zero-emission power plants.
RD&D Challenges • Low-cost, high-performance materials. • Pressurization • Scale up • Aggregation • Simpler manufacturing process and materials in fuel cells to lower costs. • Grid interconnection. • Fuel cell turbine control system for steady-state and dynamic operation. • Developing new components required by long-term cycles integrating CO2 capture. RD&D Activities • High-temperature fuel cell performance advancement for FCT hybrid application. • Systems integration and controls for hybrid FCT application. • Hybrid systems and component demonstration. • Low-cost fuel cell systems. • Develop hydrogen separation, transport, and storage. • Develop methods for CO2 sequestration and/or capture. • Develop high-performance materials, catalysts, and processes for reforming methane. • Develop membranes for separation of air, hydrogen, and CO2.
Recent Progress • Siemens-Westinghouse has demonstrated a nominal 300 kW fuel cell turbine direct-cycle hybrid for more
than 3,000 hours and achieved an electrical efficiency of 53%. • FuelCell Energy Inc. (FCE) has demonstrated a nominal 300 kW fuel cell turbine indirect cycle hybrid for
more than 6,000 hours and achieved an electrical efficiency of 52%. FCE is currently building a fully integrated version of their 300 kW hybrid.
Commercialization and Deployment Activities • Fuel cells are becoming viable in niche applications, and increased production rates are expected to lower
capital costs. • About 300 fuel cell units (mostly 200-kW size) have been installed worldwide. • Currently, there are six industrial teams in the SECA program developing low-cost (< $400/kW) solid
oxide fuel cell technology. The SECA program is supported by a significant core technology program to resolve technical issues. Three of the six SECA industry team have shown significant interest in developing fuel cell turbine hybrid products.
• Energy losses and cost are expected to decline with system refinements.
U.S. Climate Change Technology Program – Technology Options for the Near and Long Term August 2005 – Page 2.1-8
2.2 HYDROGEN 2.2.1 HYDROGEN PRODUCTION FROM NUCLEAR FISSION AND FUSION
Technology Description
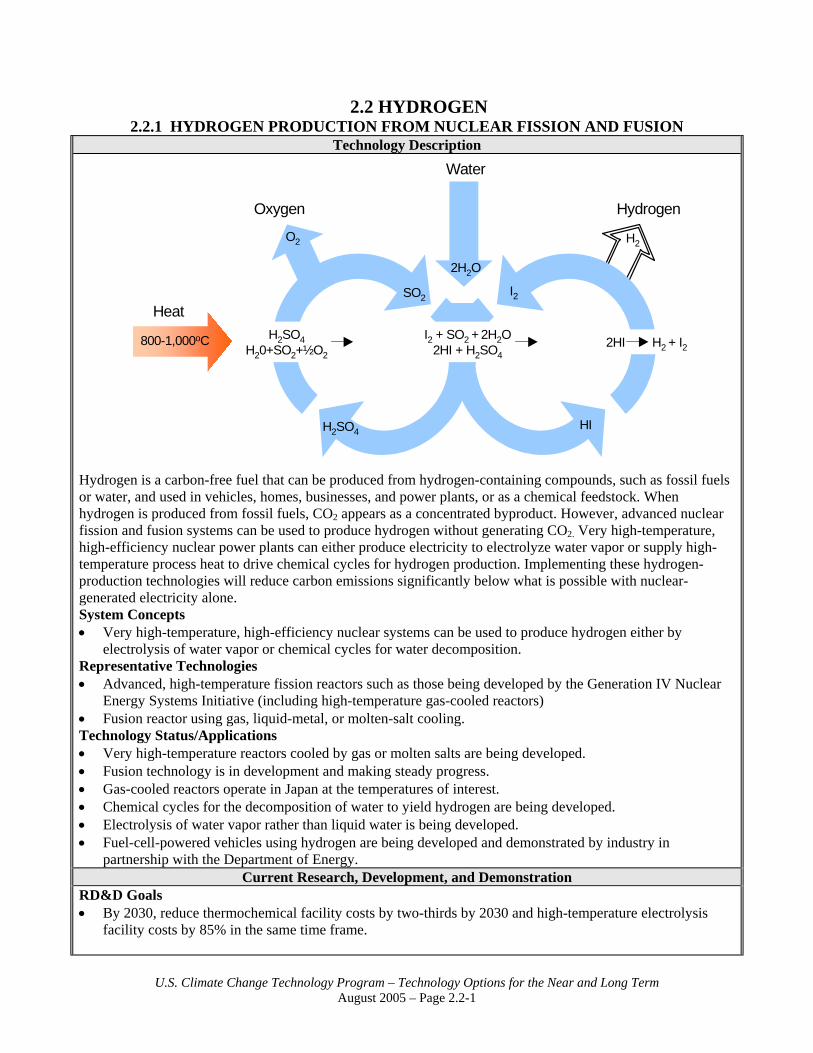
Hydrogen is a carbon-free fuel that can be produced from hydrogen-containing compounds, such as fossil fuels or water, and used in vehicles, homes, businesses, and power plants, or as a chemical feedstock. When hydrogen is produced from fossil fuels, CO2 appears as a concentrated byproduct. However, advanced nuclear fission and fusion systems can be used to produce hydrogen without generating CO2. Very high-temperature, high-efficiency nuclear power plants can either produce electricity to electrolyze water vapor or supply high-temperature process heat to drive chemical cycles for hydrogen production. Implementing these hydrogen-production technologies will reduce carbon emissions significantly below what is possible with nuclear-generated electricity alone. System Concepts • Very high-temperature, high-efficiency nuclear systems can be used to produce hydrogen either by
electrolysis of water vapor or chemical cycles for water decomposition. Representative Technologies • Advanced, high-temperature fission reactors such as those being developed by the Generation IV Nuclear
Energy Systems Initiative (including high-temperature gas-cooled reactors) • Fusion reactor using gas, liquid-metal, or molten-salt cooling. Technology Status/Applications • Very high-temperature reactors cooled by gas or molten salts are being developed. • Fusion technology is in development and making steady progress. • Gas-cooled reactors operate in Japan at the temperatures of interest. • Chemical cycles for the decomposition of water to yield hydrogen are being developed. • Electrolysis of water vapor rather than liquid water is being developed. • Fuel-cell-powered vehicles using hydrogen are being developed and demonstrated by industry in
partnership with the Department of Energy. Current Research, Development, and Demonstration
RD&D Goals • By 2030, reduce thermochemical facility costs by two-thirds by 2030 and high-temperature electrolysis
facility costs by 85% in the same time frame.
Water
Oxygen Hydrogen
Heat
O2
SO2
2H2O
H2
H2SO4H20+SO2+½O2
H2SO4 HI
I2 + SO2 + 2H2O2HI + H2SO4
2HI H2 + I2
I2
800-1,000oC
U.S. Climate Change Technology Program – Technology Options for the Near and Long Term August 2005 – Page 2.2-1

• By 2030, decrease operating costs by three-fourths for both technologies, while thermal efficiency would increases from levels as low as 30% to 40% to more than 50%.
RD&D Challenges • Develop reactor designs and materials that operate at temperatures high enough to achieve needed
efficiencies. • Overcome barriers to economic hydrogen generation by electrolysis. • Develop chemical processes for water decomposition that operate efficiently and reliably. • Demonstrate production and large-scale storage of hydrogen using a nuclear power plant. RD&D Activities • Development of high-temperature materials, separation membranes, advanced heat exchangers, and
supporting systems relating to hydrogen production using the sulfur-iodine (S-I) thermochemical cycle and high-temperature electrolysis.
• Design and development of gas-cooled and lead-bismuth-cooled reactors and hydrogen-production systems are underway, through the Generation IV Nuclear Energy Systems Initiative and the Nuclear Hydrogen Initiative.
• Concept development for high-temperature blanket/cooling systems is underway as part of the fusion program.
Recent Progress • Chemical cycles for hydrogen production are being developed, and the conceptual design is being prepared
for a gas-cooled reactor to couple to the most promising cycles. • Japan’s gas-cooled, high-temperature test reactor operates at 850°C with periodic testing up to 950°C. • Recent analyses indicate that, because of low fuel costs, fission systems could provide cost-effective off-
peak electricity for electrolysis at either onsite or offsite filling stations. Commercialization and Deployment Activities
• High-temperature, high-efficiency test reactors are being operated in China and Japan. • Fuel cell-powered vehicles will create demand for hydrogen in addition to existing demand of the process
chemical and petrochemical industries. • High-temperature reactor designs are being developed through the Generation IV Nuclear Energy Systems
Initiative. High-temperature operation will make reactors competitive with other methods of electrical power generation.
• Partnering with industry to demonstrate hydrogen production using electricity during off-peak demand periods has been proposed.
• Fusion plants could be commercialized late in the second quarter of this century. Market Context • The potential for carbon emissions reductions using these technologies is enormous, including
consideration of the GHG reduction from the significant improvements in the efficiency of electrical power generation.
• Hydrogen fuel cell vehicles will create a demand for hydrogen as a transportation fuel in addition to the demand by the process chemical industry. Petrochemical industry demand for hydrogen will grow as the use of lower-quality crude oils becomes more common in refining.
• Extends the applicability of large fission energy resources and essentially unlimited fusion energy resources to the transportation sector.
U.S. Climate Change Technology Program – Technology Options for the Near and Long Term August 2005 – Page 2.2-2

2.2.2 HYDROGEN SYSTEMS TECHNOLOGY VALIDATION Technology Description
Similar to electricity, hydrogen can be produced from many sources, including fossil fuels, renewable resources, and nuclear energy. Hydrogen and electricity can be converted from one to the other using electrolyzers (electricity to hydrogen) and fuel cells (hydrogen to electricity). Hydrogen is an effective energy-storage medium, particularly for distributed generation. Implementation of hydrogen energy systems could play a major role in addressing climate challenges and national security issues through 2030 and beyond. Today, hydrogen is produced primarily from natural gas using widely known commercial thermal processes. In the future, we can adapt current technologies to produce hydrogen with significantly reduced CO2 emissions, through carbon capture and sequestration processes, and by using renewable and nuclear electricity to produce hydrogen with no production-side CO2 emissions. Using hydrogen in combustion devices or fuel cells results in few, if any, harmful emissions. In the next 20-30 years, hydrogen systems used for stationary and vehicular applications could solve many of our energy and environmental security concerns. Hydrogen could be affordable, safe, domestically produced, and used in all sectors of the economy and in all regions of the country. System Concepts and Representative Technologies • A hydrogen system is comprised of production, storage and distribution, and use. A systems approach is
needed to demonstrate integrated hydrogen production, delivery, and storage, as well as refueling of hydrogen vehicles and use in stationary fuel cells. This could involve providing hydrogen in gaseous and liquid form. Technologies are in various stages of development across the system. Hydrogen made via electrolysis from excess nuclear or renewable energy can be used as a sustainable transportation fuel or stored to meet peak-power demand. It also can be used as a feedstock in chemical processes.
• Hydrogen produced by decarbonization of fossil fuels followed by sequestration of the carbon can enable the continued use of fossil fuels in a clean manner during the transition to the ultimate carbon-free hydrogen energy system.
• For hydrogen to become an important energy carrier – as electricity is now – an infrastructure must be developed. Although the ultimate transition to a hydrogen economy requires significant infrastructure investments, it is possible to develop the components of a hydrogen energy system in parallel with infrastructure. As hydrogen applications become more cost effective and ubiquitous, the infrastructure will also evolve. Beginning with fleets of buses and delivery vans, the transportation infrastructure will evolve to include sufficient refueling islands to enable consumers to consider hydrogen vehicles as attractive and convenient. The development of distributed power systems will begin with natural gas-reformer systems and evolve to provide hydrogen from a variety of resources (for all services), including hydrogen-to-fuel vehicles, reliable/affordable power, lighting, heating, cooling, and other services for buildings and homes.
• The technology-validation effort also provides information in support of technical codes and standards development of infrastructure safety procedures.
Technology Status/Applications • Today, hydrogen is primarily used as a chemical feedstock in the petrochemical, fertilizer, electronics, and
metallurgical processing industries. Hydrogen is receiving new capital investments for transportation and power-generation applications.
• Nearly half of the worldwide production of hydrogen is via large-scale steam reforming of natural gas, a relatively low-carbon fuel/feedstock. In the United States, almost all of the hydrogen used as a chemical (i.e., for petroleum refining and upgrading, and ammonia production) is produced from natural gas. Today,
U.S. Climate Change Technology Program – Technology Options for the Near and Long Term August 2005 – Page 2.2-3

we safely produce about 9 million metric tons of hydrogen annually. Although comparatively little hydrogen is currently used as fuel or as an energy carrier, there are emerging trends that will drive the future consumption of hydrogen.
• The long-term goal of the DOE Hydrogen, Fuel Cell & Infrastructure Technologies (HFCIT) Program is to make a transition to a hydrogen-based energy system in which hydrogen will join electricity as a major energy carrier. Furthermore, the hydrogen will be derived from domestically plentiful resources, making the hydrogen economy an important foundation for sustainable development and energy security.
• Requirements in California – especially the Los Angeles basin – are propelling the development of zero-emission vehicles, which in turn, provide incentives for the growth of fuel cell cars, trucks, and buses. Several bus fleets are currently incorporating hydrogen and fuel cell technologies into their fleets. Major car manufacturers are developing fuel cell vehicles in response to concerns about greenhouse gas and other emissions, and in response to policy drivers, especially for higher efficiencies and reduced oil consumption.
• Integrating the components of a hydrogen system in a variety of applications enables the continued development of infrastructure that is needed as we move from concept to reality. The development of the components of an integrated hydrogen system has begun:
• Production: Hydrogen production from conventional fossil-fuel feedstocks is commercial, and results in significant CO2 emissions. Large-scale CO2 sequestration options have not been proven and require R&D. Current commercial electrolyzers are 60%-70% efficient, but the cost of hydrogen is strongly dependent on the cost of the electricity used to split water into hydrogen and oxygen. Production processes using wastes and biomass are under development, with a number of engineering scale-up projects underway. Longer-term, direct hydrogen production processes (photoconversion) are largely in the research stage, with significant progress being made toward development of cost-effective, efficient, clean systems.
• Storage and Distribution: Liquid and compressed gas tanks are available and have been demonstrated in a small number of bus and automobile demonstration projects. Lightweight, fiber-wrapped tanks have been developed and tested for higher-pressure hydrogen storage. Experimental metal hydride tanks have been used in automobile demonstrations. Alternative solid-state storage systems using alanates and carbon nanotubes are under development. Current commercial practices for the distribution and delivery of hydrogen include cryogenic liquid and high-pressure trucks, and limited pipeline transmission. Longer-term, lower-cost delivery infrastructure and technologies will be needed.
• Use: Significant demonstrations by domestic and foreign auto and bus companies have been undertaken in Japan, Europe, and the United States. Small-scale power systems using fuel cells are being beta-tested. Small fuel cells for battery replacement applications have been developed.
Current Research, Development, and Demonstration RD&D Goals • The overall goal in this area is to validate, by 2015, integrated hydrogen and fuel cell technologies for
transportation, infrastructure, and electric generation in a systems context under real-world operating conditions.
• By 2005, demonstrate that an energy station (coproduction of hydrogen as fuel for a stationary fuel cell and for a fuel-cell vehicle) can produce electricity for 8 cents/kWh and $3.60/gallon gasoline equivalent.
• By 2008, demonstrate stationary fuel cells with a durability of 20,000 hours and 32% efficiency. • By 2009, demonstrate vehicles with greater than 250-mile range and 2,000-hour fuel cell durability. • By 2009, establish hydrogen production at $3/gallon gasoline equivalent. • By 2015, provide critical statistical data that demonstrate that fuel cell vehicles can meet targets of 5,000-
hour fuel cell durability, storage systems can efficiently meet 300+ mile range requirements, and H2 fuel can cost less than $2.50/gallon gasoline equivalent.
• The technology validation effort also will provide sufficient information in support of technical codes and standards development of infrastructure safety procedures.
RD&D Challenges • Low-cost and durable fuel cells need to be developed and demonstrated that can make significant market
penetrations in the transportation and electric-generation sectors.
U.S. Climate Change Technology Program – Technology Options for the Near and Long Term August 2005 – Page 2.2-4

• Low-cost, low-weight, and high energy-density storage systems need to be developed so that there is no compromise to vehicle costs and existing vehicle passenger or trunk compartments.
• Hydrogen can be produced and delivered at a cost that is competitive on a cents/mile basis with current vehicles.
• Codes and standards must be developed and implemented. RD&D Activities • The overall strategy of the HFCIT Program is to conduct a comprehensive and balanced program that
includes mid- and long-term research and development of hydrogen production, storage, and utilization technologies; integrated systems and technology validation using close collaboration with industry that develops, demonstrates, and deploys critical technologies emerging from research and development; and an analysis element that helps determine the performance and cost targets that technologies must meet to achieve goals of the HFCIT Program, as well as specific project objectives determined by peer review.
• DOE’s HFCIT Program is carried out by national laboratories, universities, and the private sector, including cost-shared industry-led efforts, and CRADA collaborations between industry and the labs.
Recent Progress • Hydrogen refueling equipment (liquid delivered to the facility) – to provide hydrogen to the small fleet of
hydrogen fuel cell vehicles that are currently being tested in California – has been installed by the California Fuel Cell Partnership (Sacramento, California).
• Three Power Park facilities that generate power from fuel cells and engines and hydrogen fuel for vehicles have been built and are being tested. Natural gas, biomass, wind, and solar energy are being used to generate the hydrogen fuel for both stationary power and for vehicles.
• An Energy Station that coproduces hydrogen fuel from natural gas for both stationary and vehicles applications has been demonstrated.
• Four awards have been made to major automobile and energy company teams to demonstrate up to 120 vehicles and 28 stations that will validate program targets under real-world operating conditions.
Commercialization and Deployment Activities • Major industrial companies are pursuing R&D in fuel cells and hydrogen reformation technologies with a
mid-term (5-10 years) time frame to deploy these technologies for both stationary and vehicular applications. These companies include ExxonMobil, Shell, Chevron Corporation, BP, General Motors, Ford, Daimler-Chrysler, Hyundai, Toyota, Honda, Nissan, BMW, United Technology Corporation Fuel Cells, Ballard, Air Products, and Praxair.
• The National Vision of America’s Transition to a Hydrogen Economy, completed in November 2002, outlines a vision for America’s energy future – a more secure nation powered by clean, abundant hydrogen. This document was used as the foundation for formulating the elements of the National Hydrogen Energy Roadmap.
• The Fuel Cell Report to Congress, completed in February 2003, was a request from Congress that DOE report (within 12 months) to the House and Senate Committees on Appropriations, on the technical and economic barriers to the use of fuel cells in transportation, portable power, stationary, and distributed power generation applications.
• In November 2002, the U.S. Department of Energy issued its National Hydrogen Energy Roadmap. The purpose of the roadmap was to identify the activities required to realize hydrogen’s potential to address U.S. energy security, diversity, and environmental needs.
• The DOE Office of Energy Efficiency and Renewable Energy (EERE) – with support from the DOE Offices of Fossil Energy; Science; and Nuclear Energy, Science, and Technology – completed a Hydrogen Posture Plan in response to the President’s Hydrogen Fuel Initiative. This document outlines the activities, milestones, and deliverables that the Department plans to pursue to support America’s shift to a hydrogen-based energy system.
• The DOE Hydrogen, Fuel Cells, and Infrastructure Technologies Program completed a Multiyear Research, Development, and Demonstration (RD&D) Plan in February 2005, detailing the goals, objectives, technical
U.S. Climate Change Technology Program – Technology Options for the Near and Long Term August 2005 – Page 2.2-5

targets, tasks, and schedule for EERE’s contribution to the DOE Hydrogen Program. • The DOE Office of Fossil Energy (in June 2003) completed the FE Hydrogen Program Plan, focusing on
the research, development, and demonstration activities that are required to develop advanced hydrogen production, storage, and delivery technologies from fossil fuels.
• The Basic Research Needs for the Hydrogen Economy, completed by the DOE Office of Basic Energy Sciences in 2003, outlines the findings from the Basic Energy Sciences Workshop on Hydrogen Production, Storage, and Use.
• The DOE Nuclear Energy, Science, and Technology Program completed the Nuclear Hydrogen R&D Plan in March 2004 to identify the candidate advanced hydrogen production technologies most suitable for nuclear energy, assess their viability, and prioritize the needed R&D to enable the demonstration of nuclear hydrogen production. The DOE Nuclear Energy, Science, and Technology Program also completed the Nuclear Hydrogen Initiative Ten-Year Program Plan in March 2005, identifying objectives and priorities to provide programmatic direction within the U.S. Department of Energy (DOE) and among the program participants or collaborators, including national laboratories, industry, universities, and international participants.
U.S. Climate Change Technology Program – Technology Options for the Near and Long Term August 2005 – Page 2.2-6

2.2.3 HYDROGEN PRODUCTION AND DISTRIBUTION USING ELECTRICITY AND FOSSIL/ALTERNATIVE ENERGY
Technology Description Similar to electricity, hydrogen can be produced from many sources, including fossil fuels, renewable resources, and nuclear energy. Today, industrial hydrogen is produced primarily from natural gas using widely known commercial thermal processes. In the future, we can adapt current technologies through advanced development to produce hydrogen with significantly reduced overall CO2 emissions, through carbon capture and sequestration – and by using renewable and nuclear electricity to produce hydrogen with no production-side CO2 emissions. System Concepts and Representative Technologies • Natural gas can be delivered to refueling stations using existing pipelines and re-formed into hydrogen on-
site. The infrastructure costs for small-scale, distributed production would be much lower than that required to pipe or truck mass-produced hydrogen from long distances. By making hydrogen from natural gas, we can also take advantage of existing natural gas infrastructure such as storage cylinders, pipelines, and compressors.
• Hydrogen made via electrolysis from nuclear or renewable power can be used as a sustainable transportation fuel or stored to meet peak-power demand. Hydrogen as a storage medium enables intermittent renewable power systems to provide reliable power, even when the wind is not blowing or the sun is not shining.
• Hydrogen produced from fossil fuels (followed by sequestration of the carbon) can enable the continued use of fossil fuels in a clean manner during the transition to the ultimate carbon-free hydrogen energy system.
• Biomass can be used to produce hydrogen, electricity, and other value-added coproducts such as activated carbon, fuel additives, and adhesives, when it is thermally treated under relatively mild conditions. This is part of the biorefinery concept, wherein fuels, power, and products are produced from biomass resources in an integrated process.
• Hydrogen separation- and purification-process improvements offer cost-reduction and efficiency improvement opportunities for current fossil-based systems.
• An ultimate hydrogen economy vision includes hydrogen production from several processes, including high-temperature thermochemical water splitting cycles, direct photoelectrochemical semiconductor-based systems, and biological systems.
• Transport and distribution concepts and technologies include evaluation of existing natural gas pipelines for use to transport hydrogen and natural gas mixtures or pure hydrogen, development of new pipeline materials to reduce costs and resolve hydrogen embrittlement issues, development of more reliable and lower-cost hydrogen-compression technologies, development of more energy-efficient and lower-cost hydrogen liquefaction technology,and the evaluation of novel solid or liquid carriers for hydrogen delivery.
Technology Status/Applications • Nearly half of the worldwide production of hydrogen is via large-scale steam reforming of natural gas (a
relatively low-carbon fuel/feedstock). In the United States, almost all of the hydrogen used as a chemical (i.e., for petroleum refining and upgrading, ammonia production) is produced from natural gas. Today, we produce and utilize 9 million metric tons of hydrogen annually in the United States. Although comparatively little hydrogen is currently used as fuel or as an energy carrier, there are emerging technologies such as fuel cells that will drive the future consumption of hydrogen into the transportation and electric-generation sectors.
• Hydrogen production from conventional fossil-fuel feedstocks is commercial (on a large scale), but results in significant CO2 emissions.
• Current commercial electrolyzers are 60%-70% efficient, but the cost of hydrogen is strongly dependent on the cost of electricity.
• Biomass feedstocks (such as agricultural and forest residues, switchgrass and willow trees, and municipal waste) are being evaluated and tested for dedicated hydrogen production and multiproduct biorefineries.
U.S. Climate Change Technology Program – Technology Options for the Near and Long Term August 2005 – Page 2.2-7

Current Research, Development, and Demonstration • Today, hydrogen is transported by cryogenic liquid truck
and high-pressure tube trailers at a very high cost. Some is transported through a very limited hydrogen pipeline infrastructure. Research on lower-cost hydrogen distribution technologies is just now being initiated.
RD&D Goals • By 2006: (1) completion of research of small-scale steam
methane reformers with a projected cost of $3.00/kg hydrogen at the pump; (2) development of alternative reactors, including auto-thermal reactors; and (3) evaluation of whether renewable energy integrated hydrogen production by water electrolysis can achieve 64% net energy efficiency at a projected cost of $5.50/kg, delivered at 5,000 psi.
• By 2010: At the pilot-plant scale, demonstrate (1) membrane separation and reactive membrane separation technology for hydrogen production from coal, and (2) distributed hydrogen production from natural gas with a projected cost of $2.50/kg hydrogen at the pump.
• By 2015: At the laboratory-bench scale, demonstrate (1) a photo-electrochemical water-splitting system and (2) a biological system for water-splitting (or other substrates) that both show potential to achieve long-term costs that are competitive with conventional fuels and reduce the cost of hydrogen distribution to $1/kg.
RD&D Challenges • Key challenges to commercializing small-scale distributed production technology are: (1) reducing the
capital equipment costs; (2) reducing the cost of operating and maintaining these systems; and (3) using components that can withstand wide temperature ranges under which these systems operate.
• Electrolyzers operating at higher temperatures could provide more cost-effective hydrogen (higher efficiency/reduced electricity demand). Integration with intermittent renewable resources requires development of control strategies and/or design modifications.
• Improved heat and process integration as well as improved catalyst and membrane technology is needed to reduce the cost and improve the energy efficiency for the production of hydrogen from biomass.
• Hydrogen production via chemical cycles using high-temperature heat from nuclear power plants or solar collection facilities will need to be developed and then demonstrated.
• Photoconversion R&D efforts – including photoelectrochemical and photobiological processes – are presently in the exploratory research stage. Biological production of hydrogen from other substrates is also in the exploratory research stage. To continue advancing these technologies, research must be supported.
• Pipeline development to reduce pipeline capital and installation costs while resolving hydrogen embrittlement issues.
RD&D Activities • The overall strategy of the HFCIT Program is to conduct a comprehensive and balanced program that
includes mid- and long-term research and development of hydrogen production, storage, and utilization technologies; integrated systems and technology validation using close collaboration with industry that develops, demonstrates, and deploys critical technologies emerging from research and development; and an analysis element that helps determine the performance and cost targets that technologies must meet to achieve goals of the HFCIT Program – as well as specific project objectives determined by peer review.
• DOE’s HFCIT Program is carried out by national laboratories, universities, and the private sector, including cost-shared industry-led efforts, and CRADA collaborations between industry and the labs.
Recent Progress • Air Products and Chemicals Inc. achieved a three times reduction in hydrogen purification cost compared
with commercially available units
Hydrogen production by photovoltaic hydrolysis.
U.S. Climate Change Technology Program – Technology Options for the Near and Long Term August 2005 – Page 2.2-8

• GE Global Research completed R&D for a highly efficient autothermal cyclic reformer for integration into the hydrogen generation system.
• Gas Technology Institute (GTI) developed a second-generation fuel processor and a hydrogen filling station with a fast-fill dispensing system.
• These three efforts indicate that the technology is approaching $3/gge for dispensed hydrogen from natural gas (690 kg/day, >100 units annually, $4/MMBTU NG, 90% utilization).
• An autothermal reformer was installed and operated at a transit agency in California to generate hydrogen for buses and other vehicles. Also at this facility, a PV-electrolysis system is operated to provide renewable hydrogen to the same vehicles.
• Increased photobiological efficiency of absorbed sunlight energy to ~15% (5% in 2003), found the first designer proton-channel gene, and designed the DNA sequence for the necessary proton channel to increase system efficiency
• Achieved 1,000 hours durability (100 hour in 2003) with new gallium nitride material for photoelectrochemical hydrogen production
• Oak Ridge National Laboratory (ORNL) developed a new proton transport membrane that – when used in a less capital intensive, single-step reactor – could cost about a quarter less than conventional hydrogen-purification technologies.
• Air Products and Chemicals Inc. fabricated a commercial-size ceramic membrane and operated a pilot scale prototype at 24 MSCFD of hydrogen.
• The National Renewable Energy Laboratory (NREL) developed a new catalyst for biomass gasification with reduced coking and improved attrition characteristics.
• More than 150 potential thermochemical cycles have been identified and have been screened for energy efficiency and practicality for use with solar concentrators to produce hydrogen from water and sunlight. Four families of cycles have been selected and are being researched.
Commercialization and Deployment Activities • In an industry-university-national lab partnership, agricultural residues are being used to produce hydrogen
and valuable coproducts. Peanut shells represent both a waste-disposal issue and a valuable resource. Pyrolysis of the densified shells results in a valuable vapor stream that can be used to produce chemicals and hydrogen, and in a solid stream that is used to make activated carbon. This concept is currently being tested in a pilot plant, in preparation for operation at an industrial site in Georgia.
• An industry-led project is installing a small-scale steam methane reformer to provide hydrogen for vehicles in the Las Vegas, Nevada, area.
U.S. Climate Change Technology Program – Technology Options for the Near and Long Term August 2005 – Page 2.2-9

2.2.4 HYDROGEN STORAGE Technology Description
Unlike electricity, hydrogen can be stored for long periods of time without significant losses. Today, hydrogen is stored as a cryogenic liquid or compressed gas, and transported by cryogenic liquid or high-pressure trucks; and, to a limited extent, by gaseous pipelines. In the future, it could be stored and possibly transported in chemical and metal hydrides, carbon nanostructured materials, and high surface area adsorbents. In such forms, hydrogen would be more amenable to safe and efficient distribution and storage. In the meantime, current technologies can be adapted to store and distribute hydrogen to the emerging transportation and stationary markets for hydrogen. System Concepts and Representative Technologies • There are four broad hydrogen storage approaches
currently under development: (1) composite pressure vessels, which will contain the hydrogen as a compressed gas or cryogenic vapor; (2) physical absorption on high-surface-area lightweight carbon structures; (3) reversible metal hydrides; and (4) chemical hydrides. Improving hydrogen compression and/or liquefaction equipment – as well as evaluating the compatibility of the existing natural gas pipeline infrastructure for hydrogen distribution – are also planned.
• Materials-based approaches such as solid-state materials or liquids may offer increased safety for onboard vehicular storage of hydrogen, because tank punctures or ruptures would not result in large energy releases. These approaches also require less volume than pressurized or liquid systems. Stationary applications would also benefit from the successful development of such systems.
Technology Status/Applications • Most prototype vehicles store hydrogen in composite tanks at high pressures (5,000 or 10,000 psi), while
some store liquid hydrogen at 20 K. There are limited demonstrations of vehicles with metal hydrides and chemical hydrides, such as sodium borohydride. Metal hydrides are used in limited stationary applications where weight is not a critical factor, and where waste heat is available at the appropriate temperature for hydrogen release.
• Current R&D efforts are focused on improving performance (i.e., weight, volume, charging/discharging rates, cycle life, safety, etc.) and lowering cost.
• Particularly notable are recent advances in storage energy densities, primarily focused on mobile applications. The composite tank development is a prime example of a successful technology partnership among the national labs, DOE, and industry.
• Industrial investment in chemical hydride development has recently been initiated
High-pressure, all-composite gaseous hydrogen storage cylinders encourage commercialization of hydrogen gas-powered vehicles.
Carbon nanotube structure and micrographs.
U.S. Climate Change Technology Program – Technology Options for the Near and Long Term August 2005 – Page 2.2-10

• Continued improvements are still required to meet perceived customer demands in vehicular applications, in particular with respect to convenience, safety, and cost.
Current Research, Development, and Demonstration RD&D Goals • By 2010, develop and verify hydrogen storage systems with 6 weight-percent, 1,500 watt-hrs/liter energy
density, and at a cost of $4/kWh of stored energy. • By 2015, develop and verify hydrogen storage systems with 9 weight-percent, 2,700 watt-hrs/liter energy
density, and a cost of $2/kWh of stored energy – and develop the associated technology. RD&D Challenges • Onboard hydrogen storage for transportation applications requires increased storage density, so that the
volume and weight of storage systems can be reduced while providing range equal to that of a conventionally fueled vehicle, without compromising vehicle weight and performance. Technologies that meet performance (capacity, cycle life, charging/discharging kinetics, efficiency, etc.), safety and cost are required.
• Fundamental understanding of chemical and metal hydrides and carbon nanostructured materials as hydrogen storage media is needed to enable the efficient and timely development of storage systems that are inherently safe and more efficient and convenient than current systems.
• Research and development of advanced materials-based hydrogen storage systems – including chemical hydrides, metal hydrides, such as amides and complex metal hydrides, and carbon materials – needs to be broadened, with deployment of the resultant systems in prototype vehicles and/or at user sites.
• Thermal management, particularly for metal hydride systems, is critical to meet required refueling times. Efficiency and energy requirements to release hydrogen from storage systems must also be addressed.
• Production processes for materials-based technologies need to be developed and scaled-up with industry. • Off-board regeneration efficiency for chemical hydrogen storage needs to be improved and life-cycle
energy and environmental impact needs to be assessed. • For the interim approach of physical storage, low-cost tanks that meet safety and performance requirements
for high-pressure or cryocompressed storage – as well as improved hydrogen compressors – are needed. • Improved liquefaction equipment that uses less energy to liquefy hydrogen compared to conventional
processes (where 30%-35% of the energy contained in the hydrogen is required) could provide additional storage options for stationary applications and more energy-efficient and lower-cost transport of hydrogen by cryogenic liquid trucks.
• New hydrogen compression technology to improve reliability and reduce cost. RD&D Activities • The overall strategy of DOE’s Hydrogen Program is to conduct a comprehensive and balanced program
that includes mid- and long-term research and development of hydrogen production, storage, and utilization technologies; integrated systems and technology validation with close industry collaboration that develops, demonstrates, and deploys critical technologies emerging from research and development; and an analysis element that helps determine the performance and cost targets that technologies must meet to achieve the overall goals of the Hydrogen Program, as well as the specific project objectives determined by peer review.
• RD&D for DOE’s Hydrogen Program is carried out by national laboratories, universities, and the private sector, including CRADA collaborations between industry and labs, and cost-shared industry-led efforts.
Recent Progress • “Centers of Excellence” were established in FY 2005 with multiple Federal laboratory, industry, and
university partners, focusing collaborative research in the three key areas of metal hydrides, chemical hydrogen storage, and carbon-based materials.
• High-pressure, composite storage tanks have been developed through the combined efforts of industry, national labs, and universities. Building on DOE-funded industry research, these tanks have been tested and certified, and are now being used in prototype hydrogen vehicles.
U.S. Climate Change Technology Program – Technology Options for the Near and Long Term August 2005 – Page 2.2-11

• A prototype complex metal hydride system for 1 kg of hydrogen was developed using sodium alanate (NaAlH4) and provides a basis to investigate critical issues such as performance and thermal management. Sodium borohydride (NaBH4) was demonstrated in a prototype vehicle, and efforts are underway to investigate regeneration efficiency of the spent fuel.
• A novel thermal hydrogen compressor is being developed in an industry-led project. This compressor operates in conjunction with advanced hydrogen production technologies and improves the efficiency and economics of the compression and hydrogen utilization process. The thermal compressor is an absorption-based system that uses the properties of reversible metal hydride alloys to silently and cleanly compress hydrogen; hydrogen is absorbed into an alloy bed at ambient temperature; and, subsequently, is released at elevated pressure when the bed is heated with hot water. Compression energy can be supplied by waste heat or solar hot water.
Commercialization and Deployment Activities • High-pressure tanks (up to 10,000 psi) have been demonstrated in prototype vehicles, and more than 1,500
have been built and tested. • Through a national laboratory and industry effort, a prototype cryocompressed tank was constructed and is
being tested onboard a pickup. • An industry-led project is developing metal-hydride storage containers for use on scooters, wheelchairs,
and other personal mobility products.
U.S. Climate Change Technology Program – Technology Options for the Near and Long Term August 2005 – Page 2.2-12

2.2.5 HYDROGEN USE Technology Description
Almost all of the hydrogen produced in the United States each year (about 9 million tons) is currently used as an industrial feedstock, primarily in the fertilizer and petroleum-refining industries. During the next 20-30 years, solutions for energy security and environmental concerns may be based on development of domestic hydrogen-based energy systems for vehicle and electric power applications. Hydrogen’s use as an energy carrier is gaining worldwide interest with development of efficient, clean fuel cell systems that could potentially replace the internal combustion engine in vehicles and provide power in stationary and portable power applications. If pure hydrogen is used as a fuel, fuel cells emit only heat and water as byproducts. Hydrogen can also be used as a cleaner-burning fuel in internal combustion engines (after slight modifications) and in gas turbines or turbine/fuel cell hybrid systems to provide electric power. A fuel cell is a device that uses hydrogen (or a hydrogen-rich fuel) and oxygen to create an electric current via an electrochemical reaction. This process is inherently much more efficient than combustion processes, which lose a significant amount of the embodied energy in the fuel to heat. A single fuel cell consists of an electrolyte and two catalyst-coated electrodes (a porous anode and cathode) and produces enough electricity for only the smallest applications. To provide the power needed for larger applications – such as powering a vehicle – individual fuel cells are combined in series into a fuel cell stack. A typical fuel cell stack may consist of hundreds of fuel cells. The fuel cell stack is the “heart” of the energy system, which also includes compressor systems, current converters, thermal and water management systems, some stationary applications, and fuel-processor systems. There are several types of fuel cells currently under development, classified primarily by the kind of electrolyte they employ. Each has its own advantages, limitations, and potential applications. This technology brief will focus on the fuel cells most suitable for transportation and distributed power generation applications – the polymer electrolyte membrane (PEM) fuel cell system. The PEM fuel cell is a low-temperature fuel cell that offers high-power density, low weight and volume, and rapid-start capabilities. It requires a noble-metal catalyst (e.g., platinum) and operates on pure hydrogen. Other types of fuel cells, which are generally more suitable for larger power facilities (e.g., molten carbonate and solid oxide) are covered elsewhere in this report (see sections 2.1.1 and 2.1.3). Hydrogen’s use in gas turbines and internal combustion engines is also covered separately in this report (see sections 2.1.2 and 1.1.1). System Concepts and Representative Technologies • Due to their fast start-up time, low sensitivity to orientation, and favorable power-to-weight ratio, polymer
electrolyte membrane (PEM) fuel cells are the current focus for use in light-duty vehicles. Their ability to cycle on and off, provide higher durability due to low-temperature operations, and offer a relatively small footprint also makes them suitable for distributed power applications.
• PEM fuel cell vehicles with electric power trains operating on pure hydrogen supplied to onboard storage systems. These hydrogen vehicles are fueled at distributed refueling stations.
• PEM fuel cell systems for distributed stationary power applications, including backup power units, grid management, power for remote locations, stand-alone power plants for cities or towns, distributed power generation for buildings and industrial facilities, and combined heat and power generation.
• For fuel cells and fuel cell stacks: membrane electrode assemblies and high-temperature membranes, non- or low-platinum catalysts, and bipolar plates.
U.S. Climate Change Technology Program – Technology Options for the Near and Long Term August 2005 – Page 2.2-13

• Compressor/expander technologies to enable pressurized operation of fuel cells • Thermal- and water-management technologies to recover and utilize waste heat and water • Physical and chemical sensors to detect hydrogen leaks and monitor hydrogen purity • Fuel-flexible fuel processors for stationary applications. Technology Status/Applications • Industrial participation in PEM system development is expanding, with all major automobile manufactures
and several fuel cell-specific companies investing in development and demonstration activities for both vehicles and power generation.
• Current PEM fuel cell systems do not offer the cost or performance required by end users. Researchers and technology developers are working to overcome a variety of technical barriers to make these systems commercially viable.
• Residential PEM fuel cell units, typically 5-7kW in size, are being developed and demonstrated by several companies. PEM fuel cell-powered buses, taxis, and passenger vehicles are also being demonstrated in limited numbers around the world. For the most part, these demonstration units are essentially custom-built by the manufacturers. Facilities to manufacture these systems in large quantities are still in development.
Current Research, Development, and Demonstration RD&D Goals • By 2010, develop a 60% peak-efficient, durable, PEM fuel cell power system for transportation at a cost
of $45/kW, and a distributed generation (50-250 kW) PEM fuel cell system operating on natural gas or propane that achieves 40% electrical efficiency and 40,000 hours durability at $400-750/kW.
• By 2015, reduce the cost of PEM fuel cell power systems to $30/kW for transportation systems. RD&D Challenges Cost and durability are the major barriers to fuel cell commercialization. For transportation applications, which have the most stringent cost and durability requirements, fuel cell costs need to be decreased by a factor of 5,l and durability needs to be increased by a factor of 3 to be competitive with current vehicle technologies. R&D challenges include: • Durable electrodes with low precious-metal content • High-volume fabrication processes for membrane electrode
assemblies and bipolar plates • Improved air electrode performance to raise cell voltage, increase fuel
cell stack efficiency, and reduce number of cells per stack • Membranes that operate at higher temperatures (e.g., 120oC for
transportation and 150oC for distributed power) and low humidity to facilitate heat rejection and increase carbon monoxide tolerance of the anode
• Compact, lightweight, efficient balance-of-plant components, such as air compressors, humidifiers, heat exchangers, and sensors
• Durability studies and accelerated aging test methods • Systems analysis and analytical capability RD&D Activities • The overall strategy of the HFCIT Program is to conduct a comprehensive and balanced program that
includes mid- and long-term research and development of hydrogen production, storage, and utilization technologies; integrated systems and technology validation using close collaboration with industry that develops, demonstrates, and deploys critical technologies emerging from research and development; and an analysis element that helps determine the performance and cost targets that technologies must meet to achieve goals of the HFCIT Program, as well as specific project objectives determined by peer review.
• DOE’s HFCIT Program is carried out by national laboratories, universities, and the private sector, including cost-shared industry-led efforts; and CRADA collaborations between industry and the labs.
U.S. Climate Change Technology Program – Technology Options for the Near and Long Term August 2005 – Page 2.2-14

Recent Progress • Reduced the high-volume cost of automotive fuel cells from $275/kW (2002) to $200/kW (2004) using
innovative processes developed by national laboratories and fuel cell developers for depositing platinum catalyst
• Achieved 54% efficiency in a stationary fuel cell stack assembly – on target to meet overall system electrical efficiency go/no-go target of 40% in 2010
• 5 kW stationary fuel cell system stack assembly efficiency is on track to meet overall system efficiency target of 32% in FY05
• Achieved long-term, 8X mass specific activity improvement of low Pt-content (Pt-Pd BNL) cathode catalysts
• Demonstrated a bipolar plate manufacturing process (at 20 parts per hour) that produces plates with target properties and acceptable performance
Commercialization and Deployment Activities • Major industrial companies are pursuing R&D in PEM fuel cells with a mid-term (5-10 years) time frame
for deployment of these technologies for both stationary and vehicular applications. These companies include General Motors, Ford, Daimler-Chrysler, Toyota, Honda, United Technology Corporation Fuel Cells, Xcellsis, and Ballard.
U.S. Climate Change Technology Program – Technology Options for the Near and Long Term August 2005 – Page 2.2-15

2.2.6 HYDROGEN INFRASTRUCTURE SAFETY Technology Description
Similar to other commodities used as fuels in today’s energy and transportation systems, hydrogen is classified as a hazardous material. Direct transport and storage of hydrogen can be achieved via pipelines, compressed gas storage vessels/cylinders, cryogenic vessels, as a hydride, or contained in a nanostructured material. Other commodities, including natural gas and methanol, also can be used as hydrogen carriers that are later reformed. Extensive hydrogen infrastructure is already in place to meet the transport needs of the petrochemical, fertilizer, electronics, and food industries. The approach to safely expand the hydrogen infrastructure is expected to build on current delivery approaches. Federal agencies are working to test and refine existing hydrogen technologies in compliance with Federal standards while developing new technologies that can improve hydrogen distribution, as well as reduce or eliminate leaks or other risks. Codes and standards must be adopted that support the safe, commercialization and integration of these technologies into the existing transportation and energy infrastructures of the United States. System Concepts and Representative Technologies • There are currently three primary methods of hydrogen transport and storage: pipeline, vehicular
commodity transport via tube-trailer/pressure vessels and cryogenic vessels, and stationary/fixed storage and fueling infrastructure.
• Within the United States, each of the three primary methods of hydrogen transport and storage is governed by a different set of regulations established by The U.S. Department of Transportation (DOT)/Pipeline and Hazardous Materials Safety Administration (PHMSA) and local and state fire marshals.
• The current system for transporting natural gas and hydrogen provides a reasonable foundation and model for expanding the hydrogen infrastructure. However, the current paradigm, with the exception of motor fuels and natural gas, is for hazardous materials (HAZMAT) transport to divert or restrict the transport of these materials into urban areas and through tunnels and other vulnerable transportation infrastructure.
• Current technologies include: small diameter hydrogen pipelines; DOT-approved pressure vessels and cylinders; DOT-approved cryogenic vessels; and, for stationary applications, pressure vessels complying with the American Society of Mechanical Engineers (ASME) boiler and pressure vessel code.
• New technologies developed or being proposed include very high-pressure (13,000-15,000 psi), all-composite pressure vessels meeting both DOT and ASME requirements; advanced pipeline materials that reduce and/or catalyze permeated or leaked hydrogen; hydrides; below-ground cryogenic vessels; and nanostructured materials.
• These new technologies may be additions to or replace current transportation infrastructure, or may be integrated into the existing infrastructure.
Technology Status/Applications • Hydrogen has been transported and stored within the United States safely, securely, and reliably, for
several decades using the current conventional (under 4,500 psi) technologies. • New technologies to increase the efficiency and reduce the cost of hydrogen transport, such as advanced
carbon composite cylinders and storage, are being adapted. New technologies are being reviewed and evaluated within the framework of the appropriate and necessary Federal regulations and other codes and standards.
• Other technologies, such as carbon nanotubes and advanced pipeline materials, are still in an early research and development (R&D) phase and are not ready for commercialization.
• The DOT/ Pipeline and Hazardous Materials Safety Administration (PHMSA) is currently reviewing applications for exemption for several technologies, including hydrides and high-pressure composite cylinder mobile fuelers, and is working with industry and the Department of Energy (DOE) to help guide safe and successful development and deployment of these technologies.
Current Research, Development, and Demonstration RD&D Goals • Work within the Federal government to develop, test, and approve new hydrogen storage and monitoring
technologies.
U.S. Climate Change Technology Program – Technology Options for the Near and Long Term August 2005 – Page 2.2-16

• Conduct a thorough and comprehensive transportation and storage hydrogen infrastructure assessment to address capacity, safety, security, reliability, operations, and environmental compliance evaluating scenarios for near-term and long-term development and implementation of hydrogen infrastructure including a risk analysis for each technology and application.
• Investigate future systems that offer improved safety, security, reliability, and functionality vs. the current transportation and storage systems.
RD&D Challenges • Gain a fundamental understanding of fatigue and failure modes of hydrogen materials including advanced
composites and other storage media. • Establish effective monitoring, inspection, and recertification technologies and procedures for hydrogen
transport and storage. • Adapt aging infrastructure to accommodate new demands. • Educate and train operators, regulators, and users effectively. RD&D Activities • The overall strategy of the HFCIT Program is to conduct a comprehensive and balanced program that
includes mid- and long-term research and development of hydrogen production, storage, and utilization technologies; integrated systems and technology validation using close collaboration with industry that develops, demonstrates, and deploys critical technologies emerging from research and development; and an analysis element that helps determine the performance and cost targets that technologies must meet to achieve goals of the HFCIT Program, as well as specific project objectives determined by peer review.
• DOE’s HFCIT Program is carried out by national laboratories, universities, and the private sector, including cost-shared industry-led efforts; d CRADA collaborations between industry and the labs.
Recent Progress • To address the key barrier of perceived safety, the DOE initiated a successful effort to have the
International Code Council (ICC) form a special committee to develop provisions specific to hydrogen for incorporation into its model building, fire, and fuel gas codes, which the ICC will publish for adoption by local jurisdictions throughout the United States. The ICC model codes will incorporate standards for hydrogen components and equipment being developed by leading organizations, such as the Society of Automotive Engineers and the International Standards Organization.
• Six chapters of a planned 15 chapters on hydrogen materials have been published on-line detailing properties of hydrogen materials and embrittlement.
• Through a consensus workshop process, a path forward has been established to integrate risk assessment analysis into the codes and standards process.
• Progress is being made in the development and revision of consensus codes and standards. Numerous draft standards are currently under review and adoption process. Excellent progress has been made in establishing an international hydrogen fuel-quality specification.
Commercialization and Deployment Activities • Through its regulatory authority, DOT supports deployment and demonstration of pipelines and vehicles. • The Operating Administrations of DOT, specifically the Pipeline and Hazardous Materials Safety
Administration (PHMSA) and the National Highway Traffic Safety Administration (NHTSA), are actively engaged in domestic and international consensus codes and standards development.
• DOT staff support DOE R&D activities and the activities and committees of the various consensus codes- and standards-setting organizations.
• DOT staff continues to work with the National Association of State Fire Marshals to educate and train personnel and to promote safe handling and storage practices.
U.S. Climate Change Technology Program – Technology Options for the Near and Long Term August 2005 – Page 2.2-17

2.3 RENEWABLE ENERGY AND FUELS 2.3.1 WIND ENERGY Technology Description
Wind turbine technology converts the kinetic energy in wind to electricity. Grid-connected wind power reduces greenhouse gas emissions by displacing the need for natural gas and coal-fired generation. Village and off-grid applications are important for displacing diesel generation and for improving quality of life, especially in developing countries. System Concepts • Most modern wind turbines operate using
aerodynamic lift generated by airfoil-type blades, yielding much higher efficiency than traditional windmills that relied on wind “pushing” the blades. Lifting forces spin the blades, driving a generator that produces electric power in proportion to wind speed. Turbines either rotate at constant speed and directly link to the grid, or at variable speed for better performance, using a power electronics system for grid connection. Utility-scale turbines for wind plants range in size up to several megawatts, and smaller turbines (under 100 kilowatts) serve a range of distributed, remote, and stand-alone power applications.
Representative Technologies • The most common machine configuration is a three-bladed wind turbine, which operates “upwind” of the
tower, with the blades facing into the wind. To improve the cost-effectiveness of wind turbines, technology advances are being made for rotors and controls, drive trains, towers, manufacturing methods, site-tailored designs, and offshore and onshore foundations.
Technology Status/Applications • In the United States, the wind energy capacity tripled from 1,600 MW in 1994 to more than 6,700 MW by
the end of 2004 – enough to serve more than 1.6 million households. • Current performance is characterized by levelized costs of 4-6¢/kWh (depending on resource quality and
financing terms), capacity factors of 30%-50%, availability of 95-98%, total installed costs of approximately $800-$1,100/kW, and efficiencies of 65%-75% of theoretical (Betz limit) maximum.
U.S. Climate Change Technology Program – Technology Options for the Near and Long Term August 2005 – Page 2.3-1

Current Research, Development, and Demonstration RD&D Goals • By 2007: For distributed wind turbines under 100 kw, achieve a power production cost of 10-15¢/kWh in
Class 3 winds. • By 2012: For larger systems greater than 100 kw, the goal is to achieve a power production cost of 3¢/kWh
for onshore at sites with average wind speeds of 13 mph (wind Class 4), and 5¢/kWh at offshore sites with average wind speeds of 13 mph (wind Class 4).
RD&D Challenges • Developing wind technology that will be economically competitive at low (13 mph) wind-speed sites
requires optimizing increasingly large turbine designs in a fatigue-driven environment with minimal or no component replacements, requiring improved knowledge of wind inflow, aerodynamics, structural dynamics and materials, and optimal control of turbines and wind farms.
• Developing information and strategies to facilitate and optimize integration of wind power into electric grid systems.
• Developing offshore wind technology to take advantage of the immense wind resources in shallow and deep waters of U.S. coastal areas and the Great Lakes near large energy markets.
• Conducting analysis and R&D to explore the role of wind power in the production of hydrogen, in both large-scale and distributed systems.
RD&D Activities • Core and university research: wind characteristics and forecasting, aerodynamics, structural dynamics and
fatigue, and control systems for turbines and wind farms. • Turbine research: cost-shared design and testing of next-generation utility-grade technology for low wind-
speed sites, performance verification of onshore and offshore prototypes, development of advanced small turbines for distributed power applications, and component and system testing at the National Wind Technology Center (NWTC).
• Cooperative research and testing: collection of wind turbine-performance data, power-systems integration, resource assessment, industry technical support, participation in international standards development, wind turbine-certification assistance, and regionally targeted outreach.
Recent Progress • In 1989, the wind program set a goal of 5¢/kWh by 1995 and 4¢/kWh by 2000 for sites with average wind
speeds of 16 mph. The program and the wind industry met the goals as part of dramatic cost reductions from 25¢-50¢/kWh in the early 1980s to 4¢-6¢/kWh today
• Wind power is the world’s fastest-growing energy source. In the past decade, the global wind energy capacity has increased ten fold from 3,500 MW in 1994 to almost 50,000 MW by the end of 2004. During 2004, nearly 8,000 MW of new capacity was added worldwide.
• Domestic public interest in environmentally responsible electric generation technology is reflected by new state energy policies and in the success of “green marketing” of wind power throughout the country.
• The National Wind Technology Center (operated by the National Renewable Energy Laboratory in Golden, Colorado) is recognized as a world-class center for wind energy R&D and has many facilities – such as blade structural test stands and a large gearbox test stand – not otherwise available to the domestic industry.
Commercialization and Deployment Activities • Installed wind capacity in the United States expanded from 2,554 MW to 6,740 MW during the period of
2000 to 2004. • California has the greatest installed wind capacity, followed by Texas, Iowa, Minnesota, Oregon,
Washington, Wyoming, New Mexico, Colorado, and Oklahoma. • Wind technology is competitive today in bulk power markets with support from the production tax credit –
and in high-value niche applications or markets that recognize non-cost attributes. Its competitiveness is affected by policies regarding ancillary services and transmission and distribution regulations. Continued
U.S. Climate Change Technology Program – Technology Options for the Near and Long Term August 2005 – Page 2.3-2

cost reductions from low wind-speed technologies will increase the resource areas available for wind development by 20-fold and move wind generation five times closer to major load centers.
• The principal markets for wind energy are substitution for new natural gas combined-cycle plants or displacement of fuel from existing plants, and replacement of coal-generated power plants. Emerging markets for wind energy include providing energy for water purification, irrigation, and hydrogen production.
• Utility restructuring is a critical challenge to increased deployment in the near term because it emphasizes short-term, low-capital-cost alternatives and lacks public policy to support deployment of sustainable technologies such as wind energy.
• In the United States, the wind industry is thinly capitalized, except for General Electric Wind Energy, which recently acquired wind technology and manufacturing assets in April 2002. About six manufacturers and six to 10 developers characterize the U.S. industry.
• In Europe, there are about 10 turbine manufacturers and about 20 to 30 project developers. European manufacturers have established North American manufacturing facilities and are actively participating in the U.S. market.
• Initial lower levels of wind deployment (up to 15%-20% of the total U.S. electric system capacity) are not expected to introduce significant grid reliability issues. Since the wind resource is variable, intensive use of this technology at larger penetrations may require modification to system operations or ancillary services. Transmission infrastructure upgrades and expansion will be required for large penetrations of onshore wind turbines. However, offshore resources are located close to major load centers.
• Small wind turbines (100 kW and smaller) for distributed and residential grid-connected applications are being used to harness the Nation’s abundant wind resources and defer impacts to the long-distance transmission market. Key market drivers include state renewable portfolio standards, incentive programs, and demand for community-owned wind applications.
U.S. Climate Change Technology Program – Technology Options for the Near and Long Term August 2005 – Page 2.3-3

2.3.10 ADVANCED HYDROPOWER Technology Description
Hydroelectric power generates no greenhouse gas. To the extent that existing hydropower can be maintained or expanded through advances in technology, it can continue to be an important part of a greenhouse gas emissions-free energy portfolio. Advanced hydropower is technology that produces hydroelectricity both efficiently and with improved environmental performance. Traditional hydropower may have environmental effects, such as fish mortality and changes to downstream water quality and quantity. The goal of advanced hydropower is to maximize the use of water for generation while improving environmental performance. System Concepts • Conventional hydropower projects use either impulse or
reaction turbines to convert kinetic energy in flowing or falling water into turbine torque and power. Source water may be from free-flowing rivers, streams, or canals, or water released from upstream storage reservoirs.
• New environmental and biological criteria for turbine design and operation are being developed to help sustain hydropower’s role as a clean, renewable energy source – and to enable upgrades of existing facilities and retrofits at existing dams.
Representative Technologies • New turbine designs that improve survivability of fish that pass through the power plant. • Autoventing turbines to increase dissolved oxygen in discharges downstream of dams. • Reregulating and aerating weirs used to stabilize tailwater discharges and improve water quality. • Adjustable-speed generators producing hydroelectricity over a wider range of heads and providing more
uniform instream-flow releases without sacrificing generation opportunities. • New assessment methods to balance instream-flow needs of fish with water for energy production and to
optimize operation of reservoir systems. • Advanced instrumentation and control systems that modify turbine operation to maximize environmental
benefits and energy production. Technology Status/Applications • Hydropower provides about 78,000 MW of the nation’s electrical-generating capability. This is about 80
percent of the electricity generated from renewable energy sources. • Existing hydropower generation faces a combination of real and perceived environmental effects, regulatory
pressures, and changes in energy economics (deregulation, etc.); potential hydropower resources are not being developed for similar reasons.
• Some new environmentally friendly technologies are being implemented • DOE's Advanced Hydropower Turbine System (AHTS) program will be completing public-private
partnerships with industry to demonstrate the feasibility of new turbine designs (e.g., aerating turbines at the Osage Dam, and a Minimum Gap Runner turbine at the Wanapum Dam).
Current Research, Development, and Demonstration RD&D Goals • By 2006, the completion of testing of hydroelectric turbine technology capable of reducing the rate of fish
mortality to 2%, which would equal or better other methods of fish passage (e.g., spillways or fishways). • Also in the near term, the goal is to complete the development of the Advanced Hydro Turbine Technology
in support of maintaining hydroelectric generation capacity due for relicensing between 2010 and 2020.
ALDEN/NREC Advanced
Turbine
U.S. Climate Change Technology Program – Technology Options for the Near and Long Term August 2005 – Page 2.3-24

RD&D Challenges • Biological design criteria for new technology are limited by poor understanding of how fish respond to
turbulent flows and other physical stresses inside turbines and downstream of dams. • To affect public perception, field-testing will be needed to provide the evidence that fish survival through
turbines is equal to or greater than survival in other passage routes around dams. Regulatory trends are shifting power plant operation from peaking to baseload, effectively reducing the energy value of hydroelectricity and reducing plant capacity factors; higher instream-flow requirements are reducing total energy production to protect downstream ecosystems, but scientific justification is weak.
RD&D Activities • DOE’s AHTS program constructed a test facility for pilot-scale testing of a new turbine design to evaluate
hydraulic and biological performance; testing at this facility was completed in FY 2003. • New biological design criteria to protect fish from shear and pressure have been developed in controlled
laboratory experiments; computational fluid dynamics modeling and new sensor systems are producing new understanding of turbulence in turbines and draft tubes.
• Regional efforts by the Army Corps of Engineers and Bonneville Power Administration are producing solutions to some site-specific problems, especially in the Columbia River basin; but they are not addressing the national situation that is driven by market pressures and environmental regulation.
• Resource assessments of low-head and low-power resources were completed and analyzed. Recent Progress
• TVA has demonstrated that improved turbine designs, equipment upgrades, and systems optimization can lead to significant economic and environmental benefits – energy production was increased approximately 12% while downstream fish resources were significantly improved.
• Field-testing of the Kaplan turbine Minimum Gap Runner design indicates that fish survival can be significantly increased, if conventional turbines are modified. The full complement of Minimum Gap Runner design features will be tested at the Wanapum Dam in FY 2005.
Commercialization and Deployment Activities • Voith Siemens Hydro Power and the TVA have established a partnership to market environmentally
friendly technology at hydropower facilities. Their products were developed in part by funding provided by DOE and the Corps of Engineers, as well as private sources.
• In a competitive solicitation, DOE accepted proposals for advanced turbine designs from Voith Siemens, Alstom, American Hydro, and General Electric Co., field verification and testing is underway with some of these designs to demonstrate improved environmental performance.
• Flash Technology is developing strobe lighting systems to force fish away from hydropower intakes and to avoid entrainment mortality in turbines. Implementation at more sites may allow improved environmental performance with reduced spillage.
Market Context • Advanced hydropower products can be applied at more than 80% of existing hydropower projects (installed
conventional capacity is now 78 GW); the potential market also includes 15-20 GW at existing dams (i.e., no new dams required for development) and more than 30 GW of undeveloped hydropower.
• Retrofitting advanced technology and optimizing system operations at existing facilities would lead to at least a 6% increase in energy output – if fully implemented, this would equate to 5 GW and 18,600 GWh of new, clean energy production.
U.S. Climate Change Technology Program – Technology Options for the Near and Long Term August 2005 – Page 2.3-25

2.3.11 GEOTHERMAL ENERGY Technology Description
Geothermal energy is heat from within the Earth. Hot water or steam are used to produce electricity or applied directly for space heating and industrial processes. This energy can offset the emission of carbon dioxide from conventional fossil-powered electricity generation, industrial processes, building thermal systems, and other applications. System Concepts • Geophysical, geochemical, and
geological exploration locates resources to drill, including highly permeable hot reservoirs, shallow warm groundwater, hot impermeable rock masses, and highly pressured hot fluids.
• Well fields and distribution systems allow the hot fluids to move to the point of use, and afterward, back to the earth.
• Utilization systems may apply the heat directly or convert it to another form of energy such as electricity. Representative Technologies • Exploration technologies identify geothermal reservoirs and their fracture systems; drilling, reservoir
testing, modeling optimize production, and predict useful lifetime; steam turbines use natural steam or hot water flashed to steam to produce electricity; binary conversion systems produce electricity from water not hot enough to flash.
• Direct applications use the heat from geothermal fluids without conversion to electricity. • Geothermal heat pumps use the shallow earth as a heat source and heat sink for heating and cooling
applications. • Coproduction, the recovery of minerals and metals from geothermal brine, is being pursued. Zinc is
recovered at the Salton Sea geothermal field in California. Technology Status/Applications • With improved technology, the United States has a resource base capable of producing up to 100 GW of
electricity at less than 5¢/kWh. • Hydrothermal reservoirs are being used to produce electricity with an online availability of up to 97%;
advanced energy-conversion technologies are being implemented to improve plant thermal efficiency. • Direct-use applications are successful throughout the western United States and provide heat for space
heating, aquaculture, greenhouses, spas, and other applications. • Geothermal heat pumps continue to penetrate markets for heating/cooling (HVAC) services.
Current Research, Development, and Demonstration RD&D Goals • By 2010, for “flash” power systems, reduce the levelized cost of power generated by conventional
(hydrothermal) geothermal resources from 6.1 cents per kWh in 2000 to 4.3 cents per kWh. • By 2010, for “binary” power systems, reduce the cost from 8.7 cents per kWh in 2000, to 6.1 cents per
kWh.
Condensers and cooling towers, The Geysers.
U.S. Climate Change Technology Program – Technology Options for the Near and Long Term August 2005 – Page 2.3-26

RD&D Challenges • Develop improved methodologies for predicting reservoir performance and lifetime. • Find and characterize underground fracture permeability and develop low-cost, innovative drilling
technologies. • Reduce capital and operating costs and improve the efficiency of geothermal conversion systems. • Develop and demonstrate technology for enhanced geothermal systems that will allow the use of
geothermal areas that are deeper, less permeable, or dryer than those currently considered as reserves. RD&D Activities • DOE Office of Energy Efficiency and Renewable Energy promotes collaborations among laboratories,
universities, states, and industry. Industry provides access to operating fields and well data, equipment and geothermal materials, and matching funds. Related activities are supported by DOE Office of Fossil Energy and Office of Science.
Recent Progress • The DOE Geothermal Program sponsored research that won two R&D 100 Awards in 2003: Acoustic
Telemetry Technology, which provides a high speed data link between the surface and the drill bit; and Low Emission Atmospheric Monitoring Separator, which safely contains and cleans vented steam during drilling, well testing, and plant start-up.
• A second pipeline to carry replacement water has been completed through the joint efforts of industry and Federal, state, and local agencies. This will increase production and extend the lifetime of The Geysers Geothermal Field in California. The second pipeline adds 85 MW of capacity.
Commercialization and Deployment Activities • Costs at the best sites are competitive at today’s energy prices – and investment is limited by uncertainty in
prices; lack of new, confirmed resources; high front-end costs; and lag time between investment and return.
• Improvements in cost and accuracy of resource exploration and characterization can lower the electricity cost; demonstration of new resource concepts, such as enhanced geothermal systems, would allow a large expansion of the U.S. use of hydrothermal when economics become favorable.
Market Context • Hydrothermal reservoirs have an installed capacity of about 2,400 MW electric in the United States and
about 8,000 MW worldwide. Direct-use applications have an installed capacity of about 600 MW thermal in the United States. About 300 MW electric are being developed in California, Nevada, and Idaho.
• Geothermal will continue production at existing plants (2.2 GW) with future construction potential (100 GW by 2040). Direct heat will replace existing systems in markets in 19 western states.
• By 2015, geothermal should provide about 10 GW, enough heat and electricity for 7 million homes; by 2020, an installed electricity capacity of 20,000 MW from hydrothermal plants and 20,000 MW from enhanced geothermal systems.
U.S. Climate Change Technology Program – Technology Options for the Near and Long Term August 2005 – Page 2.3-27

2.3.2 SOLAR PHOTOVOLTAIC POWER Technology Description
Solar photovoltaic (PV) arrays use semiconductor devices called solar cells to convert sunlight to electricity without moving parts and without producing fuel wastes, air pollution, or greenhouse gases. Using solar PV for electricity – and eventually using solar PV to produce hydrogen for fuel cells for electric vehicles or by producing hydrogen from water – will help reduce carbon dioxide emissions worldwide. System Concepts • Flat-plate PV arrays use global sunlight; concentrators use direct sunlight. Modules are mounted on a
stationary array or on single- or dual-axis sun trackers. Arrays can be ground-mounted or on all types of buildings and structures (e.g., see semi-transparent solar canopy, right). The DC output from PV can be conditioned into grid-quality AC electricity, or DC can be used to charge batteries or to split water to produce hydrogen (electrolysis of water).
• PV systems are expected to be used in the United States for residential and commercial buildings, peak power shaving, and intermediate daytime load following. With energy storage, PV can provide dispatchable electricity and/or produce hydrogen.
• Almost all locations in the United States and worldwide have enough sunlight for cost-effective PV. For example, U.S. sunlight in the contiguous states varies by only about 25% from an average in Kansas. Land area is not a problem for PV. Not only can PV be more easily sited in a distributed fashion than almost all alternatives (for example, on roofs or above parking lots), a PV-generating station 140 km by 140 km sited at a high solar insolation location in the United States (such as the desert Southwest) could generate all of the electricity needed in the country (2.5 × 10⁶ GWh/year, assuming a system efficiency of 10% and an area packing factor of 50% to avoid self-shading).
Representative Technologies and Status • Wafers of single-crystal or polycrystalline silicon – best cells: 25% efficiency; commercial modules: 13%-
17%. Silicon modules dominate the PV market and currently cost about $2/Wp to manufacture. • Thin-film semiconductors (e.g., amorphous silicon, copper indium diselenide, cadmium telluride, and dye-
sensitized cells) – best cells: 12%-19%; commercial modules: 6%-11%. A new generation of thin-film PV modules is going through the high-risk transition to first-time and large-scale manufacturing. If successful, market share could increase rapidly.
• High-efficiency, single-crystal silicon and multijunction gallium-arsenide-alloy cells for concentrators – best cells: 25%-37% efficient; commercial modules: 15%-24%; prototype systems are being tested in high solar areas in the southwest United States.
• Grid-connected PV systems currently sell for about $6-$7/Wp (17¢-22¢/kWh), including support structures, power conditioning, and land.
Semi-transparent PV canopy PV solar arrays for larger-scale electricity. PV panels on rooftop.
U.S. Climate Change Technology Program – Technology Options for the Near and Long Term August 2005 – Page 2.3-4

Current Research, Development, and Demonstration RD&D Goals • Overall research goals include scaling up laboratory-sized PV cells to much larger sizes suitable for
product markets; validation of new module technologies for outdoors use to achieve 30-year outdoor warrantable lifetimes; and addressing of substantial technical issues associated with high-yield, first-time, and large-scale (greater than 100 MW/yr) manufacturing for advanced technologies.
• The long-term cost goal for electricity from PV cells for residential PV applications is $0.06/kWh, compared to costs ranging from $0.18 to $0.23/kWh in 2004.
• The interim cost goal is to reduce the 30-year user cost for PV electric energy to a range of $0.14 to $0.19/kWh by 2010.
RD&D Challenges • Improve fundamental understanding of materials, processes, and devices to provide a technology base for
advanced PV options. • Improve and invent new low-cost processes and technologies; reduce module and balance-of-systems
manufacturing costs. • Develop and validate new, lower-cost systems hardware and integrated applications. RD&D Activities • Capabilities at national labs and university centers of excellence have been developed, both in expertise
and unique facilities. Funding is split 50-50 between national labs and external subcontracts with universities and industry. Public/private R&D partnerships, including extensive national R&D teams, have been the favored approach. All subcontracts have been awarded via competitive solicitations to select the best and most committed research partners.
• DOE and the National Center for Photovoltaics have worked with state regulatory agencies and influenced the direction of state programs.
• The Department of Defense (DOD) has some funding through special programs in which PV has a role supplying power for military systems.
• The National Aeronautics and Space Administration (NASA) has some research funds for PV. Though this effort has decreased during the past decade, advanced PV has become very important for space missions (e.g., the high-performance cells on the Sojourner probe on Mars).
• Japan and Europe have significant funding for PV research. • States have individual subsidy and utility portfolio programs related to PV; for example, California has a
buy-down program for residential and commercial PV systems. • U.S. PV businesses are marginally or not yet profitable and are unable to fund their own advanced research
for low-cost PV. Recent Progress
• Because of public/private partnerships, such as the Thin-Film Partnership with its national research teams, U.S. PV technology leads the world in measurable results such as record efficiencies for cells and modules. Another partnership, the PV Advanced Manufacturing R&D program, has resulted in industry cost reductions of more than 60% and facilitated a sixteen-fold increase of manufacturing capacity during the past 12 years.
• A new generation of potentially lower-cost technologies (thin films) is entering the marketplace. A 25-megawatt amorphous silicon thin-film plant by United Solar is reaching full production in 2005. Two plants (First Solar and Shell Solar) using even newer thin films (cadmium telluride and copper indium diselenide alloys) are in first-time manufacturing at the MW-scale. Thin-film PV has been a focus of the Federal R&D efforts of the past decade because it holds considerable promise for module cost reductions.
• During the past two years, record sunlight-to-electricity conversion efficiencies for solar cells were set by Federally funded universities, national labs, or industry in copper indium gallium diselenide (19%-efficient cells and 13%-efficient modules) and cadmium telluride (16%-efficient cells and 11%-efficient modules). Cell and module efficiencies for these technologies have increased more than 50% in the past decade.
U.S. Climate Change Technology Program – Technology Options for the Near and Long Term August 2005 – Page 2.3-5

• A unique multijunction gallium-arsenide-alloy cell was spun off to the space power industry, leading to a record cell efficiency (35%) and an R&D 100 Award in 2001. This device configuration is expected to dominate future space power for commercial and military satellites. Recent champion cell efficiency has reached 37% under concentrated sunlight. DOE is interested in this technology (III-V multijunctions), as an insertion candidate for high efficiency terrestrial PV concentrator systems.
Commercialization and Deployment Activities • Worldwide, approximately 1,200 MW of PV were sold in 2004, with systems valued at more than $7
billion; total installed PV is more than 2 GW. The U.S. world market share fell to about 12% in 2004. • Worldwide, market growth for PV has averaged 25%/year for the past decade as a result of reduced prices
and successful global marketing. Worldwide sales grew 36% in 2001, 44% in 2002, 33% in 2003, and 60% in 2004.
• Hundreds of applications are cost effective for off-grid needs. However, the fastest growing segment of the market is grid-connected PV, such as roof-mounted arrays on homes and commercial buildings in the United States. California is subsidizing PV systems to reduce their dependence on natural gas, especially for peak daytime loads which match PV output, such as air-conditioning.
Market Context • Electricity for remote locations, especially for billions of people worldwide who do not have electricity. • U.S. markets: retail electricity for residential and commercial buildings; distributed utility systems for grid
support, peak-shaving, and other daytime uses. • Future electricity and hydrogen storage for dispatchable electricity, electric car-charging stations, and
hydrogen production for portable fuel.
U.S. Climate Change Technology Program – Technology Options for the Near and Long Term August 2005 – Page 2.3-6

2.3.3 SOLAR HEATING AND LIGHTING Technology Description
Solar heating and lighting technologies being developed for buildings applications include solar water heating and hybrid solar lighting. System Concepts • In solar heating systems, solar-thermal collectors convert solar energy into heat, usually for domestic hot
water, pools, and space heating. • In solar lighting systems, sunlight is transmitted into the interior of buildings using glazed apertures, light
pipes, and/or optical fibers. Representative Technologies • Active solar heating systems use pumps and controls to circulate a heat-transfer fluid between the solar
collector(s) and storage. System sizes can range from 1 to 100 kW. • Passive solar heating systems do not use pumps and controls but rather rely on natural circulation to
transfer heat into storage. System sizes can range from 1 to 10 kW. • Transpired solar collectors heat ventilation air for industrial and commercial building applications. A
transpired collector is a thin sheet of perforated metal that absorbs solar radiation and heats fresh air drawn through its perforations.
• Hybrid solar lighting systems focus concentrated sunlight on optical fibers and, with a controller, combine natural daylight with conventional illumination, depending on sunlight availability.
Technology Status/Applications • Typical residential solar systems use glazed flat-plate collectors combined with storage tanks to provide
40%-70% of residential water heating requirements. Typical systems generate hot water equivalent to supplying 2,500 kWh/year at a cost of about 8¢/kWh.
• Typical solar pool heating systems use unglazed polymer collectors to provide 50%-100% of residential pool heating requirements. Typical systems generate 1,600 therms or 46,000 kWh/year and have 25% of the market.
Current Research, Development, and Demonstration RD&D Goals • Near-term solar water-heating research goals include use of polymer materials and manufacturing
enhancements to reduce the cost of solar water heating systems to 4.5¢/kWh from their current cost of 8¢/kWh.
• Near-term solar-lighting research goals include demonstrating the second generation of the lighting system, coupled with an enhanced control system – and determining the market potential of the technology.
RD&D Challenges • Solar heating RD&D efforts are targeted to reduce manufacturing and installation costs, improve durability
and lifetime, and provide advanced designs for system integration. One key R&D issue is durability. Polymer materials in solar heating systems must survive harsh service environments that include exposure to elevated temperatures, moisture, and ultraviolet radiation.
• Demonstration of hybrid lighting-system performance and reliability in the field are critical to the success of solar lighting.
RD&D Activities • Key DOE program activities are targeted to demonstrate lower cost and improved reliability of components
and systems, develop advanced systems and applications, and support the next commercial opportunities for these technologies.
• DOE support of RD&D has been required because solar manufacturers are generally small businesses with limited resources and expertise. These manufacturers are constantly facing manufacturing and system design issues that affect the reliability, lifetime systems costs, and overall cost effectiveness of their products, yet they do not have the resources to conduct reliability and cost-reduction R&D. DOE and its national laboratories, however, have extensive expertise and facilities that can be critical to the long-term
U.S. Climate Change Technology Program – Technology Options for the Near and Long Term August 2005 – Page 2.3-7

success of these manufacturers. Recent Progress
• More than 1,000 MW of solar buildings PV systems are operating successfully in the United States, generating more than 3 million MWh/year.
• The energy costs of solar-thermal systems have been reduced through technology improvements by more than 50%, saving more than 5 million MWh/yr in U.S. primary energy consumption.
Commercialization and Deployment Activities • About 1.2 million solar water-heating systems have been installed in the United States. However, due to
relatively low energy prices, there are currently only approximately 8,000 installations per year. • Several hundred transpired solar collector systems have been installed, including installations for Ford
Motor Company, General Motors, Federal Express, the U.S. Army, and the Bureau of Reclamation. Market Context • Retrofit markets: There are 73 million existing single-family homes in the United States. A potential
replacement market of 29 million solar water-heating systems is based on the assumption that only 40% of the homes have been built with suitable orientation and absence of shading needed for solar water-heating systems.
• New construction markets: In 2000, 1.2 million new single-family homes were built in the United States. Assuming 70% of these homes could be sited to enable proper orientation of solar water-heating systems, new construction represents another 840,000 possible system installations each year.
• Solar building technologies will reduce daytime peak electricity requirements.
U.S. Climate Change Technology Program – Technology Options for the Near and Long Term August 2005 – Page 2.3-8

2.3.4 CONCENTRATING SOLAR POWER Technology Description
Concentrating Solar Power (CSP) systems concentrate solar energy 50 to 5,000 times to produce high-temperature thermal energy, which is used to produce electricity for distributed or bulk generation process applications. System Concepts • In CSP systems, highly reflective sun-
tracking mirrors produce temperatures of 400°C to 800°C in the working fluid of a receiver; this heat is used in conventional heat engines (steam or gas turbines or Stirling engines) to produce electricity at solar-to-electric efficiencies for the system of up to 30%.
• CSP technologies provide firm, nonintermittent electricity generation (peaking or intermediate load capacity) when coupled with storage.
• Because solar-thermal technologies can yield extremely high temperatures, the technologies could some day be used for direct conversion (rather than indirect conversion through electrochemical reactions) of natural gas or water into hydrogen for future hydrogen-based economies.
Representative Technologies • A parabolic trough system focuses solar energy on a linear oil-filled receiver to collect heat to generate
steam to power a steam turbine. When the sun is not shining, steam can be generated with a fossil fuel to meet utility needs. Plant sizes can range from 1.0 to 100 MWe.
• A power tower system uses many large heliostats to focus the solar energy onto a tower-mounted central receiver filled with a molten-salt working fluid that produces steam. The hot salt can be stored extremely efficiently to allow power production to match utility demand, even when the sun is not shining. Plant size can range from 30 to 200 MWe.
• A dish/engine system uses a dish-shaped reflector to power a small Stirling or Brayton engine/generator or a high-concentrator PV module mounted at the focus of the dish. Dishes are 2-25 kW in size and can be used individually or in small groups for distributed, remote, or village power; or in clusters (1-10 MWe) for utility-scale applications, including end-of-line support. They are easily hybridized with fossil fuel.
Technology Status/Applications • Nine parabolic trough plants, with a rated capacity of 354 MWe, have been operating in California since
the 1980s. Trough system electricity costs of about 12¢-14¢/kWh have been demonstrated commercially. • Solar Two, a 10-MWe pilot power tower with three hours of storage, provided all the information needed
to scale up to a 30-100 MW commercial plant, the first of which is now being planned in Spain. • A number of prototype dish/Stirling systems are currently operating in Nevada, Arizona, Colorado, and
Spain. High levels of performance have been established; durability remains to be proven, although some systems have operated for more than 10,000 hours.
Current Research, Development, and Deployment RD&D Goals • The long-term goal is to achieve a power cost of between $0.035/kWh and $0.062/kWh, compared to the
cost of between $0.12-$0.14/kWh in 2004. • The interim goal is to reduce the cost of large-scale CSP power plants in the Southwest United States,
where solar conditions are most favorable, to $0.09-$0.11/kWh by 2010. RD&D Challenges • RD&D efforts are targeted to improve performance and lifetime, reduce manufacturing costs with
Luz Trough Power Plant
U.S. Climate Change Technology Program – Technology Options for the Near and Long Term August 2005 – Page 2.3-9

improved designs, provide advanced designs for long-term competitiveness, and address barriers to market entry.
• Improved manufacturing technologies are needed to reduce the cost of key components, especially for first-plant applications where economies of scale are not yet available.
• Demonstration of Stirling engine performance and reliability in the field are critical to the success of dish/engine systems.
RD&D Activities • Key DOE program activities are targeted to support the next commercial opportunities for these
technologies, demonstrate improved performance and reliability of components and systems, reduce energy costs, and develop advanced systems and applications.
• Several European countries and Israel have programs comparable in size to the United States. • DOE support of RD&D has been required because of the specialized technology development and the need
for reducing costs and for reducing barriers to market penetration. The Federal CSP program provides expert technical support, as well as serving as a catalyst and facilitator for participation of utilities and manufacturers to assist in driving down system costs.
Recent Progress • New commercial plants are being considered for California, Nevada, and Arizona. • The 10-MW Solar Two pilot power tower plant operated successfully near Barstow, California, leading to
the first commercial plant being planned in Spain. • Operations and maintenance costs have been reduced through technology improvements at the commercial
parabolic trough plants in California by 40%, saving plant operators $50 million. Commercialization and Deployment Activities
• Parabolic troughs have been commercialized and nine plants (354 MW total) have operated in California since the 1980s.
• The state of Nevada announced plans to build a 50-MW parabolic trough plant near Boulder City. Nevada Power and Sierra Pacific Power will purchase the power to comply with the solar portion of Nevada’s renewable portfolio standard.
• Successful operation of Solar Two has provided the basis for a partnership to provide the first 30-100 MW power tower plant.
• The World Bank’s Solar Initiative is pursuing CSP technologies for less-developed countries. The World Bank considers CSP to be a primary candidate for Global Environment Facility funding, which could total $1-$2 billion for projects during the next two years.
Market Context • There is currently 350 MW of CSP generation in the United States, all of it in Southern California's
Mojave Desert. • Power purchase agreements have been signed for 150 MW of new CSP capacity (50 MW in Nevada and
100 MW in Spain). The plants are anticipated to come on-line within the next two to three years. Significant domestic and international interest will likely result in additional projects.
• According to a recent study commissioned by the Department of Energy, CSP technologies can achieve significantly lower costs (below 4¢/kWh) at modest production volumes.
• Congress asked DOE to scope out what would be required to deploy 1,000MW of CSP in the Southwest United States. DOE is actively engaged with the western Governors to map a strategy to deploy 1-5 GW of CSP in the Southwest by 2015.
• A near-term to mid-term opportunity exists to build production capacity in the United States for both domestic use and international exports.
U.S. Climate Change Technology Program – Technology Options for the Near and Long Term August 2005 – Page 2.3-10

2.3.5 BIOCHEMICAL CONVERSION OF BIOMASS Technology Description
Biomass resources are agricultural crops and residues, wood residues, grasses, and trees. Biomass absorbs CO2 as it grows, offsetting the CO2 emissions from harvesting and processing, and can be a substitute for fossil resources in the production of power, fuels, and chemicals. Biomass feedstocks currently supply about 3 quadrillion Btus (Quads) to the nation’s energy supply, based primarily on the use of wood. The potential exists for increasing the total biomass contribution up to 10 Quads nationwide, which would have a positive impact on the farm economy. Cost, sustainable supply availability, biomass variability, and transportation systems are key challenges for biomass utilization. The use of biomass as an alternative to fossil resources reduces most emissions, including emissions of greenhouse gases (GHGs). Through the use of biomass materials that would otherwise go to waste, biomass systems can represent a net sink for GHG emissions because methane emissions that would result from landfilling the unused biomass would be avoided. Sugars are important platform intermediates for producing fuels, products, and power from biomass. Technologies in manufacturing platforms – such as the sugars platform – can provide the basis for a biorefinery or be combined with those from other platforms. The sugars platform is used to break down biomass, cellulose, and hemicellulose polymers into their building blocks. The building blocks are sugars that can be converted to many products including liquid fuels (e.g., ethanol), monomeric components for the polymer market (e.g., lactic acid), and hydrogen. In addition to using sugar as a feedstock for fuel and chemical production, biomass rich in oils (such as soybean) can be converted to esters that are combusted like petroleum-based diesel. These oils have potential for the production of chemicals and other products, such as lubricants or polymers. The biorefinery is analogous to an oil refinery. Multiple feedstocks are converted to a slate of products via multiple technology routes. Fuel production provides a large-volume product to achieve economies of scale, while lower-volume biobased coproducts and power can improve the economic competitiveness of biomass as a sustainable source of energy. Integrated biorefinery systems are being evaluated for their feasibility in producing fuels and products for potentially large commercial markets. A major challenge is to develop the ability to convert the fractionated biomass components into value-added products as efficiently as the current petrochemical business. System Concepts • The most common sugar-platform process consists of pretreating a biomass feedstock to release sugars from
the fibrous cellulose and hemicellulose fractions. These sugars can be converted biologically into products such as ethanol or lactic acid, and can also be converted catalytically into products such as sorbitol. The products are then purified and sold as liquid fuels, sold into commodity chemical markets, or further converted and sold into other markets. The residue remaining from the sugar process can be burned to produce steam and electricity or further processed into other products such as animal feed.
• Oil technologies under development include conversion of glycerol to higher-value chemicals, including 1,3 propanediol.
Representative Technologies • Sugar platform: hydrolysis of fibrous biomass that utilizes enzymes or acid catalysts, followed by microbial
or catalytic conversion of the sugars to products. • Glyceride platform: thermochemical transesterification of triglycerides. • Fractionating biomass materials from grain and oil seeds, agricultural and forestry residues, or dedicated
U.S. Climate Change Technology Program – Technology Options for the Near and Long Term August 2005 – Page 2.3-11

biomass feedstocks (such as grasses and woody crops) into component parts allows further development of value-added products such as chemical intermediates, wood products, biodiesel fuel, and composite materials.
Technology Status/Applications • Enzymatic hydrolysis: A major barrier of this sugar-platform technology has been development of low-cost
cellulase enzyme cocktails. DOE has recently completed cost-shared subcontracts with Genencor International and Novozyme Biotech to reduce the cost of enzymes to improve the economics of the process. Process options using those enzymes will lead to the first large-scale, sugar-platform biorefineries.
• R&D advances have been identified to lower the cost of sugars for products including biofuels. As production costs for biofuels are reduced commensurately, larger fuel markets will become accessible. The technical challenge is to advance biomass processing to a level of maturity comparable to that of the existing petroleum industry.
• Biobased products will be key elements in the development of integrated processes for producing fuels, chemicals, and power.
Current Research, Development, and Demonstration RD&D Goals • By 2010, finalize a process flow diagram with material and energy balances for an integrated biorefinery
with the potential for three bio-based chemicals or materials. • By 2012, complete a system-level demonstration with corn kernels’ fiber and recalcitrant starch aiming at
5% to 20% increase in ethanol yield from ethanol plants. • By 2012, reduce the estimated cost for producing a mixed, dilute sugar stream suitable for fermentation to
ethanol to $0.10/lb, compared to the cost of $0.15/lb in 2003. If successful, this cost goal would correspond to $1.75 per gallon of ethanol, assuming a cost of $45 per dry ton of corn stover.
RD&D Challenges • Low-cost enzymatic hydrolysis process technologies need to be developed. • Pretreatment cost, yield, and equipment reliability need to be improved. • Process integration and optimization needs to be developed. • Fermentation organisms need to be developed and improved. RD&D Activities • Evaluation of pretreatment options and advanced R&D to understand biomass feedstock mechanisms. • Industrial partnerships for demonstrating biochemical conversion technology on corn stover. • Joint DOE and USDA solicitations targeting key enabling technologies to meet the RD&D challenges.
Recent Progress • Cargill-Dow, a corporate partner, has built a facility that can produce almost 300 million pounds of lactic
acid annually from corn starch. The facility also converts lactic acid into PLA for the polymers markets. • Genencor International has announced that it met the target of a 10X reduction in the cellulase portion of the
production cost of ethanol from biomass. Novozyme Biotech has announced that it expects to achieve the same goal by the end of its subcontract in 2004 (goal achieved).
• Breakthroughs in genetically engineered microorganisms capable of fermenting the broad range of sugars found in biomass. These advances have led to an R&D 100 award and a number of patents.
• A conceptual design and cost estimate of a cellulosic ethanol facility has been completed and updated by DOE and engineering and construction firms. The report outlines the process necessary to meet cost targets.
Commercialization and Deployment Activities • Conversion of cellulosic biomass to sugars and products from those sugars is not yet commercial. The U.S.
capacity to produce ethanol from corn is 3 billion gallons annually. Ethanol is used as a fuel extender and, increasingly, as an oxygenating additive for reformulated gasoline wherever MTBE is phased down.
• Starch crops play a transitional role, but large-scale displacement of petroleum will rely on cellulose. • About 15-21 million gallons of biodiesel is produced annually in the United States. • Biobased products can replace 1:1 their chemically derived counterpart if the cost is competitive. This
U.S. Climate Change Technology Program – Technology Options for the Near and Long Term August 2005 – Page 2.3-12

approach is of interest to the existing biomass-processing community; their infrastructure is already in place.• Oil-based products or fuels have essentially a 1:1 displacement of petroleum-based products or fuels; this is
attractive in efforts to reduce dependence on imported oil. • Biobased products can bring new properties and functions to materials and chemical intermediates. This
characteristic can enable biorefinery operations and the development of small businesses. Here, the market is not fully defined, capital risk is high, and time to commercialize may be long. Investments by the Federal government can lower some of these barriers.
Market Context • For ethanol:
1 Quad of biomass: 1% of projected petroleum imports for 2020 5 Quads of biomass: 6% of projected petroleum imports for 2020
• For fuels and chemicals (depending on the mix of products): 1 Quad of biomass: 0.5-1% of projected petroleum imports for 2020
5 Quads of biomass: 5-10% of projected petroleum imports for 2020
U.S. Climate Change Technology Program – Technology Options for the Near and Long Term August 2005 – Page 2.3-13

2.3.6 THERMOCHEMICAL CONVERSION OF BIOMASS
Syngas Platform
Sugar Platform
FuelsChemicals & MaterialsBiomass
Combined Heat & Power
Residues
Clean Gas
Conditioned Gas
Sugar Feedstocks
Syngas PlatformSyngas Platform
Sugar PlatformSugar Platform
FuelsChemicals & Materials
FuelsChemicals & MaterialsBiomass
Combined Heat & Power
Residues
Clean Gas
Conditioned Gas
Sugar Feedstocks
Technology Description Biomass resources are agricultural crops and residues, wood residues, grasses, and trees. Biomass absorbs CO2 as it grows, offsetting the CO2 emissions from harvesting and processing, and can be a substitute for fossil resources in production of power, fuels, and chemicals. Biomass feedstocks currently supply about 3 quadrillion Btus (Quads) to the nation’s energy supply based primarily on wood resources. The potential exists for increasing total biomass contribution to 10 Quads nationwide, which would create positive impacts on farming and forest products industries. Cost, sustainable supply availability, biomass variability, and delivery systems are key challenges for biomass utilization. Use of biomass resources as an alternative to fossil resources reduces most emissions, including emissions of greenhouse gases (GHGs). Through use of materials that would normally be waste, biomass systems bring about a net sink for GHG emissions, because methane emissions that would result from landfilling are avoided. Thermal conversion of biomass is a manufacturing platform comprised of many technology routes and involves use of heat to break down biomass feed into an oil-rich vapor in pyrolysis and/or synthesis gas in gasification, which is used for generation of heat, power, liquid fuels, and chemicals. Technologies in this platform can provide the basis for a biorefinery, or be combined with other platform technologies. One advantage of thermal conversion processes is that they can convert nearly all biomass feedstocks into synthesis gas, including some feedstock components that are difficult to process by chemical or biological means. The biorefinery is analogous to an oil refinery. Multiple feedstocks are thermally converted to a slate of products via multiple technology routes. Fuel production provides a large-volume product to achieve economies of scale, while lower volume biobased coproducts and power can improve the economic competitiveness of biomass as a sustainable source of energy. Integrated biorefinery systems are being evaluated for their feasibility in producing fuels and products for potentially large commercial markets. A major challenge is to develop the ability to convert the fractionated biomass components into value-added products as efficiently as the current petrochemical business of today. Biomass combustion is a thermal process that converts biomass entirely to carbon dioxide and water vapor; and, thus, precludes conversion to intermediate fuels or chemicals. The existing biomass power industry primarily uses combustion to produce steam for heat and electricity generation. Co-combustion of biomass with coal, or “cofiring” has received recent interest as a way to reduce fossil carbon emissions from coal power plants. There are few significant technical barriers to increase use of these technologies. System Concepts and Representative Technologies Thermal conversion technology is important and has several key roles in an emerging bioeconomy: • Most current biomass conversion is for heat and power generation and is based on direct combustion in
small, biomass-only plants with relatively low electric efficiency of about 20%. Technology exists so that total system efficiencies can approach 90% if combined heat and power systems are applied. Most biomass direct combustion generation facilities use the basic Rankine steam cycle for electric power generation, which is made up of a steam boiler, an electric turbine, a condenser, and a pump. Evolution of combined cycles that integrate the use of gas and steam turbines can increase generation efficiency by up to two times. Cofiring of biomass with coal also can increase overall biomass-to-electricity conversion efficiency.
• A source of syngas for catalytic production of fuels, chemicals, and hydrogen is important. Once a clean synthesis gas is obtained, it is possible to access and leverage mature process technologies developed in the petroleum and chemicals industry for the production of a wide range of liquid fuels and chemicals.
• A source of heat and power for biorefinery operation. Virtually all other conversion processes – whether physical or biological – produce residue that cannot be directly converted to the primary product(s). In order to mitigate waste streams and to maximize the efficiency of the biorefinery, these residues can and
U.S. Climate Change Technology Program – Technology Options for the Near and Long Term August 2005 – Page 2.3-14

should be used for heat and power production. In existing biorefineries, residues are combusted in a steam boiler. There is a technological opportunity however, to use a gasifier coupled to a gas turbine combined cycle that can double conversion efficiency to electricity, while still producing steam from the gas turbine waste heat. Use of a biomass gasifier in a gasifier combined-cycle system can leverage on public and private investments in development of advanced- and next-generation gas turbine systems (more than $1 billion).
• Thermal conversion is a way to derive additional value from process residues. Within a biorefinery, thermal conversion and gasification can push many residues "up the value chain" through production of hydrogen or other higher-value products via thermal conversion to syngas followed by separation or synthesis steps.
• Gasification converts biomass to a syngas that can be substituted for natural gas in combustion turbines, shifted into hydrogen for fuel cell or other applications, or used in existing commercial catalytic processes for production of liquid fuels and chemicals. Several technologies exist in various stages of development for production of a suitable syngas, including indirect gasification, steam reforming of biomass, and gasification with oxygen or enriched air.
• Pyrolysis of biomass produces an oil-rich vapor that can be condensed for direct use as a fuel or as a hydrogen carrier, or refined for producing a variety of higher-value chemical products.
Technology Status/Applications • The existing biopower sector, nearly 1,000 plants, is mainly comprised of direct combustion plants, with an
additional small amount of cofiring (approximately 400 MWe). Plant size averages 20 MWe, and the biomass-to-electricity conversion efficiency is about 20%. Grid-connected electrical capacity was 9,700 MWe in 2001; more than 75% of this power is generated in the forest products industry’s combined heat and power applications for process heat. Combined utility and industrial generation in 2001 was more than 60 billion kilowatt-hours (about 75% of nonhydro renewable generation). Recent studies estimate that on a life-cycle basis, existing biopower plants represent a net carbon sink of 4 MMTC/yr. Biopower electricity prices generally range from 8¢−12¢/kWh.
• U.S. investment in equipment is $300-$500 M/year. At least six major engineering procurement and construction companies and several multinational boiler manufacturers are active.
• Biomass cofiring with coal ($50−$250/kW of biomass capacity) is the most near-term option for large-scale use of biomass for power-only electricity generation. Cofiring also reduces sulfur dioxide and nitrogen oxide emissions. In addition, when cofiring crop and forest product residues, GHG emissions are reduced by a greater percentage (e.g. 23% GHG emissions reduction with 15% cofiring).
• Small biopower and biodiesel systems have been used for many years in the developing world for electricity generation. OE is developing systems for village power applications for distributed generation that are more efficient, reliable, and clean for the developed world. These systems range in size from 3 kW to 5 MW, with field verification completed by the end of 2003.
Current Research, Development, and Demonstration RD&D Goals • Goals are being developed. RD&D Challenges • Feed Preparation/Gasification – Improved feed processing for operational reliability need to be developed. • Gas Cleanup – Improved methods of removing contaminants from syngas and modifying gas composition
are needed. • Synthesis gas utilization – The feasibility and optimization of syngas use in fuels, chemicals, and
heat/power applications needs to be demonstrated on both a laboratory and industrial pilot scale. • System Integration – Careful integration of the entire conversion system to maximize efficiency and reduce
costs is needed. • Development of enabling technologies is needed so that industry can reduce their risk of development and
reduce development-cycle time.
U.S. Climate Change Technology Program – Technology Options for the Near and Long Term August 2005 – Page 2.3-15
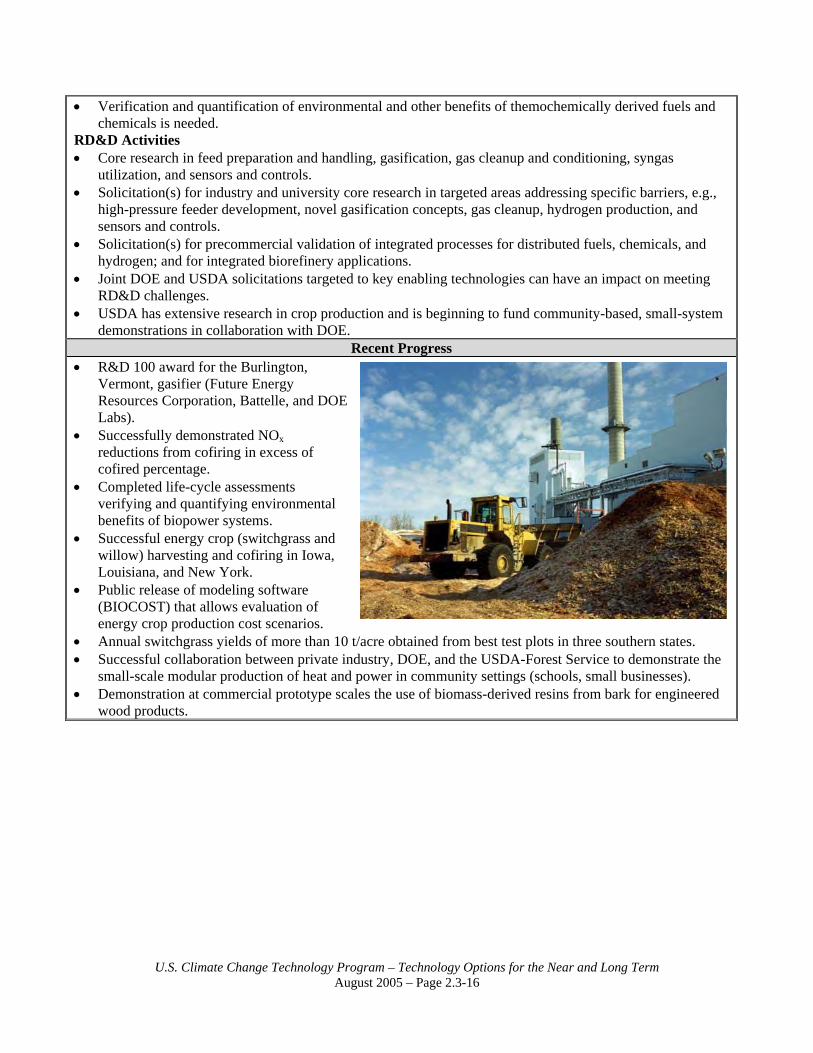
• Verification and quantification of environmental and other benefits of themochemically derived fuels and chemicals is needed.
RD&D Activities • Core research in feed preparation and handling, gasification, gas cleanup and conditioning, syngas
utilization, and sensors and controls. • Solicitation(s) for industry and university core research in targeted areas addressing specific barriers, e.g.,
high-pressure feeder development, novel gasification concepts, gas cleanup, hydrogen production, and sensors and controls.
• Solicitation(s) for precommercial validation of integrated processes for distributed fuels, chemicals, and hydrogen; and for integrated biorefinery applications.
• Joint DOE and USDA solicitations targeted to key enabling technologies can have an impact on meeting RD&D challenges.
• USDA has extensive research in crop production and is beginning to fund community-based, small-system demonstrations in collaboration with DOE.
Recent Progress • R&D 100 award for the Burlington,
Vermont, gasifier (Future Energy Resources Corporation, Battelle, and DOE Labs).
• Successfully demonstrated NOx reductions from cofiring in excess of cofired percentage.
• Completed life-cycle assessments verifying and quantifying environmental benefits of biopower systems.
• Successful energy crop (switchgrass and willow) harvesting and cofiring in Iowa, Louisiana, and New York.
• Public release of modeling software (BIOCOST) that allows evaluation of energy crop production cost scenarios.
• Annual switchgrass yields of more than 10 t/acre obtained from best test plots in three southern states. • Successful collaboration between private industry, DOE, and the USDA-Forest Service to demonstrate the
small-scale modular production of heat and power in community settings (schools, small businesses). • Demonstration at commercial prototype scales the use of biomass-derived resins from bark for engineered
wood products.
U.S. Climate Change Technology Program – Technology Options for the Near and Long Term August 2005 – Page 2.3-16

2.3.7 BIOMASS RESIDUES Technology Description
Biomass residues are the organic byproducts of green plants used for food, fiber, and forest production and processing. Major sources of residues include grain crops such as corn, wheat, and rice; animal waste; forest harvest; fuel-reduction treatments, and processing. These residues can be used as an alternative fuel source and for other purposes. This profile addresses the issues of harvesting, storing, and transporting biomass residues. System Concepts • The sustainable use of biomass residues for energy requires understanding when and where residues can be
removed from agricultural and forest soils without reducing long-term productivity. • Under certain circumstances, residues may have greater economic and ecological value when left on the
land to restore nutrients, reduce erosion, and stabilize soil structure than if harvested for fuel. Biomass residue energy production may be most effective in locations where crop yields and soil organic levels are high, and erosion is not a major concern.
Representative Technologies • Agricultural residues (corn stover, straws from wheat, rice, and other grain crops). • Wood residues resulting from lumber, furniture, and fiber production. • Forest residues (tops and limbs from harvest for wood products, material from fuel reduction treatments). • Black liquors from pulp production. • Animal wastes from confined production of chickens, pigs, and cows. • Clean wood from urban yard trimmings and construction/demolition. Technology Status/Applications • Sustainable and recoverable amounts of corn stover, wheat straw, rice straw, and cotton stalks are
estimated at about 150 MdT/year (less than 50% of the amount actually produced). Some corn stover is being removed presently for production of chemicals and animal bedding. Straws are being used in Europe as a bioenergy resource.
• More than 2.1 quadrillion Btu of primary biomass energy is consumed by industry, and it generates 56 million MWh of electricity plus heat. Nearly two-thirds of this electricity is derived from wood and wood wastes (including spent pulping liquors, wood residues, byproducts from mill processing, and forest residues). About one-third of the electricity and heat is derived from municipal solid waste and landfill gas.
• Some technologies are available to combust or gasify animal wastes. The most widely known option is to capture methane gas, a byproduct of anaerobic digestion.
Current Research, Development, and Demonstration RD&D Goals • By 2006, establish measurable cost reductions in corn-stover supply systems with modifications of current
technology. • By 2007, develop whole-crop harvest systems for supplying biorefineries of multiple products. • By 2010, develop enhancements to the whole-crop harvest systems that include fractionation for maximum
economic return, including returns to soil for maximum productivity and conservation practices. • By 2015, develop an integrated system for pretreatment of residues near harvest locations and a means of
collecting and transporting partially treated substrates to a central processing operation. • By 2020, develop fully integrated crop and residue harvesting, storage, and transportation systems for food,
feed, energy, and industrial applications. RD&D Challenges • Develop environmental data to make decisions on residue removal from agricultural and forest lands. • Assemble better information on the characteristics of residue feedstock to assist in cost-effective
harvest/handling and storage systems, and to assist potential users in optimizing their systems to handle residue feedstock.
• Develop cost-effective drying, densification, and transportation techniques to create more “standard” feedstock from residues.
U.S. Climate Change Technology Program – Technology Options for the Near and Long Term August 2005 – Page 2.3-17

• Develop efficient and environmentally sound infrastructure for residue supply systems (collection, handling, storage, transport).
• Gain public acceptance for the removal of agricultural and forest residues where shown to be sustainable. • Develop methods for estimating residue availability based on published or easily accessible information
sources. • Develop effective and publicly acceptable ways of using animal wastes. RD&D Activities • Reduce feedstock costs and enhance feedstock quality through improving and adapting the existing
collection, densification, storage, transportation, and information technologies (precision agriculture and forestry) to bioenergy supply systems.
• Enhance the sustainability of feedstock supply enterprises (production and handling) by developing and servicing robust machines for multiple applications and extended use.
• Research the engineering properties of novel aqueous and nonaqueous multiphase bioenergy feedstocks. Recent Progress
• Critical operations contributing to the cost of residue harvest have been identified. It is now clear that a reduction in the number of operations is the key to reduction in feedstock costs.
• Farm-equipment manufacturers in the United States are becoming increasingly aware of opportunities in biomass harvesting and handling systems. Large and small companies are building alliances with research institutions to develop equipment for handling large quantities of biomass.
• Green power producers are making greater use of landfill gas as a resource for electricity production. Commercialization and Deployment Activities
• Use of biomass residues for bioenergy and bioproducts is already commercial where those materials are captured internally by an industry or where disposal fees are high enough to encourage delivery of these materials to an energy end user for little to no cost.
U.S. Climate Change Technology Program – Technology Options for the Near and Long Term August 2005 – Page 2.3-18

2.3.8 ENERGY CROPS Technology Description
Energy crops are fast-growing, genetically improved trees and grasses grown under sustainable conditions for harvest at 1 to 10 years of age. End uses of energy crops include biomass power (combustion and gasification), biofuels (ethanol), and new bioproducts such as plastics and many types of chemicals. System Concepts • Biomass feedstock supply systems are widely available throughout the United States but locally optimized
for climate and soil conditions and end-use requirements. • Quantities must be sufficient to support large-scale processing facilities. • In the future, some crops will likely be genetically tailored in a way that facilitates separations and
conversion processes for selected end uses. Representative Technologies • Short rotation woody crops – selected tree varieties grown as single-stem trees under sustainable conditions
for year-round harvest within 4-10 years with replanting assumed. • Woody coppice crops – selected tree varieties grown as multistemmed “bushes” under sustainable
conditions for year-round harvest. • Perennial grass crops – selected high-yield varieties of grasses grown under agronomic conditions for fall
and winter harvest with stand regrowth assumed for up to 10 years, involving some modification to standard forage harvest systems.
• Genetic improvement, pest and disease management, sustainability optimization, and harvest equipment development R&D ongoing for all of the above.
Technology Status/Applications • Short-rotation woody crops are produced commercially in the Pacific Northwest and North Central regions
of the United States and many parts of the world (Brazil, Australia, Spain, etc.) for combined fiber and energy use.
• Woody coppice crops are produced commercially in Northern Europe and are being adapted to and tested at an operational scale in New York.
• Perennial grass crops have high yield potential and have been demonstrated in south, southeastern, mid-west, and north-central parts of the United States. Technology is being tested as a biomass feedstock supply system for biomass power in Iowa.
Current Research, Development, and Demonstration RD&D Goals • By 2006, develop feedstock crops with experimentally demonstrated yield potential of 6-8 dry
ton/acre/year and accompanying cost-effective, energy-efficient, environmentally sound harvest methods. • By 2010, identify genes that control growth and characteristics important to conversion processes in few
model energy crops – and achieve low-cost, “no-touch” harvest/processing/transport of biomass to process facility.
• By 2020, advance the concept of energy crops contributing strongly to meet biomass power and biofuels production goals – and increase yield of useful biomass per acre by a factor of 2 or more compared with yields in 2000.
RD&D Challenges • Transfer genomics information gained from arabidopsis, rice, and corn to acceleration of domestication of
poplars and switchgrass. • Develop gene maps and increased functional genomics understanding for model crops. • Develop an efficient infrastructure for energy crop supply and utilization systems. • Scale up seed to large-scale commercial deployment. • Demonstrate that energy crop production is sustainable and environmentally beneficial. • Gain acceptance by the public for the use of genetic engineering of energy crops. • Develop expertise on machinery and logistics aspects of agricultural and forest engineering.
U.S. Climate Change Technology Program – Technology Options for the Near and Long Term August 2005 – Page 2.3-19

RD&D Activities • Crop yield improvement research on two model woody crops (poplars and willow) and one herbaceous
species (switchgrass) is being conducted by researchers in academic and USDA research organizations in many locations throughout the country.
• Genetic maps have been developed for poplars and are in process for switchgrass; work has been initiated to identify genes important to accelerated domestication of poplars and switchgrass.
• Cost-supply relationships are being generated for energy crop supplies in different regions of the country. • Environmental research to optimize energy crop sustainable production techniques is being conducted in a
few locations. • Research on control of diseases and pests through genetics and/or cultural management.
Recent Progress • Yields of up to 10 dry tons/acre/year have been observed in small experimental plantings of poplars,
willows, and switchgrass in selected locations with genetically superior material. • Yields of 5-7 dry tons/acre/year have been measured in small pilot-scale regional field trials of energy
crops in some locations. • Two major industrial enzyme companies are developing a new generation of cellulase enzymes to support
an enzyme sugar platform. • Farmers are engaged in energy crop R&D in several regions of the country through federally supported
demonstrations. • An economic model for energy crop production costs has been released for public use. • Joint USDA/DOE analysis on the economic impacts of bioenergy crop production on U.S. agriculture has
shown the potential for net farm income to increase from $2.8 billion to $6 billion depending on production scenarios and feedstock prices.
• A nutrient cycling spreadsheet model applicable to forestry and short rotation woody crop applications has recently been completed and made available to industry and the public on the Web.
Commercialization and Deployment Activities • Between 1983 and 1998, 70,000 acres of poplars were established commercially in the Pacific Northwest
with significant utilization of new hybrid materials generated by the DOE-funded research programs. Opportunistic market conditions, together with short-rotation crop technology readiness and technology transfer activities, were all critical to the commercialization success in the Pacific Northwest.
• Other types of short-rotation crops – including eucalyptus, sweetgum, sycamore, and willow, and established in other parts of the country – contribute to an approximate total level of commercialization of short-rotation woody crops of about 120,000 acres. Willow contributes a partial wood supply to a cofiring biomass power demonstration project. Switchgrass is already a crop planted on many Conservation Reserve Program acres, and it is the feedstock supply for two biomass power cofiring demonstrations.
U.S. Climate Change Technology Program – Technology Options for the Near and Long Term August 2005 – Page 2.3-20

2.3.9 PHOTOCONVERSION Technology Description
Photoconversion technology encompasses sunlight-driven quantum-conversion processes (other than solid-state photovoltaics) that lead to the direct and potentially highly efficient production of electrical power or fuels, materials, and chemicals from simple renewable substrates such as water, carbon dioxide (CO2) and nitrogen. This technology has the potential to eliminate the need for fossil fuels by substituting renewable sources and conversion processes that are either carbon neutral (any carbon generated is reused during plant growth) or carbon free (e.g., hydrogen from water). These technologies also can convert CO2 into liquid and gaseous fuels via processes that are often termed biomimetic, or bio-inspired. System Concepts • Photoconversion processes use solar photons
directly to drive biological, chemical, or electrochemical reactions to generate electricity, fuels, materials, or chemicals.
• System components include biological organisms or enzymes, semiconductor structures (photoelectrochemical cells, colloids, nanocrystals, certain plastics or polymers, quantum dots or nanoparticles, or superlattices), biomimetic molecules, dye molecules, synthetic catalysts, or combinations of the above.
Representative Technologies • Elements of this future solar technology include photobiological, photochemical, photoelectrochemical,
photocatalytic, and dark catalytic processes for energy production. • Photoconversion technologies can produce electrical power, hydrogen, biodiesel, organic acids, methane,
methanol, and plastics. These technologies also can remove CO2 from the atmosphere through photoreduction of CO2 to fuels, materials, and chemicals. Moreover, they can achieve atmospheric nitrogen fixation (independent of natural gas) and convert biomass to fuels, materials, or chemicals.
• Most of these technologies are at early stages of research, but some are at the development level, and some that produce high-value products are commercial.
Technology Status/Applications • Power production: dye-sensitized, nanocrystalline, titanium dioxide semiconductor solar cells are 8%-11%
efficient and are potentially very cheap. In contrast to solid-state PV solar cells, light is absorbed by dye molecules in contact with an electrolyte rather than solid-state semiconductor materials. Novel photoelectrochemical cells with integrated fuel cells and in situ storage for 24-h solar power have been demonstrated at 6%-7% efficiency in 4-by-8-foot panels using a system developed by Texas Instruments, and photochargeable batteries that include electrochemical storage have been demonstrated with 24-h power output. Hot-carrier photoconversion technology for increasing solar-conversion efficiencies (with theoretical efficiency limits of 65%-86%, depending on the solar photon concentration) is making progress. The term “hot carrier” refers to the utilization of highly energetic electrons (called hot electrons and created upon absorption of photons with energies larger than the semiconductor bandgap) for useful chemical production or electrical power, rather than converting the excess electron energy to heat by photon
A photoconversion process to produce hydrogen from metabolically engineered algae.
U.S. Climate Change Technology Program – Technology Options for the Near and Long Term August 2005 – Page 2.3-21

emission. In present photoconversion and photovoltaic devices, the hot electrons cool, and their excess energy is lost as heat in a picosecond (1E-12 sec) or less. Semiconductor nanostructures have been found to slow the cooling time of hot electrons by up to two orders of magnitude, thus enhancing the probability for hot electron conversion.
• Fuels production: Photoelectrochemical and photobiological processes that will lead to hydrogen production from water or gasified biomass are at the early stages of research, and important advances have been made recently; biodiesel, methane, and methanol production from water, waste, and CO2 are at various stages of R&D; and fuels, such as methanol – produced by the direct electrocatalytic or photocatalytic reduction of CO2 – are at the early fundamental research stage. Electrocatalytic concentration of CO2 from the atmosphere is being studied as well; it is of interest to people involved in atmospheric control in small spaces (i.e., submarines and the space station) and has potential for removing CO2 from the atmosphere in the future.
• Materials and chemicals production: Producing materials and chemicals from CO2 and/or biomass, as well as producing fertilizer from atmospheric nitrogen and renewable hydrogen, will reduce CO2 emissions compared with the fossil fuels used currently.
• Photobiological production of pigments (e.g., astaxanthin), health foods, nutritional supplements (e.g., omega-3 fatty acids), protein, and fish food is commercial. Production of biopesticides and pharmaceuticals is under development. Production of commodity chemicals such as, but not limited to, glycerol, hydrogen peroxide, and bioemulsifiers is possible. Photocatalytic production of specialty or high-value chemicals has been demonstrated.
Current Research, Development, and Demonstration RD&D Goals • In the near-term, research will focus on applications related to electrical power and high-value fuels and
chemicals, where commercial potential may be expected during the next 5 to 10 years. If successful, larger-scale applications of photoconversion technologies may follow in the period from 2010 to 2015, with materials and fuels production beginning in the period 2015 to 2020, and commodity chemicals production in the period from 2020 to 2030.
RD&D Challenges • Develop the fundamental sciences in multidisciplinary areas involving theory, mechanisms, kinetics,
biological pathways and molecular genetics, natural photosynthesis, materials (semiconductor particles and structures), catalysts and catalytic cycles, and biomimetic components. Progress in fundamental science is needed to underpin the new photoconversion technologies.
• Maintain critical mass research groups in vital areas long enough for sustained progress to be made. RD&D Activities • A significant level of basic research activities in solar photoconversion is currently being performed by the
DOE Office of Science; some exploratory R&D is being performed by DOE Office of Energy Efficiency and Renewable Energy/Office of Solar Technologies.
• Some basic research support by the National Science Foundation and the U.S. Department of Agriculture is complementary.
Recent Progress • Prototype dye-sensitized nanocrystalline semiconductor solar cells have been demonstrated as power
sources in small niche markets. Commercial interest is very high because they also can be configured to produce hydrogen.
• Scientific breakthroughs during the past seven years have been made in microbial and enzymatic R&D; natural photosynthesis; semiconductors, nanostructures, quantum dots, and superlattices; CO2 catalysis; and energy and electron transfer in artificial donor/acceptor molecules.
U.S. Climate Change Technology Program – Technology Options for the Near and Long Term August 2005 – Page 2.3-22

Commercialization and Deployment Activities
• Astaxanthin, a pigment synthesized from petroleum, is used as a coloring agent in the poultry and salmon industries. Algal production of the pigment just started in Hawaii and is replacing the fossil version for health and environmental reasons. Large-scale algal ponds are producing high-value chemicals on a commercial basis using photobiological processes. As an example, the current astaxanthin market is $180 M/year and is expected to rise to $1 B/year in five years.
• European and Japanese companies are beginning to commercialize dye-sensitized, nanocrystalline cell-powered watches. The market is estimated to be 100 million units.
Market Context • Besides the applications discussed above, many spin-off technologies are possible. These include
optoelectronics, biosensors, biocomputers, bioelectronics, and nanoscale devices.
U.S. Climate Change Technology Program – Technology Options for the Near and Long Term August 2005 – Page 2.3-23

2.4 NUCLEAR FISSION 2.4.1 RESEARCH UNDER THE GENERATION IV NUCLEAR ENERGY
SYSTEMS INITIATIVE Technology Description
Electricity from nuclear power generates no greenhouse gas emissions. To the extent that next-generation nuclear fission energy systems can address prevailing concerns, nuclear power can continue to be an important part of a greenhouse gas emissions-free energy portfolio. Although evolutionary light water reactors of standardized design are now available – and have received Nuclear Regulatory Commission design certification and been constructed on schedule in Japan and South Korea – newer nuclear energy systems in the long term need to offer significant advances in the areas of sustainability, proliferation resistance and physical protection, safety, and economics. These newer nuclear energy systems are required to replace or add to existing light water reactor capacity and can be available starting in 2020. To develop these next-generation systems, DOE has initiated the Generation IV Nuclear Energy Systems Initiative. Generation IV is an international effort, with participation by Argentina, Brazil, Canada, France, Japan, Republic of Korea, Republic of South Africa, Switzerland, the United Kingdom, and the United States. The Generation IV Nuclear Energy Systems Technology Roadmap was completed in December 2002. The completed roadmap has identified the six most promising fission energy systems for potential further development. In FY 2003, DOE and its international partners initiated preconceptual design studies, fuel and materials development, and energy conversion development on promising systems of interest, which will lead to demonstration and eventual deployment (with industry and international participation) of one or more systems. System Concepts • Advanced fission reactors and fuel cycles that will reduce the potential for proliferation of nuclear materials,
provide economical electricity generation, and contribute to hydrogen generation, with minimal waste products.
Representative Technologies • Gas-Cooled Fast Reactor (GFR). • Lead-Cooled Fast Reactor (LFR). • Molten Salt Reactor (MSR). • Sodium-Cooled Fast Reactor (SFR). • Supercritical-Water-Cooled Reactor (SCWR). • Very-High-Temperature Reactor (VHTR). Technology Status/Applications • Advanced fission reactors and fuel cycles: development is at advanced stage; demonstration is incomplete. • High-temperature gas-cooled reactor development is focused on high-conversion efficiency through direct
use of the high-temperature gaseous reactor coolant to power a gas turbine driving a generator (i.e., direct conversion), also capable of high-efficiency hydrogen production through electrolysis or chemical processes.
• Liquid metal-cooled reactors (both sodium and lead) have been successfully operated worldwide. Safety performance has been demonstrated, but economic performance needs improvement.
• Technologies for advanced fuel recycle and remote fuel refabrication have been developed in the laboratory, and some elements have advanced to pilot scale.
• Nuclear-assisted hydrogen production by means of thermochemical cracking of water is at the preconceptual design stage, requiring extensive development.
• Other advanced fission systems are at a preconceptual stage, requiring extensive development and irradiation testing of new fuel forms and high-temperature materials.
• Direct-cycle turbine technology requires development and demonstration.
U.S. Climate Change Technology Program – Technology Options for the Near and Long Term August 2005 – Page 2.4-1

Current Research, Development, and Demonstration
RD&D Goals • Goals for next-generation fission energy systems (Generation IV) research are focused on the design of
reactors and fuel cycles that are safer, more economically competitive, more resistant to proliferation, produce less waste, and make better use of the energy content in uranium.
RD&D Challenges • Demonstrate technology for advanced concepts. • Develop proliferation-resistant fuel-cycle concepts. • Develop safety, waste, and proliferation aspects of advanced fission reactors. • Conduct comprehensive R&D on advanced fission reactor concepts, relying heavily on international
collaboration. RD&D Activities • Federally funded development of advanced reactors and fuel cycles has been resumed in the United States,
through the Nuclear Energy Research Initiative, the Generation IV Nuclear Energy Systems Initiative, and the Advanced Fuel Cycle Initiative.
• Advanced used fuel treatment technologies are under development through the Advanced Fuel Cycle Initiative.
Recent Progress • Advanced light water reactors have received design certification from the Nuclear Regulatory Commission. • An advanced boiling water reactor, which was built in less than five years, is operating in Japan.
Commercialization and Deployment Activities • Generation IV Nuclear Energy Systems are projected to be ready for commercial deployment in the
timeframe of 2020 to 2030. Market Context • Indeterminate at this time. Potentially large international and domestic markets.
U.S. Climate Change Technology Program – Technology Options for the Near and Long Term August 2005 – Page 2.4-2

2.4.2 RESEARCH ON NUCLEAR POWER PLANT TECHNOLOGIES FOR NEAR-TERM DEPLOYMENT
Technology Description Electricity from nuclear power generates no greenhouse gas emissions. To the extent that deployment of near-term nuclear power plants can address prevailing concerns, nuclear power can continue to be an important part of a greenhouse gas emissions-free energy portfolio. In order to enable the deployment of new, advanced nuclear power plants in the United States in the relatively near-term – within a decade – it is essential to demonstrate the untested federal regulatory and licensing processes for the siting, construction, and operation of new nuclear plants. In addition, other major obstacles (including the initial high capital costs of the first few plants and the business risks resulting from this and the regulatory uncertainty) must be addressed. Technology development on near-term advanced reactor concepts that offer enhancements to safety and economics is needed to enable these new technologies to be competitive in the deregulated electricity market, and support energy supply diversity and security. The Near-Term Deployment Roadmap was issued in October 2001 and advises DOE on actions and resource requirements needed to support deployment of new nuclear power plants. The primary focus of the roadmap is to identify the generic and design-specific gaps to near-term deployment, to identify those designs that best promise to meet the needs of the marketplace, and to propose recommended actions that would close gaps and otherwise support deployment. This includes, but is not limited to, actions to achieve economic competitiveness and timely regulatory approvals. System Concepts • Advanced fission reactor designs that are currently available or could be made available with limited
additional work to complete design development and deployment in the 2010 timeframe. Representative Technologies • Certified Advanced Light Water Reactor designs: ABWR, AP600, System 80+. • Enhancements to certified designs with some engineering work already completed: AP1000, ESBWR. (An
NRC design certification rulemaking is scheduled for the AP-1000 in December 2005.) • Proposed light water reactor designs from overseas with potential for near-term deployment in the United
States: ACR-700, EPR. Technology Status/Applications • All near-term deployment designs are well-defined concepts in varying stages of development. Most still
need significant detailed engineering development and/or regulatory approval. Current Research, Development, and Demonstration
RD&D Goals • Research goals are focused on successfully demonstrating the untested regulatory processes for Early Site
Permit (ESP) and combined Construction and Operating License (COL) processes and on the regulatory acceptance (certification) and completion of first-of-a-kind engineering and design.
• Specific goals include an industry decision to order a new nuclear power plant by 2008 and deployment of one or more new nuclear power plants in the 2010 time frame.
U.S. Climate Change Technology Program – Technology Options for the Near and Long Term August 2005 – Page 2.4-3

RD&D Challenges • Support resolution of the technical, institutional, and regulatory barriers to the deployment of new nuclear
power plants in the 2010 time frame, consistent with recommendations in Near-Term Deployment Roadmap.• In cooperation with the nuclear industry, demonstrate the untested regulatory processes for Early Site Permit
and combined Construction and Operating Licenses to reduce licensing uncertainties and attendant financial risk to the licensees.
• Provide for technology development to enable finalization and NRC certification of those advanced nuclear power plant designs that the U.S. power generation companies are willing to build.
• Provide for development and demonstration of advanced technologies to reduce construction time for new nuclear power plants and to minimize schedule uncertainties and associated costs for construction.
RD&D Activities • Demonstration of regulatory processes for Early Site Permit and combined Construction and Operating
Licenses. • Development and NRC certification of advanced nuclear plant designs.
Recent Progress • Three near-term deployment designs have been certified by the Nuclear Regulatory Commission. • Reactor vendors are exploring NRC certification of advanced reactor concepts. • The three cost-shared Early Site Permit (ESP) demonstration projects initiated with industry in FY 2002;
power companies submitted ESP applications to the NRC for review and approval. Issuance of NRC approved ESPs is anticipated in calendar year 2006.
• Two cost-shared Construction and Operating License (COL) demonstrations projects were initiated with power companies in FY2005, with activities leading to a decision to submit a COL application to the NRC in 2007.
• A nuclear power plant cost and construction assessment to independently evaluate the cost, schedule, and construction methods of the Advanced Boiling Water Reactor design by GE, as well as identify promising improvements to the construction methods and techniques to support new nuclear power plant deployment in the 2010 timeframe will complete in FY 2005.
• The Advanced Boiling Water Reactor has been deployed successfully in Japan; Advanced Boiling Water Reactors are under construction in Taiwan.
Commercialization and Deployment Activities • At least two designs and perhaps more can be commercialized in the United States within the next decade.
Achieving this goal will require a major effort by industry and DOE to work together to resolve open issues and to share the one-time costs of closing both generic and design-specific gaps.
Market Context • The focus of the market is in the United States. Due to the uncertainty regarding the impacts of deregulation,
designs in the 100-300 MWe range and the 1,000 MWe-plus range are both required.
U.S. Climate Change Technology Program – Technology Options for the Near and Long Term August 2005 – Page 2.4-4

2.4.3 ADVANCED FUEL CYCLE INITIATIVE Technology Description
The Advanced Fuel Cycle Initiative (AFCI), under the leadership of DOE, is focused on developing advanced fuel cycle technologies, which include spent fuel treatment, advanced fuels, and transmutation technologies, for application to current operating commercial reactors and next-generation reactors and to inform a recommendation by the Secretary of Energy in the 2007-2010 time frame on the need for a second geologic repository. The AFCI program will develop technologies to address intermediate and long-term issues associated with spent nuclear fuel. The intermediate-term issues are the reduction of the volume and heat generation of material requiring geologic disposal. The program will develop proliferation-resistant processes and fuels for application to current light water reactor systems and Generation IV reactor systems to enable the energy value of these materials to be recovered, while destroying significant quantities of plutonium. This work provides the opportunity to optimize use of the nation’s first repository and reduce the technical need for an additional repository. The longer-term issues to be addressed by the AFCI program are the development of fuel cycle technologies to destroy minor actinides, greatly reducing the long-term radiotoxicity and heat load of high-level waste sent to a geologic repository. This will be accomplished through the development of Gen IV fast reactor fuel cycle technologies and possibly accelerator-driven systems System Concepts • Advanced nuclear systems (fission reactors and accelerator-driven systems) that aim to reduce the lifetime of
the waste from current-generation fission reactors to short times. • Advanced nuclear systems that aim to extract the full energy potential of the spent nuclear fuel from current
fission reactors, while reducing or eliminating the potential for proliferation of nuclear materials and technologies, and reducing the amount of waste produced.
Representative Technologies • Spent-fuel treatment technologies that are proliferation resistant. • Advanced fuel types for waste transmutation. • Advanced fuel types for sustained nuclear energy. • Accelerator-driven systems for rapid waste transmutation. • Advanced reactors for sustained nuclear energy. Technology Status/Applications
Advanced Separations(UREX+)
Pu/Np
Reactor(LWR/HTGR)
Gen IV Fast Reactor(Transmuter)
Trace PuTrace ActinidesFission Products
Repository
Uranium
SpentFuelRecycle
Uranium
Chemical Processing & LWR/HTGR Fast Reactor Recycle
• Pu consumption and toxicity reduction
• Significant reduction in number of waste packages
• Permits significant expansion to existing repository
U.S. Climate Change Technology Program – Technology Options for the Near and Long Term August 2005 – Page 2.4-5

• Advanced fuel-cycle development has reached the laboratory scale-demonstration stage in some cases. • Transmutation fuels are in early R&D stages. • Development of accelerator-driven systems is at the early R&D stage.
Current Research, Development, and Demonstration RD&D Goals • Proving design principles of spent-fuel treatment and transmutation technologies. • Demonstrating the fuel and separation technologies for waste transmutation. • Deploying Generation IV advanced fast spectrum reactors that can transmute nuclear waste. RD&D Challenges • Demonstrate performance of advanced fuel cycles. • Demonstrate performance of advanced transmutation fuels. • Demonstrate technology for advanced fission reactor concepts. • Demonstrate feasibility and technology for accelerator-driven systems. RD&D Activities • Continued development and demonstration of aqueous and electrometallurgical spent-fuel treatment
technologies. • Development of transmutation fuels for Generation IV reactor systems. • Development of technologies for accelerator-driven systems.
Recent Progress • Hot demonstration of several parts of the UREX+ (Uranium Extraction Plus) aqueous spent fuel-treatment
process, including separation of high-purity uranium, cesium/strontium, plutonium/neptunium, and americium/curium products.
• Irradiation tests of several transmutation fuels containing transuranic elements Commercialization and Deployment Activities
• Disposal of spent nuclear fuel is a government activity in the United States. Similar spent-fuel treatment and transmutation technology development programs exist in France, Japan, and the United States. Development of treatment and transmutation technologies for use with advanced Generation IV fuel cycles will increase the acceptability of nuclear energy.
• Advanced Fuel Cycle Initiative has the potential to decrease the quantity and toxicity of nuclear waste, possibly eliminating the need for a second geologic repository.
Market Context • Technologies to improve spent-fuel disposition increase the value of keeping existing nuclear power plants
online as well as increase the likelihood for expanded new nuclear power capacity.
U.S. Climate Change Technology Program – Technology Options for the Near and Long Term August 2005 – Page 2.4-6

2.5 FUSION 2.5.1 FUSION ENERGY
Technology Description Fusion can be achieved using either magnetic forces to confine the hot plasma fuel or intense laser/particle beams, which rapidly compress a pellet of fuel. Both methods use deuterium/tritium fuel. Deuterium is abundantly available from water, and tritium can be produced from lithium within the fusion plant. The energy of the fusion reactions could be used to generate electricity and/or hydrogen at central power plants with no greenhouse gas emissions. Due to anticipated low fuel costs, electricity produced from fusion at off-peak hours could also be used to generate hydrogen at off-site fueling stations. System Concepts • Strong magnetic fields produced by
superconducting coils confine plasmas with temperatures of several hundred million degrees Celsius. Approximately 20% of the heat from the fusion reactions remains in the fuel to sustain its high temperatures; the rest is carried out by neutrons and is absorbed in a surrounding blanket that serves both as a heat source to produce power and as a medium for producing the tritium.
• Compressed fuel pellets ignite and burn, producing repetitive pulses of heat and neutrons in a reaction chamber. Like its magnetic counterpart, inertial fusion uses a blanket, which surrounds the fusion chamber to produce power and breed tritium.
Representative Technologies • Large, high-current-density
superconducting magnets; deuterium ion beams (energies of 100–1000 keV); plasma-facing components: millimeter-wave high-power microwaves; high-power, radio-frequency sources and launchers; and tritium fueling apparatus are required for magnetic fusion.
• Heavy ion beam accelerators; diode-pumped solid-state lasers, krypton-fluoride gas lasers, or fast Z-pinches; and target design and fabrication technologies are required for inertial fusion.
• Structural materials with low-activation properties will be required to fulfill the ultimate potential of fusion devices. Tritium generation and heat-recovery systems are other common nuclear system technologies required for all fusion concepts.
Technology Status/Applications • Moderate-sized magnetic confinement fusion experiments, with plasmas at temperatures needed for power
plants, have produced more than 16 MW of fusion power, and more than 22 MJ per pulse. • A facility has been designed through an international project called ITER; which, if built, will support
scientific experiments and engineering tests for magnetic fusion burning plasma that is near commercial power plant scale (500 MW of fusion power, 500-2500 sec pulse length).
• The target physics of ignition and high gain, using glass lasers, are objectives of the National Ignition Facility, now under construction.
• Candidate high-efficiency, high-repetition gas and solid-state laser driver technologies for inertial fusion energy have been developed and demonstrated in a National Nuclear Security Administration (NNSA)-funded program.
Pictured above is the fusion-specific portion of a 1,000 MWe power plant, the result of a conceptual design study done to explore the scientific and technological issues associated with the possible reactor embodiments of fusion.
U.S. Climate Change Technology Program – Technology Options for the Near and Long Term August 2005 – Page 2.5-1

• Dramatic advances have been made in the diagnosis, understanding, computer simulation, and control of magnetically confined plasmas, allowing improved designs of confinement systems and increased confidence in extrapolations to power plant scale.
Current Research, Development, and Demonstration RD&D Goals • Accelerate the advance of scientific understanding of fusion plasmas. • Determine the approaches and configurations that will take the best advantage of the newest scientific
insights. • Qualify low-activation materials that meet structural and compatibility criteria. RD&D Challenges • Create a self-sustaining burning plasma. • Develop magnetic geometries optimal for heat containment that at the same time (1) minimize technical
complexity, (2) maximize fusion power density for good economics, and (3) operate in a continuous mode. • Understand target requirements for high gain; reduce the development cost of candidate drivers; and develop
long-life chambers and low-cost pellet targets. • Develop low-activation materials that also meet structural and compatibility criteria. RD&D Activities • Coordinated worldwide magnetic fusion experimental and theoretical efforts center on understanding plasma
behavior in toroidal magnetic fields. Fusion technology and materials development is also being pursued internationally.
• The United States has joined Europe, Japan, South Korea, China, and Russia to negotiate an agreement for construction of ITER, a magnetic fusion-burning plasma science and engineering test facility, which is to be capable of operation for 500–2,500 sec with a fusion power level of 500 MW.
• The National Ignition Facility project, funded by the National Nuclear Security Administration, will provide information on high-gain, single-shot pellet burn experiments for inertial fusion energy.
Recent Progress • More than 10 MW of fusion power was produced in magnetically confined plasma for about 1 second, using
deuterium-tritium fuel. • Improved understanding of plasma stability and turbulence has led to improved plasma performance in
existing facilities and improved configuration designs for the future. • Ferritic steels show promise as a low-activation structural material for use in fusion devices. • The potential improvement in the efficiency in the heating of an inertial fusion pellet by the use of a second
laser pulse at the petawatt level in a scenario called Fast Ignition has been demonstrated experimentally. Commercialization and Deployment Activities
• Large central-station, electrical-generating plants based on fusion could be commercialized late in the second quarter of the 21st century; the timescale depends on a sustained international effort and success in that R&D.
• These fusion power plants would replace aging and polluting power generators and fill a potential multibillion-dollar per year market sector; they could also be used to produce hydrogen.
• Fusion also may find use in transmutation of fissile waste products. • Many technologies developed for fusion are used in the commercial sector. Prominent are plasma processing
for etching semiconductor chips, hardening of metals, thin-film deposition, and plasma spraying and lighting applications. Other applications from this research include medical imaging, heat-removal technologies, destruction of toxic waste, X-ray lithography and microscopy, micro-impulse radar, precision laser cutting, large-scale production of precision optics, and high-power microwave and accelerator technologies.
• Emphasize fusion science, concept improvement and alternative approaches, and development of materials. • Recognize increasing importance of international cooperation as a means of building major facilities. Market Context • Large potential market in the United States and throughout the world.
U.S. Climate Change Technology Program – Technology Options for the Near and Long Term August 2005 – Page 2.5-2

Nuclear Power
Nuclear power is an abundant, affordable, clean, and safe source of energy.
The U.S. has 103 commercial nuclear power plants operating in 31 states, supplying approximately 20 percent of America’s electricity.
Annually the domestic use of nuclear energy prevents the release of up to 3
million tons of sulfur dioxide and 1 million tons of nitrogen oxide, and avoids the emission of 700 million tons of carbon dioxide—an amount nearly equal to the annual emissions from our 136 million passenger cars.
The EPAct 2005 includes:
o Loan guarantees (the current solicitation is limited to $2 billion in total
loan guarantees and excludes nuclear technologies in this first round) o Production tax credits of $0.018 per kWh over eight years limited to $125
million in a year per 1,000 MWe allocated to a particular new nuclear plant
o Federal risk insurance for a delay in operation of new nuclear plants from causes beyond the power company’s control
Since the passage of EPAct 2005 and in recognition of the benefits accruing from
the continuing Federal nuclear R&D programs, 12 companies have expressed an interest in building new plants.
The current Federal nuclear R&D programs include:
o The Nuclear Power 2010 program, which is focused on reducing the
technical, regulatory and institutional barriers to deployment of new nuclear power plants, including the demonstration of the new Nuclear Regulatory Commission licensing processes—10 CFR Part 52;
o The Generation IV Nuclear Energy Systems Initiative, which addresses the fundamental research and development issues necessary to establish the viability of next-generation nuclear energy system that are expected to offer improvements in safety, sustainability, cost-effectiveness, and proliferation resistance relative to current reactor plant designs;
o The Nuclear Hydrogen Initiative, which conducts R&D of enabling technologies, demonstrates nuclear-based hydrogen production technologies, and studies potential hydrogen production strategies; and
o The Global Nuclear Energy Partnership (GNEP), which seeks to develop worldwide consensus on enabling expanded use of economical, zero-emission nuclear energy to meet growing electricity demand while

reducing the risk of nuclear proliferation, through an international program— using new technologies that will effectively and safely recycle
spent nuclear fuel and potentially can reduce significantly the storage requirements for nuclear waste;
allow the recovery of fissile materials in spent fuel that would otherwise be sent directly to a geologic repository; and
help developing countries meet their growing energy needs by providing them with small-scale reactors that will be secure and cost-effective in exchange for their commitment to forego uranium enrichment and reprocessing activities that can be used to develop nuclear weapons.
Treatment of Projects. Version 4. October 23, 2002
1TREATMENT OF PROJECTS
This paper is one in a series that identifies issues and options involved in developing revisions to the Department of Energy=s Voluntary Greenhouse Gas Reporting Program, which was created pursuant to Section 1605b of the Energy Policy Act of 1992. Other papers in this series are available at: http://www.pi.energy.gov/enhancingGHGregistry The Department of Energy=s Voluntary Reporting of Greenhouse Gases program has been operational since 1994. The program records voluntarily submitted data on greenhouse gas (GHG) emissions and the results of actions to reduce, avoid, or sequester greenhouse gas emissions. On February 14, 2002, the President recognized the need to enhance the greenhouse gas registry by improving the program=s accuracy, reliability, and verifiability as a means of more effectively promoting innovative and effective ways to reduce greenhouse gas emissions. Specifically, the President:
Directed the Secretary of Energy, in consultation with the Secretary of Commerce, the Secretary of Agriculture, and the Administrator of the Environmental Protection Agency, to propose improvements to the current voluntary emissions reduction registration program under section 1605(b) of the 1992 Energy Policy Act within 120 days. These improvements will enhance measurement accuracy, reliability, and verifiability, working with and taking into account emerging domestic and international approaches. Directed the Secretary of Energy to recommend reforms to ensure that businesses and individuals that register reductions are not penalized under a future climate policy and to give transferable credits to companies that can show real emissions reductions. Directed the Secretary of Agriculture, in consultation with the Environmental Protection Agency and the Department of Energy, to develop accounting rules and guidelines for crediting sequestration projects, taking into account emerging domestic and international approaches.
On May 6, 2002, the Department of Energy solicited comments on various issues relevant to its efforts to implement the President's directives. The request for comments and the comments received are located at the website above. On July 8, 2002, after considering public comments, the Secretaries of Energy, Commerce and Agriculture, and the Administrator of the Environmental Protection Agency provided the President with ten recommended improvements to the Voluntary Greenhouse Gas Reporting Program:
1. Develop fair, objective, and practical methods for reporting baselines, reporting boundaries, calculating real results, and awarding transferable credits for actions that lead to real reductions.
Treatment of Projects. Version 4. October 23, 2002
2
2. Standardize widely accepted, transparent accounting methods.
3. Support independent verification of registry reports.
4. Encourage reporters to report greenhouse gas intensity (emissions per unit of output) as well as emissions or emissions reductions.
5. Encourage corporate or entity-wide reporting.
6. Provide credits for action to remove carbon dioxide from the atmosphere as well as for actions to reduce emissions.
7. Develop a process for evaluating the extent to which past reductions may qualify
for credits.
8. Assure the voluntary reporting program is an effective tool for reaching the 18 percent goal.
9. Factor in international strategies as well as State-level efforts.
10. Minimize transactions costs for reporters and administrative costs for the
Government, where possible, without compromising the foregoing recommendations.
In addition to these recommendations, the Secretaries of Energy, Commerce and
Agriculture, and the Administrator of the Environmental Protection Agency proposed a process leading to revising the guidelines by January 2004 that includes this series of stakeholder workshops. The workshops, for which these background papers are prepared, are intended to assist the Department of Energy and the other participating agencies to enhance the reporting of greenhouse gas emissions and emission reductions, as authorized by existing law and directed by the President.
The issues discussed in these papers are similar to those the Department considered in
developing the existing guidelines. The President=s June 14, 2002 policy directive has added new considerations that require revisiting these issues. Some of the reporting flexibility provided in the existing program may not be consistent with an revised program that includes enhanced measurement accuracy, reliability, and verifiability, takes into account emerging domestic and international approaches, and ensures that businesses and individuals that register reductions are not penalized under a future climate policy and to give transferable credits to companies that can show real emissions reductions.
1. Background

Treatment of Projects. Version 4. October 23, 2002
3 Under the current 1605(b) program reporting units can, and often do, report entity wide-
changes in emissions. Nevertheless, reductions in emissions can be reported at the project level for both domestic and international activities. For this paper, a project is defined as a subset of all activities undertaking by a given entity. Typical examples of projects include energy efficiency projects where equipment which consume less fuel and emit fewer ghg gases are installed; fuel-switching from more ghg intensive fuels to less intensive ones; reductions in flaring of ghg-intensive products; and forest sequestration.
Project reporting faces many of the same issues as entity reporting discussed elsewhere.1
The discussion of this paper focuses for the implications of project level reporting of the President’s directive to recommend reforms that could ensure transferable credits for real reductions and the Secretaries’ recommendations to encourage both entity wide reporting and greenhouse intensity (emissions per unit of output). Issues that arise both outside and within the boundaries of the project are examined.
2. Issues for Entity Emissions and Withdrawals Unrelated to a Given Project
A. Entity-Wide Reporting The major distinction between project-level reporting and entity-wide reporting is that, with the former, the reporting unit does not have to report changes in emissions unrelated to the particular projects. Therefore, the possibility exists, for example, that an entity’s net emissions or intensity may increase even though the net emissions for a project may have decreased. The issue is whether the rules under which a voluntary program operates should attempt to ensure that reductions in net emissions related to the project are not offset elsewhere. This raises the question whether entities claiming reductions at the project level might also have to report entity wide changes in order to receive credit for real reductions. B. Emissions Intensity Reporting Measuring performance based on emissions intensity has the advantage of eliminating the effect of changes in output due changes in production. For an entity, the metric most commonly mentioned is emissions per unit of physical output. A problem that arises with this metric is that many businesses produce multiple products or output, thereby, making it difficult to derive a single measure that would accommodate changes in product mix. Coming up with a single measure is easier if changes in intensity are measured at the project level, but aggregating to an entity level would still be difficult. An alternative metric sometimes mentioned is emissions per dollar of value added although this presents difficult accounting issues and may not be viable.
3. Issues for Entity Emissions and Withdrawals Related to a Given Project

Treatment of Projects. Version 4. October 23, 2002
4 This discussion focuses on two issues whose characteristics are qualitatively and
quantitatively different than those faced by an entity: the definition of project baselines and project boundaries. Project baselines are important to the success of any modified 1605b program whose goal is to produce emissions reductions and removals that could qualify as real reductions under some future system of tradable credits. Since projects can result in changes in emissions levels off-site, a methodology for defining spatial and temporal limits for emissions accounting, or boundaries, is also critical to the success of such a goal.
A. Project Baselines
Since the choice of baseline methodology may determine how many emissions credits a
project accrues, the avoidance of systematic errors is central to the success of any modified 1605b program. Systematic errors can result in a number of undesirable outcomes. An overly generous methodology may increase global emissions. Adopting a methodology that sets baselines too low will reduce the economic incentives for participation in GHG mitigation projects. Frequently mentioned criteria for any methodology for determining project level baselines include accuracy, consistency, cost-effectiveness, simplicity, transparency and verifiability of the methodology.2
The issue is what baseline scenario best describes what would have happened in the
absence of the project. This baseline in fact is a reference scenario that Ais expected to occur in the absence of the certified project activity@. The basis of baselines ranges from simple historic averages to those based on sophisticated modeling.
A.(1) Simple Project Baselines Often referred to as benchmarks, simple baselines may be based on measurements such
as historic, current or extrapolated conversions efficiencies or ghg intensity. While it is not clear that simple baselines will be recognized as valid baseline approaches under Kyoto Protocol rules, they may be relevant for small projects under a modified 1605b program where baseline development costs need to be contained.
A.(2) Baselines Based on Model Forecasts Baselines may be based on model simulations designed to predict what would have
happened in the absence of the proposed project activity. These models can also be used in developing the project proposal to determine the anticipated level of reductions resulting from the project.
Identifying a proper baseline B or Awhat would have happened otherwise@-- often
involves an assessment of the regulatory, technology, market and economic environments of the project. Specific factors for deciding the level emissions that might be included in

Treatment of Projects. Version 4. October 23, 2002
5the baseline include (1) regulatory or statutory limits, (2) profitability and (3) projected rates of penetration of new technologies.
A.(2)(a) Regulatory or statutory limits may represent an upper bound of possible
emissions in the baseline depending on the standard applied. Regulatory and statutory limits can only form the basis for a baseline provided the assumption of clear laws, properly implemented and enforced, holds. A critical question is whether the project activity or baseline option is required under the existing or contemplated legal/regulatory framework.
A.(2)(b) Profitability can serve as a guideline for establishing the baseline although it is
necessary to forecast future market conditions. Profitability relates to the commercial viability of the activity. A key issue is whether, when GHG benefits are assigned no value, the internal rate of return (IRR) on the activity would meet or exceed the hurdle rate of the project investor. An activity that has an acceptable rate of return before GHG benefits are monetized will probably be part of the baseline.
A.(2)(c) Forecasts of future rates of penetration is another way of establishing baselines
provided the potential for market barriers and government failures can be assessed. Assessing market barriers requires one to examine whether the proposed project activity faces impediments that would prevent its implementation. These could be financial, such as lack of capital, or non-financial, such as lack of awareness or lack of skilled personnel. An activity that faces significant barriers to implementation will probably not be part of the baseline, even if on paper it appears to be commercially viable.
B. Project Boundaries Properly defining project boundaries is important because of potential positive and
negative indirect effects. Indirect effects exist where a project reduces on-site GHG emissions but emissions are affected in another location. For example, a boiler efficiency project that decreases coal consumption could result in a slight change of price to some other users, thereby stimulating an increase in consumption off-site.
Positive indirect effects arise when a project induces emission reductions elsewhere that
are not credited. These effects can occur due to a variety of off-site impacts of a project such as a demonstration effect, economies of scale, learning-by-doing and other induced technological changes, and institutional capacity building.
Negative indirect effects arise when a project induces emission increases elsewhere that
are not counted against on-site reductions. These effects can occur due to a variety off-site impacts of a project although it is generally agreed that leakages are the most important kind of negative indirect effect.3 Many of these leakages seem to be associated with projects that cause price changes. For example, energy efficiency projects may reduce demand for fuels, thereby encourage increased consumption

Treatment of Projects. Version 4. October 23, 2002
6elsewhere. Forest sequestration projects, which are supply reducing, may cause price increases and elicit increased harvesting in other forested areas.
Ideally, the project boundary, which must be defined both spatially and temporally,
should encompass all direct and relevant indirect emissions and removals that were impacted by the project. This implies a causation test that would help identify GHG impacts that could be reasonably be attributed to the project.
A systematic bias in the definition of project boundaries, such as those that exclude
significant positive and negative indirect effects, could result in reduce incentives for participation or in an increase in global emissions. As of now there is no common methodology for GHG emissions accounting on the project level, especially for the accounting of upstream and downstream emissions. It has been suggested that any such methodology should satisfy criteria including materiality, control, avoidance of double counting, and cost-effectiveness.4 Additionally, all sub-systems of a project with GHG effects should be specified qualitatively and quantitatively by a methodology, including reference to:
Direct emission changes (on-site, within the sub-system) due to (1) changes of energy related fuel use; (2) Process changes; and (3) Other interventions leading to changes of other emission level components (such as
sequestration and the flaring of GHG-intensive products). Indirect emission level changes (off-site) due to (1) Changes in the imported quantity of a GHG-intensive input and substitutions of one
GHG-intensive input for another with a different GHG intensity. (Examples include fuel switches and supply-side efficiency improvements that reduce fossil fuel);
(2) Changes in the exported quantity of a GHG-intensive output and substitutions of one GHG-intensive output for another with a different GHG intensity (An example is the substitution of electricity produced by the project for electricity with a different GHG intensity produced elsewhere.); and
(3) Other changes, such as changing the quality of exported product, thereby creating net GHG emission level effects downstream.
(4) Options
A. Only allow entity reporting: This option raises the question of what to do with existing projects which are allowed under existing 1605b rules and whether previous reductions reported for projects would be disallowed entirely B. Require entity level reporting along with project level reporting: This option raises the question whether the unrelated emissions would count for or against those reductions reported as part of the project or whether the project results would count as read

Treatment of Projects. Version 4. October 23, 2002
7reductions regardless of entity activities.
Footnotes 1. See other papers on Corporate Boundaries, Entity Baselines, Treatment of International
Emissions, Verification, Historical Tons, Confidentiality and Operational Boundaries. 2. Accuracy implies that methods should not generate credits for substantially more
greenhouse gas emissions that actually realized. Consistency requires that similar projects be credited with similar benefits. Cost-effectiveness implies some limits to the costs of baseline development relative to project implementation costs. Simplicity suggests that the baseline methodology should be relatively straightforward. Transparency suggests that the methodology and data be available and understandable to the general public. Verifiability means that estimates should be replicable.
3. Some studies have suggested that other forms of negative indirect effects are free riding in
the form of claiming credit for off-site reductions that would have occurred anyway and the rebound effect where efficiency improvements are associated with changes in consumer behavior.
4. Materiality refers to the concept that sources and sinks be counted only if they will
significantly affect the calculation of net emissions. Control is the issue of whether project boundaries should be defined by ownership or management or by whether or not emissions (on and off site) are a consequence of the project. Avoidance of double counting is simply the rule that multiple projects not be credited with the same reductions. Cost effectiveness suggests that monitoring and verification costs be considered in setting project boundaries.

ESA/P/WP.186* 21 August 2003
Department of Economic and Social Affairs United Nations Secretariat Population Division
LONG-RANGE POPULATION PROJECTIONS Proceedings of the United Nations Technical Working Group on Long-Range Population Projections United Nations Headquarters New York 30 June 2003
______________
*Prepared by the Population Division of the Department of Economic and Social Affairs of the United Nations Secretariat. This report may not be reproduced or reprinted without the express permission of the United Nations.

ii
NOTE The designations employed in this report and the material presented in it do not imply the expression of any opinion whatsoever on the part of the Secretariat of the United Nations concerning the legal status of any country, territory, city or area or of its authorities, or concerning the delimitation of its frontiers or boundaries. The term “country” as used in the text of this report also refers, as appropriate, to territories or areas. The designations “more developed”, “less developed” and “least developed” for countries, areas or regions are intended for statistical convenience and do not necessarily express a judgement about the stage reached by a particular country or area in the developing process. Symbols of United Nations documents are composed of capital letters combined with figures. This publication has been issued without formal editing.

iii
PREFACE
In addition to its biennial medium-range population projections, the Population Division of the Department of Economic and Social Affairs of the United Nations Secretariat has produced seven sets of long-range population projections since 1970. The first set of long-range projections was issued in 1974 and was consistent with the 1968 Revision of the medium-range population projections. The most recent set was issued in 2000 and is consistent with the results of the 1998 Revision of population projections to 2050.
The Population Division reviews regularly the assumptions used in projecting the fertility, mortality and international migration of national populations. Most recently, the Population Division has undertaken the systematic examination of the premises underlying the assumptions on future fertility trends. A series of three expert group meetings have been convened to discuss recent fertility trends and future prospects for different groups of countries. As a result of the deliberations of those meetings, the assumptions on future fertility trends have been modified significantly over the course of the three most recent sets of national population projections, namely, the 1998, 2000 and 2002 Revisions of World Population Prospects. In addition, the methodology for the projection of HIV/AIDS was revised considerably in the 2002 Revision and the assumptions about international migration have also been changing as better information becomes available. Consequently, the long-range projections consistent with the 1998 Revision are not consistent with the 2002 Revision and there is a need for a new set of long-range projections. The Population Division will adopt two major innovations in preparing a new set of long-range population projections consistent with the 2002 Revision. For the first time, such long-range projections will be made at the national level, that is, for each of the 228 units constituting the world. In addition, the time horizon for the projections will be extended to 2300, so as to allow for the eventual stabilization of the population in at least one scenario. In order to address the technical and substantive challenges posed by the preparation of long-range projections at the national level, the Population Division convened a meeting of the Technical Working Group on Long-Range Population Projections at United Nations Headquarters in New York on 30 June 2003. The purpose of the meeting was to discuss the assumptions and methodology that the Population Division was planning to use in the preparation of national population projections to 2300. The Technical Working Group consisted of fifteen invited experts participating in their personal capacity. Also attending were staff members of the Population Division, the Development Policy Analysis Division, the Division for Social Policy and Development, the Div ision for Sustainable Development, and the Statistics Division, all part of the Department of Economic and Social Affairs of the United Nations Secretariat. This document presents the report of the meeting of the Technical Working Group together with the background paper prepared by the Population Division and the questions addressed by the meeting. As in the past, the Population Division drew valuable guidance from the deliberations at the meeting as well as from comments submitted in writing by experts. All these inputs are being taken into consideration in preparing the next set of long-range projections. The Population Division extends its appreciation to all the experts for their suggestions and contributions to the preparation of the long-range projections. This publication may also be accessed on the Population Division world wide web site at www.unpopulation.org. For further information about the long-range projections, please contact the office of Mr. Joseph Chamie, Director, Population Division, United Nations, New York, NY 10017, USA, tel. 212-963-3179 and FAX: 212-963-2147.

iv

v
Contents Page Preface....................................................................................................................................................................................... iii Explanatory notes..................................................................................................................................................................... vi I. REPORT OF THE MEETING......................................................................................................................................... 1 II. BACKGROUND PAPER: UNITED NATIONS POPULATION PROJECTIONS TO 2300 Population Division......................................................................................................................................... 10 III. QUESTIONNAIRE FOR EXPERTS................................................................................................................................ 40
TABLES
No.
1. Projection variants in terms of assumptions for fertility, mortality and international migration.................... 15 2. Total fertility in 2045-2050, period of below-replacement fertility and population in 1950, 2000 and 2050, medium variant, by country ......................................................................................................................... 16 3. Distribution of countries by year in which the period of below-replacement fertility started and proposed year when that period will end............................................................................................................... 20 4. Expectation of life at birth and average annual increase in life expectancy by country, 1950-1955, 1995-2000 and 2045-2050...................................................................................................................................... 25 5. Expectation of life at birth and average annual increase in life expectancy for countries affected by HIV/AIDS, 1950-1955, 1995-2000 and 2045-2050 ............................................................................................ 28 6. Life expectancy in 2045-2050 and projected to 2295-2300................................................................................ 31
FIGURES
1. Estimated and projected fertility, Niger, 1950-2200, low, medium and high.................................................... 22 2. Estimated and projected fertility, Venezuela, 1950-2200, low, medium and high............................................ 22 3. Estimated and projected total fertility for Latvia, 1950-2200, low, medium and high variants....................... 23 4. Annual increments of life expectancy in 1950-2000 vs. life expectancy in 1950 ............................................. 29 5. 1950-1995 NoAIDS, high e(0) and rapid decline................................................................................................. 30
ANNEXES
Agenda ...................................................................................................................................................................................... 42 List of participants ................................................................................................................................................................... 43

vi
Explanatory notes
Tables presented in this volume make use of the following symbols: Two dots (..) indicate that data are not available or are not separately reported. An em dash (—) indicates that the amount is nil or negligible. A hyphen (-) indicates that the item is not applicable. A minus sign (-) before a figure indicates a decrease. A full stop (.) is used to indicate decimals. Years given start on 1 July. Use of a hyphen (-) between years, for example, 1995-2000, signifies the full period involved,
from 1 July of the first year to 1 July of the second year.
Numbers and percentages in tables do not necessarily add to totals because of rounding.
Countries and areas are grouped geographically into six major areas: Africa; Asia; Europe; Latin America and the Caribbean; Northern America; and Oceania. These major areas are further divided into 21 geographical regions. In addition, for statistical convenience, the regions are classified as belonging to either of two categories: more developed or less developed. The less developed regions include all the regions of Africa, Asia (excluding Japan), and Latin America and the Caribbean, as well as Melanesia, Micronesia and Polynesia. The more developed regions comprise Australia/New Zealand, Europe, Northern America and Japan.
The results of the 2002 Revision of World Population Prospects were finalized and announced
on 26 February 2003. As of 12 April 2001, the group of least developed countries as defined by the United Nations General Assembly comprised 49 countries: Afghanistan, Angola, Bangladesh, Benin, Bhutan, Burkina Faso, Burundi, Cambodia, Cape Verde, Central African Republic, Chad, Comoros, Democratic Republic of the Congo, Djibouti, Equatorial Guinea, Eritrea, Ethiopia, Gambia, Guinea, Guinea-Bissau, Haiti, Kiribati, Lao People’s Democratic Republic, Lesotho, Liberia, Madagascar, Malawi, Maldives, Mali, Mauritania, Mozambique, Myanmar, Nepal, Niger, Rwanda, Samoa, Sao Tome and Principe, Senegal, Sierra Leone, Solomon Islands, Somalia, Sudan, Togo, Tuvalu, Uganda, United Republic of Tanzania, Vanuatu, Yemen and Zambia.

1
I. REPORT OF THE MEETING OF THE TECHNICAL WORKING GROUP
ON LONG-RANGE POPULATION PROJECTIONS 30 JUNE 2003
Opening 1. The United Nations Population Divis ion convened a meeting of the Technical Working Group on Long-Range Population Projections at United Nations Headquarters in New York on 30 June 2003. The purpose of the meeting was to discuss the assumptions and methodology that the Population Division was planning to use in the preparation of population projections to 2300. The Technical Working Group consisted of fifteen invited experts participating in their personal capacity. Also attending were the staff of the Population Division as well as representatives of the Development Policy Analysis Division, the Division for Social Policy and Development, the Division for Sustainable Development and the Statistics Division, all part of the Department of Economic and Social Affairs of the United Nations Secretariat. 2. Mr. Joseph Chamie, Director of the Population Division, opened the meeting by noting that the Population Division had prepared long-range population projections several times in the past. Two sets of such projections had been issued during the 1990s. On both of those occasions, the projection horizon used had ended in 2150 and projections had been calculated only for a small number of major areas. This time, the plans for the preparation of long-range projections were more ambitious. For the first time, the Population Division proposed to extend the projection horizon to 2300 and to calculate the projections at the country level (that is, for more than 190 geographically disjoint units). The role of the Technical Working Group was therefore to provide a forum for the discussion of the various issues raised by such a project. Given the calibre of the members of the Technical Working Group, Mr. Chamie expected that their advice regarding both methodological issues and assumptions about long-term demographic trends would be very useful.
3. The meeting began with a general discussion on the reasons for preparing long-range population projections to 2300, their general utility and the challenges faced in making assumptions about demographic trends over very long periods. It was noted that population projections spanning more than one or one and a half centuries were needed by those studying environmental change and that projections at the country level were necessary to respond to requests about regional groupings different from those traditionally used by the Population Division in preparing long-range projections. In addition, only by considering a long time horizon could one address the issue of the eventual stabilization of world population size. 4. Members of the Working Group questioned the need of carrying out the long-range projections at the country level. It was argued that the current political configuration of countries was unlikely to remain unchanged during the next 300 years and, therefore, that it was not useful to consider the countries of today as the basic units for population projections to 2300. Instead, it was argued that large geographic regions provided a more appropriate basis for long-range projections. It was also noted that in projections to 2050 the heterogeneity of country experience tended to diminish and that it would do so even more according to the assumptions proposed by the Population Division for projections to 2300 so that, over the long run, maintaining the focus on individual countries that were becoming increasingly homogeneous might not add much value to the country-level exercise.

2
5. Participants also questioned whether the use of projection methodology based on the demographic components was appropriate for use over very long periods. It was argued that making independent assumptions about the future paths of fertility, mortality and international migration was not tenable since those phenomena were interrelated. Thus, trends in population size would have implications for international migration. Alternative methodologies to calculate population projections had been described in the U.S. National Academy of Sciences report entitled Beyond Six Billion or by Goldstein and Stecklov1.
6. Some participants addressed the issue of uncertainties regarding the long-term future. A few argued that crises that would disrupt demographic trends significantly were bound to occur and that, because the assumptions proposed made no allowance for such occurrences, they were unrealistic. However, participants recognized that it was not possible to determine when or where those types of crises would strike. Others indicated that, given the uncertainty surrounding long-term trends, producing scenarios that differed only by 0.25 of a child in terms of total fertility would not convey well the levels of uncertainty involved. Using methodology that would yield measurable confidence intervals was suggested, although it was recognized that confidence intervals to 2300 would probably be too wide given the high levels of uncertainty involved. Nevertheless, it was argued that explicit allowance for variability was useful because the projections were aiming to illustrate not only the situation in 2300 but also for periods closer to the present. However, it was noted that use of probabilistic methods would severely strain data processing capabilities given the number of units considered (over 190) and the long projection periods involved. In addition, it was not clear that adequate measures of variability, even over the recent past, would be available for most countries.
FERTILITY 7. Mr. François Pelletier presented the Population Division’s proposed fertility assumptions. In the medium or central variant, it was suggested that countries whose total fertility had already been at below-replacement level for 95 years or more by 2045-2050 would return to replacement level by 2070-2075 and remain at that level until 2300. The fertility of other countries would be projected so that it would remain below replacement level for 95 years before returning to replacement level, a level that would then be maintained until 2300. For countries that were still projected to have a total fertility above 2.1 children per woman in 2045-2050, a period of fertility reduction until below-replacement level was reached would come first. In the high and low scenarios, total fertility would differ from that in the central scenario by 0.25 and –0.25 children, respectively.
8. Participants commented first on the cases of countries where mortality trends could conceivably be closely correlated to fertility trends under a Malthusian type of response to high population growth. For Niger or Yemen, for instance, countries whose populations were already projected to be very large by 2050 in the 2002 Revision, either the mortality check might dampen population growth or fertility decline brought about by hardship might be the motor for slower growth. If regional projections were carried out instead of those at the country level, those types of issues would not need to be addressed, as was noted by those who favoured regional projections. The cases of outliers such as Niger or Yemen helped illustrate the problems that would be inherited from the 2002 Revision and that were likely to be magnified in the long-range
1 J.R. Goldstein and G. Stecklov, On long-range population projections made simple, Population and
Development Review , vol. 28, No. 1, March 2002, pp. 121-141.

3
scenarios. The latter could thus be useful in making more patent the problematic cases in the projections to 2050.
9. Several participants commented on the proposal to maintain fertility at below replacement level for approximately the same length of time in all countries. Some participants thought that the crossovers in fertility levels that would result were not appealing since they would mean that today’s high-fertility countries would in the future have lower fertility than that of today’s low-fertility countries. It was noted that the return to replacement level over the long run seemed to be inconsistent with the conclusion of the meeting on completing the fertility transition that most populations would experience below-replacement fertility. However, some participants argued that, as concern about the consequences of sustained low fertility grew, such concern was likely to trigger measures to raise fertility levels. Those changes would probably happen in many countries at once, implying that the simultaneity of changes in fertility trends among groups of countries would be appropriate. It was noted that, although the medium variant of the projections to 2050 assumed that all countries whose fertility was at below-replacement level in 1995-2000 would remain at below-replacement level until 2050, that might not turn out to be so, and the 95 years that those countries would remain under replacement level depended on the assumptions made to 2050.
10. Other paths of fertility change were suggested. Instead of keeping fertility steady at replacement level, it was suggested that fertility swings consistent with Easterlin cycles be modelled and used in the projections. A different approach would not focus on fertility per se but rather on the dependency ratio (those aged 0-14 and 60 or over divided by the population aged 15-59), trying to keep it constant. Studies of European populations spanning nearly four centuries had shown that, whereas fertility had varied considerably, the dependency ratio had remained relatively stable. The projections could aim at ensuring such stability. 11. A discussion of economic changes that would affect fertility trends brought up the case of Japan, described as a traditional society where the traditional form of the family was no longer attractive to women who were increasingly participating in the labour force. However, Japanese women still tended to get low-paying jobs and would likely be the first to be laid off if economic circumstances deteriorated. Single working women in Japan were still benefiting from the relative affluence of their parents, the current generation of elderly. But as the process of population ageing continued, if women’s status in the labour force did not improve markedly, young women in the future might find it more attractive to have children and raise a family than to work. Some participants noted that such a scenario assumed that individualistic values would not prevail among women and that the earning prospects for young men would be good, since they would have to provide for their wives and children. However, in ageing populations, employment prospects and salary levels for young workers, whether male or female, had tended to be worse than those for middle -aged workers and were not necessarily improving.
12. There was some discussion about age-specific fertility. It was noted that over the next 300 years it was likely that the childbearing span would be extended beyond age 50. If so, the age-specific fertility schedules used to project populations should be modified. It was judged, however, that such a change was still speculative and that there were other more important issues to deal with in making the long-range projections. By 2045-2050 in the 2002 Revision, most countries already had age-specific fertility schedules derived from the current experience of countries with very low fertility. Therefore, their further modification for projection purposes was probably not necessary.

4
13. Regarding the variation in fertility between the low and high variants, it was considered that scenarios with a difference of 0.5 and –0.5 children per woman should also be prepared. However, it was noted that a scenario that would keep fertility at about 1.6 children per woman would result, over the very long run, in a very peculiar age distribution. 14. It was pointed out that, if the aim was to attain a global population with unchanging size, it was necessary to ensure that the net reproduction rate would be slightly less than 1, taking into account both the sex ratio at birth and changing mortality levels. Otherwise, with a fixed total fertility at 2.1 children per woman and declining mortality, the population would continue to increase indefinitely. 15. Given the importance of the sex ratio at birth in determining the net reproduction rate and the increasing evidence of male preference in certain populations, it was suggested that projections with different trends in the sex ratio at birth be carried out for selected populations. However, it was argued that, as fertility declines and women become more like men in more spheres of life, including the economic, there is evidence that even cultures that have traditionally valued males over females are changing. Hence, it seems acceptable to expect that, over the long run, sex ratios that are closer to the biological levels will prevail even in those populations. 16. There were a number of comments on issues related to heterogeneity, both within and between populations. It was noted that fertility cycles at the country level could nevertheless yield an essentially unchanging world population. Similarly, some countries might maintain fertility above replacement level and others at below-replacement level in such a way that world fertility would ensure the replacement of the global population. Nevertheless, some types of heterogeneity could have very different outcomes in terms of genetics, for instance. Thus, if all couples had exactly 2 children, genetic variability would be maintained, whereas that would not be the case if half of all couples had 4 children and half had none. One could imagine a future where children might be so highly valued that some women might make a “career” of bearing and raising them, perhaps being economically rewarded for such services.
17. There could also be heterogeneity in the responsiveness of societies to development. Thus, some countries might not necessarily follow a path leading to below-replacement fertility. There might also remain considerable heterogeneity within countries. The fertility of cities, for instance, would probably be different from that of rural areas and that difference had to be taken into account in a context of increasing urbanization. In this regard, the assumption made in the projections that all countries would follow one scenario (e.g., low, medium or high) was weak since it was unlikely that all countries would follow similar fertility paths.
18. The possibility of using population density as a feedback mechanism that would indicate when rapid fertility reductions were necessary was discussed. Participants pointed out the difficulty of establishing appropriate thresholds with respect to density. The average population density of different regions had been and was expected to remain markedly different. In the more developed countries as a whole, average population density was 23 persons per square kilometre in 2000 and would remain virtually unchanged until 2050. In the less developed regions, population density was projected to rise to 93 persons per square kilometre by 2050 although only 10 per cent of the land in those regions was arable. Concentration of population in relatively small areas also complicated comparisons, given the expectation that the growth of cities and urbanization would continue. In view of the above, several participants concluded that population density per se should not be used as a guide to determine future fertility trends.

5
19. At the conclusion of the session participants provided their views on the effects that fertility trends would have on future population growth. That is, instead of focusing on fertility trends, they expressed views about the future size of the world population. There was a general consensus that world population would peak at some point during the next 300 years and then begin to decline. Some participants added nuances to this view, indicating that decline would be very slow; that the possibility of rapid and catastrophic decline could not be ruled out; and that swings of fertility would happen, probably being different in the zones of high and low fertility. 20. With regard to the wording used to describe the results of the projection exercise, it was suggested that the terms “forecast” and “projection” be avoided as much as possible and they be substituted by terms such as “simulation” or “hypothetical scenario”. Similarly, it was suggested that the assumption that fertility would remain at replacement level in the long run be justified in terms of the fact that the population growth rate could not be above zero over long periods if sustainability was to be maintained. MORTALITY 21. Mr. Thomas Buettner presented the Population Division’s proposed methodology for the projection of mortality. The proposal was to use to Lee-Carter method to extrapolate the estimated rate of change for 2000-2050 at the country level. Tests of the proposed methodology had only started but seemed to be producing adequate results. There was some concern about the possibility of obtaining implausible crossovers of the expectation of life at birth among countries.
22. The discussion centred on the known limitations of the Lee-Carter method, although it was generally recognized that the method was flexible and adequate for the task at hand. It was noted that in the examples shown for China and the United States the method seemed to be producing divergence of e(0) instead of convergence over the long run. It was reported that, with the collaboration of Ron Lee himself and members of his team, the Population Division would ensure that the projected levels of life expectancy would not diverge. Ron Lee had been working on a modification of the method that would project trends in life expectancy for a group of countries and would use country-specific factors to modify the group projections to represent the experience of each country. When applied over long periods, such a modified method would result, if not in convergence, at least in non-divergence. 23. Several participants commented on the proposal to cap future life expectancy at 100 years. They thought such a procedure should be avoided and that life expectancies above 100 for certain countries could be projected provided allowance was made for the necessarily modified shape of the mortality schedule. In this regard, use of the model schedules proposed by Preston-Himes for old ages was preferable to the Coale-Guo approach. It was noted that the Preston-Himes models had been used to extend the model life tables to very old ages and that they produced unacceptable crossovers at very advanced ages. To solve that problem, the Coale -Kisker method for the closure of the life table had been used. 24. There was some debate about the pattern of change of e(0) over time. It was noted that when e(0) was plotted over long periods it clearly did not change linearly with time. However, e(50) did seem to follow a linear decline. Analysis of long time series of mortality estimates for low-mortality countries had shown that, using the Lee-Carter decomposition, the parameter k(t) declined linearly and e(0) increased logistically. However, when e(0) became high enough that mortality at young ages was very low, a linear decline in k(t) resulted in an almost linear change

6
in e(0). It was suggested that a linear change in e(0) would also be more evident if changes in the model pattern, b(x) of the Lee-Carter method, were made.
25. Mention was made of tempo distortions in estimates of life expectancy. Essentially, over periods in which the mean age at death was rising, the period life expectancy would tend to be too high compared to that of cohorts. A tempo bias could lead to either over or underestimation of the rate of change of e(0) with respect to time.
26. Also noted were studies of long-term mortality trends in relation to GDP. One conclusion of those studies was that life expectancy among countries tended to converge as GDP rose rather than as a function of time. The underlying data for those studies included time series going back to the 1870s and covered the experience of developing countries, although there were no data for most of Africa. 27. The issue of whether, barring major crises, it was appropriate to project a universal reduction of mortality was raised. Concerns about the possible long-term effects of changes in life style that might increase the incidence of chronic and degenerative diseases in societies that had successfully controlled infectious disease were voiced. Societies where obesity was on the rise, smoking was increasing or the consumption of alcohol was high might not be able to reach the very low levels of mortality observed in the lowest mortality countries of today. 28. It was also noted that, historically, recovery from catastrophic mortality had been much slower than recovery from economic crises so that, perhaps, modelling catastrophic mortality should be incorporated in some way into the long-range projections. INTERNATIONAL MIGRATION 29. Ms. Cheryl Sawyer presented the Population Division’s proposals for the projection of international migration. She noted that this was the variable that had shown the greatest volatility in the past and was therefore most difficult to project with some accuracy. Because the overall net international migration for the world had to sum to zero, the strategy proposed for projecting it involved deciding which countries would be net receivers of international migrants and which net senders over the projection period. By keeping the status of each country constant, it would be easier to set assumptions on future international migration levels that added to zero at the world level. It was also important that international migration assumptions take account of changes in the population size of the countries involved, otherwise the populations of some countries might disappear because of the cumulative effect of international migration. 30. Mr. Joel Cohen proposed a method for the automatic projection of international migration in such a way that the resulting net migration at the country level ensured a zero net migration at the world level. The method assumed that the matrix formed by the numbers of migrants flowing from country i to country j over a given year was available. In addition, it was assumed that the population of each country was available at the beginning of each year. Essentially, the method consisted in assuming that the number of international migrants from country i to country j was proportional to the product of the populations of both countries at the start of each period. A proposal for estimating the coefficients of proportionality (c(i,j,0)) at time 0 was made and one strategy for projection was to maintain those coefficients constant over time. Mr. Cohen noted that other variants of the same approach were also possible. For instance, the proportionality coefficients could be made to depend on distance between the countries concerned.

7
31. The discussion on international migration covered a few main issues. First, the question of whether to use a non-zero assumption for international migration was addressed. Several participants were of the view that, because any non-zero path adopted to project international migration over 300 years would have little credibility, it would be preferable to avoid making a non-zero assumption altogether. Projecting international migration as zero for all countries from 2050 to 2300 was the strategy they recommended. They considered that assumption to be “conservative”.
32. Other participants countered that assuming zero international migration for all countries over the projection period would be neither realistic nor conservative. In fact, such an assumption was described as the most radical. However, it was considered that the bases for developing a sounder strategy were weak. It was pointed out in particular that time series data on international migration did not exist for many countries and that changes in policy or in economic circumstances, not to mention crises, war or conflict, could modify international migration trends at the country level very rapidly. There seemed to be no sound bases for modelling such volatility and even less for projecting it over the long run. 33. Assuming constancy of circumstances was not considered realistic. In terms of whether countries would remain as “senders” or “receivers” for centuries, multiple examples were cited of countries that had experienced one or several turnarounds in the direction of international migration flows over the course of the 19th and 20th centuries. Using an approach such as that suggested by Mr. Cohen also implied assuming that a certain relationship between population size and international migration remained unchanged. It was an empirical question whether that assumption had any validity. However, given the limitations of available data on past trends of international migration, testing that hypothesis might not be straightforward. It was noted in this respect that the basic matrix assumed to exist in Mr. Cohen’s model could not be created from existing information. However, such a matrix could be estimated from assumed levels of net migration. 34. The attractiveness of Mr. Cohen’s model and variants of it was that international migration levels and trends were made to depend exclusively on demographic factors (population size in the case of the most simple model discussed by Mr. Cohen). However, some participants noted that in actuality international migration levels depended more often than not on other factors, including economic conditions, a wide range of policies, the occurrence of crises and even a number of geo-political considerations, many of which were hard to forecast even over the short run.
35. Nevertheless, several participants advanced arguments linking demographic trends with international migration. One noted that some countries experiencing very low fertility had been resorting to international migration to maintain population growth. If fertility rose, international migration intakes might decline. Another mentioned that countries that were important sources of international migrants currently might experience a reduction or even cessation of those flows as their populations aged and population growth came to an end. The point was also made that increasing urbanization within developing countries might affect the supply of economic migrants, with people preferring to move to the large cities within their own countries instead of going abroad. Some of these considerations could be reflected in a modified model similar to that proposed by Mr. Cohen that took into account the populations with the greatest propensity to migrate (the young, for instance) instead of the total populations of the countries concerned. It was also suggested that the median ages of the populations concerned could be taken into account.

8
36. Regarding other possible methods for allocating international migrants, mention was made of the procedure used by the U. S. Bureau of the Census in making projections of the United States population by state. Projections are made in terms of out-migration rates for the states and the resulting numbers of internal migrants were distributed among the “receiving” states following the same pattern over time. The Population Division might consider adopting a similar approach. 37. Participants also discussed the possibility of making general assumptions about international migration trends at the regional level. Those who favoured making the long-term projections only at the regional level considered that this approach was satisfactory. Others warned that even with respect to regions some assumptions might not hold over the long run. It could be hoped that in 300 years the level of development of the least developed regions of today might have increased substantially. Similarly, there were examples of countries whose level of economic development had declined during the 20th century (e.g. Argentina). It was suggested, however, that countries belonging to regions whose members all had similar levels of development were unlikely to suffer such setbacks. For that reason, some participants thought that assuming that today’s developed countries, as a group, would continue to be net receivers of international migrants over the next 300 years was an acceptable assumption. CLOSING 38. In the concluding session, the Population Division underscored that the preparation of population projections to 2300 at the country level was a new and special activity that was not meant to be repeated routinely at short intervals. The plan was to produce the projections to 2300 by the end of 2003.
39. Some participants suggested that instead of producing again long-range projections in future years, it would be very useful to produce population estimates extending back to 1900.
40. In their concluding comments, participants addressed a number of new issues or reiterated points made during the rest of the meeting. It was again suggested that the results of the projection exercise be called scenarios or simula tions rather than projections. To make clear the illustrative nature of the scenarios produced, it was suggested that several be considered. The issue of whether the “central” scenario should be the one where fertility returned to replacement level was raised and the Population Division was urged to consider alternatives.
41. Participants who favoured the preparation of long-range projections only at the level of regions suggested that country-level projections be presented to 2150 but only regional results be presented thereafter. Another approach suggested would be to make country-level projections and regional projections independently and then compare results at least in one scenario to try and assess whether there was any advantage in making country-level projections. 42. Mention was again made of the use of simpler methodology to project over the long run (avoiding the cohort-component method). It was suggested that the cohort-component method be used for the first 100 years and a simpler method for the rest of the projection period. 43. The suggestion of modelling fertility cycles for the future was reiterated, together with the consideration of stochastic methods to reflect the possibility of crises. It was noted in this respect that the possibility of catastrophic mortality had not been considered sufficiently during

9
the meeting and that, whereas populations had recovered rapidly from some epidemics in the past, recovery would take longer if economic conditions were poor.
44. Lastly, it was suggested that the possibility of combining scenarios for different regions be considered since the normal presentation of results implied that all countries would follow the same variant or path in the future. 45. Although some members of the working group were sceptical about the value of population projections over very long periods, all agreed that the challenges posed by the exercise were interesting and that it would be illuminating to see the results obtained.

10
II. BACKGROUND PAPER: UNITED NATIONS POPULATION
PROJECTIONS TO 2300 Population Division
Introduction 46. The Population Division has the task of producing the official population estimates and projections of the United Nations. The first set of population projections was issued in 1951 covering the period 1920-1980. Updated and expanded sets of projections were issued at varying intervals until 1973. Starting in 1978 the Population Division has been producing every two years updated population estimates and projections at the national level. The projection period used in the different Revisions has varied but it has been extended to 2050 since the 1994 Revision. 47. The Population Division has also produced several sets of long-range population projections over a longer time frame. Until now, those long-range projections have been prepared only for a small number of mutually exclusive regional groups constituting the world. Long-range projections have been prepared on a less regular basis than the mid-range projections but during the 1990s they were produced at intervals of five years. The most recent set of long-range projections was issued in 2000 and was consistent with the results of the 1998 Revision.2 48. Starting with the 1998 Revision, the Population Division has undertaken the systematic examination of the premises underlying the assumptions on future fertility trends. A series of three expert groups meetings3 were convened to discuss recent fertility trends and future prospects for the following groups of countries: (1) countries whose fertility had already reached below-replacement level, many of which had been experiencing such low fertility levels for a decade or more; (2) countries where fertility remained high and where fertility decline was either incipient or non-existent, and (3) countries that were already far advanced in the transition from high to low fertility but whose fertility levels remained well above replacement level. Largely on the basis of the findings of those meetings, the assumptions about future fertility trends in the different groups of countries have been modified on a step-by-step basis. In the 1998 Revision, for instance, the fertility of countries that had already attained below-replacement levels was kept below replacement during the whole projection period. In the 2000 Revision, the fertility of countries that still had high fertility levels was not necessarily projected to reach 2.1 children per woman during the projection period, that is, it could remain well above that level during the whole projection period. Lastly, in the 2002 Revision, the fertility declines projected for countries with fertility above replacement level were no longer constrained to stop at 2.1 children per woman. Instead, 1.85 children per woman was used as the new lower limit beyond which fertility was not allowed to decline during the projection period for countries whose total fertility in 1995-2000 was still above 2.1 children per woman. In addition, as in the 2000 Revision, countries whose fertility in 1995-2000 was still relatively high were not necessarily constrained to reach the lower limit of 1.85 children per woman by 2050.
2 Long-range World Population Projections: Based on the 1998 Revision (United Nations publication, Sales
No. E.00.XIII.8). 3 Below Replacement Fertility, Population Bulletin of the United Nations, Special Issue Nos. 40/41, 1999
(United Nations, 2000); United Nations Workshop on Prospects for Fertility Decline in High-Fertility Countries, New York, 9-11 July 2001 (United Nations, ESA/P/WP.167); Completing the Fertility Transition, New York, 11-14 March 2002 (United Nations, ESA/P/WP.172/Rev.1).
11
49. These changes have been necessary for several reasons, but two deserve mention. First, there is growing heterogeneity among countries regarding past trends in fertility and current fertility levels. In comparison with the 1950s or 1960s, when virtually all developing countries had high fertility and were only beginning to experience declining fertility levels and virtually all developed countries were far advanced in the transition to low fertility, by the 1990s there were countries in all stages of the transition to low fertility as well as numerous countries (59 according to the 2002 Revision) where fertility had dropped below replacement level and had remained very low over protracted periods 4. This empirical observation brings us to the second point, namely, that constraining the future decline of fertility for countries already far advanced in the fertility transition to remain ultimately at 2.1 children per woman (that is, close to replacement level) does not seem tenable given the experience of both developed countries and a growing number of developing countries which have not maintained replacement level fertility at the end of the transition to low fertility. 50. As a result of the process undertaken to modify the assumptions about future fertility levels in the preparation of the normal Revisions of population estimates and projections to 2050, the long-range projections consistent with the 1998 Revision lack consistency with the 2002 Revision. Therefore, users of long-range projections do not have results that reflect the important changes made to the medium-term projections and that have major implications for the long-term future of population. 51. In particular, the expectation that the last stages of the fertility transition will be characterized by long periods of below-replacement fertility levels suggest that the period of population growth may come to an end and that, over the long-term future, the world population may actually decline. Exploration of such a possibility or of the possible stabilization of world population size demand that long-term projections be made for horizons longer than 150 years. 52. For these reasons, the Population Division has decided to prepare a set of long-range projections consistent with the 2002 Revision and with a time horizon ending in 2300. Furthermore, the plan is to produce, for the first time in the Population Division’s history, long-term projections at the country level. The main reason to produce projections at the national level is the demographic heterogeneity that will still characterize countries by 2050 and that is likely to persist over another 50 or 100 years. Indeed, limiting long-range projections to a small number of country aggregates implicitly assumes that the populations of those aggregates are fairly homogeneous in terms of fertility and mortality levels as well as the momentum for population growth related to their age distributions, an assumption that is not tenable. Projections at the national level are also useful because they permit users to consider regional groupings different from those normally considered by the Population Division. In addition, calculation of regional projections as the sum of country-level projections whose errors are not correlated would, other things being equal, lead to smaller errors at the regional level. Nevertheless, it is clear that over a horizon of 300 years, the uncertainty about the future paths of fertility, mortality and international migration cannot but be very large. So, the projection variants proposed in this document can best be thought of as illustrative scenarios and not as possible forecasts of the long-term evolution of national populations. 53. Because the projections proposed will take off where those presented in the 2002 Revision end, it is important to review the assumptions underlying the 2002 Revision. The next section presents those assumptions. The following sections present our preliminary thinking about
4 World Population Prospects: The 2002 Revision, Highlights, February 2003 (United Nations, ESA/P/WP.180),
p. 7.

12
how to extend the projections of fertility, mortality and international migration. The concluding section outlines the main points for discussion at the meeting.
A. ASSUMPTIONS UNDERLYING THE PROJECTIONS TO 2050 OF THE 2002 REVISION 54. The full set of projections to 2050 from the 2002 Revision includes eight projection variants. These variants have been named: low, medium, high, constant-fertility, instant-replacement-fertility, No-AIDS, constant-mortality and zero-migration. Among these eight variants, the first four plus the instant-replacement-fertility variants differ among themselves with regard to the assumptions made about the future path of fertility. The sixth and seventh variants differ from the medium in terms of the assumptions made about the course of mortality, and the eighth differs from the medium in terms of the future course of international migration. 55. To describe the different projection variants, the various assumptions made regarding fertility, mortality and international migration are presented first.
1. Fertility assumptions 56. Fertility assumptions are described in terms of the following groups of countries:
57. High-fertility countries: Countries that until 2000 had had no fertility reduction or only an incipient decline; 58. Medium-fertility countries: Countries where fertility has been declining but whose level was still above 2.1 children per woman in 1995-2000; 59. Low-fertility countries: Countries with total fertility at or below 2.1 children per woman in 1995-2000. Medium-fertility assumptions: 60. Total fertility in high-fertility and medium-fertility countries is assumed to decline following a path derived from models of fertility decline established by the United Nations Population Division on the basis of the past experience of all countries with declining fertility during 1950-2000. The models relate the level of total fertility during a period to the average expected decline in total fertility during the next period. Under the medium variant, whenever the total fertility projected by a model falls below 1.85 children per woman, the value actually used in projecting the population is set to 1.85. That is, 1.85 children per woman represents a floor value below which the total fertility of high and medium-fertility countries is not allowed to drop before 2050. However, it is not necessary for all countries to reach the floor value by 2050. If the model of fertility change used produces a total fertility above 1.85 children per woman for 2045-2050, that value is used in projecting the population. 61. Total fertility in low-fertility countries is generally assumed to remain below 2.1 children per woman during most of the projection period and reach 1.85 children per woman by 2045-2050. For low-fertility countries whose total fertility in 1995-2000 is estimated to be below 1.85 children per woman, projected total fertility often declines further before increasing slowly to reach 1.85 children per woman in 2045-2050.

13
High-fertility assumptions: 62. Under the high variant, total fertility is projected to remain 0.5 children above the total fertility in the medium variant over most of the projection period. By 2045-2050, total fertility in the high variant is therefore half a child higher than that of the medium variant. That is, countries reaching a total fertility of 1.85 children per woman in the medium variant have a total fertility of 2.35 children per woman in the high variant at the end of the projection period. Low-fertility assumptions: 63. Under the low variant, total fertility is projected to remain 0.5 children below the total fertility in the medium variant over most of the projection period. By 2045-2050, total fertility in the low variant is therefore half a child lower than that of the medium variant. That is, countries reaching a total fertility of 1.85 children per woman in the medium variant have a total fertility of 1.35 children per woman in the low variant at the end of the projection period. Constant-fertility assumption: 64. For each country, total fertility remains constant at the level estimated for 1995-2000. Instant-replacement assumption: 65. For each country, fertility levels over the 2000-2050 period are set so that, during each quinquennium, the net reproduction rate is equal to one.
2. Mortality assumptions Normal-mortality assumption: 66. Mortality is projected on the basis of the models of change of life expectancy produced by the United Nations Population Division. A medium pace of mortality decline is generally used to project future mortality levels. However, for countries highly affected by the HIV/AIDS epidemic, the slow pace of mortality decline has generally been used to project the reduction of general mortality risks not related to HIV/AIDS. 67. In addition, for the countries highly affected by the HIV/AIDS epidemic, estimates of the impact of HIV/AIDS are made explicitly through assumptions about the future course of the epidemic—that is, by projecting the yearly incidence of HIV infection. The model developed by the UNAIDS Reference Group on Estimates, Modelling and Projections5 has been used to fit past HIV prevalence estimates obtained from UNAIDS so as to derive the parameters determining the past dynamics of the epidemic. For most countries, the model is fitted assuming that the relevant parameters have remained constant in the past. For projection purposes, the parameters are kept constant until 2010. Thereafter, the parameter PHI, which reflects the rate of recruitment of new individuals into the high-risk or susceptible group, is projected to decline by a third over intervals of increasing length. In addition, the parameter R, which represents the force of infection, is projected to decline by 15 per cent over the same intervals. A reduction in R is based on the
5 Improved methods and assumptions for estimation of the HIV/AIDS epidemic and its impact:
Recommendations of the UNAIDS Reference Group on Estimates, Modelling and Projections. AIDS , vol. 16, pp. W1-W14 (UNAIDS Reference Group on Estimates, Modelling and Projections, 2002).

14
assumption that changes in behaviour among those subject to the risk of infection will reduce the chances of transmitting the virus.
No-AIDS assumption: 68. For each country for which the impact of HIV/AIDS has been taken into account, mortality is projected by assuming that there is no AIDS. As mentioned above, in countries highly affected by the HIV/AIDS epidemic, the slow pace of mortality decline has generally been used to estimate and project the reduction of general mortality risks not related to HIV/AIDS, starting at the estimated time of onset of the HIV/AIDS epidemic. Consequently, the results of the No-AIDS variant differ from those of other variants, not only during the projection period (2000-2050) but also during the estimation period (mainly during 1980-2000). Constant-mortality assumption: 69. For each country, mortality remains constant at the level estimated in 1995-2000.
3. International migration assumptions Normal-migration assumption: 70. The future path of international migration is set on the basis of past international migration estimates and an assessment of the policy stance of countries with regard to future international migration flows. Zero-migration assumption: 71. For each country, international migration is set to zero for the period 2000-2050.
4. Synopsis
72. Table 1 presents in a schematic way the different assumptions underlying the eight projection variants. As shown, the five fertility variants (low, medium, high, constant-fertility and instant-replacement-fertility) share the same assumptions regarding mortality and international migration. They differ among themselves only with respect to the assumptions regarding fertility. A comparison of their results allows therefore an assessment of the effects that different fertility paths have on other demographic parameters. 73. In addition to the five fertility variants, a No-AIDS variant, a constant-mortality variant and a zero-migration variant have also been prepared. They all have the same fertility assumption as the medium variant. Furthermore, the No-AIDS and constant-mortality variants have the same international migration assumption as the medium variant. Consequently, the results of these two mortality variants can be compared with those of the medium variant to assess the impact of HIV/AIDS and the effect of changing mortality, respectively, on other demographic parameters. The No-AIDS projections are hypothetical and serve only as a basis for comparison. Similarly, the zero-migration variant differs from the medium variant only with respect to the underlying assumption regarding migration. Therefore, the zero-migration variant allows an assessment of the effect that non-zero migration has on other demographic parameters.
15
TABLE 1. PROJECTION VARIANTS IN TERMS OF ASSUMPTI ONS FOR FERTILITY , MORTALITY
AND INTERNATIONAL MIGRATION
Assumptions
Projection variant Fertility Mortality International
migration Low......................................... Low Normal Normal Medium.................................. Medium Normal Normal High........................................ High Normal Normal Constant-fertility ................... Constant Normal Normal Instant-replacement-fertility... Instant-replacement Normal Normal No-AIDS................................ Medium No-AIDS Normal Constant-mortality.................. Medium Constant Normal Zero -migration........................ Medium Normal Zero
Source: Population Division of the Department of Economic and Social Affairs of the United Nations Secretariat (2003). World Population Prospects: The 2002 Revision. Highlights. New York: United Nations.
B. THE LONG-RANGE PROJECTION OF FERTILITY 74. The point of departure for a discussion of long-range assumptions about fertility trends is the medium variant of the 2002 Revision. As table 2 indicates, by 2045-2050 the majority of the 192 countries whose population is projected using the components method had a total fertility level of 1.85 children per women. However, there were still 69 countries with a total fertility above that level and the range of variation of total fertility in 2045-2050 was from 1.85 to 3.85 children per women. That is, by 2050 a few countries were projected to still be far from completing the transition to low fertility. Consequently, in extending the medium variant of the 2002 Revision, the first step is clearly to allow those countries that had not yet reached the floor level of 1.85 children per woman to reach it. In the case of Niger, the country with the highest fertility in 2045-2050, the models of fertility change over time used to project fertility in the 2002 Revision can yield a level of 1.85 children per woman as early as 2080-2085 so that, by 2085, all countries could find themselves with that level of fertility were it to remain constant once it is reached. 75. Therefore, one possible way of extending the medium variant to 2300 would be to maintain the level of 1.85 children per woman constant once it is reached. Such an assumption would yield a declining world population over the long run because 1.85 children per woman is a level that does not ensure the replacement of the population. 76. In previous long-range projections, the medium scenario for future fertility levels was normally designed so that it would produce a stationary population if its fertility level remained constant over a sufficiently long time. In the case of the proposed new set of long-range projections, a medium scenario that can potentially produce a stationary population also seems appropriate so that it can serve as the “central” path with respect to which other scenarios can be compared. However, because this scenario must take off where the medium variant of the 2002 Revision ends, it will “inherit” the below-replacement paths that many countries have been following for lengthy periods. Table 2 shows countries ordered in terms of the year when the period of below-replacement fertility started for each of them (for convenience, replacement level is assumed to be equal to 2.1 children per woman in all cases). Latvia, for instance, would have experienced 100 years of below-replacement fertility by 2050, whereas Jordan would have experienced just 20. That is, if all countries with a total fertility of 1.85 children per woman in

16
TABLE 2. T OTAL FERTILITY IN 2045-2050, PERIOD OF BELOW-REPLACEMENT FERTILITY AND POPULATION IN 1950, 2000 AND 2050, MEDIUM VARIANT, BY COUNTRY
Population (thousands) Count Country or area
Total fertility in 2045-2050
Beginning of period with TF < 2.1
End of period of TF < 2.1 1950 2000 2050
1 Latvia.............................................. 1.85 1950 2070 1 949 2 373 1 3311 Japan............................................... 1.85 1955 2070 83 625 127 034 109 7221 Croatia ............................................ 1.85 1965 2070 3 850 4 446 3 5872 Finland............................................ 1.85 1965 2070 4 009 5 177 4 9413 Russian Federation ......................... 1.85 1965 2070 102 702 145 612 101 4564 Ukraine........................................... 1.85 1965 2070 37 298 49 688 31 7491 Austria ............................................ 1.85 1970 2070 6 935 8 102 7 3762 Belgium.......................................... 1.85 1970 2070 8 639 10 251 10 2213 Canada............................................ 1.85 1970 2070 13 737 30 769 39 0854 Channel Islands .............................. 1.85 1970 2070 102 144 1265 Denmark......................................... 1.85 1970 2070 4 271 5 322 5 2736 Germany......................................... 1.85 1970 2070 68 376 82 282 79 1457 Luxembourg ................................... 1.85 1970 2070 296 435 7168 Malta............................................... 1.85 1970 2070 312 389 4029 Netherlands..................................... 1.85 1970 2070 10 114 15 898 16 954
10 Sweden ........................................... 1.85 1970 2070 7 014 8 856 8 70011 Switzerland..................................... 1.85 1970 2070 4 694 7 173 5 81012 United Kingdom............................. 1.85 1970 2070 49 816 58 689 66 1661 Australia ......................................... 1.85 1975 2070 8 219 19 153 25 5602 Belarus............................................ 1.85 1975 2070 7 745 10 034 7 5393 Estonia............................................ 1.85 1975 2070 1 101 1 367 6574 France............................................. 1.85 1975 2070 41 829 59 296 64 2305 Italy................................................. 1.85 1975 2070 47 104 57 536 44 8756 Norway........................................... 1.85 1975 2070 3 265 4 473 4 8957 Singapore........................................ 1.85 1975 2070 1 022 4 016 4 5381 Barbados......................................... 1.85 1980 2070 211 267 2582 Bosnia and Herzegovina................. 1.85 1980 2070 2 661 3 977 3 5643 Bulgaria .......................................... 1.85 1980 2070 7 251 8 099 5 2554 China, Hong Kong SAR................. 1.85 1980 2070 1 974 6 807 9 4315 Cuba................................................ 1.85 1980 2070 5 850 11 202 10 0746 Czech Republic............................... 1.85 1980 2070 8 925 10 269 8 5537 Greece............................................. 1.85 1980 2070 7 566 10 903 9 8148 Hungary .......................................... 1.85 1980 2070 9 338 10 012 7 5899 Lithuania......................................... 1.85 1980 2070 2 567 3 501 2 526
10 New Zealand................................... 1.85 1980 2070 1 908 3 784 4 51211 Portugal .......................................... 1.85 1980 2070 8 405 10 016 9 02712 Slovenia.......................................... 1.85 1980 2070 1 473 1 990 1 56913 Spain ............................................... 1.85 1980 2070 28 009 40 752 37 3361 China, Macao SAR......................... 1.85 1985 2075 190 450 5782 Republic of Korea.......................... 1.85 1985 2075 18 859 46 835 46 4181 China .............................................. 1.85 1990 2080 554 760 1 275 215 1 395 1822 Georgia........................................... 1.85 1990 2080 3 527 5 262 3 4723 Ireland............................................. 1.85 1990 2080 2 969 3 819 4 9964 Martinique ...................................... 1.85 1990 2080 222 386 4135 Poland............................................. 1.85 1990 2080 24 824 38 671 33 0046 Romania.......................................... 1.85 1990 2080 16 311 22 480 18 0637 Serbia and Montenegro .................. 1.85 1990 2080 7 131 10 555 9 3718 Slovakia.......................................... 1.85 1990 2080 3 463 5 391 4 948

TABLE 2 (continued)
17
Population (thousands) Count Country or area
Total fertility in 2045-2050
Beginning of period with TF < 2.1
End of period of TF < 2.1 1950 2000 2050
9 TFYR Macedonia........................... 1.85 1990 2080 1 230 2 024 2 1561 Armenia.......................................... 1.85 1995 2085 1 354 3 112 2 3342 Cyprus ............................................ 1.85 1995 2085 494 783 892
3 Democratic People's Rep. of Korea .............................................. 1.85 1995 2085 10 815 22 268 24 966
4 Iceland ............................................ 1.85 1995 2085 143 282 3305 Mauritius ........................................ 1.85 1995 2085 493 1 186 1 4616 Puerto Rico..................................... 1.85 1995 2085 2 218 3 816 3 7237 Republic of Moldova...................... 1.85 1995 2085 2 341 4 283 3 5808 Thailand.......................................... 1.85 1995 2085 19 626 60 925 77 0799 Trinidad and Tobago ...................... 1.85 1995 2085 636 1 289 1 2211 Kazakhstan ..................................... 1.85 2000 2095 6 703 15 640 13 9412 Netherlands Antilles ....................... 1.85 2000 2095 112 215 2493 Sri Lanka ........................................ 1.85 2000 2095 7 483 18 595 21 1724 Tunisia............................................ 1.85 2000 2095 3 530 9 519 12 8871 Azerbaijan ...................................... 1.85 2005 2100 2 896 8 157 10 9422 Brazil .............................................. 1.85 2005 2100 53 975 171 796 233 1403 Guadeloupe..................................... 1.85 2005 2100 210 428 4674 Lebanon.......................................... 1.85 2005 2100 1 443 3 478 4 9465 St. Vincent and the Grenadines ...... 1.85 2005 2100 67 118 1296 United States Virgin Islands........... 1.85 2005 2100 27 109 1331 Albania ........................................... 1.85 2010 2105 1 215 3 113 3 6702 Bahamas ......................................... 1.85 2010 2105 79 303 3953 Brunei Darussalam......................... 1.85 2010 2105 48 334 6854 Costa Rica....................................... 1.85 2010 2105 966 3 929 6 5125 Indonesia ........................................ 1.85 2010 2105 79 538 211 559 293 7976 Iran (Islamic Republic of) .............. 1.85 2010 2105 16 913 66 443 105 4857 Réunion .......................................... 1.85 2010 2105 248 723 1 0148 Saint Lucia...................................... 1.85 2010 2105 79 146 1639 Turkey ............................................ 1.85 2010 2105 21 484 68 281 97 759
10 United States of America............... 1.85 2010 2105 157 813 285 003 408 69511 Uzbekistan...................................... 1.85 2010 2105 6 314 24 913 37 81812 Viet Nam........................................ 1.85 2010 2105 27 367 78 137 117 6931 Algeria............................................ 1.85 2015 2110 8 753 30 245 48 6672 Bahrain ........................................... 1.85 2015 2110 116 677 1 2703 French Polynesia ............................ 1.85 2015 2110 61 233 3554 Guyana............................................ 1.85 2015 2110 423 759 5075 Jamaica........................................... 1.85 2015 2110 1 403 2 580 3 6696 Kyrgyzstan...................................... 1.85 2015 2110 1 740 4 921 7 2357 Mexico............................................ 1.85 2015 2110 27 737 98 933 140 2288 Mongolia ........................................ 1.85 2015 2110 761 2 500 3 7739 South Africa ................................... 1.85 2015 2110 13 683 44 000 40 2431 Argentina........................................ 1.85 2020 2115 17 150 37 074 52 8052 Belize.............................................. 1.85 2020 2115 69 240 4213 Chile ............................................... 1.85 2020 2115 6 082 15 224 21 8054 Libyan Arab Jamahiriya................. 1.85 2020 2115 1 029 5 237 9 2485 Myanmar........................................ 1.85 2020 2115 17 832 47 544 64 4936 New Caledonia ............................... 1.85 2020 2115 65 215 3827 Suriname......................................... 1.85 2020 2115 215 425 459

TABLE 2 (continued)
18
Population (thousands) Count Country or area
Total fertility in 2045-2050
Beginning of period with TF < 2.1
End of period of TF < 2.1 1950 2000 2050
8 Tajikistan........................................ 1.85 2020 2115 1 532 6 089 9 5529 Turkmenistan.................................. 1.85 2020 2115 1 211 4 643 7 541
10 United Arab Emirates..................... 1.85 2020 2115 70 2 820 4 11211 Uruguay.......................................... 1.85 2020 2115 2 239 3 342 4 12812 Venezuela....................................... 1.85 2020 2115 5 094 24 277 41 7331 Ecuador........................................... 1.85 2025 2120 3 387 12 420 18 7242 India................................................ 1.85 2025 2120 357 561 1 016 938 1 531 4383 Israel............................................... 1.85 2025 2120 1 258 6 042 9 9894 Kuwait ............................................ 1.85 2025 2120 152 2 247 4 9265 Malaysia ......................................... 1.85 2025 2120 6 110 23 001 39 5516 Morocco.......................................... 1.85 2025 2120 8 953 29 108 47 0647 Panama ........................................... 1.85 2025 2120 860 2 950 5 1408 Peru................................................. 1.85 2025 2120 7 632 25 952 41 1059 Philippines ...................................... 1.85 2025 2120 19 996 75 711 126 965
10 Qatar............................................... 1.85 2025 2120 25 581 8741 Bangladesh ..................................... 1.85 2030 2125 41 783 137 952 254 5992 Cape Verde..................................... 1.85 2030 2125 146 436 8123 Dominican Republic....................... 1.85 2030 2125 2 353 8 353 11 8764 Egypt .............................................. 1.85 2030 2125 21 834 67 784 127 4075 El Salvador..................................... 1.85 2030 2125 1 951 6 209 9 7936 Fiji .................................................. 1.85 2030 2125 289 814 9697 French Guiana ................................ 1.85 2030 2125 25 164 3548 Guam.............................................. 1.85 2030 2125 60 155 2489 Jordan ............................................. 1.85 2030 2125 472 5 035 10 154
10 Syrian Arab Republic..................... 1.85 2030 2125 3 495 16 560 34 1741 Botswana ........................................ 1.85 2035 2130 419 1 725 1 3802 Colombia ........................................ 1.85 2035 2130 12 568 42 120 67 4913 Guatemala....................................... 1.94 2035 2130 2 969 11 423 26 1664 Honduras ........................................ 1.95 2035 2130 1 380 6 457 12 6301 Paraguay......................................... 1.90 2040 2135 1 488 5 470 12 1112 Solomon Islands............................. 1.91 2040 2135 90 437 1 0713 Saudi Arabia................................... 1.92 2040 2135 3 201 22 147 54 7384 Swaziland ....................................... 1.92 2040 2135 273 1 044 9485 Nicaragua........................................ 1.97 2040 2135 1 134 5 073 10 868
6 Lao People's Democratic Republic.......................................... 1.97 2040 2135 1 755 5 279 11 448
7 Tonga.............................................. 1.97 2040 2135 47 101 1228 Micronesia (Federated States of).... 1.98 2040 2135 32 107 1589 Iraq.................................................. 1.99 2040 2135 5 158 23 224 57 932
10 Bolivia ............................................ 1.99 2040 2135 2 714 8 317 15 74811 Zimbabwe....................................... 1.99 2040 2135 2 744 12 650 12 65812 Democratic Rep. of Timor-Leste.... 1.99 2040 2135 433 702 1 43313 Lesotho........................................... 1.99 2040 2135 734 1 785 1 37714 Western Sahara............................... 2.00 2040 2135 14 285 64115 Kenya.............................................. 2.00 2040 2135 6 265 30 549 43 98416 Haiti................................................ 2.03 2040 2135 3 261 8 005 12 4291 Gabon ............................................. 2.01 2045 2140 469 1 258 2 4882 Sao Tome and Principe................... 2.01 2045 2140 60 149 3493 United Republic of Tanzania.......... 2.03 2045 2140 7 886 34 837 69 112

TABLE 2 (continued)
19
Population (thousands) Count Country or area
Total fertility in 2045-2050
Beginning of period with TF < 2.1
End of period of TF < 2.1 1950 2000 2050
4 Ghana.............................................. 2.03 2045 2140 4 900 19 593 39 5485 Papua New Guinea......................... 2.03 2045 2140 1 798 5 334 11 1106 Vanuatu .......................................... 2.03 2045 2140 48 197 4357 Samoa............................................. 2.05 2045 2140 82 173 2548 Nepal .............................................. 2.05 2045 2140 8 643 23 518 50 8109 Pakistan .......................................... 2.06 2045 2140 39 659 142 654 348 700
10 Togo................................................ 2.08 2045 2140 1 329 4 562 10 00511 Maldives ......................................... 2.08 2045 2140 82 291 81912 Namibia .......................................... 2.08 2045 2140 511 1 894 2 65413 Sudan.............................................. 2.08 2045 2140 9 190 31 437 60 13314 Cameroon ....................................... 2.10 2045 2140 4 466 15 117 24 9481 Côte d'Ivoire................................... 2.11 >2050 2140-2175 2 775 15 827 27 5722 Gambia ........................................... 2.11 >2050 2140-2175 294 1 312 2 9053 Cambodia........................................ 2.13 >2050 2140-2175 4 346 13 147 29 5674 Comoros ......................................... 2.14 >2050 2140-2175 173 705 1 8165 Benin .............................................. 2.16 >2050 2140-2175 2 046 6 222 15 6026 Senegal........................................... 2.16 >2050 2140-2175 2 500 9 393 21 5897 Equatorial Guinea........................... 2.17 >2050 2140-2175 226 456 1 1778 Bhutan ............................................ 2.17 >2050 2140-2175 734 2 063 5 2889 Rwanda........................................... 2.17 >2050 2140-2175 2 162 7 724 16 973
10 Oman .............................................. 2.19 >2050 2140-2175 456 2 609 6 81211 Eritrea............................................. 2.23 >2050 2140-2175 1 140 3 712 10 53912 Central African Republic................ 2.24 >2050 2140-2175 1 314 3 715 6 56313 Nigeria............................................ 2.24 >2050 2140-2175 29 790 114 746 258 47814 Mozambique................................... 2.29 >2050 2140-2175 6 442 17 861 31 27515 Guinea............................................ 2.33 >2050 2140-2175 2 550 8 117 19 59116 Occupied Palestinian Territory....... 2.34 >2050 2140-2175 1 005 3 191 11 11417 Zambia............................................ 2.36 >2050 2140-2175 2 440 10 419 18 52818 Djibouti........................................... 2.38 >2050 2140-2175 62 666 1 39519 Madagascar..................................... 2.38 >2050 2140-2175 4 230 15 970 46 29220 Congo ............................................. 2.39 >2050 2140-2175 808 3 447 10 64321 Mauritania ...................................... 2.44 >2050 2140-2175 825 2 645 7 49722 Sierra Leone................................... 2.45 >2050 2140-2175 1 944 4 415 10 33923 Malawi............................................ 2.53 >2050 2140-2175 2 881 11 370 25 94924 Ethiopia .......................................... 2.55 >2050 2140-2175 18 434 65 590 170 98725 Chad................................................ 2.56 >2050 2140-2175 2 658 7 861 25 35926 Democratic Rep. of the Congo....... 2.61 >2050 2140-2175 12 184 48 571 151 64427 Burundi........................................... 2.74 >2050 2140-2175 2 456 6 267 19 45928 Afghanistan .................................... 2.77 >2050 2140-2175 8 151 21 391 69 51729 Liberia ............................................ 2.78 >2050 2140-2175 824 2 943 9 82130 Guinea-Bissau ................................ 2.86 >2050 2140-2175 505 1 367 4 71931 Mali ................................................ 2.90 >2050 2140-2175 3 520 11 904 45 99832 Uganda............................................ 2.90 >2050 2140-2175 5 210 23 487 103 24833 Burkina Faso................................... 2.93 >2050 2140-2175 3 960 11 905 42 37334 Angola ............................................ 3.00 >2050 2140-2175 4 131 12 386 43 13135 Somalia........................................... 3.05 >2050 2140-2175 2 264 8 720 39 66936 Yemen............................................ 3.18 >2050 2140-2175 4 316 18 017 84 38537 Niger............................................... 3.85 >2050 2140-2175 2 500 10 742 53 037

20
2045-2050 were projected to return to replacement level by a fixed date, they would in effect have spent periods of very different duration at below-replacement fertility levels. 77. If we assume instead that the fertility of all countries will remain during a relatively lengthy period at below-replacement levels and that the length of that period will be similar for all countries, then the transition back to replacement level should occur later for countries that reached below-replacement fertility later. Table 3 presents the distribution of countries according to the beginning of the period of uninterrupted below-replacement fertility. That is, a country whose below-replacement period begins in 1970, for instance, maintained a level of fertility below 2.1 children per woman from 1970-1975 to 2045-2050 in the medium variant of the 2002 Revision. If, to extend that variant, countries are given a minimum of 20 years to move from a level of 1.85 children per woman to replacement level6, then the period of below-replacement fertility would end in 2070 for the countries where it started at the earliest dates. If the dates to end the period of below-replacement fertility listed in table 3 are used, the countries that by 2000 had already experienced below-replacement fertility would, on average, be projected to spend 95 years at below-replacement levels before returning to replacement-level fertility. Using that length of time for countries projected to reach below replacement level after 2000, table 2 indicates that all but 37 countries would return to replacement level by 2040. Among the other 37, Niger would take the longest to both reach below-replacement level and return to replacement level, but it should reach the latter by about 2170. That is, following this scheme, most countries would spend at least 160 years at replacement level by 2300 and, provided mortality changes little, might be getting close to having a stationary population by then.
TABLE 3. DISTRIBUTION OF COUNTRIES BY YEAR IN WHICH THE
PERIOD OF BELOW-REPLACEMENT FERTILITY STARTED AND PROPOSED YEAR WHEN THAT PERIOD WILL END
Year when TF drops below 2.1
Number of countries
Percentage of countries
End of period of TF<2.1
Difference in years
1950 ............. 1 0.5 2070 1201955 ............. 1 0.5 2070 1151960 ............. 0 0.0 2070 1101965 ............. 4 2.1 2070 1051970 ............. 12 6.3 2070 1001975 ............. 7 3.6 2070 951980 ............. 13 6.8 2070 901985 ............. 2 1.0 2075 901990 ............. 9 4.7 2080 901995 ............. 9 4.7 2085 902000 ............. 4 2.1 2095 952005 ............. 6 3.1 2100 952010 ............. 12 6.3 2105 952015 ............. 9 4.7 2110 952020 ............. 12 6.3 2115 952025 ............. 10 5.2 2120 952030 ............. 10 5.2 2125 952035 ............. 4 2.1 2130 952040 ............. 16 8.3 2135 952045 ............. 14 7.3 2140 95>2050........... 37 19.3 >2140 >95
6 2.1 children per woman will be used in this paper but, in the actual projections, true replacement level will
be calculated

21
78. Proposal for the medium scenario: The medium variant of the 2002 Revision will be extended by letting those countries that have not yet reached 1.85 children per woman move to that level. Once below-replacement fertility is reached, countries will maintain levels below replacement (that is, levels below 2.1 children per woman) for periods that will average 95 years. The exact period for each country is indicated in table 1. At the end of those 95 years, actual replacement level will be reached and maintained for the rest of the projection period.
79. Proposal for the low and high scenarios : In the 2002 Revision, the key variants were the low, the medium and the high. The fertility of the low and the high variants usually differed from that of the medium variant by 0.5 and –0.5 children, respectively, especially by 2045-2050. Previous long-range projections have shown that a difference of half a child above or below replacement level, if maintained over the long run, produces very dramatic increases or decreases of the population. Consequently, it is proposed that in this set of long-range projections the differences between the low, medium and high scenarios after 2050 be reduced to 0.25 of a child. That is, after a transition period of 20 years or so, total fertility in the low scenario will be 0.25 children less than that of the medium scenario and that of the high scenario will be 0.25 children higher than the medium.
80. Figures 1 and 2 illustrate the paths of fertility for Niger (a high-fertility country) and Venezuela (an intermediate-fertility country) starting in 1950 and going to 2200. Beyond that point, fertility will remain constant. The narrowing of the difference between the low, medium and high scenarios is evident but the period of transition works well in both cases. It is not possible, however, to follow exactly the same strategy in the case of countries such as Latvia, where fertility has already fallen below 1.85 children per woman and whose fertility was projected to increase rather than decrease from 2010 to 2050 in the 2002 Revision. In that case, the transition for the low scenario to become 0.25 children lower than the medium-scenario needs to be longer, whereas the high scenario, which starts at 2.35 children per woman, needs only remain constant to be 0.25 children higher than the medium when the latter reaches 2.1 children per women (see figure 3).
Proposals for other scenarios :
81. Ultra-low and ultra-high scenarios: Total fertility is kept at –0.5 and +0.5 children below or above that of the medium scenario.
82. Scenario with 1.85 children per woman: Countries whose fertility has not reached 1.85 children per woman by 2045-2050 are allowed to reach it before 2100. Once reached, the level of 1.85 children per woman is maintained constant until 2300 for all countries.
83. Instant-replacement scenario: Continuation of the instant-replacement scenario of the 2002 Revision, that is, instant replacement starts in 2000.
84. Instant-replacement scenario 2050: Continuation of the medium variant of the 2002 Revision but ensuring instant-replacement as of 2050.
85. Constant-fertility scenario. Continuation of the constant-fertility variant of the 2002 Revision, that is, total fertility is kept constant at the level reached in 1995-2000.

22
Figure 1. Estimated and projected fertility, Niger, 1950-2200, low, medium and high
0.0
1.0
2.0
3.0
4.0
5.0
6.0
7.0
8.0
9.0
1950
-1955
1960
-1965
1970
-1975
1980
-1985
1990
-1995
2000
-2005
2010
-2015
2020
-2025
2030
-2035
2040
-2045
2050
-2055
2060
-2065
2070
-2075
2080
-2085
2090
-2095
2100
-2105
2110
-2115
2120
-2125
2130
-2135
2140
-2145
2150
-2155
2160
-2165
2170
-2175
2180
-2185
2190
-2195
Tota
l fer
tility
Low Medium High
Figure 2. Estimated and projected fertility, Venezuela, 1950-2200, low, medium and high
0.0
1.0
2.0
3.0
4.0
5.0
6.0
7.0
1950
-1955
1960
-1965
1970
-1975
1980
-1985
1990
-1995
2000
-2005
2010
-2015
2020
-2025
2030
-2035
2040
-2045
2050
-2055
2060
-2065
2070
-2075
2080
-2085
2090
-2095
2100
-2105
2110
-2115
2120
-2125
2130
-2135
2140
-2145
2150
-2155
2160
-2165
2170
-2175
2180
-2185
2190
-2195
Tota
l fer
tility
High Low Medium

23
86. Constant-fertility scenario 2050: Total fertility is maintained constant at the level
reached in 2045-2050 in the medium variant. The projection of age-specific fertility 87. According to the medium variant of the 2002 Revision, most countries would already be experiencing fertility at below-replacement level by 2045-2050. Hence, to facilitate the preparation of long-term projections, the shape of the fertility schedule for the following 250 years will be kept constant and equal to that reached by 2045-2050. In the case of countries whose total fertility in 2045-2050 was still substantially above replacement level, the shape of the fertility schedule will be projected in such a way that it conforms to the patterns typically observed among low-fertility countries by the time below-replacement fertility is reached (on or before 2080-2085). From there on, the shape of age-specific fertility will be kept constant until the end of the projection period.
C. THE LONG-RANGE PROJECTION OF MORTALITY
88. The long-range projection of mortality probably poses more challenges than the long-range projection of fertility. As with fertility, we will focus here mostly on how to project mortality levels, although the issue cannot be totally separated from the consideration of changing mortality patterns by age. Traditionally, the Population Division has projected expectation of life at birth by using a model whereby the increments of e(0) over time diminish as higher levels of
Figure 3. Estimated and projected total fertility for Latvia, 1950-2200, low, medium and high variants
0.0
0.5
1.0
1.5
2.0
2.5
1950
-1955
1960
-1965
1970
-1975
1980
-1985
1990
-1995
2000
-2005
2010
-2015
2020
-2025
2030
-2035
2040
-2045
2050
-2055
2060
-2065
2070
-2075
2080
-2085
2090
-2095
2100
-2105
2110
-2115
2120
-2125
2130
-2135
2140
-2145
2150
-2155
2160
-2165
2170
-2175
2180
-2185
2190
-2195
Tota
l fer
tility
High Low Medium

24
life expectancy are reached. Once a future path of e(0) levels is established, life tables with those expectations of life are generated by using model life-table systems and an interpolation method based on the Lee-Carter method. Currently, the models used have a limiting life table with 92.5 years of life expectancy. 89. In addition, in the 2002 Revision the projections of mortality for 53 countries take explicit account of the impact of the HIV/AIDS epidemic. As a result, both their levels and patterns of mortality by age are projected on the basis of a projection of the future incidence of the disease. The effects of HIV/AIDS in terms of excess mortality are superimposed on life tables projected using the traditional method. Although the incidence of HIV/AIDS is projected to decline over time, by 2045-2050 it is still far from negligible in several of the countries affected and the levels and patterns of mortality by age and sex in 2045-2050 still reflect the impact of the epidemic. 90. Given the great successes in improving health during the second half of the 20th century, mortality reductions were virtually universal until the 1980s and the projections of the Population Division reflected the general view that mortality would keep on declining everywhere. The emergence of HIV/AIDS put an end to that optimistic perspective. Furthermore, the stagnation or even increases of mortality levels recorded in some of the CIS countries and other countries with economies in transition also indicated that the universal reduction of mortality could not be taken for granted. However, except for the cases of countries already affected by the HIV/AIDS epidemic, the 2002 Revision generally projects that mortality levels will decline steadily until 2050. In considering a 300 year horizon, one must admit that the possibility of setbacks increases. Epidemics caused by as yet unheard of infectious agents, high mortality due to conflict or political instability, increased mortality because of unsustainable modes of production in parts of the world are all possible and perhaps likely. However, it is not possible to pinpoint with some certainty where and when those setbacks might occur. Therefore, in making long-range projections at the country level, the scenarios proposed here will still reflect the view that progress in reducing mortality is expected everywhere. 91. To explore the changes in life expectancy recorded during the second half of the twentieth century and those projected by the 2002 Revision over the first half of the twenty-first century, table 4 presents the expectation of life for both sexes combined in 1950-1955, 1995-2000 and 2045-2050, as well as the average annual increments in life expectancy for three periods. Table 5 presents the same information for the 53 countries that are highly affected by the HIV/AIDS epidemic. Figure 4 shows the scatterplot of life expectancy in 1950-1955 against the average annual increment in life expectancy between 1950-1955 and 1995-2000 for countries that are not yet significantly affected by HIV/AIDS. Although there are some exceptions among countries with relatively low life expectancies in the early 1950s, the general trend is for the average annual increments to decline as life expectancy rises. That is, over lengthy periods (45 years in this case), countries that started with a higher life expectancy made smaller gains in absolute terms than countries whose life expectancy was lower at the beginning of the period. 92. Figure 5 shows a similar plot as that in figure 4 but restricted to countries not affected by HIV/AIDS and whose life expectancies in 1950-1955 were already fairly high (at least 60 years). The declining trend of annual increments of life expectancy in relation to initial levels of expectancy is clearer. By fitting a curve to the data, it is possible to use that curve to project life expectancy over time. The resulting life expectancies for 2295-2300 are shown in table 6. They range from 88 to 99 years. They also reflect the same country rankings as those projected by the 2002 Revision for 2045-2050. That is, crossovers are avoided.

25
TABLE 4. EXPECTATION OF LIFE A T BIRTH AND AVERAGE ANNUAL INCREASE IN L IFE EXPECTANCY
BY COUNTRY , 1950-1955, 1995-2000 AND 2045-2050
Expectation of life at birth (both sexes) Average annual increase (years)
Country or area 1950-1955 1995-2000 2045-2050 1950-1955 to
1995-2000 1995-2000 to
2045-2050 1950-1955 to
2045-2050 Japan..................................................... 63.9 80.5 88.1 0.37 0.14 0.24 China, Hong Kong SAR....................... 61.0 79.1 84.8 0.40 0.10 0.24 Sweden................................................. 71.8 79.3 84.6 0.17 0.10 0.13 China, Macao SAR.............................. 54.0 78.1 84.2 0.54 0.11 0.30 Spain..................................................... 63.9 78.4 84.1 0.32 0.10 0.20 France................................................... 66.5 78.1 84.0 0.26 0.11 0.17 Belgium................................................ 67.5 77.9 83.8 0.23 0.11 0.16 Norway................................................. 72.7 78.1 83.7 0.12 0.10 0.11 Australia............................................... 69.6 78.7 83.7 0.20 0.09 0.14 Luxembourg ......................................... 65.9 77.4 83.7 0.26 0.11 0.18 Malta .................................................... 65.9 77.3 83.7 0.25 0.12 0.18 Austria .................................................. 65.7 77.7 83.6 0.27 0.11 0.18 Israel..................................................... 65.4 78.3 83.5 0.29 0.09 0.18 Germany............................................... 67.5 77.4 83.5 0.22 0.11 0.16 Iceland.................................................. 72.0 79.3 83.4 0.16 0.08 0.11 Canada.................................................. 69.1 78.7 83.3 0.21 0.08 0.14 Guadeloupe .......................................... 56.5 77.3 83.2 0.46 0.11 0.27 Martinique............................................ 56.6 78.8 83.1 0.49 0.08 0.26 United Kingdom................................... 69.2 77.2 83.0 0.18 0.11 0.14 Singapore ............................................. 60.4 77.2 83.0 0.37 0.11 0.23 Finland ................................................. 66.3 77.2 83.0 0.24 0.11 0.17 Switzerland........................................... 69.2 78.6 82.9 0.21 0.08 0.14 Italy ...................................................... 66.0 78.2 82.5 0.27 0.08 0.17 United States Virgin Islands ................ 64.9 77.3 82.5 0.28 0.09 0.18 Greece .................................................. 65.9 77.8 82.3 0.26 0.08 0.16 New Zealand ........................................ 69.6 77.6 82.3 0.18 0.08 0.13 Channel Islands.................................... 70.6 77.6 82.2 0.16 0.08 0.12 Netherlands .......................................... 72.1 77.9 82.2 0.13 0.08 0.10 Cyprus.................................................. 67.0 77.6 82.2 0.24 0.08 0.15 Republic of Korea................................ 47.5 74.4 82.2 0.60 0.14 0.35 Costa Rica ............................................ 57.2 77.3 82.0 0.45 0.09 0.25 Slovenia................................................ 65.6 75.2 81.9 0.21 0.12 0.16 Ireland .................................................. 66.9 76.1 81.4 0.20 0.10 0.15 Denmark............................................... 71.0 75.9 81.4 0.11 0.10 0.10 Barbados............................................... 57.2 76.4 81.4 0.43 0.09 0.24 Czech Republic .................................... 67.4 74.3 81.4 0.15 0.13 0.14 Uruguay................................................ 66.1 74.2 81.3 0.18 0.13 0.15 Brunei Darussalam............................... 60.4 75.5 81.2 0.34 0.10 0.21 Portugal................................................ 59.3 75.2 81.0 0.35 0.11 0.22 Netherlands Antilles............................. 60.5 75.5 81.0 0.33 0.10 0.21 Cuba ..................................................... 59.3 76.0 80.9 0.37 0.09 0.22 Kuwait .................................................. 55.6 75.7 80.9 0.45 0.09 0.25 Jamaica................................................. 58.5 74.8 80.8 0.36 0.11 0.22 French Guiana...................................... 53.3 74.2 80.8 0.47 0.12 0.27 Chile..................................................... 54.7 75.3 80.7 0.46 0.10 0.26 Argentina.............................................. 62.5 73.2 80.5 0.24 0.13 0.18

TABLE 4 (continued)
26
Expectation of life at birth (both sexes) Average annual increase (years)
Country or area 1950-1955 1995-2000 2045-2050 1950-1955 to
1995-2000 1995-2000 to
2045-2050 1950-1955 to
2045-2050 New Caledonia ..................................... 51.4 74.0 80.4 0.50 0.12 0.29 Panama................................................. 55.2 73.7 80.4 0.41 0.12 0.25 Guam.................................................... 57.0 73.5 80.3 0.37 0.12 0.23 Puerto Rico........................................... 64.3 74.9 80.3 0.24 0.10 0.16 Réunion................................................ 52.7 74.6 80.2 0.48 0.10 0.27 Poland................................................... 61.3 72.8 80.1 0.26 0.13 0.19 United Arab Emirates........................... 48.0 73.8 80.1 0.57 0.12 0.32 Venezuela............................................. 55.1 72.8 80.0 0.39 0.13 0.25 Albania................................................. 55.2 72.8 79.9 0.39 0.13 0.25 Bahrain ................................................. 50.9 73.0 79.8 0.49 0.12 0.29 Lithuania .............................................. 64.8 71.4 79.7 0.15 0.15 0.15 Tunisia.................................................. 44.6 71.7 79.7 0.60 0.15 0.35 Mexico................................................. 50.6 72.5 79.7 0.49 0.13 0.29 Malaysia ............................................... 48.5 71.9 79.6 0.52 0.14 0.31 French Polynesia .................................. 48.9 71.7 79.6 0.51 0.14 0.31 Slovakia................................................ 64.3 72.2 79.6 0.18 0.13 0.15 Croatia .................................................. 61.2 73.3 79.6 0.27 0.11 0.18 Libyan Arab Jamahiriya....................... 42.7 71.6 79.6 0.64 0.15 0.37 TFYR Macedonia................................. 55.0 72.7 79.5 0.39 0.12 0.25 Sri Lanka .............................................. 55.5 71.6 79.5 0.36 0.14 0.24 Saint Vincent and the Grenadines........ 51.1 73.2 79.4 0.49 0.11 0.28 Estonia.................................................. 65.3 70.1 79.4 0.11 0.17 0.14 Saudi Arabia......................................... 39.9 70.9 79.3 0.69 0.15 0.39 Hungary................................................ 63.6 70.6 79.3 0.15 0.16 0.16 Lebanon................................................ 55.9 72.6 79.2 0.37 0.12 0.23 Colombia .............................................. 50.6 70.7 79.2 0.45 0.15 0.29 Latvia ................................................... 66.0 69.3 79.1 0.07 0.18 0.13 Iran (Islamic Republic of).................... 44.9 68.6 79.1 0.53 0.19 0.34 Syrian Arab Republic........................... 45.9 70.5 79.1 0.55 0.16 0.33 Serbia and Montenegro ........................ 58.0 72.2 79.1 0.32 0.12 0.21 Qatar..................................................... 48.0 70.9 79.0 0.51 0.15 0.31 Saint Lucia ........................................... 54.1 71.5 79.0 0.39 0.14 0.25 Occupied Palestinian Territory ............ 43.2 71.4 79.0 0.63 0.14 0.36 Bosnia and Herzegovina ...................... 53.8 73.3 78.9 0.43 0.10 0.25 Mauritius.............................................. 51.0 70.7 78.8 0.44 0.15 0.28 Jordan................................................... 43.2 69.7 78.8 0.59 0.17 0.36 El Salvador........................................... 45.3 69.5 78.8 0.54 0.17 0.34 Bulgaria ................................................ 64.1 70.9 78.7 0.15 0.14 0.15 Suriname .............................................. 56.0 70.1 78.6 0.31 0.15 0.23 Nicaragua ............................................. 42.3 68.0 78.6 0.57 0.19 0.36 Cape Verde........................................... 48.5 68.6 78.6 0.45 0.18 0.30 Oman.................................................... 37.6 71.6 78.5 0.76 0.13 0.41 Turkey.................................................. 43.6 69.0 78.5 0.57 0.17 0.35 Paraguay............................................... 62.6 69.7 78.5 0.16 0.16 0.16 Sao Tome and Principe ........................ 46.4 68.4 78.5 0.49 0.18 0.32 Philippines............................................ 47.8 68.6 78.4 0.46 0.18 0.31 Algeria.................................................. 43.1 67.9 78.4 0.55 0.19 0.35 Belarus ................................................. 65.9 68.5 78.4 0.06 0.18 0.12
TABLE 4 (continued)
27
Expectation of life at birth (both sexes) Average annual increase (years)
Country or area 1950-1955 1995-2000 2045-2050 1950-1955 to
1995-2000 1995-2000 to
2045-2050 1950-1955 to
2045-2050 Solomon Islands................................... 45.4 67.4 78.3 0.49 0.20 0.33 Georgia................................................. 61.5 72.7 78.3 0.25 0.10 0.17 Ecuador................................................ 48.4 69.8 78.3 0.48 0.15 0.30 Egypt.................................................... 42.4 67.0 78.2 0.55 0.20 0.36 Samoa................................................... 45.9 68.4 78.2 0.50 0.18 0.32 Ukraine................................................. 66.0 68.1 78.2 0.05 0.18 0.12 Viet Nam.............................................. 40.4 67.2 78.2 0.60 0.20 0.38 Peru ...................................................... 43.9 68.3 78.2 0.54 0.18 0.34 Azerbaijan............................................ 61.3 70.9 78.0 0.22 0.13 0.17 Armenia................................................ 64.8 71.4 77.9 0.15 0.12 0.13 Morocco ............................................... 42.9 66.6 77.9 0.53 0.21 0.35 Republic of Moldova........................... 58.4 67.3 77.8 0.20 0.19 0.19 Fiji ........................................................ 52.5 68.4 77.8 0.35 0.17 0.25 Maldives............................................... 38.9 65.4 77.5 0.59 0.22 0.39 Guatemala ............................................ 42.0 64.2 77.5 0.49 0.24 0.35 Micronesia (Federated States of)......... 54.6 67.1 77.3 0.28 0.19 0.23 Romania ............................................... 61.1 70.5 77.3 0.21 0.12 0.16 Tonga................................................... 54.6 67.0 77.2 0.28 0.19 0.23 Indonesia.............................................. 37.5 64.9 76.9 0.61 0.22 0.39 Uzbekistan............................................ 56.4 68.3 76.8 0.27 0.15 0.20 Kyrgyzstan ........................................... 55.4 66.9 76.6 0.26 0.17 0.21 Tajikistan.............................................. 55.7 67.2 76.5 0.25 0.17 0.21 Vanuatu................................................ 42.0 67.2 76.5 0.56 0.17 0.35 Bolivia .................................................. 40.4 62.1 76.5 0.48 0.26 0.36 Iraq ....................................................... 44.0 58.7 76.3 0.33 0.32 0.32 Western Sahara .................................... 35.5 61.2 76.3 0.57 0.28 0.41 Comoros............................................... 40.7 58.8 76.2 0.40 0.32 0.36 Turkmenistan ....................................... 53.0 65.4 76.2 0.27 0.20 0.23 Kazakhstan........................................... 56.5 64.6 76.0 0.18 0.21 0.20 Bhutan.................................................. 35.2 60.7 76.0 0.57 0.28 0.41 Mongolia.............................................. 42.2 61.9 75.9 0.44 0.26 0.34 Bangladesh........................................... 37.5 58.4 75.0 0.47 0.30 0.38 Nepal.................................................... 36.3 57.4 74.9 0.47 0.32 0.39 Democratic People's Rep. of Korea ..... 49.0 63.1 74.7 0.31 0.21 0.26 Pakistan................................................ 41.0 59.0 74.7 0.40 0.28 0.34 Yemen.................................................. 32.5 58.0 73.5 0.56 0.28 0.41 Papua New Guinea............................... 34.7 55.5 73.3 0.46 0.32 0.39 Lao People's Democratic Republic...... 37.8 52.5 72.2 0.33 0.36 0.34 Madagascar.......................................... 36.7 51.6 71.1 0.33 0.35 0.34 Senegal................................................. 36.5 50.9 70.9 0.32 0.36 0.34 Democratic Rep. of Timor-Leste ......... 30.0 47.5 69.9 0.39 0.41 0.40 Mauritania............................................ 35.4 50.5 69.7 0.33 0.35 0.34 Somalia................................................. 33.0 44.8 68.4 0.26 0.43 0.35 Niger..................................................... 32.2 44.2 65.4 0.27 0.39 0.33 Afghanistan.......................................... 31.9 42.1 62.4 0.23 0.37 0.31

28
TABLE 5. EXPECTATION OF LIFE A T BIRTH AND AVERAGE ANNUAL INCREASE IN L IFE EXPECTANCY FOR COUNTRIES
AFFECTED BY HIV/AIDS, 1950-1955, 1995-2000 AND 2045-2050 Expectation of life at birth (both sexes) Average annual increase (years)
Country or area 1950-1955 1995-2000 2045-2050 1950-1955 to
1995-2000 1995-2000 to
2045-2050 1950-1955 to
2045-2050 United States of America........... 68.9 76.2 81.6 0.16 0.10 0.13Thailand ..................................... 52.0 68.1 78.2 0.36 0.18 0.26Brazil.......................................... 50.9 67.1 77.9 0.36 0.20 0.27China.......................................... 40.8 69.7 76.7 0.64 0.13 0.36Trinidad and Tobago.................. 59.1 72.1 76.6 0.29 0.08 0.17Belize ......................................... 57.7 72.5 76.5 0.33 0.07 0.19Honduras .................................... 41.8 68.6 75.6 0.60 0.13 0.34Russian Federation..................... 64.5 66.1 74.2 0.04 0.15 0.10India ........................................... 38.7 62.1 73.8 0.52 0.21 0.35Dominican Republic .................. 45.9 66.9 73.7 0.47 0.12 0.28Bahamas ..................................... 59.8 67.3 73.6 0.17 0.12 0.14Guyana ....................................... 52.3 63.6 71.7 0.25 0.15 0.19Ghana ......................................... 42.0 57.3 71.6 0.34 0.26 0.30Gabon......................................... 37.0 56.6 71.6 0.44 0.27 0.35Gambia....................................... 30.0 52.7 70.2 0.51 0.32 0.40Cambodia ................................... 39.4 57.2 69.8 0.39 0.23 0.30Myanmar.................................... 36.8 56.4 69.5 0.44 0.24 0.33Uganda ....................................... 40.0 41.1 69.3 0.03 0.51 0.29Sudan.......................................... 37.6 55.0 68.6 0.38 0.25 0.31Haiti............................................ 37.6 48.2 68.4 0.24 0.37 0.31Eritrea......................................... 35.9 52.0 68.3 0.36 0.30 0.32Guinea........................................ 31.0 47.0 67.2 0.36 0.37 0.36Equatorial Guinea...................... 34.5 48.5 67.0 0.31 0.34 0.32Benin.......................................... 33.9 51.4 66.6 0.39 0.28 0.33Mali ............................................ 32.7 47.9 65.5 0.34 0.32 0.33Burkina Faso.............................. 31.9 45.9 65.0 0.31 0.35 0.33Djibouti...................................... 33.0 47.0 64.1 0.31 0.31 0.31Congo......................................... 42.1 49.2 64.1 0.16 0.27 0.22Nigeria........................................ 36.5 52.5 63.9 0.36 0.21 0.27Chad ........................................... 32.5 44.4 63.6 0.26 0.35 0.31Togo ........................................... 36.0 51.8 63.5 0.35 0.21 0.27Guinea-Bissau............................ 32.5 44.4 63.4 0.26 0.34 0.31United Republic of Tanzania ..... 37.0 45.5 63.3 0.19 0.32 0.26Ethiopia...................................... 32.9 46.1 63.2 0.29 0.31 0.30Rwanda....................................... 40.0 35.5 62.8 -0.10 0.49 0.23Côte d'Ivoire............................... 36.0 43.2 62.7 0.16 0.35 0.27Burundi....................................... 39.0 39.3 61.0 0.01 0.39 0.22Democratic Rep. of the Congo... 39.1 38.0 60.8 -0.03 0.42 0.22Liberia........................................ 38.5 41.8 59.2 0.07 0.32 0.21Cameroon................................... 36.0 52.0 59.0 0.36 0.13 0.23Angola ........................................ 30.0 40.2 58.2 0.23 0.33 0.28Central African Republic ........... 35.5 42.6 57.1 0.16 0.26 0.22Malawi ....................................... 36.3 40.7 56.5 0.10 0.29 0.20South Africa............................... 45.0 58.2 55.7 0.29 -0.05 0.11Namibia ...................................... 39.2 54.5 54.3 0.34 0.00 0.15Mozambique............................... 31.3 41.5 54.2 0.23 0.23 0.23

TABLE 5 (continued)
29
Expectation of life at birth (both sexes) Average annual increase (years)
Country or area 1950-1955 1995-2000 2045-2050 1950-1955 to
1995-2000 1995-2000 to
2045-2050 1950-1955 to
2045-2050 Kenya ......................................... 40.9 50.7 54.1 0.22 0.06 0.13Zambia ....................................... 37.8 35.7 52.3 -0.05 0.30 0.15Sierra Leone............................... 30.0 34.9 52.3 0.11 0.32 0.22Zimbabwe................................... 47.4 40.8 45.7 -0.15 0.09 -0.02Lesotho....................................... 41.7 46.9 44.1 0.11 -0.05 0.02Botswana.................................... 46.0 56.3 43.6 0.23 -0.23 -0.02Swaziland................................... 40.1 47.2 43.4 0.16 -0.07 0.03
93. This exercise leads to two conclusions. The first is that, if current projection methodology is to be used in preparing the long-range projections, the highest level of life expectancy now in use by the projection program has to be increased. However, model life tables with an ultimate life expectancy of 100 years (both sexes combined) might suffice. The second is that, provided that the ultimate life expectancy is changed, projections that incorporate a steady increase in life expectancy for all countries are feasible and would seem compatible with past average experience. 94. However, the simple method used above to derive a path of e(0) for the future has several drawbacks. It does not reflect regional differences and it does not take into account the age structure of mortality. To derive a more flexible approach for the long-range projection of mortality, we propose to use the Lee-Carter model. Ronald Lee and Lawrence Carter (1992)
Figure 4. Annual increments of life expectancy in 1950-2000 vs. life expectancy in 1950
0.0
0.1
0.2
0.3
0.4
0.5
0.6
0.7
0.8
30 35 40 45 50 55 60 65 70 75
Life expectancy (years)
Ave
rage
annu
al in
crem
ent (
year
s)

30
proposed a model for projecting future mortality. The model was based on a linear decomposition of the logarithm of age-specific mortality rates into a dominant component changing with respect to time and an age component that remained fixed as time elapsed. Carter and Lee used this model to produce mortality projections for the United States, based on data for 1900-1989. The singular value decomposition of the matrix of transformed mortality rates was used to identify the principal components and the first principal component provided the basis for projection. In particular, if m(x,t) is the central mortality rate at age x and time t, the Lee-Carter model fitted the following equation:
ln(m(x,t)) = a(x) + k(t)b(x) + å (x,t) (1)
where a(x) represents the mean pattern of mortality by age, k(t) is an index indicating the level of mortality at time t, b(x) represents a set of age-specific values describing the relative speed of change of mortality at each age, and å (x,t) is the residual at age x and time t. To project mortality, an ARIMA time-series model was fitted to k(t), by assuming that k(t) would evolve as a random walk with a drift. That is, it was assumed that k(t) could be modeled by:
k(t) = k(t-1) + d + E(t) (2)
where d was the constant “drift” and E(t) are uncorrelated errors. 95. The Lee-Carter method has been successfully applied to project the mortality of several countries, both developed and developing. More recently, Li Nan has demonstrated that the principles of the Lee-Carter method can be applied to countries with at least two reliable
Figure 5. 1950-1995 NoAIDS, high e(0) and rapid decline
y = 1.2213E+08x-4.7929E+00
R2 = 7.1820E-01
0.00
0.05
0.10
0.15
0.20
0.25
0.30
0.35
0.40
0.45
60 62 64 66 68 70 72 74
Expectation of life (both sexes )
Ann
ual i
ncre
men
t (ye
ars)

31
TABLE 6. LIFE EXPECTANCY IN 2045-2050 AND PROJECTED TO 2295-2300
Country or area Affected by
AIDS 2045-2050 2295-2300 Japan .................................................... 88.1 99.1 China, Hong Kong SAR...................... 84.8 97.4 Sweden................................................. 84.6 97.2 China, Macao SAR.............................. 84.2 97.0 Spain .................................................... 84.1 97.0 France.................................................. 84.0 96.9 Belgium................................................ 83.8 96.9 Norway ................................................ 83.7 96.8 Australia............................................... 83.7 96.8 Luxembourg......................................... 83.7 96.8 Malta.................................................... 83.7 96.8 Austria.................................................. 83.6 96.8 Israel .................................................... 83.5 96.7 Germany .............................................. 83.5 96.7 Iceland.................................................. 83.4 96.7 Canada ................................................. 83.3 96.6 Guadeloupe.......................................... 83.2 96.5 Martinique............................................ 83.1 96.5 United Kingdom.................................. 83.0 96.5 Singapore............................................. 83.0 96.4 Finland................................................. 83.0 96.4 Switzerland .......................................... 82.9 96.4 Italy ...................................................... 82.5 96.2 United States Virgin Islands................ 82.5 96.2 Greece.................................................. 82.3 96.1 New Zealand........................................ 82.3 96.1 Channel Islands.................................... 82.2 96.1 Netherlands.......................................... 82.2 96.1 Cyprus.................................................. 82.2 96.1 Republic of Korea................................ 82.2 96.1 Costa Rica............................................ 82.0 96.0 Slovenia ............................................... 81.9 95.9 United States of America..................... 1 81.6 95.8 Ireland.................................................. 81.4 95.7 Denmark.............................................. 81.4 95.7 Barbados.............................................. 81.4 95.7 Czech Republic.................................... 81.4 95.7 Uruguay ............................................... 81.3 95.7 Brunei Darussalam............................... 81.2 95.6 Portugal................................................ 81.0 95.5 Netherlands Antilles ............................ 81.0 95.5 Cuba..................................................... 80.9 95.5 Kuwait.................................................. 80.9 95.5 Jamaica................................................ 80.8 95.5 French Guiana...................................... 80.8 95.4 Chile..................................................... 80.7 95.4 Argentina ............................................. 80.5 95.3 New Caledonia..................................... 80.4 95.3

TABLE 6 (continued)
32
Country or area Affected by
AIDS 2045-2050 2295-2300 Panama................................................. 80.4 95.3 Guam.................................................... 80.3 95.2 Puerto Rico .......................................... 80.3 95.2 Réunion................................................ 80.2 95.1 Poland .................................................. 80.1 95.1 United Arab Emirates .......................... 80.1 95.1 Venezuela ............................................ 80.0 95.1 Albania................................................. 79.9 95.0 Bahrain................................................. 79.8 95.0 Lithuania.............................................. 79.7 94.9 Tunisia ................................................. 79.7 94.9 Mexico................................................. 79.7 94.9 Malaysia............................................... 79.6 94.9 French Polynesia.................................. 79.6 94.9 Slovakia ............................................... 79.6 94.9 Croatia.................................................. 79.6 94.9 Libyan Arab Jamahiriya...................... 79.6 94.9 TFYR Macedonia ................................ 79.5 94.8 Sri Lanka.............................................. 79.5 94.8 Saint Vincent and the Grenadines........ 79.4 94.8 Estonia ................................................. 79.4 94.8 Saudi Arabia ........................................ 79.3 94.8 Hungary ............................................... 79.3 94.8 Lebanon ............................................... 79.2 94.8 Colombia.............................................. 79.2 94.8 Latvia................................................... 79.1 94.7 Iran (Islamic Republic of).................... 79.1 94.7 Syrian Arab Republic .......................... 79.1 94.7 Serbia and Montenegro........................ 79.1 94.7 Qatar.................................................... 79.0 94.7 Saint Lucia........................................... 79.0 94.7 Occupied Palestinian Territory ............ 79.0 94.6 Bosnia and Herzegovina...................... 78.9 94.6 Mauritius.............................................. 78.8 94.6 Jordan................................................... 78.8 94.6 El Salvador........................................... 78.8 94.6 Bulgaria................................................ 78.7 94.5 Suriname.............................................. 78.6 94.5 Nicaragua............................................. 78.6 94.5 Cape Verde .......................................... 78.6 94.5 Oman.................................................... 78.5 94.4 Turkey.................................................. 78.5 94.4 Paraguay .............................................. 78.5 94.4 Sao Tome and Principe........................ 78.5 94.4 Philippines ........................................... 78.4 94.4 Algeria ................................................. 78.4 94.4 Belarus................................................. 78.4 94.4 Solomon Islands................................... 78.3 94.4 Georgia ................................................ 78.3 94.4

TABLE 6 (continued)
33
Country or area Affected by
AIDS 2045-2050 2295-2300 Ecuador................................................ 78.3 94.4 Egypt.................................................... 78.2 94.3 Samoa.................................................. 78.2 94.3 Ukraine................................................ 78.2 94.3 Viet Nam.............................................. 78.2 94.3 Peru ...................................................... 78.2 94.3 Thailand............................................... 1 78.2 94.3 Azerbaijan............................................ 78.0 94.2 Armenia ............................................... 77.9 94.2 Morocco............................................... 77.9 94.2 Brazil.................................................... 1 77.9 94.2 Republic of Moldova........................... 77.8 94.2 Fiji........................................................ 77.8 94.2 Maldives .............................................. 77.5 94.1 Guatemala............................................ 77.5 94.0 Micronesia (Federated States of)......... 77.3 94.0 Romania ............................................... 77.3 94.0 Tonga................................................... 77.2 94.0 Indonesia.............................................. 76.9 93.8 Uzbekistan ........................................... 76.8 93.8 China.................................................... 1 76.7 93.8 Trinidad and Tobago............................ 1 76.6 93.7 Kyrgyzstan........................................... 76.6 93.7 Tajikistan ............................................. 76.5 93.7 Belize ................................................... 1 76.5 93.7 Vanuatu................................................ 76.5 93.7 Bolivia.................................................. 76.5 93.7 Iraq....................................................... 76.3 93.6 Western Sahara.................................... 76.3 93.6 Comoros............................................... 76.2 93.6 Turkmenistan....................................... 76.2 93.6 Kazakhstan........................................... 76.0 93.5 Bhutan.................................................. 76.0 93.5 Mongolia.............................................. 75.9 93.5 Honduras.............................................. 1 75.6 93.4 Bangladesh........................................... 75.0 93.1 Nepal.................................................... 74.9 93.1 Democratic People's Rep. of Korea..... 74.7 93.0 Pakistan................................................ 74.7 93.0 Russian Federation............................... 1 74.2 92.9 India..................................................... 1 73.8 92.7 Dominican Republic............................ 1 73.7 92.7 Bahamas............................................... 1 73.6 92.7 Yemen.................................................. 73.5 92.6 Papua New Guinea.............................. 73.3 92.5 Lao People's Democratic Republic...... 72.2 92.2 Guyana................................................. 1 71.7 92.0 Ghana................................................... 1 71.6 92.0 Gabon................................................... 1 71.6 92.0

TABLE 6 (continued)
34
Country or area Affected by
AIDS 2045-2050 2295-2300 Madagascar.......................................... 71.1 91.9 Senegal................................................. 70.9 91.8 Gambia................................................. 1 70.2 91.6 Democratic Rep. of Timor-Leste......... 69.9 91.5 Cambodia ............................................. 1 69.8 91.5 Mauritania............................................ 69.7 91.5 Myanmar.............................................. 1 69.5 91.4 Uganda................................................. 1 69.3 91.4 Sudan ................................................... 1 68.6 91.2 Somalia ................................................ 68.4 91.2 Haiti..................................................... 1 68.4 91.2 Eritrea.................................................. 1 68.3 91.2 Guinea.................................................. 1 67.2 90.9 Equatorial Guinea................................ 1 67.0 90.8 Benin.................................................... 1 66.6 90.8 Mali...................................................... 1 65.5 90.5 Niger.................................................... 65.4 90.5 Burkina Faso........................................ 1 65.0 90.4 Djibouti................................................ 1 64.1 90.2 Congo................................................... 1 64.1 90.2 Nigeria ................................................. 1 63.9 90.2 Chad..................................................... 1 63.6 90.2 Togo..................................................... 1 63.5 90.1 Guinea-Bissau...................................... 1 63.4 90.1 United Republic of Tanzania............... 1 63.3 90.1 Ethiopia................................................ 1 63.2 90.1 Rwanda ................................................ 1 62.8 90.0 Côte d'Ivoire ........................................ 1 62.7 90.0 Afghanistan.......................................... 62.4 90.0 Burundi................................................ 1 61.0 89.7 Democratic Republic of the Congo ..... 1 60.8 89.7 Liberia.................................................. 1 59.2 89.5 Cameroon............................................. 1 59.0 89.5 Angola.................................................. 1 58.2 89.4 Central African Republic..................... 1 57.1 89.2 Malawi................................................. 1 56.5 89.2 South Africa......................................... 1 55.7 89.1 Namibia................................................ 1 54.3 89.0 Mozambique ........................................ 1 54.2 89.0 Kenya................................................... 1 54.1 89.0 Zambia................................................. 1 52.3 88.8 Sierra Leone......................................... 1 52.3 88.8 Zimbabwe ............................................ 1 45.7 88.6 Lesotho ................................................ 1 44.1 88.5 Botswana.............................................. 1 43.6 88.5 Swaziland............................................. 1 43.4 88.5

35
estimates of age-specific mortality by sex. Even for countries lacking data altogether, the Lee-Carter method can be applied to project mortality levels on the basis of a k(t) borrowed from other countries or from models. The proposal, therefore, is to project mortality levels on the basis of k(t) which, to the extent possible, will reflect the actual previous mortality change experienced by particular countries. 96. Projecting mortality in this way will likely result in continuous increases of life expectancy but there is no guarantee that the maximum level of life expectancy reached will be below 100 years (both sexes combined). The proposal is that, if projected life expectancy at the country level turns out to consistently surpass 100 years for both sexes combined, a limit of 100 years will be imposed artificially. 97. Proposal for the projection of mortality: Mortality levels (and the age structure of
mortality) will be projected using the Lee-Carter approach as modified by Li Nan. The parameter k(t) will be used to project mortality levels on the basis of information for each country or, if not available, on the basis of a borrowed model of change for k(t) that is appropriate. Expectation of life will be allowed to increase continuously until it reaches 100 years (both sexes combined). If that level is reached before 2300, it will be kept constant until 2300. Proposals for other scenarios:
98. Unrestricted improvement scenario: If the method to project mortality reductions results in expectations of life above 100 (both sexes combined) for a significant number of countries, a scenario where the unrestricted improvement of longevity is combined with the medium-fertility path will be produced.
99. Constant-mortality scenario 2050: Mortality will be kept constant at the level it reached in 2045-2050 and fertility will follow the medium-fertility path.
100. Constant-mortality scenario: This scenario is a continuation of the constant- mortality scenario of the 2002 Revision where mortality is kept constant at the level it reached in 1995-2000 and fertility follows the medium-fertility path.
D. THE LONG-RANGE PROJECTION OF INTERNATIONAL MIGRATION 101. As both fertility and mortality decline further, international migration is likely to become a very important component of population change for a growing number of countries. However, as the most volatile component of demographic dynamics, the bases for projecting its levels and trends over the very long term are very weak. However, it seems important to include a non-zero migration assumption in the calculation of long-term population scenarios if only to assess how the results obtained would differ from the case in which international migration would not exist. Thus, one set of the key fertility scenarios will be produced under the assumption of zero international migration and a second set will incorporate non-zero international migration for most countries over the full projection period. 102. The non-zero migration scenario will be based on two principles: (1) countries will be classified as “receiving” or “sending” and their status will not change over the whole projection period; (2) the projected net numbers of international migrants have to add to zero at the world level. The second principle or constraint implie s that either an algorithm has to be developed to

36
assign immigrants and emigrants to countries so as to ensure a zero sum at the world level or, as we do currently, the preliminary results of the projections will have to be checked manually and more emigrant or immigrants, as the case may be, will have to be allocated to ensure a world balance of zero. 103. In the normal projections to 2050, assumptions about future international migration levels are largely made in terms of net numbers of migrants and they tend to be kept constant over the projection period to facilitate the process of balancing world levels to zero. Such an approach may need to be followed also in preparing the long-range projections if time does not permit the development and testing of a programmable algorithm. 104. Given that long-term projections are likely to result in substantial changes in the population size of many countries, making assumptions on international migration in terms of net numbers of international migrants is not ideal. It would be better to use net migration rates as the means of establishing hypotheses about future trends. However, such a procedure will significantly increase the problem of getting a zero world balance. We propose to test a procedure whereby hypotheses on future trends in international migration are presented in terms of rates, a first projection is run and, on the basis of the results obtained, the rates of countries of emigration are changed to ensure that the total number of emigrants matches that of immigrants to the receiving countries (changes would be made in terms of the net number of emigrants). The net migration rates used to produce the first round of projections would largely be kept constant over the projection period, but the negative net emigration rates of some countries would change over time as a result of changes made to balance world migration to zero.
Proposed international migration scenarios :
105. Zero-migration scenario 2050: Net migration will be kept to zero in all countries starting in 2050-2055. This scenario will be combined with the low, medium and high-fertility assumptions.
106. Zero-migration scenario 2000: Continuation of the zero-migration scenario of the 2002 Revision. It will be combined with the medium-fertility assumption.
107. Cons tant net migration rates: International migration rates will be kept constant at the level they reached in 2045-2050. This scenario will be combined with the low, medium and high-fertility assumptions. Implementation of this scenario depends on developin g an algorithm for the computer-aided balancing of world migration to zero.
108. Constant net number of migrants scenario: The net number of international migrants will be kept constant at the level reached in 2045-2050. This scenario will be combined with the low, medium and high-fertility assumptions. This scenario will be used only if the one based on net migration rates cannot be implemented. Adjustments to the net number of migrants may be needed for sending countries whose population declines markedly over the projection period.
E. OBJECTIVES OF THE TECHNICAL MEETING 109. The Population Division plans to complete the calculation of the long-range population projections by October 2003. Since, as stated earlier, this is the first time that the Population Division undertakes population projections up to 2300 and that it plans to issue the results at the

37
country level, it is useful to obtain input from the research community regarding the adequacy of the assumptions made about the future paths of fertility, mortality, and international migration and the methodological challenges posed by their implementation at the country level. The meeting being convened on 30 June at United Nations Headquarters together with other input received by interested scholars will be useful in determining the final assumptions used and in refining the projection methods implemented. More specifically, we seek to address the following issues: 110. With regard to fertility, should the attainment of a stationary population be the key underlying assumption behind the path fertility takes in the medium scenario? If not, what rationale could be used to justify a different path? 111. Also with respect to fertility, how much difference should there be between the fertility levels in the high and low variants with respect to those of the medium? 112. With regard to mortality, if the models used to project future mortality trends result in expectations of life in 2300 higher than 100 years for numerous countries, should that be the mortality used for the medium scenario? Is it appropriate to set constraints on the ultimate life expectancy reached during the projection period? 113. With regard to international migration, is it acceptable to maintain the status of a country fixed as either a net receiver or a net sender of international migrants? If not, what criteria could be used to modify that status over the projection period? 114. In terms of methodology, are there important considerations that should be taken into account? Are there specific methods that we ought to consider? 115. Regarding the illustrative scenarios proposed, which are the most useful? Should any be dropped or added? 116. Lastly, suggestions about the data outputs that would best be suited for further use and evaluation of the projection results are welcome.
F. BIBLIOGRAPHY
Bongaarts, John and Rodolfo A. Bulatao, eds. (2000). Beyond Six Billion: Forecasting the
World’s Population. Washington, D.C.: National Academy Press. Bongaarts, John, and Susan C. Watkins (1996). Social interactions and contemporary fertility
transitions. Population and Development Review, vol. 22, No. 4, pp. 639-682 Bulatao, Rodolfo A., and John B. Casterline, eds. (2001). Global Fertility Transition. Population
and Development Review, vol. 27 (Supplement).
Booth, Heather, John Maindonald and Len Smith (2001). Age-time interactions in mortality projection: Applying Lee-Carter to Australia. Working Papers in Demography. No. 85. August 2001. The Australian National University. Canberra, Australia.

38
Carter, Lawrence R. and Ronald D. Lee (1992). Modeling and forecasting U.S. sex differentials in mortality. International Journal of Forecasting, Special Issue, Vol. 8, No. 3, Nov 1992, pp. 393-411. Amsterdam, Netherlands.
Carter, Lawrence R. and Alexia Prskawetz (2001). Examining structural shifts in mortality using the Lee-Carter method. MPIDR Working Paper, WP 2001-007. March 2001. Max Planck Institute for Demographic Research, Rostock, Germany.
Caselli, Graziella and Jacques Vallin (2001). Demographic trends: beyond the limits?, Population, vol. 13, No. 1, pp. 41-74.
Casterline, John B. (2001a). The pace of fertility transition: National patterns in the second half of the twentieth century. Population and Development Review, vol. 27 (Supplement), pp. 53-59.
Casterline, John B. ed. (2001b). Diffusion Processes and Fertility Transition: Selected
Perspectives. Washington, D.C.: National Academy Press. Casterline, John B. (2001c). Diffusion processes and fertility transition: Introduction. In Diffusion
Processes and Fertility Transition: Selected Perspectives, John B. Casterline, ed. Washington, D.C.: National Academy Press, pp. 1-38.
Chenais, Jean-Claude (2000). Determinants of below-replacement fertility. Population Bulletin of
the United Nations, No. 40/41, 1999, pp. 126-136. Cleland, John (2001a). The effects of improved survival on fertility: A reassessment. Population
and Development Review, vol. 27 (Supplement), pp. 60-92. Cleland, John (2001b). Potatoes and pills: An overview of innovation-diffusion contributions to
explanations of fertility decline. In Diffusion Processes and Fertility Transition: Selected Perspectives, John B. Casterline, ed. Washington, D.C.: National Academy Press, pp. 39-65.
Cleland, John, and C. R. Wilson (1987). Demand theories of the fertility transition: An
iconoclastic view. Population Studies, vol. 41, No.1, pp. 5-30.
Horiuchi, Shiro and John R. Wilmoth (1995). The aging of mortality decline. Paper presented at the Annual Meeting of the Population Association of America, 6-8 April 1995, San Francisco, CA.
Horiuchi, Shiro and John R. Wilmoth (1998). Deceleration in the age pattern of mortality at older ages. Demography. Vol. 35, No. 4, pp. 391-412.
Lee, Ronald D. and Lawrence R. Carter (1992). Modeling and forecasting U.S. mortality. JASA: Journal of the American Statistical Association, Vol. 87, No. 419, Sep 1992, pp. 659-675. Alexandria, Virginia.
Lee, Ronald D. and Rafael Rofman (1994). Modelación y proyección de la mortalidad en Chile. [Modeling and projecting mortality in Chile.] Notas de Población, Vol. 22, No. 59, Jun 1994, pp.183-213. Santiago, Chile.

39
Lee, Ronald D., Lawrence Carter and Shripad Tuljapurkar (1995). Disaggregation in population forecasting: do we need it? And how to do it simply. Mathematical Population Studies, Vol. 5, No. 3, Jul 1995, pp. 217-234. Langhorne, Pennsylvania and Basel, Switzerland.
Lee, Ronald D. and T. Miller (2000). Assessing the performance of the Lee-Carter approach to modeling and forecasting mortality. Paper presented at the Annual Meeting of the Population Association of America, 23-25 March 2000, Los Angeles, CA.
Lee, Ronald (2002). Mortality forecasts and linear life expectancy trends. Paper presented the Workshop on Mortality, Lund, Sweden, 3-4 September 2002.
Lesthaeghe, Ron (1983). A century of demographic and cultural change in Western Europe: An
exploration of underlying dimensions. Population and Development Review, vol. 9, No. 3, pp. 411-435.
Lesthaeghe, Ron, and Paul Willems (1999). Is low fertility a temporary phenomenon in the
European Union? Population and Development Review, vol. 25, No. 2, pp.211.228. Lesthaeghe, Ron, and Camille Vanderhoeft (2001). A conceptualization of transitions to new
behavioral forms. In Diffusion Processes and Fertility Transition: Selected Perspectives, John B. Casterline, ed. Washington, D.C.: National Academy Press, pp. 240-264.
Lutz, Wolfgang, James W. Vaupel and Dennis A. Ahlburg, eds. (1998). Frontiers of Population Forecasting. Population and Development Review, Supplement to vol. 24.
Lutz, Wolfgang, Warren Sanderson and Sergei Scherbov (2001). The end of world population growth. Nature, vol. 412, pp. 543-545.
Oeppen, Jim and James W. Vaupel (2002). Broken limits to life expectancy. Science, vol. 296, pp. 1029-1031.
Tuljapurkar, S., Nan Li, and C. Boe (2000). A universal pattern of mortality decline in the G7 countries. Nature. Vol. 405, pp. 789-792.
Vaupel, James W. and Vladimir Canudas Romo (1999). How mortality improvement increases population growth. MPIDR Working Paper WP 1999-015.
Wilmoth, John (1993). Computational methods for fitting and extrapolating the Lee-Carter model of mortality change. Technical Report, Department of Demography, University of California, Berkeley.
40
III. QUESTIONNAIRE FOR EXPERTS
Please find below as set of questions that the Technical Working Group will address during its 30 June 2003 meeting. We would appreciate it if you would prepare your response to the Population Division working document along the lines of these questions. Please be as explicit with your answers as possible Please expand on the answers to those questions that you think are most critical for the preparation of long-range projections.
I. What is your outlook concerning the future of fertility over the next three centuries (300 years)?
A. Do you think that, in the long-run, fertility in the countries of the world will average
around two children per woman? B. Do you think that fertility will remain below-replacement level for lengthy periods in
the majority of countries of the world? C. Do you think that some countries that still have moderate to high fertility levels may
never experience below-replacement fertility? D. Do you think that fertility will converge to a similar level for all countries of the
world? E. Where do you envision the level of fertility to be for the world and its regions in
2300? F. Please comment on the rationale for the answers you provide. Which social,
economic, political, demographic or cultural trends or factors justify your opinions?
II. What is your outlook concerning the future of mortality over the next three centuries (300 years)?
A. Do you generally foresee that mortality will decline over the long-run? If so, explain
why. B. Do you think it likely that all countries might converge to similar levels of mortality? C. Are there reasons to believe that certain regions or groups of countries will lag
behind in mortality reductions? If so, describe the regions or countries and state the reasons.
D. Are there reasons to believe that certain regions or groups of countries will maintain a consistent lead in mortality reduction? If so, describe the regions or countries and state the reasons.
E. Do you think there is an ultimate limit to the life expectancy of a population? If yes, provide an estimate.
F. What do you think may be the highest life expectancy reached by a country in 2300? Provide an estimate.
G. In projecting mortality, what should be the guidelines regarding cross-overs, that is, projections where countries with a lower initial life expectancy overtake those with higher initial life expectancies in the long run?
H. Should the projections make allowance for possible reversals in the reduction of mortality? How?
I. Is it acceptable to consider that the rates of mortality reduction by age observed in developed countries in the recent past will remain constant over the long-term future?
J. Is it acceptable to apply the rates of mortality reduction by age observed in developed countries in the recent past to all developing countries without distinction? If not, what distinctions should be made?

41
III. What is your outlook concerning the future of international migration over the next three centuries (300 years)?
A. Is it acceptable to assume that the status of countries as net receivers or net senders
of international migrants will not change over the next three centuries? Why? B. Can you identify the countries or regions most likely to change status as net receivers
or net senders of international migrants? State which and provide some explanation as to why.
C. Should population size have some effect on the number of emigrants or immigrants a country is expected to have?
D. In general, do you expect the overall volume of international migration to increase, decrease or remain stable over the coming centuries? How about net immigration to more developed countries?
E. Would it be acceptable to assume that net migration will converge to zero in all countries over the long run? Why?
IV. What is your general outlook concerning the future of world population growth over the next three centuries (300 years)?
A. Do you see world population size stabilizing at or around a certain level? Please
provide a guess about the size it may stabilize at (or the size it may be at in 2300). B. Do you see world population size oscillating over relatively short-term cycles (say
50 years or less) around a certain size? Again, if this is your choice, please provide a size.
C. Do you see world population peaking and then declining? D. Do you think world population size will continue to rise over the next three
centuries?
V. Please comment on any other issue that we ought to consider in preparing long-range population projections to 2300.

42
Annexes
AGENDA
I. Opening of the Meeting
Long-range population projections: major issues
II. The Future of Fertility
François Pelletier A proposal for the projection of fertility
III. The Future of Mortality Thomas Buettner A proposal for the projection of mortality
IV. The Future of International Migration Cheryl Sawyer A proposal for the projection of international migration
V. Closing of the Meeting

43
LIST OF PARTICIPANTS
Mr. John Bongaarts Population Council Policy Research Division One Dag Hammarskjold Plaza New York, NY 10017 Email: [email protected] Mr. Joel Cohen Rockefeller University Laboratory of Populations 1230 York Avenue, Box 20 New York, NY 10021-6399 Email: [email protected] Mr. Paul Demeny Population Council One Dag Hammarskjold Plaza New York, NY 10017 Email: [email protected] Mr. Tim Dyson Development Studies Institute London School of Economics and Political Science Houghton Street, London, WC2A 2A United Kingdom Email: [email protected] Mr. Peter Johnson US Census Bureau International Programs Center Washington, DC 20233-8860 Email: [email protected] Mr. Nan Li Department of Sociology University of Victory Victoria, Canada Email: [email protected] Mr. John Long US Census Bureau Population Division Washington, DC 20233 Email: [email protected]
Mr. Jim Oeppen Department of Geography University of Cambridge Downing Place Cambridge CB2 3EN United Kingdom Email: [email protected] Mr. Virgilio Partida CONAPO Rancho Guadalupe 55 Col. Campestre Coyoacan C.P. 04938 Delegacion Coyoacan Distrito Federal, Mexico Email: [email protected] Mr. Michael Teitelbaum Alfred P Sloan Foundation 630 Fifth Avenue Suite 2550 New York, NY 10111 Email: [email protected] Mr. Laurent Toulemon Institut National d'Etudes Demographiques 133, Boulevard DAVOUT F - 75 980 PARIS Cedex 20 FRANCE Email: [email protected] Mr. Shripad Tuljapurkar Stanford University Department of Biological Sciences Herrin Labs 454 Stanford, CA 94305-5020 Email: [email protected] Mr. Peter Way US Census Bureau International Programs Center Washington, DC 20233 Email: [email protected]

44
Mr. Charles Westoff Princeton University Office of Population Research Wallace Hall Princeton, NJ 08544 Email: [email protected]
UNITED NATIONS SYSTEM
Headquarters
Population Division Mr. Joseph Chamie Director Mr. Larry Heligman Branch Chief Population Studies Branch Ms. Hania Zlotnik Branch Chief Demographic Analysis Branch
Mr. Thomas Buettner Population Affairs Officer Population Estimates and Projections Section Mr. Francois Pelletier Population Affairs Officer Population Estimates and Projections Section Ms. Cheryl Sawyer Population Affairs Officer Population Estimates and Projections Section
Division for Social Policy and Development
Mr. Robert Venne Associate Social Affairs Officer Office of the Director of the Social Integration Branch
Division for Sustainable Development Mr. Ralph Chipman Acting Chief Policy Integration and Analysis Branch
Statistics Division
Mrs. Mary Chamie Branch Chief Demographic and Social Statistics Branch
Ms. Grace Bediako Chief Demographic Statistics Section

45
Specialized Agencies, Funds and Programs
World Bank
Mr. Eduard Bos World Bank Population, Health and Nutrition 1818 H Street, NW Washington, DC 20433 Email: [email protected]
Other Intergovernmental Organizations
International Organization for Migration
Mr. Robert Paiva International Organization for Migration 122 East 42nd Street New York, NY 10168 Email: [email protected]
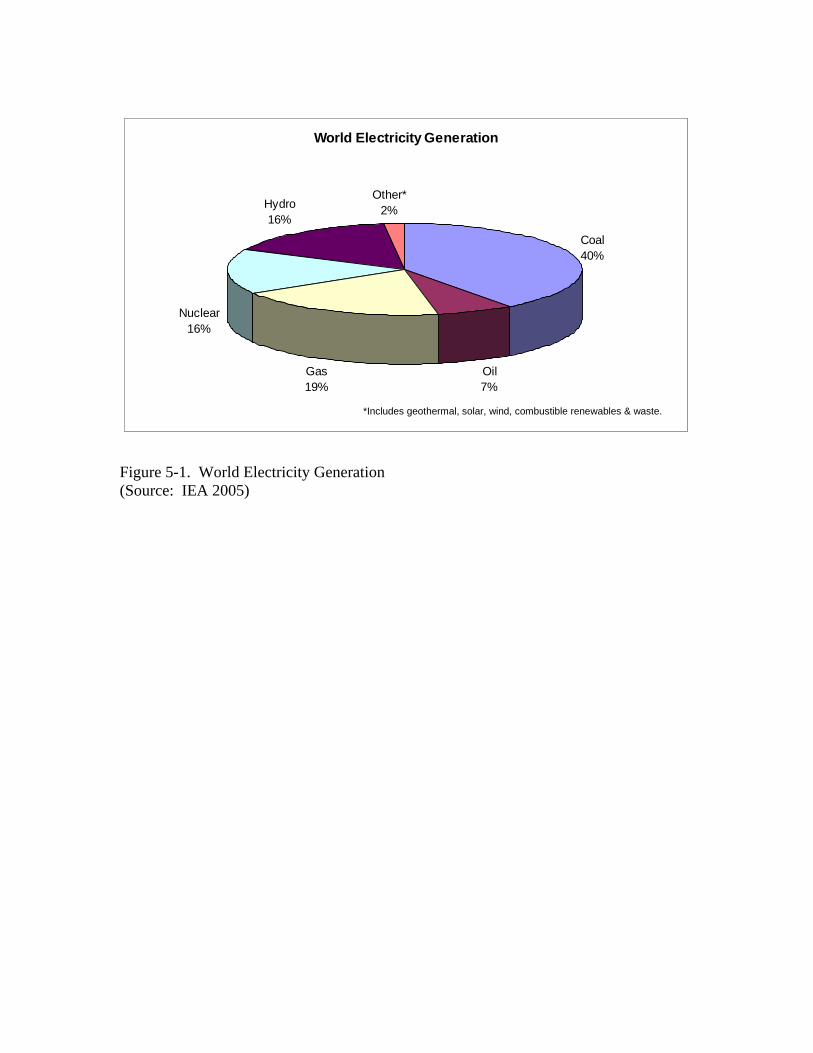
Figure 5-1. World Electricity Generation (Source: IEA 2005)
*Includes geothermal, solar, wind, combustible renewables & waste.
World Electricity Generation
Coal40%
Oil7%
Gas19%
Nuclear16%
Hydro16%
Other*2%
*Includes geothermal, solar, wind, combustible renewables & waste.*Includes geothermal, solar, wind, combustible renewables & waste.
World Electricity Generation
Coal40%
Oil7%
Gas19%
Nuclear16%
Hydro16%
Other*2%
*Includes geothermal, solar, wind, combustible renewables & waste.

Figure 5-2. World Primary Energy Supply (Source: IEA 2005)
World Primary Energy Supply
Coal24%
Oil34%
Gas21%
Other*1%
Combustible Renewables &
Waste11%
Nuclear7%
Hydro2%
*Includes geothermal, solar, wind, heat, etc.

Reactors Under Active Construction Worldwide
0 1 2 3 4 5 6 7 8
Argentina
Finland
Iran
Japan
Pakistan
Romania
Taiwan
China
Russia
India
Figure 5-12. Nuclear Reactors Under Construction (Source: World Nuclear Association http://www.world-nuclear.org/info/printable_information_papers/reactorsprint.htm )

As presentedCoal Crude Oil Pet Prod Gas Nuclear Hydro
Indigenous Prod. 2562.14 3782.87 0.00 2250.34 687.31 227.50Imports 475.24 2152.07 764.88 623.18 0.00 0.00Exports -466.97 -2048.64 -857.38 -619.54 0.00 0.00Stock Changes 13.16 -10.86 0.54 -9.84 0.00 0.00TPES 2583.57 3875.44 -91.96 2244.14 687.31 227.50
Intl. Marine Bunkers 0.00 0.00 -144.42 0.00 0.00 0.00Transfers 0.00 -121.73 135.49 0.00 0.00 0.00Statistical Diff. -33.56 -13.53 1.96 0.06 0.00 0.00Electricity Plants -1496.42 -20.18 -215.72 -468.60 -675.23 -227.50CHP Plants -186.79 -0.06 -36.82 -275.35 -12.08 0.00Heat Plants -73.50 -1.02 -16.37 -87.73 0.00 0.00Gas Works -11.87 0.00 -3.68 8.49 0.00 0.00Pet. Refineries 0.00 -3736.39 3704.52 0.00 0.00 0.00Coal Transf. -173.35 0.04 -2.67 -0.20 0.00 0.00Liquefaction Plants -17.45 8.72 0.00 -2.90 0.00 0.00Other Transf. 0.01 31.38 -29.95 -5.46 0.00 0.00Own Use -50.52 -9.64 -201.73 -198.06 0.00 0.00Distribution Losses -1.91 -3.63 -0.22 -22.47 0.00 0.00
-2045.36 -3866.04 3190.39 -1052.22 -687.31 -227.50538.21 9.40 3098.43 1191.92 0.00 0.00
TFC 538.20 9.40 3098.43 1191.93 0.00 0.00Industry Sector 409.62 9.02 607.80 539.94 0.00 0.00Transport Sector 5.50 0.01 1797.85 61.51 0.00 0.00Other Sectors 110.39 0.37 488.63 590.48 0.00 0.00Non–Energy Use 12.69 0.00 204.15 0.00 0.00 0.00
Coal Crude Oil Pet Prod Gas Nuclear HydroIndigenous Prod. 2562.14 3782.87 0.00 2250.34 687.31 227.50Imports 475.24 2152.07 764.88 623.18 0.00 0.00Exports -466.97 -2048.64 -857.38 -619.54 0.00 0.00Stock Changes 13.16 -10.86 0.54 -9.84 0.00 0.00TPES 2583.57 3875.44 -91.96 2244.14 687.31 227.50
Intl. Marine Bunkers 0.00 0.00 -144.42 0.00 0.00 0.00Transfers 0.00 -121.73 135.49 0.00 0.00 0.00Statistical Diff. -33.56 -13.53 1.96 0.06 0.00 0.00Electricity Plants -1496.42 -20.18 -215.72 -468.60 -675.23 -227.50CHP Plants -186.79 -0.06 -36.82 -275.35 -12.08 0.00Heat Plants -73.50 -1.02 -16.37 -87.73 0.00 0.00Gas Works -11.87 0.00 -3.68 8.49 0.00 0.00Pet. Refineries 0.00 -3736.39 3704.52 0.00 0.00 0.00Coal Transf. -173.35 0.04 -2.67 -0.20 0.00 0.00Liquefaction Plants -17.45 8.72 0.00 -2.90 0.00 0.00Other Transf. 0.01 31.38 -29.95 -5.46 0.00 0.00Own Use -50.52 -9.64 -201.73 -198.06 0.00 0.00Distribution Losses -1.91 -3.63 -0.22 -22.47 0.00 0.00

TFC 538.20 9.40 3098.43 1191.93 0.00 0.00Industry Sector 409.62 9.02 607.80 539.94 0.00 0.00Transport Sector 5.50 0.01 1797.85 61.51 0.00 0.00Other Sectors 110.39 0.37 488.63 590.48 0.00 0.00Non–Energy Use 12.69 0.00 204.15 0.00 0.00 0.00

Comb Ren Other Total1144.50 54.35 10709.01
1.44 46.86 4063.67-1.83 -47.17 -4041.53-1.00 0.00 -8.00
1143.11 54.04 10723.15
0.00 0.00 -144.420.00 0.00 13.760.09 0.10 -44.88
-35.38 1233.71 -1905.32-27.42 289.79 -248.73
-6.27 149.94 -34.950.00 0.00 -7.060.00 0.00 -31.870.00 0.00 -176.180.00 0.00 -11.63
-47.25 0.00 -51.27-4.84 -151.68 -616.470.00 -148.79 -177.02
-121.07 1373.07 -3436.041022.04 1427.11 7287.111022.05 1427.12 7287.13
162.82 596.50 2325.708.88 21.08 1894.83
850.35 809.54 2849.760.00 0.00 216.84
MtoeComb Ren Other Electricity Total p
1144.50 54.35 10709.01 35 1175.00 Electricity consumption1.44 46.86 4063.67 34 1192.00 Gas consumption
-1.83 -47.17 -4041.53 33 3108.00 Oil consumption-1.00 0.00 -8.00 32 538.00 Coal consumption
1143.11 54.04 10723.150.00
0.00 0.00 -144.420.00 0.00 13.760.09 0.10 -44.88
-35.38 0.00 1233.71 -1905.32-27.42 49.79 240.00 -248.73 300.47
-6.27 149.94 -34.950.00 0.00 -7.060.00 0.00 -31.870.00 0.00 -176.180.00 0.00 -11.63
-47.25 0.00 -51.27-4.84 -151.68 -616.470.00 -148.79 -177.02

1022.05 1427.12 7287.13162.82 596.50 2325.70
8.88 21.08 1894.83850.35 809.54 2849.76
0.00 0.00 216.84

n

Key World Energy Statistics 2005
p. 24 p. 24 p. 28 p.29
2003 2003 2003Consumption Consump
TWh Mtoe MtoeCoal 6,681 40.1% 470 7.4% 539 50.0%Oil 1,150 6.9% 81 42.6% 3,104 1.1%Gas 3,232 19.4% 228 16.4% 1,195 15.7%Nuclear 2,632 15.8% 185 - 22.6%Hydro 2,649 15.9% 187 0.0% - 7.6%Other* 317 1.9% 22 3.5% 255 3.1%Electricity - 16.1% 1,173 Comb Ren - 14.0% 1,020
16,661 100.0% 1,173 69.9% 7287 100.0%
http://www.iea.org/Textbase/stats/electricitydata.asp?country=World&COUNTRY_LONG_NAME=World2003 2003
Unit: GWh GWh MtoeProduction from:- coal 6681339 574.5952- oil 1151729 99.04869- gas 3224699 277.3241- biomass 138207 11.8858- waste 62493 5.374398- nuclear 2635349 226.64- hydro 2725824 234.4209- geothermal 53735 4.62121- solar PV 555 0.04773- solar thermal 548 0.047128- other sources 67406 5.796916Total Electricity Production 16741884 1439.802Imports 544790 46.85194Exports -548399 -47.16231Domestic Supply 16738275 1439.492Statistical Differences 153 0.013158Total Transformation** 4230 0.36378Heat Plants 4230 0.36378Energy Sector* 1554632 133.6984Distribution Losses 1514826 130.275Total Final Consumption 13664740 1175.168Industry 5768540 496.0944Transport 244134 20.99552

Agriculture 0 0Commercial and Public Services 0 0Residential 0 0Other Non-Specified 7652066 658.0777
* Energy Sector also includes own use by plant and electricity used for pumped storage.** Transformation sector includes electricity used by heat pumps and electricity used by electric boilers.

p. 37
2003
Mtoe1,496.42
31.75 468.60 675.23 227.50
94.09
2,993.59
1534 1,234 1173 1,474
361 240
World Electricity Generation
Coal40%
Oil7%
Gas19%
Nuclear16%
Hydro16%
Other*2%
*Includes geothermal, solar, wind, combustible renewables & waste


Coal40%
& waste.

p. 6 MtoeCoal 24.4% 2,581 Oil 34.4% 3,639 Gas 21.2% 2,243 Nuclear 6.5% 688 Hydro 2.2% 233 Combustible Renewables & Waste 10.8% 1,143 Other* 0.5% 53
10,579 10,579
Gas21%
Hydro2%
Nuclear7%
CombRenewab
1

World Primary Energy Supply
Coal24%
Oil34%
Gas21%
Other*1%Hydro
2%
lear%
Combustible Renewables & Waste
11%

billion kWh % e No. MWe No. MWe No. MWe
Argentina 6.4 6.9 2 935 1 692 0 0Armenia 2.5 43 1 376 0 0 0 0Belgium 45.3 56 7 5728 0 0 0 0Brazil 9.9 2.5 2 1901 0 0 1 1245Bulgaria 17.3 44 4 2722 0 0 2 1900Canada* 86.8 15 18 12,595 2 1540 2 2000China 50.3 2 10 7587 5 4170 13 12,920Czech Republic 23.3 31 6 3472 0 0 0 0Egypt 0 0 0 0 0 0 0 0Finland 22.3 33 4 2696 1 1600 0 0France 430.9 79 59 63,473 0 0 1 1630Germany 154.6 31 17 20,303 0 0 0 0Hungary 13 37 4 1773 0 0 0 0India 15.7 2.8 16 3577 7 3088 0 0Indonesia 0 0 0 0 0 0 0 0Iran 0 0 0 0 1 915 2 1900Israel 0 0 0 0 0 0 0 0Japan 280.7 29 55 47,700 1 866 12 14,782Kazakhstan 0 0 0 0 0 0 0 0Korea DPR (North) 0 0 0 0 0 0 1 950Korea RO (South) 139.3 45 20 16,840 0 0 8 9200Lithuania 10.3 70 1 1185 0 0 0 0Mexico 10.8 5 2 1310 0 0 0 0Netherlands 3.8 3.9 1 452 0 0 0 0Pakistan 1.9 2.8 2 425 1 300 0 0Romania 5.1 8.6 1 655 1 655 0 0Russia 137.3 16 31 21,743 5 4550 2 1850Slovakia 16.3 56 6 2472 0 0 0 0Slovenia 5.6 42 1 676 0 0 0 0South Africa 12.2 5.5 2 1842 0 0 1 165Spain 54.7 20 8 7442 0 0 0 0Sweden 69.5 45 10 8975 0 0 0 0Switzerland 22.1 32 5 3220 0 0 0 0Turkey 0 0 0 0 0 0 3 4500Taiwan 6 4884 2 2600Ukraine 83.3 49 15 13,168 0 0 2 1900United Kingdom 75.2 20 23 11,852 0 0 0 0USA 780.5 19 103 98,054 1 1065 2 2716Vietnam 0 0 0 0 0 0 0 0WORLD** 2626 16 442 370,033 28 22,041 52 57,658
2586.9 442 370033 28 22041 52 57658
NUCLEAR ELECTRICITY GENERATION
REACTORS OPERABLE
REACTORS under CONSTRUCTION REACTORS PLANNED
2005 Aug-06 Aug-06 Aug-06

billion kWh % e No. MWe No. MWe No. MWe
Sources:
Reactor data: WNA to 15/8/06.IAEA - for nuclear electricity production & percentage of electricity (% e) 5/06.WNA: Global Nuclear Fuel Market (reference scenario) - for U.
Operating = Connected to the grid.Building/Construction = first concrete for reactor poured, or major refurbishment under way.Planned = Approvals and funding in place, or construction well advanced but suspended indefinitely.Proposed = clear intention but still without funding and/or approvals.TWh = Terawatt-hours (billion kilowatt-hours), MWe = Megawatt net (electrical as distinct from thermal), kWh = ki
NB: 65,478 tU = 77,218 t U3O8
* In Canada, 'construction' figure is 2 laid-up Bruce A reactors.
** The world total includes 6 reactors on Taiwan with a combined capacity of 4884 MWe, which generated a total
See also: WANO map (PDF, 1.5 MB)
Armenia 0Belgium 0Brazil 0Bulgaria 0Czech Republic 0Egypt 0France 0Germany 0Hungary 0
NUCLEAR ELECTRICITY
GENERATION 2005
REACTORS OPERATING REACTORS BUILDING ON ORDER or
PLANNED

Indonesia 0Israel 0Kazakhstan 0Korea DPR (North) 0Korea RO (South) 0Lithuania 0Mexico 0Netherlands 0Slovakia 0Slovenia 0South Africa 0Spain 0Sweden 0Switzerland 0Turkey 0Ukraine 0United Kingdom 0Vietnam 0USA 0Canada* 0Argentina 1Finland 1Iran 1Japan 1Pakistan 1Romania 1Taiwan 2China 5Russia 5India 7WORLD** 25
Reactors Under Active Con
0 1 2 3
Argentina
Finland
Iran
Japan
Pakistan
Romania
Taiwan
China
Russia
India

URANIUM REQUIRED
2006No. MWe tonnes U
0 0 1341 1000 510 0 10750 0 3360 0 2530 0 1635
50 35,880 12942 1900 5401 600 00 0 4731 1600 10,1460 0 34580 0 251
24 13,160 13344 4000 03 2850 01 1200 00 0 81691 300 00 0 00 0 30371 1000 1342 2000 2560 0 1122 1200 643 1995 1768 9375 34392 840 3560 0 144
24 4000 3290 0 15050 0 14350 0 5750 0 0
0 0 19880 0 2158
21 24,000 19,7152 2000 0
152 107,300 65,478153 108900
REACTORS PROPOSED
Aug-06

No. MWe tonnes U
URANIUM REQUIRED
ilowatt-hour.
of 38.4 billion kWh in 2005 (accounting for 20% of Taiwan's total electricity generation). Taiwan has two
PROPOSED

Construction Worldwide
4 5 6 7 8


o reactors under construction with a combined capacity of 2600 MWe.

Supply KnownPrice (US$/kgU) $80.00 $160.00Price (US$/lbU3O8) $30.77 $61.54
(1,000 t)Australia 863Kazakhstan 472Canada 437S. Africa 298Namibia 235Brazil 197Russia 131US 104Uzbekistan 103Other 267TOTAL 3107 30000Source: www.world-nuclear.org

1
Chapter 5

2

3

4

5
252 5-25 OMB Sec 5.5 2nd para The two principal approaches for confining the fusion reaction are magnetic and inertial. Magnetic fusion relies on magnetic forces to confine the charged particles of the hot plasma fuel for sustained periods of fusion energy production. Inertial fusion relies on intense lasers, x-rays, or particle beams to rapidly compress a pellet of fuel to the point where fusion occurs, yielding a burst of energy that would be repeated to produce sustained energy production. New text: Fusion power generation offers a number of advantageous features. The basic sources of fusion fuel, deuterium and tritium, are actually heavy forms of hydrogen. Deuterium is abundantly available since it occurs naturally in water, and tritium can be derived from lithium, a light metal found in the earth’s crust. Tritium is radioactive, but the quantities in use at any given time are quite modest and can be safely handled. There are no chemical pollutants or carbon dioxide emissions from the fusion process. With appropriate advances in materials, the radioactivity of the fusion byproducts would be relatively short-lived, thereby obviating the need for extensive waste management measures. From a safety perspective, the fusion process poses little radiation risk to anyone outside the facility. Also, since only a small quantity of fuel is in the fusion system at any given time, there is no risk of a criticality accident or meltdown and little after heat to be managed in the event of an accident. The potential usefulness of fusion systems is great, but many scientific and technical challenges remain. COMMENT: As stated last year in multiple e-mails between OMB, OSTP, and DOE, inertial fusion is not being pursued for energy applications and so it’s inclusion in this plan runs Deleted text highlighted
yes
253 5-26 State Dept Last para before 5.5 However, it is highly toxic radioactive for many
Not fusion issue

6
254 5-26 OMB 1st para Also, the cost of fusion electricity is likely to could be comparable to other environmentally responsible sources of electricity generation. Deleted text highlighted Insert text COMMENT These are dubious estimates at best. They have no idea what the regulatory & commercial landscape will be in 30 years.
yes
255 5-26 OMB 2nd para The following are some Two of the major scientific questions that need to be answered Deleted text highlighted Insert text
yes
256 5-26 DOE/BER 1st bullet: It seems a stretch to call supporting resolution of technical, institutional, and regulatory barriers as a “Future Research Direction”. Say what research is needed, if any, to overcome such barriers. If no research is needed, suggest moving this bullet to a different part of section 5.4 in the chapter.
no Just leave it as it was; move, if necessary and appropriate.
257 5-26 DOE/BER 3rd bullet: Same comment as above applies here also. What research is needed to enable finalization and NRC certification of the designs.
no Just leave it as it was; move, if necessary and appropriate.
258 5-26 OMB 2nd para, 2nd bullet How can radically new materials that will withstand the temperatures and forces needed for commercial fusion power be constructed? To what extent…. Deleted text highlighted COMMENT Fusion-only materials studies are also not to be a focus of the program.
no As Congress is seeming to act to restore the materials program to Fusion, FES does not agree with this COMMENT
259 5-26 OMB 3rd para yes
7
….. that are typical of a star must eventually be ……. over several decades. Fusion researchers can now define the specific challenges that must be overcome, see promising approaches to addressing those challenges, and confidently anticipate the availability of even more powerful computational and experimental measurement capabilities. Insert text Deleted text highlightedyes COMMENT: Cheerleading isn’t appropriate for such documents.
260 5-26 OMB Sec 5.5.2 1st para ……..explores a variety of magnetic and inertial confinement approaches and leads to the most promising commercial fusion concept from a technical standpoint. ----continuing……… To ensure the highest possible scientific return on limited resources, the DOE’s Fusion Energy Sciences program will extensively ------- continuing…… Large-scale experimental facilities will likely be necessary to test approaches for self-heated (burning) fusion plasmas, for inertial fusion experiments, and for testing materials and components under extreme conditions. Where appropriate, and the rewards, risks, and costs of these major facilities will need to be shared through international collaborations. The overall Fusion Energy Sciences effort will be organized around a set of four three broad goals. Deleted text highlighted Insert text
yes
261 5-26 OMB Sec 5.5.2, 2nd para The strategy includes the following areas of emphasis: Deleted text highlighted Delete the “s” on areas
yes

8
262 5-27 State Dept Remove 2nd bullet from 2nd para yes 263 5-27 OMB In sec 5.5.2, 2nd para,
Delete 2nd bullet Change to (no bullet) Fusion Energy Sciences Goal #2: Develop a fundamental understanding of plasma behavior sufficient to provide a reliable predictive capability for fusion energy systems. Basic research is required in turbulence and transport, nonlinear behavior and overall stability of confined plasmas, interactions of waves and particles in plasmas, the physics occurring at the wall-plasma interface, and the physics of intense ion beam plasmas. The strategy includes the following areas of emphasis:
yes
264 5-27 OMB 2nd para Fusion Energy Sciences Goal #3: Determine the most promising approaches and configurations to confining hot plasmas for practical fusion energy systems. Both magnetic and inertial confinement approaches to fusion have potential for practical fusion-energy-producing systems. Within each of these two broad approaches, there are many possible configurations and designs for practical fusion systems, almost certainly including some yet to be conceived. The strategy includes the following areas of emphasis: Deleted text highlighted
yes
265 5-27 OMB 2nd para, 1-5 bullets Continue vigorous investigation of both magnetic and inertial
confinement approaches Explore through experiments and advanced simulation and
modeling, innovative magnetic confinement configurations, such as the National Spherical Torus Experiment (NSTX) at Princeton Plasma Physics Laboratory (PPPL) and a planned compact stellarator experiment, as well as smaller experiments at multiple sites
COMMENTS: QPS has not been requested or approved for construction.
Second bullet
deletion is incorrect
As Congress seems to be restoring
the materials
program to Fusion, FES
“and a planned compact stellarator experiment, the National Compact Stellarator Experiment (NCSX) at PPPL.”
The COMMENT mistakenly associates the ‘planned compact stellarator experiment’ with QPS, an unapproved proposal, while the reference, now more completely written out, refers to an ongoing, approved project, NCSX.
As Congress seems

9
Explore heavy ion beams, dense plasma beams, lasers, or other innovative approaches (e.g., fast ignition) to produce high-energy density plasmas for potential applications to inertial fusion energy
Support research in high-energy density physics in coordination with other Federal agencies
Provide definitive data on inertial fusion target physics from the NIF, along with other experiments and simulations in the United States Fusion Energy Sciences Goal #4: Develop the new materials, components, and technologies necessary to make fusion energy a reality. The environment created in a fusion reactor poses great challenges to materials and components. Materials must be able to withstand high fluxes of high-energy neutrons and endure high temperatures and high thermal gradients, with minimal degradation. The strategy includes the following areas of emphasis: Deleted text highlighted
disagrees with the
deletion of Goal #4
to be restoring the materials program to Fusion, FES disagrees with the deletion of Goal #4
266 5-28 DOE/BER 1st para, 1st sentence: It seems odd to read that the U.S. will employ a portfolio strategy to explore different fusion energy concepts. Such a strategy has been employed in fusion energy research by the U.S. for the past 30+ years.
Yes, with change as
noted
“will employ” would be better said as “will continue to employ”
267 5-28 OMB 5th para A modest scale IFE high energy density physics program is also underway with an emphasis on using heavy ion drivers to explore plasma/beam dynamics and potential applications to high energy density physics and future inertial energy systems. This program also explores innovative approaches to improving inertial fusion energy such as the fast ignition experiments. In addition, inertial fusion energy high energy density research benefits from existing experimental programs conducted for NNSA’s Deleted text highlighted Insert text
yes
268 5-28 OMB Sec 5.5.4 Major investments in fusion materials, components and technologies for MFE and IFE are contingent upon favorable results from ITER.
yes

10
and NIF, respectively. With such favorable results, and favorable results from the accompanying scientific programs, a selection could be made in the 2020 time frame between the MFE and IFE approaches. A schematic indication of the overlapping sequence of research and technology development activities for either approach is shown in Figure 5-14. Deleted text highlighted Insert text
269 5-28 OMB Delete graphic Figure 5-14
yes
270 5-29 OMB 1st para Burning plasmas represents the next major science and technology frontier for fusion research. In the major international effort mentioned above (ITER), the United States, Europe, Japan, China, Russia, and……. COMMENTS Including this figure is an explicit endorsement of the FESAC report that has been rejected by OSTP and OMB.
yes
271 5-29 OMB 2nd para In other efforts, the United States is proceeding with inertial fusion through the development of the NIF and other fusion energy work including driver, target fabrication and chamber technologies. The drivers include lasers, pulsed power driven z-pinches, and heavy ion accelerators. Efforts to explore the understanding and predictability of high energy density plasma physics, including the ramifications for energy-producing applications, are also underway The Nation’s large investment in inertial fusion for defense purposes has created the potential for developing it as a power source with relatively modest initial investments. However, any substantial additional investment in this the inertial fusion energy approach awaits successful demonstration of Deleted text highlighted
yes
272 5-29 OMB Sec 5.5.4, 2nd para yes

11
COMMENT: Including this figure is an explicit endorsement of the FESAC report that has been rejected by OSTP and OMB.
273 5-29 OSTP bullet #2 from the top: Delete ", the National Spherical Torus Experient (NSTX) at Princeton Plasma Physics Laboratory (PPPL) and".
If purely stylistic, yes;
if substantive,
no
If this is meant as a substantive deletion, then, as NSTX is a central feature of the fusion program, FES disagrees.
274 5-29 State Dept Missing various period at the end of sentences. Sec 5.5.3 Delete the extra spaces before item 1
yes
275 5-30 OMB 4th from the last reference: U.S. Department of Energy (DOE). 2003b. A plan for the development of fusion energy. DOE/SC-0074. Washington, DC: U.S. Department of Energy. http://www.ofes.fusion.doe.gov/More_HTML/FESAC/DevReport.pdf.. Deleted text highlighted COMMENT OSTP and OMB haven’t accepted the implications for the expansive program beyond ITER that this advisory committee (NOT DOE!) study promotes.
yes
276 5-30 State Dept 2nd to last para
Both the “Z” experiment at Sandia National Laboratories and the OMEGA
yes
277 5-31 State Dept Sec 5.5.4 3rd para
Prior to ITER operation in about 2014 (? Is too ambitious? ), experiments on a wide range of plasma
no No, “about 2014” is the current plan.
12
278 5-33 State Dept REFERENCES Energy Information Administration (EIA). 20042005. Annual energy outlook 20042005: with projections to 2025, DOE/EIA-0383(20042005). Washington, DC: U.S. Department of Energy. http://www.eia.doe.gov/oiaf/aeo/pdf/0383(2005).pdf U.S. Department of Energy (DOE). 2003a2005. Hydrogen fuel cells and infrastructure technologies multi-year research, development and demonstration plan, 2003-2010. Washington, DC: U.S. Department of Energy. http://www.eere.energy.gov/hydrogenandfuelcells/mypp/. U.S. Department of Energy (DOE). 2003b2003. A plan for the development of fusion energy. DOE/SC-0074. Washington, DC: U.S. Department of Energy. http://www.ofes.fusion.doe.gov/More_HTML/FESAC/DevReport.pdf.
yes
Chapter 6

13

14

15

16

17

18

19

20

21

22
* Page numbers refer to those in the June 2005 version.

1
CCTP Proposed Disposition of Comments on CCTP Strategic Plan Dated June 2005
Com-ment No.
Doc. Page No. *
Commenter Comments and Suggested Changes
Suggested Change
Accepted?
Suggested Change Accepted
with Modifications, as Shown Below
Suggested Change Was Not Accepted, with Explanation as
Shown Below
General Comments
1 NA USGS Include an executive summary.
2 NA DOE/BER Overall, the document is comprehensive in terms of the including all the relevant areas and challenges toward reducing emissions and eventually stabilizing greenhouse gas concentrations in the atmosphere. The document however falls short of laying out a clear plan and strategy to address the challenge of human-induced climate change. In fact, it’s not apparent whether the document is intended to be a technology RD&D plan or more than this. The introduction identifies what the CCTP is but it doesn’t say what the CCTP Strategic Plan is. This needs to be fixed because readers need to understand the context and content of the subsequent nine chapters in the plan.
3 NA DOE/BER Also, no clear strategy emerges from reading the chapter sections entitled “Technology Strategy.” These sections of the document are not consistent in terms of format, style or content. Some focus on technology needs and challenges, some on R&D needs, and others are a mix of both. Somewhere in the Introduction to the document, there should be a clear statement as to what “strategy” means in the context of this plan and what is meant by “Technology Strategy in Chapters 4 through 9 of the document, i.e., in the context of this CCTP plan, technology strategy means…. This will avoid raising the expectation of readers to look for more than is contained in Chapters 4 through 9 of the plan.
4 NA DOE/BER The introductory material in the first three chapters of the plan is much too long. Readers have to wade through almost 40 pages of text before coming to the part that deals climate change mitigation technologies and the RD&D that will be required. The scenarios chapter (Chapter 3) is longer than it needs to be to make the points

2
Com-ment No.
Doc. Page No. *
Commenter Comments and Suggested Changes
Suggested Change
Accepted?
Suggested Change Accepted
with Modifications, as Shown Below
Suggested Change Was Not Accepted, with Explanation as
Shown Below about the challenges ahead and why RD&D is essential to address the challenges. This chapter should either be substantially shortened or moved to the appendix of the document. The major points in the chapter can be made much more succinctly.
5 NA DOE/BER In many cases, the “current portfolio sections of the chapters are relatively uninformative. These sections should not only lay out the scope of R&D in the current portfolio and what’s expected from it and when. The sections on Possible Research Directions would then flow more logically and consistently from the sections of the technology chapters (Chapters 4-8) by addressing what the needs would be to fill gaps, shortcomings, etc. It is doubtful most readers will refer to the websites for more information. Hence, the current portfolio sections should capture the current efforts, rather than relying on readers to search for essential information on cited websites.
6 NA OSTP A compilation of all the programs and activities that are already being done does not constitute a strategic plan. The use of the term "strategic plan" usually means more than an inventory or possible contribution areas, current activities, and potential directions. There is very little in the document that shows any type of prioritization of current or future activities or role assignments to the various agencies (i.e., How does this feed into developing budget requests?), which is what would be expected, at least at a high level, of a strategic plan.
7 NA OSTP The document is too long by at least 50%. A Strategic Plan should say what's going to be done and who's going to do it. This document spends too many pages talking ABOUT important topics instead of describing what's going to be done about it. This kind of "laundry list" planning is difficult to handle. An Executive Summary should state in brief and specific language what the CCTP intends to accomplish over the next 5 or 10 years, e.g., describe the top priorities in a budget-stressed environment.
8 NA DOE/FE We have reviewed this plan and believe that it ready for review at higher levels.
9 NA ONR (DOD) How will the SP address strategy development integratively across agencies

3
Com-ment No.
Doc. Page No. *
Commenter Comments and Suggested Changes
Suggested Change
Accepted?
Suggested Change Accepted
with Modifications, as Shown Below
Suggested Change Was Not Accepted, with Explanation as
Shown Below in areas, say, like clean fuels? The SP notes the importance of clean fuels, but does not actually layout an integrative strategy for capturing all the facets of ongoing work and moving forward cohesively on a coherent clean fuels strategy. It is agreed that the SP provides a framework for starting that, but stops short of actually explaining how such strategies will be developed. It was felt there should be something in the Introduction about how this is expected to unfold, across all the players.
10 NA ONR (DOD) Regarding "metrics" for measuring benefits and progress, could CCTP benefit from recent work done by NAS for CCSP along this vein? (will be sending CCTP materials to review).
11 NA ONR (DOD) Regarding the role of that non-CC mission work (such as that at DoD) plays in supporting CC strategy, it might be useful to acknowledge that much of the R&D relevant to CCTP is motivated for other, non-CC, mission-oriented reasons, but that it is in the enlightended self-interest of these agencies to participate in CCTP -- to exchange data, avoid duplication, leverage resources, and enhance internal strategy formulation, etc.
12 NA ONR (DOD) There is an absence of a strategic goal on "adaptation", and perhaps another on "reducing radiative forcing via alterative means" (i.e., geo-engineering, albedo modification, etc.).
13 NA ONR (DOD) The SP lacks a plan of action with milestones for accomplishment.
Comments on Letter to the Reader 14 LtR OSTP Bodman-Gutierrez-Marburger Letter, paragraph 3, last sentence:
Delete "sound". Replace "strategy" with "strategic plan".
15 LtR State Dept 2nd para This Plan takes a century-long look at the nature of the climate change challenge and the potential for technological solutions across a range of uncertainties. Deleted: As a signatory to the United Nations Framework Convention on Climate Change (UNFCCC), the United States shares with many countries its ultimate goal: stabilization of greenhouse gas

4
Com-ment No.
Doc. Page No. *
Commenter Comments and Suggested Changes
Suggested Change
Accepted?
Suggested Change Accepted
with Modifications, as Shown Below
Suggested Change Was Not Accepted, with Explanation as
Shown Below (GHG) concentrations in the Earth’s atmosphere at a level that prevents dangerous interference with the climate system.
16 LtR 3rd para…..This Plan articulates a vision of the role for advanced technology in addressing climate change, defines a supporting mission for the multi-agency CCTP….. Delete: articulates
Chapter 1 17 Gener
al ONR (DOD) How will the SP address strategy development integratively across
agencies in areas, say, like clean fuels? The SP notes the importance of clean fuels, but does not actually layout an integrative strategy for capturing all the facets of ongoing work and moving forward cohesively on a coherent clean fuels strategy. There should be something in the Introduction about how this is expected to unfold, across all the players.
18 p. 1-1 and
General
EERE In the time since the last version I saw, the text reduces discussion and minimizes significance of climate change in several places. For example, in Chapter 1, p.1, pgh 2, a sentence now reads: "Should global climate change become a major long-term environmental challenge, solutions would likely require changes in the way the world produces and uses energy ..." This is an important change from the 2004 version, which read: "Should global climate change become a major long-term environmental challenge, solutions would likely require fundamental changes in the way the world produces and uses energy ..."
More broadly, significant portions of the discussion of climate issues and their significance that were in the 2004 draft have simply been deleted from the current draft. For example, the 2004 Version sections 1.1 "The Climate Change Challenge" and 1.2 "Economic Growth and Energy Demand" have been deleted, and Section 1.3 "The Role of Technology" has been sharply reduced, although some elements were moved to chapter 3. These changes significantly reduce and dilute the discussion of climate change issues and
5
Com-ment No.
Doc. Page No. *
Commenter Comments and Suggested Changes
Suggested Change
Accepted?
Suggested Change Accepted
with Modifications, as Shown Below
Suggested Change Was Not Accepted, with Explanation as
Shown Below implications.
19 1-1 OSTP paragraph 2, first sentence: Replace "incomplete" with "being improved".
20 1-1 DOE/BER 2nd para: The parenthetical question “Should global climate change become a major long-term environmental challenge...” seems inconsistent with the Administrations position that climate change is already a challenge that has to be addressed. The Administration’s support for the UNFCCC seems to be an acknowledgement of that.
21 1-1 OSTP paragraph 2, last sentence: "Should global climate change become a major long-term environmental challenge, solutions would likely require..." does not reflect the Administration's commitment to climate change as a serious issue meriting the very substantial investments we are making in understanding and finding ways to mitigate future climate change. The Washington Post, in an article on June 17, 2005, on page A-1, claims that the USG has accepted the following language for the G-8 document on climate change: "Climate change is a serious long term challenge that has the potential to affect every part of the globe." Please verify if this is approved language, and if it is, then substitute for the above. Alternately, you may use the following statement: "Climate change is a serious long term issue, requiring sustained action over many generations by both developed and developing countries. Developing innovative technologies that are cleaner and more efficient is the key to addressing our climate challenge."
22 1-1 NOAA 2nd para Although the scientific understanding of climate change continues to evolve, the potential ramifications of increasing accumulations of carbon dioxide Delete “is incomplete”
23 1-1 State Dept 2nd para…. The United States recognizes that m Meeting this UNFCCC objective will require a long-term commitment and

6
Com-ment No.
Doc. Page No. *
Commenter Comments and Suggested Changes
Suggested Change
Accepted?
Suggested Change Accepted
with Modifications, as Shown Below
Suggested Change Was Not Accepted, with Explanation as
Shown Below international cooperation Deleted The United States recognizes that m
24 1-2 NOAA Sec 1.1 1st para ….technology development and, in partnership with others, aimed to stimulate American… Comment: Please give examples or specify “others” or delete the reference to “others
25 p. ? State Dept The UNFCCC was adopted by 157 countries in 1992; as of May 24, 2004, 189 Parties, including the European Economic Community, had ratified the UNFCCC. Changed November 17, 2003 to May 24, 2004 Changed 188 to 189
26 p. ? State Dept Last para…Greenhouse gases (GHGs) are gases in the Earth’s atmosphere that may affect the atmosphere’s energy balance and contribute to long-term climate change. The most important GHG that arises from human activities is carbon dioxide (CO2), resulting mainly from the oxidation of carbon-containing fuels, materials or feedstocks; cement manufacture; and other chemical and industrial processes. Other GHGs include methane (CH4)from landfills, mining, agricultural production, and natural gas systems; nitrous oxide (N2O) from industrial and agricultural activities; fluorine-containing halogenated substances (e.g., HFCs, PFCs); sulfur hexafluoride (SF6); and other GHGs from industrial sources. Gases falling under the purview of the Montreal Protocol are excluded from this definition of GHGs. Water vapor (H2O) is also a GHG Changed entire paragraph Greenhouse gases (GHGs) are those gaseous constituents of the atmosphere, both natural and anthropogenic, that absorb and emit radiation at specific wavelengths within the spectrum of infrared radiation emitted by the Earth’s surface, the atmosphere and clouds. This property causes the greenhouse effect. Water vapor, carbon dioxide (CO2), nitrous oxide (N2O), methane (CH4) and ozone (O3)

7
Com-ment No.
Doc. Page No. *
Commenter Comments and Suggested Changes
Suggested Change
Accepted?
Suggested Change Accepted
with Modifications, as Shown Below
Suggested Change Was Not Accepted, with Explanation as
Shown Below are the primary greenhouse gases in the Earth’s atmosphere. Moreover there are a number of entirely human-made greenhouse gases in the atmosphere, such as the halocarbons and other chlorine and bromine containing substances, dealt with under the Montreal Protocol. Beside CO2, N2O and CH4, the Kyoto Protocol deals with the greenhouse gases sulphur hexafluoride (SF6), hydrofluorocarbons (HFCs) and perfluorocarbons (PFCs). [Note: This is the IPCC definition of greenhouse gases.
27 1-2 State Dept 1st para…. primarily from considerations of population growth Deleted: . These projected increases result primarily from considerations of population growth
28 1-2 State 1st para …Addressing global climate change will require changes in the way the world produces and uses energy, as well as in many other GHG-emitting activities of industry, agriculture, land use and management. Deleted Should global climate change become a major long-term environmental challenge, solutions would likely will require changes in the way the world produces and uses energy, as well as in many other GHG-emitting activities of industry, agriculture, land use and management.
29 1-2 State Dept 2nd para…. will create are needed to finance investment in new technologies. Deleted: will create are needed to finance investment in new, climate-friendly technologies.
30 1-2 State Dept 4th para ….Replaced text: .Significant progress toward meeting climate goals can be facilitated over the course of the 21st century by Replaced: As ratified by the U.S. Senate and affirmed by President Bush, the UNFCCC and its ultimate objective form the long-term planning context for this Plan.
31 1-2 State Dept 4th para ..Significant progress toward meeting climate goals can be facilitated over the course of the 21st century by

8
Com-ment No.
Doc. Page No. *
Commenter Comments and Suggested Changes
Suggested Change
Accepted?
Suggested Change Accepted
with Modifications, as Shown Below
Suggested Change Was Not Accepted, with Explanation as
Shown Below Deleted: Significant progress toward meeting the UNFCCC’s ultimate objective climate goals can be facilitated
32 1-2 State Dept 5th para….. nature of this challenge, across a range of planning Deleted: nature of this UNFCCC challenge, across a range of planning
33 1-3 State Dept 1st para…. the this Presidential initiative signaled Deleted “the”, changed to “this”
34 1-3 State Dept 2nd para… In February (?) 2002, the President Changed text from January to February
35 1-3 State Dept 2nd para….3rd sentence… Change the entire text
36 1-3 NOAA Sec 1.1…2nd para …administrative control of climate change-related activities…. Delete “-“
37 1-3 OSTP Figure 1-1: In the Interagency Working Group on Climate Change Science and Technology, replace "Secretary" with "Executive Secretary". In the Climate Change Science Program, add "CEQ". In the Climate Change Technology Program, add "CEQ".
38 1-3 NOAA Figure-1. Cabinet-Level Committee on Climate Change Science and Technology Integration Delete one of the ones “1”
39 1-3 DOT The International box should reflect participation by DOT -- not relegate it to "other agencies". We play a significant role in International activities.
40 1-4 DOE/BER 1st para: Suggest replacing “impacts” with either “consequences” or “effects” in the 3rd sentence. Impacts has negative connotations (only adverse impacts), whereas consequences or effects is more neutral,

9
Com-ment No.
Doc. Page No. *
Commenter Comments and Suggested Changes
Suggested Change
Accepted?
Suggested Change Accepted
with Modifications, as Shown Below
Suggested Change Was Not Accepted, with Explanation as
Shown Below i.e., includes both negative (i.e., adverse) and positive (beneficial) consequences or effects.
41 1-4 State Dept 1st para… coordinating entity It is responsible for facilitating the development of a strategic approach to Federally supported research, integrated across the participating agencies.
42 1-4 NOAA 1st para CCSP is a comprehensive research program charged with investigating natural and human-induced changes in the Earth’s global environmental system; monitoring important climate parameters; predicting global change; and providing a sound scientific basis for national and international decisionmaking. Its principal aim is to improve understanding of climate change and its potential impacts. Inserted new text Deleted Its principal aim is to improve understanding of climate change and its potential impacts.
43 1-4 DOE/BER 2nd para: Insert “and modeling” after “understanding in the 4th sentence. Also insert “including its response to natural and human-induced forcing” after “system” in the same sentence.
44 1-4 NOAA 2nd para Insert “National Academics” before National Research Council (NRC)
45 1-4 DOE/BER 3rd para: Should be a footnote 14 at the end of the last sentence of the paragraph to support the statement about the amount of funds invested by the USG in climate change science. At the bottom of the page, add the URL to the FY 2004-2005 version of Our Changing Planet.
46 1-4 NOAA 3rd para… for guiding research in this area for guiding (insert the word) “Climate” research, delete the words in this area
47 1-4 OSTP paragraph 4: Omit paragraph

10
Com-ment No.
Doc. Page No. *
Commenter Comments and Suggested Changes
Suggested Change
Accepted?
Suggested Change Accepted
with Modifications, as Shown Below
Suggested Change Was Not Accepted, with Explanation as
Shown Below 48 1-4 NOAA Last line…INSERT text: Since that initial meeting, two additional
ministerial summits have been held, and the intergovernmental partnership has grown to nearly 60 nations, At the most recent meeting, Earth Observation Summit III in Brussels, a Ten Year Implementation Plan for the Global Earth Observation System of Systems (GEOSS) was adopted, and the intergovernmental Group on Earth Observations was established to begin implementation of the 2-, 6-, and 10- year targets identified in the plan. The U.S. contribution to GEOSS is the Integrated Earth Observation System (IEOS). In April 2005, The USG Committee on Environment and Natural Resources (CENR) released the Strategic Plan for the U.S. Integrated Earth Observation System (http://iwgeo.ssc.nasa.gov) that addresses the policy, technical, fiscal, and societal benefit components of this integrated system, and established the U.S. Group on Earth Observation (USGEO).
49 1-5 State Dept 1st para… Change all the numbers ( I, ii, iii, iv, v, ) to numbers (1, 2, 3, 4,5)
50 1-5 DOT under NASA, text should read "aviation equipment, operations, and infrastructure efficiency"
51 1-5 OE Add "Electric Grid and Infrastructure" to the selected examples of R&D listed under "DOE" (Table 1-1)
52 1-5 State Dept Sec 1-3, 4th para…The U.S. Climate Change Technology Program (CCTP) is —the technology counterpart to CCSP. It —is a multi-agency planning and coordinating entity, led by the Department of Energy. The CCTP’s principal aimed is to at accelerate accelerating the development of new and advanced technologies to address climate change. The CCTP It works with participating agencies (Table 1-1), provides strategic direction for the CCTP-related elements of the overall Federal R&D portfolio, and facilitates the coordinated Deleted text:
53 1-5 DOE/BER Table 1-1: The table is more than a list of the Federal agencies

11
Com-ment No.
Doc. Page No. *
Commenter Comments and Suggested Changes
Suggested Change
Accepted?
Suggested Change Accepted
with Modifications, as Shown Below
Suggested Change Was Not Accepted, with Explanation as
Shown Below participating in the CCTP. Suggest revising the table legend so it more accurately conveys the table’s content. Also, contrary to the heading of the second column of the table, many of the examples listed in the 2nd column don’t appear to be examples of technology R&D programs. They are simply topical areas, such as “basic research, basic energy sciences, and land, forest, and prairie management, health effects. The purpose of the table other than listing the CCTP agencies is unclear.
54 1-5 OE To Table 1-1 on page 1-5, add "Electric Grid and Infrastructure" to the selected examples of R&D listed under "DOE
55 1-6 State Dept Sec 1.3.1 1st para… toward UNFCCC meeting climate goals attainment, but also to reduce significantly the cost of such progress Deleted Text:
56 1-6 DOE/BER 2nd para, 2nd to last sentence: Suggest rewording the sentence as follows: CCSP progress will provide the information needed to guide and pace future decisions about climate change mitigation.
57 1-6 NOAA 3rd para …….foundation for insert “near-term and” future progress
58 1-6 NOAA 3rd para …… climate change will be better understood and the…… DELETED: reduced
Chapter 2 59 2-1 State Dept 1st para….. Within the context of the United Nations Framework
Convention on Climate Change (UNFCCC), the The CCTP Strategic Plan articulates a vision for the role of new and advanced technology in addressing Deleted Text
60 2-1 NOAA The Plan establishes six strategic goals and seven approaches to be pursued toward their attainment. As a means of realizing the vision,

12
Com-ment No.
Doc. Page No. *
Commenter Comments and Suggested Changes
Suggested Change
Accepted?
Suggested Change Accepted
with Modifications, as Shown Below
Suggested Change Was Not Accepted, with Explanation as
Shown Below 61 2-1 NOAA Sec 2.1CCTP aims to inspire broad interest,
hopes
62 2-1 NOAA Last Sentence…..activities needed to achieve the CCTP’s vision and strategic goals (CCTP Mission). advance the attainment of
63 2-1 NOAA Sec 2.2 Strategic Goals In the chapter headings for your goals, you use “reducing”, “capturing”, etc. However, in your statement of goals, you use “reduce”, “capture”, etc. We suggest chose one form and stick with it throughout the document.
64 2-1 State Dept Sec 2.2, 1st para… articulates The U.S.-ratified UNFCCC, affirmed by President Bush, provides an authoritative a planning context for CCTP Deleted Text
65 2-2 State Dept Two considerations arise from the UNFCCC this goal that are relevant to long-term R&D planning and guidance for technology development. First, the level of stabilized concentrations of GHGs in Earth’s atmosphere implied by the UNFCCC’s ultimate objective is not known and will likely remain for some time a key planning uncertainty Accordingly, CCTP’s strategic goals are not be based on any hypothesized level of stabilized GHG concentrations, but rather embrace a range of levels under conditions of uncertainty. Second, the UNFCCC’s ultimate objective of Deleted Text
66 2-2 OSTP Line 3: Grammar error. Footnote at the bottom of the page: Should indicate that the first sentence is UNFCCC's language (as quoted on page 3-2), not USG language. Otherwise, we invite the question of whether we are saying that the U.S. believes that we can entirely prevent dangerous anthropogenic interference with the climate system -- depends on who defines "dangerous." Also, Second sentence, change to read: "The CCSP's principal aim is to improve

13
Com-ment No.
Doc. Page No. *
Commenter Comments and Suggested Changes
Suggested Change
Accepted?
Suggested Change Accepted
with Modifications, as Shown Below
Suggested Change Was Not Accepted, with Explanation as
Shown Below understanding of climate change and its potential impacts, which will inform CCTP." Otherwise, not consistent with page 1-4 statement about CCSP and also makes it sound like CCSP's primary aim is to inform CCTP, which is not the case.
67 2-2 DOE/BER 1st para: The sentence beginning “Second, the UNFCCCs ultimate objective…” seems to infer or imply that achieving stabilization of GHG concentrations in the atmosphere can be done by more than just achieving a net balance between emissions and sinks. If there is any other way to do it, state how else it could be done. Otherwise, suggest rewording the sentence to avoid the misleading inference or implication. Also, in the last sentence, suggest inserting “the” before technological challenge and “to achieve stabilization” after it.
68 2-2 DOE/BER 2nd para, last sentence: Basic research should be expected to do more than “illuminate technical barriers”. Suggest replacing “illuminate” with “help overcome” or “resolve”.
69 2-2 State Dept Inserted para… Countries from all regions will also work to meet their climate objectives in the context of a number of other social goals, many of which will continue to have both immediate and urgent implications. For many developing countries the overriding goal will continue to be poverty reduction and economic development. All countries will continue to seek to ensure that energy sources are secure, affordable and reliable, and will also seek approaches that address other environmental concerns such as air pollution and conservation.
70 2-2 State Dept 3rd para…. In addressing such a these challenges, opportunities Deleted text
71 2-2 OSTP last paragraph, line 6: ...geothermal, nuclear, and solar power.
72 2-2 DOT The discussion at the top of the page rightly covers uncertainties in GHG levels. It misses uncertainties in understanding the most damaging GHG. Given that almost any technology to abate GHG will entail some tradeoffs amongst gases, keeping this uncertainty in mind is critical.

14
Com-ment No.
Doc. Page No. *
Commenter Comments and Suggested Changes
Suggested Change
Accepted?
Suggested Change Accepted
with Modifications, as Shown Below
Suggested Change Was Not Accepted, with Explanation as
Shown Below 73 2-3 DOE/BER 3rd para: Need to add a new sentence after the first sentence that in
effect says producing these feedstocks and materials can and does result in net emissions of GHGs.
74 2-3 NOAA Sec 2.2 1st bullet transportation systems, building___ equipment and envelopes, industrial combustion Delete “S”
75 2-3 NOAA Sec 2.2 2nd t bullet ….equipment would further raise system performance. Another example is storage technologies Insert “system”
76 2-4 State Dept 1st para…..Transforming fossil-fuel-based combustion systems into low-carbon or carbon-free energy processes would enable the continued use of the world’s plentiful coal resources. Such a transformation would require further development and application of technologies to capture CO2 and store it using safe and acceptable means, removing it permanently from the atmosphere (Note: Use of the world’s plentiful; coal resources will continue in any event). Deleted Text Inserted text
77 2-4 DOT The discussion at the top of the page rightly covers uncertainties in GHG levels. It misses uncertainties in understanding the most damaging GHG. The tradeoffs amongst gases need to be addressed. And, the discussion should not only cover the "warming potential", but also the lifetime in the atmosphere.
78 2-5 DOE/BER 2nd bullet: Insert “emissions of these” after “reduce”
79 2-5 DOE/BER 3rd bullet, last sentence: Does “strong GHGs” refer to the gases with a high GWP? If so, it needs to be stated for clarity.
80 2-6 DOE/BER 2nd bullet: “diffused” should be “diffuse”
81 2-6 OSTP 3rd bullet, last sentence: Climate Change Science Program and the U.S. Integrated Earth Observing System.
15
Com-ment No.
Doc. Page No. *
Commenter Comments and Suggested Changes
Suggested Change
Accepted?
Suggested Change Accepted
with Modifications, as Shown Below
Suggested Change Was Not Accepted, with Explanation as
Shown Below 82 2-6 DOT Basic research should also address future work force development
83 2-6 and 2-7
DOE/BER The distinction between fundamental research and strategic research is unclear. Is the latter meant to include research that is problem/mission driven, whereas the former is driven by other factors such as scientific curiosity? In the last sentence of the bullet on Fundamental Research, it seems unnecessary to say much of the knowledge from fundamental research is indirectly related to CCTP. Suggest deleting “Indirectly”
84 2-8 DOE/BER Approach 2: Need to be consistent is using basic research and fundamental research. Both are used here but it’s not clear whether they are intended to mean the same thing.
85 2-9 State Dept 1st para…….Leadership Forum (CSLF); the International international Methane to Markets Partnership; Replace I with i
86 2-9 OSTP first paragraph, last sentence: Are these bilateral partnerships those that pertain to international cooperation in climate change R&D or just all the U.S. bilateral partnerships? The statement is unclear.
87 2-9 OSTP first paragraph: Add sentence to end: In addition, the U.S. is a leader in the 58-member country Global Earth Observations System of Systems.
88 2-9 OSTP Approach 6, sentence 3: Delete "new, young".
89 2-9 DOE/BER Approach 6: In the last sentence, change “effects” to “efforts”
90 2-9 DOT This sentence "Technology demonstrations afford unique opportunities to reduce investment uncertainty by unveiling the parameters affecting a technology’s cost and operational performance, and the areas needing further improvement or cost reduction." is key. Should be rewritten in plain English -- the message is obscured in Government speak.
91 2-11 DOE/BER section 2.4.2 What does “within a set of screens for appropriateness means? Also, what is portfolio dilution? Suggest eliminating the

16
Com-ment No.
Doc. Page No. *
Commenter Comments and Suggested Changes
Suggested Change
Accepted?
Suggested Change Accepted
with Modifications, as Shown Below
Suggested Change Was Not Accepted, with Explanation as
Shown Below jargon.
92 2-11 DOE/BER section 2.4.3, 1st para: In the 2nd sentence, what does “identifying gaps refer to? Is it gaps in the portfolio or something else? How will the gaps be identified?
93 2-11 DOT The description of criteria is very vague and hard to apply. How exactly should the valuation be done? Who does it? How does one ensure that technologies are considered consistently?
94 2-12 DOE/BER 1st sentence: Text here refers to the CCTP portfolio of today and what it reflects yet on the previous page there is mention of doing an inventory of the portfolio in the future. This seems contradictory.
95 2-12 DOE/BER box 2-1 1st bullet: The second to last sentence refers to consideration of development and deployment risks. Are such risks known, and if not, how will uncertainty of risks be dealt with?
96 2-12 DOE/BER Last sentence before section 2.5 Management: Insert “and” after “developments”
Chapter 3 97 3-1 NOAA 2nd para… to many uncertainties because, they require consideration
of a… Deleted comma Comment of the entire paragraph: Suggest shortening sentences and condensing language to make the point stand out.
98 General
EERE Chapter 3 has been significantly rewritten. Fundamental information about U.S. and global emissions, including important charts and tables, have been removed. The effect of these changes is to transform the chapter into a dry, academic treatment that is more likely to put a reader to sleep than to convey the difficulty of stabilizing emissions (which the prior version did much better than this one.)
99 General
EERE Any mention of U.S. or global emissions in any detailed way has been removed, including many of the charts or tables from before. In

17
Com-ment No.
Doc. Page No. *
Commenter Comments and Suggested Changes
Suggested Change
Accepted?
Suggested Change Accepted
with Modifications, as Shown Below
Suggested Change Was Not Accepted, with Explanation as
Shown Below removing much of this baseline data, it makes it hard for the reader to understand the immensity of the task of stabilizing concentrations. The remaining charts, using the IPCC scenarios, are a bit hard to read and understand without the other information as a foundation.
100 General
EERE It also removes economic costs, except to compare costs from one report to another, by just saying there's a savings of one relative to another without ever quoting the costs.
101 General
EERE Whereas previous reports explained what assumptions are implied by the scenarios, namely, that all 3 scenarios require a large penetration of renewables and nuclear, all such assumption/methodology issues have been removed here
102 General
EERE There is continual reference to importance of population growth, etc., but the use of fossil fuel emissions is always the 4th or so factor used to make the argument of why emissions are growing. It really isn't a function of population... the problem results from the fuel mix.
103 3-1 State Dept 2The long-term nature of both climate and technological change, when considered within the context of the United Nations Framework Convention on Climate Change’s (UNFCCC’s) ultimate objective, requires a century-long planning horizon.
technologies in the future. Finally, both uncertainties inherent in climate science and the fact that value judgements are involved make it difficult to determine a level at which atmospheric GHG concentrations in the Earth’s atmosphere would meet the UNFCCC ultimate objective of achieving “stabilization of greenhouse gas concentrations in Earth’s atmosphere at a level that would prevent dangerous anthropogenic interference with the climate system . . . within a time-frame sufficient to allow ecosystems to adapt naturally to climate change, to ensure that food production is not threatened, and to enable economic development to proceed in

18
Com-ment No.
Doc. Page No. *
Commenter Comments and Suggested Changes
Suggested Change
Accepted?
Suggested Change Accepted
with Modifications, as Shown Below
Suggested Change Was Not Accepted, with Explanation as
Shown Below a sustainable manner.”
Delete
Insert 104 3-1 DOT A century long planning horizon for technology development may not
be reasonable. While the impacts may be century-long, the technology development and deployment should at most cover 20-25 years.
105 3-1 to 3-2
State Dept [Note: Suggest deleting separate section focusing on UNFCCC objective, for three reasons: 1) UNFCCC is not the preeminent basis for CC policy; 2) the objective contains a number of elements (i.e., ecosystems, food production, and economic development) that are not discussed in this section, in particular those relating to impacts; and 3] have already incoporated the relevant text above.]
3.4 The UNFCCC Objective
Article 2 of the UNFCCC states that the ultimate objective of the Convention is the stabilization of GHG concentrations in the Earth’s atmosphere, as follows:
The ultimate objective of this Convention … is to achieve … stabilization of greenhouse gas concentrations in the atmosphere at a level that would prevent dangerous anthropogenic interference with the climate system. Such a level should be achieved within a time frame sufficient to allow ecosystems to adapt naturally to climate change, to ensure that food production is not threatened and to enable economic development to proceed in a sustainable manner.
[Note: It is unclear what the following paragraph adds — it

19
Com-ment No.
Doc. Page No. *
Commenter Comments and Suggested Changes
Suggested Change
Accepted?
Suggested Change Accepted
with Modifications, as Shown Below
Suggested Change Was Not Accepted, with Explanation as
Shown Below references radiative contributions as “effect” of GHG gas concentrations, which is separate from emissions scenario work, but not sufficient to adequately address the issues inherent in Article 2. If the paragraph and chart are kept, they might be moved to the section on non-CO2 gases, which would highlight relative contributions to radiative forcing. In any event, whenever it goes, it needs to be revised to track more closely with the IPCC text, including the figure’s title.] A large body of work has been undertaken to understand the influence of external factors on climate using the concept of radiative forcings due to changes in the atmospheric composition, alteration of surface reflectance by land use, and variation of the suneffects of GHG concentrations on the climate system. In 2001, the Intergovernmental Panel on Climate Change (IPCC) summarized the key anthropogenic and natural factors causing changes in radiative forcings from year 1750 to year 2000impacts of changes in GHGs in Figure 3-1, where the factors whose radiative forcing can be quantified are marked by wide, colored bars—some of which yield warming (positive forcings) and some cooling (negative forcings). The overall level of scientific understanding for each forcing varies considerably, as noted in the figure. Some of the radiative forcing agents are well mixed over the globe, such as CO2, thereby perturbing the global heat balance. Others represent perturbations with stronger regional signatures because of their spatial distribution, such as aerosols. For this and other reasons, a simple sum of the positive and negative bars cannot be expected to yield the net effect on the climate system.. As the figure illustrates, in addition to CO2, a number of other GHGs contribute to radiative forcing in the atmosphere.

20
Com-ment No.
Doc. Page No. *
Commenter Comments and Suggested Changes
Suggested Change
Accepted?
Suggested Change Accepted
with Modifications, as Shown Below
Suggested Change Was Not Accepted, with Explanation as
Shown Below A portion of the work on scenarios has focused on time frames for efficient stabilization of GHG concentrations. A broad range of possible stabilization levels exist in the literature. Stabilization of GHG concentrations, at any atmospheric concentration level, implies that global additions of GHGs to the atmosphere, and global withdrawals (or destruction) of GHGs from the atmosphere, must Delete Insert Text
106 3-2 DOE/BER 2nd para: Need to be make it clear that changes in radiative forcing and climate change are not the same. This is because of positive and negative feedbacks in the climate system to changes in radiative forcing.
107 3-2 DOT Highlighting aviation in this way just under aerosols is very misleading. The reader might conclude that aviation is only an issue under this category. Furthermore, given the scales, the high uncertainties in aviation's contrail and cirrus impact is masked. The charts should not single out a sector in one category as this obscures context. This is an IPCC chart, but the IPCC is not infallible and we should not continue to distribute charts that cause confusion.
108 3-3 DOE/BER 1st para: Suggest rewording the second complete sentence as follows: “For example, to stabilize the CO2 concentration, the annual release of geologic carbon cannot exceed the rate at which CO2 is sequestered in ocean and terrestrial carbon pools.”
109 3-3 OSTP paragraph 2, 1st sentence: Replace the words "climate change considerations" to "Most of the surveyed analyses of future GHG emissions indicate that, in the absence of actions taken to mitigate climate change, increases will occur in both an ...".
110 3-3 State Dept Figure 3-2. Global Mean Radiative Forcing of Various Atmospheric Constituents and Relative Uncertaintiesthe Climate System for the Year 2000, Relative to 1750

21
Com-ment No.
Doc. Page No. *
Commenter Comments and Suggested Changes
Suggested Change
Accepted?
Suggested Change Accepted
with Modifications, as Shown Below
Suggested Change Was Not Accepted, with Explanation as
Shown Below
Delete Insert text
111 3-3 DOE/BER Figure 3-2A: Insert Gross before Emission Trajectories. With respect to figure 3-2B, is sequestration the same for all scenarios plotted in the figure? Also, what do the plotted profiles assume about sequestration. The point of this figure is unclear. The text doesn’t explain the point either.
112 3-3 EPA 1st paragraph, last sentence, suggest rewording as follows: “Figure 3-2 is illustrative of one set of possible mathematical relationships between emissions and concentrations, across a wide range of concentration levels over time.
113 3-3 EPA Footnote #2. Please add the following to the end of the footnote text, “ due to the long atmospheric lifetime (decades to centuries) of most GHGs.”
114 3-4 State Dept Formatting change: Para should be 3-1 Factors Affecting ………
115 3-4 DOE/BER first word on page – change “for” to “on” Also, in the 2nd sentence of the 2nd para, it doesn’t logically follow that carbon intensity of energy leads to scenarios with the highest CO2 emissions if combustion isn’t accompanied by capture and storage of CO2. This requires further explanation.
116 3-5 State Dept 2nd para
The carbon intensity content [Note: Use of “intensity here might be confused with amount carbon emissions per unit of GDP] of energy—namely …… Delete Insert text
117 3-5 DOE/BER section 3.2.1 Is ocean uptake assumed to remain unchanged. If so, this assumption should be stated.

22
Com-ment No.
Doc. Page No. *
Commenter Comments and Suggested Changes
Suggested Change
Accepted?
Suggested Change Accepted
with Modifications, as Shown Below
Suggested Change Was Not Accepted, with Explanation as
Shown Below 118 3-6 State Dept Formatting change: Verify numbering – 3.1.1 and 3.1.1.1
119 3-6 DOE/BER Figure 3-4: It’s not at all apparent what message this figure is intended to convey. It seems to be that one can get almost any projection of future CO2 emissions, depending on the model used and the assumptions made.
120 3-8 DOE/BER 2nd para: In the second to last sentence, what does “basic definitions” mean in the context of the sentence? In the last sentence, insert “gross” before “global”
121 3-8 DOE/BER last para: Insert “and” after “services” in the 2nd sentence.
122 3-8 EPA Footnote #17, suggest rewording sentence #3 as follows, “In the latter approach, critical but uncertain parameters (such as demographic or technology trends over time) are identified and quantified through the use of probability distributions.”
123 3-9 State Dept 1st para = Formatting issues, para highlighted, font change NOTE: [Note: The referenced paper’s abstact states: We find that in the absence of GHG emissions restrictions, there is a one in forty chance that global mean surface temperature change will exceed 4.9 °C by the year 2100. A policy case with aggressive emissions reductions over time lowers the temperature change to a one in forty chance of exceeding 3.2 °C, thus reducing but not eliminating the chance of substantial warming.” Would it be more accurate to say that recent such recent analyses narrow the range of projections or is this too much of a sytretch?]
124 3-9 DOE/BER section 3.2.2 In the 4th sentence, methane is emitted from coal beds as a result of more than just coal exploration. Coal mining is a major

23
Com-ment No.
Doc. Page No. *
Commenter Comments and Suggested Changes
Suggested Change
Accepted?
Suggested Change Accepted
with Modifications, as Shown Below
Suggested Change Was Not Accepted, with Explanation as
Shown Below source of methane emissions. Also, should provide a reference supporting the statement in the last sentence of the paragraph that methane emissions have declined in the U.S. since the 1990s due to voluntary actions.
125 3-9 and 3-10
DOT Discussion of non-CO2 gases should include clarification that there are tradeoffs in mitigating various gases.
126 3-10 State Dept Sec 3.1.2 verify number
[Note: Figure 3-1 and its accompanying paragraph could be referenced at this point in this section rather than in the earlier section, to make the point that CO2 is only one contributor to radiative forcing, depending on what message is intended to be highlighted.]
127 3-11 State Dept 2nd para 2nd sentence……
In 2003, methane and nitrous Change date from 2002 to 2003
128 3-11 State Dept Text for fig 3.6 and 3.7 should be bolded
129 3-11 State Dept Sec 3.3
For the purposes of CCTP planning and analysis, a century-long planning horizon is hypothesized where advanced technology contributes to the attainment of the UNFCCC’s ultimate objective. Although the specific stabilization path toward attainment is not known, modeling the general parameters of such a hypothesized challenge provides useful information about a range of technologies, and may be

24
Com-ment No.
Doc. Page No. *
Commenter Comments and Suggested Changes
Suggested Change
Accepted?
Suggested Change Accepted
with Modifications, as Shown Below
Suggested Change Was Not Accepted, with Explanation as
Shown Below illuminated by way of example, such as that shown in Figure 3-8. To meet the UNFCCC objectivestabilization level [Note: Stabilization alone does not guarantee that the the UNFCCC’s ultimate objective will be met, since stabilization is to be achieved “within a time-frame sufficient to allow ecosystems to adapt naturally to climate change, to ensure that food production is not threatened, and to enable economic development to proceed in a sustainable manner.”] for this hypothetical example, GHG emissions would have to be reduced by about 13 GtC-eq from the level in an illustrative “unconstrained” case.1 For the example shown, the cumulative emissions reduction over the course of the 21st century would be approximately 500 GtC-eq. Across a range of alternative assumptions, the level of reduction needed to achieve this stabilization trajectory
meet the UNFCCC objective ranged from 200GtC-eq to 800 GtC-eq (cumulative avoided emissions). Delete Insert
130 3-11 EERE Figure 3-8 ("potential scale of co2 emissions reductions to meet UNFCCC objective") has been changed to one that makes it look like the challenge is a lot smaller than the previous figure used. They've removed all use of a CCTP reference, and instead quote a number of different analyses.
131 3-11 OSTP Sec. 3.3: It is not clear from the text how Figure 3-8 relates to "the attainment of the UNFCCC's ultimate objective" (defined on page 1-
1 This illustrative example is based on the reference scenario developed for CCTP by PNNL. See Placet et al (2004).

25
Com-ment No.
Doc. Page No. *
Commenter Comments and Suggested Changes
Suggested Change
Accepted?
Suggested Change Accepted
with Modifications, as Shown Below
Suggested Change Was Not Accepted, with Explanation as
Shown Below 1). It would be helpful to have some qualitative explanation of how the lower cumulative emissions curve was developed (perhaps by summarizing some of the PNNL paper, Placet et al). Also, the main text in this section is unclear and could imply, incorrectly, to the average reader that only the "unconstrained" curve is hypothesized and illustrative. It should be made clear in the main text, not jst in the footnote, that both curves -- the "unconstrained" curve and the curve representing "attainment of the UNFCCC's ultimate objective" -- are hypothesized and illustrative.
132 3-12 OSTP Sec. 3.4, 6th sentence: Add "For example," to the sentence, "Increased energy efficiency (using today's technologies)...". Otherwise, the sentence projects an overly strong opinion about which technologies may be near-term winners.
133 3-13 throu
gh 3-14
EERE Former section on "Stabilizing Concentrations -- Potential Implications for Emissions" has been removed, and with it, reference to 4 emission level scenarios. There is no qualifier, as before, on how to use scenarios and their limitations.
134 3-14 through 3-
16
EERE New section on "Economic Benefits of Using Advanced Technologies." It's important to note that the PNNL scenarios were run prior to having updated modules on wind and buildings, so the share of renewables, in particular, looks small. The end use reduction cited is based on the +/- .25% that PNNL has modeled, but nothing specific to technologies. The chart on "Cumulative Emissions vs. Cumulative Costs (2000-2100) is new and very hard for me, at least, to understand. This is also where the reference of actual costs has removed, and instead there is just a relative inference made, namely, "The estimated costs were estimated to be 2.5 times lower in the optimistic case than the pessimistic case," or "the assumed reduction was 60 percent lower than when the advanced technologies were available." No actual costs are ever cited in this version as they were in previous ones.
135 3-14 State Dept Sec 3.4 GHG emissions reductions that are likely to be required to stabilizing GHG in the atmospheremeet the

26
Com-ment No.
Doc. Page No. *
Commenter Comments and Suggested Changes
Suggested Change
Accepted?
Suggested Change Accepted
with Modifications, as Shown Below
Suggested Change Was Not Accepted, with Explanation as
Shown Below UNFCCC Delete Insert
136 3-16 DOE/BER 1st para: The “H” in hypothetical should be lower case h
137 3-16 OSTP Sec. 3.4.2, 1st word: "Hypothetical" should be lower case, since it is part of a sentence that began two pages back. Also, even without a page break, the sentence itself is hard to follow and perhaps should be reworded.
138 3-17 DOE/BER 2nd para: Insert “reductions” at the end of the last sentence.
139 3-17 DOE/BER 4th para: Delete “(gross world product)” from the 2nd sentence. It appears twice.
140 3-17 DOT "Non-CO2 gases is not a "technology area" but rather a GHG category -- need to rephrase in terms of a useful technology
141 3-19 State Dept Sec 3.4.3 stabilization levels in the literatureconsistent with the UNFCC objective. Delete Insert
142 3-19 State Dept Sec 3.4.3.1 2nd para If gross world product (gross world product) were to grow by only 2.0 percent/year over the 21st century Delete
143 3-19 State Dept Footnote 1 Meeting Report of the IPCC Expert Meeting on Emission Scenarios, 12-14
January 2005, Washington DC. http://www.ipcc.ch/meet/washington.pdf
144 3-20 State Dept Sec 3.4.3.1 3rd para, last sentence the more difficult it would be to meet any stabilization trajectorymeet the UNFCCC objective Delete Insert

27
Com-ment No.
Doc. Page No. *
Commenter Comments and Suggested Changes
Suggested Change
Accepted?
Suggested Change Accepted
with Modifications, as Shown Below
Suggested Change Was Not Accepted, with Explanation as
Shown Below 145 3-19
to 3-23
OSTP Sec. 3.4.3.2 and Sec. 3.4.3.3: The discussion of other published analyses in these sections becomes confusing because of a mix of tenses and verbs. Some examples are: (a) page 3-19, "share ... increase" -- case mismatch. (b) page 3-19, "was achieved" -- does not match the present tense of other sentences referring to model results for 2100. (c) page 3-19: "Edmonds et al. report increasing contributions from solar and nuclear energy under carbon constraints" -- this seems to be an inappropriate use of the verb "report." Instead, it should be said that researchers "report model results that indicate increased emissions", or that they "report analytical results that suggest increasing contributions from solar energy," etc. The extra wording is needed for clarity. Some rewording of these phrases throughout Sec. 3.4.3.2 and 3.4.3.3 would help the reader.
146 3-22 State Dept 2nd Footnote: CCS in a climate stabilization strategy.
147 3-26 State Dept Sec 3.5 last sentence Further scientific study must be undertaken to determine the specific level of emissions reductions that would be needed to stabilizing GHG concentrations in the atmosphere meet the UNFCC objective. Many scenarios analyses have shown that the necessary cumulative emissions reductions over the course of the century could be on the order of 200 GtC-eq to 800 GtC-eq (or more). Delete Insert
148 3-28 State Dept References Cofala, J. Markus Amann, and Reinhard Mechler. 2005. Scenarios of world anthropogenic emissions of air pollutants and methane up to 2030. Laxenburg, Austria: International Institute for Applied Systems Analysis. http://www.iiasa.ac.at/rains/global_emiss/Global%20emissions

28
Com-ment No.
Doc. Page No. *
Commenter Comments and Suggested Changes
Suggested Change
Accepted?
Suggested Change Accepted
with Modifications, as Shown Below
Suggested Change Was Not Accepted, with Explanation as
Shown Below %20of%20air%20pollutants%20.pdf Delhotal, K.C., and M. Gallaher. In press. Estimating technical change and potential diffusion of methane abatement technologies for the coal-mining, natural gas, and landfill sectors. Conference proceedings, IPCC Expert Meeting on Industrial Technology Development, Transfer and Diffusion. http://arch.rivm.nl/env/int/ipcc/docs/ITDT/ITDT%20Meeting%20Report%20Open%20website%20version.pdf http://arch.rivm.nl/env/int/ipcc/ Edmonds, J., M. Wise, and C. MacCracken. 1994. Advanced energy technologies and climate change. an analysis using the Global Change Assessment Model (GCAM). PNL-9798, UC-402. Richland, WA: Pacific Northwest Laboratory. http://sedac.ciesin.columbia.edu/mva/MCPAPER/mcpaper.html Delete Insert
149 3-29 State Dept Intergovernmental Panel on Climate Change (IPCC). 2000. Special report on emissions scenarios. Cambridge, UK: Cambridge University Press. http://www.grida.no/climate/ipcc/emission/index.htm Intergovernmental Panel on Climate Change (IPCC). 2001. Climate Change 2001. Mitigation: a report of Working Group III of the Intergovernmental Panel on Climate Change. Bert Metz, Ogunlade Davidson, Rob Swart and Jiahua Pan, eds. Cambridge, UK: Cambridge University Press

29
Com-ment No.
Doc. Page No. *
Commenter Comments and Suggested Changes
Suggested Change
Accepted?
Suggested Change Accepted
with Modifications, as Shown Below
Suggested Change Was Not Accepted, with Explanation as
Shown Below http://www.grida.no/climate/ipcc_tar/wg3/index.htm IPCC (See Intergovernmental Panel on Climate Change)
150 3-30 State Dept Placet, M., K.K. Humphreys, and N. Mahasenan. 2004. Climate change technology scenarios: energy, emissions, and economic implications. PNNL-14800. Richland, WA: Pacific Northwest National Laboratory. http://www.pnl.gov/energy/climate/climate_change-technology_scenarios.pdf
151 3-31 State Dept Richards, K. and C. Stokes. 2004. A Review of Forest Carbon Sequestration Cost Studies: A Dozen Years of Research. Climatic Change. (CHANGE TO ITALICS)63 (1-2): 1-48. Richels, R.G., A.S. Manne, and T.M.L. Wigley. 2004. Moving beyond concentrations: the challenge of limiting temperature change. Working Paper 04-11. AEI-Brookings Joint Center for Regulatory Studies. http://www.aei-brookings.org/admin/authorpdfs/page.php?id=937 Sohngen, B. and R. Mendelsohn. 2003. An Optimal Control Model of Forest Carbon Sequestration. American Journal of Agricultural Economics, 2003, Volume 85, Issue 2, pp. 448-457. A United Nations Development Program (UNDP). 2000. World Energy Assessment. New York. U.S. Environmental Protection Agency. 2005. U.S. emissions inventory: inventory of u.s. greenhouse gas emissions and sinks: 1990-2003. EPA 430-R-05-003. Washington, DC: U.S. Environmental Protection Agency.

30
Com-ment No.
Doc. Page No. *
Commenter Comments and Suggested Changes
Suggested Change
Accepted?
Suggested Change Accepted
with Modifications, as Shown Below
Suggested Change Was Not Accepted, with Explanation as
Shown Below http://yosemite.epa.gov/oar/globalwarming.nsf/content/ResourceCenterPublicationsGHGEmissionsUSEmissionsInventory2005.html Wexler, L. 1996. Improving population assumptions in greenhouse emissions models. WP-96-099. Laxenburg, Austria: International Institute for Applied Systems Analysis. http://www.iiasa.ac.at/Publications/Documents/WP-96-099.pdf
Chapter 4 152 Gener
al DOT We recommend a clearer definition and categorization of light duty-trucks.
153 4-1 State Dept 1st para Historically, global energy productivity, loosely measured in terms of economic output per unit of energy input, has shown steady increases, averaging gains of about one 0.9 percent per year over the period 1971-2002 (IEA 20012004). Insert text Delete highlighted text
154 4-2 State Dept COMMENT Suggest revising Table 4-1 so that the end-use sectors track with those identified in the first sentence of this chapter (i.e., industry, residential and commercial buildings, and transportation) and also updating to include the latest EPA emissions data (i.e. 2003 from the new reference EPA 2005 identified in Section 4.6 below). This new table would be as follows: Table 4-1 All the numbers have changed.

31
Com-ment No.
Doc. Page No. *
Commenter Comments and Suggested Changes
Suggested Change
Accepted?
Suggested Change Accepted
with Modifications, as Shown Below
Suggested Change Was Not Accepted, with Explanation as
Shown Below
155 4-2 State Dept Sec 4.1 [Can this be updated ?]. In 20022003, the U.S. transportation sector accounted for 32 percent of total CO2 emissions, with the highway modes accounting for more than 85 percent of these (see Table 4-2). According to the Federal Highway Administration’s Freight Analysis Framework, freight tonnage will grow by 70 percent over the first two decades of the 21st century (DOT 2002b) [Can this be updated ?].
156 4-2 and 4-3
DOT The discussion ignores aviation. Recommend providing the following from the info paper provided earlier:
In the near term, new technologies to improve air traffic management will help reduce emissions. An example is RVSM – Reduced Vertical Separation Minimums. We have used RVSM for transatlantic flights since 1997 and it will become standard in U.S. airspace starting in January 2005. Full implementation of RVSM may reduce fuel use by ~500 million gallons each year.
In the long-term, new engines and aircraft will feature enhanced engine cycles, more efficient aircraft aerodynamics and reduced weight, thereby improving fuel efficiency. The revolutionary, high-risk research sponsored by the Federal Government through NASA in collaboration with the Next Generation Air Transportation System (NGATS) plan will enable these enhancements. NGATS is a multi-agency integrated effort to ensure that the future air transportation system meets air transportation security, mobility and capacity needs while reducing environmental impacts.
157 4-3 State Dept Suggest revising Table 4-2 so it tracks with Table 2-17 in EPA 2005 (Table 4-2 – has different values).
158 4-4 State Dept Figure 4-3. Projected Energy Consumption in U.S. Highway

32
Com-ment No.
Doc. Page No. *
Commenter Comments and Suggested Changes
Suggested Change
Accepted?
Suggested Change Accepted
with Modifications, as Shown Below
Suggested Change Was Not Accepted, with Explanation as
Shown Below Vehicles (Source: EIA 20042005, assuming )it can be updated with EIA’s AEO 2005 Data) Delete highlighted text
159 4-4 DOT Section 4.1.3 The second bullet, on the discussion of research on heavy vehicles, mixes different objectives with different means of achieving objectives, making the section confusing and causing some categories of research that are not mutually exclusive to overlap. We recommend restructuring the list of items to focus on objectives and then provide examples for each type of objective.
For example: The research objectives are to (1) reduce energy consumption in long-haul operations, (2) increase efficiency and reduce emissions during stop-and-go operations, and (3) divert from idling to more efficient and less polluting energy sources during the time when a truck is NOT moving. Projects to reduce energy consumption and emissions during normal operation include reducing losses from lightweight materials, aerodynamic drag, and tire rolling resistance and seeking advanced combustion propulsion systems. Projects to increase efficiency and reduce emissions during stop-and-go operations (primarily in urban environments) include alternative fuel systems, such as hydrogen. Projects to divert from diesel engine idling to more efficient and less polluting energy sources include on-board auxiliary power units for refrigeration. Some projects, such as hybrid electric drive systems, serve both to increase efficiency and reduce emissions during stop-and-go operations (e.g., delivery trucks, refuse trucks, and transit buses) and to divert from diesel engine idling [for purposes of power take-off during the time when the truck is NOT moving] to more efficient and less polluting energy sources (e.g., utility trucks with operating cranes and cement mixers as well as truck stop electrification for on-board ancillary loads)
160 4-5 DOE/BER Section 4.1.4 1st bullet: Define “freight efficiency” the 5th bullet (In addition, supporting or crosscutting areas for future research include” should not indented as a bullet.

33
Com-ment No.
Doc. Page No. *
Commenter Comments and Suggested Changes
Suggested Change
Accepted?
Suggested Change Accepted
with Modifications, as Shown Below
Suggested Change Was Not Accepted, with Explanation as
Shown Below 161 4-5 DOT The fourth bullet from the top regarding transit buses is not entirely
correct. It leaves out the deployment of hydrogen and other alternative fuel internal combustion engine buses, which do not fit the category of hybrid or fuel cell.
162 4-5 DOT section 4.1.4 The first bullet should emphasize that these strategies and technologies will be intermodal. DOT is exploring ways to increase freight transfer and movement efficiency (NOT freight efficiency) between ships and trucks, ships and rail, and rail and trucks. Although this is primarily at seaports, DOT will also be looking at terminals along major land bridges between east and west coasts, and looking into adding capacity for freight movement in congested urban areas.
163 4-5 DOT Disregard the changes on the ITS language - keep the original.
164 4-5 DOT the link · Research on aviation fuel efficiency, including engine and airframe design improvements. See Section 1.1.5 http://www.climatetechnology.gov/cctp-stratplan/may2005/May05-111-116EDIT.pdf needs to be updated to cover NGATS (can use last paragraph above)
165 4-6 State Dept Sec 4.2, 2nd para According to a recent projection by the United Nations, 84 the percent percentage of the world’s population will liveliving in urban areas increases from 49 percent in 2005 to 61 percent by 2030 (UN 20012005). In the United States, energy consumption in buildings has been increasing proportionately with increases in population, although this trend masks significant increases in efficiency in some building components that are being offset by new or increased energy uses in others. In the United States in 20022003, CO2 emissions from this sector, including those from both fuel combustion and use of electricity derived from CO2-emitting sources, accounted for about nearly 37 percent of total CO2 emissions (see Table 4-1). These emissions have been

34
Com-ment No.
Doc. Page No. *
Commenter Comments and Suggested Changes
Suggested Change
Accepted?
Suggested Change Accepted
with Modifications, as Shown Below
Suggested Change Was Not Accepted, with Explanation as
Shown Below increasing at about 2 1.9 percent per year over the past 25 yearssince 1990 (EIA 20032005). Table 4-3 shows a breakdown of emissions from the buildings sector, by fuel type, in the United States. Insert text Delete highlighted text
166 4-7 State Dept Sec 4.2.1 Suggest revising Table 4-3 so it tracks with EPA 2005. This new table would be as follows: Insert text Table 4-3 All the numbers have changed.
167 4-8 State Dept Last para before Sec .4.2.2 By 2025, with advances in building envelopes, equipment, and systems integration, it may be possible to achieve up to 70 100 percent reductions in a building’s energy use (DOE 20042005). If augmented by photovoltaics or distributed sources of combined heat and power, buildings could become net-zero GHG emitters and net energy producers by the end of the century. Delete highlighter text Insert text
168 4-10 State Dept Sec 4.3 2nd para In the United States in 20022003, industry accounted for about one-third of total U.S. CO2 emissions (see Table 4-1). These are attributed to combustion of fuels (52 51 percent), use of electricity derived from CO2-emitting sources (40 41 percent), and industrial processes that emit CO2 (8 percent). (See Table

35
Com-ment No.
Doc. Page No. *
Commenter Comments and Suggested Changes
Suggested Change
Accepted?
Suggested Change Accepted
with Modifications, as Shown Below
Suggested Change Was Not Accepted, with Explanation as
Shown Below 4-4) Suggest revising Table 4-4 so it tracks with EPA 2005. This new table would be as follows Delete highlighted text Insert text
Table 4-4 All the numbers have changed. 169 4-13 DOE/BER Advanced Applications of Biotechnology: The point of throughput
screening of biodiversity in the context of advanced applications of biotech in industry to reduce GHG emissions is not at all apparent. Clarify how bio-diversity screening might help.
170 4-13 OE In recent years, the demand for electricity has increased at a rate that seriously threatens to exceed current transmission capacity. Demand is estimated to increase by 19 percent from 2003-2012 (EIA 2005); only a 6 percent increase in transmission is planned for 2002-2012 (DOE 2002), and there have been few major new investments in transmission during the past decade and a half. The outages being experienced in parts of the country, including the August 2002 blackout in the Midwest and Northwest, have highlighted the need to enhance grid reliability.
171 4-13 State Dept Sec 4.3.4 2nd bullet In the United States in 20022003, CO2 emissions from these sources accounted for 44 38 percent of the non-energy related industrial emissions and about 4 1 percent of total U.S. CO2 emissions (see Table 4-4). Insert text Delete highlighter text
172 4-14 OE Sec 4.4 In recent years, the demand for electricity has increased at a

36
Com-ment No.
Doc. Page No. *
Commenter Comments and Suggested Changes
Suggested Change
Accepted?
Suggested Change Accepted
with Modifications, as Shown Below
Suggested Change Was Not Accepted, with Explanation as
Shown Below rate that seriously threatens to exceed current transmission capacity. Demand is estimated to increase by 1920 percent from 2003-2012through 2004 (EIA 2005); only a 6 percent increase in transmission is planned for 2002-2012the next 10 years (DOE 2002), and there have been few major new investments in transmission during the past 15 years decade and a half. The outages being experienced in parts of the country, including the August 2002 blackout in the Midwest and Northwest,those most recently experienced in the Midwest and Northeast, have highlighted the need to enhance grid reliability. Deleted Insert
173 4-14 State Dept Sec 4.4 3rd para Energy losses in the U.S. transmission and distribution (T&D) system were 7.24.8 percent in 19952003, accounting for 2.5179 billion kilowatt hours quads of primary energyelectricity generation and 36.5111 million metrtic tons megatons (MtC) of CO2 emissions (CCTP 2003DOE 2004, Table 8.1 and EPA 2005, Table 2-14). Losses are divided such that about 60 percent are from transmission lines and 40 percent are from transformers (most of which are for distribution) [Reference?]. Insert text Delete highlighter text Formatted highlight area
174 4-19 State Dept Sec 4.5 1st para The relative size of the contribution of energy end-use reduction toward GHG emissions reductions the United Nations Framework Convention on Climate Change (UNFCCC) goal attainment would depend on many factors, but is generally

37
Com-ment No.
Doc. Page No. *
Commenter Comments and Suggested Changes
Suggested Change
Accepted?
Suggested Change Accepted
with Modifications, as Shown Below
Suggested Change Was Not Accepted, with Explanation as
Shown Below considered large. Insert text Delete highlighter text
175 4-19 State Dept References Brown, M.A.. 2003. What are the administration priorities for climate change technology? Testimony before the Energy Subcommittee of the U.S. House of Representatives’ Committee on Science. Hearing on November 6, 2003. http://www.house.gov/science/hearings/energy03/nov06/brown.pdf
176 4-19 OE Add the following reference: Energy Information Administration (EIA). 2005. Annual energy outlook 2005: with projections to 2025, DOE/EIA-0383(2005). Washington, DC: U.S. Department of Energy.
177 4-19 OE References Energy Information Administration (EIA). 2005. Annual energy outlook 2005: with projections to 2025, DOE/EIA-0383(2005). Washington, DC: U.S. Department of Energy.
178 4-20 State Dept Sec 4.6 References Energy Information Administration (EIA). 2003. Emissions of greenhouse gases in the United States 2002. DOE/EIA-0573(2002). Washington, DC: U.S. Department of Energy. Energy Information Administration (EIA). 2004. Annual Energy Review 2003. DOE/EIA-3084(2003). Washington, DC: U.S. Department of Energy. http://www.eia.doe.gov/emeu/aer/pdf/aer.pdf

38
Com-ment No.
Doc. Page No. *
Commenter Comments and Suggested Changes
Suggested Change
Accepted?
Suggested Change Accepted
with Modifications, as Shown Below
Suggested Change Was Not Accepted, with Explanation as
Shown Below Energy Information Administration (EIA). 20042005. Annual energy outlook 20042005: with projections to 2025, DOE/EIA-0383 (20042005). Washington, DC: U.S. Department of Energy. International Energy Agency (IEA). 20012004. World energy outlook. Paris: International Energy Agency. U.S. Environmental Protection Agency (EPA). 20042005. Inventory of U.S. greenhouse gas emissions and sinks: 1990-20022003. EPA 430-R-0405-003. http://yosemite.epa.gov/oar/globalwarming.nsf/UniqueKeyLookup/RAMR69V4ZS/$File/05_complete_report.pdf http://yosemite.epa.gov/oar/globalwarming.nsf/content/ResourceCenterPublicationsGHGEmissionsUSEmissionsInventory2004.html. U.S. Department of Energy (DOE). 20032005. Hydrogen, fuel cells and& infrastructure technologies multi- year research, development and demonstration plan: 2003-2010 (Draft). Washington, DC: U.S. Department of Energy. http://www.eere.energy.gov/hydrogenandfuelcells/mypp/. U.S. Department of Energy (DOE), Energy Efficiency and Renewable Energy (EERE). 20042005. FY 20052006: budget-in-brief. http://www.eere.energy.gov/office_eere/pdfs/fy06_budget_brief.pdfhttp://www.eere.energy.gov/office_eere/pdfs/fy05_budget_brief.pdf. Insert text Delete highlighter text
Chapter 5

39
Com-ment No.
Doc. Page No. *
Commenter Comments and Suggested Changes
Suggested Change
Accepted?
Suggested Change Accepted
with Modifications, as Shown Below
Suggested Change Was Not Accepted, with Explanation as
Shown Below 179 Genera
l Comments
NE A correction to the number of operating reactors to exclude the Tennessee Valley Authority’s Browns Ferry Unit 1, which has been shut down since 1985;
180 General Comments
NE Inclusion of desalination as a potential use for nuclear power along with electricity generation and hydrogen production
181 General Comments
NE Elimination of the discussion of the Nuclear Energy Plant Optimization (NEPO) program
182 General Comments
NE A correction to the number of currently licensed reactors that have been approved by the Nuclear Regulatory Commission for license renewal
183 General Comments
NE Clarification of the status of design certification on Generation III+ reactor designs
184 General Comments
NE Update to Technology Option 2.4.3
185 General Comments
NE Revisions to the years when new Generation III+ reactors are likely to be connected to the electricity grid; and
186 General Comments
NE Rewording to show that the work on providing the business case for new nuclear power plants has been completed
187 5-1 OSTP on low-emission, fossil-based fuels and power is the same litany of programs and activities with no sense of direction or priority.
188 5-2 State Dept 1st para after fig.
If it is deemed necessary to limit CO2 emissions to meet the United Nations Framework Convention on Climate Change (UNFCCC) objective, oOne area set of technologies that would allow continued use of coal and other fossil fuels even under

40
Com-ment No.
Doc. Page No. *
Commenter Comments and Suggested Changes
Suggested Change
Accepted?
Suggested Change Accepted
with Modifications, as Shown Below
Suggested Change Was Not Accepted, with Explanation as
Shown Below scenarios calling for substantial CO2 emission limitations is contained in an advanced coal-based production facility, based on coal gasification and production
Insert text
Delete highlighter text 189 5-3 State Dept 2nd para
The analysis of the advanced technology scenarios suggests that, through successful development and implementation of these technologies, the UNFCCC goal stabilization trajectories could be attained met across a wide range of hypothesized concentration level
Insert text
Delete highlighter text
190 5-3 OSTP on renewable energy and fuels describes the same old list of programs with no priorities and no goals. The document should describe the technical challenges that must be overcome and what the CCTP will do to attack the top priority challenges.
191 5-3 OMB Sec 5.1
Today, fossil fuels are an indispensable integral part of the U.S. and global energy mix. Insert text Delete highlighter text
192 5-3 State Dept Sec 5.1 supply over one-half of U.S. electricity demands through the year 2025 (EIA 20042005).

41
Com-ment No.
Doc. Page No. *
Commenter Comments and Suggested Changes
Suggested Change
Accepted?
Suggested Change Accepted
with Modifications, as Shown Below
Suggested Change Was Not Accepted, with Explanation as
Shown Below Insert text Delete highlighter text
193 5-4 State Dept Sec 5.1.1, Insert text Highlight the following text: For example, increasing the efficiency of all coal-fired electric generation capacity in the United States by one percentage point would avoid the emission of 14 million tons of carbon per year. That reduction is equivalent to replacing 170 million incandescent light bulbs with fluorescent lights or weatherizing 140 million homes. [Reference(s)?]
194 5.4 OMB (Section 5.1.1 Para1) ultimately leading to near-zero atmospheric emissions
The focus is on designs that are compatible with carbon sequestration technology, including the development of coal-based near-zero- atmospheric emission power plants. Insert text Delete highlighter text
195 5-4 OMB Sec 5.1.2 ………..including sulfur dioxide, nitrogen oxides, mercury, and particulates as well as almost complete elimination of atmospheric CO2, emissions through a combination of efficiency improvements and carbon capture and storage (called “sequestration” in Figure 5-3). This prototype power

42
Com-ment No.
Doc. Page No. *
Commenter Comments and Suggested Changes
Suggested Change
Accepted?
Suggested Change Accepted
with Modifications, as Shown Below
Suggested Change Was Not Accepted, with Explanation as
Shown Below plant will serve to demonstrate as the test bed for proving the most advanced technologies, such as hydrogen fuel cells. Insert text Delete highlighter text
196 5-5 OMB Sec 5.1.3 1st bullet 2nd para
Significant reductions in atmospheric CO2 emissions have been demonstrated via efficiency improvements and co-firing of coal with biomass. While current average power plant efficiencies are around 33 percent, increasing efficiencies to 45-50 percent in the mid term, and ultimately to 60 percent (with the integration of fuel cell technology) will nearly halve emissions of CO2 per unit of electricity. Development and deployment of CO2 capture and storage technology could reduce atmospheric carbon emissions to near-zero levels. Recent R&D activities have focused on integrated gasification, combined-cycle (IGCC) plants. Two U.S. IGCC demonstration plants are in operation. 2nd bullet 2nd para In the near- and mid-term, fuel cell cost reductions could enable the widespread deployment of natural-gas-fueled distributed generation in gas-only, combined heat and power, and fuel cell applications. In the mid-to-long term, this technology, along with others being developed as part of the Distributed Generation effort, will also support coal-based Future Last para Carbon emissions can be reduced in the near term principally by improving process efficiency and in the longer term via more advanced system components such as high-efficiency fuel

43
Com-ment No.
Doc. Page No. *
Commenter Comments and Suggested Changes
Suggested Change
Accepted?
Suggested Change Accepted
with Modifications, as Shown Below
Suggested Change Was Not Accepted, with Explanation as
Shown Below cells. In both the near and long terms, incorporating CO2 capture into the process, followed by permanent storage, will be required to achieve near-zero atmospheric emissions.
Inserted Text
197 5-5 OSTP paragraph 1, last sentence: Replace "Today there is little doubt that fusion power can" with "The goal is for fusion power to".
198 5.5 DOE/BER section 5.1.4 Item 1 in the second sentence is vague – what future research is needed to enhance the hydrogen production technology effort? Item 4 is also vague (on page 5-6.)
199 5-5 OMB Sec 5.1.4 The current low-emission, fossil-based power portfolio supports all of the components needed to achieve the stated objectives. Depending on how technology development of these components advances, future R&D may include However, there are areas where increased R&D could reduce risk and accelerate the introduction of technologies: (1) enhancing the hydrogen production technology effort; (2) adding advanced hybrid gasification/combustion, which offers an alternative path to achieve many of the program goals; (3) accelerating testing at FutureGen; and (4 3) broadening advanced research in materials development, which offers enormous potential benefits in system efficiency, durability, and performance. Insert text Delete highlighter text
200 5-6 DOT In the second paragraph of 5.2, the language should differentiate between chemi and pysi-sorbtion (adsorbed and absorbed) when describing hydrode and carbon-based nanotube storage. This is a minute point.
201 p. 5-7 EERE The following para was removed. Why? "Hydrogen production can be a value-added complement to other advanced climate change

44
Com-ment No.
Doc. Page No. *
Commenter Comments and Suggested Changes
Suggested Change
Accepted?
Suggested Change Accepted
with Modifications, as Shown Below
Suggested Change Was Not Accepted, with Explanation as
Shown Below technologies, such as those aimed at the use of fossil fuels or biomass with CO2 capture and storage. As such, hydrogen may be a key and enabling component for full deployment of carbonless electricity technologies (advanced fission, fusion, and/or intermittent renewables."
202 5-7 State Dept Sec 5.2.2… 2nd para
The IPHE will provides a mechanism to organize evaluate and coordinate multinational research, development and deployment programs that advance the transition to a global hydrogen economy. The Partnership will leverages limited resources, bring together the world’s best intellectual skills and talents, and develop interoperable technology standards.
203 5-8 State Dept 1st para Initially, the IPHE will has reviewed actions being pursued jointly by participating countries and is identifying additional actions
204 5-9 DOT section 5.2.3 This section should mention the research being conducted on the use of hydrogen in auxiliary power units to supplant diesel engine power use for refrigeration and housekeeping (e.g., climate control) in trucks.
205 5-9 DOT This statement "· In the case of hydrogen aircraft, the average length of future flights and whether significant demand for supersonic passenger aircraft develops over the 21st century will be important to determining the relative fuel economy advantages of hydrogen over conventional jet fuel. Scenarios that include a worldwide shift toward hydrogen aircraft, and substitutes for shorter trips (high speed rail) could be considered." Whether or not supersonic aircraft are introduced does not drive hydrogen use. This might be true of a hypersonic (greater than Mach 6) vehicle, but commercial supersonic aircraft would most likely travel

45
Com-ment No.
Doc. Page No. *
Commenter Comments and Suggested Changes
Suggested Change
Accepted?
Suggested Change Accepted
with Modifications, as Shown Below
Suggested Change Was Not Accepted, with Explanation as
Shown Below at Mach 1.2-2 -- which does not necessitate hydrogen. The point these sentences is trying to make is not clear; the first is hard to understand and the second does not follow from the first.
206 5-10 DOE/BER Hydrogen Infrastructure Safety: If its part of the current portfolio, shouldn’t “will” be “is”. “Will” suggests it’s not part of the current portfolio.
207 5-11 State Dept Sec 5.3 1st para Of the entire 71.85 quads of energy supply and disposition (97.7298.22 quads total energy consumption) in the United States in 20022003, renewable resources contributed 5.845.89 quads (8 percent of supply and 6 percent of the total). Of that, 2.79 78 quads came from hydropower, 2.61 64 quads from biomass (wood and waste), 0.30 31 quads from geothermal, and 0.13 17 quads from solar and wind. An additional 0.17 24 quads of ethanol were produced from corn for transportation (EIA 2004, EIA 2005).
208 5-11 State Dept 3rd para
FORMAT – HIGHTLIGHT TEXT In the past decade, the global wind energy capacity has increased tenfold—from 3.5 GW in 1994 to almost 50 GW by the end of 2004 [Reference?].
209 p. 5-11
EERE You didn't take solar edit. Why? "Renewable sources of energy include the energy of sunlight, the kinetic energy of wind, the thermal energy insider the earth itself . . . and instead left it as "heat and photonic energy"
210 5-14 State Dept Sec 5.3.1
Renewable energy technologies are generally modular and can be used effectively to help meet the energy needs of a

46
Com-ment No.
Doc. Page No. *
Commenter Comments and Suggested Changes
Suggested Change
Accepted?
Suggested Change Accepted
with Modifications, as Shown Below
Suggested Change Was Not Accepted, with Explanation as
Shown Below standalone application or building, an industrial plant or community, or the larger needs of a national electrical grid or fuel network [Note: Question the use of the word “effectively without all sorts of caveats, such as the need for adequate storage, etc.] .
211 5-16 State Dept Last para
HIGHLIGHT TEXT nearly 4 billion gallons [What is the refernce for the 4 billion gallon figure. It seems a bit high. The largest figure I could find is about 4.4 billion gallons in 2004])
212 p. 5-17
EERE You didn't take the addition of "solar energy" to the following sentence, "Today, grid-connected wind energy, geothermal and biopower systems . . ." How come?
213 p. 5-18
EERE You really need to replace "engineered geothermal systems" for "hot dry rock"
214 5-17 to 5-19
DOE/BER Section 5.3.3 Current Portfolio: This section lacks a description of what’s in the current portfolio in each area. Overall, the section is not informative about what’s being done currently in terms of technology RD&D. The relevance of some of the items mentioned in this section, e.g., pest and disease management in Energy Crops is unclear.
215 5-20 DOE/BER Concentration Solar Power: Insert “requiring RD&D” after “challenges”
216 5-20 DOE/BER Biochemical Conversion of Biomass: For what purpose does pretreating biomass need be changed/improved. If it’s a future research direction, need to say what the research should be trying to achieve with respect to improving biomass pretreatment.
217 5-20 DOE/BER Thermochemical Conversion of Biomass: What is the purpose of studying synthesis gas use in various applications? As a future research direction, should be more explicit why there is a need for such studies.

47
Com-ment No.
Doc. Page No. *
Commenter Comments and Suggested Changes
Suggested Change
Accepted?
Suggested Change Accepted
with Modifications, as Shown Below
Suggested Change Was Not Accepted, with Explanation as
Shown Below 218 5-20 DOE/BER Energy crops: Why is there a need to develop gene maps and to
understand functional genomics of model crops in the context of the Energy Crops for the CCTP?
219 5-20 DOE/BER Photoconversion: Why is there a need for such research in the context of the CCTP?
220 5-21 State Dept Sec 5.4
There are over 440 nuclear power plants in 31 nations currently that generate 17 16 percent of the world’s
221 5-21 NE 5.4 para 1 Change the number of currently operating reactors: “There are 439 nuclear power plants in 31 nations currently generating 17 percent of the world’s . . . ”
This is the world statistic consistent with 103 operating reactors in the U.S.
222 5-21 OMB Sec 5.4 2nd para
Over the past 30 years, operators of U.S. nuclear However, uUsed nuclear fuel contains a substantial quantity of fissionable materials. that, although not economically useful today, could be valuable in the future. Advanced technologies may be able to that could recover much of the remaining energy from this in spent fuel and also offer the prospect of reduceing required repository space and the radiotoxicity of the disposed waste. Sec 5.4 3rd para While tThe current primary application of nuclear energy is the production of electricity. , oOther……..etc Inserted Text Deleted text highlighted
223 5-21 OMB Sec 5.4.1

48
Com-ment No.
Doc. Page No. *
Commenter Comments and Suggested Changes
Suggested Change
Accepted?
Suggested Change Accepted
with Modifications, as Shown Below
Suggested Change Was Not Accepted, with Explanation as
Shown Below through 5-
22
The mission of R&D for the nuclear energy program is to secure nuclear energy as a viable, long-term commercial energy option to provide diversity in the energy supply. In the short-term, governmental and institutional barriers will be addressed to enable new plant deployment decisions by nuclear power plant owners and operators who wish to be among the first to license and build new nuclear facilities in the United States. In the longer-term, new nuclear technologies will be developed that can compete with advanced fossil and renewable technologies, enabling power providers to select from a diverse group of generation options that are economical, reliable, safe, secure, and environmentally acceptable. The goal of R&D for nuclear facility optimization is to increase the efficiency, reliability, and power generation of 104 existing nuclear power plants. Extending the license terms of currently operating nuclear plants for 20 more years and optimizing their generation, as is being done in the United States, will offer a cost-effective resource for carbon dioxide mitigation well into the middle part of this century. Through the early months of 2004, 26 nuclear units in the United States have received approval to extend their operating licenses to a total of 60 years; 37 others have filed or announced their intent to file for license extensions; and most likely all of the remaining plants are expected to follow suit.
Insert text Delete highlighted text
224 5-21 NE Sec 5.4 para 3 Add the use of nuclear power for desalination: “While the current application of nuclear energy is the production of

49
Com-ment No.
Doc. Page No. *
Commenter Comments and Suggested Changes
Suggested Change
Accepted?
Suggested Change Accepted
with Modifications, as Shown Below
Suggested Change Was Not Accepted, with Explanation as
Shown Below electricity, other applications are possible, such as co-generation of process heat, the generation of hydrogen for water or from methane (with carbon capture or integration with other materials production or manufacturing), and desalination.” Current sentence does not include desalination.
225 5-21 NE Sec 5.4.1st para 1 Replace the first paragraph with: “The currently operating 103 U.S. nuclear reactor units are saving as much as 600 million metric tons of carbon dioxide emissions every year. Through the spring of 2005, 32 of these units have received approval to extend their operating licenses to a total of 60 years; 16 other have applications under review. Most likely all of the remaining units will follow suit. Such carbon dioxide emission mitigation can be increased if new nuclear capacity is brought on line.” Based on latest budget information, funding for the NE program to assist currently operating U.S. nuclear plant (NEPO) will be discontinued. (“103” has replaced “104” because the 104th unit, TVA’s Browns Ferry 1, has not been in operation since 1985.)
226 5-21 NE Sec 5.4.1 para 2nd Replace the opening sentence: “To the extent the financial risks of new nuclear construction can be addressed and with improvement from new technologies in the longer-term, the nuclear option can continue to be an important, growing part of a GHG-emissions-free energy portfolio.” Reflects the President’s recent announcement for encouraging nuclear construction.
227 5-21 NE 5.4.1 para 2nd Replace the second sentence: “Design and demonstration efforts on near-term advanced reactor concepts, in combination with Federal financial risk mitigation tools, will enable power companies to build and operate new reactor that are economical and competitive with other generation technologies, supporting energy security and diversity of supply.”

50
Com-ment No.
Doc. Page No. *
Commenter Comments and Suggested Changes
Suggested Change
Accepted?
Suggested Change Accepted
with Modifications, as Shown Below
Suggested Change Was Not Accepted, with Explanation as
Shown Below Provides a better description on the NE near-term activities
228 5-22 State Dept Sec 5.4.1 Through the early monthsAs of 2004early May 2005, 26 32 nuclear units in the United States have received approval to extend their operating licenses to a total of 60 years; 37 41 others have filed or announced their intent to file for license extensions; and most likely all of the remaining plants are expected to follow suit (See http://www.nrc.gov/reactors/operating/licensing/renewal/applications.html).
229 5-22 NE Sec 5.4.1 3rd para To update the readiness of certain new reactor designs, replace the first two sentences with: “Evolutionary light water reactors of standardized design, having received U.S. Nuclear Regulatory Commission design certification and having been constructed in Japan and South Korea, are demonstrated and available now for construction in the U.S. Other newer designs can be expected to be reviewed and design-certified over the next several years, making them also available.” EXPLANATION The sentence states that certain designs “are now available and have received U.S. Nuclear Regulatory Commission design certification.” This does not cover newer designs, such as the AP-1000 and the ESBWR.
230 5-22 OMB Sec 5.4.2 The strategy for the near term is to (1) increase the efficiency, reliability, and power generation of existing nuclear power plants; (2) continue the economic and clean air benefits of existing plants

51
Com-ment No.
Doc. Page No. *
Commenter Comments and Suggested Changes
Suggested Change
Accepted?
Suggested Change Accepted
with Modifications, as Shown Below
Suggested Change Was Not Accepted, with Explanation as
Shown Below through current and renewed license terms; and (3) provide technology to predict and measure the extent of materials damage from plant aging. Deleted text highlighted
231 5-22 OMB Sec 5.4.2 2nd para
In the longer term, next-generationadvanced nuclear energy systems could serve a vital role in the Nation’s diversified energy supply. Insert text Delete highlighted text
232 5-23 OMB 1st para amount of waste produced. In addition, these advanced technologies can include energy conversion systems that can produce non-electricity products such as hydrogen, desalinated water, and process heat Deleted text highlighted
233 5-23 OMB 2nd para promise as a safe, advanced, inexpensive, and environmentally sound emissions-free approach to providing reliable energy throughout the world. Deleted text highlighted Insert text
234 5-23 OMB Sec 5.4.3 1st bullet First bullet is to be eliminated Existing plant R&D is focused on improving availability and maintainability of nuclear plants; providing technology to predict and measure the extent of materials damage from plant aging; improving

52
Com-ment No.
Doc. Page No. *
Commenter Comments and Suggested Changes
Suggested Change
Accepted?
Suggested Change Accepted
with Modifications, as Shown Below
Suggested Change Was Not Accepted, with Explanation as
Shown Below level of security cost-effectively by evaluating alternative security concepts; and operating plants at higher power levels (power uprates), based on more accurate measurement and knowledge of safety margins, reduced consumption of onsite electrical power, and equipment upgrades. See Section 2.4.1 http://www.climatetechnology.gov/cctp-stratplan/may2005/May05-241-244EDIT.pdf The Nuclear Energy Plant Optimization (NEPO) Program has supported the use of nuclear energy in the United States by conducting research and development focused on improving the operations and reliability of currently operating nuclear power plants while maintaining a high level of safety and security. Improved efficiency is reflected in increases in power generating capacity, and improvements in reliability are reflected in increased operating predictability. The NEPO program has supported the Secretary of Energy’s priority to ensure U.S. energy security by protecting critical infrastructure that supports the production and delivery of electricity in the United States. NEPO is focusing on programs that help increase the supply of domestically produced energy. In addition, it has made significant progress toward addressing many of the aging material and generation optimization issues that have been identified as the key long-term issues facing current operating plants. Further information about current projects and recent results of the NEPO program can be obtained at the NEPO web site, http://nuclear.gov/nepo2/default-nepo.asp. Deleted text highlighted
235 5-23 NE 5.4.3 para 1st Revise: “The current federal portfolio focuses on three area:”
236 5-23 NE 5.4.3 1st bullet Eliminate the first bullet and Technology Option 2.4.1. Based on latest budget information, funding for the NE program to

53
Com-ment No.
Doc. Page No. *
Commenter Comments and Suggested Changes
Suggested Change
Accepted?
Suggested Change Accepted
with Modifications, as Shown Below
Suggested Change Was Not Accepted, with Explanation as
Shown Below assist currently operating U.S. nuclear plant (NEPO) will be discontinued.
237 5-23 OMB Sec 5.4.3 1st bullet 3rd para designed to pave the way for an industry decision by 2006 to order at least one new nuclear power plant for deployment in the 2010 time frame by the end of the decase. Deleted text highlighted Insert text
238 5-23 OMB Sec 5.4.3 2nd bullet Research on the Next-Generation Fission Generation IV Nuclear Energy Systems Initiative will lead to advanced nuclear energy systems that offer significant advances in the areas of sustainability, proliferation-resistance and physical protection, safety, and economics. These newer nuclear energy systems will replace or add to existing light water reactor capacity and should be available betweeny 2020 and 2030. To develop these next-generation advanced reactor systems, DOE manages the Generation IV Nuclear Energy Systems Initiative. Insert text Deleted text highlighted
239 5-23 NE 5.4.3 1st under 2nd bullet Revise the 2nd bullet under “Representative Technologies,” under “Technology Description,” of Technological Options 2.4.3., located at http://www.climatetechnology.gov/cctp-stratplan/may2005/May05-241-244EDIT.pdf: “Enhancements to certified designs with some engineering work already completed: AP-1000, ESBWR. (An NRC design certification rulemaking is scheduled for the AP-1000 in December 2005.) Provides a clarification with regard to the readiness of the AP-1000.

54
Com-ment No.
Doc. Page No. *
Commenter Comments and Suggested Changes
Suggested Change
Accepted?
Suggested Change Accepted
with Modifications, as Shown Below
Suggested Change Was Not Accepted, with Explanation as
Shown Below 240 5-23 OMB Sec 5.4.3 2nd para
Development of next-generation advanced nuclear energy systems Deleted text highlighted Insert text
241 5-23 NE 5.4.3 1st under 2nd bullet Revise the last two bullets under “RD&D Goals,” under “current Research, Development, and Demonstration” of Technological Options 2.4.3., located at http://www.climatetechnology.gov/cctp-stratplan/may2005/May05-241-244EDIT.pdf: “Industry decision to order a new nuclear power plant by 2009,” and “Operation of one or more new nuclear power plants in 2014.” Use latest estimates
242 5-23 NE 5.4.3 2nd under 2nd bullet Revise the opening sentence: “DOE’s A Roadmap to Deploy New Nuclear Power Plants in the United States By 2010, issued in October 2001, advises DOE on actions and resource requirements needed to put the country on a path to bringing new nuclear power plants online by 2010.” The first new nuclear plant since the mid-1990s is not expected to be online by 2010.
243 5-23 NE 5.4.3 3rd under 2nd bullet Update the time when new reactors are to be ordered and placed in operation from 2006 and 2010 to 2009 and 2014, respectively: “The program is designed to pave the way for an industry decision by 2009 to order at least one new nuclear power plant that will begin operation in 2014.” Use latest estimates
244 5-23 DOE/BER last para, 1st sentence: Suggest replacing “advises” with “is used as guidance by” A roadmap doesn’t advise per se but can be and is used as a guidance document.
245 5-24 OMB 1st para to establish the viability of next-generation advanced nuclear

55
Com-ment No.
Doc. Page No. *
Commenter Comments and Suggested Changes
Suggested Change
Accepted?
Suggested Change Accepted
with Modifications, as Shown Below
Suggested Change Was Not Accepted, with Explanation as
Shown Below energy system concepts. continuing The primary focus of these Gen IV systems will not only be designed to be generate electricity in a safe, economic, and secure manner; other possible benefits include the production of , but also to include energy conversion systems that produce non-electricity products such as hydrogen, desalinated water, ………….. continuing The technology roadmap defines and plans the necessary R&D to support the next generation of innovative advanced nuclear energy……. Deleted text highlighted Insert text
246 5-24 5.4.3 3rd under 2nd bullet Change the present tense to past tense: “The economics and business case for building new nuclear power plants has been evaluated as part of the Nuclear power 2010 program . Indicates that the business case study for building new nuclear plants has been completed.
247 5-24 OMB Bullet after figure ……..next-generation advanced nuclear reactors and to inform Deleted text highlighted Insert text
248 5-25 OMB 1st para gas-cooled Generation IV reactor Deleted text highlighted Insert text
249 5-25 OMB Next para new text The Nuclear Hydrogen Initiative (NHI) will conduct

56
Com-ment No.
Doc. Page No. *
Commenter Comments and Suggested Changes
Suggested Change
Accepted?
Suggested Change Accepted
with Modifications, as Shown Below
Suggested Change Was Not Accepted, with Explanation as
Shown Below research and development on enabling technologies, demonstrate nuclear-based hydrogen production technologies, and study potential hydrogen production schemes to support the President’s vision for a future Hydrogen economy. The objective of the Nuclear Hydrogen Initiative is to develop technologies that will apply heat available from advanced nuclear energy systems to produce hydrogen at a cost competitive with other alternative transportation fuels.
250 5-25 OMB Sec 5.4.4 deleted
251 5-25 OMB Sec 5.5 1st para Today there is little doubt cautious technical optimism that fusion Deleted text highlighted Insert text
252 5-25 OMB Sec 5.5 2nd para The two principal approaches for confining the fusion reaction are magnetic and inertial. Magnetic fusion relies on magnetic forces to confine the charged particles of the hot plasma fuel for sustained periods of fusion energy production. Inertial fusion relies on intense lasers, x-rays, or particle beams to rapidly compress a pellet of fuel to the point where fusion occurs, yielding a burst of energy that would be repeated to produce sustained energy production. New text: Fusion power generation offers a number of advantageous features. The basic sources of fusion fuel, deuterium and tritium, are actually heavy forms of hydrogen. Deuterium is abundantly available since it occurs naturally in water, and tritium can be derived from lithium, a light metal found in the earth’s crust. Tritium is radioactive, but the
yes

57
Com-ment No.
Doc. Page No. *
Commenter Comments and Suggested Changes
Suggested Change
Accepted?
Suggested Change Accepted
with Modifications, as Shown Below
Suggested Change Was Not Accepted, with Explanation as
Shown Below quantities in use at any given time are quite modest and can be safely handled. There are no chemical pollutants or carbon dioxide emissions from the fusion process. With appropriate advances in materials, the radioactivity of the fusion byproducts would be relatively short-lived, thereby obviating the need for extensive waste management measures. From a safety perspective, the fusion process poses little radiation risk to anyone outside the facility. Also, since only a small quantity of fuel is in the fusion system at any given time, there is no risk of a criticality accident or meltdown and little after heat to be managed in the event of an accident. The potential usefulness of fusion systems is great, but many scientific and technical challenges remain. COMMENT: As stated last year in multiple e-mails between OMB, OSTP, and DOE, inertial fusion is not being pursued for energy applications and so it’s inclusion in this plan runs Deleted text highlighted
253 5-26 State Dept Last para before 5.5 However, it is highly toxic radioactive for many
Not fusion issue
254 5-26 OMB 1st para Also, the cost of fusion electricity is likely to could be comparable to other environmentally responsible sources of electricity generation. Deleted text highlighted Insert text COMMENT These are dubious estimates at best. They have no idea what the regulatory & commercial landscape will be in 30 years.
yes

58
Com-ment No.
Doc. Page No. *
Commenter Comments and Suggested Changes
Suggested Change
Accepted?
Suggested Change Accepted
with Modifications, as Shown Below
Suggested Change Was Not Accepted, with Explanation as
Shown Below 255 5-26 OMB 2nd para
The following are some Two of the major scientific questions that need to be answered Deleted text highlighted Insert text
yes
256 5-26 DOE/BER 1st bullet: It seems a stretch to call supporting resolution of technical, institutional, and regulatory barriers as a “Future Research Direction”. Say what research is needed, if any, to overcome such barriers. If no research is needed, suggest moving this bullet to a different part of section 5.4 in the chapter.
no Just leave it as it was; move, if necessary and appropriate.
257 5-26 DOE/BER 3rd bullet: Same comment as above applies here also. What research is needed to enable finalization and NRC certification of the designs.
no Just leave it as it was; move, if necessary and appropriate.
258 5-26 OMB 2nd para, 2nd bullet How can radically new materials that will withstand the temperatures and forces needed for commercial fusion power be constructed? To what extent…. Deleted text highlighted COMMENT Fusion-only materials studies are also not to be a focus of the program.
no As Congress is seeming to act to restore the materials program to Fusion, FES does not agree with this COMMENT
259 5-26 OMB 3rd para ….. that are typical of a star must eventually be ……. over several decades. Fusion researchers can now define the specific challenges that must be overcome, see promising approaches to addressing those challenges, and confidently anticipate the availability of even more powerful computational and experimental measurement capabilities.
yes
59
Com-ment No.
Doc. Page No. *
Commenter Comments and Suggested Changes
Suggested Change
Accepted?
Suggested Change Accepted
with Modifications, as Shown Below
Suggested Change Was Not Accepted, with Explanation as
Shown Below Insert text Deleted text highlightedyes COMMENT: Cheerleading isn’t appropriate for such documents.
260 5-26 OMB Sec 5.5.2 1st para ……..explores a variety of magnetic and inertial confinement approaches and leads to the most promising commercial fusion concept from a technical standpoint. ----continuing……… To ensure the highest possible scientific return on limited resources, the DOE’s Fusion Energy Sciences program will extensively ------- continuing…… Large-scale experimental facilities will likely be necessary to test approaches for self-heated (burning) fusion plasmas, for inertial fusion experiments, and for testing materials and components under extreme conditions. Where appropriate, and the rewards, risks, and costs of these major facilities will need to be shared through international collaborations. The overall Fusion Energy Sciences effort will be organized around a set of four three broad goals. Deleted text highlighted Insert text
yes
261 5-26 OMB Sec 5.5.2, 2nd para The strategy includes the following areas of emphasis: Deleted text highlighted Delete the “s” on areas
yes
262 5-27 State Dept Remove 2nd bullet from 2nd para yes 263 5-27 OMB In sec 5.5.2, 2nd para, yes

60
Com-ment No.
Doc. Page No. *
Commenter Comments and Suggested Changes
Suggested Change
Accepted?
Suggested Change Accepted
with Modifications, as Shown Below
Suggested Change Was Not Accepted, with Explanation as
Shown Below Delete 2nd bullet Change to (no bullet) Fusion Energy Sciences Goal #2: Develop a fundamental understanding of plasma behavior sufficient to provide a reliable predictive capability for fusion energy systems. Basic research is required in turbulence and transport, nonlinear behavior and overall stability of confined plasmas, interactions of waves and particles in plasmas, the physics occurring at the wall-plasma interface, and the physics of intense ion beam plasmas. The strategy includes the following areas of emphasis:
264 5-27 OMB 2nd para Fusion Energy Sciences Goal #3: Determine the most promising approaches and configurations to confining hot plasmas for practical fusion energy systems. Both magnetic and inertial confinement approaches to fusion have potential for practical fusion-energy-producing systems. Within each of these two broad approaches, there are many possible configurations and designs for practical fusion systems, almost certainly including some yet to be conceived. The strategy includes the following areas of emphasis: Deleted text highlighted
yes
265 5-27 OMB 2nd para, 1-5 bullets Continue vigorous investigation of both magnetic and inertial
confinement approaches Explore through experiments and advanced simulation and
modeling, innovative magnetic confinement configurations, such as the National Spherical Torus Experiment (NSTX) at Princeton Plasma Physics Laboratory (PPPL) and a planned compact stellarator experiment, as well as smaller experiments at multiple sites
COMMENTS: QPS has not been requested or approved for construction.
Second bullet
deletion is incorrect
As Congress seems to be restoring
the materials
program to
“and a planned compact stellarator experiment, the National Compact Stellarator Experiment (NCSX) at PPPL.”
The COMMENT mistakenly associates the ‘planned compact stellarator experiment’ with QPS, an unapproved proposal, while the reference, now more completely written out, refers to an ongoing, approved project, NCSX.

61
Com-ment No.
Doc. Page No. *
Commenter Comments and Suggested Changes
Suggested Change
Accepted?
Suggested Change Accepted
with Modifications, as Shown Below
Suggested Change Was Not Accepted, with Explanation as
Shown Below Explore heavy ion beams, dense plasma beams, lasers, or
other innovative approaches (e.g., fast ignition) to produce high-energy density plasmas for potential applications to inertial fusion energy
Support research in high-energy density physics in coordination with other Federal agencies
Provide definitive data on inertial fusion target physics from the NIF, along with other experiments and simulations in the United States Fusion Energy Sciences Goal #4: Develop the new materials, components, and technologies necessary to make fusion energy a reality. The environment created in a fusion reactor poses great challenges to materials and components. Materials must be able to withstand high fluxes of high-energy neutrons and endure high temperatures and high thermal gradients, with minimal degradation. The strategy includes the following areas of emphasis: Deleted text highlighted
Fusion, FES disagrees with the
deletion of Goal #4
As Congress seems to be restoring the materials program to Fusion, FES disagrees with the deletion of Goal #4
266 5-28 DOE/BER 1st para, 1st sentence: It seems odd to read that the U.S. will employ a portfolio strategy to explore different fusion energy concepts. Such a strategy has been employed in fusion energy research by the U.S. for the past 30+ years.
Yes, with change as
noted
“will employ” would be better said as “will continue to employ”
267 5-28 OMB 5th para A modest scale IFE high energy density physics program is also underway with an emphasis on using heavy ion drivers to explore plasma/beam dynamics and potential applications to high energy density physics and future inertial energy systems. This program also explores innovative approaches to improving inertial fusion energy such as the fast ignition experiments. In addition, inertial fusion energy high energy density research benefits from existing experimental programs conducted for NNSA’s Deleted text highlighted
yes
62
Com-ment No.
Doc. Page No. *
Commenter Comments and Suggested Changes
Suggested Change
Accepted?
Suggested Change Accepted
with Modifications, as Shown Below
Suggested Change Was Not Accepted, with Explanation as
Shown Below Insert text
268 5-28 OMB Sec 5.5.4 Major investments in fusion materials, components and technologies for MFE and IFE are contingent upon favorable results from ITER. and NIF, respectively. With such favorable results, and favorable results from the accompanying scientific programs, a selection could be made in the 2020 time frame between the MFE and IFE approaches. A schematic indication of the overlapping sequence of research and technology development activities for either approach is shown in Figure 5-14. Deleted text highlighted Insert text
yes
269 5-28 OMB Delete graphic Figure 5-14
yes
270 5-29 OMB 1st para Burning plasmas represents the next major science and technology frontier for fusion research. In the major international effort mentioned above (ITER), the United States, Europe, Japan, China, Russia, and……. COMMENTS Including this figure is an explicit endorsement of the FESAC report that has been rejected by OSTP and OMB.
yes
271 5-29 OMB 2nd para In other efforts, the United States is proceeding with inertial fusion through the development of the NIF and other fusion energy work including driver, target fabrication and chamber technologies. The drivers include lasers, pulsed power driven z-pinches, and heavy ion accelerators. Efforts to explore the understanding and predictability of high energy density plasma physics, including the ramifications for energy-producing applications, are also underway
yes

63
Com-ment No.
Doc. Page No. *
Commenter Comments and Suggested Changes
Suggested Change
Accepted?
Suggested Change Accepted
with Modifications, as Shown Below
Suggested Change Was Not Accepted, with Explanation as
Shown Below The Nation’s large investment in inertial fusion for defense purposes has created the potential for developing it as a power source with relatively modest initial investments. However, any substantial additional investment in this the inertial fusion energy approach awaits successful demonstration of Deleted text highlighted
272 5-29 OMB Sec 5.5.4, 2nd para COMMENT: Including this figure is an explicit endorsement of the FESAC report that has been rejected by OSTP and OMB.
yes
273 5-29 OSTP bullet #2 from the top: Delete ", the National Spherical Torus Experient (NSTX) at Princeton Plasma Physics Laboratory (PPPL) and".
If purely stylistic, yes;
if substantive,
no
If this is meant as a substantive deletion, then, as NSTX is a central feature of the fusion program, FES disagrees.
274 5-29 State Dept Missing various period at the end of sentences. Sec 5.5.3 Delete the extra spaces before item 1
yes
275 5-30 OMB 4th from the last reference: U.S. Department of Energy (DOE). 2003b. A plan for the development of fusion energy. DOE/SC-0074. Washington, DC: U.S. Department of Energy. http://www.ofes.fusion.doe.gov/More_HTML/FESAC/DevReport.pdf.. Deleted text highlighted COMMENT OSTP and OMB haven’t accepted the implications for the expansive program beyond ITER that this advisory committee (NOT DOE!) study promotes.
yes
64
Com-ment No.
Doc. Page No. *
Commenter Comments and Suggested Changes
Suggested Change
Accepted?
Suggested Change Accepted
with Modifications, as Shown Below
Suggested Change Was Not Accepted, with Explanation as
Shown Below 276 5-30 State Dept 2nd to last para
Both the “Z” experiment at Sandia National Laboratories and the OMEGA
yes
277 5-31 State Dept Sec 5.5.4 3rd para
Prior to ITER operation in about 2014 (? Is too ambitious? ), experiments on a wide range of plasma
no No, “about 2014” is the current plan.
278 5-33 State Dept REFERENCES Energy Information Administration (EIA). 20042005. Annual energy outlook 20042005: with projections to 2025, DOE/EIA-0383(20042005). Washington, DC: U.S. Department of Energy. http://www.eia.doe.gov/oiaf/aeo/pdf/0383(2005).pdf U.S. Department of Energy (DOE). 2003a2005. Hydrogen fuel cells and infrastructure technologies multi-year research, development and demonstration plan, 2003-2010. Washington, DC: U.S. Department of Energy. http://www.eere.energy.gov/hydrogenandfuelcells/mypp/. U.S. Department of Energy (DOE). 2003b2003. A plan for the development of fusion energy. DOE/SC-0074. Washington, DC: U.S. Department of Energy. http://www.ofes.fusion.doe.gov/More_HTML/FESAC/DevReport.pdf.
yes
Chapter 6 279 USGS See comment about Chapter 6. Didn't we change "aquifers" to "formations"
due to someone else's input earlier?

65
Com-ment No.
Doc. Page No. *
Commenter Comments and Suggested Changes
Suggested Change
Accepted?
Suggested Change Accepted
with Modifications, as Shown Below
Suggested Change Was Not Accepted, with Explanation as
Shown Below 280 6-1 State Dept 1st parg. 2nd sentence The main focus areas for research and
development (R&D) related to carbon cycle management include: If current world energy production and consumption patterns persist into the foreseeable future, fossil fuels will remain the mainstay of global energy production well into the 21st century. The Energy Information Administration (EIA) projects that by 2025 about 88 percent of global energy demand will be met by fossil fuels, because fossil fuels will likely continue to yield competitive advantages relative to other alternatives (EIA 2004). In the United States, the use of fossil fuels in the electric power industry accounted for 39 percent of total energy-related CO2 emissions in 2003, and this share is expected to slightly increase to 41 percent in 2025. In 2025, coal is projected to account for 50 percent of U.S. electricity generation and for an estimated 81 percent of electricity-generated CO2 emissions. Natural gas is projected to account for 24 percent of electricity generation and about 15 percent of electricity-related CO2 emissions in 2025 (EIA 2005). Added text Old version If current world energy production and consumption patterns persist into the foreseeable future, fossil fuels may will remain the mainstay of global energy production well into the 21st century. The Energy Information Administration (EIA) projects that by 2025 about 87 88 percent of global energy demand will be met by fossil fuels, because fossil fuels will likely continue to yield competitive advantages relative to other alternatives (EIA 2004a). In the United States,
66
Com-ment No.
Doc. Page No. *
Commenter Comments and Suggested Changes
Suggested Change
Accepted?
Suggested Change Accepted
with Modifications, as Shown Below
Suggested Change Was Not Accepted, with Explanation as
Shown Below the use of fossil fuels in the electric power industry accounted for 39 percent of total energy-related CO2 emissions in 20012003, and this share is expected to slightly increase to 41 percent in 2025stay about the same for the next 25 years. In 2025, coal is projected to account for 50 percent of U.S. electricity generation and for an estimated 81 percent of electricity-generated CO2 emissions. Natural gas is projected to account for 27 24 percent of electricity generation and about 18 15 percent of electricity-related CO2 emissions in 2025 (EIA 2004b2005).
281 6-1 State Dept Human activities related to land conversion and agricultural practices have also contributed to the buildup of carbon dioxide to the atmosphere. During the past 150 years, land use and land-use changes were responsible for one-third of all human emissions of carbon dioxide (IPCC 2000). [Note: First sentence of Section 3.4.3.3.2 states: “Land-use change that results in net CO2 release to the atmosphere accounts for about 22 percent of today’s global CO2 emissions (IPCC 1996).” These two statements need to be reconciled.]
282 Section
6.1.1
EPA Terrestrial sequestration section 6.1.1 Role of Technology: Suggest adding a new short paragragh (paragraph #5) with economic estimates of sequestration potentials. This issue has been discussed several times over past 2 years by the working group. The paragraph could read as follows: Several recent studies have considered competition across land uses and sectors, or landowner response to public policies and a range of economic incentives (i.e. carbon prices) for carbon sequestration. For example, Lewandrowski et al. (2004) use the USMP model of USDA/ERS and estimate that at a carbon price of about $50/tC ($13.60/tCO2 eq), about 1-8 Tg C of cropland soil carbon and 29-72 TgC of afforestation would be generated over 15 years. Estimates using the ASM-GHG model (McCarl and Schneider, 2001) indicate

67
Com-ment No.
Doc. Page No. *
Commenter Comments and Suggested Changes
Suggested Change
Accepted?
Suggested Change Accepted
with Modifications, as Shown Below
Suggested Change Was Not Accepted, with Explanation as
Shown Below that at the same carbon price ($50/tC), 154 TgC of afforestation and cropland soil carbon potentially could be mobilized.
References: Lewandrowski, J. M. Peters, C. Jones, R. House, M. Sperow, M. Eve, and K. Paustian. 2004. Economics of Sequestering Carbon in the U.S. Agriclutural Sector. Technical Bulletin Number 1909. Washington, DC: U.S. Department of Agriculture, Economic Research Service. McCarl, B. and E. Schneider. 2001. U.S. Greenhouse Gas Mitigation Potential in U.S. Forestry and Agriculture. Science, vol, 294, December 21, pp. 2481-82.
283 6-2 DOE/BER 2nd para: The statement that “The potential storage capacity of the ocean is largely unknown, although some researchers estimate that it might hold thousands of Gt of C or greater” begs the questions as how the capacity is estimated. Is it based on how much CO2 could be pumped into the deep ocean without any adverse effects or something else? This should be clarified. Also, CO2 is not an inert gas. When it dissolves in water, carbonic acid is formed which will lower the pH of ocean water
284 6-2 DOE/BER 4th para, last sentence: Suggest modifying the last part of the sentence as follows: “…understanding of both the role oceans might play in storing carbon and the potential unintended consequences of using the oceans for carbon sequestration.”
285 6-3 OMB (Section 6.1.2 Para 1) the next logical short-term step would be to conduct pilot Deleted: logical the next short-term step would be to conduct pilot
286 6-3 OMB (Section 6.1.2 Para 1) Larger or full-scale tests would be appropriate within

68
Com-ment No.
Doc. Page No. *
Commenter Comments and Suggested Changes
Suggested Change
Accepted?
Suggested Change Accepted
with Modifications, as Shown Below
Suggested Change Was Not Accepted, with Explanation as
Shown Below Deleted: would Inserted: might Larger or full-scale tests might be appropriate within
287 6-3 DOE/FE The CCP project referenced here is entering its 2nd phase, and DOE is not a major participant in this phase. In fact, our relationship with the CCP group is somewhat strained due to their non-responsiveness regarding certain Phase 1 deliverables. We would thus not like to highlight our cooperation on this project. As an alternative, we would like to highlight Weyburn, and have attached a proposed replacement for Box 6-1. If this is substituted, the last sentence in Section 6.1.3 will need to be changed to something like: “Among these are a cooperative agreement with Canada (Weyburn Project – Box 6-1) and the Sleipner North Sea Project (Box 6-2). Box 6-1 WEYBURN II CO2 STORAGE PROJECT DOE is participating in this commercial-scale project that is using CO2 for enhanced oil recovery. CO2 is being supplied to the oil field in southern Saskatchewan, Canada, via a 320-kilometer pipeline from a North Dakota coal gasification facility. The goal is to determine the performance and undertake a thorough risk assessment of CO2 storage in conjunction with its use in enhanced oil recovery. The project will include extensive above and below ground CO2 monitoring.
288 6-3 DOE/BER 3rd para, 3rd sentence: What is “slip stream level testing” This should be defined.
289 6-3 DOE/BER last para: This para seems out of place. It is more appropriate for the Current Portfolio section of the chapter.
69
Com-ment No.
Doc. Page No. *
Commenter Comments and Suggested Changes
Suggested Change
Accepted?
Suggested Change Accepted
with Modifications, as Shown Below
Suggested Change Was Not Accepted, with Explanation as
Shown Below 290 6-3 OMB (Section 6.1.2 Para 1)
R&D investments in fully integrated capture and storage systems are needed to enable commercial Deleted: R&D investments in Inserted: demonstration Deleted: are needed to Inserted: help Fully integrated capture and storage demonstration systems help enable commercial
291 6-4 DOE/BER 3rd para, last sentence: Reword last part as follows: “…into a liquid, and the resulting mixture is then separated.”
292 6-4 State Dept The Carbon Sequestration Leadership Forum (CSLF) is an international collaborative effort to focus international attention on the development of carbon capture and storage technologies. The Forum is coordinating data gathering and R&D joint projects to advance the deployment of carbon sequestration technologies worldwide. Added text
293 6-4 OMB (Section 6.1.3 Para 3) A commercial installation will be evaluated at which petroleum coke will be burned and CO2 captured and injected for enhanced oil recovery. Seven cases will be evaluated under the current program. Deleted: A commercial installation will be evaluated at which petroleum coke will be burned and CO2 captured and injected for enhanced oil recovery Want to know what project that is.
294 6-4 OMB (Section 6.1.4 Para 1)

70
Com-ment No.
Doc. Page No. *
Commenter Comments and Suggested Changes
Suggested Change
Accepted?
Suggested Change Accepted
with Modifications, as Shown Below
Suggested Change Was Not Accepted, with Explanation as
Shown Below Areas identified for consideration for new or increased future emphasis include: Deleted: new or increased Added: Potential Future Potential areas identified for consideration for future emphasis include:
295 6-6 OMB (Section 6.2.1 Para 2) O2 ECBM recovery as a way to increase production of this resource. Future projects could demonstrate the commercial viability of this technology. Deleted: Future projects could demonstrate the commercial viability of this technology. O2 ECBM recovery as a way to increase production of this resource
296 6-7 OMB (Section 6.2.1 Para 3) Assessments of storage capacity will be needed to better understand the potential of geologic formations for CO2 storage. Deleted: will be needed Inserted: could help Assessments of storage capacity could help to better understand the potential of geologic formations for CO2 storage.

71
Com-ment No.
Doc. Page No. *
Commenter Comments and Suggested Changes
Suggested Change
Accepted?
Suggested Change Accepted
with Modifications, as Shown Below
Suggested Change Was Not Accepted, with Explanation as
Shown Below 297 6-7 State Dept 6.2.1 Question at end of first para. [What are the assumptions of
the mpg/car?] Second para questions. Coal-bed methane is the fastest growing source of domestic natural gas supply. [I find this hard to believe. What is the source of this statement?] Pilot projects have demonstrated the value of CO2 ECBM recovery as a way to increase production of this resource. Future projects could demonstrate the commercial viability of this technology. Comments
298 6-7 State Dept 6.2.2 The current DOE/Fossil Energy portfolio attempts to address important carbon storage-related issues consistent with the Carbon Sequestration Technology Roadmap and Program Plan (DOE 2005).
Deleted 2004 Text added
299 6-7 OMB (Section 6.2.2) Planning for large-scale demonstrations must begin now, since many of the actions being undertaken have long lead times. These activities are needed to test the large-scale viability of point-source capture and storage systems and demonstrate to interested parties the potential of these systems. Deleted: Planning for large-scale demonstrations must begin now, since many of the actions being undertaken have long lead times. These Deleted: large-scale Inserted: Field-validation

72
Com-ment No.
Doc. Page No. *
Commenter Comments and Suggested Changes
Suggested Change
Accepted?
Suggested Change Accepted
with Modifications, as Shown Below
Suggested Change Was Not Accepted, with Explanation as
Shown Below Field validation activities are needed to test the viability of point-source capture and storage systems and demonstrate to interested parties the potential of these systems.
300 6-8 USGS Page 6-8 refers to "saline formations". This should be changed to read "saline aquifers"
301 6-8 DOE/BER 2nd para, 3rd sentence: Reword as follows: “This can cause a sharp drop in permeability, thereby impeding the follow of CO2 and the recovery of methane.”
302 6-9 OMB (Section 6.2.3 Para 8) An efficient mechanism is needed for deploying technologies developed under the core RD&D program. Deleted: deploying Inserted: enabling Inserted: deployment of An efficient mechanism is needed for enabling deployment of technologies developed under the core RD&D program.
303 6-9 OMB (Section 6.2.3 Para 10) It will provide a way to test some of the key technologies developed. Deleted: test
73
Com-ment No.
Doc. Page No. *
Commenter Comments and Suggested Changes
Suggested Change
Accepted?
Suggested Change Accepted
with Modifications, as Shown Below
Suggested Change Was Not Accepted, with Explanation as
Shown Below Inserted: demonstrate It will provide a way to demonstrate some of the key technologies developed
304 6-10 DOE/BER 1st bullet: Change “depleting” to “depleted”
305 6-10 DOE/BER 6th bullet: Isn’t part of the R&D need to develop practices that minimize leakage? Also, what kinds of leakage impacts are meant here? Impacts on human safety or something else? This is too vague as worded.
306 6-10 DOE/BER 7th bullet: Not clear what “CO2 properties in shales” means? Is it the behavior of CO2 injected into shale formations, geochemical reactions between CO2 and shales, or something else? Needs to be clarified.
307 6-10 DOE/BER 9th bullet: Estimating the cost of geological sequestration doesn’t seem like research. How about “Developing improved methods for estimating the overall costs of geological sequestration, including…”
308 6-10 to 6-11
OMB Section 6.2.4 Para at the end of page 6-10) Pursuit of novel concepts is needed to reach program goals. For example, some of the lowest cost estimates for capture/sequestration options are for systems where flue gas components from coal-fueled plants are not scrubbed but rather stored in geologic formations with CO2. This eliminates the need for costly flue gas cleanup systems, but work is needed to determine the potential effects of this option. Novel concepts, demonstrated at the laboratory scale, will be required to meet to long-term goals of CCTP. Technological innovations could come from concepts associated with areas not normally related to traditional energy R&D fields.
309 6-11 DOE/BER 1st sentence: The sentence is awkward and unclear. Saying novel concepts will be required is too vague. What kinds of novel concepts? Are they pilot-scale field tests of the concepts or something else. It should be possible to be more specific about the kinds of concepts that will be needed.

74
Com-ment No.
Doc. Page No. *
Commenter Comments and Suggested Changes
Suggested Change
Accepted?
Suggested Change Accepted
with Modifications, as Shown Below
Suggested Change Was Not Accepted, with Explanation as
Shown Below 310 6-12 DOE/BER 4th para, 2nd sentence: Suggest inserting RD&D after “balanced” In
the next sentence, insert “:development of improved” before “techniques.
311 6-12 DOE/BER last bullet: Insert “goods and” after ecosystem – “ecosystem goods and services”
312 6-13 DOE/BER 2nd bullet: Add “and identifying ways to avoid conflicts between the two” at the end of the bullet. Knowing the relationship between the two may not be sufficient if some policies turn out to be in conflict with sequestration goals.
313 6-13 DOE/BER 6th bullet: Developing incentives for implementation seems like a policy rather than a research issue. What kinds of research would be needed?
314 6-13 DOE/BER last sentence of first para under 6.3.3: The point of the sentence in the context of the current portfolio is unclear. The reference is a result, not part of the current RDD&D portfolio.
315 6-14 DOE/BER 8th and 9th bullets: Based on the titles, these bullets appear to be in the wrong chapter because they deal with measurement and monitoring. Move them to Chapter 8.
316 6-14 DOE/BER second to last bullet: Change “Establish” to “Quantify”
317 6-14 OMB (Sections 6.3.4 Para 1) particular land use or management practice. Research is needed to Deleted: Research is needed to Inserted: Potential research areas include:
318 6-14 to 6-16
OMB (Section 6.3.4 Bulleted Sections) Replaced verbs in passive voice to verbs in active voice, for example Design to Designing
319 6-16 OMB (1st bulleted item on the list)

75
Com-ment No.
Doc. Page No. *
Commenter Comments and Suggested Changes
Suggested Change
Accepted?
Suggested Change Accepted
with Modifications, as Shown Below
Suggested Change Was Not Accepted, with Explanation as
Shown Below Better understand the implications of potential Deleted: Better Inserted: Improving Inserted: ing ending to the word understand. Improving understanding of the implications of potential
320 6-16 DOE/BER 5th bullet: The last sentence of the bullet is unclear. Separation of what? Suggest rewording the last part of the sentence as follows: “…increase yields and provide a more effective basis for increasing the conversion efficiency of biomass to fuels, chemicals, and other bioproducts.”
321 6-17 DOE/BER 1st sentence: Provide a reference supporting the statement that any far-field impact of injecting CO2 into the ocean would be similar to the impact of anthropogenic CO2 absorbed from the atmosphere. If there are no supporting references to support the statement, either delete it or modify it.
322 6-17 DOE/BER 4th para, 2nd sentence: Not all of the fixed carbon will be oxidized before it reaches the ocean bottom. Modify the sentence to read “…the sinking of some of this organic carbon to the deep ocean, where some of it will be oxidized back into carbon dioxide. Also, provide references supporting the statement in the second to last sentence that the long term effects on deep-sea ecosystems at large spatial scales are likely to be similar whether CO2 is added to the deep ocean by industrial processes or through fertilization. As far as we know, there is no published scientific evidence to support such a statement.
323 6-17 OMB (Section 6.4.2 Para 2) This requires both observations and modeling Deleted: requires Inserted: is being investigated through

76
Com-ment No.
Doc. Page No. *
Commenter Comments and Suggested Changes
Suggested Change
Accepted?
Suggested Change Accepted
with Modifications, as Shown Below
Suggested Change Was Not Accepted, with Explanation as
Shown Below This is being investigated through both observations and modeling
324 6-18 OMB (Section 6.4.4 Para 1) Better understanding the potential environmental impacts of ocean carbon sequestration is a high research priority. Research is also needed to more fully Deleted: high research priority Deleted: is also needed Inserted: potential future research direction Inserted: would help Better understanding the potential environmental impacts of ocean carbon sequestration is a potential future research direction. Research would help to more fully
325 6-19 OMB (Section 6.4.4 Para 2) There are a multitude of R&D needs regarding the effectiveness and environmental consequences of ocean fertilization. The most pressing question is whether iron enrichment increases the downward transport of carbon from the surface waters to the deep sea. This is crucial Inserted: Opportunities Deleted: Needs Inserted: Would help Deleted: is crucial There are a multitude of R&D opportunities regarding the effectiveness and environmental consequences of ocean fertilization. The most pressing question is whether iron enrichment increases the downward transport of carbon from the surface waters to the deep sea. This would help
326 6-20 State Dept Davison, J., P. Freund, and A. Smith. 2001. Putting carbon

77
Com-ment No.
Doc. Page No. *
Commenter Comments and Suggested Changes
Suggested Change
Accepted?
Suggested Change Accepted
with Modifications, as Shown Below
Suggested Change Was Not Accepted, with Explanation as
Shown Below back into the ground. Technical Report. Paris: International Energy Agency (IEA) Greenhouse Gas R&D Programme. http://www.ieagreen.org.uk/putcback.pdf DOE (See U.S. Department of Energy) Energy Information Administration (EIA). 2004. International energy outlook 2004. Washington, D.C: U.S. Department of Energy. http://www.eia.doe.gov/oiaf/ieo/pdf/0484(2004).pdf Energy Information Administration (EIA). 2005. Annual energy outlook 2005. Washington, DC: U.S. Department of Energy. http://www.eia.doe.gov/oiaf/aeo/pdf/0383(2005).pdf Added text Original
Davison, J., P. Freund, and A. Smith. 2001. Putting carbon back into the ground. Technical Report. Paris: International Energy Agency (IEA) Greenhouse Gas R&D Programme. http://www.ieagreen.org.uk/putcback.pdf DOE (See U.S. Department of Energy) Energy Information Administration (EIA). 2004a2004. International energy outlook 2004. Washington, D.C: U.S. Department of Energy. http://www.eia.doe.gov/oiaf/ieo/pdf/0484(2004).pdf Energy Information Administration (EIA). 2004b2005. Annual energy outlook 20042005. Washington, DC: U.S. Department of Energy. http://www.eia.doe.gov/oiaf/aeo/pdf/0383(2005).pdf
327 6-21 State Dept Intergovernmental Panel on Climate Change (IPCC). 2001a. Chapter 3: the carbon cycle and atmospheric carbon dioxide. In Climate change 2001: Working Group I: the scientific basis.

78
Com-ment No.
Doc. Page No. *
Commenter Comments and Suggested Changes
Suggested Change
Accepted?
Suggested Change Accepted
with Modifications, as Shown Below
Suggested Change Was Not Accepted, with Explanation as
Shown Below Cambridge, UK: Cambridge University Press. http://www.grida.no/climate/ipcc_tar/wg1/095.htm Intergovernmental Panel on Climate Change (IPCC). 2001b. Summary for policymakers to climate change 2001: synthesis report of the IPCC third assessment report. Cambridge, UK: Cambridge University Press. http://www.ipcc.ch/pub/un/syreng/spm.pdf Intergovernmental Panel on Climate Change (IPCC). 2001c. Chapter 4: technological and economic potential of options to enhance, maintain, and manage biological carbon reservoirs and geo-engineering. In Climate change 2001: mitigation: contribution of working group iii to the third assessment report. Cambridge, UK: Cambridge University Press. http://www.grida.no/climate/ipcc_tar/wg3/155.htm Joyce, L.A., and R. Birdsey, eds. 2000. The impact of climate change on American’s forests: a technical document supporting the 2000 USDA Forest Service RPA assessment, 133. Gen. Tech. Rep. RMRS-GTR-59. Fort Collins, Colorado: U.S. Department of Agriculture. http://www.fs.fed.us/rm/pubs/rmrs_gtr059.pdf Urls added
328 6-22 State Dept U.S. Department of Energy (DOE). 1999. Carbon sequestration: research and development. DOE/SC/FE-1. Washington, DC: U.S. Department of Energy. http://fossil.energy.gov/programs/sequestration/publications/1999_rdreport/index.html

79
Com-ment No.
Doc. Page No. *
Commenter Comments and Suggested Changes
Suggested Change
Accepted?
Suggested Change Accepted
with Modifications, as Shown Below
Suggested Change Was Not Accepted, with Explanation as
Shown Below U.S. Department of Energy (DOE). 2005. Carbon sequestration technology roadmap and program plan 2005. Washington, DC: Office of Fossil Energy. http://fossil.energy.gov/programs/sequestration/publications/programplans/2005/sequestration_roadmap_2005.pdf New url and date changed for 2004 to 2005 Changes updates
Chapter 7 329 Gener
al DOT the concept of trade-offs amongst GHGs is only briefly alluded to on
page 7-28. Should highlight this feature in this section more prominently.
330 7-1 State Dept 1st para…. When concentrated in the Earth’s atmosphere, these non-CO2 GHGs can contribute to climate change. The more significant of these are methane (CH4) from natural gas production, Deleted text
331 7-1 DOE/BER 2nd para, last sentence: Not apparent why only ozone precursors are mentioned here. Ozone itself is a greenhouse gas. Suggest deleting “precursors”
332 7-1 EPA Box 7-1: What are the other GHGs? – Please change the 2nd sentence to read as follows, “Tropospheric ozone, tropospheric ozone precursors, and black carbon (soot) also have important climatic effects.”
333 7-2 State Dept 1st para, last sentence: Insert text GWP values do allow for a comparison of the impacts of emissions and reductions of different gases, although they typically have an uncertainty of ±35 percent (EPA 2005).
334 7-2 State Dept Last bullet… emissions currently 10 percent below Delete “currently and input “in 2003”

80
Com-ment No.
Doc. Page No. *
Commenter Comments and Suggested Changes
Suggested Change
Accepted?
Suggested Change Accepted
with Modifications, as Shown Below
Suggested Change Was Not Accepted, with Explanation as
Shown Below 335 7-3 State Dept 1st sentence: change 2004 to 2005
336 7-3 DOE/BER 1st para, last sentence: Change “and” to “or”
337 7-4 DOE/BER 3rd para, last sentence: Where are the stabilization ranges of CO2 concentrations “commonly discussed” Cite a reference. Also, since CO2 forcing is already >1Watt/square meter, staying within 1 watt/square meter seems pointless. This needs clarification
338 7-4 DOE/BER 5th para, last sentence: The sentence is confusing because it seems to imply that the strategy offer maximum climate protection in the near term and then a declining protection in the longer term. Is that what the text is meant to imply? If so, it’s not a sound strategy. If not, what does the sentence mean?
339 7-5 to 7-6
State Dept Tables: Numbers changed
340 7-5 DOE/BER Table 7-1, 4th row: The column heading is misstated. It must be emissions of high GWP gases, not emissions from….
341 7-5 DOE/BER 1st para: in the first sentence, references to the tables are incorrect. First, cite Table 7.1 after the first “emissions in the second line of the para. Secondly, Table 7-2 does not show that nearly 50 percent of global methane emissions come from the energy and waste sectors because the total methane emissions are not shown in the table.
342 7-5 DOE/BER Table 7-2: The total for global emissions in the 4th column of the table is incorrect. The total should be 3665 Tg CO2 equivalent; not 2336.
343 7-6 State Dept Sec.7.1.1 Number changes estimated 172 Tg CO2 equivalent to the atmosphere in 2003 (EPA 2005). Globally, landfills are also a significant emission source, accounting for an estimated 814 Tg CO2 equivalent in 2000 or almost 10 percent of global non-CO2 emissions (Table 7-2). …ect… last sentence……Southeast Asia (12%) (EPA 2004). These numbers changed

81
Com-ment No.
Doc. Page No. *
Commenter Comments and Suggested Changes
Suggested Change
Accepted?
Suggested Change Accepted
with Modifications, as Shown Below
Suggested Change Was Not Accepted, with Explanation as
Shown Below 344 7-6 DOE/BER second para, 2nd sentence: Longer term does not suggest
technologies “on the cusp of commercialization.” This apparent inconsistency needs to be fixed.
345 7-6 DOE/BER section 7.1.1, last sentence: Does the 10 percent refer to the estimated global emissions of methane from land fills only. If so, insert “of methane from landfills” after emissions.”
346 7-7 DOE/BER Section 7.1.1.4: The first sentence refers to efforts to improve landfill gas collection (LFG) efficiencies. In the last bullet immediately preceding this section, R&D on improving LFG collection efficiency is cited as part of the current portfolio. If its part of the current portfolio, what is the current portfolio not providing that will require additional or new R&D in the future?
347 7-8 State Dept Last para… accounting for about 10 percent of total anthropogenic methane emissions (EPA 2004). Methane trapped in coal Text changes
348 7-9 State Dept 1st para…number/date changes.. Emissions of CMM in the United States in 2003 were 54 Tg CO2 equivalent (EPA 2005) and are projected to increase to 70 Tg CO2 equivalent by 2010 (EPA 2005). Worldwide emissions of methane from the coal industry are estimated to be 432 Tg CO2 equivalent and are expected to rise to 495 Tg CO2 equivalent by the year 2010 as coal production increases (EPA 2004). Number/date changes
349 7-9 DOE/BER section 7.1.2.2: Phrases like future R&D will need to or will be needed doesn’t seem like a strategy.
350 7-10 DOE/BER section 7.1.3, 2nd para, 3rd sentence: the sentence doesn’t make sense. In effect, it says measures to reduce emissions have the ancillary benefit of reducing emissions. Reword the sentence.
351 7-11 DOE/BER 1st para, last sentence: The sentence begs the question as to why actions that are cost effecting aren’t being implemented. Also, if the

82
Com-ment No.
Doc. Page No. *
Commenter Comments and Suggested Changes
Suggested Change
Accepted?
Suggested Change Accepted
with Modifications, as Shown Below
Suggested Change Was Not Accepted, with Explanation as
Shown Below actions have wide applicability, why say they “can” have such applicability. Delete “can”.
352 7-11 DOE/BER section 7.1.3.2: Not clear how the three bullets will help increase market penetration of current emission reduction technologies. Also, in the second bullet, what would isotopic markers provide in terms of GHG measurement and monitoring technologies?
353 7-11 DOE/BER section 7.1.3.3: This section is not informative at all.
354 7-11 State Dept Sec 7.1.3 1st para Date changes in 2000 (EPA 2004). Russia last sentence: (EPA 2005, 2004). 2nd para: 2020 (EPA 2004). In
355 7-12 State Dept 1st bullet Date change emissions (EPA 2005).
356 7-12 DOE/BER Table 7-4: The total for global emissions in 4th column is incorrect. The total should be 5439 Tg CO2 equivalents, not 5428.
357 7-13 State Dept Sec 7.2 Date Change (EPA 2005). Globally, agricultural sources of methane and nitrous oxide contribute an estimated 5,428 Tg CO2 equivalent, nearly 60 percent of global non-CO2 emissions (EPA 2004).
358 7-13 State Dept Table 7.4 Number change
359 7-13 DOE/BER 1st para, last sentence: Reword last part as follows: “…ability to compete with processes that result in plant available nitrogen being lost from soil-plant system.”
360 7-14 DOE/BER 2nd bullet: Is there scientific evidence of this or is it wishful thinking/hoping?
361 7-14 DOE/BER section 7.2.1.4, first bullet: Not clear what precision agriculture
83
Com-ment No.
Doc. Page No. *
Commenter Comments and Suggested Changes
Suggested Change
Accepted?
Suggested Change Accepted
with Modifications, as Shown Below
Suggested Change Was Not Accepted, with Explanation as
Shown Below would do to help reduce non-CO2 GHG emissions. The point of this bullet is unclear with respect to the plan. 2nd bullet: Suggest inserting “of microbial processes to reduce N2O emissions” after “manipulation” and replace “GHG” with “such” 3rd bullet: reword last part as follows: “…to understand how N2O emissions from agricultural soils are affected by environmental and management changes.”
362 7-15 DOE/BER section 7.2.2.1: The 3rd sentence of the paragraph doesn’t make sense. Something seems to have been left out of the sentence.
363 7-16 State Dept Sec 7.2.2 1st para… Date change 2000 (EPA 2004).
364 7-16 DOE/BER section 7.2.2.3: This section is not informative. Suggest expanding it to describe what’s in the current portfolio of technology RDD&D.
365 7-16 DOE/BER section 7.2.2.4, 4th bullet: Is this more than scaling from single farm to multiple farm operations? If so, what more R&D is needed, if any?
366 7-17 State Dept Sec 7.2.3 Date change 2000 (EPA 2004).
367 7-17 DOE/BER second to last bullet: Not clear how this will reduce methane emissions from livestock enteric fermentation. Expand to explain.
368 7-18 DOE/BER 1st bullet: By engineered microbes competitive with natural rumen microbes, does it mean non-methanogenic microbes or something else?
369 7-18 DOE/BER 3rd bullet: It’s more appropriate to say “drugs” rather than “vaccinations”. Vaccinations are intended to prevent a disease. Production of methane in the rumen of livestock is not a disease.
370 7-19 State Dept Sec 7.2.4 1st para Date Change ….methane (EPA 2004).
371 7-19 State Dept Sec 7.3 1st para Dated Change

84
Com-ment No.
Doc. Page No. *
Commenter Comments and Suggested Changes
Suggested Change
Accepted?
Suggested Change Accepted
with Modifications, as Shown Below
Suggested Change Was Not Accepted, with Explanation as
Shown Below In 2003, high-GWP gases represented 13 percent of total U.S. non-CO2 GHG emissions and 4 percent of global non-CO2 emissions in 2000 (Table 7-5)
372 7-20 State Dept Table Number change
373 7-20 DOE/BER section 7.3.1.4, 2nd para: Insert “both” after “that” in the first sentence to improve clarity.
374 7-21 DOE/BER section 7.3.2.2, last sentence of 1st para: Abatement of what? 2nd para, 2nd sentence: What does “Opportunities exist for both near- and long-term RD&D on technology? What are the opportunities?
375 7-21 DOE/BER section 7.3.2.3, 1st sentence: Insert “reducing” after “for” Also in the 2nd sentence, it’s not clear why it’s necessary to refer to EPA’s pollution prevention framework. Is it EPA’s or industries preferred option and in what way it is preferred relative to or with respect to other possible options?
376 7-22 DOE/BER 2nd bullet: If research to find substitutes for SF6 is part of the current portfolio, is it the actual research that is a challenge or something else. As worded, the bullet is unclear about what the challenge is.
377 7-22 DOE/BER section 7.3.2.4, 2nd para: This section is about high GWP gases. Hence, the para is out of place and should be deleted because it adds nothing here.
378 7-22 DOE/BER last para: The para is too vague. What specific directions should the research take?
379 7-23 DOE/BER 1st para: Insert “of N2O” after emissions in the second line. Insert “for reducing N2O emissions” after priorities in the second to last line.
380 7-24 DOE/BER second 7.4.1.3, 1st para: Modify part of the sentence as follows to improve clarify “evaluating the importance, as an N2O source, of atmospheric nitrogen from especially combustion that is deposited on land and re-emitted to the atmosphere as N2O;”
381 7-24 State Dept Sec 7.4. 1st para…

85
Com-ment No.
Doc. Page No. *
Commenter Comments and Suggested Changes
Suggested Change
Accepted?
Suggested Change Accepted
with Modifications, as Shown Below
Suggested Change Was Not Accepted, with Explanation as
Shown Below Date changes Stationary and mobile source combustion and the production of various industrial acids account for about 9 percent of non-CO2 emissions in the United States and 4 percent globally (EPA 2005, 2004) ………… . In 2003, the U.S. N2O emissions from combustion and industry accounted for nearly 7 percent of total non-CO2 GHG emissions, with the combustion sources accounting for over 70 percent of these (EPA 2005). Table 7-6 shows N2O emissions from combustion and industrial sources. R&D priorities differ between N2O
382 7-24 State Dept Sec 7.6 Inserted text: Why not use the most recent (i.e., 2003) data for the U.S. rather than 2000? In any event the revised 2000 U.S. CH4 emissions data are given, as well as the 2003 data (in parentheses).
383 7-24 State Dept Table Number change
384 7-24 State Dept Sec 7.4.1 Changed text from: The largest non-agricultural contributors to N2O emissions are the combustion of fossil fuels by mobile and stationary sources. Nitrous oxide can be formed under certain conditions during the combustion process and during treatment of exhaust or stack gases by catalytic converters. New Text: Combustion of fossil fuels by mobile and stationary sources is the largest non-agricultural contributor- to N2O emissions. Nitrous oxide can be formed under certain conditions during the combustion process and during treatment of exhaust or stack gases by catalytic converters.
385 7-24 DOE/BER section 7.4.1.4, 1st para, last sentence: This area is listed as part of the current portfolio in section 7.4.1.3: If so, what additional or new research is needed. The plan is not compelling when identical research areas appear in both the current portfolio and the future

86
Com-ment No.
Doc. Page No. *
Commenter Comments and Suggested Changes
Suggested Change
Accepted?
Suggested Change Accepted
with Modifications, as Shown Below
Suggested Change Was Not Accepted, with Explanation as
Shown Below research directions. This does not necessarily mean there is no need for future research beyond that in the current portfolio. However, if both are needed, the text should be specific about what more is needed beyond that in the current portfolio.
386 7-24 DOE/BER first bullet: This bullet is redundant with text in the first para of this section. Delete either the bullet or the redundant text in the paragraph.
387 7-24 OSTP Section 7.4.1.4, paragraph 1, line 1: Replace "has" with "have".
388 7-25 State Dept Sec.7.4.1.2 Changed text from: Understanding how N2O is formed during combustion and under what circumstances catalytic technologies contribute to N2O emissions is key to identifying the most promising approaches and technologies for reducing N2O emissions. New text: Key to identifying the most promising approaches and technologies for reducing N2O emissions is understanding how N2O is formed during combustion and under what circumstances catalytic technologies contribute to N2O emissions
389 7-25 State Dept Sec 7.4.1.4 Changed text from: Limited but recent additional collection of N2O test data has have provided statistically reliable N2O emissions estimates for most gasoline-powered passenger cars and light duty trucks. It will be important to develop vehicle- and engine-testing programs to generate N2O emissions data about N2O emissions New Text: Limited but recent N2O test data have provided statistically reliable N2O emissions estimates for most gasoline-powered passenger cars and light duty trucks. It will be important to develop vehicle- and engine-testing programs to generate N2O emissions data for a variety of vehicles

87
Com-ment No.
Doc. Page No. *
Commenter Comments and Suggested Changes
Suggested Change
Accepted?
Suggested Change Accepted
with Modifications, as Shown Below
Suggested Change Was Not Accepted, with Explanation as
Shown Below 390 7-25 State Dept Sec 7.4.1.4 2nd para: Changed text from
research on technologies that would form the basis for identification of new New text: research that would form the basis for identification of new
391 7-25 DOE/BER section 7.4.2: In the last sentence, delete “nitrous oxide” and the parentheses around N2O.
392 7-26 State Dept Sec 7.4.2 changed text from: of nitrous oxide (N2O), New text: of N2O,
393 7-26 EPA Section 7.5, 2nd Paragraph, 2nd sentence, please delete “with a high-degree of certainty” and add “precisely” before the word “quantify”
394 7-27 DOE/BER first bullet: Not clear how reducing the heat island effect deals with the black carbon and ozone problems.
395 7-27 DOE/BER second bullet: Not clear how this is part of a strategy. What is the strategy?
396 7-27 State Dept Sec 7.5 Old text changed from: Understanding of the role of black carbon (BC) and tropospheric ozone in climate change is still evolving. Large Uncertainties uncertainties remain large with regard to emission levels, atmospheric concentrations, net climatic effects, and mitigation potential. Research to date indicates, however, that these substances influence the global radiation budget contribute to climate change, particularly at regional scales. Complicating our understanding is that BC, which tends to have a warming effect, is co-emitted with organic carbon (OC), which tends to have a cooling effect on climate, much like sulfate aerosols. New text:

88
Com-ment No.
Doc. Page No. *
Commenter Comments and Suggested Changes
Suggested Change
Accepted?
Suggested Change Accepted
with Modifications, as Shown Below
Suggested Change Was Not Accepted, with Explanation as
Shown Below Understanding of the role of black carbon (BC) and tropospheric ozone in climate change is still evolving. Large uncertainties remain with regard to emission levels, atmospheric concentrations, net climatic effects, and mitigation potential. Research to date indicates, however, that these substances influence the global radiation budget, particularly at regional scales. Complicating our understanding is that BC, which tends to have a warming effect, is co-emitted with organic carbon (OC), which tends to have a cooling effect much like sulfate aerosols.
397 7-27 DOE/BER Section 7.5.3, 2nd bullet, first item: Planting shade trees could also exacerbate the ozone problem because natural emissions from trees (terpenes) contribute to tropospheric ozone formation. Also, the last sub-bullet under “representative technologies” should not be indented as a sub-bullet
398 7-27 DOE/BER section 7.5.4, 1st para and 1st bullet: Should make it clear that research described here is part of the CCSP, not the CCTP.
399 7-27 OSTP? Section 7.5.4, bullet #1: Reference the Strategic Plan for the U.S. Climate Change Science Program.
400 7-30 State Dept Sec 7.6 highlighted
401 7-31 State Dept Deleted ref: U.S. Environmental Protection Agency (EPA). 2004a. Inventory of U.S. greenhouse gas emissions and sinks: 1990 – 2002. #430-R-04-003. Washington, DC: U.S. Environmental Protection Agency.
402 7-31 State Dept Date change on ref: U.S. Environmental Protection Agency (EPA). 2004. Global emissions of non-CO2 greenhouse gases, 1990 – 2020. Washington, DC: Environmental Protection Agency.
403 7-31 State Dept Date change on ref: U.S. Environmental Protection Agency (EPA). 2005. Inventory of U.S. greenhouse gas emissions and sinks: 1990 – 2003. #430-R-

89
Com-ment No.
Doc. Page No. *
Commenter Comments and Suggested Changes
Suggested Change
Accepted?
Suggested Change Accepted
with Modifications, as Shown Below
Suggested Change Was Not Accepted, with Explanation as
Shown Below 05-003. Washington, DC: U.S. Environmental Protection Agency.
Chapter 8 404 Gener
al DOT Instrumentation should be explicitly referenced -- it is often
overlooked, which prevents us from making good measurements. Often times people forget that "instrumentation" is a key component of measurement systems.
Also, characterizing emissions from existing sources is critical and should not be buried under "inventories" in page 8-1.
405 General
DOT This discussion really covers measuring, monitoring and modeling -- suggest the title be modified to include the important component of modeling.
406 General
OSTP Chapter 8: Highlight activities that call for measurements that are not already part of the CCSP.
407 General
OSTP Section 8.1: Replace title with "Measurement and Monitoring Technology".
408 8-1 OMB (Para 2) All such measurement and monitoring systems need further development Deleted: need Inserted: could be improved through All such measurement and monitoring systems could be improved through further development
409 8-1 OSTP second paragraph: This is the place to introduce GEO, GEOSS and IEOS, not wait to page 8-17 to explain what it is and how the activity links with CCTP T he following is an explanation of IEOS and GEOSS: Another Bush Admini-stration Initiative, Integrated Earth Observations, will play an important, complementary role to the Climate Change Science and Technology Progams. On February 16, 2005, 55 countries endorsed a 10-year plan to develop and

90
Com-ment No.
Doc. Page No. *
Commenter Comments and Suggested Changes
Suggested Change
Accepted?
Suggested Change Accepted
with Modifications, as Shown Below
Suggested Change Was Not Accepted, with Explanation as
Shown Below implement the Global Earth Observation System of Systems (GEOSS) for the purpose of achieving comprehensive, coordinated, and sustained observations of the Earth system. The U.S. contribution to GEOSS is the Integrated Earth Observation System (IEOS). IEOS will meet U.S. needs for high-quality, global, sustained information on the state of the Earth as a basis for policy and decision making in every sector of our society. A strategic plan for IEOS was developed by the Group on Earth Observation (USGEO), a Subcommittee reporting to the National Science and Technology Council’s Committee on Environment and Natural Resources and released by the Admini-stration in April 2005. Both the GEOSS and the IEOS are focused around societal benefits, including Climate Variability and Change, Weather Forecasting, Energy Resources, Water Resources, Land Resources, and Ocean Resources - all of which are directly or indirectly relevant to the Climate Change Science and Technology Programs.
410 8.1 DOE/BER section 8.1, 4th bullet: Add “in GHG measurement and monitoring methods, technologies and strategies” at the end of the existing bullet.
411 8-2 State Dept 1st para…Change text from including end-use, infrastructure, Change to such as
412 8-2 State Dept framework for research and development that places Change to R&D
413 8-2 DOE/BER Figure 8-1. It’s not at all clear what this figure is intended to show as an M&M framework.. For example, what are the arrows intended to illustrate? Where is the flow of information from emission reduction technologies to the measurement and monitoring technologies? What are scenario assessment tools? What are models intended to provide? Also, the figure legend certainly doesn’t convey what this figure is apparently intended to illustrate.
414 8-3 OMB (Para 2)

91
Com-ment No.
Doc. Page No. *
Commenter Comments and Suggested Changes
Suggested Change
Accepted?
Suggested Change Accepted
with Modifications, as Shown Below
Suggested Change Was Not Accepted, with Explanation as
Shown Below by measuring changes in carbon stocks. Under CCTP, there is a need to undertake research to test, validate, and certify such uses of proxy measurements. Delete: need Insert: benefit Replace: undertake with undertaking by measuring changes in carbon stocks. Under CCTP, there is a benefit to undertaking research to test, validate, and certify such uses of proxy measurements.
415 8-3 OMB (Bulleted item 1) Measurement and monitoring technology critical to the successful implementation and Deleted: critical Deleted: to Inserted: that support Measurement and monitoring technology that support the successful implementation
416 8-3 OMB (Bulleted item 4) Measurement and monitoring technology essential to assuring that a proposed advanced climate change technology does not threaten either human health or the environment Deleted: essential Inserted: helping Replaced assuring with assure Measurement and monitoring technology helping to assure that a proposed advanced climate change technology does not threaten either human health or the environment
417 8-3 State Dept 2nd para CCTP research and development programs

92
Com-ment No.
Doc. Page No. *
Commenter Comments and Suggested Changes
Suggested Change
Accepted?
Suggested Change Accepted
with Modifications, as Shown Below
Suggested Change Was Not Accepted, with Explanation as
Shown Below Change to R&D
418 8-3 DOT should include that there is a nee to quantify the uncertainties possibly introduced by proxy measures
419 8-3 DOE/BER 1st para: What is the synergy between observations to measure and monitor GHG mitigation strategies and research observation systems for the CCSP. This is unlikely to be commonly known or understood by most readers of this document.
420 8-3 DOE/BER 3rd bullet: Not at all apparent why this is a necessary criterion for a measurement and monitoring technology. Explain the rationale for this as a criterion.
421 8-3 OSTP 3rd bullet: should be "...in the CCSP, IEOS, or other operational Earth observation systems."
422 8-4 DOE/BER Section 8.2.1, last sentence: Reword last part as follows: “…accounting of emissions at a range of scales from local to regional to global.”
423 8-4 DOE/BER Table 8-1: The table implies there is no strategy for M&M technology or methods R&D for quantifying emissions from industrial and transportation sources. For example, inferential methods can be used for transportation sources based on fuel use data. R&D is needed to improve estimates of industrial emissions.
424 8-4 OMB (Section 8.2.1 Para 1) In the near term, technologies that measure multiple gases across spatial dimensions are needed. In the long term, development is needed of a system of systems for remote, continuous, and global measurement and monitoring that provides for accounting of regional and global emissions. Deleted: are needed Deleted: is needed Inserted: the strategy focuses on

93
Com-ment No.
Doc. Page No. *
Commenter Comments and Suggested Changes
Suggested Change
Accepted?
Suggested Change Accepted
with Modifications, as Shown Below
Suggested Change Was Not Accepted, with Explanation as
Shown Below Inserted: the strategy focuses on In the near term, the strategy focuses on technologies that measure multiple gases across spatial dimensions. In the long term, the strategy focuses on development of a system of systems for remote, continuous, and global measurement and monitoring that provides for accounting of regional and global emissions.
425 8-5 OMB (Section 8.3 Para 2) Also needed are integrated carbon sequestration measurements of different components (e.g., geologic, oceanic, and terrestrial) Deleted: needed Inserted: useful Also useful are integrated carbon sequestration measurements of different components (e.g., geologic, oceanic, and terrestrial)
426 8-5 DOT add "and aviation" after "truck" in the reference to LIDAR
427 8-5 DOE/BER 1st bullet: Expand to state what the M&M need is with respect to emissions. 2nd bullet: How does this address an M&M need with respect to GHG emissions and sinks? 5th bullet: What does this have to do with M&M of GHGs?
428 8-5 DOE/BER Section 8.2.3, 2nd bullet: Not clear how this relates to M&M of GHGs; 3rd bullet: Sensors exist and are common use for monitoring CO2; 4th bullet: wireless microsensor networks doesn’t make sense in the context of vehicles and facilities. Needs revising to explain this.
429 8-6 State Dept Sec 8.3.1.1 portfolio that embraces a combination Change to embracing
430 8-6 DOE/BER 1st para: modify second complete sentence to read “…profiles near the sites of sequestration and track the potential release of CO2 into the atmosphere.”
431 8-6 OMB (Section 8.3.1.1 Para 1)

94
Com-ment No.
Doc. Page No. *
Commenter Comments and Suggested Changes
Suggested Change
Accepted?
Suggested Change Accepted
with Modifications, as Shown Below
Suggested Change Was Not Accepted, with Explanation as
Shown Below Realizing the possibilities of these technologies require a reearch Deleted: require Inserted: employ Realizing the possibilities of these technologies employs a research
432 8-6 OMB (Section 8.3.1.1 Para 1) Within the constraints of available resources, a balanced portfolio needs to address the objectives shown Deleted: needs to Replaced address with addresses Within the constraints of available resources, a balanced portfolio addresses the objectives shown in Table 8-2.
433 8-7 OMB (Section 8.3.2 Para 1) terrestrial sequestration of carbon must address both the capture Deleted: must Replaced with: should terrestrial sequestration of carbon should address both the capture
434 8-7 State Dept 1st para, middle: Change have to has Last sentence change : to .
435 8-7 DOE/BER 1st para: In the second to last sentence, add “and identify the source” at the end of the sentence.
436 8-7 State Dept Sec 8.3.1.3 research and development Change to R&D
437 8-8 State Dept Sec 8.312.1 1st sentence change an to a Delete extra space before (1)
438 8-8 DOE/BER Section 8.3.2.1: Suggest inserting a sentence after the 1st sentence

95
Com-ment No.
Doc. Page No. *
Commenter Comments and Suggested Changes
Suggested Change
Accepted?
Suggested Change Accepted
with Modifications, as Shown Below
Suggested Change Was Not Accepted, with Explanation as
Shown Below of the para that explains why an “integrated, hierarchical system of ground-based and remote sensing technologies” is needed. Simply asserting that such a system is needed is not sufficient.
439 8-8 DOE/BER Box 8-2: Is Agriflux designed to measure the net annual carbon exchange/ carbon sequestration at each site? Do or will the sites operate continuously, year round? If not, carbon sequestration can’t be derived from the Agriflux measurements alone.
440 8-8 OMB (Section 8.3.2 Para 1) sequestration will require evaluation of GHG emissions as a function of management Deleted: require Rreplaced with: depend on sequestration will depend on evaluation of GHG emissions as a function of management
441 8-8 OMB (Section 8.2.3.1 Para 1) Measurement and monitoring systems require an R&D portfolio that provides for integrated, hierarchical systems of ground-based and remote sensing Measurement and monitoring systems require an R&D portfolio that provides for integrated, hierarchical systems of ground-based and remote sensing technologies. A system must be applicable to a wide range of potential activities and a very diverse land base, have sufficient accuracy to satisfy reporting requirements of the 1605(b) voluntary reporting system (EIA 2004), and be deployed at a cost such that measurement and monitoring does not outweigh the value of the sequestered carbon. Deleted: require Replaced with: employ Deleted: system must be Replaced with: system’s utility is based on it’s

96
Com-ment No.
Doc. Page No. *
Commenter Comments and Suggested Changes
Suggested Change
Accepted?
Suggested Change Accepted
with Modifications, as Shown Below
Suggested Change Was Not Accepted, with Explanation as
Shown Below Replaced applicable with applicability Inserted: an Replaced: to (with: that) Satisfy =satisfies Replaced be deployed at a cost (with: a cost of deployment) Measurement and monitoring systems employ an R&D portfolio that provides for integrated, hierarchical systems of ground-based and remote sensing technologies. A system’s utility is based on its applicability to a wide range of potential activities and a very diverse land base, an accuracy that satisfies reporting requirements of the 1605(b) voluntary reporting system (EIA 2004), and a cost of deployment such that measurement and monitoring does not outweigh the value of the sequestered carbon.
442 8-9 DOE/BER 7th bullet: Not clear what imaging forest structure has to do with M&M of GHGs. This requires further explanation.
443 8-9 DOE/BER last bullet: Need to be more specific about the R&D being conducted at DOE labs on M&M technologies for GHGs This bullet is uninformative as is. this should be page 8-9. NOTE commenter said p. 7-8 but CCTP believes he is referring to p. 8-9.
444 8-10 State Dept 1st bullet: Ongoing Tillage and land conservation practices are ongoing and offer test beds for ground-based and remote sensing methods, as well as verification of rules of thumb for emission factors. Delete words: are ongoing
445 8-10 State Dept 2nd bullet: research and development Change to R&D
446 8-10 State Dept Box 8.4, 2nd line Delete (CAAA)
447 8-10 DOE/BER section 8.3.2.3, 1st bullet: As a future research direction, this is

97
Com-ment No.
Doc. Page No. *
Commenter Comments and Suggested Changes
Suggested Change
Accepted?
Suggested Change Accepted
with Modifications, as Shown Below
Suggested Change Was Not Accepted, with Explanation as
Shown Below inappropriate. Need to develop such a system before it can be implemented. 4th bullet: Modify to read as follows: Isotope markers to identify and distinguish between natural and human sources and determine movement of GHGs in geological, …”
448 8-10 DOE/BER last para, second to last sentence: Modify as follows: Fertilization of the oceans with iron, a nutrient required by phytoplankton, is a potential strategy to accelerate the ocean’s biological carbon pump and thereby enhance the draw-down of CO2 from the atmosphere.”
449 8-11 State Dept Sec 8.3.3.2 2nd para: Delete “have”
450 8-11 DOE/BER section 8.3.3.2: 3rd para: this is an experiment to study the direct effects of injected CO2 on deep ocean biology and chemistry. It is not about developing an M&M technology for GHGs. Delete the paragraph from this chapter.
451 8-11 OMB (Section 8.3.3.1) Realizing the opportunities for these technologies will require R&D investments in direct measurement Deleted: Realizing the opportunities for t Deleted: will require Inserted: could be advanced through Deleted investments These technologies could be advanced through R&D in direct measurement
452 8-11 OMB (Section 8.3.3.3) monitoring for ocean sequestration need to address several uncertainties with regard to direct injection and iron fertilization approaches. The mechanisms for direct injection require that measurement and monitoring technologies must assure the following

98
Com-ment No.
Doc. Page No. *
Commenter Comments and Suggested Changes
Suggested Change
Accepted?
Suggested Change Accepted
with Modifications, as Shown Below
Suggested Change Was Not Accepted, with Explanation as
Shown Below Delete: to Insert: could Delete: require that Insert: are supported by Delete: must Insert: that monitoring for ocean sequestration need could address several uncertainties with regard to direct injection and iron fertilization approaches. The mechanisms for direct injection are supported by measurement and monitoring technologies that assure
453 8-11 Section 8.3.3.2: Mention that the three examples described in paragraphs 2-4 represent selected examples.
454 8-12 DOE/BER 1st bullet: “CO2 injected” should be “injected CO2”
455 8-12 DOE/BER 5th bullet: The first CO2 in the bullet should be replace with organic carbon. The fixed carbon is organic carbon, some of which will be re-oxidized back to CO2.
456 8-12 State Dept 2nd to the last bullet: Delete “The” start with “That”
457 8-12 DOE/BER last bullet: What is “dissociation behavior? This needs explanation.
458 8-12 OMB (section 8.3.3.3 para 2) investments in measurement technologies are necessary Deleted: are necessary Inserted: would help investments in measurement technologies would help
459 8-12 OMB (Section 8.3.3.3 4th bulleted item after 2nd paragraph) and modeling needed for selection of injection Deleted: needed for

99
Com-ment No.
Doc. Page No. *
Commenter Comments and Suggested Changes
Suggested Change
Accepted?
Suggested Change Accepted
with Modifications, as Shown Below
Suggested Change Was Not Accepted, with Explanation as
Shown Below Inserted: support and modeling support selection of injection
460 8-12 OMB (Section 8.3.3.3 4th bulleted item after 2nd paragraph) chemistry will need to be monitored carefully for the dissociation Deleted: will need to Deleted: for Inserted: can Inserted: to determine chemistry can be monitored carefully to determine the dissociation
461 8-13 OMB Sec 8.4 ……. A robust R&D program will need to should consider include direct measurements of emissions and reporting methods, and it will need to becoming e part of a larger integrated system. Moreover, the program will address should consider the needs etc….. Deleted text highlighted
462 8-13 OMB Sec 8.4.1 Realizing the contributions of these technologies will require an R&D portfolio that combines a number of areas. Deleted text highlighted
463 8-13 State Dept Sec 8.4.1 last sentence: research and development Change to R&D
464 8-13 State Dept Sec 8.4.2 There are is a wide range of current ongoing R&D programs being undertaken in the area of measurement and monitoring of emissions of other GHGs. Delete highlighted words
465 8-13 State Dept Last bullet: Annual National inventories are prepared by EPA annually and

100
Com-ment No.
Doc. Page No. *
Commenter Comments and Suggested Changes
Suggested Change
Accepted?
Suggested Change Accepted
with Modifications, as Shown Below
Suggested Change Was Not Accepted, with Explanation as
Shown Below Delete highlighted words
466 8-14 NASA TEXT TO BE ADDED NASA concurs with the CCTP Strategic Plan document with inclusion of the following bullet on p. 8-14 (to be inserted after the first bullet):
Through the Advanced Global Atmospheric Gases Experiment (AGAGE) Network and other university-led measurement programs, NASA Earth science research includes measuring global distributions and temporal behavior of biogenic and anthropogenic gases important for both stratospheric ozone and climate. These include CFCs, HCFCs, HFCs, halons, nitrous oxide, methane, hydrogen, and carbon monoxide. Measurements made at the sites in the NASA-sponsored AGAGE network, along with sites in cooperative international programs, are used in international assessments for updating global ozone depletion and climate forcing estimates and in NASA’s triennial report to the Congress and the EPA on atmospheric abundances of chlorine and bromine chemicals.
467 8-14 State Dept 5th bullet: Black carbon and tropospheric ozone precursor emissions are An emerging areas of importance. concerns black carbon and tropospheric ozone precursor emissions. Although there is long history of monitoring associated with……..etc Delete highlighted words
468 8-14 OMB 6th bullet: measurement and monitoring efforts are needed Deleted text highlighted
469 8-14 State Dept 6th bullet: EPA is conducting analysis and research is being conduced by EPA to improve GHG inventories and emissions estimation methods, etc Delete highlighted words
470 8-14 OMB Sec 8.4.3 1st bullet These techniques need to would address
101
Com-ment No.
Doc. Page No. *
Commenter Comments and Suggested Changes
Suggested Change
Accepted?
Suggested Change Accepted
with Modifications, as Shown Below
Suggested Change Was Not Accepted, with Explanation as
Shown Below Change “need to” to “would” Deleted text highlighted
471 8-14 OMB Sec 8.4.3 2nd bullet Increased emphasis on the need for Development of high quality Deleted text highlighted
472 8-14 OMB Sec 8.4.3 3rd bullet Change “need to” to “would” Deleted text highlighted
473 8-15 OMB 1st bullet: but require can be addressed through indirect Deleted text highlighted
474 8-15 OMB 4th bullet: Sophisticated modeling procedures that can fingerprint large-scale measurements to unique sources could help In order to integrate continental and global measurements with regional and local emissions data, sophisticated modeling procedures are required that can fingerprint large-scale measurements to unique sources. Deleted text highlighted
475 8-15 OMB 5th bullet: technology is applies to needed for both laboratory Deleted text highlighted
476 8-15 State Dept 5th bullet: In order to integrate Integrating continental and global measurements with regional and local emissions data requires sophisticated modeling procedures are required that can fingerprint large-scale measurements to unique sources. Delete highlighted words
477 8-15 OMB Last sentence Science questions driving requirements for future development of technologies Deleted text highlighted
478 8-16 OMB Sec 8.5: It will enables the benchmarking of etc

102
Com-ment No.
Doc. Page No. *
Commenter Comments and Suggested Changes
Suggested Change
Accepted?
Suggested Change Accepted
with Modifications, as Shown Below
Suggested Change Was Not Accepted, with Explanation as
Shown Below Deleted text highlighted Add “s” to enable
479 8-16 OMB Para after figure: capability will have has the ability etc Deleted text highlighted Add “has”
480 8-17 OMB Para after figure: that will merge other data etc…. Deleted text highlighted
481 8-17 OMB Sec 8.5.1 various scales is needed. In tThe longer term, focuses on merging these spatial systems into an integrated approach employing the Integrated Earth Observation System (IEOS) would be needed. IEOS is etc Deleted text highlighted
482 8-18 State Dept Sec 8.5.2, 1st bullet research and development Change to R&D
483 8-19 State Dept Sec 8.5.3, 2nd para… Data integration requires innovative data handling and processing technology capacity in the area of data handling and processing, and depends on the development of innovative sensors, platforms, Delete highlighted words
484 8-19 OMB Sec 8.5.3 2nd para Data integration could be advanced through requires innovative technology capacity in the area of data handling and processing, and depends on through the development of innovative sensors, platforms, and computational models and systems; and their integration into decision support resources. Cross-verification of these data elements requires is based on coordination with national and international standards-setting bodies to develop protocols for

103
Com-ment No.
Doc. Page No. *
Commenter Comments and Suggested Changes
Suggested Change
Accepted?
Suggested Change Accepted
with Modifications, as Shown Below
Suggested Change Was Not Accepted, with Explanation as
Shown Below interoperability of datasets. Data systems are required allow for integrating and comparing data among hierarchical layers of the system and for application of the measurement and monitoring technologies. Some measurements need to are best be averaged or processed to reflect the variability in emissions rates or volumes, as well as spatial and temporal variability. Deleted text highlighted
485 8-19 OMB Sec 8.5.3 3rd para GHG emission sources and geologic sequestration may are supported by development of require portable platforms for sensors and autonomous units that measure, analyze, and report emissions, while ocean sequestration would likely require be supported etc Deleted text highlighted
486 8-20 State Dept 1st para,: and (6) develop remote Delete highlighted words
487 8-20 State Dept 2nd para: deployment of advanced climate change technologies can be informed and guided by field data.
Delete highlighted words; added these words at the beginning “field data can guide and inform” resulting in: With continuing progress in GHG measuring and monitoring systems, field data can guide and inform policy decisions and research plans for the development and deployment of advanced climate change technologies.
Chapter 9 488 Gener
al DOT Should also highlight the important component of training and
developing the next-generation work force that is part of basic

104
Com-ment No.
Doc. Page No. *
Commenter Comments and Suggested Changes
Suggested Change
Accepted?
Suggested Change Accepted
with Modifications, as Shown Below
Suggested Change Was Not Accepted, with Explanation as
Shown Below sciences.
489 9-1 State Dept 1st para: Remove “S” from the word “presents”)
490 9-1 to 9-2
OSTP bullets: The need to describe the meaning of research and planning is questioned.
491 9-2 State Dept 2nd bullet, 1st sentence: Delete the word “to”
492 9-15 OSTP middle paragraph: Workshops conducted by other agencies should be mentioned to show the interagency nature ofthe CCTP.
493 9-15 State Dept 2nd bullet: delete space
494 9-15 OMB Section 9.4 Para 3 Comment: Check on status. I thought we got some comments from SC earlier in the review period that “fixed” some of this text, including giving us this reference.
495 9-15 State Dept Last Para. use (ANL 2004); catalysis (report in preparation); COMMENT: Check on status. I thought we got some comments from SC earlier in the review period that “fixed” some of this text, including giving us this reference.
Chapter 10 496 10-1 NOAA Is it appropriate to add a statement about collaborating with CCSP in
this conclusion? The NRC in its review of the (final) CCSP Strategic Plan said that the linkages between CCSP and CCTP were unclear beyond scenario development. They suggested areas like social and environmental impacts of new technologies, mitigation and adaptation strategies developed by CCTP that might produce environmental impacts, poorly defined role of economic analyses, etc. See page 20-21 on NRC review of final strategic plan (2005).
497 10-1 State Dept 1st para: In keeping with the ultimate objective of the U.S.-ratified United Nations Framework Convention on Climate Change (UNFCCC), These technologies have the potential to facilitate a global shift

105
Com-ment No.
Doc. Page No. *
Commenter Comments and Suggested Changes
Suggested Change
Accepted?
Suggested Change Accepted
with Modifications, as Shown Below
Suggested Change Was Not Accepted, with Explanation as
Shown Below toward significantly lower greenhouse gas (GHG) emissions, and do so at substantially lower cost than would be the case without these technologies, etc Delete highlighted words
498 10-2 DOE/BER Section 10.1, 2nd para: The statement that Chapters 4 through 9 articulate strategies for technology development is a stretch. The “Technology Strategy” sections of the document fall short of conveying clear strategies for technology development.
499 10-3 State Dept Sec 10.1.3 In keeping with the ultimate objective of the U.S.-ratified United Nations Framework Convention on Climate Change (UNFCCC), these technologies have the potential to facilitate a global shift toward significantly lower greenhouse gas (GHG) emissions, and do so at substantially lower cost than would be the case without these technologies, while continuing to provide the energy-related and other services needed to spur and sustain economic growth.
Delete highlighted words
500 10-3 OMB (Section 10.1.2, para2) (5) the next-generation nuclear fission energy systems. Deleted –generation Added –advanced (5) the next-advanced nuclear fission energy systems
501 10.3 OMB (Section 10.1.2, para2) plant for deployment in the 2010-2015 timeframe by 2014; (7) Deleted: in the 2010-2015 timeframe, resulting in: plant for deployment by 2014; (7)
502 10-4 DOT Need to highlight potential tradeoffs between mitigating CO2 and other GHGs
503 10-4 DOT Add "Modeling" to 10.1.5

106
Com-ment No.
Doc. Page No. *
Commenter Comments and Suggested Changes
Suggested Change
Accepted?
Suggested Change Accepted
with Modifications, as Shown Below
Suggested Change Was Not Accepted, with Explanation as
Shown Below 504 10-5 DOT Add strategic workforce development component to the discussion in
10.1.6
505 10-6 OSTP under Strengthen Climate Change Technology R&D: Add a bullet: Improve integration and leveraging of resources with other relevant administration efforts, such as the National Science and Technology Council's U.S. Group on Earth Observations.
506 10-7 OSTP 4th bullet: Pusue additional means to ..........OECD, IEA, IPCC, G8, GEOSS...
507 10-7 DOT the discussion on support to IPCC is to specific -- should not go down to the Working Group level in a strategic document. We support many other IPCC (and UNFCCC) activities as well.
508 10-7 DOT the sentence "· Evaluate various technology policy options for stimulating private investment in advanced technology related to climate change or other GHG-related investments, and/or for accelerating the experimentation with and adoption of advanced climate change technology." should perhaps refer to advanced technology to reduce GHG, not "climate change technology".
509 10-8 State Dept Sec 10.4 References: Office of Management and Budget (OMB) 2005. Federal climate change expenditures report to Congress. Washington, DC: Executive Office of the President. http://www.whitehouse.gov/omb/legislative/fy06_climate_change_rpt.pdf Date Change, delete web link.
* Page numbers refer to those in the June 2005 version.

Verification v3 DRAFT- Do Not Quote page 1 of 5
Background Paper on: Verification Issues, for the 1605(b) Workshops
Office of Policy & International Affairs (PI-23) October 7, 2002
What is Verification? The concept of “Verification” encompasses a range of subtle distinctions usually not appreciated. Strictly speaking, verification “is” determination/assessment of factual truth. However, in practice it is used to refer to a much richer range of ideas. Separating out the layers of meaning is critical for conducting productive discussions on the Voluntary Reporting Program (VRP). Virtually every sector of our economy uses some system of review and auditing to create credibility, i.e. verification.1 However it can be costly, information-intensive, and raise confidentiality issues.2 Verification requirements need to be balanced against the willingness to participate, the value of the credits being offered, and the program’s need to be credible. Appreciating these tradeoffs goes a long way to finding consensus on which form of verification to use. Views on Verification It is helpful to analyze potential views on verification to anticipate resistance to and/or support for verification. All parties need to consider whether verification is seen as an opportunity for “influence and participation.” If a reporter sees verification as an opportunity for others to gather information to criticize,
then they may be less inclined to participate. If the verification process is seen as a signal of willingness to honestly reduce pollution, it
may placate critics and build trust. There are three layers to verification: type, intensity, and frequency.
1. Verification Type refers to the purpose behind conducting verification. Three divisions of this layer include:
a) Interpretation verification b) Process verification c) Quantity (or Facts) verification
2. Verification Intensity (level) refers to the level of detail of review, ranging from self-certification to independent review. There are significant differences in opinion about the amounts/levels of “verification” needed, and the tradeoffs between cost and effect.
Self-certification Desk Review and Consistency Checking Desk Review with Cross-Checking
1 Auditing discourages misrepresentation, detects misrepresentation, establishes credibility, and increases efficiency in the market. 2 Please refer to the Confidentiality Issues background paper for an expansion of issues related to who needs and/or is permitted access to reports. Where the boundaries are set for confidentiality affects the credibility of the program, the willingness to participate, and legal boundaries, among others.

Verification v3 DRAFT- Do Not Quote page 2 of 5
On-site Desk Review On-site Review comparable to financial audit Independent or “Third Party” review
3. Verification Cross-section refers to how often a review is conducted. Never Randomly Mixed sampling Threshold Complete or Compulsory
1. Types of verification
(a) Interpretation Verification Definition: Interpretation verification examines the choices a reporter makes in determining what tons to count and which ones to omit. This would encompass verification of “additionality” or reductions against a hypothetical baseline. For example: The verifier may review a reporter’s justifications for drawing boundaries around a project. Or they may examine justification for choosing the denominator in an intensity calculation. Pros: In a somewhat flexible system, it gives the verifier/auditor wide latitude to determine the
intent of the reporter, thus encouraging reporters to error on the side of caution. This hopefully reduces the attractiveness of “creative” reporting.
Cons: There is a potential for inconsistency among auditors and how different entities and
industries are treated. Results of such verification may be unpredictable because of the inherent subjectivity. It may discourage participation because of its unpredictability.
(b) Process Verification Definition: Process verification involves assessment of types of actions and measures reported. This implies showing that the emissions and/or reductions were calculated using good processes and institutions. (This is typical of ISO standards). For example: The review would look for evidence that the reporter used particular equipment to make emission measurements, and that all the “right” parts of an emitter’s operations were measured and factored into the data provided. One suggestion for a well developed emissions inventory is that it include a clear discussion of boundaries, methodological approach, data integrity, and data management procedures.

Verification v3 DRAFT- Do Not Quote page 3 of 5
Key Points: Building consensus on this is important for establishing a consistent and “verifiable” system.
Without verifiability, verification cannot occur. A new set of measurements and calculation would have to be made every time one wanted to assess the credibility of a report. This is related to data quality guidelines required of all _________(agencies?)
Nothing is actually measured in terms of quantity. This is one of the more commonly used approaches to verification. Pros: The fact that nothing is measured makes this one of the least costly options in terms of
auditing. It can set the stage for later conducting quantity verification. Cons: There is little if any review of actual emissions.
(c) Quantity Verification or (Verification of Facts) Definition: Quantity verification involves assessing the number of tons reported for each type of action. This may encompass review of either historical emissions inventories, or reductions measured against a historical, unit of production or performance standard baseline. For example: A review might assess records on each smokestack for each year reported. It may also examine inputs and leakages. Some reviews would make additional on site measurements for comparison to those reported. Pros: With established criteria about how and which tons to examine, this is a straightforward,
objective process. Energy-related carbon dioxide emissions can generally be measured with good accuracy
through mass balance (i.e., by measuring fuel burn). Cons: Establishment of the measurement criteria is a contentious process. It is very costly and intrusive to measure and audit all sources of emissions. Emissions of other gases and carbon sequestration can have much more complicated
measuring issues, particularly from area sources (land fills, surface coal mines, rice paddies, etc.).
This problem is exacerbated because many sources are relatively small, so the cost of accurate measurement may be disproportionate to the level of emissions/reductions. One suggestion for solution is to use a “de-minimus” rule, emissions smaller than some level may be ignored. In any case, even if the theoretical cost of measurement is low, potential reporters may not have systems in place to make such measurements.
This issue is particularly sensitive because a typical verification test is “completeness.” Reports may be substantively “complete” but lack estimates (or accurate estimates) for tiny sources such as methane emissions from fuel combustion.

Verification v3 DRAFT- Do Not Quote page 4 of 5
2. Intensity / Level of Verification Verification could encompass:
no verification; desk review for plausibility and arithmetic error (this is done now by EIA); desk-based comparison with third party data; or on-site review of books and measurement, or cross-checking with other parties.
Complexity and cost rise accordingly. Verification must cost less than the inferred value of the credits for participation to be worthwhile. This may be a significant issue for small firms and/or small projects. The challenge in designing a review system is to balance the benefits and costs of verification. The July 8th, 2002 letter from the Agencies’ Secretaries to the President indicated the U.S. VRP should move in the direction of similar programs in Canada, Australia and the U.K by adopting “independent verification.” Independent (or Third-Party) verification is performed by parties independent of the organization whose emissions are being verified. An external group examines the reporter’s books and certifies their consistency with established, objective standards. There are a variety of ways to organize independent verification. This boils down to who chooses the verifiers and who pays. For example:
a. Reporters chose any firm they like; b. Government defines attributes of “acceptable verification,” reporters choose any firm
they like, government reviews verification report; c. Government certifies independent verifiers; provides list of “approved verifiers;”
What constitutes “certification of a verifier” is a topic in itself. Who certifies the certifier of the verifiers? Options include:
i. a federal agency or review board ii. a nonprofit review board
iii. a consortium of government, nonprofit and private interests. d. Government conducts the verification (say, GAO);
Choice (d) stands to assign the cost of verification to the government, unless it passes the cost on to reporters when they file their report. The reporters will bear the verification costs and the government will likely bear the costs of managing the program under the other choices.
3. Cross-section of Verification No verification. Currently the U.S. relies on self-certification. The Canadian program
requires verification in principle but in practice it is deferred until or unless cap & trade is established.

Verification v3 DRAFT- Do Not Quote page 5 of 5
Random verification. It is conducted on a sample of the reporters; similar to IRS audits. For example, the Australian program requires verification in principle, but actually only conducts verification randomly.
Non-yearly (mixed) verification. A full review may be conducted every five years, with desk review other years.
Threshold verification. A full review is only triggered when emissions/reductions change by a certain percentage.
Complete/compulsory verification. All tons reported are reviewed. The United Kingdom program does this.
Challenge verification. Verification is only conducted when someone challenges the validity of the report.
Who Verifies U.S. government Financial Auditor Environmental Auditor Process Auditor NGO Auditor Professional Engineer, PE Other suggestions received during the NOI:
Two tiered system with independent verification required for receiving credits. Credits should only be given for reductions that are verifiable. Verifiable reductions must
have all underlying documentation to adequately support the claim.
J:\FOIA Library\FOIA_Documents\Department of Energy\828_829_geoengineering\NCCTI Disk 2\Verification v5.doc Contact: John Staub
1
BACKGROUND PAPER: VERIFICATION ISSUES
I. Introduction to Background Papers
This paper is one in a series that identifies issues and options involved in developing revisions to the Department of Energy’s Voluntary Greenhouse Gas Reporting Program (VGGRP), which was created pursuant to Section 1605(b) of the Energy Policy Act of 1992. Other papers are available at: http://www.pi.energy.gov/enhancingGHGregistry. The reporting program, in operation since 1994, records voluntarily submitted data on greenhouse gas (GHG) emissions and the results of actions to reduce, avoid, or sequester greenhouse gas emissions. On February 14, 2002, the President announced his Climate Change Initiative which includes a GHG intensity target, research programs and tax incentives to advance the development and adoption of new technologies, voluntary programs to promote actions to reduce GHGs, and improvements to the existing Voluntary Greenhouse Gas Reporting Program GHG reporting program. Specifically, the President:
Directed the Secretary of Energy, in consultation with the Secretary of Commerce, the Secretary of Agriculture, and the Administrator of the Environmental Protection Agency, to propose improvements to the current voluntary emissions reduction registration program under section 1605(b) of the 1992 Energy Policy Act within 120 days. These improvements will enhance measurement accuracy, reliability, and verifiability, working with and taking into account emerging domestic and international approaches. Directed the Secretary of Energy to recommend reforms to ensure that businesses and individuals that register reductions are not penalized under a future climate policy and to give transferable credits to companies that can show real emissions reductions. Directed the Secretary of Agriculture, in consultation with the Environmental Protection Agency and the Department of Energy, to develop accounting rules and guidelines for crediting sequestration projects, taking into account emerging domestic and international approaches.
On May 6, 2002, the Department of Energy solicited comments on various issues relevant to its efforts to implement the President's directives. The request for comments and the comments received are located at the website above. On July 8, 2002, after considering public comments, the Secretaries of Energy, Commerce and Agriculture, and the Administrator of the Environmental Protection Agency provided the President with ten recommended improvements to the VGGRP:
1. Develop fair, objective, and practical methods for reporting baselines, reporting boundaries, calculating real results, and awarding transferable credits for actions that lead to real reductions.
2. Standardize widely accepted, transparent accounting methods. 3. Support independent verification of registry reports.

J:\FOIA Library\FOIA_Documents\Department of Energy\828_829_geoengineering\NCCTI Disk 2\Verification v5.doc Contact: John Staub
2
4. Encourage reporters to report greenhouse gas intensity (emissions per unit of output) as well as emissions or emissions reductions.
5. Encourage corporate or entity-wide reporting. 6. Provide credits for action to remove carbon dioxide from the atmosphere as well as for
actions to reduce emissions. 7. Develop a process for evaluating the extent to which past reductions may qualify for
credits. 8. Assure the voluntary reporting program is an effective tool for reaching the 18 percent
goal. 9. Factor in international strategies as well as state-level efforts. 10. Minimize transactions costs for reporters and administrative costs for the Government,
where possible, without compromising the foregoing recommendations. In addition to these recommendations, the Secretaries of Energy, Commerce and Agriculture, and the Administrator of the Environmental Protection Agency proposed a process leading to revising the guidelines by January 2004. The process includes the workshops for which these background papers are prepared. The workshops are intended to foster an open dialog to assist the DOE and the other participating agencies in improving the reporting guidelines as authorized by existing law and directed by the President. By focusing the dialogue on specific issues and questions, many of which are addressed in the background papers, we hope the workshops can provide as much constructive input to this process as possible.
II. Background on Verification Issues The July 8, 2002 4-agency letter to the President recommended that the U.S. Voluntary Reporting Program (VRP) should support “independent verification.” Implementing this recommendation would move beyond current guidelines which rely on “self-certification” as required by the statute (NAME IT). “Verification” encompasses a wide range of concepts. Strictly speaking, verification is a determination/assessment of factual truth. The goal of verification is much like that of auditing, which seeks to discourage and detect misrepresentation and innocent error, establish credibility, and increase efficiency in the marketplace. However, in practice it is used to refer to a much richer range of ideas including verification type; verification process; verification rigor; verification frequency; and verification responsibility. Verification can be information-intensive, costly, and raise confidentiality issues (see Background Paper: Confidentiality Issues). Therefore, verification requirements need to be balanced against the willingness to participate, the value of the credits being offered, and the program’s need to be credible.
III. Verification Type Verification Type refers to the purpose behind conducting verification. The motivation for conducting verification may range from assessing reporter’s interpretations of GHG accounting rules to their processes of measuring and calculating to the actual quantities reported. Verifications types include:

J:\FOIA Library\FOIA_Documents\Department of Energy\828_829_geoengineering\NCCTI Disk 2\Verification v5.doc Contact: John Staub
3
A. Verification of Interpretation examines the choices a reporter makes in determining what tons or information to count and which ones to omit. For example, the verifier may review a reporter’s justifications for drawing boundaries around a project. Or, they may examine justification for choosing the denominator in an intensity calculation. Advantages: In a flexible system, this approach to verification gives the verifier/auditor wide
latitude to determine the intent of the reporter, thus encouraging reporters to err on the side of caution. This ideally reduces the attractiveness of creative reporting.
Disadvantages: There is a potential for inconsistency among auditors and how different entities and
industries are treated; Results of such verification may be unpredictable due to the inherent subjectivity; May discourage participation because of risks of variability.
B. Verification of Process assesses the types of actions and units of measures reported. This
involves showing that the emissions and/or reductions were calculated using good procedures (This is typical of ISO standards WHAT IS THE ISO?). For example: The review would look for evidence the reporter used particular equipment to make emission measurements, and that all the “right” parts of an emitter’s operations were measured and factored into the data provided. One suggestion for a well developed emissions report is that it includes a clear discussion of boundaries, methodological approach, data integrity, and data management procedures. Moreover, recently released data quality guidelines, seek to “ensure and maximize the quality, utility, objectivity, and integrity of the information DOE disseminates to members of the public.”1 Without such guidelines a new set of measurements and calculation would have to be made every time one wanted to assess the credibility of a report. Verification of Process is a review of procedure, not a measurement check of quantities; and is one of the more commonly used approaches to verification. Advantages:
Least costly in terms of auditing as only the process is subject to review (IS THIS RIGHT?)
Can be viewed as a base for subsequent quantity verification. Disadvantages:
There is little if any review of actual emissions.
C. Quantity Verification or (Verification of Facts) assesses the accuracy of reported
emissions (sequestration) or emissions reductions or each type of action. This may include a review of baselines, and a review of all data needed to compute emissions or emissions reductions. Quantity Verification could include onsite measurements for comparison to those reported.
1 Dept. of Energy Final Report Implementing OMB Information Dissemination Quality Guidelines, 67 Federal Register 62446; Oct. 7, 2002.
J:\FOIA Library\FOIA_Documents\Department of Energy\828_829_geoengineering\NCCTI Disk 2\Verification v5.doc Contact: John Staub
4
Advantages:
As long as there are objective measurement criteria, this is a straightforward process;
Many emissions and emissions reductions, such as energy-related carbon dioxide emissions can generally be measured with good accuracy through mass balance (i.e., by measuring fuel burn).
Disadvantages: Establishment of the measurement criteria can be difficult; May be costly and intrusive to measure and audit all sources of emissions (new
automated monitoring equipment may be able to reduce costs); Emissions of other gases and carbon sequestration are often more complicated to
measure particularly from area sources (land fills, surface coal mines, rice paddies, etc.). This problem is exacerbated because many sources are relatively small, so the cost of accurate measurement may be disproportionate to the level of emissions/reductions. One suggestion for solution is to use a “de-minimus” rule: emissions smaller than some level may be ignored. In any case, even if the theoretical cost of measurement is low, potential reporters may not have systems in place to make such measurements. This issue is particularly sensitive because a typical verification test is “completeness.” Reports may be substantively “complete” but lack estimates (or accurate estimates) for tiny sources such as methane emissions from fuel combustion.
IV. Verification Rigor (often referred to as “Intensity” or “Level”)
Once the purpose(s) for verifying reports is agreed upon, the level of detail of review must be chosen, which can range from self-certification to independent review. There are significant differences in opinion about the amounts/levels of “verification” needed, and the tradeoffs between cost and effect. Levels include:
A. Self-certification (meaning no external review of reports).
B. Independent verification. Typically performed by parties independent of the organization
whose emissions/reductions are being verified. An external group examines the reporter’s records and/or equipment and certifies their consistency with established, objective standards. Options include:
Desk review for plausibility and arithmetic error (this is done now by EIA); Desk-based comparison with third party data; On-site review of books and measurement or cross-checking with other parties; or On-site review comparable to financial audit.
Complexity and cost rise accordingly. Verification must cost less than the inferred value of the credits for participation to be worthwhile. This may be a significant issue for small firms and/or small projects. The challenge in designing a review system is to balance the benefits and costs of verification.

J:\FOIA Library\FOIA_Documents\Department of Energy\828_829_geoengineering\NCCTI Disk 2\Verification v5.doc Contact: John Staub
5
V. Verification Cross-Section / Frequency
Additional flexibility and cost savings may be achieved by adjusting how often a review is conducted, i.e. the cross-section that is verified during a given time period. Options include: A. No verification. Currently the U.S. relies on self-certification. The Canadian program
requires verification in principle but in practice it is deferred until or unless cap & trade is established.
B. Random verification. It is conducted on a sample of the reporters; similar to IRS audits. For example, the Australian program requires verification in principle, but actually only conducts verification randomly.
C. Non-yearly (mixed) verification. A full review may be conducted every five years, with desk review other years.
D. Threshold verification. A full review is only triggered when emissions/reductions change by a certain percentage.
E. Complete/compulsory verification. All tons reported are reviewed. The United Kingdom program does this.
F. Challenge verification. Verification is only conducted when someone challenges the validity of the report.
VI. Verification Responsibility
There are a variety of ways to organize who chooses the verifiers (the reporter or the government), how verifiers are certified and who pays for the verification. Options include: A. Reporters chose any firm they like;
B. Government defines attributes of “acceptable verification,” reporters choose any firm they
like, government reviews verification report;
C. Government certifies independent verifiers; provides list of “approved verifiers;”
D. Government conducts the verification (say, GAO). This option assigns the cost of verification to the government, unless it accesses a user fee on reporters when they file their reports. The reporters will bear the verification costs and the government will likely bear the costs of managing the program under the other choices.
What constitutes “certification of a verifier” is a topic in itself. The California Climate Action Registry’s Certification Protocol requires that potential verifiers “will need to demonstrate experience in certification and verification of financial data, technical data, quality control,

J:\FOIA Library\FOIA_Documents\Department of Energy\828_829_geoengineering\NCCTI Disk 2\Verification v5.doc Contact: John Staub
6
and/or environmental management systems. [Verifiers] must also demonstrate the means to accept financial liability for certification activities undertaken for a Registry participant.”2 And finally, they must attend training provided by the registry. Options for certifying the verifiers in the VRP include: A federal agency or review board; a nonprofit review board; or a consortium of government, nonprofit and private interests. A list of possible verifiers include:
1. U.S. government 2. Financial Auditor 3. Environmental Auditor 4. Process Auditor 5. NGO Auditor 6. Professional Engineer, PE
2 California Climate Action Registry’s Certification Protocol, October 2002, page 2-1.

32
Executive DirectionIn accord with Figure 1 (page 5), CCTP exercis-
es executive direction through the Cabinet-level
CCCSTI and its IWG on Climate Change Science
and Technology. The IWG is populated by agency
deputies, who are in positions to recommend
Cabinet-level approval of coordinated plans and
programs and to direct actions that will guide
respective agency implementation of those plans
and programs.
Executive direction is further facilitated by the
CCTP Steering Group. The Steering Group is com-
prised of senior-level representatives from each
participating Federal agency. It ensures that all
agencies have a means to raise and resolve issues
regarding the CCTP. It functions as a facilitating
and coordinating body. The Steering Group assists
the CCTP Director in accessing needed information
and resources within each agency. The Steering
Group is briefed regularly on CCTP plans and activ-
ities and assists in developing agency budget
crosscuts and proposals, conveying information
and actions back to the agencies, and supporting
accomplishment of the CCTP mission. The Steering
Group also ensures that consistent guidance and
direction is given to the CCTP Working Groups,
and formulates recommendations and advice
back to the CCCSTI, through the IWG.
InteragencyPlanning and IntegrationThe CCTP Working Groups
(WGs), identified in Box 2 (page
33), are primarily responsible for carry-
ing out the missions and staff functions of
the CCTP. The WGs are assisted by subgroups,
as appropriate, and by supporting technical staff
drawn from the participating agencies, their affiliated
laboratories and facilities, and other available expert
and consulting staff. The WGs are expected to:
Management
CCTP is a multi-agency, planning and
coordination entity that assists the Cabinet
leaders of government in carrying out the
President’s National Climate Change
Technology Initiative. In this capacity, CCTP’s
role is to work with the participating R&D
agencies to plan, prioritize, and coordinate
related, supporting research, as well as to work
with the Administration to formulate budgets
and adjust the R&D portfolio as needed to
better meet CCTP strategic goals. Discussed
below, CCTP’s management functions include
executive direction; interagency planning,
coordination and integration; agency
implementation, including
monitoring and reporting
progress; external
interactions; and
program support.
VISION AND FRAMEWORK F OR STRATEGY AND PL ANNING ◆ AUGUST 2005

33
◆ Serve as the principal means for interagency
deliberation and development of CCTP plans and
priorities, and the formulation of guidance for
supporting analyses in WG’s respective areas
◆ Provide a forum for exchange of
inputs and information relevant to
planning processes, including work-
shops and other meetings;
◆ Engage, cooperate with, and coordinate
inputs from the relevant R&D agencies;
◆ Identify ongoing R&D activities and identify R&D
gaps, needs, and opportunities – near- and
long-term;
◆ Support relevant interfaces with CCSP science
studies and analyses;
◆ Formulate advice and recommendations to
present to the CCCSTI;
◆ Assist in the preparation of periodic reports to
Cabinet members and the President
Agency ImplementationThe CCTP relies on the participating Federal
agencies to contribute to CCTP progress and goal
accomplishment. CCTP recognizes that agencies
must balance CCTP priorities with other mission
requirements. However, the CCTP relies on the
agencies to place appropriate priority on CCTP pro-
gram implementation. Priority setting is facilitated
by appointing agency heads and deputies to the
CCCSTI and IWG. Top agency officials make up
the CCTP Steering Group. Agency executives and
senior-level managers serve as chairs and mem-
bers of the CCTP Working Groups. As such, once
CCTP plans, programs and priorities are deliberat-
ed and set, the agencies are well positioned and
prepared to follow through and contribute to execu-
tion and completion.
External InteractionsThe CCTP accesses expert opinion and technical
input from various external parties, through adviso-
ry groups, program peer-review processes, confer-
ence participation, international partnerships and
other activities. In addition, CCTP staff convenes
technical workshops and meetings with expertsU.S. CL IMATE CHANGE TECHNOLOGY PROGRAM
CCTP WORKING GROUPS
Energy End-Use – Led by DOE◆ Hydrogen End-Use◆ Transportation◆ Buildings◆ Industry◆ Electric Grid and Infrastructure
Energy Production – Led by DOE◆ Hydrogen Production◆ Renewable and Low Carbon Fuels◆ Renewable Power◆ Nuclear Fission Power◆ Fusion Energy◆ Low Emissions Fossil-Based Power
CO2 Sequestration – Led by USDA◆ Carbon Capture ◆ Geologic Storage◆ Terrestrial Sequestration◆ Ocean Storage◆ Products and Materials
Other (Non-CO2) Gases – Led by EPA◆ Energy & Waste - Methane◆ Agricultural Methane and Other Gases◆ High Global-Warming-Potential Gases◆ Nitrous Oxide◆ Ozone Precursors and Black Carbon
Measuring and Monitoring – Led by NASA◆ Application Areas◆ Integrated Systems Architecture
Basic Research – Led by DOE◆ Fundamental Research◆ Strategic Research◆ Exploratory Research◆ Integrative Planning Processes
Box 2: CCTP Working Groups

both inside and outside the Federal Government.
The CCTP activities are of interest to a number of
external parties, including state and local govern-
ments, foreign governments, and international
organizations, such as the Organization for
Economic Cooperation and Development (OECD),
the International Energy Agency (IEA), and the
IPCC. The CCTP provides coordinated support,
through the relevant agency programs, for
enhanced international cooperation by engaging
with and supporting activities of mutual interest.
Program SupportThe CCTP staff provides technical and adminis-
trative support and day-to-day coordination of
CCTP-wide program integration, strategic planning,
product development, communication and repre-
sentation. The CCTP staff: (1) provides support
for the Working Groups and the Steering Group;
(2) fosters integration of activities to support the
CCTP goals; (3) conducts and supports strategic
planning activities that facilitate the prioritization of
R&D activities and decision-making on the compo-
sition of the CCTP portfolio, including conducting
analytical exercises that support planning (such as
technology assessments and scenario analysis);
(4) develops products that communicate the
CCTP’s plans, as well as the progress of the CCTP
and its Federal participants toward meeting the
CCTP goals; (5) coordinates interagency budget
planning and reporting; (6) assists and supports
the Administration in representing U.S. interests in
the proceedings of the United
Nations IPCC; and (7)
coordinates agency sup-
port of international
cooperative
agreements.
34
Next Steps
The CCTP’s next steps focus on two broad
thrusts. First, the CCTP will continue to pro-
vide support to the Cabinet-level CCCSTI and IWG
on Climate Change Science and Technology.
Support will include, but is not limited to, multi-
agency planning, portfolio reviews, interagency
coordination, technical and other analyses, and for-
mulation of recommendations. The CCTP will
strive to provide support that, collectively, will suf-
fice to enable CCCSTI and the IWG to address
issues, make informed decisions, and weigh poli-
cies and priorities on related science and technolo-
gy matters to the President and the agencies.
Second, the CCTP will continue to work with
and support the participating agencies in develop-
ing plans and carrying out activities needed to
advance the attainment of the CCTP’s vision, mis-
sion and strategic goals. For each CCTP strategic
goal, to the extent suitable for each goal, agency
plans, and activities will be guided by and will pur-
sue the seven core approaches. Selected ele-
ments of these approaches are outlined below,
although not all elements will be pursued at once.
Strengthen Climate ChangeTechnology R&D◆ Continue to review, realign, reprioritize, and
expand, where appropriate, Federal support for
climate change technology research, develop-
ment, demonstration, and deployment.
A P P R O A C H 1 :
VISION AND FRAMEWORK F OR STRATEGY AND PL ANNING ◆ AUGUST 2005

E u r o p e a n C o m m i s s i o n
World energy, technology and climate policy outlook
Community research
EUR 20366
2030WETO
15K
I-NA
-20366-EN
-C
OFFICE FOR OFFICIAL PUBLICATIONSOF THE EUROPEAN COMMUNITIES
L-2985 Luxembourg
Price (excluding VAT) in Luxembourg: EUR 20
The world energy, technology and climate policy outlook (WETO) positions Europe in aglobal context. It provides a coherent framework to analyse the energy, technology andenvironment trends and issues over the period from now to 2030. In this way, it supportslong-term European policy-making particularly considering the questions related to (1) thesecurity of energy supply; (2) the European research area; (3) Kyoto targets and beyond.
Using the POLES energy model and starting from a set of clear key assumptions on economic activity, population and hydrocarbon resources, WETO describes in detail the evolution of world and European energy systems, taking into account the impacts ofclimate change policies.
The reference scenario encompasses international energy prices, primary fuel supply (oil,gas and coal), energy demand (global, regional and sectoral), power generation technologiesand carbon dioxide emissions trends. To face uncertainties, WETO presents alternativescenarios corresponding to different assumptions on availability of oil and gas resources(low/high cases) and on technological progress (gas, coal, nuclear and renewable cases).
Two major policy issues are addressed: (1) the outlook of the European Union gas marketin a world perspective (impressive growth in gas demand and increasing dependence onenergy imports); (2) the impacts of greenhouse gas emission reduction policies on theworld energy system and on progress in power generation technologies.
The rigorous analysis of long-term scenarios, with particular attention to the EuropeanUnion in a global context, will enable policy-makers to define better energy, technologyand environmental policies for a sustainable future.
World
energy, tech
nolo
gy and clim
ate policy o
utlo
ok 2
030 —
WETO
EC
EU
R 20366

‘Energy, environment and sustainable development’ programmeEuropean CommissionDirectorate-General for ResearchContact: Domenico Rossetti di ValdalberoTel. (32-2) 29-62811Fax (32-2) 29-94991E-mail: [email protected]
Interested in European research?
RTD info is our quarterly magazine keeping you in touch with main developments (results, programmes, events, etc.). It is available in English, French and German. A free sample copy or free subscription can be obtained from:
European CommissionDirectorate-General for ResearchInformation and Communication Unit B-1049 BrusselsFax (32-2) 29-58220E-mail: [email protected]: http://europa.eu.int/comm/research/
Photograph of Thalys on cover page by courtesy of Thalys International
BELGIQUE/BELGIË
Jean De LannoyAvenue du Roi 202/Koningslaan 202B-1190 Bruxelles/BrusselTél. (32-2) 538 43 08Fax (32-2) 538 08 41E-mail: [email protected]: http://www.jean-de-lannoy.be
La librairie européenne/De Europese BoekhandelRue de la Loi 244/Wetstraat 244B-1040 Bruxelles/BrusselTél. (32-2) 295 26 39Fax (32-2) 735 08 60E-mail: [email protected]: http://www.libeurop.be
Moniteur belge/Belgisch StaatsbladRue de Louvain 40-42/Leuvenseweg 40-42B-1000 Bruxelles/BrusselTél. (32-2) 552 22 11Fax (32-2) 511 01 84E-mail: [email protected]
DANMARK
J. H. Schultz Information A/SHerstedvang 12DK-2620 AlbertslundTlf. (45) 43 63 23 00Fax (45) 43 63 19 69E-mail: [email protected]: http://www.schultz.dk
DEUTSCHLAND
Bundesanzeiger Verlag GmbHVertriebsabteilungAmsterdamer Straße 192D-50735 KölnTel. (49-221) 97 66 80Fax (49-221) 97 66 82 78E-Mail: [email protected]: http://www.bundesanzeiger.de
ELLADA/GREECE
G. C. Eleftheroudakis SAInternational BookstorePanepistimiou 17GR-10564 AthinaTel. (30-1) 331 41 80/1/2/3/4/5Fax (30-1) 325 84 99E-mail: [email protected]: [email protected]
ESPAÑA
Boletín Oficial del EstadoTrafalgar, 27E-28071 MadridTel. (34) 915 38 21 11 (libros)Tel. (34) 913 84 17 15 (suscripción)Fax (34) 915 38 21 21 (libros),Fax (34) 913 84 17 14 (suscripción)E-mail: [email protected]: http://www.boe.es
Mundi Prensa Libros, SACastelló, 37E-28001 MadridTel. (34) 914 36 37 00Fax (34) 915 75 39 98E-mail: [email protected]: http://www.mundiprensa.com
FRANCE
Journal officielService des publications des CE26, rue DesaixF-75727 Paris Cedex 15Tél. (33) 140 58 77 31Fax (33) 140 58 77 00E-mail: [email protected]: http://www.journal-officiel.gouv.fr
IRELAND
Alan Hanna’s Bookshop270 Lower Rathmines RoadDublin 6Tel. (353-1) 496 73 98Fax (353-1) 496 02 28E-mail: [email protected]
ITALIA
Licosa SpAVia Duca di Calabria, 1/1Casella postale 552I-50125 FirenzeTel. (39) 055 64 83 1Fax (39) 055 64 12 57E-mail: [email protected]: http://www.licosa.com
LUXEMBOURG
Messageries du livre SARL5, rue RaiffeisenL-2411 LuxembourgTél. (352) 40 10 20Fax (352) 49 06 61E-mail: [email protected]: http://www.mdl.lu
NEDERLAND
SDU Servicecentrum Uitgevers
Christoffel Plantijnstraat 2Postbus 200142500 EA Den HaagTel. (31-70) 378 98 80Fax (31-70) 378 97 83E-mail: [email protected]: http://www.sdu.nl
PORTUGAL
Distribuidora de Livros Bertrand Ld.ª
Grupo Bertrand, SARua das Terras dos Vales, 4-AApartado 60037P-2700 AmadoraTel. (351) 214 95 87 87Fax (351) 214 96 02 55E-mail: [email protected]
Imprensa Nacional-Casa da Moeda, SA
Sector de Publicações OficiaisRua da Escola Politécnica, 135P-1250-100 Lisboa CodexTel. (351) 213 94 57 00Fax (351) 213 94 57 50E-mail: [email protected]: http://www.incm.pt
SUOMI/FINLAND
Akateeminen Kirjakauppa/Akademiska Bokhandeln
Keskuskatu 1/Centralgatan 1PL/PB 128FIN-00101 Helsinki/HelsingforsP./tfn (358-9) 121 44 18F./fax (358-9) 121 44 35Sähköposti: [email protected]: http://www.akateeminen.com
SVERIGE
BTJ AB
Traktorvägen 11-13S-221 82 LundTlf. (46-46) 18 00 00Fax (46-46) 30 79 47E-post: [email protected]: http://www.btj.se
UNITED KINGDOM
The Stationery Office Ltd
Customer ServicesPO Box 29Norwich NR3 1GNTel. (44) 870 60 05-522Fax (44) 870 60 05-533E-mail: [email protected]: http://www.itsofficial.net
ÍSLAND
Bokabud Larusar Blöndal
Skólavördustig, 2IS-101 ReykjavikTel. (354) 552 55 40Fax (354) 552 55 60E-mail: [email protected]
SCHWEIZ/SUISSE/SVIZZERA
Euro Info Center Schweiz
c/o OSEC Business Network SwitzerlandStampfenbachstraße 85PF 492CH-8035 ZürichTel. (41-1) 365 53 15Fax (41-1) 365 54 11E-mail: [email protected]: http://www.osec.ch/eics
B@LGARIJA
Europress Euromedia Ltd
59, blvd VitoshaBG-1000 SofiaTel. (359-2) 980 37 66Fax (359-2) 980 42 30E-mail: [email protected]: http://www.europress.bg
CYPRUS
Cyprus Chamber of Commerce and Industry
PO Box 21455CY-1509 NicosiaTel. (357-2) 88 97 52Fax (357-2) 66 10 44E-mail: [email protected]
EESTI
Eesti Kaubandus-Tööstuskoda
(Estonian Chamber of Commerce and Industry)Toom-Kooli 17EE-10130 TallinnTel. (372) 646 02 44Fax (372) 646 02 45E-mail: [email protected]: http://www.koda.ee
HRVATSKA
Mediatrade LtdPavla Hatza 1HR-10000 ZagrebTel. (385-1) 481 94 11Fax (385-1) 481 94 11
MAGYARORSZÁG
Euro Info ServiceSzt. István krt.12III emelet 1/APO Box 1039H-1137 BudapestTel. (36-1) 329 21 70Fax (36-1) 349 20 53E-mail: [email protected]: http://www.euroinfo.hu
MALTA
Miller Distributors LtdMalta International AirportPO Box 25Luqa LQA 05Tel. (356) 66 44 88Fax (356) 67 67 99E-mail: [email protected]
NORGE
Swets Blackwell ASHans Nielsen Hauges gt. 39Boks 4901 NydalenN-0423 OsloTel. (47) 23 40 00 00Fax (47) 23 40 00 01E-mail: [email protected]: http://www.swetsblackwell.com.no
POLSKA
Ars PolonaKrakowskie Przedmiescie 7Skr. pocztowa 1001PL-00-950 WarszawaTel. (48-22) 826 12 01Fax (48-22) 826 62 40E-mail: [email protected]
ROMÂNIA
EuromediaStr.Dionisie Lupu nr. 65, sector 1RO-70184 BucurestiTel. (40-1) 315 44 03Fax (40-1) 312 96 46E-mail: [email protected]
SLOVAKIA
Centrum VTI SRNám. Slobody, 19SK-81223 BratislavaTel. (421-7) 54 41 83 64Fax (421-7) 54 41 83 64E-mail: [email protected]: http://www.sltk.stuba.sk
SLOVENIJA
GV ZalozbaDunajska cesta 5SLO-1000 LjubljanaTel. (386) 613 09 1804Fax (386) 613 09 1805E-mail: [email protected]: http://www.gvzalozba.si
TÜRKIYE
Dünya Infotel AS100, Yil Mahallessi 34440TR-80050 Bagcilar-IstanbulTel. (90-212) 629 46 89Fax (90-212) 629 46 27E-mail: [email protected]
ARGENTINA
World Publications SAAv. Cordoba 1877C1120 AAA Buenos AiresTel. (54-11) 48 15 81 56Fax (54-11) 48 15 81 56E-mail: [email protected]: http://www.wpbooks.com.ar
AUSTRALIA
Hunter PublicationsPO Box 404Abbotsford, Victoria 3067Tel. (61-3) 94 17 53 61Fax (61-3) 94 19 71 54E-mail: [email protected]
BRESIL
Livraria CamõesRua Bittencourt da Silva, 12 CCEP20043-900 Rio de JaneiroTel. (55-21) 262 47 76Fax (55-21) 262 47 76E-mail: [email protected]: http://www.incm.com.br
CANADA
Les éditions La Liberté Inc.3020, chemin Sainte-FoySainte-Foy, Québec G1X 3V6Tel. (1-418) 658 37 63Fax (1-800) 567 54 49E-mail: [email protected]
Renouf Publishing Co. Ltd5369 Chemin Canotek Road, Unit 1Ottawa, Ontario K1J 9J3Tel. (1-613) 745 26 65Fax (1-613) 745 76 60E-mail: [email protected]: http://www.renoufbooks.com
EGYPT
The Middle East Observer41 Sherif StreetCairoTel. (20-2) 392 69 19Fax (20-2) 393 97 32E-mail: [email protected]: http://www.meobserver.com.eg
MALAYSIA
EBIC MalaysiaSuite 45.02, Level 45Plaza MBf (Letter Box 45)8 Jalan Yap Kwan Seng50450 Kuala LumpurTel. (60-3) 21 62 92 98Fax (60-3) 21 62 61 98E-mail: [email protected]
MÉXICO
Mundi Prensa México, SA de CVRío Pánuco, 141Colonia CuauhtémocMX-06500 México, DFTel. (52-5) 533 56 58Fax (52-5) 514 67 99E-mail: [email protected]
SOUTH AFRICA
Eurochamber of Commerce in South AfricaPO Box 7817382146 SandtonTel. (27-11) 884 39 52Fax (27-11) 883 55 73E-mail: [email protected]
SOUTH KOREA
The European Union Chamber ofCommerce in Korea5th FI, The Shilla Hotel202, Jangchung-dong 2 Ga, Chung-kuSeoul 100-392Tel. (82-2) 22 53-5631/4Fax (82-2) 22 53-5635/6E-mail: [email protected]: http://www.eucck.org
SRI LANKA
EBIC Sri LankaTrans Asia Hotel115 Sir ChittampalamA. Gardiner MawathaColombo 2Tel. (94-1) 074 71 50 78Fax (94-1) 44 87 79E-mail: [email protected]
T’AI-WAN
Tycoon Information IncPO Box 81-466105 TaipeiTel. (886-2) 87 12 88 86Fax (886-2) 87 12 47 47E-mail: [email protected]
UNITED STATES OF AMERICA
Bernan Associates4611-F Assembly DriveLanham MD 20706-4391Tel. (1-800) 274 44 47 (toll free telephone)Fax (1-800) 865 34 50 (toll free fax)E-mail: [email protected]: http://www.bernan.com
ANDERE LÄNDEROTHER COUNTRIESAUTRES PAYS
Bitte wenden Sie sich an ein Büro IhrerWahl/Please contact the sales office ofyour choice/Veuillez vous adresser aubureau de vente de votre choixOffice for Official Publications of the EuropeanCommunities2, rue MercierL-2985 LuxembourgTel. (352) 29 29-42455Fax (352) 29 29-42758E-mail: [email protected]: publications.eu.int
2/2002
Venta • Salg • Verkauf • Pvlèseiw • Sales • Vente • Vendita • Verkoop • Venda • Myynti • Försäljninghttp://eur-op.eu.int/general/en/s-ad.htm

Directorate-General for Research
Energy
EUR 203662003
WWorld eenergy, ttechnology andclimate policy ooutlook 2030
- WETOWETO -
EUROPEAN COMMISSION

A great deal of additional information on the European Union is available on the Internet.It can be accessed through the Europa server (http://europa.eu.int).
Cataloguing data can be found at the end of this publication.
Luxembourg: Office for Official Publications of the European Communities, 2003
ISBN 92-894-4186-0
© European Communities, 2003Reproduction is authorised provided the source is acknowledged.
Printed in Belgium
PRINTED ON WHITE CHLORINE-FREE PAPER
III
TABLE OF CONTENTS
FOREWORD .......................................................................................................1
KEY MESSAGES................................................................................................3
CHAPTER 1 : CONTEXT AND METHODOLOGY ....................................71.1 THE REFERENCE SCENARIO....................................................................................71.2 UNCERTAINTIES.........................................................................................................81.3 POLICY ISSUES............................................................................................................9
CHAPTER 2 : ENERGY AND TECHNOLOGY TRENDS TO 2030........132.1 KEY ASSUMPTIONS .................................................................................................132.2 INTERNATIONAL ENERGY PRICES.......................................................................202.3. GLOBAL OUTLOOK FOR ENERGY AND CO2 EMISSIONS.................................24
2.3.1 World energy consumption...............................................................................242.3.2 Energy related CO2 emissions ..........................................................................32
2.4 PRIMARY FUEL SUPPLY..........................................................................................382.4.1 Simulation of oil and gas discovery..................................................................382.4.2 World oil supply ...............................................................................................382.4.3 World gas supply ..............................................................................................422.4.4 World coal supply.............................................................................................44
CHAPTER 3 : SECTORAL OUTLOOK ......................................................473.1 ENERGY DEMAND....................................................................................................47
3.1.1 Global trends.....................................................................................................473.1.2 Regional trends .................................................................................................483.1.3 Industry .............................................................................................................503.1.4 Transport sector.................................................................................................513.1.5 Household sector...............................................................................................523.1.6 Services and agriculture ....................................................................................53
3.2 POWER GENERATION AND RENEWABLE TECHNOLOGIES ...........................543.2.1 Global trends.....................................................................................................543.2.2 Renewables .......................................................................................................57
CHAPTER 4 : ASSESSMENT OF UNCERTAINTIES...............................634.1. OIL AND GAS RESOURCES .....................................................................................63
4.1.1 Low oil and gas resources .................................................................................644.1.2 High gas resources ............................................................................................67
4.2. TECHNOLOGY DEVELOPMENT FOR POWER GENERATION ..........................704.2.1 Gas ....................................................................................................................724.2.2 Coal ...................................................................................................................734.2.3 Nuclear ..............................................................................................................764.2.4 Renewables .......................................................................................................784.2.5 Impact on CO2 emissions..................................................................................80

IV
CHAPTER 5 : EU GAS MARKET IN A WORLD PERSPECTIVE .........835.1 GAS DEMAND............................................................................................................835.2 GAS SUPPLY ..............................................................................................................885.3 SECURITY OF EU GAS SUPPLY .............................................................................96
CHAPTER 6 : IMPACTS OF CLIMATE CHANGE POLICIES ..............996.1 INTERNATIONAL AGREEMENTS ..........................................................................996.2 A CO 2 EMISSION ABATEMENT CASE FOR 2030 ...............................................1026.3 CONSEQUENCES OF ACCELERATED TECHNOLOGY DEVELOPMENT ......108
DEFINITION OF REGIONS.........................................................................111
LIST OF ACRONYMS AND ABBREVIATIONS ......................................113
AKNOWLEDGMENT....................................................................................115
ANNEX 1 : COMPARISON OF WORLD ENERGY STUDIES ..............117
ANNEX 2 : WETO PROJECTIONS BY REGIONS .................................129
______________________________________________
LIST OF BOXES
Box 1: The POLES Model .....................................................................................................11Box 2: GDP forecasts.............................................................................................................16Box 3: Oil, gas and coal prices modelling .............................................................................20Box 4: The simulation of oil and gas reserves .......................................................................39Box 5: Modelling of final energy demand .............................................................................50Box 6: Modeling of power generation ...................................................................................55Box 7: Modelling the diffusion of new and renewable energy technologies .........................60Box 8: The simulation of gas trade and production ...............................................................91Box 9: Kyoto Protocol emissions targets and EU burden sharing .......................................101

V
LIST OF FIGURES
Figure 2.1: World population, per capita GDP and GDP growth ..........................................15Figure 2.2: World population, by region ................................................................................16Figure 2.3: Per capita GDP by region as a percentage of North America ..............................17Figure 2.4: World GDP ..........................................................................................................18Figure 2.5: Oil and gas prices.................................................................................................21Figure 2.6: Oil and gas reserve on production ratios..............................................................23Figure 2.7: World energy consumption..................................................................................24Figure 2.8: EU energy consumption.......................................................................................26Figure 2.9: Energy consumption in the other world regions ..................................................28Figure 2.10: Total and final energy intensity (1990, 2000, 2010, 2030) ..................................29Figure 2.11: Energy consumption per capita............................................................................30Figure 2.12: Electricity use and GDP per capita, 1980-2030...................................................31Figure 2.13: Transport energy use and GDP per capita, 1980-2030 ........................................31Figure 2.14: Thermal uses and GDP per capita, 1980-2030 ....................................................32Figure 2.15: Energy-related CO2 emissions .............................................................................33Figure 2.16: Carbon intensity of GDP......................................................................................36Figure 2.17: CO2 emissions per capita .....................................................................................36Figure 2.18: World conventional oil resources ........................................................................40Figure 2.19: OPEC and non-OPEC conventional oil resources ...............................................41Figure 2.20: World oil production............................................................................................42Figure 2.21: World gas resources .............................................................................................42Figure 2.22: Gas resources in the CIS and the Gulf .................................................................43Figure 2.23: World gas production...........................................................................................44Figure 2.24: World coal production .........................................................................................44Figure 3.1: World final energy consumption..........................................................................47Figure 3.2: EU final energy consumption ..............................................................................48Figure 3.3: Final energy consumption in the other world regions..........................................49Figure 3.4: Energy intensity of the industry sector.................................................................51Figure 3.5: Number of cars per 1000 inhabitants ...................................................................52Figure 3.6: World power generation ......................................................................................54Figure 3.7: EU power generation ...........................................................................................55Figure 3.8: Power generation in the other world regions .......................................................57Figure 3.9: World electricity production from renewables ....................................................58Figure 3.10: EU electricity production from renewables .........................................................58Figure 3.11: Electricity production from renewables in other world regions...........................59Figure 4.1: Ultimate Recoverable Resources in the Reference and Resource cases ..............64Figure 4.2: Learning curves for power generation technologies; 1990-2030.........................71Figure 4.3: Cost of electricity: gas combined cycle versus supercritical coal technology .....74Figure 4.4: Learning curves for advanced coal technologies .................................................76Figure 4.5: Impact of the nuclear case on the electricity generation by technology...............78Figure 5.1: World gas demand ...............................................................................................84Figure 5.2: Gas consumption increase from 2000 to 2030.....................................................85Figure 5.3: Gas reserves .........................................................................................................88Figure 5.4: Share of gas production .......................................................................................89

VI
Figure 5.5: Gas consumption and production in 2030 ...........................................................90Figure 5.6: Inter-regional gas trade by region of destination..................................................95Figure 6.1. World electricity generation in 2030 .................................................................108Figure 6.2: The role of technology to reduce marginal abatement costs..............................110
__________________________________________
LIST OF TABLES
Table 4.1: Oil supply: Low case versus Reference ...............................................................65Table 4.2: Gas supply: Low case versus Reference ..............................................................66Table 4.3: World energy consumption and CO2 emissions: Low case versus Reference.....67Table 4.4: Gas supply: High case versus Reference .............................................................68Table 4.5: World energy consumption and CO2 emissions: High case versus Reference ....69Table 4.6: Assumptions and results of the Gas case .............................................................73Table 4.7: Assumptions and results of the Coal case............................................................75Table 4.8: Assumptions and results of the Nuclear case.......................................................77Table 4.9: Assumptions and results of the Renewable case..................................................79Table 4.10: Summary of the impact of the technology cases..................................................80Table 5.1: Share of electricity generated from natural gas....................................................87Table 5.2: Gas trade matrix...................................................................................................93Table 5.3: Overview of EU and Acc. Countries position regarding gas security .................97Table 6.1: World energy demand and CO2 emissions.........................................................103Table 6.2: Energy demand and CO2 emissions in EU and Accession countries .................104Table 6.3: Energy demand and CO2 emissions in the Japan and Pacific region.................104Table 6.4: Energy demand and CO2 emissions in Asia.......................................................105Table 6.5: Energy demand and CO2 emissions in North America......................................105Table 6.6: Energy demand and CO2 emissions in the CIS..................................................106Table 6.7: Energy demand and CO2 emissions in Africa and the Middle East region .......106Table 6.8: Energy demand and CO2 emissions in Latin America.......................................106Table 6.9: Sectoral energy demand .....................................................................................107Table 6.10: Electricity generation .........................................................................................107

With the launch of the European Research Area, I haveunderlined the need to provide the EU with a common systemof scientific and technical reference for policy implementationparticularly for aspects related to sustainable development.
This World Energy, Technology and climate policy Outlook(WETO) is a clear example of a fruitful collaborationbetween European researchers (ENERDATA and IEPE inFrance, BFP in Belgium and IPTS) helping decision-makersto define their long-term policies.
Starting from a set of clear key assumptions on economicactivity, population and hydrocarbon resources, WETO
describes in detail scenarios for the evolution of World and European energy systems, powergeneration technologies and impacts of climate change policy in the main world regions orcountries. It presents a coherent framework to analyse the energy, technology and environmenttrends and issues over the period to 2030, focusing on Europe in a world context.
I would like to highlight three of the key results of this work:
First, in a Reference scenario, i.e. if no strong specific policy initiatives and measures aretaken, world CO2 emissions are expected to double in 2030 and, with a share of 90%, fossilfuels will continue to dominate the energy system;
Secondly, the great majority of the increase in oil production will come from OPEC countriesand the EU will rely predominantly on natural gas imported from the CIS.
Lastly, as the largest growing energy demand and CO2 emissions originate from developingcountries (mainly China and India), Europe will have to intensify its co-operation, particularlyin terms of transfer of technologies.
The analysis of long-term scenarios and a particular attention to the energy world context, isan important element for efficient energy, technology and environment policies towards a sustainable world.
Philippe BusquinMember of the European Commission
Responsible for Research
FOREWORD


KEY MESSAGES
Reference scenario
� The WETO study describes a Reference scenario that provides a description of thefuture world energy system, under a continuation of the on-going trends and structuralchanges in the world economy (a “business and technical change as usual” context).The scenario results should be seen as a benchmark for the assessment of alternatives,particularly with respect to resources, technologies and environmental policy. A soundunderstanding of the long-term issues is a key element in establishing future researchand technological development priorities in the field of energy and environment. TheReference scenario does represent a baseline performance which can be bettered ifappropriate policies are put in place.
� World energy demand is projected to increase at about 1.8%/year between 2000 and2030. The impact of economic and population growth (respectively 3.1% and 1%/yearon average), is moderated by a decrease in the energy intensity of 1.2%/year, due to thecombined effects of structural changes in the economy, of technological progress andof energy price increases. Industrialised countries experience a slowdown in thegrowth of their energy demand to a level of e.g. 0.4%/year in the EU. Conversely, theenergy demand of developing countries growths rapidly. In 2030, more than half of theworld energy demand is expected to come from developing countries, compared to40% today.
� The world energy system will continue to be dominated by fossil fuels with almost90% of total energy supply in 2030. Oil will remain the main source of energy (34%)followed by coal (28%). Almost two-thirds of the increase in coal supply between2000 and 2030 will come from Asia. Natural gas is projected to represent one quarterof world energy supply by 2030; power generation provides the bulk of the increase. Inthe EU, natural gas is expected to be the second largest energy source, behind oil butahead of coal and lignite. Nuclear and renewable energies would altogether representslightly less than 20% of EU energy supply.
� Given the continued dominance of fossil fuels, world CO2 emissions are expected toincrease more rapidly than the energy consumption (2.1%/year on average). In 2030,world CO2 emissions are more than twice the level of 1990. In the EU, CO2 emissionsare projected to increase by 18% in 2030 compared to the 1990 level; in the USA theincrease is around 50%. While the emissions from developing countries represented30% of the total in 1990, these countries are responsible for more than half the worldCO2 emissions in 2030.
� Sufficient oil reserves exist worldwide to satisfy the projected demand during the nextthree decades. However the decline in conventional oil reserves may constitute apreoccupying signal beyond 2030. It is only partly compensated by an increase in thereserves of non-conventional oil. The reserves of natural gas are abundant andexpected to increase by around 10%. There is no constraint on coal reserves over thistime horizon.
3

� World oil production is projected to increase by about 65% to reach some 120million bl/day in 2030: as three quarters of this increase comes from OPEC countries,OPEC accounts for 60% of total oil supply in 2030 (compared to 40% in 2000).
� Gas production is projected to double between 2000 and 2030. However, regionaldisparities in gas reserves and production costs are expected to modify the regional gassupply pattern in 2030: about one third of the total production will originate from theCIS, while the remaining production will be almost equally allocated among otherregions.
� Coal production is also expected to double between 2000 and 2030,with most of thegrowth taking place in Asia and in Africa, where more than half the coal would beextracted in 2030.
� The oil and gas prices trend corresponds to a significant increase from current levels:the oil price is projected to reach 35 €/bl in 2030 with gas prices at 28, 25 and 33 €/blin 2030 on the European/African, American and Asian markets respectively. Theregional gas price differentials are expected to diminish significantly, reflecting morecomparable gas supply mixes. The coal price is expected to remain relatively stable ataround 10 €/bl in 2030.
� The final energy demand will grow at a similar pace to the gross inland consumption.As all sectors are expected to experience similar growth, their share in final demandwill remain roughly constant at world level: around 35 % for industry, 25 % fortransport and 40 % for the residential and tertiary sectors. The energy demand bysector shows different patterns according to the regions: in developed countries,energy demand in the services sector is the fastest growing segment; in developingcountries, all sectors experience sustained growth at 2 to 3 %/year.
� Electricity continues its penetration in all regions, accounting for almost a quarter offinal energy demand; coal declines in industrialised countries; biomass is progressivelyphased out in developing countries. Oil remains the dominant fuel, with a shareranging from 40 to 50 % in 2030 according to the region.
� Electricity production increases steadily at an average rate of 3 %/year. More thanhalf of the production in 2030 will be provided by technologies that emerged in thenineties and afterwards like combined cycle gas turbines, advanced coal technologiesand renewables.
� The share of gas in power generation increases steadily in the three major gas-producing regions (CIS, Middle East and Latin America) and the share of coaldecreases in all regions, except in North America where it stabilises and in Asia whereit increases significantly. The development of nuclear power does not keep pace withtotal electricity production: its market share comes down to 10 % in 2030.Renewables covers 4 % of the production (from 2 % in 2000), mainly because of arapid progression in electricity production from wind.
4

Sensitivity to changes in hydrocarbons resources and technologydevelopments
� With lower hydrocarbons resources, oil and gas prices are projected to be muchhigher than in the Reference at around 40 €/bl for oil in 2030. This induces a lowerworld energy demand (-3%), which particularly favours coal and non-fossil energies,and curtails demand for natural gas (-13%) and oil (-6%). As a result, world CO2emissions are 2% lower than in the Reference.
� Conversely, increased gas resources would lead to a drop in gas prices to 16, 20 and28 €/bl in 2030 on the American, European and Asian markets respectively. Oil pricedecreases only slightly reflecting the limited potential for substitution between oil andgas. Although the world energy demand is slightly affected (+1.5%), the fuel mix issubstantially modified in favour of natural gas (+21%, against -9% for coal, -3% foroil and -4% for primary electricity).
� Accelerated technology developments for electricity generation lead to significantchanges in the structure of electricity production. Important though the power sectormay be, it only accounts for about one third of world CO2 emissions. Technologiesonly addressing this sector thus have a limited impact on total CO2 emissions. Theavailability of advanced technology, however, can have considerable impact on thecost to meet emission reduction targets.
EU gas market in a world perspective
� The EU gas market is rapidly expanding and growth is expected to continue in thenext two decades, driven by the "dash for gas" for power generation. Nevertheless, theEU contribution to world gas consumption is expected to decrease steadily.
� World gas reserves are abundant but concentrated in two world regions, the CIS andthe Middle East, where gas production is projected to grow considerably during thenext thirty years. In contrast, the European gas resources are limited and production isexpected to decline steadily beyond 2010, resulting in an increasing dependence onexternal gas supplies.
� Natural gas demand is also projected to increase in the other world regions: some ofthem with limited or declining gas reserves will become net importers leading toimportant changes in the world gas trade patterns. For instance, the rapid growth of gasdemand in Asia is expected to have some influence on the EU gas supply pattern in2030: while Asia is projected to rely predominantly on gas supplies from the MiddleEast, the EU and Accession countries may import more than half their natural gasneeds from the CIS.
� This outcome may translate into higher supply risks for the EU. These risks couldhowever be limited through different actions as outlined in the EC Green Paper, likethe multiplication of gas transport routes, the further integration of the European gasnetwork, and a continuous dialogue with gas producing countries. Long-term
5

contractual LNG supplies are projected to increase but more moderately and frommore diverse sources in Africa and the Middle East.
Impacts of climate change policies
� By attaching a carbon value to fossil fuel use, CO2 emissions in 2030 are 21 % lowerthan in the Reference at world level and 26 % lower in the EU and AccessionCountries. At the world level and in most regions, this reduction is achieved by equalreductions in energy demand and in the carbon intensity of energy consumption.
� In the carbon abatement case, more than half of the world energy demand reductionis achieved in the industry sector. The decrease in carbon intensity comes mainlyfrom the substitution of gas and biomass for coal and lignite and to a lesser extent oil;gas demand remains roughly stable as fuel switching in favour of gas takes place. Incontrast, the consumption of biomass increases significantly and nuclear progressesconsiderably while large hydro and geothermal remain stable; finally, wind, solar andsmall hydro jump up by a factor of 20.
6

CHAPTER 1
CONTEXT AND METHODOLOGY
1.1 THE REFERENCE SCENARIO
The Reference scenario of WETO provides a coherent picture of the evolution of energysupply and demand by world regions, as only driven by the economic fundamentals, over thenext thirty years. The framework of hypotheses was chosen so as to reflect the state of theworld in a “business and technical change as usual” perspective, which can serve as abenchmark for the economic evaluation of the future EU policy options related to energysupply and demand, and to carbon constraints. For this purpose, the Reference does not takeinto account specific energy or environment policy objectives and measures beyond what isactually (2000) embodied in "hard decisions" (investment actually made, regulation actuallyenforced in law and voluntary agreements actually signed). This means in particular that thereduction objectives in the Kyoto Protocol, the phase-out of nuclear planned or envisaged forthe future in some countries, the targeted share of renewables or the future modificationsplanned or envisaged in the economic instruments (e.g. coal subsidies) are not part of theReference. The reference does neither aim at predicting what will happen or what is the mostprobable future, nor at illustrating the EU policy targets, but rather at identifying and sizingthe possible problems and constraints raised by a business as usual development, that EU andmember countries will have to face. For instance, with respect to CO2 emissions, thisreference shows the emissions gap that needs to be closed with further measures after thedecisions of the EU to ratify the Kyoto Protocol.
This outlook is based on the results of the POLES model. This simulation model, developedand used under different EC programmes since 1994, allows to elaborate long-term energysupply and demand projections for the different regions of the world under a set of consistentassumptions concerning, in particular, economic growth, population and hydrocarbonresources (Box 1).
Projecting long-term energy profiles involves a large number of assumptions. The populationgrowth assumptions are derived from the United Nations demographic forecasts. The worldeconomic growth outlook results from CEPII projections (« Centre d’Etudes Prospectives etd’Informations Internationales”). The US Geological Survey is the source of information usedfor oil and gas Ultimate Recoverable Resources. It provides a set of estimates and attachedprobabilities that are consistent on a world and region-by-region basis. Technologicaldevelopments regarding energy technology costs and performances are derived from analyseselaborated in the framework of other projects within the European Commission’s ResearchDirectorate-General (TEEM1 project, 2000).
1 Capros P., guest Editor, Energy Technology Dynamics and Advanced Energy Systems Modeling (TEEM: aprogram funded by the European Commission, Directorate General Research), in International Journal ofGlobal Energy Issues, Special Issue, Vol. 14, Nos. 1-4, 2000.
7

WETO
All projections in WETO refer to seven world regions and seven countries or group ofcountries. The world regions are the North America, Japan/Pacific, CIS/CEECs (Communityof Independent States / Countries of Central and Eastern Europe), Latin America,Africa/Middle East and Asia. The countries or group of countries under focus are theEuropean Union, either in its existing size with 15 countries or including the AccessionCountries, USA, Japan, Brazil, China and India. The composition of each world region isprovided after Chapter 6.
The detailed description of the results of the Reference scenario for the world energy systemto 2030 are presented in Chapters 2 and 3.
1.2 UNCERTAINTIES
The Reference scenario, as any other baseline projection involves many uncertainties that mayconsiderably change the world energy development pattern in the next three decades. Two ofthese uncertainties will be considered in this report: the resource estimates for oil and gas andthe development for new electricity production technologies.
Resource availability
The uncertainty on oil and gas resources is taken into account through two variants:
- The low oil and gas resource case is designed to test the sensitivity of the projectionsto more pessimistic assumptions on hydrocarbon resources, and to assess theconsequences of higher oil and gas prices on energy demand and supply to 2030.
- The high gas reserves case is designed to simulate a situation where gas prices arestructurally lower than oil prices. For that purpose, the assumptions of the Referenceare used for oil resources, while higher estimates are considered for gas resources.
Both cases are examined and analysed against the Reference Scenario, so as to provideinsights on their main impacts on the world energy system in general and on the energysystem of the EU in particular (Chapter 4).
Technology development
Beside the uncertainties on hydrocarbon resources, Chapter 4 also explores the uncertainty onthe future development of power generation technologies. More precisely, it provides anassessment of the potential impacts of accelerated technological changes through differenttechnology cases. Each case combines consistent sets of alternative hypotheses regarding thefuture costs and performance parameters (e.g. conversion efficiency, availability factor, safetyrequirement) of selected power generation technologies, based either on fossil fuels, nuclearenergy or renewable energy forms.
The methodology used to develop and analyse the technology cases consists in three steps:first, the identification of possible technological breakthroughs affecting clusters oftechnologies, then the use of expert judgment to translate these breakthroughs into more
8

CONTEXT AND METHODOLOGY
optimistic performance trajectories, and third the assessment of the impacts of thesealternative cases against the Reference. The assessment encompasses changes in fuel supply,in the competitive position of power generation technologies, and in global and powergeneration CO2 emissions at the world and regional level.
This report presents four technology cases:
- The “gas” case, which assumes enhanced availability of natural gas and introducesfurther improvements for combined cycle gas turbines and fuel cells.
- The “coal” case, which involves major improvements in advance coal technologies,namely supercritical coal plants, integrated coal gasification combined cycle plants anddirect coal firing plants.
- The “nuclear” case, which assumes a breakthrough in nuclear technology in terms ofcost and safety. It has an influence on standard large light water reactors but especiallyon new evolutionary nuclear reactors.
- The “renewable” case, which supposes a major improvement in renewable energiesnotably wind power, biomass gasification, solar thermal power plants, small hydro andphotovoltaic cells.
1.3 POLICY ISSUES
Finally, this report analyses in more detail two important issues regarding the long-termenergy, technology and climate policy developments of the European Union. The first onerelates to the future of natural gas in the EU in a context of growing demand in the otherworld regions and of uncertainty on resources and investments in transport infrastructure. Thesecond one deals with the impacts to 2030 of the introduction of a carbon constraint at worldlevel on EU and other world regions’ energy balances and technology developments.
The EU gas market in a world perspective
Over the last ten years, the world demand for gas has grown rapidly. Gas demand increasedthe most rapidly for several reasons, including price competitiveness, environmentaladvantages over other fossil fuels and abundant resources. The rise in gas consumption hasbeen particularly remarkable in the power generation sector. As the Reference projects thecontinuation of this trend through 2030 – although at a lower pace by the end of the projectionperiod – it is worth asking how the projected growing market for gas, combined with thedecline of gas production in Europe, will affect the outlook of gas supplies to 2030 and whatthe impacts will be on the security of supply in the EU.
The POLES model provides a valuable tool for addressing the above issue. Its worlddimension makes explicit not only the linkages between the gas demand growth and thedecrease in gas production in the EU, but also the demand for gas in the other world regionsand the characteristics of the regional gas markets (e.g. prices, pipeline and Liquefied Natural
9

WETO
Gas transport routes between the producing and consuming regions). The latter are keyelements in the determination of the allocation of world gas resources among consumingregions.
Chapter 5 describes the projected evolution of the EU gas market in the Reference Scenario interms of gas demand, gas supply portfolio, world gas trade and transport between pipelinesand Liquefied Natural Gas.
Energy related CO2 emissions constraints and long-term energy development
The Reference Scenario does not ensure that emissions reduction objectives are met for theKyoto First Commitment Period (2008-2012). Therefore the Reference represents abenchmark for the identification of the gap further measures need to close in the 2008 to 2012time horizon and the debate and setting of commitments beyond 2012.
Chapter 6 is more particularly devoted to climate policy issues. It is divided into two parts,according to the time horizon considered. In the first part, the focus is on the Kyoto FirstCommitment Period and most of the attention is paid on the evaluation of the Referenceagainst the Kyoto targets. A short discussion on the implementation of the Kyoto Protocol andon the state of affairs of international negotiations is also included.
The second part provides a description and a detailed analysis of a CO2 abatement scenario(2030). This carbon abatement case is designed to simulate and assess the potential impacts ofworld CO2 reduction policies on the future development of energy balances and technologies.This case is defined through the introduction of a “carbon value” that is differentiated by mainworld regions and time horizons. More precisely, the carbon values are determined so toreflect possible regional differences in implementing the Kyoto targets in 2010.
10

CONTEXT AND METHODOLOGY
Box 1: The POLES Model2
The model structure corresponds to a hierarchical system of inter-connected modules andinvolves three levels of analysis:
i. International energy markets;ii. Regional energy balances;iii. National models3 on energy demand, new technologies and renewable energy,
power generation, primary energy supply and CO2 emissions.
The dynamics of the model is based upon a recursive simulation process, in whichenergy demand and supply in each national or regional module respond with different lagstructures to international prices variations in the preceding periods. In each module,behavioural equations take into account the combination of price effects, technico-economic constraints and trends.
There are fifteen final energy demand sectors (covering the main industrial branches,transport modes, the residential and service sectors), twelve large-scale power generationtechnologies and twelve new and renewable energy technologies.
Oil and gas supply profiles in the largest world producing countries are dealt with adiscovery process model in which oil and gas production depends on the dynamics of thedrilling activity and discovery of new reserves, given the existing resources and thecumulative production. Coal, supply is essentially demand driven.
The integration of import demand and export capacities of the different regions areensured in the international energy market module, which balances the internationalenergy flows. One world market is considered for oil (the ‘one great pool’ concept),while three regional markets (America, Europe/Africa, and Asia) are identified for gasand coal so as to account for regional differences in cost and market structures. Thechanges in international prices of oil, gas and coal are determined endogenously in thismodule. The international price equations take into account the relevant variablesassociated to short-term adjustments in price levels, such as the Gulf capacity utilisationrate for oil, and to medium and long-term variables such as the Reserve on Productionratio for oil and gas, or the trend in productivity and production costs for coal.
2 For more information www.upmf-grenoble.fr/iepe/textes/POLES8p_01.pdf3 The POLES model identifies thirty-eight world regions or countries, of which the 15 countries of the EU andthe largest countries (USA, Canada, Japan, China, India, Brazil, etc.).
11


CHAPTER 2
ENERGY AND TECHNOLOGY TRENDS TO 2030
2.1 KEY ASSUMPTIONS
The Reference scenario
The Reference scenario aims at providing a description of the future world energy system, asif the on-going technical and economic trends and structural changes were to continue. In thisrespect, it constitutes the appropriate benchmark for the economic assessment of future energyand climate policy options.
The Reference scenario was designed with the following philosophy:
- The main drivers in the future development of the world energy system will remain thedemography and economic growth (Gross Domestic Product). As the on-going trends forthese two sets of variables are differentiated across the main world regions, theircontinuation results in significant changes in the regional structure of population, GDP,energy demand and associated emissions.
- Technical change has been a continuous phenomenon through history, although thisprocess may be submitted to slowdowns or accelerations. Thus, any projection of theeconomic system has to take into account the consequences of the continuousimprovement in the technologies’ economic and technical performances. As far as energytechnologies are concerned, the hypotheses considered in the Reference indeed take intoaccount technological progress, at least along the lines of past improvements (hypothesesof breakthroughs are considered elsewhere in the technology cases).
- The availability of energy resources is clearly a potential constraint for the development offossil fuel use in the long term, or at least it is a factor that can bring tensions on theinternational energy markets and drive the energy prices up. Coal resources are known tobe overabundant, at least for the next century. But huge uncertainties surround anyassessment of the recoverable oil and gas resources at the world and regional level. TheReference scenario uses median estimates for resources that are identified at the regionallevel, with values that are globally well accepted by the experts, in a "business as usual"perspective.
- As far as energy and climate policies are concerned, the Reference scenario only includesthe consequences of policy measures, which are actually (2000) embodied in "harddecisions" (investment actually made, regulation actually enforced in law and voluntaryagreement actually signed). It is even considered by judgement that some measures maynot benefit of a full implementation over the projection period. Thus the Reference doesnot include the compliance to the policy decisions or announcements made bygovernments, including the European Commission, or industries, such as the Kyoto
13

WETO
commitments, the targeted share of renewables4, the nuclear phase-out in Germany orBelgium, or the removal of existing economic instruments (eg subsidies or taxes). This islogical as the cost of these policies, which are being implemented or will be implementedin the near future, can only be assessed by comparison with a reference scenario that isfree of such constraints or commitments.
As any model, POLES, the model used in this study, is a simplified representation of reality,mostly based on the fundamental economic relations involved in the world energy system.Some important factors, which may have a decisive impact on the future development of theworld energy system, are either ignored or at least not explicitly dealt with in the model,because too complex or impossible to quantify. Among these factors: the geopolitical driversand constraints that have already played a major role on the energy scene, such as theindustries’ regulation and organisation schemes, which have changed significantly in the pasttwenty years.
As a consequence, the “business and technical change as usual” energy evolutions depicted bythe Reference are mostly driven by changes in economic fundamentals that reflect rationaleconomic behaviours. How these evolutions would modify the geopolitical constraints orfoster complementary changes in the industries’ regulation and organisation schemes, and,therefore, which policy response they may induce, is out of the scope of the Referencegenerated by POLES.
The dynamics in world population and economic growth
The combined growth in the world population and economy will remain key driving forces inthe development of the energy sector over the next decades. The population outlook used inthe WETO study is based on the UN population prospects5. The economic outlook has beenprepared by the CEPII6 and is based on a simple growth model that takes into account theaccumulation of physical and human capital in the different regions considered.
The resulting picture of the world population and GDP7 to 2030 reflects a combination ofcontinuing trends and of important structural changes. The key features of these dynamics canbe summarised as follows:
- World population growth rate will continue to decrease over the projection period from1.5 %/year in the past decade to 1 %/year over the 2000 to 2030 period. This results in atotal population of 8.2 billions in 2030, from 6.1 billions in 2000.
- On average, world economic growth will be, slightly above 3 %/year for the next thirtyyears, a figure comparable to the past thirty years (3.3 %/year from 1970 to 2000 and 3.0
4 The EU target is 12 % of gross consumption for renewable energy in 2010, as outlined in the EuropeanDirective (2001/77EC of the European Parliament and the Council of 27 October 2001) on the Promotion ofElectricity from Renewable Energy Sources in the Internal Electricity Market.5 United Nations, World Population Prospects, The 2000 revision, UN Department of Economic and SocialAffairs, Population Division, New York, 2001.6 IEPE, CEPII, CIRED, Analyse des stratégies de Réduction des Emissions de gaz à effet de Serre, ARESproject, GICC Programme of the French Ministry of the Environment, 2002.7 All GDP figures in this study are calculated using a constant 1995 Purchasing Power Parity system.
14

ENERGY AND TECHNOLOGY TRENDS TO 2030
% from 1990 to 2000, due in particular to the transition process in the CEEC and CISregion during the past decade).
- This is made possible by acceleration in the average per capita GDP growth that isparticularly marked in the 2000-2010 decade, and is largely due to the projected economicrecovery in the CEEC and CIS region.
- The combination of the continuous slowdown in the growth rates of the population andper capita GDP results, after the initial upsurge, in an economic growth rate that isweakening over time, from 3.5 %/year in the first decade, to 3.1 %/year and finally 2.6%/year between 2020 and 2030 (Figure 2.1).
Figure 2.1: World population, per capita GDP and GDP growth
0.0%
0.5%
1.0%
1.5%
2.0%
2.5%
3.0%
3.5%
4.0%
1990-2000 2000-2010 2010-2020 2020-2030
%/y
ear
Population Per capita GDP GDP
The structure of world population
As noted above, the increase in world population will slowdown over the next thirty years,and in some regions of the industrialised world the population will even decrease in absoluteterms. This is the case of the EU after 2010, while this decrease only begins after 2020 in theCEEC and CIS region and in the Japan and Pacific region.
However the world population structure does not change that much over the projection period,as most regions only incur a 1 to 2-percentage points loss in their share. Only two regionsexperiment an increase in their share: Latin America (with a very limited gain of 0.4percentage point) and the Africa and Middle-East region, whose share of world populationgoes from 16 % in 2000 to 22 % in 2030 (Figure 2.2).
15

WETO
Figure 2.2: World population, by region
World Population (Millions)
0
1000
2000
3000
4000
5000
6000
7000
8000
9000
1990 2000 2010 2020 2030
Western Europe North America Japan, PacificCIS, CEEC Latin America Africa, Middle EastAsia
Share of World Population
0%
10%
20%
30%
40%
50%
60%
70%
80%
90%
100%
1990 2000 2010 2020 2030
Western Europe North America Japan, PacificCIS, CEEC Latin America Africa, Middle EastAsia
GDP growth projections and changes in relative per capita GDP
The simple growth model that has been used to project the GDP of the different world regionsis based on the hypothesis of a convergence in the GDP growth rates, subject to conditionalhypotheses on investment rates in physical and human capital. The hypotheses used for theGDP projections intend to reflect the particular conditions of each country or region.
Box 2: GDP forecasts
The GDP projections used in the POLES model scenarios are provided by the CEPII(Centre d’Etudes Prospectives et d’Informations Internationales), a research centre of theFrench Government specialised in international economic analysis, modelling andforecasting.
GDP forecast by world region relies on a neo-classical growth model with exogenoustechnological progress and an explicit consideration of the human capital.
The main assumption of the model is the convergence in labour productivity towards along-term equilibrium in a closed economy. The active population being exogenous, theforecast depends on three key factors: physical capital, human capital and technologylevel incorporated in labour. The physical capital is a function of the investment rate.The human capital is a function of the school enrolment, linked to the GDP per capita.The convergence in the labour productivity variation is due to an assumption of adecreasing marginal output of the physical and human accumulated capital.
Investment rates and school enrolment are different by country and the growth of thetechnology level incorporated in labour is higher for developed countries.
16

ENERGY AND TECHNOLOGY TRENDS TO 2030
When translated into per capita GDP levels, the projections show a slight convergence acrossthe different world regions. This convergence can be analysed by calculating the ratio of eachregion’s per capita GDP on that of the higher income region, i.e. North America (Figure 2.3):
- After the 1990-2000 decade during which Western Europe and the Japan and Pacificregions lost some ground comparatively to North America, the projection results in somecatch-up of these two regions in the next decades. The Japan and Pacific regionrecuperates its position of 1990 in 2030 (80 % of the North American level) whileWestern Europe slightly improves it (from 68 to 72 %).
- As far as the economies in transition are concerned, the per capita GDP ratio relatively toNorth America follows a much more uneven trajectory, with a huge drop from 1990 to2010 (from 32 to 18 % of North American level). A sustained recovery follows, withouthowever allowing a full recovery to the 1990 level (31 % in 2030).
- The trajectories of the developing regions are contrasted. While Asia sees a significantimprovement in its per capita GDP ratio (from 8 to 19 % of the North American levelbetween 1990 and 2030), the convergence process of Latin America is much more limited(from 20 to 25 %). The Africa and Middle East region does not experiment anyconvergence, as its per capita GDP represents a stable 7.5% of the North American levelover the period.
Figure 2.3: Per capita GDP by region as a percentage of North America
0%
10%
20%
30%
40%
50%
60%
70%
80%
90%
100%
1990 2000 2010 2020 2030
Latin America Western EuropeCIS, CEEC Africa, Middle-EastAsia Japan, Pacific
17

WETO
The structure of world GDP
The combination of population and per capita GDP growth results in an average world growthrate of 3.1 %/year over the projection period, with significant changes occurring in the worldGDP structure. While the industrialised countries of the West and of the East (CEEC and CIS)represented up to 70 % of total world GDP in 1990, this share is already brought down to 62% in 2000 due to the transition process in the economies in transition. In spite of the projectedeconomic recovery in that region, the share of the industrialised countries continues to declineall over the projection and ends up with 45 % of world GDP in 2030 (Figure 2.4).
Figure 2.4: World GDPWorld GDP (Billion € 99)
0
20000
40000
60000
80000
100000
1990 2000 2010 2020 2030
Western Europe North America Japan, PacificCIS, CEEC Latin America Africa, Middle-EastAsia
Share of World GDP
0%
10%
20%
30%
40%
50%
60%
70%
80%
90%
100%
1990 2000 2010 2020 2030
Western Europe North America Japan, PacificCIS, CEEC Latin America Africa, Middle-EastAsia
The developing countries’ share of world output thus significantly increases over the period.Although most of the gains take place in the Asia region, this new balance in the worldeconomy is a key driving force in the WETO projections. During the next thirty years indeed,the economic and energy scene is likely to be influenced by the growth in developing regions.They will progressively become dominant, not only in the overall economic production, butalso in energy consumption, production and CO2 emissions.
18
ENERGY AND TECHNOLOGY TRENDS TO 2030
Key assumptions
The WETO Reference scenario provides a description of the future world energysystem, under a continuation of the on-going trends and structural changes(“business and technical change as usual” context). The scenario results should beseen as a benchmark for the assessment of alternative cases, particularly with respectto resource, technologies and environmental policy.
World population will reach 8.2 billions in 2030, from 6.1 billions in 2000. Onaverage, world economic growth will be slightly above 3%/year for the next thirtyyears, a figure comparable to that of the past thirty years.
Technological progress continues along the lines of past improvements, withouthypotheses of major breakthroughs.
Median estimates are considered for the assessment of recoverable oil and gasresources by region, with values that are globally well accepted by the experts in thisfield and account for technological progress in upstream oil and gas technologies.
The Reference scenario only includes the consequences of the energy efficiency orenvironmental policies and measures that have already been decided up to now. Itdoes not include a full compliance to the policy decisions or announcements made bygovernments � including the European Commission � or industries. In particular, thecompliance to the Kyoto commitment of the various countries is not introduced as aconstraint.
19

WETO
2.2 INTERNATIONAL ENERGY PRICES
Oil and gas prices increase throughout the projection period
The long-run evolution of the international oil and gas prices is simulated in the POLESmodel, reflecting basically the dynamics and lagged adjustments of world demand and supply(see Box 3). The global picture for oil and gas prices8 in the Reference is illustrated in Figure2.5.
Box 3: Oil, gas and coal prices modelling
The oil price is calculated at world level, the oil market being described as “one greatpool”. It is considered as depending in the short term on the variations in the capacityutilisation rate of the Gulf countries and in the medium and long term on the worldaverage Reserve on Production ratio.
The gas price is calculated for three regional markets: the American market, the Euro-African and the Asian market. The gas price on each market then depends partly on a gasto oil price factor but principally, for the long term, on the variation in the averageReserve on Production ratio of the core suppliers of each main regional market.
The coal price is also estimated for the same three regional markets. It is obtained bycalculating the average price of the key suppliers on each market, weighted by theirmarket shares. The average price of the key suppliers is derived from variations inmining and operating costs (function of per capita GDP increase and of a productivitytrend) and from the capital and transport costs (both depending on the simulatedproduction increases, as compared to a "normal" expansion rate of productioncapacities).
Figure 2.5 shows a decline in oil price until the middle of the current decade, compared to thehigh level of 2000. This decline is largely due to the moderate oil demand. Later on, the oilprice increases relatively sharply to 24 €/bl in 2010 before a phase of more moderate butsteady increase until 2030. The oil price reaches 29 €/bl and 35 €/bl in 2020 and 2030respectively9. In fact, before 2010 a new period begins for the oil market, in which the oilproduction of the Gulf countries has to grow beyond its maximum historical level of about 23million bl/day. Consequently, the Gulf oil producers need by that time to continuouslydevelop new production capacities, while the reduction in Reserve on Production ratios atworld level exerts an upward pressure on oil price. However, the price-path obtained from themodel only indicates a trend that is consistent with the relative dynamics of world supply anddemand and do not pretend to provide a precise oil price forecast. In particular, the projectiondo not account for possible geopolitical events that many times in the past proved to affect theprice level.
8 All prices are in € of 1999 (equivalent to US$ of 1995).9 In 2030 this represents a doubling over the average oil price in the nineties and a level that is significantlyhigher than in EU energy outlook published by DG Energy and Transport. This is because these forecasts reflectmore optimistic views both on oil and gas endowments at world level, with resource hypotheses similar to thoseused for natural gas in the high gas resources case (§ 4.1.2.).
20

ENERGY AND TECHNOLOGY TRENDS TO 2030
Figure 2.5: Oil and gas prices
0
10
20
30
40
50
60
70
1975 1985 1995 2005 2015 2025
€99/
bl
American gas prices Asian gas pricesEuropean gas prices World oil prices
For gas, the three continental markets - America, Europe/Africa and Asia – continue to becharacterised by price levels that are structurally different. These differences reflect diverselevels of development in transport infrastructures and different conditions of supply,particularly the mix between pipeline gas and Liquefied Natural Gas (LNG). For instance, theAsian gas market is significantly dependent on LNG imports; consequently, current gas priceson this market are higher than in Europe and America. However, regional price differentialsare expected to diminish significantly over the next 30 years, reflecting more comparable gassupply mixes by 2030. This is due to increasingly interconnected gas markets, with the sameproducers exporting to different consuming regions. Some difference in price levels howeverremains � for instance between Europe and Asia � as longer distances and consequenttransport cost differentials imply slightly higher prices in the latter case (+18% in 2030).
On the European and African market, notwithstanding a period of relative stabilisation in themiddle of the current decade, the gas price is projected to increase regularly to reach 28 €/blin 2030.
On the American market, the gas price declines first significantly from the high level of 2000,down to 14 €/bl before the year 2010 and then increases again steadily, although more slowlythan on the European market, to reach 25 €/bl in 2030.
Contrary to gas prices on the American and European markets, which follow comparabletrends, the gas price on the Asian market increases constantly throughout the projection periodfrom 20 €/bl in 2001 to 33 €/bl in 2030.
According to the mechanism of oil and gas prices formation (see Box 2), the price movementsmainly depend on the variation of the Reserve on Production (R/P) ratio, which constitutes along-term indicator of the balance between demand and supply. Nevertheless, the Gulfproduction capacities are also taken into account for the projection of oil price, as well as apartial oil-indexation term for the calculation of gas prices. The latter parameter is howeverassumed to be of decreasing importance throughout the projection period.
21

WETO
Figure 2.6 shows the evolution of the R/P ratios on the different markets: the internationalmarket for oil and the three regional markets for gas.
As regards to oil, the rather stable profile of R/P in the short-run explains – together with themoderate oil demand and increasing production capacities in the Gulf – why the oil pricetrend is decreasing from 2000 to the middle of the decade. Afterwards, the smooth but steadydecline in R/P in the long run drives the oil price trend upwards.
The pattern of the oil R/P ratio (and consequently the trend in oil price) can be put in relationwith the evolution of the world oil demand: the more pronounced decrease in oil R/P ratioduring the second half of the decade corresponds to a marked increase in world oil demand,while the more moderate decrease from 2010 onwards can be related to a relative saturation ofoil demand in OECD countries and a less buoyant demand in developing countries.
The Reserve on Production ratios for gas and their evolution throughout the projection period,illustrate the peculiarities of the different markets:
- The American market is characterised by low values of the R/P ratio (about 20 yearsover the last decade) compared to those of the other markets (above 40 years). Thedecline of the R/P ratio in the long run, together with the steady increase in oil price -although to a lesser extent - explains the increasing profile of gas price from themiddle of the decade onwards.
- The Asian market has an intermediate R/P ratio. Contrary to the other two markets, itsR/P ratio decreases continuously throughout the projection period. However, thesmoother decrease at the end of the projection period explains the lower price increasecompared to the American and European markets.
- The Europe/Africa market shows the highest R/P ratios10, most particularly over the1990-2005 period, when they range from 100 to 120 years. In 2000, there was a factor2 between the R/P ratios in the European and Asian markets and a factor 6 relative tothe American market. The gap is nevertheless projected to shrink progressively overtime: in 2030, the difference between the European and Asian R/P ratio is reduced to1.5, while the difference between the European and American R/P ratio is broughtdown to a factor of 3. The sharp decrease in the R/P ratio in the Europe/Africa marketreflects relatively unbalanced long-term dynamics of supply and demand in this region.
10 This is weighted average of the R/P ratios of the key suppliers.
22
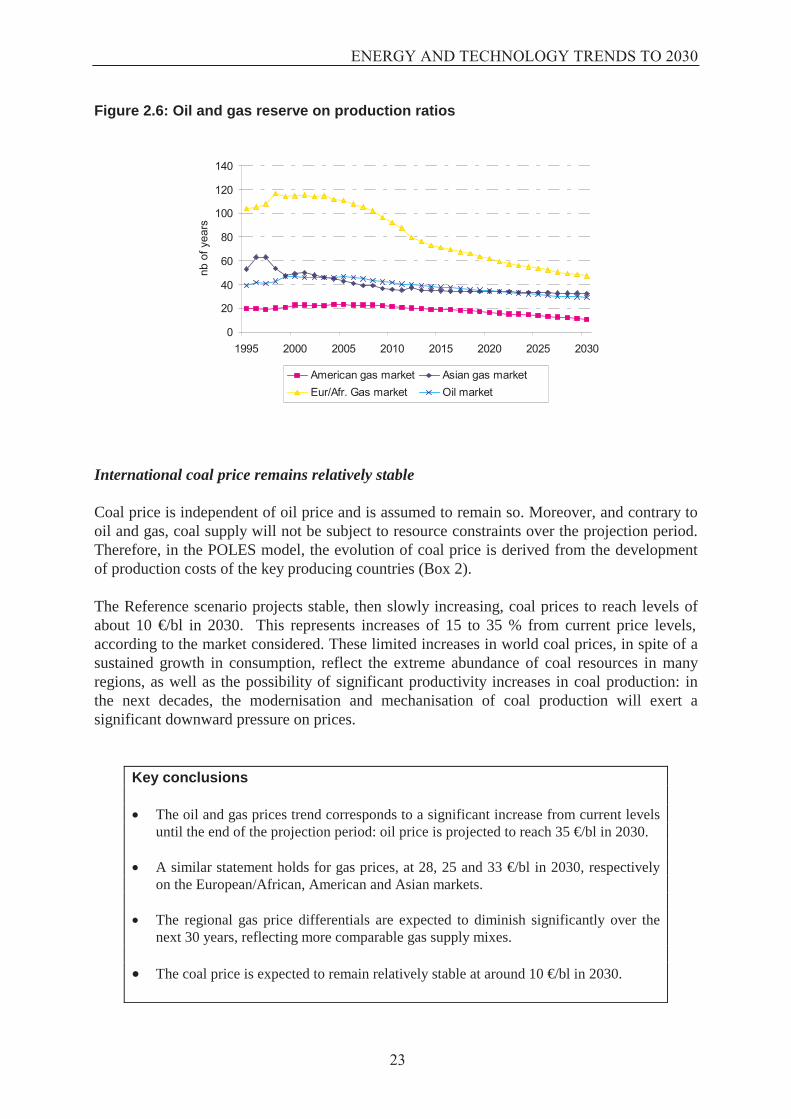
ENERGY AND TECHNOLOGY TRENDS TO 2030
Figure 2.6: Oil and gas reserve on production ratios
0
20
40
60
80
100
120
140
1995 2000 2005 2010 2015 2020 2025 2030
nb o
f yea
rs
American gas market Asian gas marketEur/Afr. Gas market Oil market
International coal price remains relatively stable
Coal price is independent of oil price and is assumed to remain so. Moreover, and contrary tooil and gas, coal supply will not be subject to resource constraints over the projection period.Therefore, in the POLES model, the evolution of coal price is derived from the developmentof production costs of the key producing countries (Box 2).
The Reference scenario projects stable, then slowly increasing, coal prices to reach levels ofabout 10 €/bl in 2030. This represents increases of 15 to 35 % from current price levels,according to the market considered. These limited increases in world coal prices, in spite of asustained growth in consumption, reflect the extreme abundance of coal resources in manyregions, as well as the possibility of significant productivity increases in coal production: inthe next decades, the modernisation and mechanisation of coal production will exert asignificant downward pressure on prices.
Key conclusions
� The oil and gas prices trend corresponds to a significant increase from current levelsuntil the end of the projection period: oil price is projected to reach 35 €/bl in 2030.
� A similar statement holds for gas prices, at 28, 25 and 33 €/bl in 2030, respectivelyon the European/African, American and Asian markets.
� The regional gas price differentials are expected to diminish significantly over thenext 30 years, reflecting more comparable gas supply mixes.
� The coal price is expected to remain relatively stable at around 10 €/bl in 2030.
23

WETO
2.3. GLOBAL OUTLOOK FOR ENERGY AND CO2 EMISSIONS
2.3.1 World energy consumption
Global trends
In the Reference, the picture of the world energy scene in 2030 mainly reflects an expandedvision of the current system. However, some significant changes occur, particularly in therelative shares of the main world regions and of the primary energy sources. These changesare associated, respectively, to different population and economic growth dynamics and tohigher energy prices and more efficient technologies. The world energy consumption isprojected to increase by some 70% over the 2000-2030 period (Figure 2.7). This translatesinto an average increase of 1.8%/year to be compared with 1.4%/year over the 1990-2000period.
Figure 2.7: World energy consumption
0
30006000
9000
1200015000
18000
1980 1990 2000 2010 2020 2030
Mto
e
Coal, lignite Oil Natural gasPrim. Electricity Wood and wastes
In 2030, fossil fuels (coal, lignite, oil and natural gas) are projected to represent 88% of worldenergy consumption. This percentage is greater than the 81% share observed in 2000. Despitea rapid growth of coal and gas utilisation, oil still represents the largest share (34%) of theworld gross inland consumption (GIC) in 2030:
- Oil demand increases at a rate similar to the one observed during the decade 1990-2000 (i.e. 1.6%/year) and demand reaches 5.9 Gtoe in 2030.
- Natural gas demand increases by 3%/year on average between 2000 and 2010 and by2.1%/year afterwards. The share of natural gas in total consumption extends to 25% in2030 from 21% in 2000.
- Coal demand is also projected to grow rapidly over the next thirty years. Between1990 and 2000 the growth of coal consumption was 0.9%/year but after 2000 it goesup to 2.1%/year until 2010 and then to 2.5%/year until 2030 as it becomes morecompetitive than other fuels.
24

ENERGY AND TECHNOLOGY TRENDS TO 2030
The change in the fossil fuel shares impacts considerably on the carbon intensity of the worldenergy system and on the associated CO2 emissions, as discussed in section 2.3.2.
Nuclear energy increases slightly in absolute terms. During the 1990-2000 decade the growthof nuclear was 2.7%/year, but this rate weakens to 0.9%/year over the projection period. In2030, nuclear represents 5% of the world GIC, compared to 7% in 2000.
The share of large hydropower and geothermal energy stabilises at 2% of world GIC. Wind,solar and small hydropower increase together by 7%/year between 2000 and 2010 and then byaround 5%/year until 2030. In spite of the marked acceleration in the diffusion process ofthese renewable sources and because of their limited initial penetration, their market sharerepresents less than 1% of world GIC in 2030. Conversely, wood and wastes consumptiondecreases steadily during the projection period, but its share in world GIC (5% in 2030, to becompared with 9% today) remains higher than the share of the new renewable sources.
Globally, energy from renewable sources is projected to cover 8% of world energyrequirements in 2030. This is less than the 13% share observed in 2000 and is essentially dueto the continuous decline of traditional biomass consumption in Asia and Africa, due toincreased urbanisation, deforestation and substitution to modern energies in rural areas.Actually, the evolution of the share of renewables in total energy consumption showscontrasted patterns across regions, while the EU with a regular increase achieves the highestprogression among industrialised regions.
The detailed results of the Reference scenario by regions are provided in Annex 2.
Key indicators of the world energy consumption
The gross inland consumption is the sum of the final energy demand and the energy demandfor electricity production and other energy transformations. The final demand is modelled atthe level of various sectors. In each sector, energy demand is driven by economic activityvariables and price changes and trends (see section 3.1). The energy demand for electricityproduction results from the simulation of power generation technologies (see section 3.2). Thedynamics of the GIC can be analysed through the evolution of three factors: population (POP),Gross Domestic Product/capita (GDP/POP) and the energy intensity (GIC/GDP). Under thisdecomposition, the Gross Inland Consumption is described as: POP x GDP/POP x GIC/GDP
In the WETO Reference, the gross consumption increases at 1.8%/year between 2000 and2030, as population grows at a rate of 1%/year and the per capita GDP at 2.1%/year, while theenergy intensity of GDP decreases by –1.2%/year. The projections show that at the world leveland in most regions, the GDP/capita mainly influence the energy consumption growth.Nevertheless, in Africa, Latin America and Asia, the demography represents an importantfactor of the energy demand growth.
Regional trends
The analysis of regional trends indicates that a major structural change will occur in theworldwide distribution of the GIC over the next decades. The most outstanding element
25

WETO
stemming from the Reference is the slowdown in the energy consumption growth in theindustrialised countries and the sustained high growth in the developing countries. Thesecombined trends lead to a new balance in the regional structure of the world GIC: the share ofdeveloping countries shifts from 40% to 55% over the projection period.
In the EU, population is expected to be stable over the projection period. Therefore, the0.4%/year increase in energy consumption is mainly due to the impact of the per capita GDPgrowth (1.9%/year) that is partially compensated by the 1.4%/year decrease in the energyintensity of GDP. The projected growth for the EU thus reveals a relative saturation ofequipment ownership (cars, refrigerators, etc.) but not a full stabilisation of the energydemand: total GIC reaches about 1.7 Gtoe in 2030, from 1.5 Gtoe in 2000.
The above analysis remains valid when the Accession countries are included. In thesecountries, the projected economic growth per capita is higher but the decrease in energyintensity is also more significant due to large efficiency gains. These indicators balance eachother and the regional trend is not significantly different from the EU picture.
Figure 2.8: EU energy consumption
0
500
1000
1500
2000
1980 1990 2000 2010 2020 2030
Mto
e
Coal, lignite Oil Natural gasPrim. Electricity Wood and wastes
In terms of fuels shares, the contribution of natural gas strongly increases from 2000 to 2030,at the expense of coal, lignite and oil. At the end of the period, natural gas represents 27% ofEU total energy consumption and becomes the second fuel used, behind oil (39%), but aheadof coal and lignite (16%)11.
11 The WETO Reference projects a fuel mix that is different from the one described in the EU energy outlookspublished by DG Energy and Transport. In particular, the share of gas is lower in WETO, while the share of coalis higher. This is explained by two key factors. First of all, the price of gas, relatively to that of coal, is higher inWETO due to expected less abundant gas resources; this translates into a better cost competitiveness of coal-based electricity generation when GHG emission constraints are ignored. Secondly, the gas consumption islimited by a slower nuclear phase-out in Germany, Belgium and Sweden, as the WETO Reference only considersthe retirement of nuclear power plants at the end of their operating lifetime.
26

ENERGY AND TECHNOLOGY TRENDS TO 2030
In North America the energy intensity of GDP decreases by 1.3%/year, a rate similar to whatis projected in the EU. As a result, the energy consumption rises by 0.7%/year on average,almost twice faster than in the EU. Coal experiences a steady growth of 1.1%/year on averageresulting in a share of coal of 28% in 2030. This evolution contrasts with the situation of theother industrialised countries where coal consumption stabilises or decreases gradually:indeed coal, because of more favourable economic conditions, continues to develop on theelectricity market.
In the CIS and CEEC region, the economic recovery drives the energy demand up. The energyintensity is projected to decrease substantially (-2.3%/year) in the 2000-2010 decade,reflecting the large potential for energy efficiency gains. The energy consumption per capitareturns to its 1990 level around 2020. Gas holds an increasing share in the total energydemand of the region, exceeding 50% in 2030, mainly at the expense of coal and oil.
In the Japan and Pacific region, the energy demand pattern is similar to the trends observed forthe other industrialised regions but the decrease in the oil market share is more rapid; oil isreplaced by natural gas and primary electricity (nuclear in Japan and renewable in Australia).
Asia experiences the most rapid energy demand increase among all regions because of a.strong economic growth (progression of 3.7%/year for the per capita GDP between 2000 and2030). The energy intensity of GDP decreases annually by 1.5% on average with the greatestgains occurring in the 2000-2010 period. Energy consumption in this region reaches exceeds 6Gtoe in 2030 with a per capita consumption significantly lower than in the EU (1.5 versus 4.6toe/year). Because of the abundant resources in the region, the share of coal remains high(42%) and does not change significantly. In contrast, the shares of oil and gas increase rapidlyto the expense of biomass that is almost phased out (6% of GIC in 2030 compared to 30% in1990).
In the Africa and Middle East region, the energy consumption per capita remains below 1 toewith very different energy profiles among countries, in particular between Africa and theMiddle East. As in the most populous countries, energy is used to meet the essential needs, theenergy intensity reduction is projected to be lower than in the other developing regions. Oilremains clearly the dominant energy source (39%). In contrast, the shares of gas and coal(mainly in the South African sub-region) increase while the consumption of biomassdecreases sharply from 25% in 2000 to 8% in 2030.
In Latin America, finally, energy demand grows by 2.4%/year on average between 2000 and2030, with the energy intensity of GDP decreasing by 0.8%/year. The significant feature is theslight decrease in the share of oil that is compensated by a strong penetration of gas, anabundant resource in the region.
27

WETO
Figure 2.9: Energy consumption in the other world regions
North America
0500
10001500200025003000
1980 1990 2000 2010 2020 2030
Mto
e
Latin America
0
500
1.000
1.500
1980 1990 2000 2010 2020 2030
Mto
e
CIS, CEEC
0
500
1000
1500
2000
1980 1990 2000 2010 2020 2030
Mto
e
Africa, Middle East
0
500
1000
1500
2000
1980 1990 2000 2010 2020 2030
Mto
e
Asia
0
2000
4000
6000
8000
1980 1990 2000 2010 2020 2030
Mto
e
Coal, lignite OilNatural gas Prim. ElectricityWood and wastes
Japan, Pacific
0
500
1000
1980 1990 2000 2010 2020 2030
Mto
e
Regional overview of energy intensity trends
Figure 2.10 illustrates the evolution of the energy intensity of GDP in the different regionsover the projection period. The energy intensity, measured as the GIC per unit of GDP, is anaggregate indicator of the link between economic growth and energy consumption. Its leveland variation are the combined results of very different factors: the stage in the economic
28

ENERGY AND TECHNOLOGY TRENDS TO 2030
development process, energy efficiency and energy price patterns, climate, geography, cultureand lifestyles.
The total energy intensity is expected to decline, at the world level, by 1.2%/year over theprojection period, which is less than the 1.6%/year decrease observed from 1990 to 2000.Substantial differences appear between regions. In all regions but Asia the intensityimprovements accelerates from past trends in the current decade. Asia continues to decreaseits energy intensity but the particularly rapid fall of 2.9%/year observed from 1990 to 2000 inthis region is somewhat reduced beyond 2010. The CIS and CEEC region reveals largepotentials for energy intensity gains with an annual decrease of 2.3%/year between 2000 and2010.
At world level, the improvements in energy intensity in relative terms are essentially driven bythe reduction of the intensity of final energy demand. This is the case in the EU, in LatinAmerica and in the Africa and Middle East region. On the contrary, in North America, in theJapan and Pacific region, in the CIS and CEEC region and in Asia, the decreases in final andtransformation sector energy intensities are comparable; to a large extent this reflectsimportant efficiency gains in the power generation sector.
Figure 2.10: Total and final energy intensity (1990, 2000, 2010, 2030)
0.000.050.100.150.200.250.300.350.400.450.50
World EuropeanUnion
NorthAmerica
LatinAmerica
Africa,MiddleEast
CIS,CEEC
Asia Japan,Pacific
koe/
€ 99
Final Transformations
Regional overview of per capita energy consumption trends
Apart from the particular case of the CIS and CEEC region during the 90’s, the per capitaenergy consumption steadily increases in all regions (Figure 2.11). Only in North America theprogression tends to slow down over the 2010-2030 period, which may reflect markedsaturation effects, but no region experiences a stabilisation of its per capita energyconsumption. Despite the strong increase in energy consumption in the developing countries,the magnitude of the gap in the per capita energy consumption between developing andindustrialised countries remains stable with a range of 1 toe/cap in the Africa and Middle Eastregion to 8.4 toe/cap in North America in 2030. Nevertheless, the ratio between the highest
29

WETO
and lowest levels of per capita energy consumption is projected to decrease to 8 in 2030 from10 in 2000.Figure 2.11: Energy consumption per capita
0.0
1.0
2.0
3.0
4.0
5.0
6.0
7.0
8.0
9.0
World EuropeanUnion
NorthAmerica
LatinAmerica
Africa,MiddleEast
CIS,CEEC
Asia Japan,Pacific
toe/
cap
1990 2000 2010 2030
Trends in energy-related services
In the analysis of long-term energy trends, it is important to identify the ultimate services thatenergy consumption provides. In this respect, the consumption is broken down into three mainservices: electricity uses, transport uses (motive power) and thermal uses.
- Electricity uses per capita
At world level, the per capita electricity demand rises at sustained rates with the per capitaGDP over the projection period: 1.2%/year between 1990 and 2000, 1.4%/year in the nextdecade and up to 2.2%/year from 2010 to 2030 (Figure 2.12). In the industrialised countries,electricity demand follows closely the economic activity as it did in the past. The EU, NorthAmerica and the Japan and Pacific region experience a relative slowdown of the progressionbetween 2000 and 2010 but the growth is faster beyond 2010 (respectively 1%/year and1.6%/year in the EU, 0.3%/year and 1%/year in North America, 1.1%/year and 1.9%/year inthe Japan and Pacific region). Electricity demand per capita grows much faster in Asia(4.2%/year on average over the projection period) and in the CIS and CEEC region(2.7%/year). Electricity demand also increases strongly in the Africa and Middle East region(2.4%/year) and in Latin America (2.6%/year) although with lower rates than in Asia.
30

ENERGY AND TECHNOLOGY TRENDS TO 2030
Figure 2.12: Electricity use and GDP per capita, 1980-2030
0
2000
4000
6000
8000
10000
12000
14000
16000
18000
0 5000 10000 15000 20000 25000 30000 35000 40000 45000 50000 € 99/cap
kWh/
cap
World European Union North America Latin AmericaAfrica, Middle East CIS, CEEC Asia Japan, Pacific
- Transport energy use per capita
The per capita transport energy use also increases steadily but the progression slows downslightly from 0.9%/year between 1990 and 2000 to 0.7%/year over the projection period(Figure 2.13). North America is the only region where a decrease is projected beyond 2000.The potential for energy efficiency gains in vehicles is large in this region while already highequipment rates reduce the diffusion of vehicles. In the EU similarly, the impact of risingincome on demand diminishes slightly in the second half of the projection. This reflects risingsaturation effects and constraints on road traffic such as congestion and limits to infrastructuredevelopment as well as long-term adjustment of the vehicle stock to increasing oil prices. Forall other regions, a relative slowdown of the increase in the indicator is projected for the 2010-2030 period relative to the 2000-2010 period but the increase in China and India isnevertheless considerable (around 3%/year).
Figure 2.13: Transport energy use and GDP per capita, 1980-2030
0.0
0.5
1.0
1.5
2.0
2.5
0 5000 10000 15000 20000 25000 30000 35000 40000 45000 50000
€ 99/cap
toe/
cap
World European Union North America Latin AmericaAfrica, Middle East CIS, CEEC Asia Japan, Pacific
31

WETO
- Thermal uses per capita
The thermal uses per capita mimics the increase in per capita GDP, reversing the decreasingtrend observed from 1980 until the late 90’s. As a result, the per capita thermal uses in 2030return to the level of 1980 (Figure 2.14).
In the EU, after a decrease until the late nineties, the per capita thermal uses increasemoderately up to 2010 and then evolves relatively independently from the per capita GDPbehaviour. The trend in the Japan and Pacific region is comparable to the trend in the EU. InNorth America instead, the decrease observed until 1995 is much larger than in the EU; it isfollowed by a stabilisation between 1995 and 2015 and then by a slight but steady decreaseuntil 2030. The CIS and CEEC region is projected to show a rapid increase in the per capitathermal uses since the year 2000 when its economy starts to recover from the years ofrestricted consumption and economic recession. In the industrialised countries, the relativestabilisation of this indicator compared to the per capita GDP reflects essentially the saturationin household heating and the transformation of these economies towards less energydemanding industrial production structures. On the contrary, the increase in Asia and LatinAmerica reflects the increase in thermal uses in response both to rising income levels and torapid growth in manufacturing output.
Figure 2.14: Thermal uses and GDP per capita, 1980-2030
0.0
0.5
1.0
1.5
2.0
2.5
3.0
3.5
4.0
0 5000 10000 15000 20000 25000 30000 35000 40000 45000 50000€ 99/cap
toe/
cap
World European Union North America Latin AmericaAfrica, Middle East CIS, CEEC Asia Japan, Pacific
2.3.2 Energy related CO2 emissions
Global CO2 emissions more than double between 1990 and 2030
This section examines the dynamics of the energy-related CO2 emissions that reflects theincrease in fossil fuel combustion underlined above. On a world scale, CO2 emissions morethan double over the 1990-2030 period, from 21 to 45 Gt of CO2. The regional shares alsochange significantly: in 1990, the emissions from the industrialised regions represented 70%
32

ENERGY AND TECHNOLOGY TRENDS TO 2030
of CO2 emissions; this share decreases to 42 % by 2030. By then China is the largest worldCO2 emitter in absolute terms but not relative to population.
Figure 2.15: Energy-related CO2 emissions
0
1000
2000
3000
4000
5000
6000
7000
8000
9000
10000
1990 2000 2010 2020 2030
Mt o
f CO
2
European Union EU & Accession CountriesUSA BrazilIndia ChinaJapan
Emissions growth in developing countries is expected to be extremely rapid, whereasdeveloped and industrialised regions undergo a more moderate growth or even a decline. Forinstance, India experiences a six-fold increase (5%/year). The emissions in the otherdeveloping regions increase in a range of 200- 350%.
CO2 emissions of the CIS and CEEC decreased spectacularly during the economic recessionof the nineties, with a drop in emissions of 41% and 22% respectively in the 1990-2000period. Only in 2030 do their CO2 emissions reach again the level of 1990. The EU, the Japanand Pacific region and North America experience a more moderate but still substantial growthof their emissions with increases of 18%, 32% and 50% respectively.
The contrasted CO2 emission trends in the different regions reflect a large number of factorsincluding economic growth, population, fuel mix as well as historical and policy relatedelements.
Three determinants of CO2 emissions dynamics
The CO2 emissions dynamics can be analysed through the decomposition into three factors:the GDP, the carbon intensity of the gross inland energy consumption and the energy intensityof GDP (CO2 emissions = CO2 emissions/GIC X GIC/GDP X GDP).
33

WETO
Usually, the GDP and the energy intensity have opposite effect on CO2 emissions but up tonow, the growth in GDP dominated resulting in increases in energy consumption andassociated emissions.
While natural gas and oil use emits approximately 30% and 25% less CO2 per unit of energythan coal, electricity produced from nuclear, hydro, solar and wind is almost CO2 emissionfree, at least at the operational stage. The energy produced by biomass combustion isconsidered as CO2 neutral, as far as a re-growth process compensates for the re-emission ofthe carbon captured during the biomass growing. In summary, decreasing the carbon intensityof energy consumption will imply increasing the share of low CO2 energy sources anddecreasing that of CO2 intensive sources.
CO2 emission increases the most in developing countries
China experiences the largest economic growth over the 40-years period and becomes themajor world emitter of CO2 in 2030. While its GDP is multiplied by ten between 1990 and2030, making of China the largest economy in the world, this remarkable economicdevelopment impacts dramatically on the energy consumption. During the same period, Chinais also projected to be the most successful region in decreasing the energy intensity of theGDP, with a reduction of 66% relative to the 1990 level (see Figure 2.16). In spite of thismajor change, energy demand still increases by nearly 250% over the period. The third factor,the carbon intensity of energy consumption, increases by 12% and leads to an additional risein China’s CO2 emissions beyond the energy demand growth. In total, CO2 emissions areprojected to increase by 290% relative to the 1990 level. In terms of energy mix, it appearsthat, though China succeeds in reducing the share of coal in its energy consumption by 3%,the carbon intensity of total consumption increases because the relative share of traditionalbiomass decreases substantially, as in every fast developing country.
Similar conclusions can be drawn for the other developing regions as all countries experiencea large growth in GDP and a decrease in the energy intensity of GDP. Yet, the latter effectdoes not compensate for the former and as a result, the total energy consumption increasesconsiderably and so do the energy-related CO2 emissions.
The carbon intensity of energy consumption increases in all developing regions, reinforcingthe trend in CO2 emission growth. In India, in South East of Asia, in Africa and Middle East,the share of traditional biomass decreases and the increment in energy demand is mostly metby fossil fuels. India sees the greatest increase in the share of coal and the most limitedincrease in the share of natural gas. This results in the sharpest projected increase in thecarbon intensity of the total consumption (+79%) of all developing regions. In spite of thesubstantial reductions in the energy intensity, India thus experiences the strongest increase inCO2 emission of all regions, namely a six-fold increase.
The growth in the carbon intensity of the energy consumption is much more moderate in LatinAmerica, where a 7% increase is projected. This change is explained by trends that aredifferent from those of the other developing regions. While the supply of CO2-free energyproduced by hydropower plants and biomass does not keep pace with energy demand, thedecline in their market share is however compensated by a relatively low carbon source,natural gas, in place of coal or oil. Even under a scenario with substantial economic growth
34

ENERGY AND TECHNOLOGY TRENDS TO 2030
and significant expansion of the energy supply, the energy demand in Latin America appearsthe least carbon intensive in 2030.
CO2 emissions increase in industrialised countries at a slow pace
Energy demand increases in the industrialised countries but not as much as in the developingcountries. The lowest growth appears in the CIS (8%) and the highest reaches 51% in theJapan and Pacific region.
All industrialised regions decrease the carbon intensity of their consumption with the onlyexception of North America. In that region, the share of oil in the energy consumptiondecreases but this reduction is almost entirely compensated by an equal increase in the shareof coal use, while the share of other primary energy sources remains stable. The overall resultin 2030 is an increase in the carbon intensity of 7%. Together with the 40% increase in theenergy demand itself, this leads to a 50% increase in CO2 emissions above the 1990 level.
In the EU, the shares of coal and oil decrease respectively by 7% and 4% and the share ofnatural gas increases by 10%, leading to a drop in carbon intensity of energy consumption of amodest 6%. However, due to the increase in energy consumption, total CO2 emissionsincrease by 18% between 1990 and 2030.
In the Japan and Pacific region, Japan decreases the carbon intensity of its energyconsumption by 12%. The share of coal in Japan decreases marginally, by less than 1% in2030. Instead the share of oil decreases substantially by 18% and the share of natural gas risesof 12%. Furthermore, the Reference projects a considerable growth in the electricityproduction by nuclear energy: 29% of the electricity produced in 2030 compared to some 19%in 1990. Nevertheless, despite the substantial decrease in carbon intensity, CO2 emissions stillincrease by 32% relative to the 1990 level as a main consequence of the increase by 51% ofthe energy demand.
Finally, in the CIS and CEEC region, the shares of coal and oil decrease and the share ofnatural gas increases more rapidly than in the EU. This shift induces a reduction of some 10%in the carbon intensity. Together with a moderate increase in GDP and a decrease in theenergy intensity of GDP, CO2 emissions reach similar levels in 2030 than in 1990.
The carbon intensity of the GDP decreases significantly in all regions but in Africa
Figure 2.16 shows the regional disparities in the carbon intensity of GDP but illustrates alsothe significant reductions projected in the Reference. At world level, the drop is about 40%between 1990 and 2030. The reductions are particularly substantial in the EU, North America,the CIS, CEEC region and in Asia. In contrast, the carbon intensity of the GDP remainsroughly constant in the Africa, Middle East region.
35
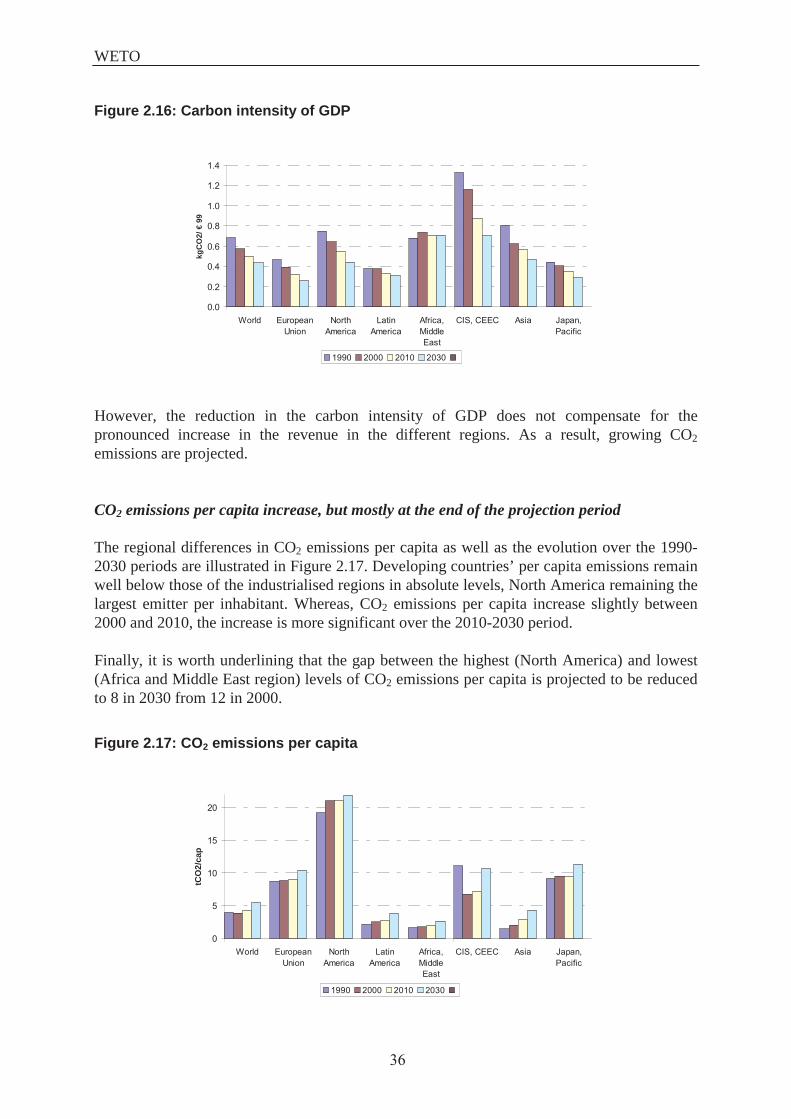
WETO
Figure 2.16: Carbon intensity of GDP
0.0
0.2
0.4
0.6
0.8
1.0
1.2
1.4
World EuropeanUnion
NorthAmerica
LatinAmerica
Africa,MiddleEast
CIS, CEEC Asia Japan,Pacific
kgC
O2/
€ 9
9
1990 2000 2010 2030
However, the reduction in the carbon intensity of GDP does not compensate for thepronounced increase in the revenue in the different regions. As a result, growing CO2emissions are projected.
CO2 emissions per capita increase, but mostly at the end of the projection period
The regional differences in CO2 emissions per capita as well as the evolution over the 1990-2030 periods are illustrated in Figure 2.17. Developing countries’ per capita emissions remainwell below those of the industrialised regions in absolute levels, North America remaining thelargest emitter per inhabitant. Whereas, CO2 emissions per capita increase slightly between2000 and 2010, the increase is more significant over the 2010-2030 period.
Finally, it is worth underlining that the gap between the highest (North America) and lowest(Africa and Middle East region) levels of CO2 emissions per capita is projected to be reducedto 8 in 2030 from 12 in 2000.
Figure 2.17: CO2 emissions per capita
0
5
10
15
20
World EuropeanUnion
NorthAmerica
LatinAmerica
Africa,MiddleEast
CIS, CEEC Asia Japan,Pacific
tCO
2/ca
p
1990 2000 2010 2030
36

ENERGY AND TECHNOLOGY TRENDS TO 2030
Key conclusions
� World energy consumption is projected to increase at about 1.8%/year between 2000and 2030. This growth is driven by economic and population growth (of respectively3.1% and 1%/year on average), whose impacts are nevertheless moderated by adecrease in energy intensity of 1.2%/year, due to the combined effects of structuralchanges in the economy, of technological progress and of energy price increases.
� Industrialised countries experience a slowdown in their energy demand growth(0.4%/year in the EU). Conversely, the energy demand of developing countries isgrowing rapidly. In 2030, some 55% of the world energy demand is expected to comefrom developing countries, compared to 40% now.
� The world energy system will continue to be dominated by fossil fuels. In 2030,fossil fuels are expected to represent almost 90% of total energy demand. Oil remainsthe main source of energy (34%) followed by coal (28%). Almost two-thirds of theincrease in coal demand between 2000 and 2030 comes from Asia. Natural gas isprojected to represent one quarter of world energy demand by 2030; powergeneration provides the bulk of the incremental gas demand.
� In the EU, natural gas is expected to be the second energy source, with a share ofaround 27% in 2030, behind oil but ahead of coal and lignite. Nuclear and renewableenergies would altogether represent slightly less than 20%.
� Given the continued dominance of fossil fuels, world CO2 emissions are expected togrow rapidly, at a rate slightly higher than energy consumption (2.1%/year onaverage). In 2030, world CO2 emissions are more than twice the level of 1990. In theEU, CO2 emissions are projected to increase by 18% in 2030 compared to the 1990level. In the USA, the increase is around 50%. While the emissions from developingcountries represented 30% of the total in 1990, these countries will emit more thanhalf the world CO2 emissions in 2030.
37

WETO
2.4 PRIMARY FUEL SUPPLY
2.4.1 Simulation of oil and gas discovery
The POLES model provides a relatively detailed simulation of the oil and gas discoveryprocess. This feature is in particular essential to the endogenous calculation of internationaloil and gas prices. In broad terms, the modelling oil and gas supply is based on the followingsequence (see Box 4):
- The Ultimate Recoverable Resources (URR) of oil and gas are simulated from a baseyear value on the basis of the impact of increasing recovery rates (price dependent);
- Discoveries increase with cumulative drilling (also dependent);- Reserves are equal to the total discoveries minus the past cumulative production;- For all regions except the Gulf, the production depends on a price dependent Reserve
on Production ratio.
2.4.2 World oil supply
Figure 2.18 describes the conventional oil development profile in the Reference. Sufficient oilreserves exist to satisfy the projected oil demand over the next three decades. The productionincreases by about 65% to reach some 120 million barrels per day in 2030. About thousandbillion barrels will be needed to satisfy the cumulative oil demand over the 2000-2030 period.
The total conventional oil reserves decline between 2000 and 2030 by some 22%. Moreprecisely, oil reserves start declining from the middle of the current decade. This decline ishowever limited by the increase in URR due to the increase in recovery rates (from 30-40% in2000 to 50-70% in 2030, depending on the region), induced partially by autonomous progressand by oil price increases: in 2030, world oil URR end up at 4500 Gbl. As the productionlevel is increasing during the projection period, the world Reserves to Production ratiodecreases from 40 years to 18 years: in the model simulation this is the key driving forceexplaining the increase in oil price from the end of the current decade onwards (see Section2.2).
38

ENERGY AND TECHNOLOGY TRENDS TO 2030
Box 4: The simulation of oil and gas reserves
The modelling of oil and gas reserves and production is carried out in three stages in thePOLES model.
First, the model simulates the level of oil and gas resources discovered each year (cumulateddiscoveries) as a function of the Ultimate Recoverable Resources and of the cumulative drillingeffort. URR are not fixed as considered usually: they are the product of the oil and gas in placefor a base year (from USGS estimates12) and of a recovery ratio that increases with the price andan autonomous technological trend. The drilling effort is also a function of the price and atrend.
Second, the reserves are equal to the difference between the cumulative discoveries and thiscumulative production for the previous period.
Finally, the model calculates the production. For oil, it results from applying a Reserve onProduction ratio in the “price-taker” regions, while the “swing-producers” balance between theoil demand and supply. For gas, it is derived from the simulated demand.
Oil in Place
Ultimate Recoverable Resources
Cum. Discoveries Reserves
Cum. Production
Cumulative drilling
12 U.S. Geological Survey World Petroleum Assessment-2000, Description and Results, USGS World EnergyAssessment Team, Denver, 2000.
39

WETO
Figure 2.18: World conventional oil resources
0
500
1000
1500
2000
2500
3000
1975 1985 1995 2005 2015 2025
Gbl
Cumulative Discov. Cumulative Prod.
Oil Reserves
URR in 2000
The development of oil supply shows different pictures for OPEC and non-OPEC countries(Figure 2.19), illustrating the different patterns of behaviour of oil producers. Countriesoutside OPEC are considered as “price-takers” and their production only depends on theirown reserves and production capabilities. In contrast, OPEC countries are modelled as“swing-producers” and their oil production is determined by the difference between total oildemand and the production of non-OPEC countries (conventional and non-conventional oil).
Gains in production are expected for both OPEC and non-OPEC producers (respectively+108% and +10% between 2000 and 2030), and one quarter of the production increase areexpected to come from non-OPEC countries. This basically reflects the resource and Reserveon Production constraints that are expected to severely limit non-OPEC production in thecoming decades. Non-OPEC production in 2030 is projected to be 3 millions barrels per dayhigher than it was in 2000, against 33 for OPEC. As a result, OPEC countries, which currentlyprovide 40% of total oil supply (of which 27% from the Middle East), will account for 60% in2030 (of which 46% from the Middle East). These developments are opposite to the onesobserved since 1975 when the production of non-OPEC countries increased the fastest(respectively 1.8%/ year on average for non OPEC and 0.2% for OPEC).
In contrast to oil production, discoveries progress more in non-OPEC countries, at least duringthe last 20 to 25 years of the projection period when oil price begins to increase.
These contrasted developments of oil production and discoveries in these two areas have adirect influence on oil reserves: the latter decline more significantly in non-OPEC than inOPEC countries (respectively -84% and –19% between 2000 and 2030) despite similarrecovery rates. Thus, although more than 80% of world’s oil reserves were alreadyconcentrated in the OPEC countries, this percentage will reach 95% at the end of theprojection period. This increasing dependence on OPEC resources raises questions in terms ofprobability of occurrence and geopolitical feasibility that are out of the scope of the WETOstudy.
40

ENERGY AND TECHNOLOGY TRENDS TO 2030
Figure 2.19: OPEC and non-OPEC conventional oil resources
Non-OPEC
0
500
1000
1500
2000
1975 1985 1995 2005 2015 2025
Gbl
Cumulative Discov. Cumulative Prod.
URR in 2000
OPEC
0
500
1000
1500
2000
1975 1985 1995 2005 2015 2025
Gbl
Cumulative Discov. Cumulative Prod.
Oil Reserves
URR in 2000
The production of non-conventional oil, which is currently negligible (1% of total oilproduction worldwide), is projected to represent about 10 million barrels per day in 2030.Furthermore, the reserves of non-conventional oil increase steadily (contrary to the reserves ofconventional oil which decline) to cover one third of total oil reserves in 2030.
The evolution of oil production by main region illustrates the increasing share of OPECcountries in world oil supply (Figure 2.20). Oil production shows the highest increase in theGulf countries (+160% over the projection period) where there are plenty of low-costresources. It is projected to more than double in all OPEC countries but Venezuela where theincrease is limited to 50% over the 2000-2030 period. On the contrary, it rises moderately inthe CIS (+5%) and even declines in OECD countries (-15%) and notably in the USA (-5%).
Ten countries cover three third of total oil demand in 2030 (Saudi Arabia, Iraq, Iran, CIS,USA, UAE, Kuwait, Venezuela, Canada and Brazil. In North America, the US productiondecline is more than offset by production increases in Canada. Brazil’s production is projectedto rise the most: its share in total oil production increases to 5% in 2030 from 1% in 2000.
41

WETO
Figure 2.20: World oil production
0
1000
2000
3000
4000
5000
6000
1975 1985 1995 2005 2015 2025
Mto
e
GULF Other OPEC CIS OECD Other
2.4.3 World gas supply
The outlook for gas supply is different from oil in several respects. First, gas reserves areexpected to increase over the projection period (+9%) while oil reserves decline. Second, thereserves are more widely distributed among regions for gas than for oil. However, as for oil,more than half of gas reserves are located in few countries, namely the CIS and the Gulfregion. Third, the recovery rate for gas is and will continue to be higher than for oil: itincreases over the projection period from 80% in 2000 to around 94% in 2030.
The rapid growth in natural gas reserves observed in the past is projected to continue for thecurrent decade, followed by a moderate but steady decrease (Figure 2.21). Progress in drillingactivity contribute to increase gas discoveries by around 1.4%/year over the period. Some 100Tm3 of additional production will be required to meet the cumulative demand from 2000 to2030. This is equivalent to about two third of the proven gas reserves at the end of 2000.
Figure 2.21: World gas resources
0
100
200
300
400
1985 1990 1995 2000 2005 2010 2015 2020 2025 2030
Tm3
Cumulative Discov. Cumulative Prod.
Gas reserves
URR in 2000
42

ENERGY AND TECHNOLOGY TRENDS TO 2030
About 68% of existing gas reserves are located in the CIS and in the Gulf region. Moreover,gas reserves are expected to grow in both areas over the projection period (+14%) so that theirshare in world reserves will reach 72% in 2030 (Figure 2.22). Total gas discoveries areprojected to reach similar levels at the end of the projection periods; on the contrary,cumulative production in the Gulf region will be less than half the CIS level in 2030,reflecting disparities in supply costs to final markets. The CIS is projected to cover about onethird of the cumulative gas demand over the 2000-2030 period, compared to slightly morethan 10% for the Gulf region. Similarly to oil, this result raises questions in terms ofprobability of occurrence and geopolitical feasibility that are out of the scope of the WETOstudy.
Figure 2.22: Gas resources in the CIS and the Gulf
CIS
0
50
100
150
1985 1995 2005 2015 2025
Tm3
Cumulative Discov. Cumulative Prod.
Gas reserves
URR in 2000
Gulf
0
50
100
150
1985 1995 2005 2015 2025
Tm3
Cumulative Prod. Cumulative Discov.
Gas reserves
URR in 2000
Figure 2.23 shows the development of gas production by main region. It illustrates not onlythe remarkable increase in gas production but also the important changes in the regionalallocation of total gas supply over time.
It is worth pointing out the moderate increase in production taking place in the OECD region(+3% between 2000 and 2030) as compared to the significant increases in the other regions,and more particularly in the Middle East (+470%). Although the OECD region accounted foraround 15% of the world’s total gas reserves at the end of 2000, it accounted for more than40% of the world’s total production, followed by the CIS with 28%. In 2030, the picture looksquite different: about one third of the gas production will come from the CIS and theremaining production is projected to be almost equally allocated among the OECD, theMiddle East, and the other gas producers in Latin America and Asia. Furthermore, the tenlargest gas producers in 2030 will ensure more than 80% of the world’s total production. Butcontrary to oil, the ten largest gas producers in 2030 remain more evenly distributed amongthe different world regions, although the CIS represents more than 40% of their totalproduction.
43

WETO
Figure 2.23: World gas production
0
1000
2000
3000
4000
5000
1975 1985 1995 2005 2015 2025
Mto
e
Middle East CIS OECD Other
2.4.4 World coal supply
The distribution of coal reserves is more evenly distributed than for oil and gas. Significantreserves exist in North America, in Asia, in Africa and in the Pacific region. Important coalreserves also exist in Russia but coal production and transport costs are there considerablyhigher than in the other regions, resulting in relatively low production levels compared to theother regions with abundant coal reserves.
In the present outlook, coal supply is not subject to resources constraints and the production isessentially demand driven and follows the primary demand for coal. Coal production isexpected to grow by 2.3%/year on average over the projection period, mostly in Africa andAsia (respectively 4.5% and 3%/year). In contrast, production will continue to decline in theEU (-0.8%/year). In 2030, more than half the world’s coal production will originate fromAsia, and most particularly from China (35%), while the USA will remain the secondproducer with a share of about 20% (Figure 2.24).
Figure 2.24: World coal production
0
1000
2000
3000
4000
5000
World WesternEurope
CIS,CEEC
NorthAmerica
Japan,Pacific
Africa,MiddleEast
LatinAmer
Asia
Mto
e
2000 2030
44

ENERGY AND TECHNOLOGY TRENDS TO 2030
Key conclusions
� Sufficient oil, gas and coal reserves exist worldwide to satisfy the projected demandduring the next three decades. The decline of conventional oil reserves iscompensated by an increase in the reserves of non-conventional oil. The reserves ofnatural gas are abundant and expected to increase by around 10%. Coal reserves areenormous and do not constitute a constraint to coal demand at the horizon of 2030.
� World oil production is projected to increase by about 65% to reach some 120million bl/day in 2030: three quarters of the production increase will come fromOPEC countries, where the largest part of oil reserves is concentrated. As a result,OPEC would account for 60% of total oil supply in 2030 (compared to 40% in 2000).
� World gas production is projected to double between 2000 and 2030. However,regional disparities in gas reserves and production costs are expected to modify theregional gas supply pattern in 2030: about one third of the total gas production willoriginate from the CIS while the remaining production is projected to be almostequally allocated among OECD countries, the Middle East, and the other gasproducers in Latin America and Asia.
� World coal production is also expected to double between 2000 and 2030, the growthtaking place mostly in Africa and in Asia. This latter region is projected to covermore than half the total coal production in 2030.
45


CHAPTER 3
SECTORAL OUTLOOK
3.1 ENERGY DEMAND
3.1.1 Global trends
World final energy consumption is projected to grow by 1.8 %/year on average over theprojection period (Figure 3.1); however, the growth declines from 2 %/year during the firstdecade to 1.5 %/year over the last two decades. This progression is similar in the three finaldemand sectors between 2000 and 2030 but the pace of increase varies significantly betweenthe different sectors. Energy demand from industry increases the most over the 2000-2010period with 2.4 %/year on average and then slows down to reach 1.2 %/year over the last tenyears of the projection period. Energy demand for transport increases more regularly by 1.7%/year up to 2010 and by 1.5 %/year beyond. The household, service and agriculture sectorexperiences a steady increase of its energy demand with an average increase of 1.9 %/year.
Figure 3.1: World final energy consumption
0
3000
6000
9000
12000
1990 2000 2010 2020 2030
Mto
e
Industry Transport Household, service, agriculture
There are few changes in the fuel shares over the next thirty years. The only notable changesare the increase in the share of electricity from 15 % in 2000 to 22 % in 2030 and the decreasein the share of renewables from 13 % to 6 % due to the significant shift from traditionalbiomass to fossil fuels and the penetration of electricity in developing countries.
47

WETO
3.1.2 Regional trends
The evolution of final energy demand shows contrasted patterns from one region to the otherin relation to their level of industrial development. In the EU, the final energy demand isprojected to increase by 0.5 %/year (i.e. less than one third the growth in world final demand)whereas, at the opposite side of the range, final demand in Asia increases by 3 %/year over theprojection period (see Figures 3.2 and 3.3). Among industrialised regions, the EU is projectedto have the lowest increase, with a more rapid progression for the household, service andagriculture sector (0.7 %/year) than in transport (0.4 %/year) and industry (0.3 %/year).
The household, services and agriculture sector is the principal contributor to the projectedgrowth of final energy demand in the industrialised countries, whereas all final demandsectors contribute almost equally to the demand growth in developing countries. Theworldwide fastest growing segment of final demand is transport in Asia with an averageincrease of 3.9 %/year over the projection period.
Changes in fuel mix vary according to the region but oil remains the dominant fuel in mostregions with stable shares ranging from 40 to 50 %. Oil is principally used for transport inindustrialised countries, which is a major difference with developing countries where oil isalso largely consumed in industry. The share of solid fuels in final energy demand decreasessignificantly in all regions but in Asia, where it remains constant, and in Africa, where itincreases slightly. The share of electricity increases in all regions either at the expense offossil fuels in industrialised countries or at the expense of traditional biomass in mostdeveloping countries. Electricity experiences the fastest growth, among energy forms andworld regions, in Asia with 5.1 %/year on average. In the Africa and Middle East region andin Latin America, the electricity demand increases also significantly, above the world average.
Figure 3.2: EU final energy consumption
0
500
1000
1500
1990 2000 2010 2020 2030
Mto
e
Industry Transport Household, service, agriculture
48

SECTORAL OUTLOOK
Figure 3.3: Final energy consumption in the other world regions
In the POLES model, the total final energy demand is allocated into four main sectors:industry, transport, households and services including agriculture. Industry is broken downinto 4 branches (steel, chemicals, non metallic minerals and others). Transport considers 6modes (passenger/road, road/goods, rail/passenger, rail/goods, air and others). In industry,households and services, the model separates thermal uses from captive uses of electricity.The demand is basically modelled in each sub-sector through econometric relations,integrating short term and long-term price effects as well as technological trends (see Box 5).
49

WETO
Box 5: Modelling of final energy demand
Final energy demand is represented in the model as follows. Two standard equations areused to calculate on the one hand the total energy demand for each sector and on theother hand the demand for each individual fuel in the sector. The variation of the finalenergy consumption is a function of:- an income or activity variable with an income elasticity.- a short-term price response to the variation in the average price of the sector over thetwo previous years with a short-term price elasticity. This short-term effect mainlyreflects behavioural changes.- a long-term price effect which is supposed to be investment-driven and thereforeincludes an asymmetry factor and a distributed lag corresponding to the duration of theprice effect, with a long-term elasticity.- an autonomous technological trend.
3.1.3 Industry
At world level, the energy intensity of industry (Figure 3.4) decreases by 1.2 %/year onaverage over the projection period. This means that the energy productivity of industry isprogressing by 1.2 %/ year: more value added can be produced with less and less energy .Thegreatest improvements in the energy productivity are expected in Asia (1.5 %/year) and in theCIS and CEEC region (1.4 %/year). North America and the Japan and Pacific region areprojected to have progression of around 1 %/year The EU, with an annual average reductionof 0.9 %, has the slowest energy intensity decrease among industrialised regions. However, inabsolute terms, the EU has low levels of energy intensity compared to most world regions: inthe nineties, together with the Japan and Pacific region, it experienced the lowest level ofenergy intensity. Beyond 2010, it will only be overtaken by Asia where energy intensity isprojected to decrease significantly in industry. Despite a continuous and significant decline,the energy intensity of the CIS and CEEC’s industry is projected to remain the highest in theworld. Finally, since the energy intensity is projected to decrease the least in Latin America,industry in this region becomes more energy intensive in 2030 than in most other regions.
50

SECTORAL OUTLOOK
Figure 3.4: Energy intensity of the industry sector
0.00
0.05
0.10
0.15
0.20
0.25
0.30
0.35
0.40
1990 1995 2000 2005 2010 2015 2020 2025 2030
koe/
€ 99
World European Union North America Latin AmericaAfrica, Middle East CIS, CEEC Asia Japan, Pacific
The industrial sector is very diverse from the point of view of energy use. The POLES modelaccounts for a breakdown of the sector into four main industrial activities: iron and steel,chemical, non-metallic and other industries. Fuel substitution is modelled according to thestructure of the different industrial sub-sectors.
Remarkable improvements in the energy efficiency of steel production are expected in moststeel producing countries or regions. Nevertheless, significant differences remain amongcountries as to the level of energy use per unit of steel produced in 2030. The most efficientsteel industry is and remains located in the EU despite relatively low energy efficiencyimprovements over the projection period. In the USA, no significant declining trend isexpected and this country remains at the second place after the EU in terms of energyefficiency. Brazil experiences some energy efficiency gains after 2015 but its steel industryremains the most energy intensive: it consumes twice as much the amount of energy requiredto produce one ton of steel in the EU in 2030. India and China continue their rapid decliningtrend and reach intermediate levels of energy efficiency in 2030. The iron and steel industry inJapan is characterised by some losses in energy efficiency up to the middle of the projectionperiod, mainly due a reduction of steel production below the optimal level of steel plants’capacity.
Steady decreases in the energy intensity of both chemical and non-metallic industries areexpected in all regions. Moreover, the decreases are such that the regional differences inenergy intensity are reduced in 2030 compared to 2000.
3.1.4 Transport sector
The slower increase in the overall energy use in transport, compared to past trends, resultsfrom a combination of competing factors. On the one hand, the Reference projects for allregions a growing number of cars per inhabitant. Between 2000 and 2030, the growth reaches1.3 %/year on average at world level with extreme figures ranging from 6 %/year in Asia and
51

WETO
0.3 %/year in the EU and North America where car ownership saturates around one car perdriving license (Figure 3.5). Over the projection period, the ratio between the number of carsper inhabitant in developed and developing regions is projected to decrease from 22 to 10.
Figure 3.5: Number of cars per 1000 inhabitants
0
100
200
300
400
500
600
1980 1990 2000 2010 2020 2030
World European Union North America Latin AmericaAfrica, Middle East CIS, CEEC Asia Japan, Pacific
The number of kilometres travelled per car slightly decreases in most regions. This trend is tobe associated more to the expansion of the car stock and to shifts in transport modes in favourof aviation or rail, rather than to a reduction in the demand for transport. This is particularlytrue in North America and Europe, where the average distance per car is already close tosaturation levels (because of constraints in time-budgets), and where substitutions to fastmodes (air, fast trains) are already taking place on long distances.
On the other hand, significant improvements of the specific consumption of cars tend todecrease the energy demand. Over the projection period, the average consumption of cardecreases by 9 % in the EU even though the negotiated agreements13 with the automobileindustry is not taken explicitly into account in the Reference. In the USA, the specificconsumption decreases by 18 % over the same period but remains higher than in the EU. Suchtechnical evolutions have been observed in these regions for the past twenty years, but theirimpact on the fuel demand has been partly offset by a regular increase in the average size ofvehicles (at least since 1986, when the oil price dropped). In the Reference, the increasingtensions on the price of oil on the international market curve down the size effect.
Overall considered, the increase in energy demand for transport results principally from thegrowing number and size of vehicles that is only partially compensated by gains in thespecific consumption of cars.
3.1.5 Household sector
The thermal energy use per household is expected to decrease in the industrialized countrieswith important improvements in energy efficiency. In the developing countries, at theexception of China that follows the trends of industrialized nations, the thermal energy use
13 Negotiated agreements concluded with the European (1999/125/EC), the Japanese (2000/304/EC) and theKorean car manufacturers (2000/303/EC).
52

SECTORAL OUTLOOK
slightly increases, as the efficiency gains are not fully compensated by the steady increase ofpopulation and the development of the household sector. In the EU and Japan, non-electricenergy use in households is no longer linked with the growth in income level over theprojection period.
The increasing use of electrical appliances and lighting in all regions is expected tosignificantly soar the energy use. The energy use per household increases significantly in thedeveloping countries but in absolute terms, the quantity of energy required grows the most inthe industrialised countries.
In terms of the total energy use per dwelling, the consumption remains roughly constant in theEU and Japan whereas it slightly drops in the other world regions as greater efficiency gainsoccur.
3.1.6 Services and agriculture
The service and agriculture sector exhibits impressive energy demand growth rates in allworld regions. In industrialised countries, this sector develops steadily and a continuousaverage reduction of around 1 %/year in energy intensity of services is expected for thermaluses. In Brazil and India, remarkable reductions in energy intensity of respectively 2.4 and 4.2%/year are projected and these figures contrast with the increase of 0.4 %/year in China,where space heating needs are developing.
On the contrary, the energy intensity of services for captive uses grows in all regions andcountries. The fastest increases are expected in India (3.3 %/year) and China (2.7 %/year)while lower increases are projected in the EU (0.9 %/year) and in the USA (0.5 %/year). Theevolution of energy demand in the services and agriculture indicates that the gains in energyefficiency projected for thermal uses are more than counterbalanced by the increase in thedemand for captive uses consuming principally electricity.
Key conclusions
� The world final energy demand is expected to grow at a similar pace as the grossinland consumption (1.8 %/year). Moreover, at world level, all final sectors areexpected to experience similar energy demand growth. As a result, the share of thesectors in final demand remain roughly constant at around 35 % for industry, 25 %for transport and 40 % for the residential and tertiary sectors.
� The sectoral energy demand shows different patterns according to the regions: indeveloped countries, energy demand in the services sector is the fastest growingsegment of final demand; in developing countries, all sectors experience sustaineddemand growth above 2 to 3 %/year.
� There are some changes in the fuel mix over the next 30 years. The most notablechanges are the remarkable increase in the share of electricity in all world regions,the continuous decline of coal in developed countries and the steady decrease in theuse of biomass in developing countries. However, electricity accounts for less than aquarter of final energy demand in 2030, with oil remaining the dominant fuel with apractically constant share ranging from 40 to 50 % according to the region.
53

WETO
3.2 POWER GENERATION AND RENEWABLE TECHNOLOGIES
3.2.1 Global trends
In the Reference, the world electricity demand and production rise steadily at an average rateof 3 %/year over the projection period, to a level 2.3 times higher in 2030 than in 2000. Thelevel of detail in the POLES model allows the detailed analysis of the evolution of the powergeneration technology mix.
The modeling of power generation capacity planning and power plant management in thePOLES model is described in Box 6.
Figure 3.6: World power generation
05000
10000150002000025000300003500040000
1990 2000 2010 2020 2030
TWh
Adv. coal Conv. coal Oil Gas Nuclear Large hydro Renew able
More than half the total electricity production in 2030 will be provided by technologies thatemerged in the nineties and afterwards like gas combined cycle turbines, advanced coaltechnologies and renewables. These two fossil fuel-based technologies are expected to largelyreplace conventional thermal power plants by the end of the projection period. The share ofconventional coal in power generation is expected to decrease from 36 % in 2000 to 12 % in2030 while the share of gas increases from 16 % to 25 % and advanced coal takes a share of33 % in 2030.
In spite of a continuous expansion, the development of nuclear power does not keep pace withtotal electricity production: nuclear world market share comes down to 10 % of totalelectricity production in 2030, from 18 % in 2000. The same applies, although to a lesserextent, to large hydropower, whose market share decreases from 19 % to 13 %. On thecontrary, the share of other renewable technologies is expected to increase from 2 % to 4 %despite the rapid increase in solar and wind power of about 11 %/year at world level.
The general trend in the EU is similar to the evolution at world level (Figure 3.7). However,the penetration of advanced coal is more limited - 19 % of total electricity production in 2030
54

SECTORAL OUTLOOK
- while renewable technologies are projected to represent 8 % in 203014. It is worth underlyinghere that the Reference does not include any specific policy measures in favour of renewablesand that the penetration of these technologies is based solely on their potential, cost andperformance. Similarly, recent decisions at national level on a progressive phasing out ofnuclear production are not accounted for in the Reference; nevertheless, the share of nuclearpower is projected to decrease from 35 % in 2000 to 25 % in 2030.
Figure 3.7: EU power generation
0500
1000150020002500300035004000
1990 2000 2010 2020 2030
TWh
Adv. coal Conv. coal Oil Gas Nuclear Large hydro Renewable
Box 6: Modeling of power generation
The expected capacities for the different plant categories are simulated by taking intoaccount the future electricity demand and the relative costs of the different categories ofpower plants. These total costs per kWh (fixed and variable costs) are calculated for sixreference load factors (from 730 to 8760 hours), while taking into account investmentand fuel costs. The total electricity demand and load curve, anticipated to a t+10 yearshorizon, are also simulated by the model, as an extrapolation of current demand and loadcurves.
Primary electricity sources, such as hydro and nuclear electricity, are supposed to beused in priority for producing the base-load part of the demand curve. All other types ofpower generation plant are considered as competing (in t+10) for the fulfillment of theremaining part of the base-load and of the expected load curve. On the basis of total costcomparisons a “screening curve”-like process makes it possible to derive the desiredcapacities for each type of plant in the future.
Once the planning of new capacities is simulated, the model deals with power plantmanagement and electricity production for the “actual” simulated demand at time t. Atype of “order of merit” process is used, ensuring that, once the capacities are installed,then the management of the power plant types will supply sufficient electricity for theload curve, while using in priority the plants with the lowest variable cost (and not totalcosts).
14 In particular, the Reference does not fully account for respect of the European Directive of 2001 fixing anindicative target of 22 % of electricity produced from renewable energy sources in 2010.
55

WETO
The evolution of the power generation mix shows contrasted regional patterns mainlyinfluenced by the endowment in coal and gas resources (Figure 3.8): the share of coaldecreases in all regions except in regions with abundant coal in North America, where itstabilises, and in Asia, where it increases significantly; the share of gas increases steadily inthe three major gas producing regions (CIS, Middle East and Latin America); the share of oilremains small and even tends to zero in North America and in the Japan and Pacific region.
More specifically, advanced coal power production increases very rapidly in North Americaand reaches 37 % of total electricity production in 2030. Globally, the share of coal remainsstable at more than 50 % of total electricity production, advanced coal mainly substitutingconventional coal.
Asia will continue to rely heavily on coal for power generation (more than 60 % of totalelectricity production) and advanced coal power plants are expected to represent no less thanthree quarter of total coal-based electricity production.
In the CIS and CEEC, with the availability of abundant gas resources, the share of gasincreases significantly and this fuel is expected to represent the largest share (47 %) in 2030.On the contrary, nuclear power is expected to decrease from 21 % in 2000 to 10 % in 2030 asthe existing plants will be progressively replaced by gas power plants.
In the Japan and Pacific Region, the shares of gas and nuclear increase, principally at theexpense of oil.
In the Africa and Middle East region, the most significant development is the increase in thegas share from 33 % in 2000 to 48 % in 2030; on the other hand, advanced coal is expected torepresent 19 % of total electricity production in 2030.
Contrary to what happens in most world regions, coal-based electricity production is marginalin Latin America where power generation is expected to rely almost equally on gas and largehydro power plants.
56

SECTORAL OUTLOOK
Figure 3.8: Power generation in the other world regions
3.2.2 Renewables
The diffusion of renewables in the POLES model depends on their performance, costs andpotential (See Box 7).
At world level, the growth of electricity production from biomass, solar, wind and small hydrois remarkable (more than 4 %/year on average) although no policy targets for renewables (asfor instance the EU Directive of 2001) have been taken into account in the Reference. Thegrowth is the most pronounced for solar and wind, whose production is expected to increase atan average rate of about 11 %/year over the 2000-2030 period (Figure 3.9). In spite of thisquick development and because of very low initial levels, electricity from renewable sourcesis not expected to exceed 3 % of world total electricity production in 2030 (16 % when largehydro and geothermal are included).
57
Adv. coal Conv. coal Oil Gas Nuclear Large hydro Renewable

WETO
Figure 3.9: World electricity production from renewables
0
500
1000
1500
1990 2000 2010 2020 2030
TWh
Biomass Solar Small hydro Wind
Figure 3.10 displays the outlook for electricity production from renewables (excluding largehydro and geothermal) in the EU. The development of wind is the most significant featuretogether with a low contribution of solar photovoltaic. However, this expansion steadilyremains below the world growth rate with an increase of about 7%/year. Power generationfrom small hydro and biomass increases steadily covering together half the electricityproduced from renewables in 2030, the other half being fulfilled by wind power production.
Figure 3.10: EU electricity production from renewables
0
100
200
300
400
1990 2000 2010 2020 2030
TWh
Biomass Solar Small hydro Wind
The prospects for the other world regions are illustrated in Figure 3.11.
In North America, wind is expected to grow rapidly over the projection period and to cover 55% of the electricity produced from renewables in 2030; instead, electricity from biomass willdrop to 30 % in 2030 from slightly less than 70 % in 2000.
In the CIS and CEEC region, biomass continues to be the dominant renewable energy sourcefor electricity production with more than 50 % ahead of wind and small hydro.
58

SECTORAL OUTLOOK
In the Japan and Pacific region, the most significant evolution is the expected development ofsolar photovoltaic. On the contrary, wind power production is modest compared to the outlookfor wind in the rest of the world; in 2030, power generation from renewables is distributedalmost evenly between biomass, small hydro and solar.
In Asia, wind and biomass power production grows significantly at respectively 14 % and 8%/year over the projection period, whereas electricity production from small hydro remainsstable; in 2030, each of the above renewable energy source represents one third of totalelectricity generated from renewables.
Power generation from wind also increases rapidly in the African and Middle East region andreaches more than 50 % of electricity produced from renewables in 2030. The growth of solarphotovoltaic is also notable but less significant than for wind.
In Latin America, wind power generation is developing steadily beyond 2010. In 2030,electricity produced from renewables is almost evenly allocated between biomass, small hydroand wind.
Figure 3.11: Electricity production from renewables in other world regions
0
100
200
300
400
1990 2000 2010 2020 2030
TWh
North America
0
20
40
60
80
1990 2000 2010 2020 2030
TWh
Latin America
0
100
200
300
1990 2000 2010 2020 2030
TWh
CIS, CEEC
0
30
60
90
1990 2000 2010 2020 2030
TWh
Africa & Middle Eas t
0
100
200
300
400
500
1990 2000 2010 2020 2030
TWh
Asia
0
50
100
150
1990 2000 2010 2020 2030
TWh
Japan, Pacific
Biomass Solar Small hydro Wind
59

WETO
Box 7: Modelling the diffusion of new and renewable energy technologies
The diffusion of new and renewable technologies is determined by a logistic curvefunction of two key factors: the size of the economic potential and the length of thediffusion process, which are different according to the technology.
The size of the economic potential is determined by the share of the technical potentialthat turns out to be economically competitive under the conditions simulated by themodel (investment cost of the technology considered, cost of the alternative conventionalsolutions). This share is a function of the average payback period for the consideredinvestment: the lower is the payback period (i.e. the more cost-effective the technology)and the larger the share of the technical potential that is considered as an economicpotential.
The speed of the diffusion process is defined through the “take-over time”, i.e. the timethat is necessary to go from a 10% to a 90% market penetration, and is a function of amaximum take-over time and of the actual payback period. As a consequence, the shorterthe payback period, the quicker is the diffusion process.
Technical/Resource potential
Economic potential TaDiffusion Ta
Economic potential Tb
Diffusion Tb
TimeTa = technology with high RoITb = Technology with medium RoI
60

SECTORAL OUTLOOK
Key conclusions
� World electricity production rises steadily at an average rate of 3 %/year. More thanhalf the total electricity production in 2030 will be provided by technologies thatemerged in the nineties and afterwards like gas combined cycle turbines, advancedcoal technologies and renewables.
� The share of gas increases steadily in the three major gas-producing regions (CIS,Middle East and Latin America) and the share of coal decreases in all regions exceptin North America where it stabilises and in Asia where it increases significantly. Thedevelopment of nuclear power does not keep pace with total electricity production:nuclear world market share comes down to 10 % of total electricity production in2030.
� World electricity production from renewables is expected to rise from 2 % in 2000 to4 % in 2030, mainly because of a rapid increase in the electricity production fromwind.
61


CHAPTER 4
ASSESSMENT OF UNCERTAINTIES
The Reference scenario provides a picture of the future world energy system under a set ofbroadly accepted assumptions as to, among others, the general macro-economic background,future energy and environmental policies, energy prices and resources, and the technico-economic development of energy technologies. Considerable uncertainty remains however onthese hypotheses and may change the course of world energy development in the next threedecades. Two important uncertainties are examined in detail in this chapter and assessedagainst the Reference: the resource estimates for conventional oil and gas (section 4.1) and thepace of development of some key energy technologies (section 4.2). The goal of this analysisis to evaluate the sensitivity of the reference energy projection according to theseuncertainties.
4.1. OIL AND GAS RESOURCES
As to the hydrocarbon resources, the Reference assumes current conventional wisdom on oiland gas availability. However, to assess the sensitivity of the Reference scenario to otherhypotheses on hydrocarbon resources and examine their impacts on international oil andregional gas prices and consequently on the world energy system, two alternative cases havebeen designed: a low oil and gas resources case (Low case) and a high gas resource case (Highcase).
The principal source of information for the design of these two cases is the USGS 2000 study.Indeed, besides the median estimate for oil and gas endowments (in terms of UltimateRecoverable Resources), used in the Reference, this study also provides alternative resourcesestimates. On the one hand, low estimates attaching a 95% probability to a “pessimistic” viewconcerning the oil and gas recoverable resources. On the other hand, it describes a state of theworld in which the resource constraint is supposed to be considerably alleviated (Figure 4.1).This is supposed to happen with a 5% probability15.
These alternative hypotheses on oil and gas Ultimate Recoverable Resources have an impacton the projected oil and gas reserves and production levels, and consequently on oil and gasprices and demand.
15 The interpretation of the above probabilities is as follows: there is a 95% probability that actual resources arehigher than the low estimates, there is a 50% probability that actual resources are higher than the medianestimates, and there is a 5% probability that actual resources are higher than the high estimates.
63

WETO
Figure 4.1: Ultimate Recoverable Resources in the Reference and Resource cases16
(Gbl) OIL GAS
Low 2127 1597
Median 2708 2157
High 3651 3116
Low case
Reference
High case
4.1.1 Low oil and gas resources
The Low case allows testing the sensitivity of the Reference scenario to low hydrocarbonrecoverable resources at world level and assessing the impact of higher oil and gas prices onthe world energy system to 2030.
The impact on oil and gas ultimate recoverable resources, reserves, production and prices
Changes in the key variables describing oil and gas development in the Low case compared tothe Reference are described in Tables 4.1 and 4.2.
The impact of lower estimates for the Ultimate Recoverable Resources of conventional oil isparticularly strong for countries outside the Gulf and OECD. As far as gas is concerned, themost significant impact is for countries outside the CIS and OECD regions. However, thedifference in oil and gas URR is decreasing over time: as oil and gas prices are higher than inthe Reference, progress in recovery rates is also higher. Also, reserves and production of non-conventional oil are significantly higher than in the Reference.
In the Low case, the structure of world oil production is considerably modified with theexception of the Gulf whose production represents constantly 40% of world production in2030. On the contrary, the OECD share is 6% in the Low case instead of 12% in theReference, and the other oil producers 18% instead of 34%. Finally, the share of non-conventional oil grows to 18% from 8% in the Reference.
16 The URR estimates are based on the technology of 2000. Along the simulation path of the model, recoverytechnologies are supposed to improve, thus increasing the quantity of oil and gas that can be recovered.
64

ASSESSMENT OF UNCERTAINTIES
Table 4.1: Oil supply: Low case versus Reference
OIL 2010 2020 2030
URRGulf -13% -11% -10%OECD -21% -19% -18%Other -26% -24% -22%World -20% -18% -16%
OiI reservesGulf -20% -34% -52%OECD -43% -51% -47%Other -28% -41% -50%Non conventional 20% 34% 16%World -18% -23% -31%
Oil productionGulf 40% 36% 9%OECD -37% -51% -47%Other -22% -35% -46%Non conventional 27% 67% 153%World -2% -2% 6%
R/P ratio -15% -20% -28%
Oil price 9% 16% 22%
URR: Ultimate Recoverable Resources
Lower gas availability also results in a different structure of world gas production but themodifications are less pronounced than for oil; the most important change concerns gasproduction in North America whose share in the total decreases to 11% from 18% in theReference at the 2030 horizon.
As a result of the above-described changes in oil and gas availability and production patterns,oil and gas prices are higher in the low resource case: about 20% in 2030 compared to theReference for oil, and between +20% and almost 60% for gas, depending on the marketconsidered.
65
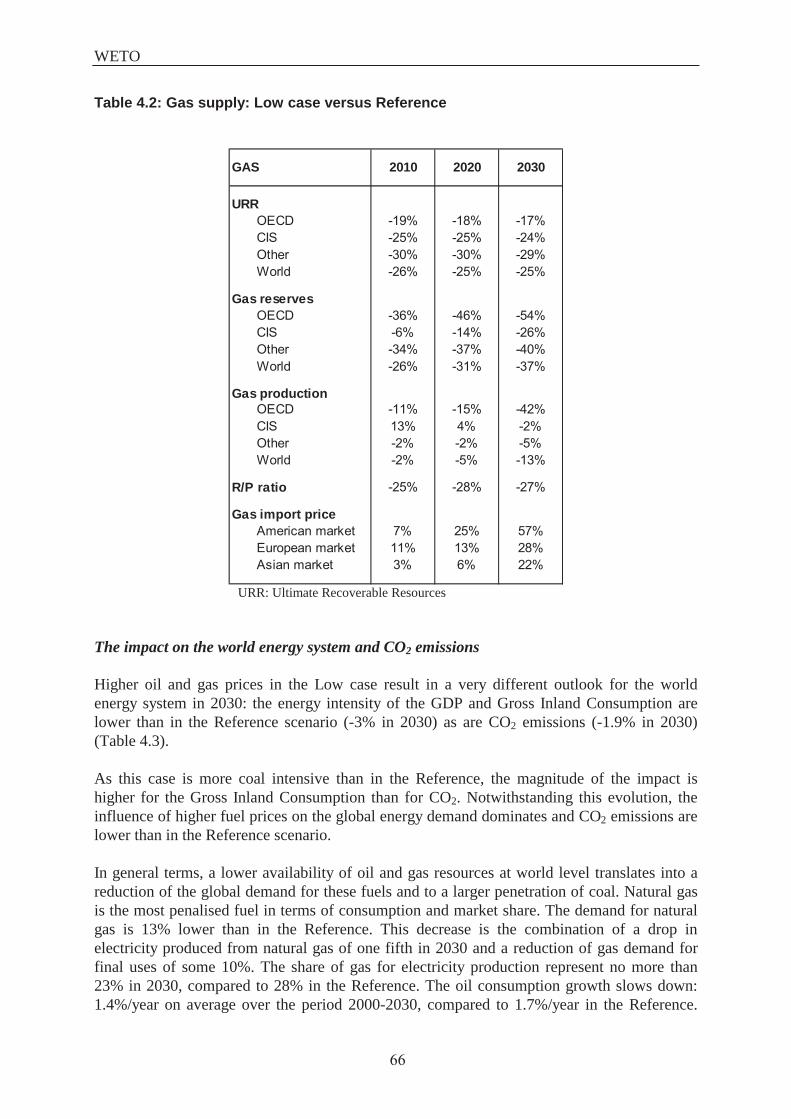
WETO
Table 4.2: Gas supply: Low case versus Reference
GAS 2010 2020 2030
URROECD -19% -18% -17%CIS -25% -25% -24%Other -30% -30% -29%World -26% -25% -25%
Gas reservesOECD -36% -46% -54%CIS -6% -14% -26%Other -34% -37% -40%World -26% -31% -37%
Gas productionOECD -11% -15% -42%CIS 13% 4% -2%Other -2% -2% -5%World -2% -5% -13%
R/P ratio -25% -28% -27%
Gas import priceAmerican market 7% 25% 57%European market 11% 13% 28%Asian market 3% 6% 22%
URR: Ultimate Recoverable Resources
The impact on the world energy system and CO2 emissions
Higher oil and gas prices in the Low case result in a very different outlook for the worldenergy system in 2030: the energy intensity of the GDP and Gross Inland Consumption arelower than in the Reference scenario (-3% in 2030) as are CO2 emissions (-1.9% in 2030)(Table 4.3).
As this case is more coal intensive than in the Reference, the magnitude of the impact ishigher for the Gross Inland Consumption than for CO2. Notwithstanding this evolution, theinfluence of higher fuel prices on the global energy demand dominates and CO2 emissions arelower than in the Reference scenario.
In general terms, a lower availability of oil and gas resources at world level translates into areduction of the global demand for these fuels and to a larger penetration of coal. Natural gasis the most penalised fuel in terms of consumption and market share. The demand for naturalgas is 13% lower than in the Reference. This decrease is the combination of a drop inelectricity produced from natural gas of one fifth in 2030 and a reduction of gas demand forfinal uses of some 10%. The share of gas for electricity production represent no more than23% in 2030, compared to 28% in the Reference. The oil consumption growth slows down:1.4%/year on average over the period 2000-2030, compared to 1.7%/year in the Reference.
66
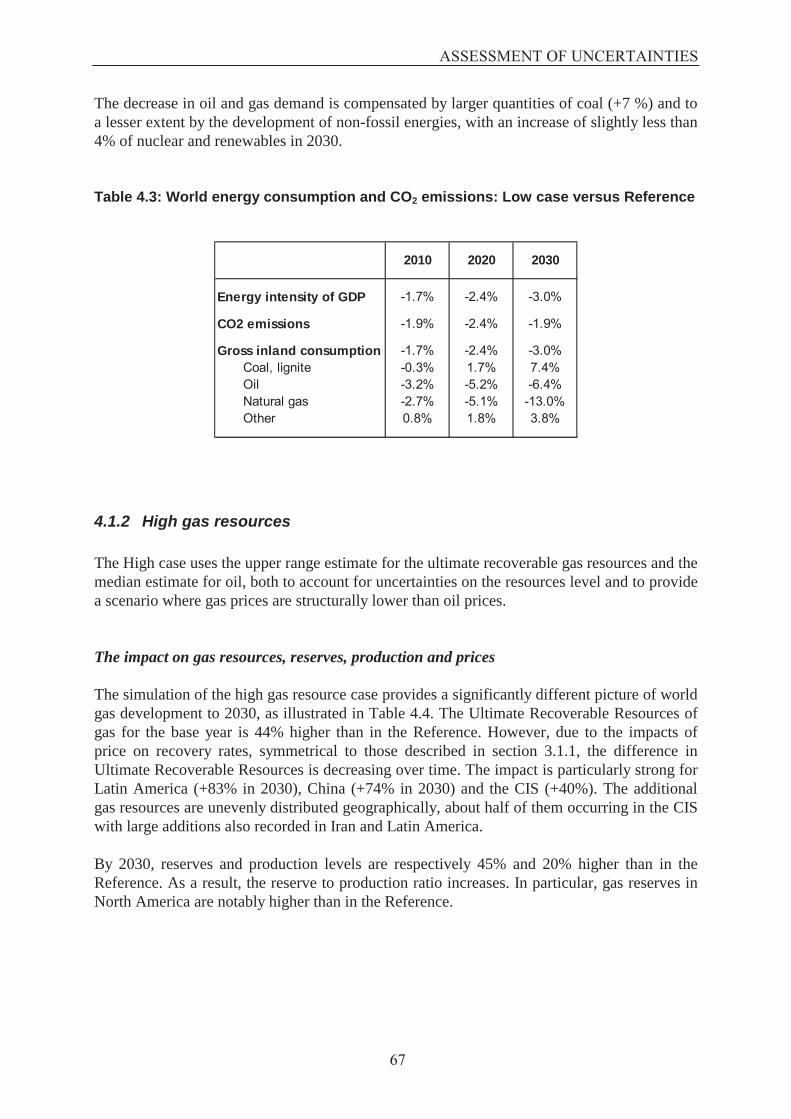
ASSESSMENT OF UNCERTAINTIES
The decrease in oil and gas demand is compensated by larger quantities of coal (+7 %) and toa lesser extent by the development of non-fossil energies, with an increase of slightly less than4% of nuclear and renewables in 2030.
Table 4.3: World energy consumption and CO2 emissions: Low case versus Reference
2010 2020 2030
Energy intensity of GDP -1.7% -2.4% -3.0%
CO2 emissions -1.9% -2.4% -1.9%
Gross inland consumption -1.7% -2.4% -3.0%Coal, lignite -0.3% 1.7% 7.4%Oil -3.2% -5.2% -6.4%Natural gas -2.7% -5.1% -13.0%Other 0.8% 1.8% 3.8%
4.1.2 High gas resources
The High case uses the upper range estimate for the ultimate recoverable gas resources and themedian estimate for oil, both to account for uncertainties on the resources level and to providea scenario where gas prices are structurally lower than oil prices.
The impact on gas resources, reserves, production and prices
The simulation of the high gas resource case provides a significantly different picture of worldgas development to 2030, as illustrated in Table 4.4. The Ultimate Recoverable Resources ofgas for the base year is 44% higher than in the Reference. However, due to the impacts ofprice on recovery rates, symmetrical to those described in section 3.1.1, the difference inUltimate Recoverable Resources is decreasing over time. The impact is particularly strong forLatin America (+83% in 2030), China (+74% in 2030) and the CIS (+40%). The additionalgas resources are unevenly distributed geographically, about half of them occurring in the CISwith large additions also recorded in Iran and Latin America.
By 2030, reserves and production levels are respectively 45% and 20% higher than in theReference. As a result, the reserve to production ratio increases. In particular, gas reserves inNorth America are notably higher than in the Reference.
67

WETO
Table 4.4: Gas supply: High case versus Reference
GAS 2010 2020 2030
URROECD 32% 31% 30%CIS 42% 41% 40%Other 50% 49% 48%World 43% 42% 42%
Gas reservesOECD 52% 92% 124%CIS 8% 16% 28%Other 5% 27% 43%World 11% 30% 45%
Gas productionOECD 4% 19% 35%CIS 2% 5% 7%Other 12% 12% 23%World 7% 12% 20%
R/P ratio 4% 16% 20%
Gas import priceAmerican market -14% -25% -39%European market -14% -21% -28%Asian market -14% -15% -16%
In the High case, the Middle East represents 13% of world gas production in 2030, instead of16% in the Reference, the CIS 31% instead of 35%, and the OECD region 27% instead of24%. As a whole, the High case portrays a world with a lesser degree of dependence on gassupply from the Middle East and the CIS.
As a consequence of the above trends in reserves and production levels, and in spite of thehigher demand for natural gas, natural gas prices are lower by 16% and up to 40% dependingon the regional market considered. More precisely, gas prices in the High case are projected tobe 16, 20 and 28 €/bl in 2030, respectively on the American, Euro-African, and Asianmarkets.
The impact on the world energy system and CO2 emissions
As expected, the High case provides a fully different (nearly opposite.) picture of the worldenergy system at the 2030 horizon, compared to the Low case. The world energy outlookdescribed in the Reference is also affected by the lower gas prices resulting from theworldwide abundance of resources. The major change concerns the share of the different fuelsin gross inland consumption: the demand for natural gas is 20% higher than in the Reference(Table 4.5). Gas replaces principally coal (-8.5%) but also some quantities of oil (-3%) and
68

ASSESSMENT OF UNCERTAINTIES
non-fossil energies (-4%). As a result, natural gas increases its market share in 2030 to 30%,from 25% in the Reference.
In contrast, total energy demand and CO2 emissions are only slightly affected by the low gasprices. The average energy intensity of the economy and total energy demand are 1.5% higherthan in the Reference in 2030, while CO2 emissions are 0.2% lower. The latter figure showsthat the replacement of coal by natural gas, a fuel with lower carbon intensity, compensatesfor the increase in gross inland consumption and for the decrease in non-fossil energies,principally nuclear.
Table 4.5: World energy consumption and CO2 emissions: High case versusReference
2010 2020 2030
Energy intensity of GDP 0.1% 0.9% 1.5%
CO2 emissions -0.8% -0.4% -0.2%
Gross inland consumption 0.1% 0.9% 1.5%Coal, lignite -4.2% -5.9% -8.5%Oil -0.9% -1.8% -2.9%Natural gas 5.7% 12.2% 21.2%Other 0.2% -0.9% -3.7%
Key conclusions
� With lower oil and gas resources than the Reference, oil and gas prices are projectedto be much higher than in the Reference, around 40 €/bl in 2030. This induces alower world energy demand (-3%), which benefits particularly coal and non-fossilenergies, to the disadvantage of natural gas (-13%) and oil (-6%). As a result, worldCO2 emissions are 2% lower than in the Reference.
� Increased availability in gas resources would lead to a drop in gas prices to 16, 20and 28 €/bl in 2030, respectively on the American, European and Asian markets. Incontrast, the oil price decreases only slightly underlying low substitution possibilitiesbetween oil and gas. Although the world energy demand is slightly affected (+1.5%compared to the Reference), the fuel mix is substantially modified in favour ofnatural gas (+21%, against –9% for coal ,-3% for oil and -4% for primary electricity )
69

WETO
4.2. TECHNOLOGY DEVELOPMENT FOR POWER GENERATION
Besides the availability of fuels and the related fuel prices, assumptions on the development ofenergy technologies play a crucial role in the analysis of future energy systems. The ability toreduce greenhouse gas emissions and especially the cost of the corresponding policies willlargely depend on the available technologies. Alternative proposals to the Kyoto protocol evencall for a multi-lateral agreement on research and development (R&D) in order to acceleratethe development of new energy technologies and thus provide cheap options for the reductionof greenhouse gas emissions. This section provides a closer look on the role of energytechnologies in carbon emissions and emission reduction. The purpose is to determine to whatextent technology development or accelerated technology substitution can reduce energy-related greenhouse gas emissions by applying more efficient technology and changing thefuel-mix.
Technology development and learning
Forecasting technology development is a highly speculative activity, especially for a long-termtime horizon. However, considerable efforts have been recently made to improve themodelling of technology development in energy models. The simplest approach reliesexclusively on exogenous forecasts based on expert judgement on technology developmentand economic performance17. It can be replaced by a description of technology cost dynamicswhich allows to endogenise, at least partially, technological change in energy models18. ForWETO the method applied takes into account the "learning by doing" effect and also theimpact of R&D on technology development. This approach yields projections of technologydevelopment which are consistent with historic trends (see Figure 4.2). The WETO Referencethus contains a coherent set of assumptions with respect to technology development.
For the technology cases it is assumed that accelerated technology development, ortechnological breakthroughs, may occur for certain clusters of technologies. To describe theenhanced technology performance, the conversion efficiency, total investment cost19, as wellas operation costs are changed. Here it is assumed that these breakthroughs present a deviationfrom the trajectory of technology development as applied in the Reference. Expert judgementshave been used to define a possible albeit optimistic set of assumptions for improvedtechnology performance up to the year 2030. The technology cases thus use a hybrid approachapplying exogenous technology improvements to a set of consistent endogenous projectionson technology development. The model used is able to estimate the amount of additional
17 E3-TDB, the database on energy technologies used in the POLES model has been developed under severalresearch projects under the JOULE programme of the European Commission (Bess M. et al., TechnologyDatabase E3TDB, in International Journal of Global Energy Issues, Special Issue, Vol. 14, Nos. 1-4, pp. 398-403, 2000).18 See Kouvaritakis N., Soria A., Isoard, S., Modeling energy technology dynamics: methodology for adaptiveexpectations models with learning by doing and learning by searching, in International Journal of Global EnergyIssues, Special Issue, Vol. 14, Nos. 1-4, pp. 104-115, 200019 The cost figures presented hereafter refer to total investment costs, i.e. they include the so-called overnightconstruction costs (the cost of the equipment) plus financial costs that accrue during the construction time, aswell as decommissioning costs.
70

ASSESSMENT OF UNCERTAINTIES
R&D necessary to bring about accelerated technological progress. However, the focus of thetechnology cases is to analyse the impact of a defined technological breakthrough rather thanthe issue of higher R&D investments or more focussed technology policies to provoketechnological development. For this reason the hybrid approach has been chosen and the linkbetween R&D and technology improvement is not treated in this study.
Figure 4.2: Learning curves for power generation technologies20 up to 2030
cumulative installed capacity [MW]
100 1000 10000 100000 1000000 10000000
Tota
l Inv
estm
ent C
ost [
€ 99/k
W]
500
600
700
800900
1000
1500
2000
2500
3000
3500
400045005000
HydroNuclearNew nuclear designPhotovoltaicsConventional ligniteConventional coalSmall hydroBiogas turbineBiomass CHPCoal gasification ccDirect coalSupercritical coalConventional gasSolar thermal powerWindFuel cells (SFC)Gas combined cycleFuel cells (PEM)
WETO Reference2030
2010
2000
The technology cases can be summarised as follows:
� The "Gas case", which assumes enhanced availability of natural gas and introducesimprovements for gas turbine combined cycle plants and fuel cells.
� The "Coal case", which involves major improvements in advanced solid fuel burningtechnologies, namely Supercritical coal plants, Integrated coal gasification combined cycleplants and direct coal firing plants.
� The "Nuclear case", which assumes a breakthrough in nuclear technology in terms of costand safety. It has an influence on standard large light water reactors but especially on anew evolutionary nuclear design.
� The "Renewable case" involves a major effort in renewable energies notably, wind power,biomass gasification, solar thermal power plants, small hydro and photovoltaic cells.
20 The learning curves or progress curves show the historic development of investment cost for the energytechnologies over the total cumulative installed capacity and their projections up to the year 2030 for the WETOReference. The symbols indicate time steps of five years.
71

WETO
All the cases are technology scenarios looking exclusively at technologies for electricitygeneration. They are focused on changes in the technology portfolio on the supply side and donot analyse policies and technologies on the demand side. Whilst this can be considered alimitation of the exercise at the same time it provides better consistency in the assessment of agiven breakthrough.
4.2.1 Gas
This case combines modifications in the performance and costs of some key technologies andan expansion of world ultimate gas resources. This latter was carried out by following the 5 %probability upper estimate for undiscovered resources and corresponds to the high gasreserves case (High case) as described in the previous section. The technology side of the casegas powered technologies based on gas turbines have been dealt with:
� Gas turbine combined cycle (GTCC). This is already the most successful powergenerating technology in the Reference contributing about 22 % of total generation by theyear 2030. This gain in share achieved in the face of substantial increases in natural gasprices is mainly due to the major improvements in techno-economic performanceincorporated already in the Reference: i.e. a 40 % decrease in capital costs mainly due toan increase in efficiency from around 53 % at present to 59 %. For the gas case capitalcosts are reduced by a further 20 %, specific fixed operation costs reduced by 20% andefficiencies raised to 63 %.
� Gas turbine combined cycle for combined heat and power. It is another gas-turbinedependent technology that sees relatively sluggish performance in the Reference due tohigher gas prices. For the technology case apart from the lower gas prices this technologyis assisted by a two point increase in both electric and steam conversion efficiency but alsoby a 20 % reduction in specific capital cost, fixed and variable operating costs.
This technology case represents a radical alternative in terms of world energy marketconfigurations due to the enhanced natural gas resource base. Already the High case sees areduction of global CO2 emissions of -0.1%. With the changed assumptions on technologies asintroduced in the Gas case global emission the emission reduction reaches -1.6%.
As described in the section on the High Gas Resources case (High case), in spite of muchhigher cumulative production, world reserves are more than one and a half times theirreference level in 2030 resulting in much lower bulk gas prices. This has strong impacts forlow to medium loads (residential/commercial electricity) where due to the suitability of GTCCto meet such demand, electricity prices have fallen on average world-wide by nearly 10%. Inspite of an increase in consumption, electricity generation stays at the same level since gasturbines for combined heat and power generation as well as fuel cells are used to a muchhigher extent in industry so that distribution losses are reduced.
Within the power generating sector, many considerable changes occur world-wide. Generationfrom gas turbine combined cycle plants increases considerably bringing their share to 28% oftotal generation instead of 22% in the Reference. This increase is achieved at the expense ofsuper critical coal (-1080 TWh) and the other coal technologies (-820 TWh) but also ofnuclear (-1700 TWh, 60 % of which the new nuclear design which finds little room todevelop). Combined heat and power from combined cycles sees its contribution increasing by
72

35%. On the other hand, many renewable sources of electricity see their shares reduced (egwind power plants by 10%).
The Gas case has produced weak results as far as CO2 emissions is concerned. The emissionreduction vis-à-vis the Reference is -1.6%. This is due partly to the uneven geographicaldistribution of the enhanced resources resulting in the gas not being available at sufficientlycheap prices where it could have made the biggest impact (the big Asian coal users China andIndia). For some other regions assuming higher resources implies that prices tend to stayrelatively lower during the simulation time horizon, causing demand to expand, particularlyfrom the power generating sector. Also this effect limits the impact of the advanced gastechnology on the reduction of CO2 emissions.
Table 4.6: Assumptions and results of the Gas case
2000 2010 2030Reference Gas case Change Reference Gas case Change
Gas turbine combined cycleTotal investment cost [€99/kW] 745 587 548 -7% 533 427 -20%Efficiency [%] 53.5 57 57 0% 59 63 7%Electricity generation [TWh] 1311 5240 6111 17% 8334 10409 25%
TotalElectricity generation [TWh] 15639 20159 20175 0.1% 36621 36720 0.3%CO2 emissions [Gt] 6794 8184 8162 -0.3% 12562 12359 -1.6%CO2 emissions [Gt] from electr. generation
2318 2457 2412 -1.8% 4298 3990 -7.2%
4.2.2 Coal
The coal case analyses the effect of improvements of advanced coal based energytechnologies. The following technologies have been considered:
� The supercritical coal power plant. This power plant type achieves high conversionefficiencies applying supercritical steam conditions (higher pressure and temperature ofthe steam). Special materials are necessary that can withstand these conditions. In thereference case the conversion efficiency achieved in 2030 is 49 % and specific capital costof the technology is around 1100 €/kW with low operating and maintenance costs (by coalfired power plant standards). This technology is the “winning” coal technology in theReference gaining about 20 % of world total central power generation and 30 % of worldcoal generation by 2030. For the purpose of this case the efficiency was increased to 55 %and the capital cost brought down to 800 €/kW by 2030 while a 10 % reduction inoperation and maintenance (O&M) costs was also introduced.
� The integrated coal gasification combined cycle power plant (IGCC). This technologyapplies coal gasification with combustion of the coal gas in a gas turbine and the recoveryof waste heat in a boiler. The technology in the Reference reaches about 50 % efficiencyand costs 1350 €/kW by 2030 with still relatively high operating and maintenance costs ofabout 87 €/kW. In that case, it achieves a penetration of about half the importance of
ASSESSMENT OF UNCERTAINTIES
73

WETO
supercritical coal. In the Coal case the techno-economic performance of this type of plantis substantially improved to reach 54 % efficiency by 2030 while achieving 28 %reductions in capital and 10% in fixed O&M costs.
� The direct coal fired combined cycle plant. Like the IGCC plant this technology isapplying a gas turbine and a steam turbine in a combined cycle. However, the coal isdirectly burnt in the gas turbine without previous gasification.. The presence of coalparticles inside the turbine poses technical problems, which still have to be solved.Therefore, it is assumed that this technology will be available only after 2015. Thistechnology is costing 1250 €/kW, reaching 50 % thermal efficiency by 2030 withrelatively low operating costs. It achieves a penetration comparable to the IGCC plant inthe Reference. A capital cost of 960 €/kW and an efficiency of 54 % is retained for thescenario resulting in cost performances similar to those of the IGCC plant.
A salient effect of this case is a noticeable displacement of gas-fired combined cycles by coal-fired power plants even in regions with access to reasonably cheap gas prices. Coal-firedpower plants exhibit a competitiveness threshold with respect to combined cycles for loadshigher than 6500 hours/year in the Reference, whereas in the advanced coal case this thresholdmoves to around 4500 hours/year. The development over time of electricity generation cost ofa supercritical coal plant and a gas combined cycle plant can be seen in Figure 4.3.
Figure 4.3: Cost of electricity: gas combined cycle versus supercritical coaltechnology
2000 2005 2010 2015 2020 2025 2030
€ 99/k
Wh
0.040
0.045
0.050
0.055
0.060
0.065
0.070
0.075
Supercritical Coal (Coal case)Supercritical Coal (Reference)Gas Combined Cycle
(5100 hours, Europe )
74

ASSESSMENT OF UNCERTAINTIES
Table 4.7: Assumptions and results of the Coal case
2000 2010 2030Reference Coal case Change Reference Coal case Change
Supercritical coalTotal investment cost [€99/kW] 1970 1303 1181 -9% 1117 805 -28%Efficiency [%] 44 46 47.7 4% 49 55 12%Electricity generation [TWh] 0.009 1391 1518 9% 6989 8608 23%
Integrated Coal Gasification (IGCC)Total investment cost [€99/kW] 2631 1805 1637 -9% 1361 980 -28%Efficiency [%] 43.5 49 49 0% 49.8 54 8%Electricity generation [TWh] 0.11 355 396 12% 3101 3752 21%
Direct coalTotal investment cost [€99/kW] n.a. 1733 1696 -2% 1252 969 -23%Efficiency [%] n.a. 46.5 50 8% 49.3 54 10%Electricity generation [TWh] n.a. n.a. 1893 2140 13%
TotalElectricity generation [TWh] 15639 20159 20167 0.0% 36621 37006 1.1%CO2 emissions [Gt] 6794 8184 8170 -0.2% 12562 12560 0.0%CO2 emissions [Gt] from electr. generation
2318 2457 2443 -0.6% 4298 4309 0.3%
The Coal case produces no change in world CO2 emissions, with relatively high regionaldifferences: a decrease in Asia (-1.0 %), an increase in Western Europe (1.4 %) and the OECDas a whole (0.8%), and stagnation in the rest of the world. Advanced coal plants are moreefficient and therefore produce considerably less CO2 per kWh than conventional coal-firedplants. However, this is offset in some regions by the fact that clean coal plants also becomecheaper and therefore often are preferred to nuclear and gas-fired plants which produce evenless CO2 per kWh. Coal consumption in power stations increases by 5 % while gasconsumption decreases by 14 %, oil by 13 % and nuclear generation by 6 %.
Concerning new coal technologies the largest change occurs for the supercritical coal plants.Supercritical coal’s share of world centralised power generation goes up from under 20 % toaround 25 % while the increase in IGCC generation is less marked (share up from 9 % to 11%). The improvements supposed for the Direct Coal combustion plants are insufficient tosignificantly increase its cost-competitiveness. Thus, its contribution remains at 5.5%. Theresults are reflected in the learning curves for the Coal case (Figure 4.4).
75

WETO
Figure 4.4: Learning curves for advanced coal technologies
Cumulative Installed Capacity [MW]
10000 100000 1000000
Tota
l Inv
estm
ent C
ost[€
99/k
W]
2500
2250
2000
1750
1500
1250
1000
750
Supercritical Coal (Reference)Supercritical coal (Coal case)Integrated Coal gasification (Reference)Integrated Coal Gasification (Coal case)Direct Coal Combustion (Reference)Direct Coal Comb. (Coal case)
The advanced coal technologies replace very substantially gas combined cycle generation(-1300 TWh). Since already in the Reference the bulk of coal based electricity generationcomes from new technologies (78%) the potential for replacement of these technologies bynew coal technologies is limited. Indeed, the generation from conventional coal technology isreduced by only 85 TWh. The new coal technologies act as a break for the development ofnew nuclear design power plants (-36%), while conventional nuclear plants are less affected.Also severely affected are the biomass gasification combined cycle plants (-18 %) and windpower generation (-10 %) mainly due to the lower base load electricity prices (nearly 10 %lower). International coal prices are 5-7 % higher which is clearly not sufficient to reducesignificantly the competitiveness of the new coal technologies.
4.2.3 Nuclear
This case has been implemented by altering the techno-economic characteristics of the twotypes of nuclear power plants considered in this study:
� Standard large Light Water Reactor (LWR). In the reference case this plant type issupposed to exhibit capital costs slightly increasing over time due to increased investmentin security measures. In the technology case, the investments as well as O&M costs areassumed to be about 35 % lower as compared to the Reference in 2030.
� New evolutionary nuclear design. This technology is assumed to be introduced graduallyafter 2010 in the Reference and costs about 30 % less to construct than the LWR by to2030 thanks primarily to its inherent safety characteristics. In the Reference it gained asubstantial share of the total nuclear market (approx. 12 %). For the nuclear technologycase this type of plant is assumed to be 35 % cheaper to construct and 35 % to operatethan in the Reference.
76

ASSESSMENT OF UNCERTAINTIES
Table 4.8: Assumptions and results of the Nuclear case
2000 2010 2030Reference Nuclear case Change Reference Nuclear case Change
Light Water Reactor (LWR)Total investment cost [€99/kW] 3632 3574 3159 -12% 3639 2365 -35%Electricity generation [TWh] 2627 3155 3158 0% 2832 4253 50%
Advanced Nuclear DesignTotal investment cost [€99/kW] n.a. 6770 5980 -12% 2560 1663 -35%Electricity generation [TWh] n.a n.a. n.a 377 1443 283%
TotalElectricity generation [TWh] 15639 20159 20225 0.3% 36621 36849 0.6%CO2 emissions [Gt] 6794 8184 8202 0.2% 12562 12214 -2.8%CO2 emissions [Gt] from electr. generation
2318 2457 2473 0.7% 4298 3984 -7.3%
These changes have an important impact on the market penetration of these plants. In theReference they become less and less competitive in most regions of the world even for thehigh annual loads. In the nuclear technology case, they become generally cost-attractive vis-à-vis combined cycle gas turbines at around 5500 hours/year and vis-à-vis supercritical coaltechnologies in the region of 4500 hours/year. The competitiveness gains are particularlymarked for the new nuclear design. It is worth noting, however, that the changes in costs arephased in gradually and that power plants and especially nuclear ones are characterised by aslow capital turnover.
The overall effect of this technology case is a worldwide reduction of CO2 emissions in 2030of 2.8% (4.6 % in the OECD). At global scale there is considerable increase in nuclearelectricity generation. Overall nuclear contribution increases from 9 % to over 15.5 % (from16 % to 37 % in the OECD). Nuclear power – an expensive option in the Referenceprojection – penetrates into the high to medium annual loads displacing coal and gas firedelectricity production (see Figure 4.5). The relatively important reduction in GTCC justreflects its fundamental contribution in middle and high loads in the reference case.International coal prices are 5-10 % lower while gas prices are down 3-8 %. World oil pricesstand virtually unaffected (-1 %) since most of the changes implied by this technology caseoccur within the electricity sector where petroleum plays a small role.
77

WETO
Figure 4.5: Impact of the nuclear case on the electricity generation by technology
new
nuc
lear
gas
com
bine
d cy
cle
supe
rcrit
ical
coa
l
coal
gas
ifica
tion
dire
ct c
oal
conv
entio
nal c
oal
win
d
biom
ass
gas
turb
ine
conv
entio
nal g
as
nucl
ear
-700
-350
0
350
700
1050
1400
TWh
Nuclear case in 2030
4.2.4 Renewables
This case is different from the previous ones in that it is not organised around a singletechnological breakthrough or a generic cluster of technological developments. It is ratherrepresentative of a situation where a major R&D effort would be directed on decentralisedrenewable technologies producing drastic improvements in their techno-economiccharacteristics of a number of them. The main technologies affected in this technology caseare:
� Biomass gasification for electricity production in small scale (less than 25 MW)combined cycle plants. In the Reference, the specific capital cost of this technology isreduced by 15% and the conversion efficiency increased from to 43 %. Under thesecircumstances the contribution of this technology is growing at an average 5.5 %/year.For this technology case, specific capital costs are assumed to be cut by 30% by 2030 withsome further improvements in efficiency and operating costs. The impact of these changesis a doubling of the contribution of this technology in 2030, albeit with an inflexion ofgrowth towards the end of the period due to the limited availability of cheap biomassresources.
� Photovoltaics. In the Reference, their capital cost is drastically reduced from about 15000€/ kW in 1990 to 4400 €/kW by 2010 and 3200 €/kW by 2030. Specific fixed O&M costsare halved between the present and 2030. Impressive as these reductions are they leave thecost of electricity produced at a generally uncompetitive level and the technology had arelatively symbolic contribution. The Renewable Case implies a halving of 2030 referencecosts, which translates into a reduction of the cost of the kWh delivered to around 17 €ct.This cost, although still not generally competitive as compared with network electricity,allows at least the development of niche markets and leads to a contribution of around 32TWh worldwide by 2030. Of these only about 6 TWh are produced in developingcountries despite the fact that on average they enjoy better insolation conditions.
78

ASSESSMENT OF UNCERTAINTIES
� Molten Salt Tower Solar plant with storage. This is the main solar thermal powertechnology considered with a capital cost reduced to 2050 €/ kW and a capacity factor of36 % by 2030 in the Reference. In the technology case these figures reach 1450 €/kW and38 % respectively, and the total electricity generation is 119 TWh worldwide. Though thisfigure is relatively modest, it does not represent the full potential impact of this technologyas by 2030 it is still in the stage of rapid take off in industrialised countries and has noteven entered that stage in developing countries where most of the physical potential exists.
� Small hydro. In the Reference, it is assumed to be a mature technology registeringinsignificant gains over the projection period. Capital cost are halved in this technologycase and hence its contribution rises from 250 TWh to 380 TWh worldwide by 2030.However by the end of the period the technology displays clear signs of saturation as thebest available sites are gradually exhausted.
� On-shore wind turbines (over 500 kW capacity). In the Reference relatively modestreductions in capital costs from 1000 €/kW to 820 €/kW in 2030 are assumed withimprovements in capacity factors to a range of 12-30 % depending on the site. Thetechnology case by contrast implies a reduction of capital costs to two thirds of theirpresent level and further significant increases (+ 25 %) in capacity factors. Thesedevelopments render wind power highly competitive, in spite of its intermittent characterand lead to massive development worldwide. This development is furthermore fairlyevenly distributed, with about half occurring in industrialised countries.
Table 4.9: Assumptions and results of the Renewable case
2000 2010 2030Reference Renewable
case Change Reference Renewablecase Change
PhotovoltaicsTotal investment cost [€99/kW] 6457 4373 3936 -10% 3146 2202 -30%Electricity generation [TWh] 0.02 0.26 0.33 27% 0.88 2.04 132%
Biomass gasificationTotal investment cost [€99/kW] 2368 2198 1978 -10% 2087 1461 -30%Electricity generation [TWh] 0.11 255 218 -15% 169 371 120%
Wind turbinesTotal investment cost [€99/kW] 996 911 820 -10% 816 571 -30%Electricity generation [TWh] 23.6 171 230 35% 710 2016 184%
TotalElectricity generation [TWh] 15639 20127 20159 0.2% 36621 35802 -2.2%CO2 emissions [Gt] 6794 8184 8150 -0.4% 12562 12188 -3.0%CO2 emissions [Gt] from electr. generation
2318 2457 2432 -1.0% 4298 3917 -8.9%
79

WETO
In addition to the above the renewable case includes three more technologies where theimprovements implied are insufficient to produce a significant impact. These are lowtemperature passive solar, which due to insufficient cost reductions remains a niche option,rural photovoltaic, which becomes uncompetitive with network connection and therefore facesa shrinking market potential as electrification proceeds.
The Renewable case results in a 3 % reduction in worldwide CO2 emissions (3.2 % in Asiaand 2.4 % in the EU). This is primarily achieved by an across the board reduction in centrallyproduced electricity (-1600 TWh of coal fired -950 TWh of gas fired and -180 TWh of nucleargenerated electricity world-wide).
World oil prices are hardly affected (around -1 %) but wholesale gas and coal prices are moresubstantially reduced (around - 5 %) allowing for some increase of the consumption of thesefuels outside the power generation (especially in industry). This phenomenon partially offsetsthe substantial reductions in power generation. Generally this technology case has majorimplications for new and renewable technologies but fails to produce a major impact on CO2emissions in the 2030 horizon because these technologies are mostly applicable to the powersector and often (being mostly intermittent) even a limited section of this sector. In addition,the some of the renewable technologies become truly competitive only towards the end of theperiod, thus having little time to display their full potential.
4.2.5 Impact on CO2 emissions
The technology cases as described in section 4.2 provide a closer look on the role of energytechnologies in carbon emissions and emission reduction. The different assumptions ontechnology development lead to significant changes in the electricity production structure(Figure 4.10). The impact on total global CO2 emissions, however, is limited. The maximumreduction vis-à-vis the Reference was 3%. The technology cases as defined here do not offerdefinitive solutions for the global CO2 emission problem. There are many reasons for this.Some of them are inherent to the way these cases were set up, whereas other are related to thestructure of energy markets.
Table 4.10: Summary of the impact of the technology cases
Electricity generation Totalbased on
Gas Coal Nuclear Renewables Total generation
CO2
emissionsCO2
emissions
Gas case 21.6% -12.2% -5.3% -10.5% 0.3% -7.2% -1.6%
Coal case -16.0% 15.0% -6.5% -10.2% 1.1% 0.3% 0.0%
Nuclear case -7.1% -8.1% 77.5% -9.9% 0.6% -7.3% -2.8%
Renewable case -12.3% -8.8% -2.4% 132.0% -2.2% -8.9% -3.0%
changes as compared to Reference in 2030
80

ASSESSMENT OF UNCERTAINTIES
Key conclusions
� The different assumptions on technology development lead to significant changes inthe structure of electricity production. However, the technology cases defined here donot offer definitive solutions for the global CO2 emission problem.
� This is largely because the technology cases are defined in terms of clusters oftechnological breakthroughs affecting only a part of the energy market, basically thepower generation sector. Important though the power sector may be, it only accountsfor about one third of world CO2 emissions. Technologies addressing only this sectorcan be expected to have an impact limited by this share.
� The extension of these energy technology cases to other important CO2 emittingsectors should be a priority in the future. An area where such an impact of a clusterof emerging technologies could be convincingly found is in road transport. Also newtechnologies in industrial energy-intensive sectors as well in the residential andtertiary sector could be analysed.
� Cases involving major improvements in fossil fuel technologies produce low impactson CO2 emissions because of two opposing effects. On the one hand, advanced fossil-fuelled technologies reduce specific carbon emissions due to enhanced conversionefficiency. On the other hand, they make fossil-fuel technologies more attractive dueto lower costs and therefore foster the use of fossil fuels. Therefore, scenariosinvolving non-fossil energy delivered markedly better a greater impact on CO2emissions.
� It is hard to see how clusters of energy technologies could by themselves make amajor impact on the global CO2 problem if they are not accompanied by major policyinitiatives albeit market related ones. Combining the technology cases withinternalisation of external costs through taxation would magnify the impact and tendto neutralise some of the more ambiguous side effects quite apart from the fact thatthese policy instruments can by definition act on a much wider front. Section 6.3 isshowing that advanced technologies can have a considerable impact on the cost ofmeeting emission reduction targets.
81


CHAPTER 5
EU GAS MARKET IN A WORLD PERSPECTIVE
In the EU, natural gas has been the fastest growing component of the energy consumptionover the last ten years. At world level, the increase in gas demand has also been remarkable.The increasing synergy between gas and electricity generation was, without any doubt, a keydeterminant of this remarkable evolution. As the Reference projects the continuation of thistrend at world level through 2030, it is worth asking how the projected growing market forgas, combined with the decline of gas production in Europe, will affect the outlook ofEuropean gas supplies to 2030 and what the impacts could be on the security of natural gassupply in the EU.
The chapter starts with a description of the projected evolution of EU gas demand in theReference and compares this evolution with past trends in the EU and with the evolution inthe other world regions. In this analysis, particular attention is given to the prospects of gasuse in electricity generation. In the next section, the projected changes in gas production levelsby world region and in gas supply patterns for the EU and the other regions are described andanalysed, as well as the consequences in terms of inter-regional gas trade and gas transportinfrastructures (i.e. pipelines versus LNG). Finally, the last section deals with the implicationsfor the security of natural gas supply in the EU and describes how the uncertainties on gasresources may affect the security.
In this chapter, the EU gas market is examined under two configurations: the presentEuropean Union of 15 Member countries (EU) and the enlarged EU including the 12Accession countries21 (EU + Acc. Countries).
5.1 GAS DEMAND
EU contribution to world gas consumption
The WETO Reference projects a significant increase in the world demand for gas. Over theperiod 2000-2030, gas demand is expected to double, reaching 4.3 Gtoe in 2030. This increaseis the result of the remarkable growth of 3%/year on average from 2000 to 2010 followed by aslightly lower growth of 2.1%/year over the period 2010-2030. On average, the gas demandgrowth through 2030 will be higher than during the last ten years, namely 2%/year. However,it is worth pointing out that, during that period, the world natural gas consumption growth wassubstantially reduced due to a considerable decrease in the CIS’s consumption.
The pace of growth shows however contrasted patterns between world regions (Figure 5.1).For instance, the EU’s contribution to this impressive rise in gas demand is minor compared
21 Hungary, Poland, Czech Republic, Slovakia, Latvia, Estonia, Lithuania, Slovenia, Romania, Bulgaria, Maltaand Cyprus.
83

WETO
to the contribution of certain regions, in particular Asia and the CIS, which represent the bulkof the increase.
Figure 5.1: World gas demand
0
1000
2000
3000
4000
5000
1990 2000 2010 2020 2030
Mto
e
EU + Acc. Countries Other Western Europe CIS
North America Japan, Pacif ic Africa, Middle East
Latin America Asia
In fact, the EU gas demand is projected to increase more slowly than the world average, at0.8% per year over the outlook period22, but also in comparison to the last ten years when itgrew at an exceptional average annual rate of 4.9%. The growth rate is slightly higher, namely0.9%/year, when the Accession countries are included. Despite this apparent low growth,natural gas remains the second fastest growing primary source23 in the EU. For the sake ofcomparison, coal and oil primary demands are projected to increase respectively by 0.5% and0.2%/year. The EU is with North America the region where gas demand increases the least.The average rate of increase in North America is projected to be 1.2%/year for the next thirtyyears.
On the opposite side of the range, the projections of natural gas consumption show a rapidgrowth in Asia and Latin America, above 4%/year between 2000 and 2030. On the other hand,the average growth in the CIS, Africa, Middle East, Japan and Pacific ranges from 2.3 to 3%.
The largest increments in gas demand compared to the present situation are therefore expectedin Asia and Latin America. In fact, about one third of the increase in world gas demand overthe next thirty years comes from Asia. In contrast, Latin America accounts for 12% of theincremental gas demand as it starts from a smaller share of world gas consumption in 2000.EU with Accession countries contributes to 7% of the increase in world gas demand over theoutlook period (Figure 5.2).
Consequently to the above regional trends in natural gas demand, the share of developingcountries in the world gas demand increases to 40% in 2030 from around 25% in 2000.
22 1.7% per year on average between 2000 and 2010, and 0.4% thereafter.23 The fastest growing component is wind energy but its share in GIC remains small.
84
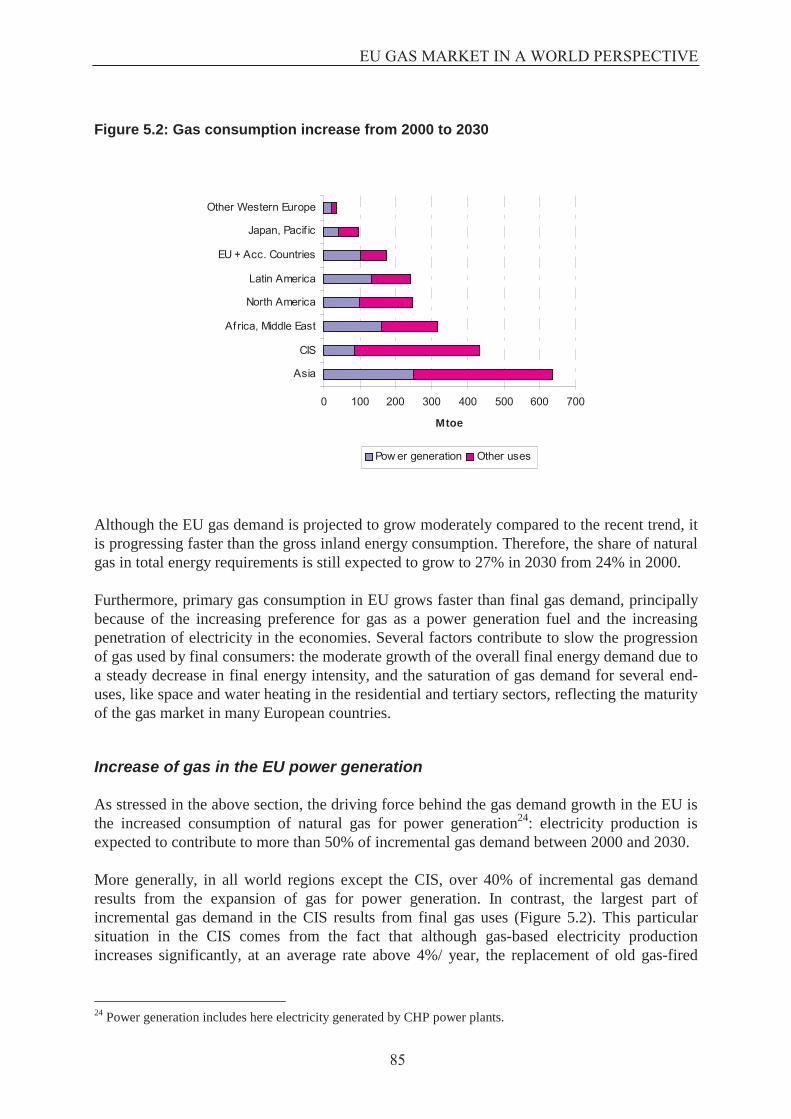
EU GAS MARKET IN A WORLD PERSPECTIVE
Figure 5.2: Gas consumption increase from 2000 to 2030
0 100 200 300 400 500 600 700
Asia
CIS
Africa, Middle East
North America
Latin America
EU + Acc. Countries
Japan, Pacif ic
Other Western Europe
Mtoe
Pow er generation Other uses
Although the EU gas demand is projected to grow moderately compared to the recent trend, itis progressing faster than the gross inland energy consumption. Therefore, the share of naturalgas in total energy requirements is still expected to grow to 27% in 2030 from 24% in 2000.
Furthermore, primary gas consumption in EU grows faster than final gas demand, principallybecause of the increasing preference for gas as a power generation fuel and the increasingpenetration of electricity in the economies. Several factors contribute to slow the progressionof gas used by final consumers: the moderate growth of the overall final energy demand due toa steady decrease in final energy intensity, and the saturation of gas demand for several end-uses, like space and water heating in the residential and tertiary sectors, reflecting the maturityof the gas market in many European countries.
Increase of gas in the EU power generation
As stressed in the above section, the driving force behind the gas demand growth in the EU isthe increased consumption of natural gas for power generation24: electricity production isexpected to contribute to more than 50% of incremental gas demand between 2000 and 2030.
More generally, in all world regions except the CIS, over 40% of incremental gas demandresults from the expansion of gas for power generation. In contrast, the largest part ofincremental gas demand in the CIS results from final gas uses (Figure 5.2). This particularsituation in the CIS comes from the fact that although gas-based electricity productionincreases significantly, at an average rate above 4%/ year, the replacement of old gas-fired
24 Power generation includes here electricity generated by CHP power plants.
85

WETO
plants with more efficient combined cycle gas turbines limits considerably the rise in gas usefor power generation.
In the 1990s, the EU, similarly to most world regions, experienced a rapid rise in the marketshare of natural gas in electricity production: in 2000, about 20% of total electricity wasgenerated from natural gas compared to 12% in 1990. Low capital costs and high conversionefficiency of gas turbine technologies; environmental concerns and competitive gas priceswere the driving factors behind this remarkable change. This evolution was also characterisedby a growing interconnection between European gas and power industries. Theimplementation of the European Parliament and Council Electricity and Gas Directives25
introducing greater competition into EU Member States’ electricity and gas markets isexpected to perpetuate this trend, provided that power plants operating on natural gas remaincompetitive compared to other technologies, principally advanced coal technologies.
In fact, the use of natural gas for the production of electricity depends on several factorsincluding the future electricity demand growth, the need for new generation capacity, theevolution of the prices of competing fuels (particularly coal) and the evolution of the costs ofnew power generation technologies
Between 2000 and 2010, natural gas is projected to account for the largest share (nearly 70%)of the increase in electricity production in the EU. As a result, some 27% of electricity shouldbe produced from gas-based power generation and CHP plants in 2010 (Table 5.1). Thefavourable outlook for gas is projected to continue in the Reference scenario up to 2020: overthis period, the projected increases in real gas prices will not remove the competitiveadvantage of natural gas compared to other generation fuels or energy forms. On the contrary,expectations for the period 2020-2030 are that advanced coal technologies may account forthe bulk of incremental electricity demand, the net result being a stabilisation of the share ofnatural gas based electricity production at 2010 level.
The Reference shows similar developments in Japan, Pacific and North America. However, inthese regions, larger investments in advanced coal power plants from 2020 to 2030 comparedto those in combined cycle gas turbines lead to a slight decrease of the gas market share forelectricity generation in 2030.
In contrast, the share of gas-based power generation continues to rise steadily over theprojection period in the other regions. At the world level, the share of gas use for electricitygeneration and combined heat and power production is expected to rise to 28% in 2030 from18% in 1990 and 19% in 2000.
25 Directive 96/92/EC of the European Parliament and of the Council of 19 December 1996 concerning commonrules for the internal market in electricity; Directive 98/30/EC of the European Parliament and of the Council of22 June 1998 concerning common rules for the internal market in natural gas.
86

EU GAS MARKET IN A WORLD PERSPECTIVE
Table 5.1: Share of electricity generated from natural gas
1990 2000 2010 2020 2030
European Union 12% 22% 27% 29% 27%
CIS, CEEC 35% 30% 36% 44% 49%
North America 15% 14% 22% 24% 20%
Japan, Pacific 24% 31% 40% 37% 35%
Africa, Middle East 25% 34% 39% 47% 49%
Latin America 10% 15% 29% 38% 40%
Asia 5% 12% 13% 16% 17%
World 18% 19% 25% 28% 28%
In all regions and over the 2000-2030 period, gas-based electricity production is progressingmore rapidly than total electricity production: 4% and 3% per year respectively at world level;1.9% and 1.2% per year respectively for the EU. The outlooks are the same for coal-basedelectricity. These trends result principally from the projected moderate increases of electricityproduced in nuclear and hydro power plants. As a consequence, the share of these electricitygeneration technologies in total world electricity production decreases considerably to 24% in2030, from 37% in 2000, to the benefit of gas and coal power plants and to a lesser extent ofwind turbines.
Finally, gas input to power generation grows less rapidly than gas-based electricityproduction, reflecting the increase in the average conversion efficiency of gas-fired powerplants. The difference is particularly impressive in the CIS where the conversion efficiency ofexisting gas-fired power capacities is very low compared to new gas-fired technologies. Gasinput to power generation in the CIS grows at an annual average rate of 1.6% over theprojection period while the growth of gas-based electricity production is 4.3% per year. In theEU, North America, Japan and Pacific the two growth rates are much closer.
87

WETO
5.2 GAS SUPPLY
Gas reserves
The most recent assessment of world natural gas reserves, some 164 Tm3 in 2001, indicatesthat natural gas is an abundant energy source. However, 70% of these reserves are located intwo world regions: the CIS and the Middle East. Western Europe represents 5% of the world’sproven gas reserves and North America 4%.
Figure 5.3: Gas reserves26
34%
5%
4%14%7%
36%
CIS, CEEC Western Europe North AmericaOther Africa Middle East
Gas production
To meet the fast growing demand for natural gas at world level, production should doublebetween 2000 and 2030. WETO shows that natural gas production is expected to increase inall regions except in the EU where gas production is projected to decrease by half and wouldrepresent no more than 2% of world gas production in 2030, compared to 9% in 2000 (Figure5.4).
The major increases in natural gas production will occur in Latin America (more than fourtimes the 2000 production level in 2030) and in Africa, Middle East (more than three times).In 2030, the CIS will be the lead gas producer with over one-third of world gas production,followed by Africa and Middle East (23%), North America (18%) and Latin America (10%).
It is worth pointing out that gas production in the two main producing regions is not onlydriven by increased gas demand in regions with limited gas resources, but also by the growingdomestic gas requirements. In fact, more than 50% of the natural gas produced in the CIS,Africa and Middle East will remain inside the regions.
26 As 1st January 2001; source: Cedigaz, Preliminary estimates, March 2002.
88

EU GAS MARKET IN A WORLD PERSPECTIVE
Figure 5.4: Share of gas production
9%
3%
28% 28%
2%
13%
5%
13%
2% 2%
35%
18%
2%
23%
10%8%
EU + Acc.Countries
OtherWesternEurope
CIS NorthAmerica
Japan,Pacific
Africa,MiddleEast
LatinAmerica
Asia
2000 2030
Despite the steady increase in gas production in North America and Asia, of 9% and 23%respectively over the period 2000-2030, the shares of these regions in world production shoulddecline because of a faster progression in the other large producing regions.
Natural gas production in the EU including the Accession countries is concentrated in theNetherlands and the United Kingdom. In 2000, it covered slightly more than 50% of theregion’s gas demand (this percentage goes up to 66% if Norway's gas production is included).The remaining demand was met essentially by pipeline imports from Norway, the CIS andAlgeria, and by LNG from Algeria and Nigeria. The other net importing region in the world in2000 is Japan, Pacific. About two third of gas consumption in this region was covered byLNG imports mainly from the South East of Asia and the Middle East. Elsewhere in theworld, gas production is sufficient to meet gas needs within the defined regional areas.
In the longer term, the regional imbalance between consumption and production is not onlyexpected to increase in the EU, the Accession countries and Japan, but also to take place inAsia and to a lesser extent North America. In contrast, the CIS, Africa, Middle East, thePacific region and Latin America would remain (or become - for Latin America) net exportingregions (Figure 5.5).
89

WETO
Figure 5.5: Gas consumption and production in 2030
0
200
400
600
800
1000
1200
1400
1600
EU + Acc.Countries
OtherWesternEurope
CIS NorthAmerica
Japan,Pacif ic
Africa,MiddleEast
LatinAmerica
Asia
Mto
e
Production Consumption
The dependence of the EU and Accession countries on extra-regional gas supplies increasessteadily throughout the projection period: the region’s gas imports are projected to more thandouble between 2000 and 2030. In 2030, the EU gas production would represent less than16% of the region’s natural gas requirements. In other words, gas dependence of the EU withthe Accession countries could reach 80% within 30 years.
The growing demand for gas in all regions combined with regional disparities in gas reservesand production costs will thus foster the development of inter-regional gas trade and increasethe linkages between regional markets. The WETO outlook shows that inter-regional tradewould represent some 36% of gas consumed worldwide in 2030, compared to 14% now. Thiswill imply new investments in long distance pipelines from producing to consuming regionsand significantly increased LNG trade and investments in LNG infrastructure.
One key question then is how the huge amounts of gas made available to meet the world gasdemand will be allocated between the regional consumption areas, or put in other words, towhat extent the rapid growth in gas demand in developing regions with limited gas reserves(e.g. Asia) will affect the long-term EU gas supply pattern.
90

EU GAS MARKET IN A WORLD PERSPECTIVE
Gas trade between Europe and the CIS
In the POLES model, the market shares of gas exporter on each regional market aredetermined endogenously on the basis of the production and transport costs of the various gasexporters and gas prices on the regional markets: America, Europe/Africa/Middle-East andAsia (Box 8). Moreover, the export potential of gas producers accounts for the evolution ofgas demand in the producing countries or regions.
Regional disparities in gas reserves, supply costs, prices and demand growth lead to changesover time in regional supply patterns, as reflected by the gas trade matrices. These matricesprovide information about intra- and inter-regional gas trade within and between sevenregions (Table 5.2). The level of integration of gas transport infrastructure and supply inEurope leads to consider Western, Central and Eastern Europe as one regional market,referred to in the following as “Europe”. Nevertheless, separate figures for EU’s internal andexternal supplies within the region (exclusively from Norway) are provided where possible.
Box 8: The simulation of gas trade and production
While the gas discoveries and reserves dynamics are modelled in a way that is similar to thatused for oil, the gas trade and production are simulated in a more complex process that accountsfor the constraints introduced by gas transport routes to the different markets. Three mainregional markets are considered for gas price determination, but the gas trade flows are studiedwith more detail for 14 sub-regional markets, 18 key exporters and a set of smaller gasproducers.The natural gas trade and production is modelled on the one hand on the basis of the capacitiesfrom each producer to each sub-regional market and on the other hand on the actual quantitiessupplied by each producer for the demand simulated by the model.
First the model calculates the total new capacities required by each market. Then, the projectedcapacities along the different routes depend on the gap between the price on the consideredmarket and a cost benchmark, associated to each route: the larger this gap, the higher theincentive to develop new capacities. A constraint allows limiting the possible “crowding out”effect of new entrants on the different market.
The actual capacities are then derived from projected in the previous five years period, with aconstraint ensuring that new capacities will not induce a rapid exhaustion of the availablereserves of the considered producer.
Finally the model allocates the market shares of the major exporters on each market, on thebasis of the variable transport costs on each route.
91
WETO
Natural gas supply projections in the Reference scenario show that EU external gas suppliesshould continue to arrive primarily from the CIS, Norway and North Africa (Algeria andLibya). Other sources of imports into the EU are the Middle East (mainly pipeline gas viaTurkey) and LNG from Nigeria but their combined share is not expected to exceed 10% in2020 and 5% in 2030 of imports.
The relative contribution of these core gas suppliers for the EU is however projected tochange in the next thirty years. Starting from 28% in 2000, the share of the CIS is expected toincrease steadily to reach 54% of gas requirements in Western Europe and CEEC. Thisincrease translates into a tripling of traded volumes with the CIS during the projection period.
The share of gas supplies from Africa and Middle East would reach a peak of 22% in 2020and then decrease to 15% of the European gas demand in 2030. This decrease is concerningmainly supplies from the Middle East, which are exported mostly towards Asia after 2020. Onthe contrary, the share of gas imports from Africa (mainly Algeria and Nigeria) is expected toremain stable up to 2030, ranging from 10 to 15% of Europe’s gas requirements. Twice thevolumes of gas currently imported from Africa and Middle East would be exported to Europein 2030.
Gas supplies from Norway would double over the next ten years, reaching 23% of Europeangas requirements in 2010, and then decrease slightly but constantly until 2030. For that timehorizon, imports from Norway would represent the same market share as in 2000, namely15% of the European gas market.
92

EU GAS MARKET IN A WORLD PERSPECTIVE
Table 5.2: Gas trade matrix
2000 Importingregions North Latin Europe CIS Africa, Asia Japan, Total
Exporting America America Middle East Pacific productionregions Gm3
North America 659 0 0 0 0 0 2 661
Latin America 1 116 0 0 0 0 0 117
Europe 0 0 294 0 0 0 0 294
CIS 0 0 137 521 0 0 0 658
Africa, Middle East 2 0 62 0 239 0 8 311
Asia 0 0 0 0 0 246 75 321
Japan, Pacific 0 0 0 0 0 0 41 41
Total consumption 662 116 493 521 239 246 126 2404
2010 Importingregions North Latin Europe CIS Africa, Asia Japan, Total
Exporting America America Middle East Pacific productionregions
North America 837 5 0 0 0 0 4 846
Latin America 31 187 0 0 0 0 0 218
Europe 0 0 304 0 0 0 0 304
CIS 0 0 204 613 0 5 0 822
Africa, Middle East 0 2 125 0 304 14 10 455
Asia 0 0 0 0 0 425 121 546
Japan, Pacific 0 0 0 0 0 0 63 63
Total consumption 868 194 633 613 304 444 198 3254
2030 Importingregions North Latin Europe CIS Africa, Asia Japan, Total
Exporting America America Middle East Pacific productionregions Gm3
North America 866 16 0 0 0 0 4 886
Latin America 73 372 0 0 0 62 0 507
Europe 0 0 220 0 0 0 0 220
CIS 0 0 420 1007 0 265 0 1692
Africa, Middle East 1 0 114 0 606 378 8 1107
Asia 0 0 0 0 3 187 188 378
Japan, Pacific 0 0 0 0 1 0 90 91
Total consumption 940 388 754 1007 610 892 290 4881
93

WETO
Gas demand in Asia
One key determinant of the long-term gas supply pattern of Europe (and therefore of the EU)is the fast growing gas demand in Asia, and most particularly in China and South Asia. Gasrequirements in the whole region is projected to rise at an average rate of 4.6%/year over the2000-2030 period, the highest growth among the regions. In contrast, gas production in thatregion will grow much less rapidly at 0.7%/year on average, and most of the gas produced inthe South East Asia (Indonesia and Malaysia) will continue to be traded outside the region,mainly to Japan.
As a result, Asia will switch from being a net gas exporter to a net importer around the year2020. At that time horizon, more than 300 Gm3 would be required externally to meet theregion’s gas demand; these volumes correspond to half of the total gas requirements. Theywould come mainly from the Middle East in the form of LNG (70%) and to a lesser extendfrom the CIS via pipelines (30%). In 2030, gas production is projected to decline dramaticallyin China and South Asia, resulting in the need for further external supplies, which would thenrepresent some 80% of total gas demand in Asia.
Over a thirty years’ time horizon, this evolution in Asia is similar to the projected situation inEurope, where 70% of the region’s gas demand would have to be met by external gassupplies. However, in the case of Asia, the bulk of external supplies is projected to come fromthe Middle East (70%), while in the case of Europe, it would originate principally from theCIS (77%). The significant projected gas exports from the Middle East to the Asian market, atthe expense of the European market results from model’s comparisons between supply costsfrom the CIS and the Middle East to the importing regions and between the gas prices on thetwo regional markets, namely Asia and Europe.
The export position of Asia is another noteworthy difference with Europe. The projectionsshow that Asia increases its gas imports from outside the region during he period 2000-2030,while at the same time it increases also its exports abroad. This situation can be explained bythe fact that whereas China and South Asia are net importers of gas, South East Asia is a netexporter to Japan. On the contrary, Europe would not export significant gas volumes outsidethe region.
Inter-regional gas trade
As a result of the increased dependence of most world regions on external gas supplies, inter-regional gas trade will develop considerably over the period to 2030. At the world level, inter-regional gas trade is projected to be five times larger in 2030 than in 2000. Asia is not only themajor contributor to this significant progression but it also becomes the region the mostdependent on extra-regional gas supplies. This is a fundamental change compared to thecurrent situation where Europe and Japan contribute to almost 100% of the inter-regionaltrade (Figure 5.6).
94
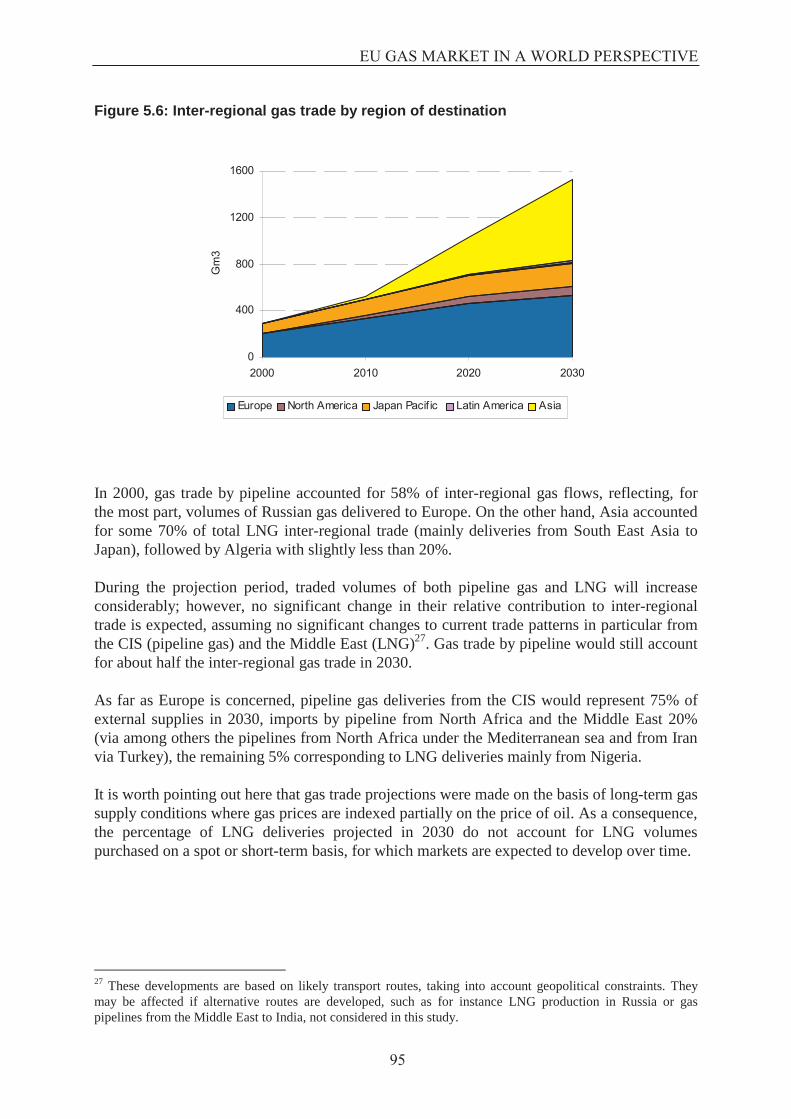
EU GAS MARKET IN A WORLD PERSPECTIVE
Figure 5.6: Inter-regional gas trade by region of destination
0
400
800
1200
1600
2000 2010 2020 2030
Gm
3
Europe North America Japan Pacif ic Latin America Asia
In 2000, gas trade by pipeline accounted for 58% of inter-regional gas flows, reflecting, forthe most part, volumes of Russian gas delivered to Europe. On the other hand, Asia accountedfor some 70% of total LNG inter-regional trade (mainly deliveries from South East Asia toJapan), followed by Algeria with slightly less than 20%.
During the projection period, traded volumes of both pipeline gas and LNG will increaseconsiderably; however, no significant change in their relative contribution to inter-regionaltrade is expected, assuming no significant changes to current trade patterns in particular fromthe CIS (pipeline gas) and the Middle East (LNG)27. Gas trade by pipeline would still accountfor about half the inter-regional gas trade in 2030.
As far as Europe is concerned, pipeline gas deliveries from the CIS would represent 75% ofexternal supplies in 2030, imports by pipeline from North Africa and the Middle East 20%(via among others the pipelines from North Africa under the Mediterranean sea and from Iranvia Turkey), the remaining 5% corresponding to LNG deliveries mainly from Nigeria.
It is worth pointing out here that gas trade projections were made on the basis of long-term gassupply conditions where gas prices are indexed partially on the price of oil. As a consequence,the percentage of LNG deliveries projected in 2030 do not account for LNG volumespurchased on a spot or short-term basis, for which markets are expected to develop over time.
27 These developments are based on likely transport routes, taking into account geopolitical constraints. Theymay be affected if alternative routes are developed, such as for instance LNG production in Russia or gaspipelines from the Middle East to India, not considered in this study.
95
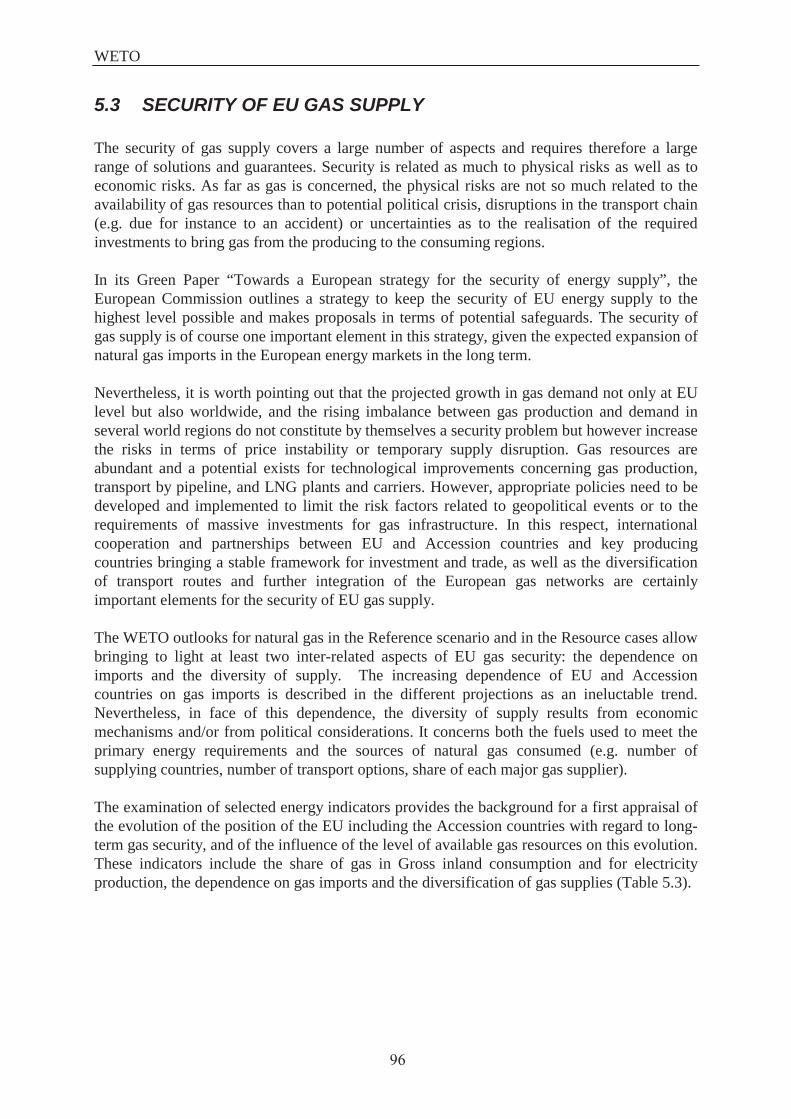
WETO
5.3 SECURITY OF EU GAS SUPPLY
The security of gas supply covers a large number of aspects and requires therefore a largerange of solutions and guarantees. Security is related as much to physical risks as well as toeconomic risks. As far as gas is concerned, the physical risks are not so much related to theavailability of gas resources than to potential political crisis, disruptions in the transport chain(e.g. due for instance to an accident) or uncertainties as to the realisation of the requiredinvestments to bring gas from the producing to the consuming regions.
In its Green Paper “Towards a European strategy for the security of energy supply”, theEuropean Commission outlines a strategy to keep the security of EU energy supply to thehighest level possible and makes proposals in terms of potential safeguards. The security ofgas supply is of course one important element in this strategy, given the expected expansion ofnatural gas imports in the European energy markets in the long term.
Nevertheless, it is worth pointing out that the projected growth in gas demand not only at EUlevel but also worldwide, and the rising imbalance between gas production and demand inseveral world regions do not constitute by themselves a security problem but however increasethe risks in terms of price instability or temporary supply disruption. Gas resources areabundant and a potential exists for technological improvements concerning gas production,transport by pipeline, and LNG plants and carriers. However, appropriate policies need to bedeveloped and implemented to limit the risk factors related to geopolitical events or to therequirements of massive investments for gas infrastructure. In this respect, internationalcooperation and partnerships between EU and Accession countries and key producingcountries bringing a stable framework for investment and trade, as well as the diversificationof transport routes and further integration of the European gas networks are certainlyimportant elements for the security of EU gas supply.
The WETO outlooks for natural gas in the Reference scenario and in the Resource cases allowbringing to light at least two inter-related aspects of EU gas security: the dependence onimports and the diversity of supply. The increasing dependence of EU and Accessioncountries on gas imports is described in the different projections as an ineluctable trend.Nevertheless, in face of this dependence, the diversity of supply results from economicmechanisms and/or from political considerations. It concerns both the fuels used to meet theprimary energy requirements and the sources of natural gas consumed (e.g. number ofsupplying countries, number of transport options, share of each major gas supplier).
The examination of selected energy indicators provides the background for a first appraisal ofthe evolution of the position of the EU including the Accession countries with regard to long-term gas security, and of the influence of the level of available gas resources on this evolution.These indicators include the share of gas in Gross inland consumption and for electricityproduction, the dependence on gas imports and the diversification of gas supplies (Table 5.3).
96
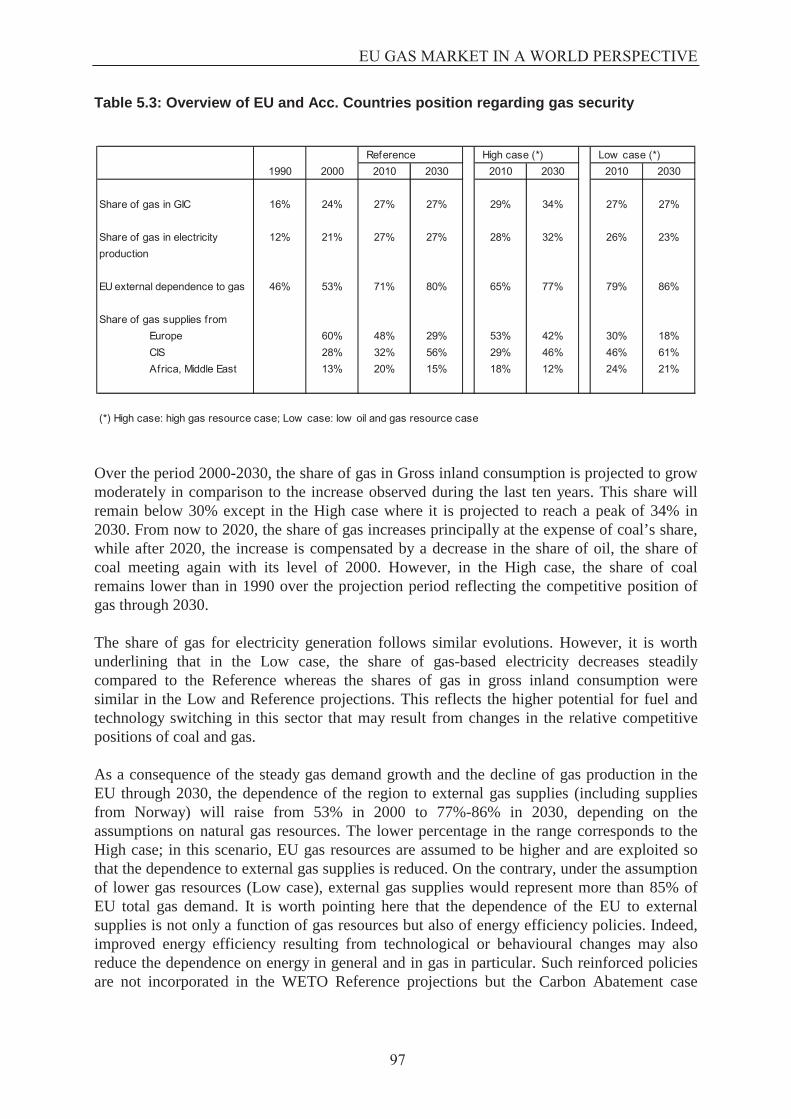
EU GAS MARKET IN A WORLD PERSPECTIVE
Table 5.3: Overview of EU and Acc. Countries position regarding gas security
Reference High case (*) Low case (*)1990 2000 2010 2030 2010 2030 2010 2030
Share of gas in GIC 16% 24% 27% 27% 29% 34% 27% 27%
Share of gas in electricity 12% 21% 27% 27% 28% 32% 26% 23%production
EU external dependence to gas 46% 53% 71% 80% 65% 77% 79% 86%
Share of gas supplies fromEurope 60% 48% 29% 53% 42% 30% 18%CIS 28% 32% 56% 29% 46% 46% 61%Africa, Middle East 13% 20% 15% 18% 12% 24% 21%
(*) High case: high gas resource case; Low case: low oil and gas resource case
Over the period 2000-2030, the share of gas in Gross inland consumption is projected to growmoderately in comparison to the increase observed during the last ten years. This share willremain below 30% except in the High case where it is projected to reach a peak of 34% in2030. From now to 2020, the share of gas increases principally at the expense of coal’s share,while after 2020, the increase is compensated by a decrease in the share of oil, the share ofcoal meeting again with its level of 2000. However, in the High case, the share of coalremains lower than in 1990 over the projection period reflecting the competitive position ofgas through 2030.
The share of gas for electricity generation follows similar evolutions. However, it is worthunderlining that in the Low case, the share of gas-based electricity decreases steadilycompared to the Reference whereas the shares of gas in gross inland consumption weresimilar in the Low and Reference projections. This reflects the higher potential for fuel andtechnology switching in this sector that may result from changes in the relative competitivepositions of coal and gas.
As a consequence of the steady gas demand growth and the decline of gas production in theEU through 2030, the dependence of the region to external gas supplies (including suppliesfrom Norway) will raise from 53% in 2000 to 77%-86% in 2030, depending on theassumptions on natural gas resources. The lower percentage in the range corresponds to theHigh case; in this scenario, EU gas resources are assumed to be higher and are exploited sothat the dependence to external gas supplies is reduced. On the contrary, under the assumptionof lower gas resources (Low case), external gas supplies would represent more than 85% ofEU total gas demand. It is worth pointing here that the dependence of the EU to externalsupplies is not only a function of gas resources but also of energy efficiency policies. Indeed,improved energy efficiency resulting from technological or behavioural changes may alsoreduce the dependence on energy in general and in gas in particular. Such reinforced policiesare not incorporated in the WETO Reference projections but the Carbon Abatement case
97

WETO
discussed in Chapter 6 provides an insight as to the impact improved energy efficiency mayhave on the external gas dependence of the EU.
Finally, the Reference scenario and the Resource cases show contrasted gas supply patterns.Although in all above projections, the CIS is expected to be the lead gas supplier of the EUcountries in 2030, its contribution may vary from 46% in the High case to slightly more than60% in the Low case. The major difference between the cases rests mainly on the respectiveshares of the CIS and Europe (including Norway) in total gas supply. In the High case, theshares are comparable (around 44%), whereas, in the Low case, the share of CIS is more thanthree times the share of Europe. On the other hand, supply countries located in Africa and inthe Middle East would represent no more than 20% of gas demand in EU and Accessioncountries.
Key conclusions
� The EU gas market is rapidly expanding and growth is expected to continue in thenext two decades. The expansion of gas in the EU is determined principally by thesurge of gas use for power generation. Nevertheless, the EU contribution to world gasconsumption is expected to decrease steadily.
� World gas reserves are abundant but concentrated in two world regions, the CIS andthe Middle East, where gas production is projected to grow considerably during thenext thirty years. In contrast, the European gas resources are limited and productionis expected to decline steadily beyond 2010, resulting in an increasing dependence onexternal gas supplies.
� Natural gas demand is also projected to increase in the other world regions: some ofthem with limited or declining gas reserves are expected to become net importersleading to modification of the world gas trade patterns. For instance, the rapid gasdemand growth in Asia is expected to have some influence on the EU gas supplypattern in 2030: while Asia is projected to rely predominantly on gas supplies fromthe Middle East, the EU and Accession countries should import more than half itsnatural gas needs from the CIS region at the horizon of 2030.
� This outcome may translate into higher supply risks for the EU. These risks couldhowever be limited through different actions as outlined in the European CommissionGreen Paper, like the multiplication of gas transport routes, the further integration ofthe European gas network, and a continuous dialogue with gas producing countries.Long-term contractual LNG supplies are projected to move up but more moderatelyand from more diverse sources from Africa and the Middle East.
98

CHAPTER 6
IMPACTS OF CLIMATE CHANGE POLICIES
In the Reference scenario it is assumed that CO2 emissions, the predominant greenhouse gasemitted by human activities, occur without complying necessarily with the reductioncommitments of the Kyoto Protocol. This key assumption leaves aside the hypothesis of theemergence of policy regimes on climate change mitigation. Negotiations on this regime havefilled the international environmental agenda in recent years and many countries have alreadyintroduced measures in order to limit the amount of greenhouse gas emitted. In the comingyears, more countries are expected to adopt climate change mitigation policies, with the entryinto force of the Kyoto Protocol.
If future climate change policies do effectively limit the expected increase in greenhouse gasemissions at world level or even reduce them in the industrialised world, then the globalenergy system will experience major changes. One would expect on the one hand, importantconsequences on energy consumption and, on the other hand, significant shifts in the primaryand final energy mix. These shifts would indeed correspond to a lower use of carbon intensivesources and technologies and, conversely, to a more rapid development of low carbon powergeneration and renewable energy technologies. Other technologies, as carbon sequestration,could also emerge; they have however not been taken into account in this study. The purposeof this chapter is to illustrate the main consequences for the global energy system of such acarbon constrained alternative.
6.1 INTERNATIONAL AGREEMENTS
Increasing scientific evidence of human interference with the climate system began to pushclimate change onto the political agenda in the mid-1980s. In 1990, the IntergovernmentalPanel on Climate Change established by the United Nations issued its First AssessmentReport, confirming that climate change was indeed a threat and calling for a global treaty toaddress the problem. This call, translated into the United Nations Framework Convention onClimate Change (UNFCCC), opened to signature in the 1992 “Earth Summit” in Rio deJaneiro. The Convention entered into force in 1994 and counts, a decade after its adoption,186 governments (including the European Community) as Parties.
The ultimate objective of the UNFCCC is to achieve the “stabilization of greenhouse gasconcentrations in the atmosphere at a level that would prevent dangerous anthropogenicinterference with the climate system” (Art.2). The Convention does not define what levelsmight be “dangerous”, although it does state that ecosystems should be allowed to adaptnaturally, that food supply should not be threatened, and that economic development shouldbe able to proceed in a sustainable manner. No concentration target is thus defined but arecommendation for a stabilisation by 2000 of the greenhouse gas emissions in theindustrialised countries was adopted.
The rising trend in world emissions called for more action in the direction of the Conventionobjective. International negotiations continued and in December 1997 the Kyoto Protocol to
99

WETO
UNFCCC was adopted. The most striking element of this Protocol is that most industrialisedcountries accepted that the average emissions over the 2008-2012 period for a country shouldnot exceed a given amount, defined as a percentage of the country greenhouse gases emissionsin the base year, i.e. 1990 for most countries. The list of countries with their emission targetappears in Annex B to the Kyoto Protocol. The emission limitation covers a basket of sixdifferent greenhouse gases, i.e. carbon dioxide (CO2), methane (CH4), nitrous oxide (N2O),hydro-fluorocarbons (HFCs), perfluorocarbons (PFCs) and sulphur hexafluoride (SF6). Asdefined in Kyoto, the aggregate commitments in terms of emission reduction should lead to adecrease in the aggregate emissions of the Annex B countries of 5 % from the 1990 level,during the first commitment period, i.e. from 2008 to 2012. The list of commitments isreminded in Box 8 and includes EU countries targets within the EU “burden sharingagreement”.
In meeting their commitments, countries that adopted targets may use several policy options.The most straightforward option is to reduce domestically the greenhouse gas emissions.However, the Protocol also contains other options, mainly inspired by the concept offlexibility in the abatement policies and by the corresponding cost reduction opportunities.
First, the Protocol recognises the principle of carbon absorption in the biosphere as a way tocompensate for greenhouse gases emissions. Countries are allowed to take into account theabsorption of greenhouse gases by their biosphere resources, as long as this capture isadditionally induced by human activities. This option is referred to as ‘sinks’ activities.Additional carbon capture in the biosphere could indeed be less expensive than domesticemission reduction, however the temporary nature of the capture increases the risk of thisoption from both the economic and environmental point of view.
Second, the Protocol introduces three flexible mechanisms to take advantage of the costdifferences for emission reductions between countries. The International Emission Trading(IET) scheme allows countries that emit more greenhouse gas than their total allowances tobuy emission allowances from other countries that reduce their emissions beyond theircommitment. The two other mechanisms are project-based and referred to as JointImplementation (JI) and Clean Development Mechanism (CDM). Under both mechanisms, aninvestor (public or private) from a country with a commitment may obtain carbon credits fromthe implementation of a project in another country member of the Protocol. Provisions onJoint Implementation concern projects in Annex B countries, particularly those undergoing atransition to a market economy, and the Clean Development Mechanism involves countriesthat did not adopt commitments in Kyoto.
At the time of its adoption, the Kyoto Protocol left a number of implementation mattersundecided. The flexible mechanisms, sinks and compliance provisions were agreed upon inprinciple but their operational guidelines still needed to be defined. The modalities of themonitoring, reporting and verification systems necessary to assure compliance and thebanking provisions for different types of emission allowances also remained to be discussed.The principle of sinks enhancement was accepted but the list of eligible sinks activities andthe extent of their use was still undecided.
All these unresolved issues led the countries that adopted targets to delay their ratification ofthe agreement. On their side, developing countries demanded more concrete rules on how the
100

IMPACTS OF CLIMATE CHANGE POLICIES
developed countries would assist them in the adaptation to the adverse consequences ofclimate change. It took the negotiating countries nearly four years to decide upon theseextended guidelines and to make the text on the different instruments of the Kyoto Protocoloperational. The rulebook has been completed in November 2001 and is referred to as theMarrakech Accords.
Box 9: Kyoto Protocol emissions targets and EU burden sharing
Country Target (1990����-2008/2012)EU-15, Bulgaria, Czech Republic, Estonia,Latvia, Liechtenstein, Lithuania, Monaco,Romania, Slovakia, Slovenia, Switzerland
-8 %
United States -7 %Canada, Hungary, Japan, Poland -6 %Croatia -5 %New Zealand, Russian Federation, Ukraine 0Norway +1 %Australia +8 %Iceland +10 %
Country Target (1990-2008/2012)Luxembourg -28 %Denmark, Germany -21 %Austria -13 %United Kingdom -12.5 %Belgium -7.5 %Italy -6.5 %The Netherlands -6 %Finland, France 0Sweden +4%Ireland +13 %Spain +15 %Greece +25 %Portugal +27 %
The Kyoto Protocol will enter into force only if 55 countries ratify the treaty and if thesecountries account for at least 55 % of the 1990 CO2 emissions of those industrialised countrieslisted in the Annex I of the UNFCCC. The limit of 55 ratifications, including ratification fromthe EU and Japan, has been attained but the second necessary condition is more difficult tofulfil since the United States of America, in spite of their ratification of the Convention, haveofficially declared in February 2001 that they have no intention to ratify the Kyoto Protocol.
� Some economies in transition have a base year other than 1990.
101

WETO
6.2 A CO2 EMISSION ABATEMENT CASE FOR 2030
Rationale and definition
In order to explore the long-term consequences for the energy sector of greenhouse emissionconstraints at world level, a Carbon Abatement case (CA) has been developed up to the 2030horizon. Its aim is to describe a reasonable hypothesis for the development of CO2 emissions,while taking into account the different regions’ consent to commit themselves in medium-term reductions and the expected reinforcement of climate change policies beyond the year2010.
The CA case is designed through the introduction of a value for CO2 emissions within thePOLES model, a method that impacts, in theory, identically as the introduction of regionaltaxes on CO2 emissions or as a system of CO2 permits within a world emission tradingsystem. The CA case is defined so as to reach a level of CO2 emissions in 2030 that iscomparable to the emissions projected in the “B1” scenario28 of the IPCC projections (IPCC,2001). The IPCC integrated assessment analysis indicates that this type of emission profileassumes the implementation of sustainable development policies in a large amount of sectorsof the economy. Such an emission path lies at the upper end of an emission control strategythat would remain compatible with an objective of stabilisation of greenhouse gasconcentration around 550 ppmv (twice the pre-industrial concentration) by the end of thiscentury and a global temperature rise of no more than 2°C relative to the year 1850.
In order to take into account the commitments of the industrialised countries for the Kyotoperiod, the carbon value is differentiated by main regions up to 2010. For Western Europe andthe Accession countries a value of 13.5 €/tCO2
29 is chosen, a lower value (5.5 €/tCO2) beingapplied to the other countries that accepted a commitment. No carbon value applies to the CIS- that remains below its target without the implementation of any carbon constraint - and tocountries without commitments until 2010. As a consequence, these countries follow the CO2emissions trends projected in the Reference until 2010. Between 2010 and 2030 and in orderto meet an emission path that remains compatible both with the global concentration targetand with long-term EU indicative emission targets30, a 60 €/tCO2 carbon value is thenimplemented in Western Europe and the Accession countries whereas a value of 30 €/tCO2applies to the other world regions.
To some extent, the CA case describes a world in which Europe is ahead of the othercountries in terms of climate policy. This also means however that the abatement costsaccepted are higher, as indicated by the level of the carbon value that is twice the level of theother world regions.
28 The “B1 family” of scenarios projects world CO2 emissions from fossil fuel and industrial processes in 2030 ofabout 41 GtCO2 per year.29 To have the price in €/tC, the figures must be multiplied by 3.66.30 From the 6th Environment Action Programme (COM(2001)31), these targets come out as an average emissionreduction rate of 1 %/year.
102

IMPACTS OF CLIMATE CHANGE POLICIES
World energy demand and CO2 emissions
The major changes in world energy-related CO2 emissions, total energy consumption and fuelswitching as resulting from the above-defined alternative case are illustrated in Table 6.1.
Table 6.1: World energy demand and CO2 emissions
The carbon value leads to the achievement of a reduction of about 9 GtCO2 compared to theReference, i.e. a decrease of 21 %. Nevertheless, both cases project an increase in world CO2
emissions in 2030 compared to the 1990 level. The average growth between 1990 and 2030 isprojected to be 1.3 %/year in the CA case compared to 1.9 %/year in the Reference. It is worthunderlying here that the environmental impact of the CA case depends only on the totalreduction at world level, while the changes in world energy consumption patterns depend onthe reductions implemented at the regional level.
The results of the CA case show that the projected reduction by 21 % of world CO2 emissionscompared to the Reference comes in equal parts, on the one hand from the reduction in energydemand and on the other hand from the decrease in the carbon intensity of the totalconsumption – which is the result of drastic changes in the world energy mix. The total energydemand decreases from 17.1 Gtoe to 15.2 Gtoe. This reduction needs to be examined in thelight of the projected increase of the total consumption from about 8.7 Gtoe in 1990. It alsoshows that both actions on the energy system, i.e. the slowdown in energy demand growth andthe changes in the primary fuel mix, are necessary to achieve significant CO2 emissionreductions.
The 11 % reduction in the carbon intensity of the world total consumption in the CA casereflects the opportunities for fuel substitution in the energy system. As expected, the carbonvalue affects primarily the fuels with the greatest carbon content, namely coal (-42 %) and oil(-8 %). Natural gas is not affected as the downward pressure on gas consumption iscompensated by gas-to-coal substitutions; the market shares lost by coal and oil arecompensated with nuclear (increase of 36 %) and renewable energies31, which increase by 35% on average over the projection period. Within the renewable, a 20-fold increase for wind,solar and small hydro is expected.
Impacts on regional energy demand and CO2 emissions
The decrease in the emissions from the EU and Accession countries is greater than the worldaverage (see Table 6.2): 0.4 %/year until 2010 and 0.6 %/year beyond. In 2030, some 1.2
31 Biomass, wind, solar, small hydro, large hydro, geothermal and wastes are here included into the renewables.
1990 Ref 2030 CA 2030 % Change CA-Ref
CO2 emissions (GtCO2) 20.8 44.5 35.3 -21 %Total consumption (Gtoe) 8.7 17.1 15.2 -11 %
Coal, lignite (Gtoe) 2.2 4.7 2.7 -42 %Oil (Gtoe) 3.1 5.9 5.4 -8 %Natural gas (Gtoe) 1.7 4.3 4.3 0 %Nuclear (Gtoe) 0.5 0.9 1.2 36 %Renewable (Gtoe) 1.1 1.4 1.8 35 %
103

WETO
GtCO2 emissions of annual emissions are avoided and this brings the enlarged EU toemissions level nearly 15% lower than the 1990 level. The decrease in the carbon intensity ofthe total consumption (12 %) is in the range of the world reduction. As it is the case at theworld level, the emission reductions come in the enlarged EU in equal parts from thereduction in energy demand and from the decrease in the carbon intensity of the totalconsumption.
Table 6.2: Energy demand and CO2 emissions in EU and Accession countries
1990 Ref 2030 CA 2030 % Change CA-Ref
CO2 emissions (GtCO2) 4.1 4.7 3.5 -26 %Total consumption (Mtoe) 1608 2000 1759 -12 %
Coal, lignite 449 387 151 -61 %Oil 626 727 635 -13 %Natural gas 262 546 527 -3 %Nuclear 198 238 322 35 %Renewable 64 122 191 56 %
Changes in the fossil fuels mix of total energy consumption in the EU and Accessioncountries are similar to the world pattern. However, as the carbon value is higher in thisregion, more pronounced changes are projected. The reduction of coal consumption is thelargest of all regions in relative terms (-61 %) and the decrease in oil demand is alsosignificant (-13 %). The decrease in supply from these sources is compensated for with nuclearand renewable energy. Demand for natural gas is not significantly changed by the carbonvalue.
In the other world regions, the carbon value induces a slowdown in CO2 emissions and energyconsumption growth everywhere, but this is more significant in regions with the highestenergy intensity. For instance, the decrease in Japan is rather limited compared to the impactsin other regions.
In the Japan and Pacific region (see Table 6.3), the reduction in demand for coal iscompensated for by renewable, nuclear and natural gas. Demand for oil decreases slightly.
Table 6.3: Energy demand and CO2 emissions in the Japan and Pacific region
1990 Ref 2030 CA 2030 % Change CA-Ref
CO2 emissions (GtCO2) 1.4 1.8 1.5 -14 %Total consumption (Mtoe) 537 812 766 -6 %
Coal, lignite 111 160 95 -41 %Oil 291 291 282 -3 %Natural gas 61 188 197 5 %Nuclear 51 135 142 5 %Renewable 25 45 62 39 %
104

IMPACTS OF CLIMATE CHANGE POLICIES
The largest changes in CO2 emissions occur in Asia and in North America, with reductions of4.1 and 2.1 GtCO2 respectively (see Tables 6.4 and 6.5), in spite of relatively low carbon valuein the CA case. From one scenario to the other, Asia and North America both experiencesimilar reductions in their emissions by 2030 in relative terms, with about –22 %. Theseregions also experience the highest percentage of reduction in the carbon intensity of energyconsumption with about 12 % decrease in 2030, compared to the Reference: this is largely dueto the important reductions in coal use in these two regions.
Table 6.4: Energy demand and CO2 emissions in Asia
1990 Ref 2030 CA 2030 % Change CA-Ref
CO2 emissions (GtCO2) 4.1 18.5 14.4 -22 %Total consumption (Mtoe) 1736 6369 5604 -12 %
Coal, lignite 709 2698 1649 -39 %Oil 371 2175 2042 -6 %Natural gas 74 856 1025 20 %Nuclear 23 160 304 90 %Renewable 553 521 694 33 %
The most significant changes in the fuel mix in Asia are the rapid development of nuclear anda higher gas penetration. The increase in renewable results from growth in wind, solar andsmall hydro energy and also from an increase in biomass energy, as the use of modernbiomass now compensates for the decrease in traditional biomass.
North America experiences a large decrease in coal demand and a significant development ofrenewable and nuclear (Table 6.5).
Table 6.5: Energy demand and CO2 emissions in North America
1990 Ref 2030 CA 2030 % Change CA-Ref
CO2 emissions (GtCO2) 5.3 8.0 6.1 -23 %Total consumption (Mtoe) 2202 3082 2715 -12 %
Coal, lignite 484 859 446 -48 %Oil 849 1004 930 -7 %Natural gas 571 836 815 -2 %Nuclear 173 225 291 29 %Renewable 100 172 273 59 %
The CIS sees its emissions reduced by 18 % and remains below its 1990 level (Table 6.6). Inthis region, emissions reduction comes primarily from reduction in energy demand as largepotentials for energy efficiency still exist. However, the decrease in the carbon intensity of thetotal consumption is lower than the world average, namely 7 % over the projection period. Asno carbon value is applied before 2010 in this region, it remains therefore with a relativelyhigh level of carbon intensity and the large potential for decrease is not entirely exploited bythe end of the projection.
105

WETO
Table 6.6: Energy demand and CO2 emissions in the CIS
1990 Ref 2030 CA 2030 % Change CA-Ref
CO2 emissions (GtCO2) 3.6 3.5 2.8 -18 %Total consumption (Mtoe) 1356 1465 1305 -11 %
Coal, lignite 289 146 80 -45 %Oil 415 303 257 -15 %Natural gas 560 897 800 -11 %Nuclear 54 76 78 3 %Renewable 42 45 116 161 %
In the Africa and Middle East region (Table 6.7), the emissions reduction also comesprimarily from a reduction in energy demand, as the projected fuel mix of this region in theReference is based more on oil and gas than on coal. Thus the decrease in the carbon intensityof the total consumption is lower than the world average and the changes in fuel mix are morelimited than in most other regions.
Table 6.7: Energy demand and CO2 emissions in Africa and the Middle East region
1990 Ref 2030 CA 2030 % Change CA-Ref
CO2 emissions (GtCO2) 1.2 4.7 3.9 -16 %Total consumption (Mtoe) 620 1762 1566 -11 %
Coal, lignite 78 378 248 -34 %Oil 240 690 614 -11 %Natural gas 109 526 513 -3 %Nuclear 2 6 7 15 %Renewable 188 170 213 26 %
In Latin America also (Table 6.8), the decrease in the carbon intensity of the totalconsumption is lower than the world average and the emissions reduction comes primarilyfrom a reduction in energy demand. Nuclear power develops rapidly in relative terms and theincrease in renewable - although greater than nuclear in absolute terms – is relatively modestin comparison to other regions.
Table 6.8: Energy demand and CO2 emissions in Latin America
1990 Ref 2030 CA 2030 % Change CA-Ref
CO2 emissions (GtCO2) 0.9 2.7 2.5 -9 %Total consumption (Mtoe) 454 1251 1186 -5 %
Coal, lignite 20 58 31 -46 %Oil 239 605 571 -6 %Natural gas 76 345 323 -6 %Nuclear 3 14 23 60 %Renewables 99 232 248 7 %
106

IMPACTS OF CLIMATE CHANGE POLICIES
Sectoral energy demand
The decrease in final energy demand in the CA case relative to the Reference (-9 %) is slightlylower than the reduction of the world total energy demand (-11 %). The carbon constraintresults in a lower final energy demand in all sectors, however, the largest reductions occur inindustry (-14 %), followed by households, service and agriculture (-8 %) (Table 6.9).Reductions in energy demand for transport are the lowest with 4 %. This result is easilyexplained by structural differences in sectoral tax regimes that occur in most regions. Indeed,when the carbon value applies uniformly on all sectors in relation with their carbon content,the average fuel price in industry increases more than in the household sector and significantlymore than in transport where tax levels are already very high. Moreover, industry is the finalsector, which relies the most on coal so that it can react to the carbon value both by energydemand reductions and by switching to lower carbon intensity fuels. Transport emissionreductions are also projected to be more limited than in the other sectors as fuel andtechnology alternatives remain more expensive.
Table 6.9: Sectoral energy demand
Gtoe Ref 2030 CA 2030 % change
Final energy demand 12.1 11.0 -9 %Industry 4.3 3.7 -14 %Transport 2.8 2.7 -4 %Household, Service, Agriculture 5.0 4.6 -8 %
Power generation technologies
In a context where electricity demand grows at an annual rate twice the growth of final energyconsumption and where power generation technologies with very different carbon content arecurrently competing, the carbon value also results in significant substitutions among fuels andtechnologies. Table 6.10 shows the effect of the carbon value on electricity generation for theworld and the EU and Accession countries.
Table 6.10: Electricity generation
TWh Ref 2030 CA 2030 % Change
World 34700 31200 -10 %EU and Accession countries 4350 3940 -9 %
Figure 6.1 shows the change in the fuel mix for electricity generation. In relative terms, thelargest impact is for renewable sources: wind (2.7 fold increase), solar (two-fold increase) andsmall hydro (+60 %). In absolute terms however, the most significant changes occur fornuclear and combined heat and power (CHP), while thermal production decreasessignificantly.
107
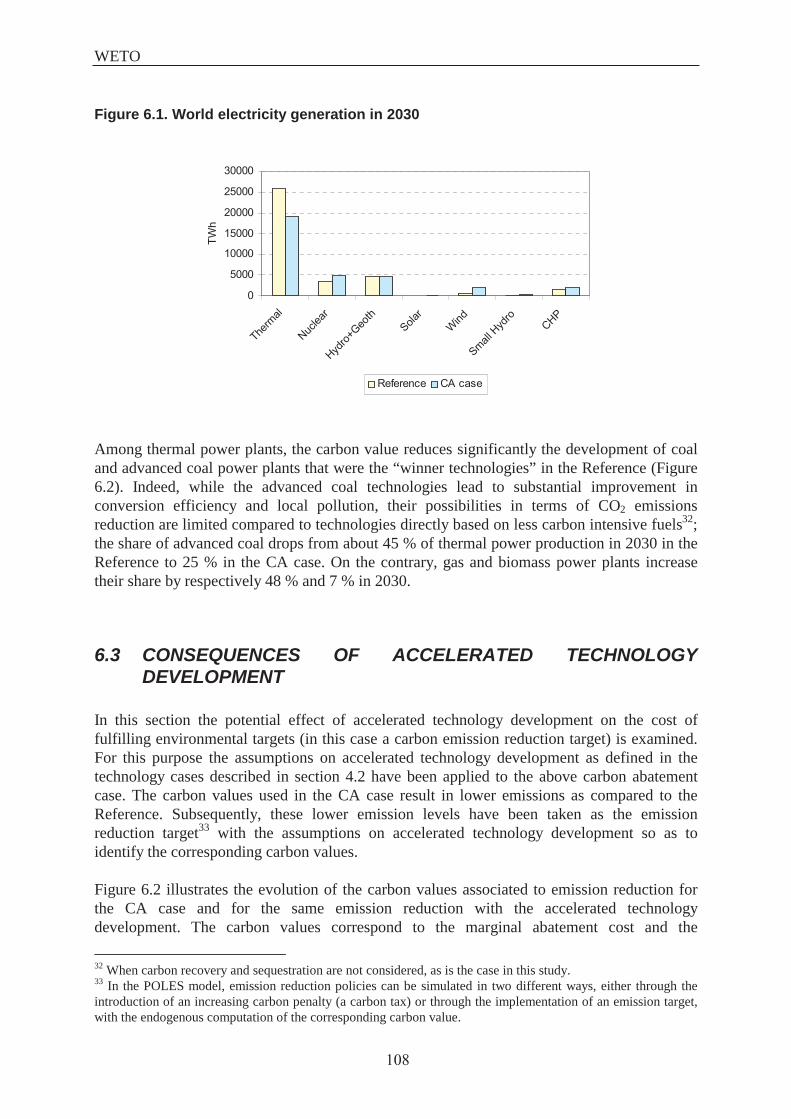
WETO
Figure 6.1. World electricity generation in 2030
0
5000
10000
15000
20000
25000
30000
Therm
al
Nuclea
r
Hydro+
Geoth
Solar
Wind
SmallHyd
roCHP
TWh
Reference CA case
Among thermal power plants, the carbon value reduces significantly the development of coaland advanced coal power plants that were the “winner technologies” in the Reference (Figure6.2). Indeed, while the advanced coal technologies lead to substantial improvement inconversion efficiency and local pollution, their possibilities in terms of CO2 emissionsreduction are limited compared to technologies directly based on less carbon intensive fuels32;the share of advanced coal drops from about 45 % of thermal power production in 2030 in theReference to 25 % in the CA case. On the contrary, gas and biomass power plants increasetheir share by respectively 48 % and 7 % in 2030.
6.3 CONSEQUENCES OF ACCELERATED TECHNOLOGYDEVELOPMENT
In this section the potential effect of accelerated technology development on the cost offulfilling environmental targets (in this case a carbon emission reduction target) is examined.For this purpose the assumptions on accelerated technology development as defined in thetechnology cases described in section 4.2 have been applied to the above carbon abatementcase. The carbon values used in the CA case result in lower emissions as compared to theReference. Subsequently, these lower emission levels have been taken as the emissionreduction target33 with the assumptions on accelerated technology development so as toidentify the corresponding carbon values.
Figure 6.2 illustrates the evolution of the carbon values associated to emission reduction forthe CA case and for the same emission reduction with the accelerated technologydevelopment. The carbon values correspond to the marginal abatement cost and the
32 When carbon recovery and sequestration are not considered, as is the case in this study.33 In the POLES model, emission reduction policies can be simulated in two different ways, either through theintroduction of an increasing carbon penalty (a carbon tax) or through the implementation of an emission target,with the endogenous computation of the corresponding carbon value.
108

IMPACTS OF CLIMATE CHANGE POLICIES
hypothetical price that carbon emissions permits would reach in a perfect market for thesepermits were established. Even if the values shown in Figure 6.2 are marginal and not totalcost and do not incorporate all costs and benefits of the respective case, the followingcomments can be made:
- The accelerated technological development can have considerable impact on thecosts of meeting environmental targets. Marginal abatement costs are reduced byup to approximately one third for the technology cases.
- The nuclear scenario produces in the long run (up to 2030) the lowest carbonvalues. Results by region � not provided here by sake of conciseness � show thatcost reductions are more marked in OECD countries, which are better placed tobenefit from the technologies concerned.
- The renewable scenario, mainly involving non-fossil fuel technologies also has aconsiderable effect, offering cheap alternative possibilities to fulfil the carbonemission reduction target. Moreover, for the medium term (until 2020) thisscenario is the one offering the cheapest opportunities. The impact of therenewable scenario is smaller for the EU since the potential (especially for windenergy) is limited and already used to a large extent in the case withoutaccelerated technology development.
- The clean coal scenario yields carbon values to fulfil the carbon emission targetthat are sometimes even a little bit higher than the CA Case. This is due to thepresence of cheaper coal-based technologies that make comparatively moreexpensive to renounce to use coal as a primary energy source and, in particular,to produce electricity. However, the total costs corresponding to this scenariowould be lower (due to the benefits embedded in the technology case).
- The gas scenario shows less effect on the carbon value than one might expect.Gas technology is already intensively used in the carbon abatement case withoutaccelerated technology development. The higher penetration of gas technologyin the Gas case offers cheaper opportunities to generate electricity but these areoffset by the higher demand caused by lower gas34 and electricity prices.
34 The Gas case assume higher global natural gas reserves which lead to lower gas prices (see scenario definitionin chapter 4.2.1 ).
109

WETO
Figure 6.2: The role of technology to reduce marginal abatement costs
2010 2020 2030 2040
Marginal abatement cost [€/tCO2
�
10
20
30
40
50
60
70
Coal case (EU) Gas case (EU)
Renewable case (EU)
Nuclear case (EU)
Coal case (Rest of the world)Gas case (Row)
Renewable case (Row)Nuclear case (Row)
Carbon Abatement Case(EU)
Carbon Abatement Case(Rest of the world)
Key conclusions
With a carbon value on the fossil fuel use, CO2 emissions in 2030 are 21 % lowerthan in the Reference. At the world level and in most regions, this reduction isequally achieved by a reduction in energy demand and by a decrease in the carbonintensity of energy consumption.
More than half of the world energy demand reduction is achieved in the industrysector.
The decrease in the carbon intensity comes mainly from substitutions away from coaland lignite and to a lesser extent from oil; gas demand remains roughly stable as fuelswitching in favour of gas takes place. In contrast, the consumption of biomassincreases significantly, nuclear progresses considerably, large hydro and geothermalremains stable; finally, wind, solar and small hydro jumps up by a factor 20.
Accelerated technology development can have a considerable impact on the cost toachieve emission reductions.
110

DEFINITION OF REGIONS
WORLD BREAKDOWN INTO 7 REGIONS IN WETO1
Western Europe: Austria, Belgium, Cyprus,Denmark, Finland, France, Germany, Greece,Iceland, Ireland, Italy, Luxembourg, Malta,Netherlands, Norway, Portugal, Spain, Sweden,Switzerland, Turkey, United Kingdom
CEEC, CIS2:
CEEC (Central and Eastern EuropeanCountries): Albania, Bosnia-Herzegovina,Bulgaria, Croatia, Czech Republic, Estonia,Hungary, Latvia, Lithuania, Macedonia, Poland,Romania, Serbia & Montenegro, SlovakRepublic, Slovenia
CIS (Community of Independent States):Armenia, Azerbaijan, Belarus, Georgia,Kazakhstan, Kyrgyz Rep., Moldova, Russia,Tajikistan, Turkmenistan, Ukraine, Uzbekistan
North America: USA, Canada
1 The POLES model identifies thirty-eight world regions orcountries, of which the 15 countries of the European Union andthe largest countries (USA, Canada, Japan, China, India, Brazil,etc…).
2 This composite region is used because of lack of data bycountry for countries of the Former Soviet Union before 1992.
Latin America: Central America (including
Mexico), South America and Caribbean
Japan, Pacific: Japan, Australia, New Zealand,Papua New Guinea, Fiji, Kiribati, Samoa (Western),Solomon Islands, Tonga, Vanuatu
Asia: Afghanistan, Bangladesh, Bhutan, Brunei,Cambodia, China, Hong-Kong, India, Indonesia,Lao, Macao, Malaysia, Maldives, Myanmar,Mongolia, Nepal, North Korea, Pakistan,Philippines, Thailand, Singapore, South Korea, SriLanka, Taiwan, Vietnam.
Africa, Middle East:
Africa: North Africa (Algeria, Tunisia,
Morocco, Libya, Egypt) and Sub-Saharian
Africa
Middle East: Bahrain, Iran, Iraq, Israel, Jordan,Kuwait, Lebanon, Oman, Qatar, Saudi Arabia,Syria, United Arab Emirates, Yemen
111

OTHER REGIONS
EU (European Union): Austria, Belgium, Denmark, Finland, France, Germany, Greece,Ireland, Italy, Luxembourg, Netherlands, Portugal, Spain, Sweden, United Kingdom
Other Western Europe: Iceland, Switzerland, Norway, Turkey
Accession Countries: Bulgaria, Cyprus, Czech Republic, Estonia, Hungary, Latvia,Lithuania, Malta, Poland, Romania, Slovak Republic, Slovenia
OECD: Australia, Austria, Belgium, Canada, Czech Republic, Denmark, Finland, France,Germany F.R., Greece, Hungary, Iceland, Ireland, Italy, Japan, Luxembourg, Mexico,Netherlands, New Zealand, Norway, Poland, Portugal, Spain, Slovak Republic, South Korea,Sweden, Switzerland, Turkey, United Kingdom, USA
OPEC (Organisation of Petroleum Exporting Countries): Venezuela, Nigeria, Indonesia,Algeria, Libya, Saudi Arabia, United Arab Emirates, Iraq, Iran, Kuwait, Qatar
OPEC Middle East: Saudi Arabia, United Arab Emirates, Iraq, Iran, Kuwait, and Qatar
Gulf: Bahrain, Iran, Iraq, Kuwait, Oman, Qatar, Saudi Arabia, United Arab Emirates, Yemen
112

LIST OF ACRONYMS AND ABBREVIATIONS
€ Euro at 1999 prices (=US$ at 1995 prices)AAU Assigned Amount UnitsAcc. Countries Accession countries (to the European Union)BfP Bureau Federal du Plan (Belgium)bl BarrelCA Carbon Abatementcap CapitaCC Combined cycleCDM Clean Development MechanismsCEEC Central and Eastern European CountriesCEPII Centre d’Etudes Prospectives et d’Informations InternationalesCER Certified Emission ReductionCHP Combined heat and powerCIS Community of Independent States (1)
Cum CumulativeDG Directorate GeneralEU, EU 15 European Union (15 countries) (1)
GDP
C Gross Inland Consumption (=primary energy consumption or TotalPrimary Energy Supply)
Gm3 Million cubic meterGt Billion of tonsGTCC Gas Turbine Combined CycleGtoe Billion of tons oil equivalentGWP Global Warming PotentialIEA International Energy AgencyIEPE Institute of Energy Policy and EconomicsIET International Emission TradingIGCC Integrated coal gasification combined cycleIIASA International Institute for Applied System AnalysisIPCC International Panel on Climatic ChangeJI Joint Implementationkoe kilogram oil equivalentLNG Liquefied Natural GasLWR Light water reactorMt Million tonsMtoe Million ton oil equivalentO&M Operation and MaintenanceOECD Organisation for Economic Cooperation and DevelopmentOPEC Organisation of Petroleum Exporting CountriesPEM Proton Exchange MembranePOLES Prospective On Long Term Energy Systems
(1) See definition of regions
113
GI
Gross Domestic ProductGHG Greenhouse Gas

POP Populationppp Purchasing power paritiesppmv Parts per million by volumePrim Primary (electricity): nuclear, hydro, geothermal, wind, solarR&D Research and DevelopmentR/P Reserve on ProductionRMU Removal UnitsSFC Solid oxide Fuel Celltoe Ton of oil equivalentTWh Billion kWhUAE United Arab EmiratesUN United NationsUNFCCC United Nations Framework Convention on Climate ChangeURR Ultimate Recoverable ResourcesUS-DOE US Department of EnergyUSGS United States Geological SurveyWEC World Energy Council
114

AKNOWLEDGMENT
WETO has been prepared by a consortium of four European research organisations and hasbeen funded by the European Commission 5th RTD Framework Programme (DG ResearchEnergy programme, socio-economic activities).
The team has been co-ordinated by Bruno Lapillonne from ENERDATA and the members ofthe team were Dominique Gusbin (principal author), Philippe Tulkens and Willem van Ierlandfrom the Bureau Fédéral du Plan, Patrick Criqui from the Institut d’Economie et de Politiquede l’Energie (CNRS-IEPE) and Peter Russ from the Institute for Prospective TechnologyStudies (JRC-IPTS). All team members have participated in the thorough analysis of the drafttext and Domenico Rossetti di Valdalbero (European Commission, DG Research) hassupervised the work.
Silvana Mima (IEPE) and Nathalie Quercia (ENERDATA) have provided support in thepreparation of Figures and Tables. In addition, valuable comments have been received fromBertrand Chateau (ENERDATA) and Michela Nardo (IPTS).
An in-depth peer-review of WETO has been held in Brussels in December 2001 and relevantsuggestions have been given by the following experts: Georges Dupont-Roc fromTotalFinaElf, Bernard Laponche from International Conseil Energie, Peter Pearson fromImperial College and Clas-Otto Wene from the International Energy Agency.
From the European Commission, constructive remarks have been made by Pedro de SampaioNunes, Knut Kübler, Manfred Decker, Franz Xaver Soeldner, Timo Aaltonen and ChristineJenkins from DG Energy and Transport, Jos Delbeke and Peter Zapfel from DG Environment,Hardo Bruhns, Michel Poireau, Piet Zegers and Claude Thonet from DG Research.
115


ANNEX 1
COMPARISON OF WORLD ENERGY STUDIES

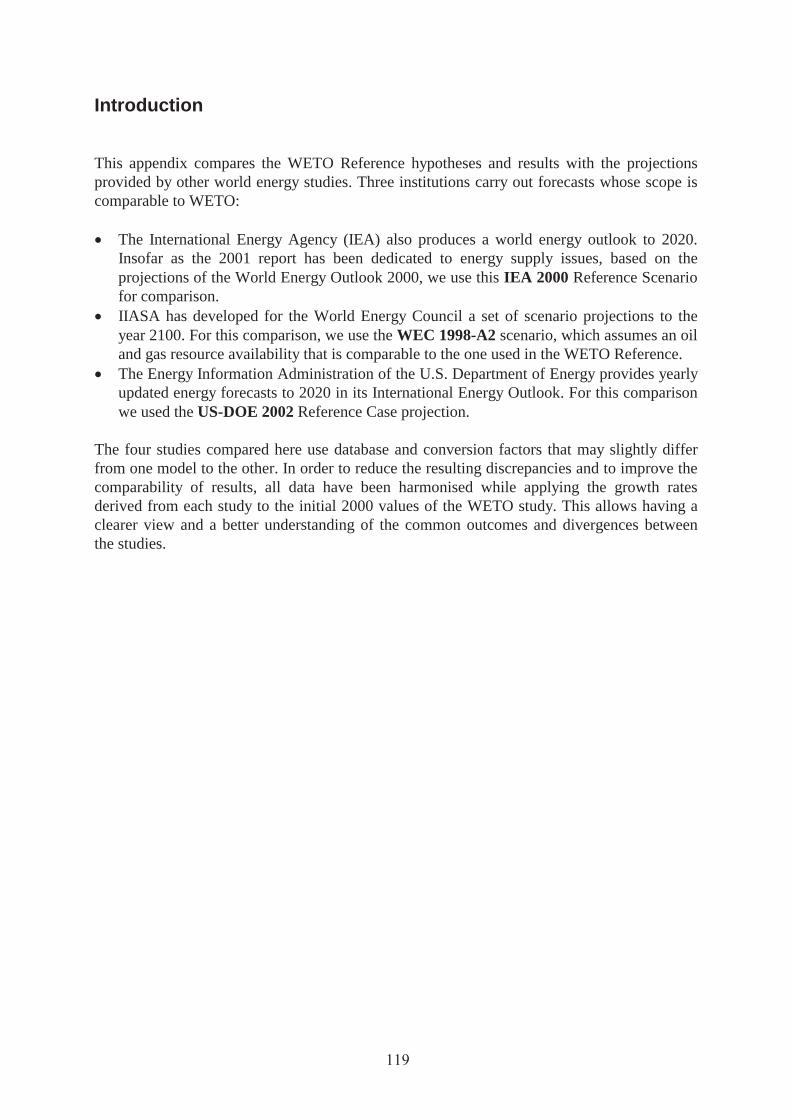
Introduction
This appendix compares the WETO Reference hypotheses and results with the projectionsprovided by other world energy studies. Three institutions carry out forecasts whose scope iscomparable to WETO:
� The International Energy Agency (IEA) also produces a world energy outlook to 2020.Insofar as the 2001 report has been dedicated to energy supply issues, based on theprojections of the World Energy Outlook 2000, we use this IEA 2000 Reference Scenariofor comparison.
� IIASA has developed for the World Energy Council a set of scenario projections to theyear 2100. For this comparison, we use the WEC 1998-A2 scenario, which assumes an oiland gas resource availability that is comparable to the one used in the WETO Reference.
� The Energy Information Administration of the U.S. Department of Energy provides yearlyupdated energy forecasts to 2020 in its International Energy Outlook. For this comparisonwe used the US-DOE 2002 Reference Case projection.
The four studies compared here use database and conversion factors that may slightly differfrom one model to the other. In order to reduce the resulting discrepancies and to improve thecomparability of results, all data have been harmonised while applying the growth ratesderived from each study to the initial 2000 values of the WETO study. This allows having aclearer view and a better understanding of the common outcomes and divergences betweenthe studies.
119

1. World population
With a world population of slightly less than 7 billions in 2010 and around 7.5 billions in 2020, allfour studies reflect very similar population projections until this time horizon. For the 2030 horizon,the downward revision of the World Population Prospects operated by the UN in recent yearstranslates into the fact that the WETO study shows a significantly lower projection (8.2 billions) thanthe IIASA-WEC study of 1998 (8.7 billions).
Population %/year M
2000-10* 2010-20 2020-30 2000 2010 2020 2030
WETO 1.17% 0.98% 0.78% 6 102 6 855 7 558 8 164
US-DOE 1.21% 1.05% 6 882 7 642
IEA 1.10% 1.10% 6 807 7 594
WEC A2 1.34% 1.17% 1.00% 6 974 7 834 8 657
0
1 000
2 000
3 000
4 000
5 000
6 000
7 000
8 000
9 000
10 000
2000 2010 2020 2030
Mill
ions
WETO US-DOE IEA WEC A2
1999-2010 in %/year for US-DOE and 1997-2010 for IEA
2. World GDP
According to three out of the four studies, world GDP will grow, in the next two decades, at a yearlyaverage rate between 3 and 3.5 %. This results in a world GDP of nearly 80 trillions € in 2020, i.e.almost a doubling, as compared with the 2000 level. In the WETO scenario, the continuous slowdownin the average growth rate translates into a linear-shaped GDP profile, with an increase of about 20Trillions € per decade. As a result, world GDP overpasses 100 trillions € in 2030.
%/year Millions
120

GDP %/year Billions
2000-10 2010-20 2020-30 2000 2010 2020 2030
WETO 3.49% 3.13% 2.62% 41 407 58 350 79 400 102 788
US-DOE 3.17% 3.33% 56 565 78 462
IEA 3.10% 3.10% 56 191 76 252
WEC A2 2.74% 2.59% 2.67% 54 240 70 016 91 088
0
20 000
40 000
60 000
80 000
100 000
120 000
2000 2010 2020 2030
Billi
ons
99€
WETO US-DOE IEA WEC A2
3. World oil price
After a ten years period during which world oil price stayed below 20 €/bl, in 2000 it reached a peakof 26.5 €/bl. The three studies elaborating price projections point to a lower oil price in 2010. In 2020however, two out of three studies show a full recovery from the 2000 level. The WETO endogenousprojection of prices shows the highest profile with 29 and 35 €/bl, in 2020 and 2030 respectively.These levels are deemed to be necessary � in the set of the WETO hypotheses and modellingframework � to balance world demand and supply, including that of non-conventional oil resources.
Oil Price 95$ / bl = 99 € / bl
2000 2010 2020 2030
WETO 26.5 23.8 28.7 34.9
US-DOE 21.6 22.8
IEA 18.8 25.7
%/year Billions 99Euros
$95/bl=€99/bl
121

0.0
5.0
10.0
15.0
20.0
25.0
30.0
35.0
40.0
2000 2010 2020 2030
99€
/ bl
WETO US-DOE IEA
4. World energy consumption
World total energy consumption levels, as they stem from the harmonisation process used here, showsimilar levels for the time-period considered, with a typical 12 Gtoe in 2010 and 14.5 in 2020 (onlyone study displays a significantly higher value, i.e. 15.5 Gtoe for that date) and 17 Gtoe in 2030.However, this proximity in total energy forecasts hides more important differences in the projectionsfor individual energy sources, as analysed below.
Primary Energy %/year
2000-10 2010-20 2020-30 2000 2010 2020 2030
WETO 1.97% 1.88% 1.64% 9 927 12 062 14 536 17 100
US-DOE 2.34% 2.19% 12 512 15 532
IEA 1.96% 1.79% 12 054 14 396
WEC A2 1.84% 1.81% 1.82% 11 915 14 250 17 064
0
2 000
4 000
6 000
8 000
10 000
12 000
14 000
16 000
18 000
2000 2010 2020 2030
Mto
e
WETO US-DOE IEA WEC A2
%/year Mtoe
122

5. World CO2 emissions
As for the energy consumption, the total projected CO2 emissions from the combustion of fossil fuelsshow a reasonable proximity with about 30 Gt CO2 in 2010 and 35 in 2020. For the last decade of theprojection, the difference between the IIASA-WEC and the WETO projections (40 and 45 Gt CO2 in2030 respectively) turns out to be important. This reflects a much higher contribution of thetraditional biomass and new renewable energy sources in the former study.
CO2 %/year MtCO2
2000-10 2010-20 2020-30 2000 2010 2020 2030
WETO 2.14% 2.26% 1.93% 23 781 29 376 36 738 44 498
US-DOE 2.39% 2.22% 30 130 37 520
IEA 2.09% 2.00% 29 251 35 666
WEC A2 1.89% 1.65% 1.66% 28 687 33 792 39 858
0
5 000
10 000
15 000
20 000
25 000
30 000
35 000
40 000
45 000
50 000
2000 2010 2020 2030
MtC
O2
WETO US-DOE IEA WEC A2
6. World coal demand
All four scenarios point to an increase in world coal consumption over the next decades, with a totalconsumption of about 3 Gtoe in 2010. For the longer term, the WETO and WEC-IIASA projectionsshow structurally higher coal consumption than the IEA and DOE projections for 2020 and the rise ofcoal continues in the 2020-2030 decade, with average growth rates higher than 2 %/year. In bothcases, coal consumption reaches a level of more than 4.5 Gtoe in 2030, corresponding to a doublingfrom current level. This reflects the assumptions used in these two studies for oil and gas resourcesand the fact that, in the long run, coal remains the only abundant and cheap fossil source, providedthat environmental considerations do not dominate the scenario framework.
%/year Mt CO2
123

Coal %/year Mtoe
2000-10 2010-20 2020-30 2000 2010 2020 2030
WETO 2.07% 2.42% 2.48% 2 389 2 931 3 723 4 757
US-DOE 1.88% 1.50% 2 878 3 340
IEA 1.74% 1.74% 2 837 3 370
WEC A2 2.13% 2.31% 2.22% 2 949 3 707 4 616
0
500
1 000
1 500
2 000
2 500
3 000
3 500
4 000
4 500
5 000
2000 2010 2020 2030
Mto
e
WETO US-DOE IEA WEC A2
7. World oil demand
World oil demand exceeds 4 Gtoe in 2010 in the four studies, and 5 Gtoe in 2020 in three of them.The corresponding growth rates are however at a relatively low level, between 1.5 and 2 %/year. TheDOE forecast shows the highest level of world oil demand in 2020 and this is consistent, on thedemand side, with the fact that this study also has the lowest oil price for that horizon (23 $/bl).
Oil %/year Mtoe
2000-10 2010-20 2020-30 2000 2010 2020 2030
WETO 1.91% 1.84% 1.43% 3 517 4 250 5 099 5 878
US-DOE 2.28% 2.14% 4 407 5 445
IEA 2.01% 1.82% 4 293 5 139
WEC A2 1.44% 0.97% 0.81% 4 057 4 470 4 846
%/year
%/year
Mtoe
Mtoe
124

0
1 000
2 000
3 000
4 000
5 000
6 000
7 000
2000 2010 2020 2030
Mto
e
WETO US-DOE IEA WEC A2
8. World gas demand
The natural gas projections show the same differences and similarities than those observed foroil. World gas demand is in a range of 2.8-3 Gtoe in 2010 and 3.5-4 Gtoe in 2020. Theaverage growth rates are however much higher than for oil, with values between 2.5 and morethan 3 %/year at least until 2020. This is a clear indication of the strong dynamics that has tobe expected for natural gas in the next twenty years.
Natural Gas %/year Mtoe
2000-10 2010-20 2020-30 2000 2010 2020 2030
WETO 3.00% 2.59% 1.63% 2 129 2 860 3 693 4 340
US-DOE 3.19% 3.12% 2 916 3 965
IEA 2.76% 2.69% 2 797 3 646
WEC A2 2.72% 2.12% 2.02% 2 784 3 434 4 193
0
500
1 000
1 500
2 000
2 500
3 000
3 500
4 000
4 500
5 000
2000 2010 2020 2030
Mto
e
WETO US-DOE IEA WEC A2
%/year Mtoe
125

9. World nuclear electricity production
The prospects for nuclear electricity development in the next thirty years appear to be quite limited inthe four projections. This is explained by the marked slowdown or even the halt in new plant orderssince the 1980s. The WETO scenario however projects some increase in the nuclear power productionfor the next decade, due partly to the additions of new capacities and partly to improvements inexisting plants management and load factors. Between 2010 and 2020 the production is expected tostabilise in the WETO projection before a modest growth recovery between 2020 and 2030, while theIEA outlook points for a rapid retirement of the so called “second generation” plants after 2010. In allcases the contribution of nuclear energy seems to be limited to less than 0.8 Gtoe before 2020 and lessthan 0.9 Gtoe before 2030.
Nuclear %/year Mtoe
2000-10 2010-20 2020-30 2000 2010 2020 2030
WETO 1.89% -0.09% 0.96% 663 799 792 872
US-DOE 0.78% 0.22% 717 732
IEA 0.77% -1.10% 716 641
WEC A2 0.52% 1.05% 1.73% 699 776 920
0
200
400
600
800
1 000
1 200
2000 2010 2020 2030
Mto
e
WETO US-DOE IEA WEC A2
10. World hydro-electricity production
World hydro power production is expected to rise relatively regularly over the period, with for theWETO and the IEA studies average rates of 2 %/year between 2000 and 2010 and 1.6 % p.a. between2010 and 2020. If the same conversion factors were used for hydro power and for nuclear, then thecontribution of hydro power to world energy supply would exceed 1Gtoe in 2020 and 1.4 Gtoe in2030 according to the WETO projection.
%/year Mtoe
126

Large Hydro %/year Mtoe
2000-10 2010-20 2020-30 2000 2010 2020 2030
WETO 1.98% 1.65% 1.40% 238 290 342 392
IEA 2.05% 1.57% 292 341
WEC A2 1.24% 1.31% 1.36% 270 307 351
0
50
100
150
200
250
300
350
400
450
2000 2010 2020 2030
Mto
e
WETO IEA WEC A2
11. World biomass production
By definition, the contribution of biomass to world energy supply is difficult to measure. It is alsodifficult to model as the proper dynamics of the corresponding energy sources as well as their links �in terms of substitution processes � with commercial fuels have hardly been explored, and only infield-studies. The three projections providing estimates for this category of fuels indeed show verycontrasted profiles, with stability in the IIASA-WEC projection, an increase in the IEA outlook and acontinuous decrease, based on the hypothesis of growing urbanisation, in the WETO projection.
Biomass %/year Mtoe
(non comm.) 2000-10 2010-20 2020-30 2000 2010 2020 2030
WETO -1.83% -1.79% -1.75% 820 682 569 477
IEA 0.98% 0.87% 904 986
WEC A2 0.16% -0.23% 0.01% 833 814 815
%/year
%/year
Mtoe
Mtoe
127

0
200
400
600
800
1 000
1 200
2000 2010 2020 2030
Mto
e
WETO IEA WEC A2
12. World other renewable production
The category of other renewable used for this comparison includes different energy sources fromcommercial biofuels to micro-hydro systems, wind and photovoltaic. Altogether, they represent notmore than 0.17 Gtoe in 2000, with a clear predominance of commercial biofuels. The expectedaverage growth rate is relatively high, i.e. above 3 %/year, for the first 2000-2010 decade. It thenslows down in the WETO and IEA projections, while it increases significantly in the IIASA-WECprojection. In the two former studies, the Reference cases do not incorporate any particular emphasison environmentally friendly policies.
Other %/year Mtoe
Renewable 2000-10 2010-20 2020-30 2000 2010 2020 2030
WETO 3.87% 2.49% 1.87% 171 250 319 384
IEA 3.03% 2.61% 230 298
WEC A2 3.53% 5.47% 4.70% 242 412 652
0
100
200
300
400
500
600
700
2000 2010 2020 2030
Mto
e
WETO IEA WEC A2
%/year Mtoe
128

ANNEX 2
WETO PROJECTIONS BY REGIONS

%/ year 1990 2000 2010 2020 2030 1990/00 2000/10 2010/30
Overall indicators Population (Million) 5248 6102 6855 7558 8164 1,5% 1,2% 0,9%GDP (G € 99 ppp) 30793 41407 58350 79400 102788 3,0% 3,5% 2,9%Per capita GDP (1000 € 99/cap) 5,9 6,8 8,5 10,5 12,6 1,5% 2,3% 2,0%Gross Inland Cons/GDP (toe/1000 € 99) 281 241 206 183 166 -1,5% -1,5% -1,1%Gross Inland Cons per capita (toe/cap) 1,7 1,6 1,8 1,9 2,1 -0,1% 0,7% 0,9%% renewables in gross inland consumption 13% 13% 11% 9% 8% -0,2% -1,8% -1,4%Electr. Consumption per capita (kWh/cap) 1,8 2,1 2,4 3,0 3,7 1,1% 1,7% 2,1%CO2 Emissions per capita (t of CO2/cap) 4,0 3,9 4,3 4,9 5,5 -0,2% 1,0% 1,2%Transport fuels per capita (toe/cap) 0,26 0,28 0,30 0,32 0,34 0,9% 0,5% 0,7%
Primary Production (Mtoe) 8530 9953 12110 14611 17213 1,6% 2,0% 1,8% Coal, lignite 1901 2389 2931 3723 4757 2,3% 2,1% 2,5% Oil 3258 3517 4250 5099 5878 0,8% 1,9% 1,6% Natural gas 1754 2129 2860 3693 4340 2,0% 3,0% 2,1% Nuclear 509 663 799 792 872 2,7% 1,9% 0,4% Hydro,geothermal 193 238 290 342 392 2,1% 2,0% 1,5% Wood and wastes 904 1002 949 908 900 1,0% -0,5% -0,3% Wind, solar, small hydro 11 15 30 54 73 3,3% 7,1% 4,6%
Gross Inland Consumption (Mtoe) 8668 9980 12043 14514 17065 1,4% 1,9% 1,8% Coal, lignite 2168 2371 2913 3704 4739 0,9% 2,1% 2,5% Oil 3104 3591 4250 5099 5878 1,5% 1,7% 1,6% Natural gas 1747 2127 2859 3689 4323 2,0% 3,0% 2,1% Primary electricity 746 890 1072 1114 1225 1,8% 1,9% 0,7% Wood and wastes 904 1002 949 908 900 1,0% -0,5% -0,3%
Electricity Generation (TWh) 11945 14865 19339 26122 34716 2,2% 2,7% 2,9% Thermal 7561 9299 12464 18382 25803 2,1% 3,0% 3,7% of which: Conventional coal, lignite 4412 5516 5532 5154 4325 2,3% 0,0% -1,2% Advanced coal technology 0 0 1582 5573 11331 10,3% Gas 1688 2418 4054 6209 8542 3,7% 5,3% 3,8% Biomass 132 197 260 335 423 4,1% 2,8% 2,5% Nuclear 2013 2622 3161 3137 3498 2,7% 1,9% 0,5% Hydro+Geoth 2246 2771 3371 3971 4562 2,1% 2,0% 1,5% Solar 1 2 24 44 51 6,6% 31,4% 3,8% Wind 4 23 117 342 544 19,4% 17,5% 8,0% Small Hydro 120 149 203 245 258 2,1% 3,2% 1,2%
CHP 519 586 1055 1510 1568 1,2% 6,1% 2,0%
Final Energy Consumption (Mtoe) 6270 7124 8682 10425 12132 1,3% 2,0% 1,7% Coal, lignite 882 762 1100 1371 1626 -1,5% 3,7% 2,0% Oil 2540 2998 3609 4339 5041 1,7% 1,9% 1,7% Gas 960 1102 1423 1704 1859 1,4% 2,6% 1,3% Heat 179 234 235 236 238 2,7% 0,0% 0,1% Electricity 832 1083 1442 1974 2621 2,7% 2,9% 3,0% Wood and wastes 865 945 872 800 748 0,9% -0,8% -0,8%
Industry 2411 2524 3190 3800 4289 0,5% 2,4% 1,5% Transport 1459 1733 2056 2413 2796 1,7% 1,7% 1,5% Household, Service, Agriculture 2437 2867 3437 4213 5047 1,6% 1,8% 1,9%
CO2 Emissions (Mt of CO2), of which: 20843 23781 29376 36738 44498 1,3% 2,1% 2,1%Electricity generation 6943 8261 9393 12191 15809 1,7% 1,3% 2,6%Industry 4752 4390 5674 6665 7302 -0,8% 2,9% 1,3%Transport 4228 5125 6096 7163 8306 1,9% 1,8% 1,6%Household, Service, Agriculture 3249 3748 5353 7110 8665 1,4% 3,4% 2,4%
World
130

1990 2000 2010 2020 2030 1990/00 2000/10 2010/30Overall indicators Population (Million) 434 456 467 470 468 0,5% 0,2% 0,0%GDP (G € 99 ppp) 7536 9225 11517 14226 16706 2,0% 2,2% 1,9%Per capita GDP (1000 € 99/cap) 17,4 20,2 24,7 30,2 35,7 1,5% 2,0% 1,9%Gross Inland Cons/GDP (toe/1000 € 99) 190 174 148 129 116 -0,9% -1,6% -1,2%Gross Inland Cons per capita (toe/cap) 3,3 3,5 3,7 3,9 4,1 0,6% 0,4% 0,6%% renewables in gross inland consumption 6% 6% 7% 7% 7% 0,3% 1,0% 0,6%Electr. Consumption per capita (kWh/cap) 4,7 5,4 6,1 7,2 8,4 1,4% 1,2% 1,6%CO2 Emissions per capita (t of CO2/cap) 7,8 7,9 8,0 8,8 9,3 0,1% 0,2% 0,8%Transport fuels per capita (toe/cap) 0,64 0,71 0,73 0,77 0,79 1,0% 0,4% 0,4%
Primary Production (Mtoe) 863 1045 926 809 752 1,9% -1,2% -1,0% Coal, lignite 224 134 107 108 110 -5,0% -2,2% 0,1% Oil 212 339 217 129 82 4,8% -4,4% -4,7% Natural gas 156 252 261 220 178 4,9% 0,4% -1,9% Nuclear 188 223 227 218 238 1,7% 0,2% 0,2% Hydro,geothermal 40 44 48 51 54 1,0% 0,9% 0,6% Wood and wastes 41 48 54 65 71 1,5% 1,3% 1,4% Wind, solar, small hydro 3 5 11 18 20 7,2% 8,1% 2,9%
Gross Inland Consumption (Mtoe) 1430 1604 1705 1839 1936 1,2% 0,6% 0,6% Coal, lignite 320 246 224 269 315 -2,6% -0,9% 1,7% Oil 615 667 688 716 722 0,8% 0,3% 0,2% Natural gas 227 379 464 521 537 5,2% 2,0% 0,7% Primary electricity 227 264 274 269 291 1,5% 0,4% 0,3% Wood and wastes 41 48 54 65 71 1,5% 1,3% 1,4%
Electricity Generation (TWh) 2420 2762 3118 3707 4279 1,3% 1,2% 1,5% Thermal 1187 1313 1537 2044 2470 1,0% 1,6% 2,4% of which: Conventional coal, lignite 783 675 551 544 492 -1,5% -2,0% -0,6% Advanced coal technology 0 0 114 378 726 228,7% 9,7% Gas 183 433 649 882 1021 9,0% 4,1% 2,3% Biomass 15 35 48 70 80 8,9% 3,1% 2,6% Nuclear 744 882 899 863 959 1,7% 0,2% 0,3% Hydro+Geoth 459 507 552 593 623 1,0% 0,9% 0,6% Solar 0,0 0,1 0,2 0,5 0,8 19,6% 9,5% 7,9% Wind 1 16 67 139 157 34,0% 15,8% 4,3% Small Hydro 29 43 61 67 69 4,2% 3,6% 0,6%
CHP 103 191 258 285 269 6,4% 3,1% 0,2%
Final Energy Consumption (Mtoe) 1027 1164 1257 1354 1409 1,3% 0,8% 0,6% Coal, lignite 99 56 57 67 75 -5,5% 0,2% 1,4% Oil 517 587 604 629 637 1,3% 0,3% 0,3% Gas 180 251 290 301 289 3,4% 1,4% 0,0% Heat 18 24 25 26 26 2,9% 0,3% 0,4% Electricity 174 210 243 291 338 1,9% 1,5% 1,7% Wood and wastes 35 36 38 41 44 0,4% 0,5% 0,7%
Industry 372 402 434 463 471 0,8% 0,8% 0,4% Transport 295 329 350 369 380 1,1% 0,6% 0,4% Household, Service, Agriculture 374 433 472 522 558 1,5% 0,9% 0,8%
CO2 Emissions (Mt of CO2), of which: 3565 3599 3751 4129 4374 0,6% 0,4% 0,8%Electricity generation 1047 1026 1013 1236 1429 -0,4% -0,1% 1,7%Industry 624 623 641 645 616 -0,5% 0,3% -0,2%Transport 843 966 1029 1083 1117 1,4% 0,6% 0,4%Household, Service, Agriculture 691 720 765 813 819 0,4% 0,6% 0,3%
Western Europe
%/ year
131

1990 2000 2010 2020 2030 1990/00 2000/10 2010/30Overall indicators Population (Million) 410 425 428 427 422 0,4% 0,1% -0,1%GDP (G € 99 ppp) 3423 2457 3495 4910 6400 -3,3% 3,6% 3,1%Per capita GDP (1000 € 99/cap) 8,4 5,8 8,2 11,5 15,2 -3,6% 3,5% 3,1%Gross Inland Cons/GDP (toe/1000 € 99) 493 478 379 331 290 -0,3% -2,3% -1,3%Gross Inland Cons per capita (toe/cap) 4,1 2,8 3,1 3,8 4,4 -3,9% 1,1% 1,8%% renewables in gross inland consumption 3% 5% 5% 5% 4% 4,2% 0,0% -0,8%Electr. Consumption per capita (kWh/cap) 3,9 3,2 4,0 5,5 7,1 -2,0% 2,3% 2,9%CO2 Emissions per capita (t of CO2/cap) 11,0 6,7 7,2 9,1 10,6 -4,8% 0,6% 2,0%Transport fuels per capita (toe/cap) 0,37 0,20 0,24 0,28 0,32 -5,8% 1,6% 1,5%
Primary Production (Mtoe) 1627 1375 1480 1889 2405 -1,7% 0,7% 2,5% Coal, lignite 167 261 214 268 312 4,6% -2,0% 1,9% Oil 586 355 331 340 388 -4,9% -0,7% 0,8% Natural gas 747 606 746 1102 1529 -2,1% 2,1% 3,7% Nuclear 68 92 120 103 94 3,1% 2,7% -1,2% Hydro,geothermal 24 25 29 32 34 0,7% 1,4% 0,8% Wood and wastes 35 36 39 41 42 0,4% 0,9% 0,3% Wind, solar, small hydro 0,3 0,4 0,9 2,8 6,6 2,4% 8,9% 10,3%
Gross Inland Consumption (Mtoe) 1688 1173 1323 1625 1853 -3,6% 1,2% 1,7% Coal, lignite 446 235 187 234 271 -6,2% -2,2% 1,9% Oil 496 264 312 368 390 -6,1% 1,7% 1,1% Natural gas 628 531 650 862 1035 -1,7% 2,0% 2,4% Primary electricity 83 108 134 119 115 2,7% 2,2% -0,8% Wood and wastes 35 36 39 41 42 0,4% 0,9% 0,3%
Electricity Generation (TWh) 2168 1756 2165 2978 3766 -2,1% 2,1% 2,7% Thermal 1619 1091 1341 2168 2917 -3,9% 2,1% 4,0% of which: Conventional coal, lignite 690 469 377 449 407 -3,8% -2,2% 0,4% Advanced coal technology 0 0 65 259 519 197,2% 10,9% Gas 625 457 700 1213 1758 -3,1% 4,4% 4,7% Biomass 34 45 63 70 68 3,0% 3,3% 0,4% Nuclear 269 365 474 407 372 3,1% 2,7% -1,2% Hydro+Geoth 276 296 340 371 400 0,7% 1,4% 0,8% Solar 0,0 0,0 0,0 0,1 1,0 17,7% 26,7% 39,4% Wind 0 0 2 15 50 64,8% 31,3% 17,1% Small Hydro 4 5 9 17 26 2,1% 6,8% 5,5%
CHP 198 95 127 155 177 -7,1% 3,0% 1,7%
Final Energy Consumption (Mtoe) 1192 809 929 1123 1280 -3,8% 1,4% 1,6% Coal, lignite 194 86 69 72 82 -7,8% -2,1% 0,8% Oil 370 178 212 249 277 -7,1% 1,8% 1,3% Gas 320 230 306 407 471 -3,2% 2,9% 2,2% Heat 143 177 177 177 177 2,1% 0,0% 0,0% Electricity 138 116 146 202 257 -1,7% 2,3% 2,9% Wood and wastes 24 22 18 17 17 -0,8% -1,9% -0,4%
Industry 609 315 377 437 473 -6,4% 1,8% 1,2% Transport 143 91 107 126 142 -4,4% 1,6% 1,4% Household, Service, Agriculture 422 402 445 560 665 -0,5% 1,0% 2,0%
CO2 Emissions (Mt of CO2), of which: 4377 2857 3058 3877 4476 -4,5% 0,7% 1,9%Electricity generation 1675 997 929 1264 1495 -5,1% -0,7% 2,4%Industry 913 510 593 670 715 -5,7% 2,5% 0,9%Transport 424 261 308 365 411 -4,8% 1,7% 1,4%Household, Service, Agriculture 800 600 663 873 1056 -2,8% 1,0% 2,4%
%/ year
CIS, CEEC
132

1990 2000 2010 2020 2030 1990/00 2000/10 2010/30Overall indicators Population (Million) 277 304 327 348 365 0,9% 0,7% 0,6%GDP (G € 99 ppp) 7293 9943 12632 15330 18096 3,1% 2,4% 1,8%Per capita GDP (1000 € 99/cap) 26,3 32,7 38,7 44,1 49,6 2,2% 1,7% 1,3%Gross Inland Cons/GDP (toe/1000 € 99) 302 255 217 191 170 -1,7% -1,6% -1,2%Gross Inland Cons per capita (toe/cap) 8,0 8,3 8,4 8,4 8,4 0,5% 0,1% 0,0%% renewables in gross inland consumption 5% 6% 5% 5% 6% 2,2% -0,4% 0,2%Electr. Consumption per capita (kWh/cap) 11,0 12,6 14,1 16,0 18,1 1,4% 1,1% 1,3%CO2 Emissions per capita (t of CO2/cap) 19,2 21,0 21,0 21,4 21,8 0,9% 0,0% 0,2%Transport fuels per capita (toe/cap) 1,92 2,12 2,09 2,02 1,96 1,0% -0,1% -0,3%
Primary Production (Mtoe) 1914 2164 2410 2623 2849 1,2% 1,1% 0,8% Coal, lignite 582 694 721 828 1011 1,8% 0,4% 1,7% Oil 559 533 575 603 651 -0,5% 0,8% 0,6% Natural gas 500 589 754 830 789 1,6% 2,5% 0,2% Nuclear 173 205 212 203 225 1,7% 0,3% 0,3% Hydro,geothermal 52 62 63 65 66 1,8% 0,3% 0,2% Wood and wastes 47 79 80 84 89 5,5% 0,2% 0,5% Wind, solar, small hydro 2 2 4 10 17 3,0% 6,9% 7,0%
Gross Inland Consumption (Mtoe) 2203 2532 2744 2934 3082 1,4% 0,8% 0,6% Coal, lignite 484 613 637 717 859 2,4% 0,4% 1,5% Oil 850 994 988 1000 1004 1,6% -0,1% 0,1% Natural gas 571 588 773 871 836 0,3% 2,8% 0,4% Primary electricity 252 258 267 264 294 0,2% 0,3% 0,5% Wood and wastes 47 79 80 84 89 5,5% 0,2% 0,5%
Electricity Generation (TWh) 3681 4348 5032 6083 7412 1,7% 1,5% 1,7% Thermal 2375 2791 3404 4408 5539 1,6% 2,0% 2,5% of which: Conventional coal, lignite 1783 2126 1998 1739 1445 1,8% -0,6% -1,6% Advanced coal technology 0 0 442 1415 2738 108,7% 9,5% Gas 392 428 845 1127 1227 0,9% 7,0% 1,9% Biomass 53 76 93 95 87 3,6% 2,1% -0,3% Nuclear 684 812 838 805 909 1,7% 0,3% 0,4% Hydro+Geoth 602 719 738 754 765 1,8% 0,3% 0,2% Solar 0,7 1,0 1,5 7,1 8,4 3,4% 4,0% 9,2% Wind 3 5 21 77 158 4,9% 15,2% 10,7% Small Hydro 16 20 29 32 32 2,5% 3,6% 0,5%
CHP 169 202 364 429 348 1,8% 6,1% -0,2%
Final Energy Consumption (Mtoe) 1458 1693 1854 1987 2068 1,5% 0,9% 0,5% Coal, lignite 65 35 36 39 39 -6,0% 0,2% 0,4% Oil 774 896 923 930 936 1,5% 0,3% 0,1% Gas 325 365 436 474 451 1,2% 1,8% 0,2% Heat 2,2 8,4 8,5 8,6 8,7 14,4% 0,1% 0,1% Electricity 262 331 395 477 566 2,3% 1,8% 1,8% Wood and wastes 31 58 57 59 66 6,6% -0,2% 0,8%
Industry 476 534 589 620 613 1,2% 1,0% 0,2% Transport 535 646 686 704 719 1,9% 0,6% 0,2% Household, Service, Agriculture 449 513 579 664 736 1,3% 1,2% 1,2%
CO2 Emissions (Mt of CO2), of which: 5314 6387 6863 7441 7955 1,9% 0,7% 0,7%Electricity generation 2106 2642 2729 3128 3686 2,3% 0,3% 1,5%Industry 827 675 747 765 682 -2,0% 1,0% -0,5%Transport 1601 1931 2054 2107 2150 1,9% 0,6% 0,2%Household, Service, Agriculture 695 757 845 920 908 0,9% 1,1% 0,4%
%/ year
North America
133

1990 2000 2010 2020 2030 1990/00 2000/10 2010/30Overall indicators Population (Million) 150 158 162 162 159 0,5% 0,3% -0,1%GDP (G € 99 ppp) 3168 3699 4356 5287 6302 1,6% 1,6% 1,9%Per capita GDP (1000 € 99/cap) 21,1 23,5 26,9 32,6 39,5 1,0% 1,4% 1,9%Gross Inland Cons/GDP (toe/1000 € 99) 170 172 157 141 129 0,1% -0,9% -1,0%Gross Inland Cons per capita (toe/cap) 3,6 4,0 4,2 4,6 5,1 1,2% 0,5% 0,9%% renewables in gross inland consumption 5% 5% 5% 6% 6% 0,1% 1,0% 0,3%Electr. Consumption per capita (kWh/cap) 6,1 7,1 8,0 9,6 11,6 1,6% 1,2% 1,9%CO2 Emissions per capita (t of CO2/cap) 9,1 9,5 9,4 10,1 11,3 0,4% -0,2% 1,0%Transport fuels per capita (toe/cap) 0,66 0,80 0,83 0,88 0,94 1,9% 0,3% 0,6%
Primary Production (Mtoe) 248 346 437 522 615 3,4% 2,4% 1,7% Coal, lignite 113 152 161 219 313 3,0% 0,6% 3,4% Oil 36 38 66 70 41 0,6% 5,7% -2,3% Natural gas 23 37 57 67 80 4,9% 4,4% 1,8% Nuclear 51 90 118 125 135 5,8% 2,8% 0,7% Hydro,geothermal 12 13 13 14 14 0,7% 0,3% 0,2% Wood and wastes 12 15 19 23 25 2,6% 2,5% 1,4% Wind, solar, small hydro 1,5 2,0 2,8 4,7 5,8 2,4% 3,7% 3,6%
Gross Inland Consumption (Mtoe) 537 635 684 744 812 1,7% 0,7% 0,9% Coal, lignite 111 128 121 131 160 1,4% -0,5% 1,4% Oil 291 297 278 290 291 0,2% -0,7% 0,2% Natural gas 61 94 138 165 188 4,4% 3,9% 1,6% Primary electricity 63 101 128 135 147 4,9% 2,4% 0,7% Wood and wastes 12 15 19 23 25 2,6% 2,5% 1,4%
Electricity Generation (TWh) 1062 1279 1464 1674 1888 1,9% 1,4% 1,4% Thermal 703 752 810 968 1121 0,7% 0,7% 1,6% of which: Conventional coal, lignite 208 277 172 140 112 2,9% -4,7% -2,1% Advanced coal technology 0 0 67 228 383 9,1% Gas 221 342 531 559 582 4,5% 4,5% 0,5% Biomass 17 18 30 36 40 0,9% 5,0% 1,5% Nuclear 202 355 467 493 539 5,8% 2,8% 0,7% Hydro+Geoth 139 150 154 158 161 0,7% 0,3% 0,2% Solar 0,1 0,2 3,1 19,9 28,5 12,9% 29,9% 11,7% Wind 0,0 0,1 1,1 4,3 7,9 36,9% 29,8% 10,3% Small Hydro 18 22 28 30 30 2,3% 2,4% 0,3%
CHP 39 71 78 109 117 6,2% 1,0% 2,0%
Final Energy Consumption (Mtoe) 385 443 487 525 564 1,4% 0,9% 0,7% Coal, lignite 47 45 58 53 53 -0,5% 2,6% -0,5% Oil 219 256 259 271 280 1,5% 0,1% 0,4% Gas 25 35 47 53 57 3,4% 2,9% 1,0% Heat 0,6 1,1 1,3 1,5 1,8 7,4% 1,3% 1,6% Electricity 79 97 111 134 159 2,1% 1,4% 1,8% Wood and wastes 9 10 10 12 13 0,5% 0,3% 1,5%
Industry 182 191 210 218 231 0,5% 0,9% 0,5% Transport 107 128 136 144 152 1,8% 0,6% 0,6% Household, Service, Agriculture 102 124 141 162 181 2,0% 1,3% 1,3%
CO2 Emissions (Mt of CO2), of which: 1364 1496 1512 1640 1806 0,9% 0,1% 0,9%Electricity generation 442 472 396 481 561 0,0% -1,7% 1,8%Industry 338 323 370 359 369 -0,4% 1,3% 0,0%Transport 300 379 401 427 450 2,4% 0,6% 0,6%Household, Service, Agriculture 174 189 208 236 257 0,8% 1,0% 1,0%
%/ year
Japan, Pacific
134

1990 2000 2010 2020 2030 1990/00 2000/10 2010/30Overall indicators Population (Million) 751 984 1225 1490 1755 2,7% 2,2% 1,8%GDP (G € 99 ppp) 1707 2313 3335 4745 6553 3,1% 3,7% 3,4%Per capita GDP (1000 € 99/cap) 2,3 2,4 2,7 3,2 3,7 0,3% 1,5% 1,6%Gross Inland Cons/GDP (toe/1000 € 99) 363 363 310 286 269 0,0% -1,6% -0,7%Gross Inland Cons per capita (toe/cap) 0,83 0,85 0,84 0,91 1,00 0,3% -0,1% 0,9%% renewables in gross inland consumption 30% 26% 19% 13% 10% -1,5% -3,3% -3,3%Electr. Consumption per capita (kWh/cap) 0,9 0,9 1,1 1,4 1,8 0,4% 2,0% 2,6%CO2 Emissions per capita (t of CO2/cap) 0,00 0,00 0,00 0,00 0,00 0,7% 1,0% 1,6%Transport fuels per capita (toe/cap) 0,05 0,12 0,12 0,13 0,14 9,8% 0,0% 0,6%
Primary Production (Mtoe) 1628 2009 2717 3823 4740 2,1% 3,1% 2,8% Coal, lignite 107 125 185 297 475 1,6% 4,0% 4,8% Oil 1188 1386 1923 2587 3105 1,6% 3,3% 2,4% Natural gas 143 275 409 758 986 6,7% 4,0% 4,5% Nuclear 2,1 3,4 8,8 7,1 5,9 4,9% 9,9% -2,0% Hydro,geothermal 6,2 8,2 11,5 15,4 20,4 2,8% 3,3% 2,9% Wood and wastes 181 211 178 155 143 1,5% -1,7% -1,1% Wind, solar, small hydro 0,3 0,4 3,3 5,1 6,0 3,5% 23,2% 3,0%
Gross Inland Consumption (Mtoe) 620 840 1034 1358 1762 3,1% 2,1% 2,7% Coal, lignite 78 82 137 227 378 0,5% 5,2% 5,2% Oil 241 326 425 553 690 3,1% 2,7% 2,5% Natural gas 110 210 273 398 526 6,7% 2,6% 3,3% Primary electricity 10 12 22 24 25 2,0% 6,4% 0,8% Wood and wastes 181 211 178 155 143 1,5% -1,7% -1,1%
Electricity Generation (TWh) 559 803 1207 1881 2846 3,7% 4,2% 4,4% Thermal 476 691 1017 1631 2527 3,8% 3,9% 4,7% of which: Conventional coal, lignite 174 221 247 250 222 2,4% 1,1% -0,5% Advanced coal technology 0 0 37 209 532 NA 126,2% 14,3% Gas 137 268 465 867 1372 7,0% 5,7% 5,6% Biomass 0 0 2 5 16 8,2% 13,2% 12,0% Nuclear 8 14 35 28 23 4,9% 9,9% -2,0% Hydro+Geoth 72 96 133 179 238 2,8% 3,3% 2,9% Solar 0 0 13 13 10 22,4% 60,1% -1,5% Wind 0 0 4 24 41 42,8% 48,9% 11,9% Small Hydro 1,8 2,4 4,4 6,4 7,1 2,9% 6,4% 2,5%
CHP 2 4 10 19 19 4,6% 10,2% 3,2%
Final Energy Consumption (Mtoe) 457 598 731 943 1192 2,7% 2,0% 2,5% Coal, lignite 20 25 68 128 195 2,0% 10,8% 5,4% Oil 181 232 303 402 508 2,5% 2,7% 2,6% Gas 36 73 94 121 143 7,4% 2,5% 2,1% Heat 0,4 0,5 0,5 0,5 0,5 3,7% 0,0% 0,0% Electricity 40 58 88 138 210 3,8% 4,3% 4,5% Wood and wastes 181 210 177 153 136 1,5% -1,7% -1,3%
Industry 142 171 211 282 371 1,8% 2,1% 2,9% Transport 99 122 151 193 244 2,1% 2,2% 2,4% Household, Service, Agriculture 257 341 416 535 671 2,9% 2,0% 2,4%
CO2 Emissions (Mt of CO2), of which: 1217 1708 2358 3373 4652 3,4% 3,3% 3,5%Electricity generation 379 536 684 978 1413 3,5% 2,5% 3,7%Industry 201 242 270 335 402 -1,5% 1,1% 2,0%Transport 275 365 454 578 732 2,9% 2,2% 2,4%Household, Service, Agriculture 163 283 598 998 1398 5,7% 7,8% 4,3%
%/ year
Africa, Middle East
135

1990 2000 2010 2020 2030 1990/00 2000/10 2010/30Overall indicators Population (Million) 435 514 589 658 717 1,7% 1,4% 1,0%GDP (G € 99 ppp) 2498 3455 4940 6783 8840 3,3% 3,6% 3,0%Per capita GDP (1000 € 99/cap) 5,7 6,7 8,4 10,3 12,3 1,6% 2,2% 1,9%Gross Inland Cons/GDP (toe/1000 € 99) 182 178 160 151 142 -0,2% -1,1% -0,6%Gross Inland Cons per capita (toe/cap) 1,0 1,2 1,3 1,6 1,7 1,3% 1,1% 1,3%% renewables in gross inland consumption 22% 21% 22% 20% 19% -0,2% 0,4% -0,9%Electr. Consumption per capita (kWh/cap) 1,1 1,6 2,0 2,6 3,3 3,4% 2,5% 2,4%CO2 Emissions per capita (t of CO2/cap) 2,1 2,5 2,8 3,3 3,8 1,8% 0,9% 1,6%Transport fuels per capita (toe/cap) 0,25 0,29 0,34 0,40 0,46 1,7% 1,6% 1,4%
Primary Production (Mtoe) 577 808 1217 1662 2142 3,4% 4,2% 2,9% Coal, lignite 21 24 24 29 38 1,3% -0,3% 2,3% Oil 378 542 815 1100 1407 3,7% 4,2% 2,8% Natural gas 75 103 192 320 451 3,2% 6,4% 4,3% Nuclear 3,2 6,3 9,0 8,8 14,1 7,2% 3,5% 2,3% Hydro,geothermal 34 48 63 79 96 3,5% 2,8% 2,1% Wood and wastes 65 83 112 124 133 2,5% 3,0% 0,9% Wind, solar, small hydro 0,5 0,6 1,1 1,7 2,8 1,3% 5,4% 5,0%
Gross Inland Consumption (Mtoe) 454 614 788 1024 1251 3,1% 2,5% 2,3% Coal, lignite 20 31 30 37 58 4,2% -0,3% 3,4% Oil 239 334 398 499 605 3,4% 1,8% 2,1% Natural gas 76 103 172 274 345 3,1% 5,2% 3,6% Primary electricity 53 63 76 90 110 1,6% 2,0% 1,9% Wood and wastes 65 83 112 124 133 2,5% 3,0% 0,9%
Electricity Generation (TWh) 608 974 1355 1895 2561 4,8% 3,4% 3,4% Thermal 198 386 573 922 1358 6,9% 4,0% 4,4% of which: Conventional coal, lignite 21 49 50 47 50 8,5% 0,4% -0,1% Advanced coal technology 0 0 15 61 184 13,3% Gas 57 138 354 657 950 9,3% 9,8% 5,1% Biomass 6 11 13 15 18 6,0% 1,9% 1,7% Nuclear 12 25 35 35 58 7,2% 3,5% 2,5% Hydro+Geoth 392 555 734 918 1113 3,5% 2,8% 2,1% Solar 0 0,1 2,2 1,5 0,8 30,6% 38,4% -4,9% Wind 0 0,1 1,2 6,5 19,5 34,8% 27,5% 15,1% Small Hydro 6,3 7,0 8,8 11,2 11,9 1,1% 2,3% 1,5%
CHP 4 7 56 114 124 6,9% 22,3% 4,1%
Final Energy Consumption (Mtoe) 346 469 612 786 950 3,1% 2,7% 2,2% Coal, lignite 13 15 14 17 19 1,1% -0,7% 1,6% Oil 188 254 321 406 492 3,1% 2,4% 2,2% Gas 39 50 66 94 110 2,5% 2,9% 2,6% Heat 0 0 0 0 0 14,9% 0,0% 0,0% Electricity 42 70 103 148 201 5,1% 3,9% 3,4% Wood and wastes 64 81 109 120 128 2,4% 3,1% 0,8%
Industry 137 189 248 315 365 3,3% 2,7% 2,0% Transport 115 150 202 264 327 2,7% 3,0% 2,4% Household, Service, Agriculture 102 129 162 207 257 2,4% 2,3% 2,4%
CO2 Emissions (Mt of CO2), of which: 919 1296 1629 2176 2722 3,5% 2,3% 2,6%Electricity generation 157 283 311 433 620 6,1% 0,9% 3,5%Industry 166 220 272 349 383 2,9% 2,1% 1,7%Transport 321 423 594 784 979 2,8% 3,5% 2,5%Household, Service, Agriculture 86 107 141 180 212 2,2% 2,8% 2,1%
%/ year
Latin America
136
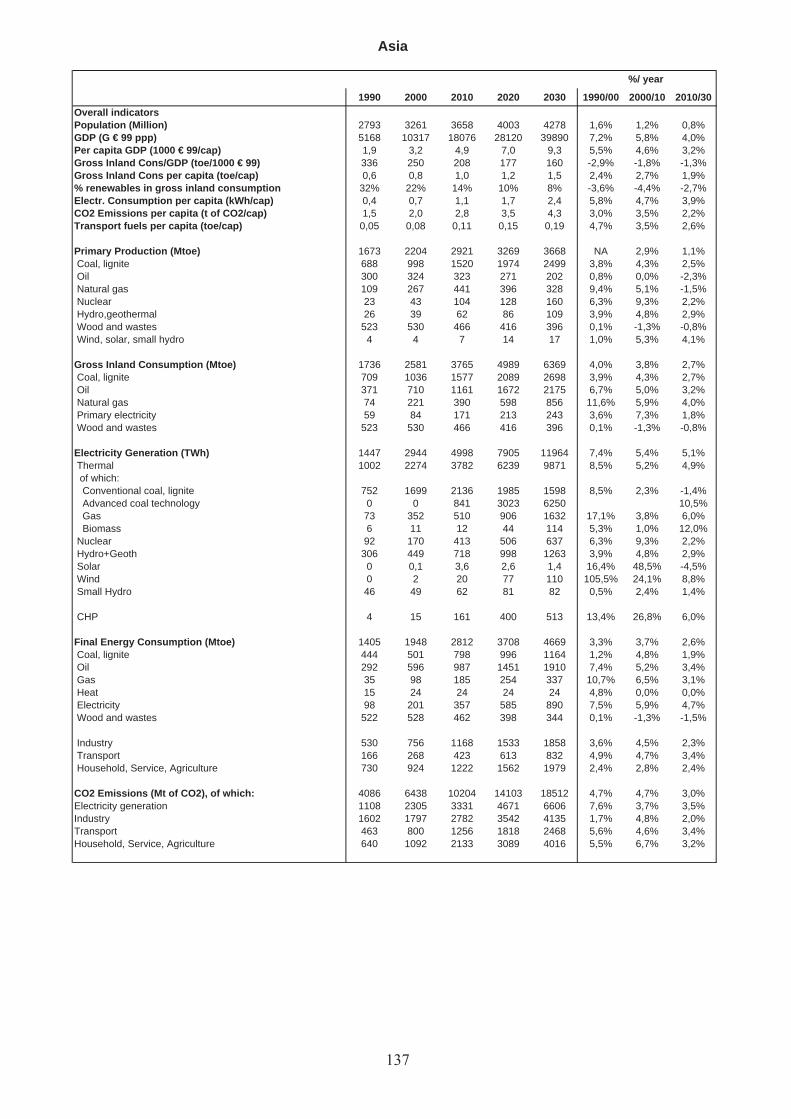
1990 2000 2010 2020 2030 1990/00 2000/10 2010/30Overall indicators Population (Million) 2793 3261 3658 4003 4278 1,6% 1,2% 0,8%GDP (G € 99 ppp) 5168 10317 18076 28120 39890 7,2% 5,8% 4,0%Per capita GDP (1000 € 99/cap) 1,9 3,2 4,9 7,0 9,3 5,5% 4,6% 3,2%Gross Inland Cons/GDP (toe/1000 € 99) 336 250 208 177 160 -2,9% -1,8% -1,3%Gross Inland Cons per capita (toe/cap) 0,6 0,8 1,0 1,2 1,5 2,4% 2,7% 1,9%% renewables in gross inland consumption 32% 22% 14% 10% 8% -3,6% -4,4% -2,7%Electr. Consumption per capita (kWh/cap) 0,4 0,7 1,1 1,7 2,4 5,8% 4,7% 3,9%CO2 Emissions per capita (t of CO2/cap) 1,5 2,0 2,8 3,5 4,3 3,0% 3,5% 2,2%Transport fuels per capita (toe/cap) 0,05 0,08 0,11 0,15 0,19 4,7% 3,5% 2,6%
Primary Production (Mtoe) 1673 2204 2921 3269 3668 NA 2,9% 1,1% Coal, lignite 688 998 1520 1974 2499 3,8% 4,3% 2,5% Oil 300 324 323 271 202 0,8% 0,0% -2,3% Natural gas 109 267 441 396 328 9,4% 5,1% -1,5% Nuclear 23 43 104 128 160 6,3% 9,3% 2,2% Hydro,geothermal 26 39 62 86 109 3,9% 4,8% 2,9% Wood and wastes 523 530 466 416 396 0,1% -1,3% -0,8% Wind, solar, small hydro 4 4 7 14 17 1,0% 5,3% 4,1%
Gross Inland Consumption (Mtoe) 1736 2581 3765 4989 6369 4,0% 3,8% 2,7% Coal, lignite 709 1036 1577 2089 2698 3,9% 4,3% 2,7% Oil 371 710 1161 1672 2175 6,7% 5,0% 3,2% Natural gas 74 221 390 598 856 11,6% 5,9% 4,0% Primary electricity 59 84 171 213 243 3,6% 7,3% 1,8% Wood and wastes 523 530 466 416 396 0,1% -1,3% -0,8%
Electricity Generation (TWh) 1447 2944 4998 7905 11964 7,4% 5,4% 5,1% Thermal 1002 2274 3782 6239 9871 8,5% 5,2% 4,9% of which: Conventional coal, lignite 752 1699 2136 1985 1598 8,5% 2,3% -1,4% Advanced coal technology 0 0 841 3023 6250 10,5% Gas 73 352 510 906 1632 17,1% 3,8% 6,0% Biomass 6 11 12 44 114 5,3% 1,0% 12,0% Nuclear 92 170 413 506 637 6,3% 9,3% 2,2% Hydro+Geoth 306 449 718 998 1263 3,9% 4,8% 2,9% Solar 0 0,1 3,6 2,6 1,4 16,4% 48,5% -4,5% Wind 0 2 20 77 110 105,5% 24,1% 8,8% Small Hydro 46 49 62 81 82 0,5% 2,4% 1,4%
CHP 4 15 161 400 513 13,4% 26,8% 6,0%
Final Energy Consumption (Mtoe) 1405 1948 2812 3708 4669 3,3% 3,7% 2,6% Coal, lignite 444 501 798 996 1164 1,2% 4,8% 1,9% Oil 292 596 987 1451 1910 7,4% 5,2% 3,4% Gas 35 98 185 254 337 10,7% 6,5% 3,1% Heat 15 24 24 24 24 4,8% 0,0% 0,0% Electricity 98 201 357 585 890 7,5% 5,9% 4,7% Wood and wastes 522 528 462 398 344 0,1% -1,3% -1,5%
Industry 530 756 1168 1533 1858 3,6% 4,5% 2,3% Transport 166 268 423 613 832 4,9% 4,7% 3,4% Household, Service, Agriculture 730 924 1222 1562 1979 2,4% 2,8% 2,4%
CO2 Emissions (Mt of CO2), of which: 4086 6438 10204 14103 18512 4,7% 4,7% 3,0%Electricity generation 1108 2305 3331 4671 6606 7,6% 3,7% 3,5%Industry 1602 1797 2782 3542 4135 1,7% 4,8% 2,0%Transport 463 800 1256 1818 2468 5,6% 4,6% 3,4%Household, Service, Agriculture 640 1092 2133 3089 4016 5,5% 6,7% 3,2%
Asia
%/ year
137

European Commission
EUR 20366 — World energy, technology and climate policy outlook 2030 — WETO
Luxembourg: Office for Official Publications of the European Communities
2003 — VI, 137 pp. — 21 x 29.7 cm
ISBN 92-894-4186-0
Price (excluding VAT) in Luxembourg: EUR 20

‘Energy, environment and sustainable development’ programmeEuropean CommissionDirectorate-General for ResearchContact: Domenico Rossetti di ValdalberoTel. (32-2) 29-62811Fax (32-2) 29-94991E-mail: [email protected]
Interested in European research?
RTD info is our quarterly magazine keeping you in touch with main developments (results, programmes, events, etc.). It is available in English, French and German. A free sample copy or free subscription can be obtained from:
European CommissionDirectorate-General for ResearchInformation and Communication Unit B-1049 BrusselsFax (32-2) 29-58220E-mail: [email protected]: http://europa.eu.int/comm/research/
Photograph of Thalys on cover page by courtesy of Thalys International
BELGIQUE/BELGIË
Jean De LannoyAvenue du Roi 202/Koningslaan 202B-1190 Bruxelles/BrusselTél. (32-2) 538 43 08Fax (32-2) 538 08 41E-mail: [email protected]: http://www.jean-de-lannoy.be
La librairie européenne/De Europese BoekhandelRue de la Loi 244/Wetstraat 244B-1040 Bruxelles/BrusselTél. (32-2) 295 26 39Fax (32-2) 735 08 60E-mail: [email protected]: http://www.libeurop.be
Moniteur belge/Belgisch StaatsbladRue de Louvain 40-42/Leuvenseweg 40-42B-1000 Bruxelles/BrusselTél. (32-2) 552 22 11Fax (32-2) 511 01 84E-mail: [email protected]
DANMARK
J. H. Schultz Information A/SHerstedvang 12DK-2620 AlbertslundTlf. (45) 43 63 23 00Fax (45) 43 63 19 69E-mail: [email protected]: http://www.schultz.dk
DEUTSCHLAND
Bundesanzeiger Verlag GmbHVertriebsabteilungAmsterdamer Straße 192D-50735 KölnTel. (49-221) 97 66 80Fax (49-221) 97 66 82 78E-Mail: [email protected]: http://www.bundesanzeiger.de
ELLADA/GREECE
G. C. Eleftheroudakis SAInternational BookstorePanepistimiou 17GR-10564 AthinaTel. (30-1) 331 41 80/1/2/3/4/5Fax (30-1) 325 84 99E-mail: [email protected]: [email protected]
ESPAÑA
Boletín Oficial del EstadoTrafalgar, 27E-28071 MadridTel. (34) 915 38 21 11 (libros)Tel. (34) 913 84 17 15 (suscripción)Fax (34) 915 38 21 21 (libros),Fax (34) 913 84 17 14 (suscripción)E-mail: [email protected]: http://www.boe.es
Mundi Prensa Libros, SACastelló, 37E-28001 MadridTel. (34) 914 36 37 00Fax (34) 915 75 39 98E-mail: [email protected]: http://www.mundiprensa.com
FRANCE
Journal officielService des publications des CE26, rue DesaixF-75727 Paris Cedex 15Tél. (33) 140 58 77 31Fax (33) 140 58 77 00E-mail: [email protected]: http://www.journal-officiel.gouv.fr
IRELAND
Alan Hanna’s Bookshop270 Lower Rathmines RoadDublin 6Tel. (353-1) 496 73 98Fax (353-1) 496 02 28E-mail: [email protected]
ITALIA
Licosa SpAVia Duca di Calabria, 1/1Casella postale 552I-50125 FirenzeTel. (39) 055 64 83 1Fax (39) 055 64 12 57E-mail: [email protected]: http://www.licosa.com
LUXEMBOURG
Messageries du livre SARL5, rue RaiffeisenL-2411 LuxembourgTél. (352) 40 10 20Fax (352) 49 06 61E-mail: [email protected]: http://www.mdl.lu
NEDERLAND
SDU Servicecentrum Uitgevers
Christoffel Plantijnstraat 2Postbus 200142500 EA Den HaagTel. (31-70) 378 98 80Fax (31-70) 378 97 83E-mail: [email protected]: http://www.sdu.nl
PORTUGAL
Distribuidora de Livros Bertrand Ld.ª
Grupo Bertrand, SARua das Terras dos Vales, 4-AApartado 60037P-2700 AmadoraTel. (351) 214 95 87 87Fax (351) 214 96 02 55E-mail: [email protected]
Imprensa Nacional-Casa da Moeda, SA
Sector de Publicações OficiaisRua da Escola Politécnica, 135P-1250-100 Lisboa CodexTel. (351) 213 94 57 00Fax (351) 213 94 57 50E-mail: [email protected]: http://www.incm.pt
SUOMI/FINLAND
Akateeminen Kirjakauppa/Akademiska Bokhandeln
Keskuskatu 1/Centralgatan 1PL/PB 128FIN-00101 Helsinki/HelsingforsP./tfn (358-9) 121 44 18F./fax (358-9) 121 44 35Sähköposti: [email protected]: http://www.akateeminen.com
SVERIGE
BTJ AB
Traktorvägen 11-13S-221 82 LundTlf. (46-46) 18 00 00Fax (46-46) 30 79 47E-post: [email protected]: http://www.btj.se
UNITED KINGDOM
The Stationery Office Ltd
Customer ServicesPO Box 29Norwich NR3 1GNTel. (44) 870 60 05-522Fax (44) 870 60 05-533E-mail: [email protected]: http://www.itsofficial.net
ÍSLAND
Bokabud Larusar Blöndal
Skólavördustig, 2IS-101 ReykjavikTel. (354) 552 55 40Fax (354) 552 55 60E-mail: [email protected]
SCHWEIZ/SUISSE/SVIZZERA
Euro Info Center Schweiz
c/o OSEC Business Network SwitzerlandStampfenbachstraße 85PF 492CH-8035 ZürichTel. (41-1) 365 53 15Fax (41-1) 365 54 11E-mail: [email protected]: http://www.osec.ch/eics
B@LGARIJA
Europress Euromedia Ltd
59, blvd VitoshaBG-1000 SofiaTel. (359-2) 980 37 66Fax (359-2) 980 42 30E-mail: [email protected]: http://www.europress.bg
CYPRUS
Cyprus Chamber of Commerce and Industry
PO Box 21455CY-1509 NicosiaTel. (357-2) 88 97 52Fax (357-2) 66 10 44E-mail: [email protected]
EESTI
Eesti Kaubandus-Tööstuskoda
(Estonian Chamber of Commerce and Industry)Toom-Kooli 17EE-10130 TallinnTel. (372) 646 02 44Fax (372) 646 02 45E-mail: [email protected]: http://www.koda.ee
HRVATSKA
Mediatrade LtdPavla Hatza 1HR-10000 ZagrebTel. (385-1) 481 94 11Fax (385-1) 481 94 11
MAGYARORSZÁG
Euro Info ServiceSzt. István krt.12III emelet 1/APO Box 1039H-1137 BudapestTel. (36-1) 329 21 70Fax (36-1) 349 20 53E-mail: [email protected]: http://www.euroinfo.hu
MALTA
Miller Distributors LtdMalta International AirportPO Box 25Luqa LQA 05Tel. (356) 66 44 88Fax (356) 67 67 99E-mail: [email protected]
NORGE
Swets Blackwell ASHans Nielsen Hauges gt. 39Boks 4901 NydalenN-0423 OsloTel. (47) 23 40 00 00Fax (47) 23 40 00 01E-mail: [email protected]: http://www.swetsblackwell.com.no
POLSKA
Ars PolonaKrakowskie Przedmiescie 7Skr. pocztowa 1001PL-00-950 WarszawaTel. (48-22) 826 12 01Fax (48-22) 826 62 40E-mail: [email protected]
ROMÂNIA
EuromediaStr.Dionisie Lupu nr. 65, sector 1RO-70184 BucurestiTel. (40-1) 315 44 03Fax (40-1) 312 96 46E-mail: [email protected]
SLOVAKIA
Centrum VTI SRNám. Slobody, 19SK-81223 BratislavaTel. (421-7) 54 41 83 64Fax (421-7) 54 41 83 64E-mail: [email protected]: http://www.sltk.stuba.sk
SLOVENIJA
GV ZalozbaDunajska cesta 5SLO-1000 LjubljanaTel. (386) 613 09 1804Fax (386) 613 09 1805E-mail: [email protected]: http://www.gvzalozba.si
TÜRKIYE
Dünya Infotel AS100, Yil Mahallessi 34440TR-80050 Bagcilar-IstanbulTel. (90-212) 629 46 89Fax (90-212) 629 46 27E-mail: [email protected]
ARGENTINA
World Publications SAAv. Cordoba 1877C1120 AAA Buenos AiresTel. (54-11) 48 15 81 56Fax (54-11) 48 15 81 56E-mail: [email protected]: http://www.wpbooks.com.ar
AUSTRALIA
Hunter PublicationsPO Box 404Abbotsford, Victoria 3067Tel. (61-3) 94 17 53 61Fax (61-3) 94 19 71 54E-mail: [email protected]
BRESIL
Livraria CamõesRua Bittencourt da Silva, 12 CCEP20043-900 Rio de JaneiroTel. (55-21) 262 47 76Fax (55-21) 262 47 76E-mail: [email protected]: http://www.incm.com.br
CANADA
Les éditions La Liberté Inc.3020, chemin Sainte-FoySainte-Foy, Québec G1X 3V6Tel. (1-418) 658 37 63Fax (1-800) 567 54 49E-mail: [email protected]
Renouf Publishing Co. Ltd5369 Chemin Canotek Road, Unit 1Ottawa, Ontario K1J 9J3Tel. (1-613) 745 26 65Fax (1-613) 745 76 60E-mail: [email protected]: http://www.renoufbooks.com
EGYPT
The Middle East Observer41 Sherif StreetCairoTel. (20-2) 392 69 19Fax (20-2) 393 97 32E-mail: [email protected]: http://www.meobserver.com.eg
MALAYSIA
EBIC MalaysiaSuite 45.02, Level 45Plaza MBf (Letter Box 45)8 Jalan Yap Kwan Seng50450 Kuala LumpurTel. (60-3) 21 62 92 98Fax (60-3) 21 62 61 98E-mail: [email protected]
MÉXICO
Mundi Prensa México, SA de CVRío Pánuco, 141Colonia CuauhtémocMX-06500 México, DFTel. (52-5) 533 56 58Fax (52-5) 514 67 99E-mail: [email protected]
SOUTH AFRICA
Eurochamber of Commerce in South AfricaPO Box 7817382146 SandtonTel. (27-11) 884 39 52Fax (27-11) 883 55 73E-mail: [email protected]
SOUTH KOREA
The European Union Chamber ofCommerce in Korea5th FI, The Shilla Hotel202, Jangchung-dong 2 Ga, Chung-kuSeoul 100-392Tel. (82-2) 22 53-5631/4Fax (82-2) 22 53-5635/6E-mail: [email protected]: http://www.eucck.org
SRI LANKA
EBIC Sri LankaTrans Asia Hotel115 Sir ChittampalamA. Gardiner MawathaColombo 2Tel. (94-1) 074 71 50 78Fax (94-1) 44 87 79E-mail: [email protected]
T’AI-WAN
Tycoon Information IncPO Box 81-466105 TaipeiTel. (886-2) 87 12 88 86Fax (886-2) 87 12 47 47E-mail: [email protected]
UNITED STATES OF AMERICA
Bernan Associates4611-F Assembly DriveLanham MD 20706-4391Tel. (1-800) 274 44 47 (toll free telephone)Fax (1-800) 865 34 50 (toll free fax)E-mail: [email protected]: http://www.bernan.com
ANDERE LÄNDEROTHER COUNTRIESAUTRES PAYS
Bitte wenden Sie sich an ein Büro IhrerWahl/Please contact the sales office ofyour choice/Veuillez vous adresser aubureau de vente de votre choixOffice for Official Publications of the EuropeanCommunities2, rue MercierL-2985 LuxembourgTel. (352) 29 29-42455Fax (352) 29 29-42758E-mail: [email protected]: publications.eu.int
2/2002
Venta • Salg • Verkauf • Pvlèseiw • Sales • Vente • Vendita • Verkoop • Venda • Myynti • Försäljninghttp://eur-op.eu.int/general/en/s-ad.htm

E u r o p e a n C o m m i s s i o n
World energy, technology and climate policy outlook
Community research
EUR 20366
2030WETO
15K
I-NA
-20366-EN
-C
OFFICE FOR OFFICIAL PUBLICATIONSOF THE EUROPEAN COMMUNITIES
L-2985 Luxembourg
Price (excluding VAT) in Luxembourg: EUR 20
The world energy, technology and climate policy outlook (WETO) positions Europe in aglobal context. It provides a coherent framework to analyse the energy, technology andenvironment trends and issues over the period from now to 2030. In this way, it supportslong-term European policy-making particularly considering the questions related to (1) thesecurity of energy supply; (2) the European research area; (3) Kyoto targets and beyond.
Using the POLES energy model and starting from a set of clear key assumptions on economic activity, population and hydrocarbon resources, WETO describes in detail the evolution of world and European energy systems, taking into account the impacts ofclimate change policies.
The reference scenario encompasses international energy prices, primary fuel supply (oil,gas and coal), energy demand (global, regional and sectoral), power generation technologiesand carbon dioxide emissions trends. To face uncertainties, WETO presents alternativescenarios corresponding to different assumptions on availability of oil and gas resources(low/high cases) and on technological progress (gas, coal, nuclear and renewable cases).
Two major policy issues are addressed: (1) the outlook of the European Union gas marketin a world perspective (impressive growth in gas demand and increasing dependence onenergy imports); (2) the impacts of greenhouse gas emission reduction policies on theworld energy system and on progress in power generation technologies.
The rigorous analysis of long-term scenarios, with particular attention to the EuropeanUnion in a global context, will enable policy-makers to define better energy, technologyand environmental policies for a sustainable future.
World
energy, tech
nolo
gy and clim
ate policy o
utlo
ok 2
030 —
WETO
EC
EU
R 20366

5-1
5 Reducing Emissions from Energy Supply
As discussed in Chapters 3 and 4, by 2100 global energy demand is projected to grow by a factor of three from today’s level (from about 400 to 1200 EJ), even under scenarios that assume energy efficiency improves over time. Growth in global electricity demand is projected to increase faster than direct use of fuels in end use applications; electricity use grows by a factor of eight – from about 50 EJ/year in 2000 to almost 400 EJ/year in 2100 in the Reference Case. In addition, use of petroleum products for transportation is also projected to rise with growing population and increased standard of living. In the Reference Case, transportation energy use grows by almost a factor of four – from about 80 EJ/year in 2000 to almost 300 EJ/year in 2100. If the mix of energy supply options does not change, a large portion of energy demand in the future will be met by combustion of fossil fuels, and the resulting emissions of CO2 would be expected to grow steadily over the course of the 21st Century. The development of advanced technologies that can significantly reduce emissions of CO2 from energy supply is a central component of the U.S. Climate Change Technology Strategy. Many technological opportunities exist for pursuing low or near-net-zero emissions energy supplies, which a coordinated Federal R&D investment plan can facilitate. Some build on the existing energy infrastructure, dominated by coal and other fossil fuels. They attempt to “close the loop on carbon.” The central technology in this scenario is advanced coal-based production facilities, usually starting with coal gasification and production of syngas, which can generate electricity, hydrogen, other valued fuels and chemicals, while also capturing and sequestering emissions of CO2 and emitting very low levels of other pollutants. Other near-term opportunities exist for dramatically increasing the efficiency of fossil fuel generation through increased use of combined heat and power. Approaches for carbon capture for other fossil fuels that will be required for atmospheric CO2 stabilization have yet to emerge clearly. Other options envision a “new energy backbone” based, in part, on continuing advances in coal-based and other energy technology systems, but significantly augmented by new and advanced, low- or near-net zero GHG-emitting energy supply technologies. These include advanced forms of: renewable energy, such as wind, photovoltaics, solar thermal applications, and others; biologically based open and closed energy cycles, such as enhanced systems for bio-mass, bio-energy, bio-fuels, and refuse-derived fuels and energy; and forms of nuclear energy, including spent fuel recycling. If GHG emissions need to be reduced significantly, massive deployment of all of these technology options would be required. In all of the Advanced Technology Scenarios examined by CCTP, zero-carbon energy sources played a role in reducing emissions toward the target trajectories (see Chapter 3). The cumulative (2000-2100) CO2 reduction attributable to net carbon-free energy supply (biomass, nuclear, hydropower, geothermal, wind and solar) ranged from 8 GtC in the Closing the Loop on Carbon case that led to the low emission
Formatted: Subscript
Comment: [Editorial note: it might be useful to show a graph showing the current share of zero-emission contribution by fuel source; the listing of carbon-free sources should be listed in the order in which they contribute.]
Deleted: technology
Comment: It is a given that the government would only promote and support technologies (nuclear and others) that meet “expectations for safety and security concerns.” So this does not have to be stated, especially juxtaposed with nuclear energy. If you want to leave this qualifier at the end of the list, move nuclear forward so that the qualifier immediately follows something else. (This Administration got off defense when it comes to nuclear when the NEP was issued.)
Deleted: , that can also meet expectations for safety and security concerns
Deleted: have to scale up several orders of magnitude from that of today
Deleted: and renewable energy
Deleted: such as

5-2
reduction trajectory, to 324 GtC in the New Energy Backbone case that led to the very high emission reduction trajectory. (In that New Energy Backbone case, nuclear, biomass and renewable energy make about equal contributions to the 324 GtC reduction).
Ref: Key World Energy Statistics—2003, International Energy Agency
Figure 5-1. World Electricity Generation
World Total Primary Energy Supply
Coal23.0%
Oil35.8%
Nat. Gas20.9%
Nuclear6.8%
Hydro2.2%
Other0.5%
Comb. Ren. & Waste10.8%
Figure 5-2. World Primary Energy Supply Source: IEA “Key World Energy Statistics—2003”
There is also a role for additional technology options “beyond the standard suite.” These might include advanced fuel cycles based on combinations of nano-technology and new forms of bio-assisted energy
World Electricity Generation
Coal38.7%
Oil7.5%
Nat. Gas 18.3%
Nuclear 17.1%
Hydro 16.6%
Other1.8%
Formatted: Font: Italic
Deleted: 360
Comment: Not a good segue to the “Beyond the Standard Suite” paragraph. What are the limiting factors (cost?, rate of growth?) on the new technologies that will keep them from being sufficient? Over nearly 100 years, how do we even know what the limits to construction and market penetration will be? Additionally, this and “In this event” in the next sentence imply that the “Beyond the Standard Suite” technologies will only be considered if the “New Energy Backbone” technologies are insufficient.
Deleted: All of the above technology options may succeed to one extent or another. All might compete successfully in various segments of global markets for energy supply. All may satisfactorily address their attendant environmental challenges. The extent of their successes, in terms of absolute contributions to energy supply, may in fact turn out to be many times larger than their respective markets of today. Yet, even with such great successes, the total amount of energy supplied from these sources may not be sufficient to meet the clean energy demands of future generations .
Comment: All statistical charts and tables need to be referenced.
Deleted: In this event, there may be a need

5-3
production, using genetically-designed organisms for more efficient photosynthesis, hydrogen production or photon-water splitting, and CO2 capture and sequestration. They might include advanced technologies for capturing solar energy in Earth orbit, on the moon, or in the vast desert areas of Earth, enabled, in part, by new forms of energy carriers and/or low-resistance power transmission over long-distances. They would likely include breakthrough designs in fusion energy that reduce its cost and increase its rate of deployment. While requiring substantial development, fusion energy has the potential for contributing significantly, and it, like nuclear fission and renewable energy, is an option where the fuel resources are essentially inexhaustible. Since outcomes of these technology development scenarios are not known, a prudent path for R&D planning in the face of uncertainty is to diversify. The current Federal portfolio supports technology R&D important to all three of the above-mentioned technology scenarios. The analysis of the scearios, in turn, suggests that, through successful implementation of these technologies, the UNFCCC goal could be attainded across a wide range of hypothesized concentration levels, and so accomplished both sooner and with significant cost savings over what would otherwise be the case without such technological advance. A range of CCTP planning scenarios were designed to explore the potential roles for advanced energy technologies to slow the rate of CO2 emissions. These scenarios examined ways to reduce emissions from energy supply, while also supporting the energy demands of robust economic growth. All of the “energy supply” scenarios assumed, a priori, that the other important components of any comprehensive technology strategy were successful, e.g., the scenarios also included large gains in energy efficiency (see Chapter 3). The scenarios show that no single technology or energy source would likely meet all of the world’s energy needs or serve as the perfect solution for reducing carbon emissions. Some technologies with significant potential fell into the following categories: Low-Emission, Fossil-Based Fuels and Power Hydrogen as an Energy Carrier Renewable Energy and Fuels Nuclear Fission Fusion Energy
This chapter explores each of these technologies in depth, explaining the current research portfolio as well as future research directions.
5.1 Low-Emission, Fossil-Based Power
Today, fossil fuels are an indispensable part of the U.S. and global energy mix. Because of its abundance and low cost, coal now accounts for more than half of the electricity generated in the United States, and it is projected to continue to supply over one half of our electricity demands through the year 2025. Natural gas will also continue to be the “bridge” energy resource, and offers significant efficiency improvements (and emissions reductions in distributed energy and combined heat and power applications.
Deleted: molecules
Deleted: plan
Deleted: se
Comment: Original wording implies a lack of confidence.
Deleted: if such technolgies were successful
Deleted: Nuclear

5-4
5.1.1 Potential Role of Technology
Because coal is America’s most plentiful and readily available energy resource, the United States Department of Energy (DOE) has directed a portion of its research and development (R&D) resources toward finding ways to use coal in a more efficient, cost-effective, and environmentally benign manner, ultimately leading to near-zero emissions. Even small improvements in efficiency of the installed base of coal-fueled power stations, through technologies such as combined heat and power, will result in a significant lowering of carbon emissions. For example, increasing the efficiency of all current coal-fired electric generation capacity in the United States by one percentage point would avoid the emission of 14 million tons of carbon per year (emission avoidance will rise in future years as capacity and efficiency are increased). That reduction is equivalent to replacing about 170 million incandescent light bulbs with florescent lights or weatherizing 140 million homes. New U.S. government-industry collaborative efforts are expected to continue to find ways to improve our ability to decrease emissions from coal power generation at lower costs. The goal for future power plant designs is to both increase efficiency and reduce environmental issues by developing coal-based zero emission power plants. Moreover, the focus is on designs that are compatible with carbon sequestration technology.
5.1.2 Technology Strategy
The current U.S fossil research portfolio is a fully integrated program with mid- and long-term market entry offerings. The principal goal is a zero emissions, 60 percent efficient, coal-based electricity generation plant that has the ability to co-produce low-cost hydrogen. The mid-term manifestation for that goal is expected to be the FutureGen project, which will be a cost-shared $1 billion venture that will combine electricity and hydrogen production with the elimination of virtually all emissions of air pollutants such as sulfur dioxide, nitrogen oxides, and mercury, as well as almost complete elimination of CO2, through a combination of efficiency improvements and sequestration (see Figure 5-3). This prototype power plant will serve as the test bed for proving the most advanced technologies, such as hydrogen fuel cells.
5.1.3 Current Portfolio
The low emissions fossil-based power system portfolio has several major thrusts: Advanced Power Systems: Advanced coal-fired power generation technologies can achieve very
significant reduction in CO2 emissions while providing a reliable, efficient supply of electricity. See: http://www.climatetechnology.gov/library/2003/tech-options/tech-options-2-1-2.pdf Significant reductions in CO2 emissions have been demonstrated via efficiency improvements and co-firing of coal with biomass. While current fleet average power plant efficiencies are around 33 percent, increasing efficiencies to 50 percent in the mid-term, and ultimately to 60 percent (with the integration of fuel cell technology) will nearly halve emissions of CO2 per unit of electricity. Development/deployment of CO2 sequestration technology could reduce carbon emissions to near-zero levels. Recent R&D activities have focused on integrated gasification, combined-cycle (IGCC) plants. Two U.S. IGCC demonstration plants are in operation.
Deleted: principle
Deleted: ]
Deleted: improvements in reducing
Deleted: ,
Deleted: , and other carbonatious fuels
Deleted: or more
Deleted: a portfolio of high-efficiency coal power systems including
Deleted: , pressurized fluidized bed combustion, and Vision 21
Deleted: Four
Deleted: various stages of completion

5-5
Distributed Generation/Fuel Cells: The fuel cell program is focused on reducing the cost of fuel cell technology by an order of magnitude. See: http://www.climatetechnology.gov/library/2003/tech-options/tech-options-2-1-3.pdf In the near and mid-term, this will enable the widespread deployment of natural gas fueled distributed generation in gas-only, combined heat and power, and fuel cell applications. In the mid-to long-term, this technology, along with others being develop as part of the Distributed Generation effort, will support coal-based FutureGen/central station applications. The goal is to develop a modular power system with lower cost and significantly lower carbon dioxide emissions than current plants. Examples of current R&D projects in this area include: (1) high-temperature fuel cell performance advancement for fuel cell turbine (FCT) hybrid application, (2) large gas turbines for hybrid FCT application, (3) hybrid systems and component demonstration, (4) low-cost fuel cell systems, (5) hydrogen storage, separation, and transport, (6) high-performance materials, catalysts, and processes for reforming methane, and (7) membranes for separation of air, hydrogen, and CO2.
Co-Production/Hydrogen: Co-production technology focuses on developing technology to co-
produce electricity and hydrogen from coal and perhaps coal/biomass blends with very large reductions in CO2 emissions compared to present technologies. See: http://www.climatetechnology.gov/library/2003/tech-options/tech-options-2-1-1.pdf This technology uses synthesis gas generated from coal gasification to produce hydrogen.
Carbon emissions are expected to be reduced in the near-term principally by improving process efficiency and in the longer term via more advanced system components such as high-efficiency fuel cells. In both the near and long-term, incorporating CO2 collection into the process, followed by permanent sequestration will be required to achieve zero emissions. Current R&D activities have focuses on: (1) ion transport oxygen separation membranes, (2) hydrogen separation membranes, and (3) early-entrance co-production plant designs. 5.1.4 Future Research Directions
The current low-emission fossil-based power portfolio supports all of the components needed to achieve the stated objectives. However, there are areas where increased R&D could reduce risk and accelerate the introduction of technologies. Some of these include: (1) enhancing the hydrogen production technology effort, (2) adding advanced hybrid gasification/combustion – which offers an alternate path to achieve many of the program goals, (3) accelerating testing at FutureGen, and (4) broadening advanced research in materials development – which offers enormous potential benefits in system efficiency, durability, and performance.
5.2 Hydrogen
As discussed above, in a long-term future characterized by low or near net-zero emissions of greenhouse gases, global energy primary supply could continue its reliance on fossil fuels, provided there were suitable means for capturing and sequestering the resulting emissions of carbon dioxide (CO2). Alternatively, the world could increase reliance on low carbon and non-fossil energy sources. These approaches share a need for carbonless energy carriers, such as electricity or some alternative, to store and
Deleted: , clean, reliable fuel cells for
Deleted: , high quality electricity,
Deleted: , and storage
Deleted: The
Deleted: the
Deleted: Vision 21
Deleted: Vision 21
Comment: Doing R&D to reduce “risk” has become a cliché; we state it automatically as if everyone understands and agrees that there are risks that the government needs to alleviate. The average reader may wonder exactly what risks we are talking about.
Deleted: in 2008

5-6
deliver energy on demand to end-users. Electricity is increasingly the carbonless energy carrier of choice for stationary energy consumers, but hydrogen could prove to be an attractive carrier for the
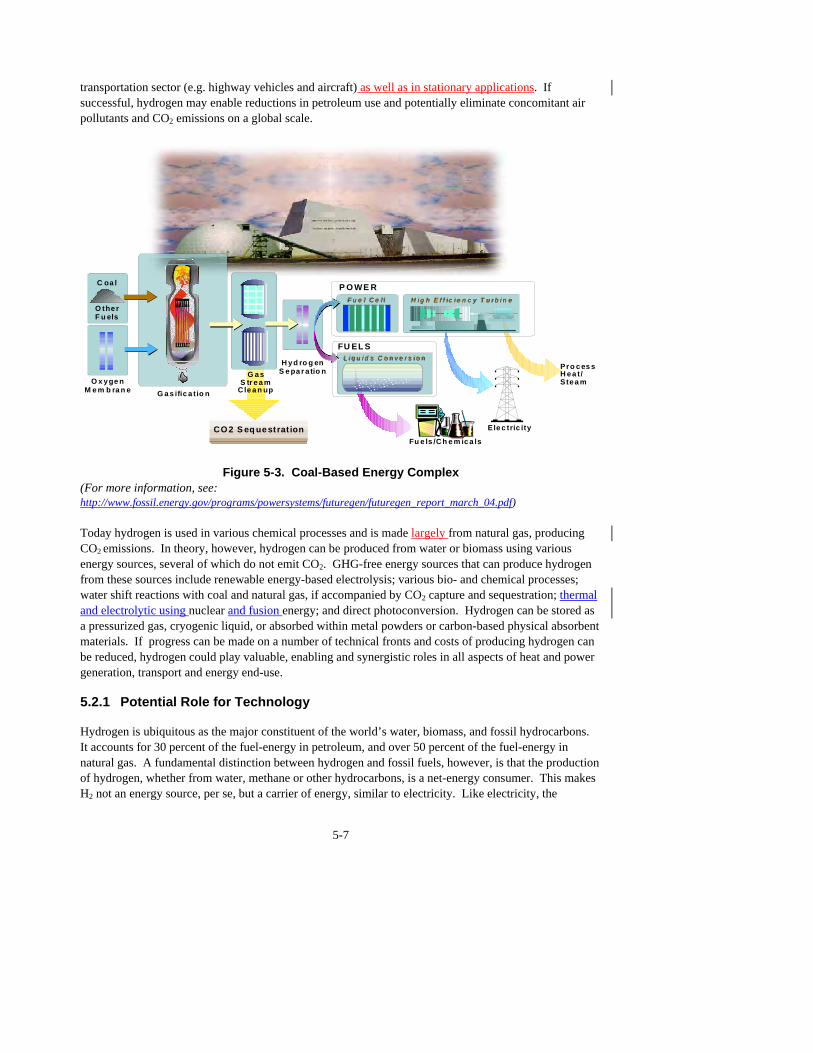
5-7
transportation sector (e.g. highway vehicles and aircraft) as well as in stationary applications. If successful, hydrogen may enable reductions in petroleum use and potentially eliminate concomitant air pollutants and CO2 emissions on a global scale.
CO 2 S eq ue st rat ion
O x y ge n M e m b ra n e
Ele c tric ity
Pro c es sH e a t/Ste a m
P O WE R
FU EL S
H y d ro g enS e pa r a tio n
G a s ific a t io n
G a sS tr e a m
Cle a n up
Fu e ls /C h e m ic a ls
Fue l Ce llF ue l C ell
L iqu id s C onver s ionL iqu ids Conve rs ion
H ig h E ff ic ien cy T urb in eH igh E ff ic ie ncy T ur b ine
C oa l
O the rF u els
Figure 5-3. Coal-Based Energy Complex (For more information, see: http://www.fossil.energy.gov/programs/powersystems/futuregen/futuregen_report_march_04.pdf) Today hydrogen is used in various chemical processes and is made largely from natural gas, producing CO2 emissions. In theory, however, hydrogen can be produced from water or biomass using various energy sources, several of which do not emit CO2. GHG-free energy sources that can produce hydrogen from these sources include renewable energy-based electrolysis; various bio- and chemical processes; water shift reactions with coal and natural gas, if accompanied by CO2 capture and sequestration; thermal and electrolytic using nuclear and fusion energy; and direct photoconversion. Hydrogen can be stored as a pressurized gas, cryogenic liquid, or absorbed within metal powders or carbon-based physical absorbent materials. If progress can be made on a number of technical fronts and costs of producing hydrogen can be reduced, hydrogen could play valuable, enabling and synergistic roles in all aspects of heat and power generation, transport and energy end-use.
5.2.1 Potential Role for Technology
Hydrogen is ubiquitous as the major constituent of the world’s water, biomass, and fossil hydrocarbons. It accounts for 30 percent of the fuel-energy in petroleum, and over 50 percent of the fuel-energy in natural gas. A fundamental distinction between hydrogen and fossil fuels, however, is that the production of hydrogen, whether from water, methane or other hydrocarbons, is a net-energy consumer. This makes H2 not an energy source, per se, but a carrier of energy, similar to electricity. Like electricity, the

5-8
potential GHG emissions associated with hydrogen use would arise from the methods of production, storage, and distribution. H2 can be generated at any scale, including central plants, fuel stations, businesses, homes, and perhaps onboard vehicles. In principle, the diversity of scales, methods, and sources of production make H2 a highly versatile fuel, capable of transforming transportation and potentially other energy services by enabling compatibility with any blend of primary energy sources. This versatility opens up possibilities for long-term dynamic optimization of CO2 emissions, technology development lead times, economics, and other factors along many and varied trajectories toward low or near net-zero GHG emissions. In a future “hydrogen economy,” H2 may ultimately serve as a means of linking energy sources to energy uses in ways that are more flexible, secure, reliable, and responsive to consumer demands than today, while also integrating transportation and electricity markets. While its simple molecular structure makes H2 an efficient synthetic fuel to produce, use, and/or convert to electricity, hydrogen’s physical properties make storage and delivery more challenging than most fuels. Consequently, most H2 today is produced at or near its point of use, consuming other fuels (e.g. natural gas) that are easier to handle and distribute. Large H2 demands at petroleum refineries or ammonia (NH3) synthesis plants can justify investment in dedicated H2 pipelines, but smaller or variable demands for H2 are usually met more economically by truck transport of compressed gaseous H2 or cryogenic and liquefied hydrogen (LH2) produced by steam methane reforming. These methods have evolved over decades of industrial experience, with H2 as a niche chemical commodity, produced in amounts (8 billion kg H2/yr) equivalent to about 1 percent (~1EJ/yr) of current primary energy use in the United States. In order for H2 use to scale up from its current position to a global carbonless energy carrier (alongside electricity), new energetically and economically efficient technical approaches would be required for delivery, storage and production methods. Hydrogen production can be a value-added complement to other advanced climate change technologies, such as those aimed at the use of fossil fuels or biomass with CO2 capture and sequestration, and may be the key and enabling component for full deployment of carbonless electricity technologies (advanced fission, fusion, and/or intermittent renewables). In the context of technologies that address climate change, the overarching role for hydrogen is that of a universal, carbonless transportation fuel with other potentially important roles in stationary energy storage and/or distributed combined heat and power (CHP) applications. In the near term, initial deployment of H2 fleet vehicles and uninterrupted power systems may provide early adoption opportunities and exercise the existing H2 delivery and on-site production infrastructure. This will also contribute in other ways, such as improving urban air quality and strengthening electricity supply reliability. This phase of H2 use may also serve as a commercial proving ground for advanced distributed H2 production and conversion technologies using existing storage technology, both stationary and vehicular. In the mid-term, light-duty vehicles likely will be the first large mass market (10-15 EJ/yr in the U.S) for hydrogen. Fuel cells may be particularly attractive in automobiles given their efficiency vs. load characteristics and typical driving patterns. Hydrogen production could occur either in large centralized plants or using distributed production technologies on a more localized level. In the long-term, production technologies must be able to produce hydrogen at a price competitive with gasoline for bulk commercial fuel use in automobiles, freight trucks, aircraft, rail, and ships. This would

5-9
likely require efficient production means and large quantities of reasonable-cost energy supplies, perhaps from sequestered coal, advanced nuclear power, fusion energy, solar, wind, or biomass. Other important factors in the long-term include the cost of hydrogen storage and transportation. Finally, basic science advances in direct water-splitting and solid-state hydrogen storage could possibly permit even lower-cost H2 production, and safer storage, delivery, and utilization in the context of low or near net-zero emission futures for transportation and electricity generation.
5.2.2 Technology Strategy
Introducing H2 into the mix of competitive fuel options and building the foundation for a global hydrogen economy will require a balanced technical approach that envisions a plausible commercialization path, but also respects a triad of long-run uncertainties on a global scale regarding: (i) the scale, composition, and energy intensity of future worldwide transportation demand, and potential substitutes; (ii) the viability and endurance of CO2 sequestration; and (iii) the long-term economics of carbonless energy sources. The influences of these factors shape the urgency, relative importance, economic status, and ideal end-state of a future H2 infrastructure. The Department of Energy’s Hydrogen Program plans to research, develop, and demonstrate the critical technologies (and implement codes and standards for safe use) needed for H2 light-duty vehicles (see Figure 5-4). The program plans to operate in cooperation with automakers and related interests in refueling infrastructure to develop technology necessary to enable a
Figure 5-4. Timeline from the DOE Hydrogen Posture Plan
Deleted: low
Deleted: say,
Deleted:
Deleted:
Deleted: Fuel Cells and Infrastructure Technologies

5-10
commercialization decision by 2015. Success for the program is designed as validation, by 2015, of technology for: Hydrogen storage systems enabling minimum 300-mile vehicle range while meeting identified
packaging, cost, and performance requirements. Hydrogen production from coal and nuclear power to safely and efficiently deliver hydrogen to
consumers at prices competitive with gasoline without adverse environmental impacts. Fuel cells to enable engine costs of less than $50/kW (in high volume production) while meeting
performance and durability requirements. (MYPP of 6/3/03, p. iii)
5.2.3 Current Portfolio
Within the constraints of available resources, the current Federal hydrogen technology research portfolio balances the emphasis on near-term technologies that will enable a commercialization decision for H2 automobiles by 2015, with the longer-term ultimate development of a mature hydrogen economy founded on advanced H2 production, storage, and delivery technologies. Elements of the portfolio include: Hydrogen Production Using Nuclear Power. High efficiency, high-temperature fission power
plants are projected to produce H2 economically without CO2. Hydrogen would be produced by cyclic thermochemical decomposition of water or high-efficiency electrolysis of high-temperature steam. See: http://www.climatetechnology.gov/library/2003/tech-options/tech-options-2-2-1.pdf
Hydrogen Production Using Electricity and Fossil/Alternative Energy. Development of small-
scale steam reformers, alternative reactor technologies for producing hydrogen from natural gas, and hydrogen membrane/separation technologies for improving the economics of hydrogen production from coal with CO2 sequestration. Demonstration of on-site electrolysis integrated with renewable electricity and laboratory-scale direct water-splitting by photoelectrochemical and photobiological methods. See: http://www.climatetechnology.gov/library/2003/tech-options/tech-options-2-2-3.pdf
Hydrogen Storage and Distribution. Five (5) methods of high density, energy-efficient storage of
hydrogen: in composite pressure vessels as a compressed gas or cryogenic vapor, liquid hydrogen (LH2) tanks, physical absorption on high-surface-area lightweight carbon structures, reversible metal hydrides, and chemical hydrides. Improvement of hydrogen compression and/or liquefaction equipment as well as materials compatibility of existing natural gas pipeline infrastructure for hydrogen distribution. See: http://www.climatetechnology.gov/library/2003/tech-options/tech-options-2-2-4.pdf]
Hydrogen Use. Demonstrate high-efficiency solid-oxide fuel cell/turbine hybrid-electric
generation systems operating on coal with carbon sequestration. Also develop efficient and durable PEM fuel cells appropriate for automotive use and stationary combined heat and power (CHP). See: http://www.climatetechnology.gov/library/2003/tech-options/tech-options-2-2-5.pdf
Deleted: kg
Deleted: In addition, the Department of Energy is also pursuing the production of hydrogen from nuclear power and, as discussed in Section 5.1, from coal. ¶
Deleted: and on
Comment: “(and ultimately fusion)” deleted by NE. Fusion is too far into the future for us to be able to state at this time that it is “projected to produce H2 economically.” This was not in the EPWG comments, but EPWG chair concurs.
Deleted:
Deleted: (and ultimately fusion)
Inserted: and
Deleted:
Deleted:
Deleted:
Deleted: High
Deleted:
Deleted: by five (5) methods
Deleted:
Deleted:
Deleted:
Deleted:
Deleted:
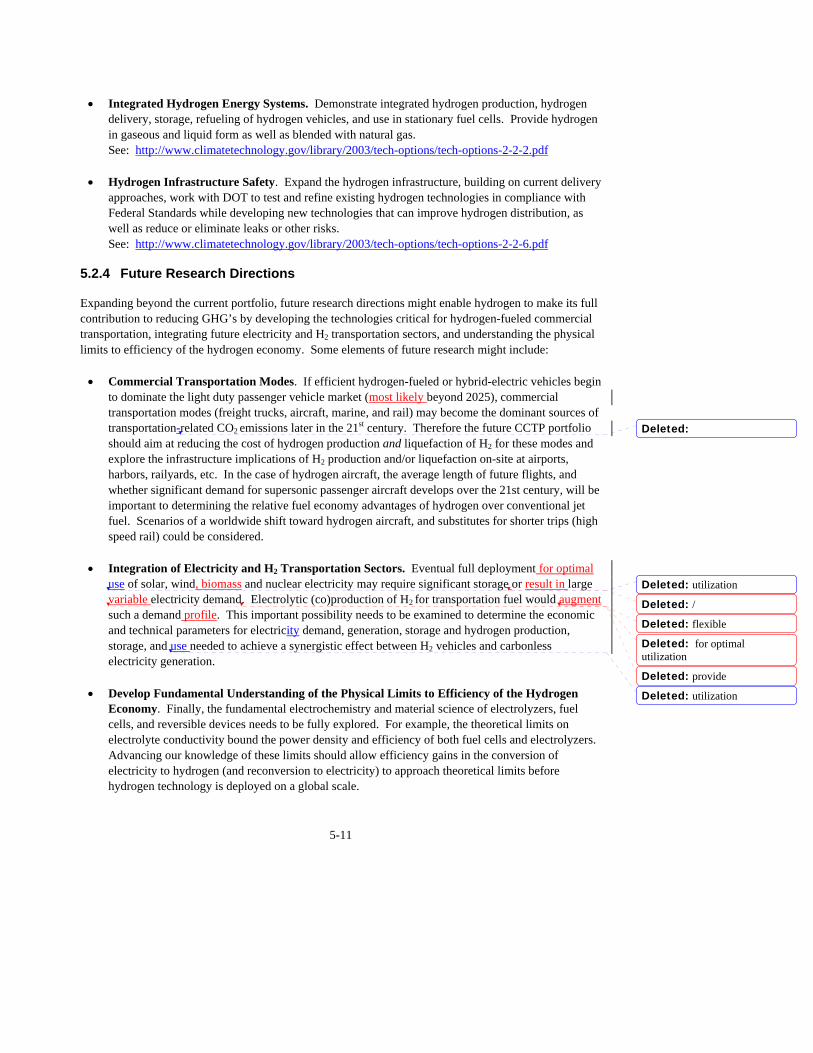
5-11
Integrated Hydrogen Energy Systems. Demonstrate integrated hydrogen production, hydrogen
delivery, storage, refueling of hydrogen vehicles, and use in stationary fuel cells. Provide hydrogen in gaseous and liquid form as well as blended with natural gas. See: http://www.climatetechnology.gov/library/2003/tech-options/tech-options-2-2-2.pdf
Hydrogen Infrastructure Safety. Expand the hydrogen infrastructure, building on current delivery
approaches, work with DOT to test and refine existing hydrogen technologies in compliance with Federal Standards while developing new technologies that can improve hydrogen distribution, as well as reduce or eliminate leaks or other risks. See: http://www.climatetechnology.gov/library/2003/tech-options/tech-options-2-2-6.pdf
5.2.4 Future Research Directions
Expanding beyond the current portfolio, future research directions might enable hydrogen to make its full contribution to reducing GHG’s by developing the technologies critical for hydrogen-fueled commercial transportation, integrating future electricity and H2 transportation sectors, and understanding the physical limits to efficiency of the hydrogen economy. Some elements of future research might include: Commercial Transportation Modes. If efficient hydrogen-fueled or hybrid-electric vehicles begin
to dominate the light duty passenger vehicle market (most likely beyond 2025), commercial transportation modes (freight trucks, aircraft, marine, and rail) may become the dominant sources of transportation-related CO2 emissions later in the 21st century. Therefore the future CCTP portfolio should aim at reducing the cost of hydrogen production and liquefaction of H2 for these modes and explore the infrastructure implications of H2 production and/or liquefaction on-site at airports, harbors, railyards, etc. In the case of hydrogen aircraft, the average length of future flights, and whether significant demand for supersonic passenger aircraft develops over the 21st century, will be important to determining the relative fuel economy advantages of hydrogen over conventional jet fuel. Scenarios of a worldwide shift toward hydrogen aircraft, and substitutes for shorter trips (high speed rail) could be considered.
Integration of Electricity and H2 Transportation Sectors. Eventual full deployment for optimal
use of solar, wind, biomass and nuclear electricity may require significant storage or result in large variable electricity demand. Electrolytic (co)production of H2 for transportation fuel would augment such a demand profile. This important possibility needs to be examined to determine the economic and technical parameters for electricity demand, generation, storage and hydrogen production, storage, and use needed to achieve a synergistic effect between H2 vehicles and carbonless electricity generation.
Develop Fundamental Understanding of the Physical Limits to Efficiency of the Hydrogen
Economy. Finally, the fundamental electrochemistry and material science of electrolyzers, fuel cells, and reversible devices needs to be fully explored. For example, the theoretical limits on electrolyte conductivity bound the power density and efficiency of both fuel cells and electrolyzers. Advancing our knowledge of these limits should allow efficiency gains in the conversion of electricity to hydrogen (and reconversion to electricity) to approach theoretical limits before hydrogen technology is deployed on a global scale.
Deleted:
Deleted: utilization
Deleted: /
Deleted: flexible
Deleted: for optimal utilization
Deleted: provide
Deleted: utilization

5-12
5.3 Renewable Energy and Fuels
Renewable sources of energy include the heat and photonic energy of the sun, the kinetic energy of wind, the thermal energy of the earth itself, the kinetic energy of flowing water, and the chemical energy of biomass. These sources of energy, available in one or more forms across the United States, are converted and/or delivered to end users as electricity, direct heat, fuels, hydrogen, and useful chemicals and materials. Box 5-1 lists the eleven individual renewable-energy technologies discussed in Technology Options for the Near- and Long-Term. Of the entire 71 quads of energy produced in the U.S. in 2002, renewable resources contributed 5.9 quads (8 percent). Of that, 2.7 quads came from hydropower, 2.8 quads from biomass (wood and waste), 0.3 quads from geothermal and 0.2 quads from solar and wind. (Ref: Annual Energy Review 2002, Table 1.2). Renewable energy constituted 5.9 quads out of a total consumption of 97 quads (6 percent) in the United States in 2002. Figure 5-5 shows U.S. availability of key renewable resources. The suite of renewable energy technologies is in various states of market readiness. For example, hydropower is well established but improvements in the technology could improve its efficiency and applicability. Geothermal technologies are established in some areas and applications, but significant improvements are needed to tap broader resources. Renewable energy supply technologies with the highest rates of market growth at this time include solar photovoltaic and wind energy technologies, where global shipments have been growing at 30 to 35 percent per year over the last 4 years (see graph of wind energy capacity in Figure 5-6, next page). However, the next generation of solar and wind technologies—with improved performance and lower cost—are in various stages of concept identification, laboratory research, engineering development, and process scale-up. Also, the development of integrated and advanced systems involving solar photovoltaics, concentrating solar power, solar buildings, and wind energy are still in quite early stages. Biochemical and thermo-chemical conversion technologies also range broadly in their stages of development, from some that need only to be proved at an industrial scale, to others that need more research, to others in early stages of scientific exploration. In the general category of photo-conversion, most technical ideas are at the earliest stages of concept development, theoretical modeling, and laboratory experiment.
Box 5-1 Renewable Energy and Fuels Technologies
Wind Energy Solar Photovoltaic Power Solar Buildings Concentrating Solar Power Biochemical Conversion of Biomass Thermochemical Conversion of
Biomass Biomass Residues Energy Crops Photoconversion Advanced Hydropower Geothermal Energy
Deleted: <sp>
Deleted: renewable
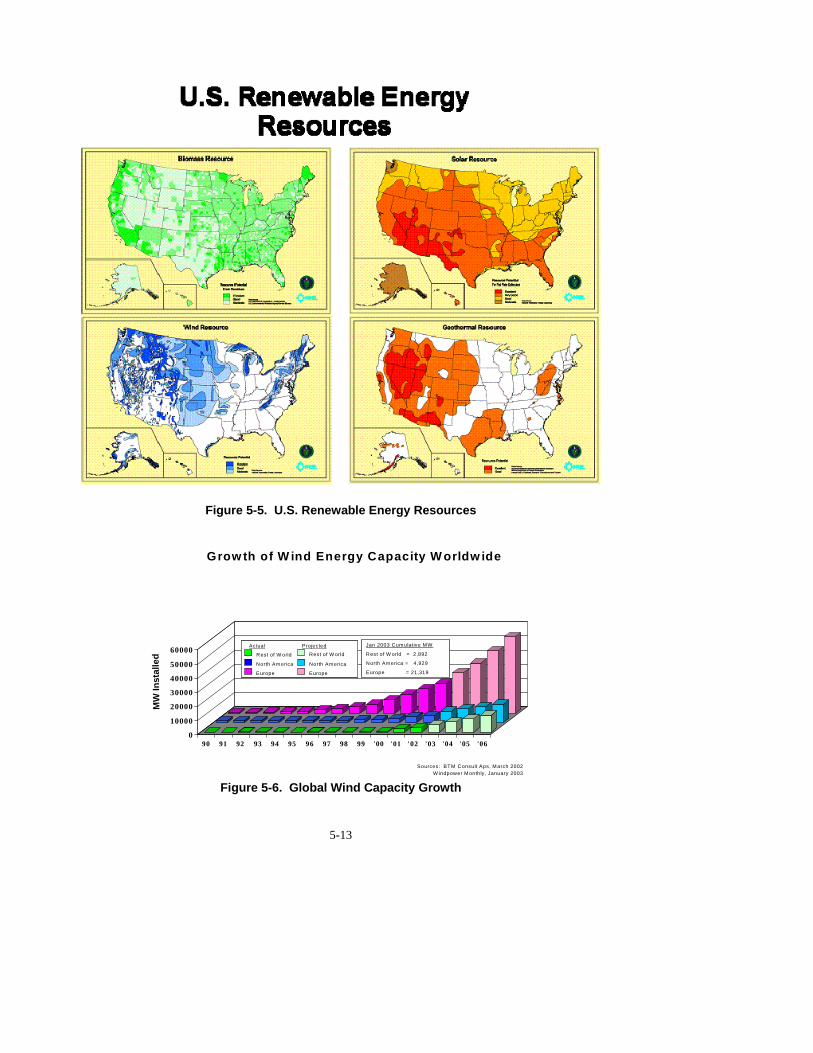
5-13
Figure 5-5. U.S. Renewable Energy Resources
Grow th of W ind Energy Capacity W orldw ide
0
10000
20000
30000
40000
50000
60000
90 91 92 93 94 95 96 97 98 99 '00 '01 '02 '03 '04 '05 '06
Rest of W orld
Actual Projected
Rest of W orld
North Am erica North Am erica
Europe Europe
Rest of W orld
Actual Projected
Rest of W orld
North Am erica North Am erica
Europe Europe
Jan 2003 Cum ulative MW
Rest of W orld = 2,892
North America = 4,929
Europe = 21,319
MW
Inst
alle
d
Sources: BTM Consult Aps, M arch 2002W indpower M onthly, January 2003
Figure 5-6. Global Wind Capacity Growth
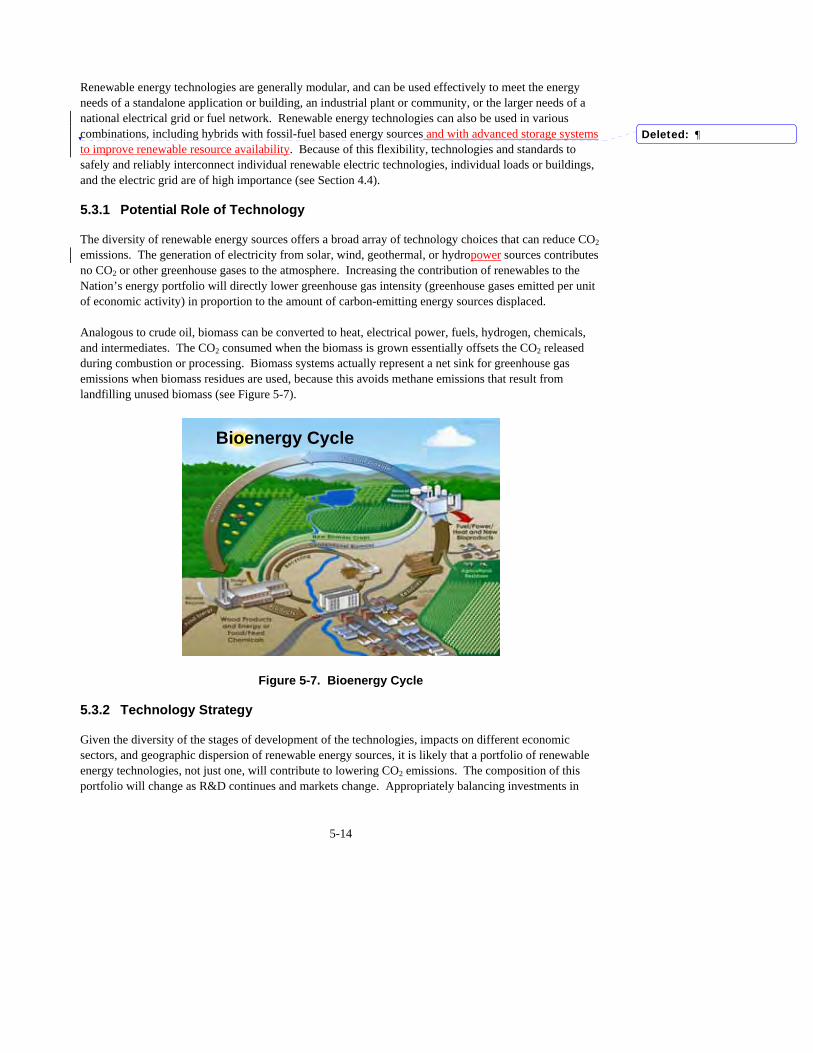
5-14
Renewable energy technologies are generally modular, and can be used effectively to meet the energy needs of a standalone application or building, an industrial plant or community, or the larger needs of a national electrical grid or fuel network. Renewable energy technologies can also be used in various combinations, including hybrids with fossil-fuel based energy sources and with advanced storage systems to improve renewable resource availability. Because of this flexibility, technologies and standards to safely and reliably interconnect individual renewable electric technologies, individual loads or buildings, and the electric grid are of high importance (see Section 4.4).
5.3.1 Potential Role of Technology
The diversity of renewable energy sources offers a broad array of technology choices that can reduce CO2 emissions. The generation of electricity from solar, wind, geothermal, or hydropower sources contributes no CO2 or other greenhouse gases to the atmosphere. Increasing the contribution of renewables to the Nation’s energy portfolio will directly lower greenhouse gas intensity (greenhouse gases emitted per unit of economic activity) in proportion to the amount of carbon-emitting energy sources displaced. Analogous to crude oil, biomass can be converted to heat, electrical power, fuels, hydrogen, chemicals, and intermediates. The CO2 consumed when the biomass is grown essentially offsets the CO2 released during combustion or processing. Biomass systems actually represent a net sink for greenhouse gas emissions when biomass residues are used, because this avoids methane emissions that result from landfilling unused biomass (see Figure 5-7).
Bioenergy Cycle
Figure 5-7. Bioenergy Cycle
5.3.2 Technology Strategy
Given the diversity of the stages of development of the technologies, impacts on different economic sectors, and geographic dispersion of renewable energy sources, it is likely that a portfolio of renewable energy technologies, not just one, will contribute to lowering CO2 emissions. The composition of this portfolio will change as R&D continues and markets change. Appropriately balancing investments in
Deleted: ¶

5-15
developing this portfolio will be important to maximizing the effect of renewable-energy technologies on greenhouse gas emissions in the future. Transitioning from today’s reliance on fossil fuels to a national energy portfolio including significant renewable energy sources requires continued improvements in cost and performance of renewable technologies. For example, Figure 5-8 shows the improvement goals for photovoltaics. This transition also requires shifts in the energy infrastructure to allow a more diverse mix of technologies to be delivered efficiently to consumers in forms they can readily use.
1008060
40
86
4
2
10
2016
Thin films
Crystallinesilicon
Concentrators
Flat-plate module cost ($/m2)
2.5–3*6–8
12–15
24–30
*Range of levelized electricity costs (¢/kWh) from sunny to average U.S. locations
10 20 30 40 60 80 100 200 300 500 800
9–11
Solar Energy 2050:ultralow cost
Solar Energy 2050:ultrahigh efficiency
4–5Solar Energy 2050 goals–2050
Solar Energy 2050 goals–2020
Core program 2020 goals
Today’s technology
Mod
ule
effic
ienc
y (%
)
Solar Photovoltaics Goals
Figure 5-8. Photovoltaic Performance Goals In general, as performance continues to improve and costs continue to decline, improved generations of technologies will replace today’s renewable technologies. Combinations of renewable and conventional technologies and systems, and therefore integration and interconnection issues, will grow in importance. The transition from today’s energy mix to a state of greenhouse gas stabilization can be projected as an interweaving of individual renewable energy technology and market developments through the upcoming decades. Today, grid-connected wind energy, geothermal, and biopower systems are well established and in some cases growing throughout the country. Solar hot-water technologies are reasonably established, though improvements continue. Market penetration of renewable technologies is growing rapidly for smaller, high value or remote applications of solar photovoltaics, wind energy, biomass-based combined heat and power, some hydropower, and integrated systems that may include natural gas or diesel generators. Other technologies and applications today are in various stages of research, development, and demonstration.
Deleted: impact
Deleted:
Deleted: -
Deleted:
Deleted: -

5-16
In the near term, as system costs continue to decrease, the penetration of off-grid systems should continue to increase rapidly, including integration of renewable systems such as photovoltaics into buildings. As interconnection issues are resolved, the number of grid-connected renewable systems should increase quite rapidly, meeting local energy needs such as uninterruptible power, community power, or peak shaving. Wind energy may expand the most rapidly among grid-connected applications, with solar expanding as system costs are reduced and geothermal expanding as research reduces costs and extends access to resources. Environment-friendly hydropower systems should be developed. Demonstrations of biorefinery concepts should begin in the near term, producing one or more products (electricity, heat, fuel, etc.) from one plant using local waste and residues as the feedstock. In the mid-term, low-wind and offshore-wind energy should begin to expand significantly. Reductions in cost should encourage penetration by solar technologies into more large-scale markets, first distributed markets such as commercial buildings and communities and later utility-scale systems. Solar cooling systems should become cost effective in new construction. The first hot dry rock plants should come on line, greatly extending access to geothermal resources. Hydropower should benefit from full acceptance of new turbines and operational improvements that enhance environmental performance, lowering barriers to new development. Biorefineries should begin using both waste products and energy crops as primary feedstocks. In the long-term, hydrogen from solar, wind, and possibly geothermal energy should be the backbone of the economy, powering vehicles and stationary fuel cells. Solar technologies should also be providing electricity and heat for commercial buildings, industrial plants, and entire communities in major sections of the country, and most residential and commercial buildings should generate their own energy onsite. Wind energy should be the lowest cost option for electricity generation in favorable wind areas for grid power, and offshore systems should be prevalent. Geothermal systems should be a major source of baseload electricity for large regions. Biorefineries should be providing a wide range of cost-effective products as rural areas embrace the economic advantages of widespread demand for energy crops.
5.3.3 Current Federal Portfolio
The current Federal portfolio of renewable energy supply technologies encompasses eleven areas. Wind Energy. Generating electricity from wind energy focuses on using aerodynamically designed
blades to drive generators that produce electric power in proportion to wind speed. Utility-scale turbines range in size up to several megawatts, and smaller turbines (under 100 kilowatts) serve a range of distributed, remote, and standalone power applications. Research activities include wind characteristics and forecasting; aerodynamics; structural dynamics and fatigue; control systems; design and testing of new prototypes; component and system testing; power systems integration; and standards development. See: http://www.climatetechnology.gov/library/2003/tech-options/tech-options-2-3-1.pdf
Solar Photovoltaic Power. Generating electricity from solar energy focuses on using
semiconductor devices to convert sunlight directly to electricity. A variety of semiconductor materials can be used, varying in conversion efficiency and cost. Today’s commercial modules are 13 to 17 percent efficient and generate electricity for about 20¢-.32¢/kWh. Efficiencies of experimental cells range from 12 to 19 percent for low-cost thin-film amorphous and polycrystalline
Deleted:
Deleted: hit
Deleted: regimes
Deleted: c
Deleted: c

5-17
materials, and 25 to 37 percent for higher cost multijunction cells. Research activities, conducted with strong partnerships between the federal laboratories and the private sector, include the fundamental understanding and optimization of photovoltaic materials, process and devices; module validation and testing; process research to lower costs and scale up production; and technical issues with inverters and batteries. See: http://www.climatetechnology.gov/library/2003/tech-options/tech-options-2-3-2.pdf
Solar Buildings. Solar buildings focus on combining very energy-efficient building designs,
energy-efficient lighting and appliances, and solar technologies to deliver heat, light and cooling such that a building would require zero net off-site energy on an annual basis. Technologies include solar collectors for solar hot water and space heating, solar cooling using absorption chillers or desiccant regeneration, and solar daylighting. See: http://www.climatetechnology.gov/library/2003/tech-options/tech-options-2-3-3.pdf
Concentrating Solar Power. Concentrating solar power technology involves concentrating solar
energy 50 to 5,000 times to produce high-temperature thermal energy, which is then used to produce electricity. Parabolic trough systems (1 – 100 MWe) generating electricity for 12c-14c/kWh have been demonstrated commercially; power towers (30-200 MWe) have been demonstrated; and prototype dish/Stirling engine systems (2 kWe – 10 MWe) are operating in several states. See: http://www.climatetechnology.gov/library/2003/tech-options/tech-options-2-3-4.pdf
Biochemical Conversion of Biomass. Biochemical technology can be used to convert the cellulose
and hemicellulose polymers in biomass (agricultural crops and residues, wood residues, trees and forest residues, grasses, and municipal waste) to their building blocks such as sugars and glycerides. Using either acid hydrolysis (well-established) or enzymatic hydrolysis (being developed), sugars can then be converted to liquid fuels such as ethanol, chemical intermediates and products such as lactic acid, and hydrogen. Glycerides can be converted to a biobased alternative for diesel fuel and other products. Producing multiple products from biomass feedstocks in a biorefinery will ultimately resemble today’s oil refinery. See: http://www.climatetechnology.gov/library/2003/tech-options/tech-options-2-3-5.pdf
Thermochemical Conversion of Biomass. Thermochemical technology uses heat to convert
biomass into a very wide variety of products. Pyrolysis or gasification of biomass produces an oil-rich vapor or synthesis gas, which can be used to generate heat, electricity, liquid fuels, and chemicals. Combustion of biomass (or combinations of biomass and coal) generates steam for electricity production and/or space, water, or process heat, occurring today in the wood products industry and biomass power plants. Analogous to an oil refinery, a biorefinery can use one or more of these methods to convert a variety of biomass feedstocks into multiple products. See: http://www.climatetechnology.gov/library/2003/tech-options/tech-options-2-3-6.pdf
Biomass Residues. Biomass (agricultural crops and residues, wood residues, trees and forest
residues, animal wastes, pulp, and paper waste) must be harvested, stored, and transported on a very large scale to be used in a biorefinery. Research activities include improving and adapting the existing harvest collection, densification, storage, transportation, and information technologies to bioenergy-supply systems, and developing robust machines for multiple applications. See: http://www.climatetechnology.gov/library/2003/tech-options/tech-options-2-3-7.pdf
Field Code Changed
Deleted: 2
Deleted:
Deleted: trees,
Deleted: residues
Deleted:

5-18
Energy Crops. Energy crops are fast growing, often genetically improved trees and grasses grown
under sustainable conditions to provide feedstocks that can be converted to heat, electricity, fuels such as ethanol, and chemicals and intermediates. Research activities include genetic improvement, pest and disease management, and harvest equipment development to maximize yields and sustainability See: http://www.climatetechnology.gov/library/2003/tech-options/tech-options-2-3-8.pdf
Photoconversion. Photoconversion processes use solar photons to drive a variety of quantum
conversion processes other than solid-state photovoltaics. These processes can produce electrical power or fuels, materials, and chemicals directly from simple renewable susbstrates such as water, carbon dioxide, and nitrogen. Photoconversion processes that mimic nature (termed “bio-inspired”), can also convert CO2 into liquid and gaseous fuels. Most of these technologies are at early stages of research where technical feasibility must be demonstrated, but a few (such as dye-sensitized solar cells) are at the developmental level. See: http://www.climatetechnology.gov/library/2003/tech-options/tech-options-2-3-9.pdf
Advanced Hydropower. The goal of advanced hydropower technology is to maximize the use of
water for generation of electricity, while eliminating harmful environmental side effects. Representative technologies include new turbine designs that improve survivability of fish passing through the power plant and increase dissolved oxygen in downstream discharges, new assessment methods to optimize operation of reservoir system, and advanced instrumentation and control systems that modify turbine operation to maximize environmental benefits and energy production. See: http://www.climatetechnology.gov/library/2003/tech-options/tech-options-2-3-10.pdf
Geothermal Energy. Geothermal sources of energy include hot rock masses, highly pressured hot
fluids, and shallow warm groundwater. Exploration techniques locate resources to drill, well fields and distribution systems allow the hot fluids to move to the point of use, and utilization systems apply the heat directly or convert it to electricity. Geothermal heat pumps use the shallow earth as a heat source and heat sink for heating and cooling applications. The U.S. installed capacity for electrical generation is currently about 2 gigawatts, but with improved technology, the U.S. resource base is capable of producing up to 100 gigawatts of electricity at 3¢-5¢/kWh. See: http://www.climatetechnology.gov/library/2003/tech-options/tech-options-2-3-11.pdf
5.3.4 Future Research Directions
Promising areas identified for consideration for new or increased emphasis in future portfolio planning include: Wind Energy. Research challenges include developing wind technology that will be economically
competitive at low wind-speed sites (13 mph), optimizing larger turbine designs for 30-year life, developing offshore wind technology to take advantage of the immense wind resources in U.S. coastal areas and the Great Lakes, and exploring the role of wind-generated electricity to produce hydrogen through the electrolysis of water.
Deleted: -
Deleted: c
Deleted: c
Deleted: from

5-19
Solar Photovoltaic Power. Research will be required to lower the cost of solar electricity further. This can occur through developing “third-generation” materials such as quantum dots and nanostructures for ultra-high efficiencies or lower-cost organic or polymer materials; solving complex integrated processing problems to lower the cost of large-scale production of thin-film polycrystalline devices; optimizing cells and optic systems using concentrated sunlight; and improving the performance and lowering the cost of inverters and batteries.
Solar Buildings. Required research includes reducing cost and improving reliability of components
and systems, optimizing energy efficiency and renewable energy combinations, integrating solar technologies into building designs, and incorporating solar technologies into building codes and standards.
Concentrating Solar Power. Future challenges include reducing cost and improving reliability;
demonstating Stirling engine performance in the field; developing systems to generate electricity using photovoltaic cells designed for concentrated sunlight rather than heat engines; and technology to produce hydrogen from concentrated sunlight and water.
Biochemical Conversion of Biomass. Research must focus on improving the cost, yield, and
equipment reliability for harvesting, collecting and transporting biomass; pretreating biomass before conversion; lowering the cost of the genetically engineered cellulose enzymes needed to hydrolyze biomass; developing and improving fermentation organisms; and developing integrated processing applicable to a large, continuous-production commercial facility.
Thermochemical Conversion of Biomass. Research is needed to improve the production,
preparation and handling of biomass; improve the operational reliability of thermochemical biorefineries; remove contaminants from synthesis gas; and study synthesis gas use in various applications. All the processes in the entire conversion system must be integrated to maximize efficiency and reduce costs.
Biomass Residues. Research challenges include developing sustainable agriculture and forest
management systems that provide energy feedstock, food, and fiber; developing cost-effective drying, densification, and transportation techniques to create more standard feedstock from various biomass sources; developing whole-crop harvest and fractionation systems; and developing methods for pretreatment of biomass at harvest locations.
Energy Crops. Crop research needs in the future include identifying genes that control growth and
characteristics important to conversion processes, developing gene maps, understanding functional genomics in model crops, and advanced management systems and enhanced cultural practices to optimize sustainable energy crop production.
Photoconversion. Photoconversion research requires developing the fundamental scientific
understanding of photolytic processes through multidisciplinary approaches involving theory, mechanisms, kinetics, biological pathways and molecular genetics, natural photosynthesis, materials science, catalysts and catalytic cycles.
Deleted: environmental data to make decisions on residue removal from agricultural and forest lands
Deleted: residues
Deleted: residues
Deleted: environmental research
Deleted: sustainable
Deleted: techniques

5-20
Advanced Hydropower. Research challenges include computational fluid dynamics modeling; advanced instrumentation, sensor, and control systems; improvements to understand how fish respond to turbulent flows and other physical stresses inside turbines and downstream of dams; and field testing of new technology to measure fish survival rates.
Geothermal Energy. Future research needs include developing improved methodologies for
predicting reservoir performance and lifetime; finding and characterizing underground fracture permeability; developing low-cost innovative drilling technologies; reducing the cost and improving the efficiency of conversion systems; and developing technology that will allow the use of geothermal areas that are deeper, less permeable, or drier than those currently considered as reserves.
5.4 Nuclear Fission
There are over 440 nuclear power plants in 31 nations currently that generate 17 percent of world electricity (see Figure 5-1 earlier in the chapter), providing 7 percent of total world energy (see Figure 5-2). Because they emit no greenhouse gases, today’s nuclear power plants avoid the CO2 emissions associated with combustion of coal or other fossil fuels. Over the past 30 years, operators of nuclear power plants have steadily improved economic performance, reduced costs for maintenance and operations, improved power plant availability and efficiency, established a proven record of reliability and safety, and advanced the science and technology for the safe storage and ultimate disposal of nuclear waste. Waste from nuclear energy must be isolated from the environment. High-level nuclear wastes from fission reactors (used fuel assemblies) are stored in contained, steel-lined pools or in robust dry casks at limited-access reactor sites, until a deep geologic repository is ready to accept and permanently isolate them from the environment. However, used nuclear fuel contains a substantial quantity of fissile materials that although not economically useful today, could be valuable in the future. Advanced technologies that could recover much of the remaining energy in spent fuel also offer the prospect of reducing required repository space and the radiotoxicity of the disposed waste. While the current application of nuclear energy is the production of electricity, other applications are possible, such as co-generation of process heat and the generation of hydrogen from water or from methane (with carbon capture or integration with other materials production or manufacturing).
5.4.1 Potential Role of Technology
The goal of R&D for nuclear facility optimization is to increase the efficiency, reliability, and power generation of existing nuclear power plants to the advantage of the environment. Extending the license terms of currently-operating nuclear plants for 20 more years and optimizing their generation, as is being done in the United States, will offer a cost-effective resource for carbon-dioxide mitigation well into the middle part of this century. Through the early months of 2004, 26 nuclear units in the United States have received approval to extend their operating licenses to a total of 60 years; 37 others have filed or announced their intent to file for license extensions; and most likely all of the remaining plants are expected to follow suit.
Comment: NE comment, not EPWG. EPWG comment: either spelling is acceptable.
Deleted: dryer
Deleted: desirable
Deleted: Recycling would have the added benefit of reducing needed repository space. Hence, research continues to develop improved processes for recycling used nuclear fuel.
Deleted: ,
Deleted: lifetimes
Deleted: 23
Deleted: 43
Deleted: , or
Deleted: ,

5-21
To the extent that new nuclear power plant technologies can address prevailing concerns, the nuclear option can continue to be an important part of a greenhouse gas emissions-free energy portfolio. Research and development on near-term advanced reactor concepts that offer enhancements to safety and economics should enable these new technologies to be competitive in the deregulated electricity market, and support energy supply diversity and security. Evolutionary light water reactors of standardized design are now available and have received U.S. Nuclear Regulatory Commission design certification and been constructed on schedule in Japan and South Korea. However, even newer nuclear energy systems for the longer-term have the potential to offer significant advances in the areas of sustainability, proliferation resistance and physical protection, safety, and economics. These newer nuclear energy systems, described as Generation IV reactors, will be required to replace or add to existing light water reactor capacity.
5.4.2 Technology Strategy
The strategy for the near-term is to increase the efficiency, reliability, and power generation of existing nuclear power plants; and to help make the economic and clean air benefits of the plants available through current and renewed license terms and to provide technology to predict and measure the extent of materials damage from plant aging. In order to expand current nuclear capacity significantly in markets other than Asia and Eastern Europe (see Figure 5-9), by deploying new, advanced nuclear power plants in the relatively near-term, United States leadership is essential. The untested federal regulatory and licensing processes for the siting, construction, and operation of new nuclear plants must be demonstrated. In addition, other major obstacles (including the initial high capital costs of the first few plants and the business risks resulting from this and the regulatory uncertainty) must be addressed. For additional information see: In the longer-term, next-generation nuclear energy systems can serve a vital role in the Nation’s long-term, diversified energy supply. By successfully addressing the fundamental research and development issues of system concepts that excel in safety, sustainability, cost-effectiveness and proliferation resistance, the systems are highly likely to attract future private-sector sponsorship and ultimate commercialization by the private sector. Advanced nuclear systems (fission reactors) aim to reduce the longevity of the waste from current-generation fission reactors and aim to extract the full energy potential of the spent nuclear fuel from current fission reactors, while reducing or eliminating the potential for proliferation of nuclear materials and technologies, and reducing the amount of waste produced. Additionally they can include energy conversion systems that can produce non-electricity products such as hydrogen, desalinated water, and process heat. A key objective of nuclear energy research and development is to enhance the basic technology, and through advanced civilian technology research, chart the way toward the next leap in technology. From these efforts, and those of industry and our overseas partners, nuclear energy will continue to fulfill its promise as a safe, advanced, inexpensive, and environmentally sound approach to providing reliable energy throughout the world.
Deleted: continue to
Deleted: in
Comment: Placeholder. The document for this link has not yet been put on our web page.
Comment: NE comment not in original EPWG comments, but EPWG chair concurs.
Deleted: and accelerator-driven systems
Comment: NE comment; EPWG chair concurs

5-22
Figure 5-9. Nuclear Reactors Under Construction
Sources: IAEA Power Reactor Information System; Uranium Information Centre/World Nuclear Association; Nuclear News 2004; organization press releases/web pages
5.4.3 Current Portfolio
The current Federal portfolio focuses on four areas: Existing plant R&D is focused on improving availability and maintainability of nuclear plants;
providing technology to predict and measure the extent of materials damage from plant aging; and operating plants at higher power levels (power uprates), based on more accurate measurement and knowledge of safety margins, reduced consumption of onsite electrical power, and equipment upgrades. See: http://www.climatetechnology.gov/library/2003/tech-options/tech-options-2-4-1.pdf The Nuclear Energy Plant Optimization (NEPO) Program has supported the use of nuclear energy in the United States by conducting research and development focused on improving the operations and reliability of currently operating nuclear power plants while maintaining a high level of safety. Improved efficiency is reflected in increases in power generating capacity and improvements in reliability are reflected in increased operating predictability. The NEPO program has supported the Secretary of Energy’s priority to ensure U.S. energy security by protecting critical infrastructure that supports the production and delivery of electricity in the United States and focusing on programs that help increase the supply of domestically produced energy. Additionally, it has made significant
Reactors Under Construction Worldwide
0 1 2 3 4 5 6 7 8 9
India
Russia
Ukraine
China
Japan
Taiwan
South Korea
Iran
Argentina
North Korea
Romania
Formatted: Normal
Formatted: Bullets andNumbering
Deleted:
R
0
IndiaUkraine
ChinaJapan
RussiaIran
SlovakiaTaiwan
ArgentinaN. KoreaS. KoreaRomania
Deleted: Source: IAEA¶
Deleted: power uprates

5-23
progress toward addressing many of the aging material and generation optimization issues which have been identified as the key long-term issues facing current operating plants. Further information about current projects and recent results of the NEPO program can be obtained at the NEPO web site: http://nuclear.gov/nepo2/default-nepo.asp
Research on nuclear power plant technologies for near-term deployment is focused on
advanced fission reactor designs that are currently available or could be made available with limited additional work to complete design development and deployment in the 2010 timeframe. See: http://www.climatetechnology.gov/library/2003/tech-options/tech-options-2-4-3.pdf The Near-Term Deployment Roadmap (http://nuclear.gov/nerac/ntdroadmapvolume1.pdf and http://nuclear.gov/nerac/NTDRoadmapVolII.PDF) was issued in October 2001 and advises DOE on actions and resource requirements needed to support deployment of new nuclear power plants around 2010. The primary focus of the roadmap is to identify the generic and design-specific prerequisites to near-term deployment, to identify those designs that best promise to meet the needs of the marketplace, and to propose recommended actions that would support deployment. This includes, but is not limited to, actions to achieve economic competitiveness and timely regulatory approvals. The Nuclear Power 2010 program is designed to pave the way for an industry decision by 2006 to order at least one new nuclear power plant for deployment in the 2010 timeframe. Activities under this program supports cost-shared demonstration of the Early Site Permit (ESP) and combined Construction and Operating License (COL) processes to reduce licensing uncertainties and minimize the attendant financial risks to the licensee. In addition, the program includes technology research and development to finalize and license a standardized advanced reactor design, which U.S. power generation companies will find to be more competitive in the deregulated electricity market. The economics and business case for building new nuclear power plants is also being evaluated as part of the Nuclear Power 2010 program to identify the necessary financial conditions under which power generation companies would add new nuclear capacity.
Research on the Next-Generation Fission Energy Systems will lead to newer nuclear energy
systems that offer significant advances in the areas of sustainability, proliferation-resistance and physical protection, safety, and economics. These newer nuclear energy systems will replace or add to existing light water reactor capacity and should be available before 2020. To develop these next-generation systems, DOE manages the Generation IV Nuclear Energy Systems Initiative. See: http://www.climatetechnology.gov/library/2003/tech-options/tech-options-2-4-2.pdf Development of next-generation nuclear energy systems is being pursued by the Generation IV International Forum, a group of ten leading nuclear nations (Argentina, Brazil, Canada, France, Japan, the Republic of Korea, the Republic of South Africa, Switzerland, the United Kingdom, and the United States) plus Euratom, who have selected six promising technologies as candidates for next-generation nuclear energy systems concepts. The Generation IV (Gen IV) Nuclear Energy Systems Initiative addresses the fundamental research and development issues necessary to establish the viability of next-generation nuclear energy system concepts. By successfully addressing the fundamental research and development issues of system concepts that excel in safety, sustainability, cost-effectiveness and proliferation resistance, the systems are highly likely to attract future
Formatted: Bullets andNumbering
Deleted: by
Deleted: 2005
Comment: NE comment; EPWG chair concurs.
Deleted: R&D
Deleted:
Deleted: starting in 2015
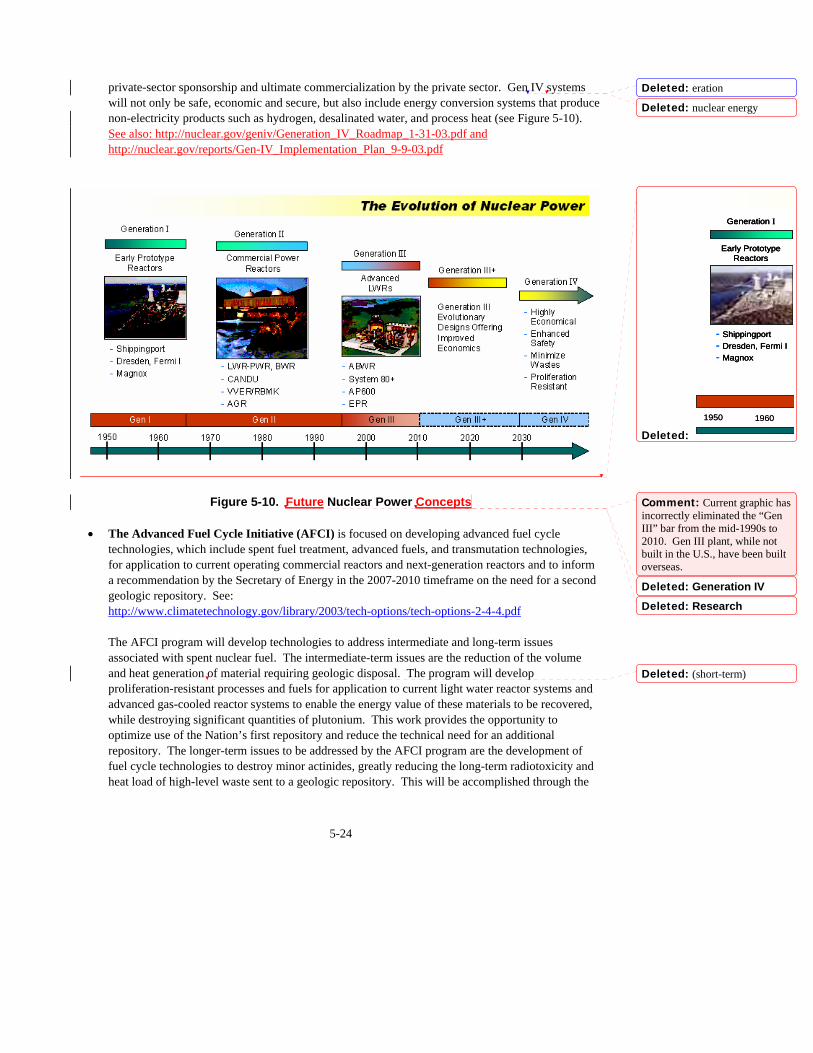
5-24
private-sector sponsorship and ultimate commercialization by the private sector. Gen IV systems will not only be safe, economic and secure, but also include energy conversion systems that produce non-electricity products such as hydrogen, desalinated water, and process heat (see Figure 5-10). See also: http://nuclear.gov/geniv/Generation_IV_Roadmap_1-31-03.pdf and http://nuclear.gov/reports/Gen-IV_Implementation_Plan_9-9-03.pdf
Figure 5-10. Future Nuclear Power Concepts The Advanced Fuel Cycle Initiative (AFCI) is focused on developing advanced fuel cycle
technologies, which include spent fuel treatment, advanced fuels, and transmutation technologies, for application to current operating commercial reactors and next-generation reactors and to inform a recommendation by the Secretary of Energy in the 2007-2010 timeframe on the need for a second geologic repository. See: http://www.climatetechnology.gov/library/2003/tech-options/tech-options-2-4-4.pdf
The AFCI program will develop technologies to address intermediate and long-term issues associated with spent nuclear fuel. The intermediate-term issues are the reduction of the volume and heat generation of material requiring geologic disposal. The program will develop proliferation-resistant processes and fuels for application to current light water reactor systems and advanced gas-cooled reactor systems to enable the energy value of these materials to be recovered, while destroying significant quantities of plutonium. This work provides the opportunity to optimize use of the Nation’s first repository and reduce the technical need for an additional repository. The longer-term issues to be addressed by the AFCI program are the development of fuel cycle technologies to destroy minor actinides, greatly reducing the long-term radiotoxicity and heat load of high-level waste sent to a geologic repository. This will be accomplished through the
Deleted: eration
Deleted: nuclear energy
Deleted:
Early PrototypeReactors
Generation I
- Shippingport- Dresden, Fermi I- Magnox
1950 1960
Early PrototypeReactors
Generation I
- Shippingport- Dresden, Fermi I- Magnox
Early PrototypeReactors
Generation I
- Shippingport- Dresden, Fermi I- Magnox
1950 1960
Comment: Current graphic has incorrectly eliminated the “Gen III” bar from the mid-1990s to 2010. Gen III plant, while not built in the U.S., have been built overseas.
Deleted: Generation IV
Deleted: Research
Deleted: (short-term)

5-25
development of Gen IV fast reactor fuel cycle technologies and possibly accelerator-driven systems. For more information see: http://nuclear.gov/reports/AFCI_CongRpt2003.pdf .
5.4.4 Future Research Directions
Most R&D challenges remaining for near-term deployment options relate to advanced light water and gas reactors, including fuel development, characterization, manufacture, testing and regulatory acceptance; power conversion system design and testing, including resolution of uncertainties regarding materials, reliability, and maintainability; and fission reactor internals design and verification. Additional research needs to support deployment of nuclear plant systems include: Supporting resolution of the technical, institutional, and regulatory barriers to the deployment of
new nuclear power plants in the 2010 timeframe, consistent with recommendations in the Near-Term Deployment Roadmap.
In cooperation with the nuclear industry, demonstrating the untested regulatory processes for Early
Site Permit and combined Construction and Operating Licenses to reduce licensing uncertainties and attendant financial risk to the licensees.
enabling finalization and NRC certification of those advanced nuclear power plant designs that the
U.S. power generation companies may be willing to build. Providing for development and demonstration of advanced technologies to reduce construction time
for new nuclear power plants and to minimize schedule uncertainties and associated costs for construction.
Supporting operational safety, proliferation-resistant fuel cycle concepts; minimization of wastes;
and economy of both capital and O&M. Of the other challenges that must be addressed to enable a future expansion in the use of nuclear energy in the United States and worldwide, none is more important or more difficult than that of dealing effectively with spent nuclear fuel. Compared to other industrial waste, the spent nuclear fuel generated during the production of electricity is relatively small in quantity. However, it is highly toxic for many thousands of years, and its disposal requires resolution of many political, societal, technical, and regulatory issues. While these issues are being addressed in the license application for the Yucca Mountain repository, several countries around the world have pursued advanced technologies that could treat and transmute spent nuclear fuel from nuclear power plants. These technologies have the potential to dramatically reduce the quantity and toxicity of waste requiring geologic disposal. Over the last four years, the United States has joined this international effort and found considerable merit in this area of advanced research.
5.5 Fusion Energy
Fusion energy holds the possibility of an almost inexhaustible supply of zero-GHG electricity. Fusion is the power source of the sun and the stars. Lighter elements are “fused” together in the core of the sun, producing heavier elements and prodigious amounts of energy. On Earth, fusion has been demonstrated
Formatted: Bullets andNumbering
Deleted: eration
Deleted: e
Deleted: Provide for conduct of R&D to
Deleted: e
Deleted: are
Deleted: e
Deleted: that
Deleted: be addressed
Deleted: For many years
Deleted: making
5-26
in the laboratory at powers of five to fifteen million watts, with pulse lengths in the range of one to five seconds. Today there is little doubt that fusion power can eventually be produced at much larger scales. The two principal approaches for confining the fusion reaction are magnetic and inertial. Magnetic fusion relies on magnetic forces to confine the charged particles of the hot plasma fuel for sustained periods of fusion energy production. Inertial fusion relies on intense lasers, x-rays, or particle beams to rapidly compress a pellet of fuel to the point where fusion occurs; yielding a burst of energy that would be repeated to produce sustained energy production. Fusion power generation offers a number of advantageous features. The basic sources of fusion fuel, deuterium and tritium, are actually heavy forms of hydrogen. Deuterium is abundantly available since it occurs naturally in water, and tritium can be derived from lithium, a light metal found in the earth’s crust. Tritium is radioactive, but the quantities in use at any given time are quite modest and can be safely handled. There are no chemical pollutants or carbon dioxide emissions from the fusion process. With appropriate advances in materials, the radioactivity of the fusion by-products would be relatively short-lived, thereby obviating the need for extensive waste management measures. From a safety perspective, the fusion process poses little radiation risk to anyone outside the facility. Also, since only a small quantity of fuel is in the fusion system at any given time, there is no risk of a criticality accident or meltdown and little after heat to be managed in the event of an accident. The potential usefulness of fusion systems is great, but many technological challenges remain.
5.5.1 Potential Role of Technology
Fusion energy is an attractive option to consider for long-term sustainable energy generation. It would be particularly suited for base-load electricity supply, but could also be used for hydrogen production. With the growth of world population expected to occur in cities and megacities, concentrated energy sources that can be located near population centers, such as fusion energy, may be particularly attractive. Additionally, the fusion process does not produce greenhouse gases and has well-attested and attractive inherent safety and environmental characteristics that will help gain public acceptance. Energy scenarios imposing reasonable constraints on non-sustainable energy sources show that fusion energy could contribute significantly to large-scale electricity production during the second half of the 21st century. Also, the cost of fusion electricity is likely to be comparable to other environmentally responsible sources of electricity generation. Much basic research remains to be accomplished to make fusion energy practical and economic, but the time required for the development of fusion power is consistent with the need to bring major new non-polluting energy sources on line in mid-century. Supporting technologies and research that are needed include: increased scientific understanding of both magnetic and inertial fusion plasmas
Formatted: Superscript
Deleted: ten
Deleted: and abundantly available
Deleted: is
Comment: Short half-life does not mean “safe,” which is implied here. A material with a shorter half-life can produce a higher dose than one with a longer half-life.
Deleted: has a relatively short half-life and
Inserted: and the quantities in use at any given time are quite modest
Deleted: (a)
Deleted: technology
Deleted: extreme
Deleted: the
Deleted: barring implementation are many
Deleted: .
Deleted: are not constrained
Deleted: with respect to where they can be located
Deleted: by location near populations
Inserted: by location near populations
Deleted: to
Deleted: A sound approach to accomplishing the goal of making fusion a reality would be for U.S. and international laboratories and universities to continue to work together.
Deleted: Advance the
5-27
approaches and configurations for both magnetic and inertial fusion energy that will take the best advantage of the newest scientific insight.
predictive simulations of fusion plasmas using the evolving terascale computing capabilities
wave/particle heating and fueling technologies that will be used to establish and control magnetic
fusion plasmas extending the limits of superconducting magnet technology to improve magnetic confinement of
fusion plasmas structural materials with low-activation properties will be required to fulfill the ultimate potential of
fusion devices tritium generation and heat-recovery systems are other common nuclear system technologies
required for both magnetic and inertial fusion. a systems approach so that engineering, technological and scientific advances needed for practical
fusion energy are pursued in concert. for inertial fusion, a technological basis for efficient, low-cost ion beams; develop high-average-
power, durable and cost-effective solid-state and gas laser systems; development of low-cost, repetitive pulsed power driver/transmission lines for z-pinches and other potentially attractive imploding liners/pinches including dense plasma jets; and demonstration of useful gain from compression and burn of fusion energy-relevant targets in the National Ignition Facility.
5.5.2 Technology Strategy
Given the substantial scientific and technological uncertainties that now exist; the U.S. government will employ an optimized portfolio strategy that explores a variety of magnetic and inertial confinement approaches that lead to the most promising commercial fusion concept. Advanced computational modeling is central to guiding and designing experiments that cannot be readily investigated in the laboratory. This requires testing the agreement between theory and experiment, and permits exploring innovative concepts and designs for fusion plants. To ensure the highest possible scientific return on limited resources, the DOE fusion program will work with other DOE programs and with other agencies and the international scientific community in areas such as materials science, ion beam physics, and laser physics. Large-scale experimental facilities are necessary to test approaches for self-heated (burning) fusion plasmas; for inertial fusion experiments; and for testing materials and components under extreme conditions. There are many overlapping challenges to be met (Figure 5-11). Where appropriate, the rewards, risks, and costs of major facilities will be shared through international collaborations. In addition, there is significant overlap with nuclear fission efforts, particularly in the field of materials.
Formatted: Bullets andNumbering
Formatted: Bullets andNumbering
Formatted: Indent: Left: 7.2 pt, Hanging: 18 pt
Deleted: Develop the
Deleted: Develop
Deleted: Develop
Deleted: ¶¶
Deleted: Establish the
Deleted: a technological basis for efficient, low-cost ion beams; develop high-average-power, durable and cost-effective solid-state and gas laser systems; demonstrate useful gain from compression and burn of fusion energy-relevant targets in the National Ignition Facility
Inserted: a
Deleted: Extend
Deleted: Structural
Deleted: Tritium
Deleted: ,
Deleted: such as
Deleted: within the U.S. Department of Energy (DOE)

5-28
Configuration Optimization
Burning Plasma
Materials Testing
Component Testing
Demonstration
Underlying Scientific and Technology Development Programs
Figure 5-11. Overlapping Scientific and Technological Challenges Associated with Fusion Energy Production

5-29
The overall research effort is organized around a set of four broad goals: demonstrate with burning plasmas the scientific and technological feasibility of fusion energy
develop a fundamental understanding of plasma behavior sufficient to provide a reliable predictive
capability for fusion energy systems determine the most promising approaches and configurations to confining hot plasmas for practical
fusion energy systems develop the new materials, components, and technologies necessary to make fusion energy a reality.
5.5.3 Current Portfolio
The current federal portfolio focuses on the basic sciences needed to better understand and to answer the major scientific questions and overcome the many technical challenges that will make it possible to harness fusion power. See: http://www.climatetechnology.gov/library/2003/tech-options/tech-options-2-5-1.pdf] In one major effort, the United States, Europe, Japan, China, Russia, and the Republic of Korea are negotiating an agreement to construct a magnetic fusion-burning plasma science and engineering test facility. Referred to as ITER, this international magnetic fusion experiment is part of a U.S. strategy to achieve magnetic confinement fusion (see Figure 5-12).
Prior to ITER operation in about 2014, experiments on a wide range of plasma confinement systems worldwide will continue physics research in preparation for ITER operations. These experiments will include detailed simulations of ITER behavior as well as innovative new ways of operating fusion systems to optimize efficiency. Because of the sophisticated measurement techniques employed on modern fusion experiments, detailed data are already available to validate computer models.
5.5.4 Future Research Directions for Magnetic Fusion Energy
The ITER design is based on the use of existing, well-qualified materials, which are not yet able to sustain the lifetime neutron irradiation that would be required in an
Figure 5-13. ITER Schematic
Deleted: Demonstrate
Deleted: Develop
Deleted: Determine
Deleted: Develop
Deleted: Federal
Deleted: <sp>
Deleted: tokamaks(a)
Deleted: to develop tokamak
Deleted: tokamaks
Deleted: achieve the optimum
Deleted: from this magnetic geometry
Deleted: diagnostics on the tokamaks
Comment: Figure 5-12 shown here should remain labeled “5-12.” This is just another case of MS Word taking control. Try as I might, I have been unable to reject this change or keep the label “5-12.”

5-30
operational fusion power plant. Materials resistant to radioactivity and neutron damage are needed for high performance, environmentally benign, and economically attractive power plants. Promising candidate materials already exist in industrial quantities and are being more fully characterized. These have not been tested under fusion power conditions, although similar materials have been successfully tested under fission reactor conditions. In a number of areas, the fruits of basic research, not specific to fusion, could assist the development of fusion power. Basic science developments bearing on fusion plasma science relate to obtaining a better first-principles understanding and predictive capability of the non-linear dynamics of plasma behavior, including improved understanding and modeling of turbulence; self-organizing non-linear systems; particle and plasma accelerations; high-energy density physics; and interpretation of very large data series by statistical modeling. Additionally, basic science developments bearing on fusion materials science relate to improvements in nano-structural engineering of materials for specific roles; predictive modeling over the complete range of scales of material behavior; and advanced instrumentation and advanced computational physics. 5.5.5. Future Research Directions for Inertial Fusion Energy Inertial fusion is an alternative and complementary path to fusion power. The United States has primarily pursued inertial fusion as part of the nuclear stockpile stewardship mission. Large single shot laser and pulsed power facilities have been constructed to investigate and develop its scientific underpinnings. The National Ignition Facility, now under construction, is designed to achieve the inertial fusion equivalent to ITER’s burning plasma. A smaller parallel effort in fusion energy technologies has developed driver, target fabrication and chamber technologies. The drivers include lasers, pulsed power driven z-pinches and liners (including dense plasma jets), and heavy ion accelerators. The Nation’s large investment in inertial fusion for Defense has created the potential for developing it as a power source with relatively modest initial investments. The research community has formulated a 3-phase plan to develop this approach to fusion energy. In Phase I the basic driver, target and chamber technologies are developed. In Phase II the full scale components for a test plant are developed in parallel and in concert with the validation and optimization of ignition and target physics. The modularity of inertial fusion drivers, where large systems are constructed from smaller components, reduces the cost and risk involved in the development of power plant sized components. In Phase III the Engineering Test Facility (ETF) is constructed and operated. The ETF is a full scale power plant sized fusion facility with a high duty cycle, but with the added capability and main mission of testing and developing materials, technologies and components for follow on commercial plants. It is thus envisioned that the ETF could carry out all the tasks given in figure 5.11. Phase I development of the laser drivers has been funded through NNSA’s high average power program and it is projected that there will be sufficient technical progress to proceed to Phase II within a few years. Phase 1 development of z-pinch IFE is presently funded through NNSA, and highly leverages the single-shot inertial confinement fusion z-pinch program funded through NNSA Phase 1 development of heavy ion IFE and other forms of potentially attractive drivers including dense plasma jets has been proceeding for many years with funding through the Office of Fusion Energy Sciences. With a focused effort and appropriate funding an ETF might be operational by 2020.
Deleted: station
Deleted: under
Deleted: characterization
Deleted: in
Deleted: in
Deleted: irradiations
Deleted: high

5-31
5.6 Conclusions
Among the many thrusts for addressing climate change with the aid of technology, improved energy efficiency, CO2 capture and sequestration, and reduced emissions of non-CO2 greenhouse gases, soot and aerosols, are all important, if not essential, to goal attainment. Large quantities of energy supplied by low or near net-zero emissions technology, however, form the core of any long-term technology component of the overall strategy. Just meeting the expected growth in world energy demand over the span of the 21st century will likely be challenging enough. Meeting such demand, while simultaneously reducing emissions and maintaining economic prosperity, will be doubly challenging. Advanced technology in energy supply can facilitate progress in this direction.
Deleted: would

5-1
5 Reducing Emissions from Energy Supply
As discussed in Chapters 3 and 4, by 2100 global energy demand is projected to grow by a factor of three from today’s level (from about 400 to 1200 EJ), even under scenarios that assume energy efficiency improves over time. Growth in global electricity demand is projected to increase faster than direct use of fuels in end use applications; electricity use grows by a factor of eight – from about 50 EJ/year in 2000 to almost 400 EJ/year in 2100 in the Reference Case. In addition, use of petroleum products for transportation is also projected to rise with growing population and increased standard of living. In the Reference Case, transportation energy use grows by almost a factor of four – from about 80 EJ/year in 2000 to almost 300 EJ/year in 2100. If the mix of energy supply options does not change, a large portion of energy demand in the future will be met by combustion of fossil fuels, and the resulting emissions of CO2 would be expected to grow steadily over the course of the 21st Century. The development of advanced technologies that can significantly reduce emissions of CO2 from energy supply is a central component of the U.S. Climate Change Technology Strategy. Many technological opportunities exist for pursuing low or near-net-emissions energy supplies, which a coordinated Federal R&D investment plan can facilitate. Some build on the existing energy infrastructure, dominated by coal and other fossil fuels. They attempt to “close the loop on carbon.” The central technology in this technology scenario is advanced coal-based production facilities, usually starting with coal gasification and production of syngas, which can generate electricity, hydrogen, other valued fuels and chemicals, while also capturing and sequestering emissions of CO2 and emitting very low levels of other pollutants. Other options envision a “new energy backbone” based, in part, on continuing advances in coal-based and other energy technology systems, but significantly augmented by new and advanced, low- or near-net zero GHG-emitting energy supply technologies. These include advanced forms of: renewable energy, such as wind, photovoltaics, solar thermal applications, and others; biologically based open and closed energy cycles, such as enhanced systems for bio-mass, bio-energy, bio-fuels, and refuse-derived fuels and energy; and forms of nuclear energy, including fuel recycling, that can also meet expectations for safety and security concerns. If GHG emissions need to be reduced significantly, deployment of all of these technology options would have to scale up several orders of magnitude from that of today. In all of the Advanced Technology Scenarios examined by CCTP, zero-carbon energy sources played a role in reducing emissions toward the target trajectories (see Chapter 3). The cumulative (2000-2100) CO2 reduction attributable to carbon-free energy supply (biomass, nuclear, and renewable energy, such as biomass, wind, and solar) ranged from 8 GtC in the Closing the Loop on Carbon case that led to the low emission reduction trajectory, to 324 GtC in the New Energy Backbone case that led to the very high emission reduction trajectory. (In that New Energy Backbone case, nuclear, biomass and renewable energy make about equal contributions to the 360 GtC reduction). All of the above technology options may succeed to one extent or another. All might compete successfully in various segments of global markets for energy supply. All may satisfactorily address their attendant environmental challenges. The extent of their successes, in terms of absolute contributions to energy supply, may in fact turn out to be many times larger than their respective markets of today. Yet, even with such great successes, the total amount of energy supplied from these sources may not be sufficient to meet the clean energy demands of future generations.
Formatted: Bullets andNumbering
Comment: Please note that the figures were deleted from this review draft so that it could be emailed. With figures, it exceeded our email system limits.
Comment: It must be noted that biomass is BOTH a renewable energy feedstock as well as a carbon-free one in the terminology of this chapter. It belongs in both categories.
Comment: Disagree: “Biomass” is renewable. It does not have to be called out separately. The parenthetical should read: (nuclear energy and renewables such as wind, solar, geothermal, hydropower, and biomass)

5-2
Figure 5-1. World Electricity Generation
Figure 5-2. World Primary Energy Supply Source: IEA “Key World Energy Statistics—2003”
In this event, there may be a need for additional technology options “beyond the standard suite.” These might include advanced fuel cycles based on combinations of nano-technology and new forms of bio-assisted energy production, using genetically designed organisms for more efficient photosynthesis, hydrogen production or photon-water splitting, and CO2 capture and sequestration. They might include breakthrough designs in fusion energy. They might include advanced technologies for capturing solar energy in Earth orbit, on the moon, or in the vast desert areas of Earth, enabled, in part, by new forms of energy carriers and/or low-resistance power transmission over long-distances. Since outcomes of these technology development scenarios are not known, a prudent plan for R&D planning in the face of uncertainty is to diversify. The current Federal portfolio supports technology R&D important to all three of these technology scenarios. The analysis of the scearios, in turn, suggests that, if such technolgies were successful, the UNFCCC goal could be attainded across a wide range of hypothesized concentration levels, and so accomplished both sooner and with significant cost savings over what would otherwise be the case without such technological advance. A range of CCTP planning scenarios were designed to explore the potential roles for advanced energy technologies to slow the rate of CO2 emissions. These scenarios examined ways to reduce emissions from energy supply, while also supporting the energy demands of robust economic growth. All of the “energy supply” scenarios assumed, a priori, that the other important components of any comprehensive technology strategy were successful, e.g., the scenarios also included large gains in energy efficiency (see Chapter 3). The scenarios show that no single technology or energy source would likely meet all of the world’s energy needs or serve as the perfect solution for reducing carbon emissions. Some technologies with significant potential fell into the following categories: Low-Emission, Fossil-Based Fuels and Power Hydrogen as an Energy Carrier Renewable Energy and Fuels Nuclear Fission Nuclear Fusion
This chapter explores each of these technologies in depth, explaining the current research portfolio as well as future research directions.
Comment: As written, the sentence was not very readable and the language did not camoflage the intent of organisms designed for specific functions.
Comment: Already addressed in EPWG comments
Deleted: designed molecules
Comment: It needs to be made clear here what the three technology scenarios are. It is not clear from previous material in this chapter.
Comment: Already addressed in the EPWG comments by adding the words “above-mentioned.” The 3 advanced technology scenarios have been introduced on p. 5-1.
Comment: Please note – biomass must be assumed to be in the Renewable Energy and Fuels category in this list because it doesn’t fit in any of the others.
Comment: I agree. No revision necessary.

5-3
5.1 Low-Emission, Fossil-Based Power
Today, fossil fuels are an indispensable part of the U.S. and global energy mix. Because of its abundance and low cost, coal now accounts for more than half of the electricity generated in the United States, and it is projected to continue to supply over one half of our electricity demands through the year 2025.
5.1.1 Potential Role of Technology
Because coal is America’s most plentiful and readily available energy resource, the United States Department of Energy (DOE) has directed a portion of its research and development (R&D) resources toward finding ways to use coal in a more efficient, cost-effective, and environmentally benign manner, ultimately leading to near-zero emissions. Even small improvements in efficiency of the installed base of coal-fueled power stations result in a significant lowering of carbon emissions. For example, increasing the efficiency of all coal-fired electric generation capacity in the United States by one percentage point would avoid the emission of 14 million tons of carbon. That reduction is equivalent to replacing about 170 million incandescent light bulbs with florescent lights or weatherizing 140 million homes. New U.S. government-industry collaborative efforts are expected to continue to find ways to improve our ability to decrease emissions from coal power generation at lower costs. The goal for future power plant designs is to both increase efficiency and reduce environmental issues by developing coal-based zero emission power plants. Moreover, the focus is on designs that are compatible with carbon sequestration technology.
5.1.2 Technology Strategy
The current U.S fossil research portfolio is a fully integrated program with mid- and long-term market entry offerings. The principle goal is a zero emissions, 60 percent efficient, coal-based electricity generation plant that has the ability to co-produce low-cost hydrogen. The mid-term manifestation for that goal is expected to be the FutureGen project, which will be a cost-shared $1 billion venture that will combine electricity and hydrogen production with the elimination of virtually all emissions of air pollutants such as sulfur dioxide, nitrogen oxides, and mercury, as well as almost complete elimination of CO2, through a combination of efficiency improvements and sequestration (see Figure 5-3). This prototype power plant will serve as the test bed for proving the most advanced technologies, such as hydrogen fuel cells.
5.1.3 Current Portfolio
The low emissions fossil-based power system portfolio has several major thrusts: Advanced Power Systems: Advanced coal-fired power generation technologies can achieve very
significant reduction in CO2 emissions while providing a reliable, efficient supply of electricity. See: http://www.climatetechnology.gov/library/2003/tech-options/tech-options-2-1-2.pdf] Significant improvements in reducing CO2 have been demonstrated via efficiency improvements and co-firing of coal, biomass, and other carbonatious fuels. While current fleet average power plant efficiencies are around 33 percent, increasing efficiencies to 50 percent in the mid-term, and ultimately to 60 percent (with the integration of fuel cell technology) or more will nearly halve emissions of CO2 per unit of electricity. Development/deployment of CO2 sequestration technology

5-4
could reduce carbon emissions to near-zero levels. Recent R&D activities have focused on a portfolio of high-efficiency coal power systems including integrated gasification, combined-cycle (IGCC), pressurized fluidized bed combustion, and Vision 21 plants. Four IGCC demonstration plants are in various stages of completion.
Distributed Generation/Fuel Cells: The fuel cell program is focused on reducing the cost of fuel
cell technology by an order of magnitude. See: http://www.climatetechnology.gov/library/2003/tech-options/tech-options-2-1-3.pdf In the near and mid-term, this will enable the widespread deployment of natural gas fueled, clean, reliable fuel cells for distributed generation. In the mid-to long-term, this technology, along with others being develop as part of the Distributed Generation effort, will support coal-based FutureGen/central station applications. The goal is to develop a modular power system with lower cost, high quality electricity, and significantly lower carbon dioxide emissions than current plants. Examples of current R&D projects in this area include: (1) high-temperature fuel cell performance advancement for fuel cell turbine (FCT) hybrid application, (2) large gas turbines for hybrid FCT application, (3) hybrid systems and component demonstration, (4) low-cost fuel cell systems, (5) hydrogen storage, separation, transport, and storage, (6) high-performance materials, catalysts, and processes for reforming methane, and (7) membranes for separation of air, hydrogen, and CO2.
Co-Production/Hydrogen: Co-production technology focuses on developing technology to co-
produce electricity and hydrogen from coal and perhaps coal/biomass blends with very large reductions in CO2 emissions compared to present technologies. See: http://www.climatetechnology.gov/library/2003/tech-options/tech-options-2-1-1.pdf The technology uses synthesis gas generated from coal gasification to produce the hydrogen.
Carbon emissions are expected to be reduced in the near-term principally by improving process efficiency and in the longer term via more advanced system components such as high-efficiency fuel cells. In both the near and long-term, incorporating CO2 collection into the process, followed by permanent sequestration will be required to achieve zero emissions. Current R&D activities have focuses on: (1) Vision 21 ion transport oxygen separation membranes, (2) Vision 21 hydrogen separation membranes, and (3) early-entrance co-production plant designs. 5.1.4 Future Research Directions
The current low-emission fossil-based power portfolio supports all of the components needed to achieve the stated objectives. However, there are areas where increased R&D could reduce risk and accelerate the introduction of technologies. Some of these include: (1) enhancing the hydrogen production technology effort, (2) adding advanced hybrid gasification/combustion – which offers an alternate path to achieve many of the program goals, (3) accelerating testing at FutureGen in 2008, and (4) broadening advanced research in materials development – which offers enormous potential benefits in system efficiency, durability, and performance.

5-5
5.2 Hydrogen
As discussed above, in a long-term future characterized by low or near net-zero emissions of greenhouse gases, global energy primary supply could continue its reliance on fossil fuels, provided there were suitable means for capturing and sequestering the resulting emissions of carbon dioxide (CO2). Alternatively, the world could increase reliance on low carbon and non-fossil energy sources. These approaches share a need for carbonless energy carriers, such as electricity or some alternative, to store and deliver energy on demand to end-users. Electricity is increasingly the carbonless energy carrier of choice for stationary energy consumers, but hydrogen could prove to be an attractive carrier for the

5-6
transportation sector (e.g. highway vehicles and aircraft). If successful, hydrogen may enable reductions in petroleum use and potentially eliminate concomitant air pollutants and CO2 emissions on a global scale.
Figure 5-3. Coal-Based Energy Complex (For more information, see: http://www.fossil.energy.gov/programs/powersystems/futuregen/futuregen_report_march_04.pdf) Today hydrogen is used in various chemical processes and is made from natural gas, producing CO2
emissions. In theory, however, hydrogen can be produced from water or biomass using various energy sources, several of which do not emit CO2. GHG-free energy sources that can produce hydrogen from these sources include renewable energy-based electrolysis; various bio- and chemical processes; water shift reactions with coal and natural gas, if accompanied by CO2 capture and sequestration; nuclear energy; and direct photoconversion. Hydrogen can be stored as a pressurized gas, cryogenic liquid, or absorbed within metal powders or carbon-based physical absorbent materials. If progress can be made on a number of technical fronts and costs of producing hydrogen can be reduced, hydrogen could play valuable, enabling and synergistic roles in all aspects of heat and power generation, transport and energy end-use.
5.2.1 Potential Role for Technology
Hydrogen is ubiquitous as the major constituent of the world’s water, biomass, and fossil hydrocarbons. It accounts for 30 percent of the fuel-energy in petroleum, and over 50 percent of the fuel-energy in natural gas. A fundamental distinction between hydrogen and fossil fuels, however, is that the production of hydrogen, whether from water, methane or other hydrocarbons, is a net-energy consumer. This makes H2 not an energy source, per se, but a carrier of energy, similar to electricity. Like electricity, the potential GHG emissions associated with hydrogen use would arise from the methods of production, storage, and distribution. H2 can be generated at any scale, including central plants, fuel stations, businesses, homes, and perhaps onboard vehicles. In principle, the diversity of scales, methods, and sources of production make H2 a highly versatile fuel, capable of transforming transportation and potentially other energy services by enabling compatibility with any blend of primary energy sources. This versatility opens up possibilities for long-term dynamic optimization of CO2 emissions, technology development lead times, economics, and other factors along many and varied trajectories toward low or near net-zero GHG emissions. In a future “hydrogen economy,” H2 may ultimately serve as a means of linking energy sources to energy uses in ways that are more flexible, secure, reliable, and responsive to consumer demands than today, while also integrating transportation and electricity markets. While its simple molecular structure makes H2 an efficient synthetic fuel to produce, use, and/or convert to electricity, hydrogen’s physical properties make storage and delivery more challenging than most fuels. Consequently, most H2 today is produced at or near its point of use, consuming other fuels (e.g. natural gas) that are easier to handle and distribute. Large H2 demands at petroleum refineries or ammonia (NH3) synthesis plants can justify investment in dedicated H2 pipelines, but smaller or variable demands for H2 are usually met more economically by truck transport of compressed gaseous H2 or cryogenic and liquefied hydrogen (LH2) produced by steam methane reforming. These methods have evolved over

5-7
decades of industrial experience, with H2 as a niche chemical commodity, produced in amounts (8 billion kg H2/yr) equivalent to about 1 percent (~1EJ/yr) of current primary energy use in the United States. In order for H2 use to scale up from its current position to a global carbonless energy carrier (alongside electricity), new energetically and economically efficient technical approaches would be required for delivery, storage and production methods. Hydrogen production can be a value-added complement to other advanced climate change technologies, such as those aimed at the use of fossil fuels or biomass with CO2 capture and sequestration, and may be the key and enabling component for full deployment of carbonless electricity technologies (advanced fission, fusion, and/or intermittent renewables). In the context of technologies that address climate change, the overarching role for hydrogen is that of a universal, carbonless transportation fuel with other potentially important roles in stationary energy storage and/or distributed combined heat and power (CHP) applications. In the near term, initial deployment of H2 fleet vehicles and uninterrupted power systems may provide early adoption opportunities and exercise the existing H2 delivery and on-site production infrastructure. This will also contribute in other ways, such as improving urban air quality and strengthening electricity supply reliability. This phase of H2 use may also serve as a commercial proving ground for advanced distributed H2 production and conversion technologies using existing storage technology, both stationary and vehicular. In the mid-term, light-duty vehicles likely will be the first large mass market (10-15 EJ/yr in the U.S) for hydrogen. Fuel cells may be particularly attractive in automobiles given their efficiency vs. load characteristics and typical driving patterns. Hydrogen production could occur either in large centralized plants or using distributed production technologies on a more localized level. In the long-term, production technologies must be able to produce hydrogen at a price competitive with gasoline for bulk commercial fuel use in automobiles, freight trucks, aircraft, rail, and ships. This would likely require efficient production means and large quantities of low-cost energy supplies, say, from sequestered coal, advanced nuclear power, fusion energy, solar, wind, or biomass. Other important factors in the long-term include the cost of hydrogen storage and transportation. Finally, basic science advances in direct water splitting and solid-state hydrogen storage could possibly permit even lower cost H2 production, and safer storage, delivery, and utilization in the context of low or near net-zero emission futures for transportation and electricity generation.
5.2.2 Technology Strategy
Introducing H2 into the mix of competitive fuel options and building the foundation for a global hydrogen economy will require a balanced technical approach that envisions a plausible commercialization path, but also respects a triad of long-run uncertainties on a global scale regarding: (i) the scale, composition, and energy intensity of future worldwide transportation demand, and potential substitutes; (ii) the viability and endurance of CO2 sequestration; and (iii) the long-term economics of carbonless energy sources. The influences of these factors shape the urgency, relative importance, economic status, and ideal end-state of a future H2 infrastructure.

5-8
The Department of Energy’s Hydrogen Fuel Cells and Infrastructure Technologies Program plans to research, develop, and demonstrate the critical technologies (and implement codes and standards for safe use) needed for H2 light-duty vehicles (see Figure 5-4). The program plans to operate in cooperation with automakers and related interests in refueling infrastructure to develop technology necessary to enable a
Figure 5-4. Timeline from the DOE Hydrogen Posture Plan

5-9
commercialization decision by 2015. Success for the program is designed as validation, by 2015, of technology for: Hydrogen storage systems enabling minimum 300-mile vehicle range while meeting identified
packaging, cost, and performance requirements. Hydrogen production to safely and efficiently deliver hydrogen to consumers at prices competitive
with gasoline without adverse environmental impacts. Fuel cells to enable engine costs of less than $50/kg (in high volume production) while meeting
performance and durability requirements. (MYPP of 6/3/03, p. iii) In addition, the Department of Energy is also pursuing the production of hydrogen from nuclear power and, as discussed in Section 5.1, from coal.
5.2.3 Current Portfolio
Within the constraints of available resources, the current Federal hydrogen technology research portfolio balances the emphasis on near-term technologies that will enable a commercialization decision for H2 automobiles by 2015, and on longer-term ultimate development of a mature hydrogen economy founded on advanced H2 production, storage, and delivery technologies. Elements of the portfolio include: Hydrogen Production Using Nuclear Power. High efficiency, high temperature fission
(ultimately fusion) power plants are projected to produce H2 economically without CO2. Hydrogen would be produced by cyclic thermochemical decomposition of water or high efficiency electrolysis of high temperature steam. See: http://www.climatetechnology.gov/library/2003/tech-options/tech-options-2-2-1.pdf
Hydrogen Production Using Electricity and Fossil/Alternative Energy. Development of small-
scale steam reformers, alternative reactor technologies for producing hydrogen from natural gas, and hydrogen membrane/separation technologies for improving the economics of hydrogen production from coal with CO2 sequestration. Demonstration of on-site electrolysis integrated with renewable electricity and laboratory-scale direct water splitting by photoelectrochemical and photobiological methods. See: http://www.climatetechnology.gov/library/2003/tech-options/tech-options-2-2-3.pdf
Hydrogen Storage and Distribution. High density, energy efficient storage of hydrogen by
five (5) methods: in composite pressure vessels as a compressed gas or cryogenic vapor, liquid hydrogen (LH2) tanks, physical absorption on high surface area lightweight carbon structures, reversible metal hydrides, and chemical hydrides. Improvement of hydrogen compression and/or liquefaction equipment as well as materials compatibility of existing natural gas pipeline infrastructure for hydrogen distribution. See: http://www.climatetechnology.gov/library/2003/tech-options/tech-options-2-2-4.pdf]
Hydrogen Use. Demonstrate high efficiency solid oxide fuel cell/turbine hybrid electric generation
systems operating on coal with carbon sequestration. Also develop efficient and durable PEM fuel

5-10
cells appropriate for automotive use and stationary combined heat and power (CHP). See: http://www.climatetechnology.gov/library/2003/tech-options/tech-options-2-2-5.pdf
Integrated Hydrogen Energy Systems. Demonstrate integrated hydrogen production, hydrogen
delivery, storage, refueling of hydrogen vehicles, and use in stationary fuel cells. Provide hydrogen in gaseous and liquid form as well as blended with natural gas. See: http://www.climatetechnology.gov/library/2003/tech-options/tech-options-2-2-2.pdf
Hydrogen Infrastructure Safety. Expand the hydrogen infrastructure, building on current delivery
approaches, work with DOT to test and refine existing hydrogen technologies in compliance with Federal Standards while developing new technologies that can improve hydrogen distribution, as well as reduce or eliminate leaks or other risks. See: http://www.climatetechnology.gov/library/2003/tech-options/tech-options-2-2-6.pdf
5.2.4 Future Research Directions
Expanding beyond the current portfolio, future research directions might enable hydrogen to make its full contribution to reducing GHG’s by developing the technologies critical for hydrogen-fueled commercial transportation, integrating future electricity and H2 transportation sectors, and understanding the physical limits to efficiency of the hydrogen economy. Some elements of future research might include: Commercial Transportation Modes. If efficient hydrogen-fueled or hybrid-electric vehicles begin
to dominate the light duty passenger vehicle market (beyond 2025), commercial transportation modes (freight trucks, aircraft, marine, and rail) may become the dominant sources of transportation related CO2 emissions later in the 21st century. Therefore the future CCTP portfolio should aim at reducing the cost of hydrogen production and liquefaction of H2 for these modes and explore the infrastructure implications of H2 production and/or liquefaction on-site at airports, harbors, railyards, etc. In the case of hydrogen aircraft, the average length of future flights, and whether significant demand for supersonic passenger aircraft develops over the 21st century, will be important to determining the relative fuel economy advantages of hydrogen over conventional jet fuel. Scenarios of a worldwide shift toward hydrogen aircraft, and substitutes for shorter trips (high speed rail) could be considered.
Integration of Electricity and H2 Transportation Sectors. Eventual full deployment of solar,
wind, biomass, and nuclear electricity may require significant storage/or large flexible electricity demand for optimal utilization. Electrolytic (co)production of H2 for transportation fuel would provide such a demand. This important possibility needs to be examined to determine the economic and technical parameters for electric demand, generation, storage and hydrogen production, storage, and utilization needed to achieve a synergistic effect between H2 vehicles and carbonless electricity generation.
Develop Fundamental Understanding of the Physical Limits to Efficiency of the Hydrogen
Economy. Finally, the fundamental electrochemistry and material science of electrolyzers, fuel cells, and reversible devices needs to be fully explored. For example, the theoretical limits on electrolyte conductivity bound the power density and efficiency of both fuel cells and electrolyzers. Advancing our knowledge of these limits should allow efficiency gains in the conversion of
Comment: Already in the EPWG comments

5-11
electricity to hydrogen (and reconversion to electricity) to approach theoretical limits before hydrogen technology is deployed on a global scale.
5.3 Renewable Energy and Fuels
Renewable sources of energy include the heat and photonic energy of the sun, the kinetic energy of wind, the thermal energy of the earth itself, the kinetic energy of flowing water, and the chemical energy of biomass. These sources of energy, available in one or more forms across the United States, are converted and/or delivered to end users as electricity, direct heat, fuels, hydrogen, and useful chemicals and materials. Box 5-1 lists the eleven individual renewable energy technologies discussed in Technology Options for the Near- and Long-Term. Of the entire 71 quads of energy produced in the U.S. in 2002, renewable resources contributed 5.9 quads (8 percent). Of that, 2.7 quads came from hydropower, 2.8 quads from biomass (wood and waste), 0.3 quads from geothermal and 0.2 quads from solar and wind. (Ref: Annual Energy Review 2002, Table 1.2). Renewable energy constituted 5.9 quads out of a total consumption of 97 quads (6 percent) in the United States in 2002. Figure 5-5 shows U.S. availability of key renewable resources. The suite of renewable energy technologies is in various states of market readiness. For example, hydropower is well established but improvements in the technology could improve its efficiency and applicability. Geothermal technologies are established in some areas and applications, but significant improvements are needed to tap broader resources. Renewable energy supply technologies with the highest rates of market growth at this time include solar photovoltaic and wind energy technologies, where global shipments have been growing at 30 to 35 percent per year over the last 4 years (see graph of wind energy capacity in Figure 5-6, next page). However, the next generation of solar and wind technologies—with improved performance and lower cost—are in various stages of concept identification, laboratory research, engineering development, and process scale-up. Also, the development of integrated and advanced systems involving solar photovoltaics, concentrating solar power, solar buildings, and wind energy are still in quite early stages. Biochemical and thermo-chemical conversion technologies also range broadly in their stages of development, from some that need only to be proved at an industrial scale, to others that need more research, to others in early stages of scientific exploration. In the general category of photo-conversion, most technical ideas are at the earliest stages of concept development, theoretical modeling, and laboratory experiment.
Box 5-1 Renewable Energy and Fuels Technologies
Wind Energy Solar Photovoltaic Power Solar Buildings Concentrating Solar Power Biochemical Conversion of Biomass Thermochemical Conversion of
Biomass Biomass Residues Energy Crops Photoconversion Advanced Hydropower Geothermal Energy
Formatted: Bulleted + Level:1 + Aligned at: 18 pt + Tabafter: 36 pt + Indent at: 36pt, Tabs: 18 pt, Left

5-12
Figure 5-5. U.S. Renewable Energy Resources
Figure 5-6. Global Wind Capacity Growth
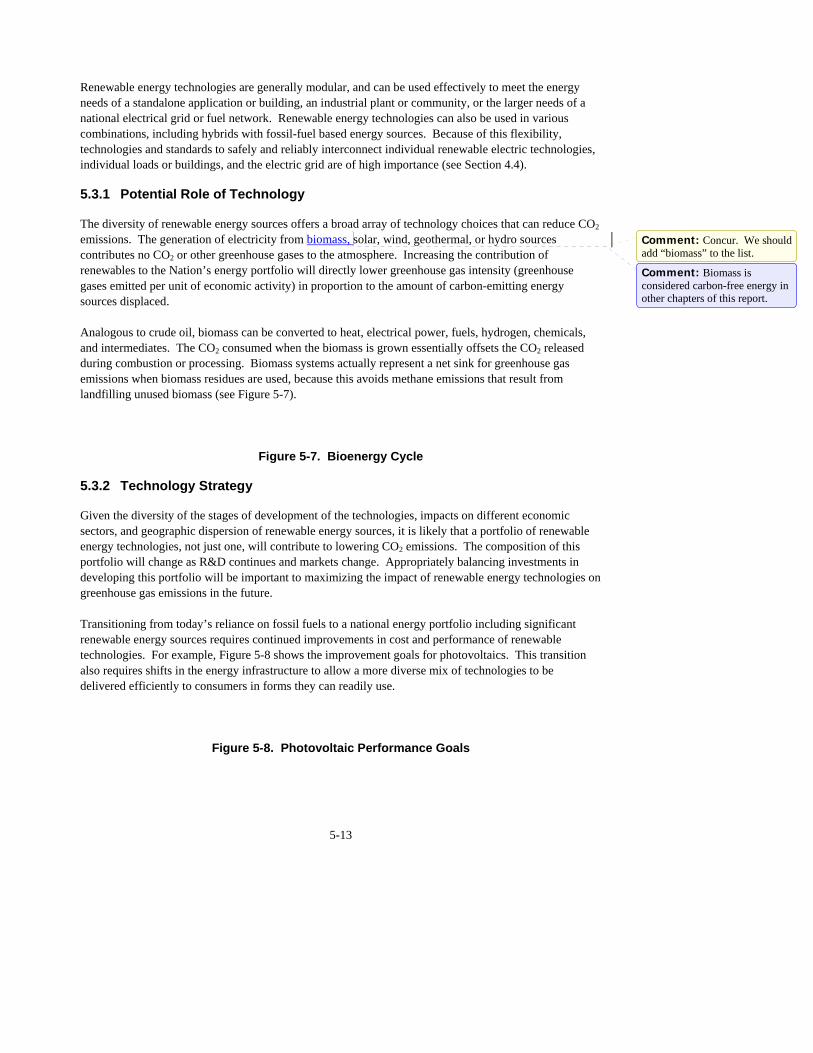
5-13
Renewable energy technologies are generally modular, and can be used effectively to meet the energy needs of a standalone application or building, an industrial plant or community, or the larger needs of a national electrical grid or fuel network. Renewable energy technologies can also be used in various combinations, including hybrids with fossil-fuel based energy sources. Because of this flexibility, technologies and standards to safely and reliably interconnect individual renewable electric technologies, individual loads or buildings, and the electric grid are of high importance (see Section 4.4).
5.3.1 Potential Role of Technology
The diversity of renewable energy sources offers a broad array of technology choices that can reduce CO2 emissions. The generation of electricity from biomass, solar, wind, geothermal, or hydro sources contributes no CO2 or other greenhouse gases to the atmosphere. Increasing the contribution of renewables to the Nation’s energy portfolio will directly lower greenhouse gas intensity (greenhouse gases emitted per unit of economic activity) in proportion to the amount of carbon-emitting energy sources displaced. Analogous to crude oil, biomass can be converted to heat, electrical power, fuels, hydrogen, chemicals, and intermediates. The CO2 consumed when the biomass is grown essentially offsets the CO2 released during combustion or processing. Biomass systems actually represent a net sink for greenhouse gas emissions when biomass residues are used, because this avoids methane emissions that result from landfilling unused biomass (see Figure 5-7).
Figure 5-7. Bioenergy Cycle
5.3.2 Technology Strategy
Given the diversity of the stages of development of the technologies, impacts on different economic sectors, and geographic dispersion of renewable energy sources, it is likely that a portfolio of renewable energy technologies, not just one, will contribute to lowering CO2 emissions. The composition of this portfolio will change as R&D continues and markets change. Appropriately balancing investments in developing this portfolio will be important to maximizing the impact of renewable energy technologies on greenhouse gas emissions in the future. Transitioning from today’s reliance on fossil fuels to a national energy portfolio including significant renewable energy sources requires continued improvements in cost and performance of renewable technologies. For example, Figure 5-8 shows the improvement goals for photovoltaics. This transition also requires shifts in the energy infrastructure to allow a more diverse mix of technologies to be delivered efficiently to consumers in forms they can readily use.
Figure 5-8. Photovoltaic Performance Goals
Comment: Concur. We should add “biomass” to the list.
Comment: Biomass is considered carbon-free energy in other chapters of this report.

5-14
In general, as performance continues to improve and costs continue to decline, improved generations of technologies will replace today’s renewable technologies. Combinations of renewable and conventional technologies and systems, and therefore integration and interconnection issues, will grow in importance. The transition from today’s energy mix to a state of greenhouse gas stabilization can be projected as an interweaving of individual renewable energy technology and market developments through the upcoming decades. Today, grid-connected wind energy, geothermal, and biopower systems are well-established and in some cases growing throughout the country. Solar hot water technologies are reasonably established, though improvements continue. Market penetration of renewable technologies is growing rapidly for smaller, high-value or remote applications of solar photovoltaics, wind energy, biomass-based combined heat and power, some hydropower, and integrated systems that may include natural gas or diesel generators. Other technologies and applications today are in various stages of research, development, and demonstration. In the near term, as system costs continue to decrease, the penetration of off-grid systems should continue to increase rapidly, including integration of renewable systems such as photovoltaics into buildings. As interconnection issues are resolved, the number of grid-connected renewable systems should increase quite rapidly, meeting local energy needs such as uninterruptible power, community power, or peak shaving. Wind energy may expand the most rapidly among grid-connected applications, with solar expanding as system costs are reduced and geothermal expanding as research reduces costs and extends access to resources. Environment-friendly hydropower systems should be developed. Demonstrations of biorefinery concepts should begin in the near term, producing one or more products (electricity, heat, fuel, etc.) from one plant using local waste and residues as the feedstock. In the mid-term, low-wind and offshore wind energy should begin to expand significantly. Reductions in cost should encourage penetration by solar technologies into more large-scale markets, first distributed markets such as commercial buildings and communities and later utility-scale systems. Solar cooling systems should become cost effective in new construction. The first hit dry rock plants should come on line, greatly extending access to geothermal resources. Hydropower should benefit from full acceptance of new turbines and operational improvements that enhance environmental performance, lowering barriers to new development. Biorefineries should begin using both waste products and energy crops as primary feedstocks. In the long-term, hydrogen from solar, wind, and possibly geothermal energy should be the backbone of the economy, powering vehicles and stationary fuel cells. Solar technologies should also be providing electricity and heat for commercial buildings, industrial plants, and entire communities in major sections of the country, and most residential and commercial buildings should generate their own energy onsite. Wind energy should be the lowest cost option for electricity generation in favorable wind regimes for grid power, and offshore systems should be prevalent. Geothermal systems should be a major source of baseload electricity for large regions. Biorefineries should be providing a wide range of cost-effective products as rural areas embrace the economic advantages of widespread demand for energy crops.
5.3.3 Current Federal Portfolio
The current Federal portfolio of renewable energy supply technologies encompasses eleven areas.

5-15
Wind Energy. Generating electricity from wind energy focuses on using aerodynamically designed blades to drive generators that produce electric power in proportion to wind speed. Utility-scale turbines range in size up to several megawatts, and smaller turbines (under 100 kilowatts) serve a range of distributed, remote, and standalone power applications. Research activities include wind characteristics and forecasting; aerodynamics; structural dynamics and fatigue; control systems; design and testing of new prototypes; component and system testing; power systems integration; and standards development. See: http://www.climatetechnology.gov/library/2003/tech-options/tech-options-2-3-1.pdf
Solar Photovoltaic Power. Generating electricity from solar energy focuses on using
semiconductor devices to convert sunlight directly to electricity. A variety of semiconductor materials can be used, varying in conversion efficiency and cost. Today’s commercial modules are 13 to 17 percent efficient and generate electricity for about 20c-32c/kWh. Efficiencies of experimental cells range from 12 to 19 percent for low-cost thin-film amorphous and polycrystalline materials, and 25 to 37 percent for higher cost multijunction cells. Research activities, conducted with strong partnerships between the federal laboratories and the private sector, include the fundamental understanding and optimization of photovoltaic materials, process and devices; module validation and testing; process research to lower costs and scale up production; and technical issues with inverters and batteries. See: http://www.climatetechnology.gov/library/2003/tech-options/tech-options-2-3-2.pdf
Solar Buildings. Solar buildings focus on combining very energy-efficient building designs,
energy-efficient lighting and appliances, and solar technologies to deliver heat, light and cooling such that a building would require zero net off-site energy on an annual basis. Technologies include solar collectors for solar hot water and space heating, solar cooling using absorption chillers or desiccant regeneration, and solar daylighting. See: http://www.climatetechnology.gov/library/2003/tech-options/tech-options-2-3-2.pdf
Concentrating Solar Power. Concentrating solar power technology involves concentrating solar
energy 50 to 5,000 times to produce high-temperature thermal energy, which is then used to produce electricity. Parabolic trough systems (1 – 100 MWe) generating electricity for 12c-14c/kWh have been demonstrated commercially; power towers (30-200 MWe) have been demonstrated; and prototype dish/Stirling engine systems (2 kWe – 10 MWe) are operating in several states. See: http://www.climatetechnology.gov/library/2003/tech-options/tech-options-2-3-4.pdf
Biochemical Conversion of Biomass. Biochemical technology can be used to convert the cellulose
and hemicellulose polymers in biomass (agricultural crops and residues, trees and forest and wood residues, grasses, and municipal waste) to their building blocks such as sugars and glycerides. Using either acid hydrolysis (well-established) or enzymatic hydrolysis (being developed), sugars can then be converted to liquid fuels such as ethanol, chemical intermediates and products such as lactic acid, and hydrogen. Glycerides can be converted to a biobased alternative for diesel fuel and other products. Producing multiple products from biomass feedstocks in a biorefinery will ultimately resemble today’s oil refinery. See: http://www.climatetechnology.gov/library/2003/tech-options/tech-options-2-3-5.pdf
Comment: Moved to put all of forest material together and make it easier on the reader.
Comment: Already addressed in the EPWG comments.
Deleted: trees,

5-16
Thermochemical Conversion of Biomass. Thermochemical technology uses heat to convert biomass into a very wide variety of products. Pyrolysis or gasification of biomass produces an oil-rich vapor or synthesis gas, which can be used to generate heat, electricity, liquid fuels, and chemicals. Combustion of biomass (or combinations of biomass and coal) generates steam for electricity production and/or space, water, or process heat, occurring today in the wood products industry and biomass power plants. Analogous to an oil refinery, a biorefinery can use one or more of these methods to convert a variety of biomass feedstocks into multiple products. See: http://www.climatetechnology.gov/library/2003/tech-options/tech-options-2-3-6.pdf
Biomass Biomass (agricultural crops and residues, trees and forest and wood residues, animal
wastes, pulp, and paper waste) must be harvested, stored, and transported on a very large scale to be used in a biorefinery. Research activities include improving and adapting the existing harvest, collection, densification, storage, transportation, and information technologies to bioenergy supply systems, and developing robust machines for multiple applications. See: http://www.climatetechnology.gov/library/2003/tech-options/tech-options-2-3-7.pdf
Energy Crops. Energy crops are fast-growing, often genetically improved trees and grasses grown
under sustainable conditions to provide feedstocks that can be converted to heat, electricity, fuels such as ethanol, and chemicals and intermediates. Research activities include genetic improvement, pest and disease management, and harvest equipment development to maximize yields and sustainability See: http://www.climatetechnology.gov/library/2003/tech-options/tech-options-2-3-8.pdf
Photoconversion. Photoconversion processes use solar photons to drive a variety of quantum
conversion processes other than solid-state photovoltaics. These processes can produce electrical power or fuels, materials, and chemicals directly from simple renewable susbstrates such as water, carbon dioxide, and nitrogen. Photoconversion processes that mimic nature (termed “bio-inspired”) can also convert CO2 into liquid and gaseous fuels. Most of these technologies are at early stages of research where technical feasibility must be demonstrated, but a few (such as dye-sensitized solar cells) are at the development level. See: http://www.climatetechnology.gov/library/2003/tech-options/tech-options-2-3-9.pdf
Advanced Hydropower. The goal of advanced hydropower technology is to maximize the use of
water for generation of electricity, while eliminating harmful environmental side effects. Representative technologies include new turbine designs that improve survivability of fish passing through the power plant and increase dissolved oxygen in downstream discharges, new assessment methods to optimize operation of reservoir system, and advanced instrumentation and control systems that modify turbine operation to maximize environmental benefits and energy production. See: http://www.climatetechnology.gov/library/2003/tech-options/tech-options-2-3-10.pdf
Geothermal Energy. Geothermal sources of energy include hot rock masses, highly pressured hot
fluids, and shallow warm groundwater. Exploration techniques locate resources to drill, well fields and distribution systems allow the hot fluids to move to the point of use, and utilization systems apply the heat directly or convert it to electricity. Geothermal heat pumps use the shallow earth as a heat source and heat sink for heating and cooling applications. The U.S. installed capacity for electrical generation is currently about 2 gigawatts, but with improved technology, the U.S. resource
Comment: Please note that this issue does not just apply to residues, but to the ag and forest crops used for energy feedstocks. The harvest, collection, transport, and handling research is needed to support the use of biomass in whatever way it is used – biochemical, thermochemical, direct combustion, or any other.
Deleted: Residues.
Deleted: residues
Deleted: forest residues,
Comment: Already addressed in the EPWG comments.
Comment: Already addressed in the EPWG comments.

5-17
base is capable of producing up to 100 gigawatts of electricity at 3c-5c/kWh. See: http://www.climatetechnology.gov/library/2003/tech-options/tech-options-2-3-11.pdf
5.3.4 Future Research Directions
Promising areas identified for consideration for new or increased emphasis in future portfolio planning include: Wind Energy. Research challenges include developing wind technology that will be economically
competitive at low wind-speed sites (13 mph), optimizing larger turbine designs for 30-year life, developing offshore wind technology to take advantage of the immense wind resources in U.S. coastal areas and the Great Lakes, and exploring the role of wind-generated electricity to produce hydrogen from the electrolysis of water.
Solar Photovoltaic Power. Research will be required to lower the cost of solar electricity further.
This can occur through developing “third-generation” materials such as quantum dots and nanostructures for ultra-high efficiencies or lower-cost organic or polymer materials; solving complex integrated processing problems to lower the cost of large-scale production of thin-film polycrystalline devices; optimizing cells and optic systems using concentrated sunlight; and improving the performance and lowering the cost of inverters and batteries.
Solar Buildings. Required research includes reducing cost and improving reliability of components
and systems, optimizing energy efficiency and renewable energy combinations, integrating solar technologies into building designs, and incorporating solar technologies into building codes and standards.
Concentrating Solar Power. Future challenges include reducing cost and improving reliability;
demonstating Stirling engine performance in the field; developing systems to generate electricity using photovoltaic cells designed for concentrated sunlight rather than heat engines; and technology to produce hydrogen from concentrated sunlight and water.
Biochemical Conversion of Biomass. Research must focus on improving the cost, yield, and
equipment reliability for harvesting, collecting, and transporting biomass; pretreating biomass before conversion; lowering the cost of the genetically engineered cellulose enzymes needed to hydrolyze biomass; developing and improving fermentation organisms; and developing integrated processing applicable to a large, continuous-production commercial facility.
Thermochemical Conversion of Biomass. Research is needed to improve the production,
preparation and handling of biomass; improve the operational reliability of thermochemical biorefineries; remove contaminants from synthesis gas; and study synthesis gas use in various applications. All the processes in the entire conversion system must be integrated to maximize efficiency and reduce costs.
Biomass. Research challenges include developing sustainable agriculture and forest management
systems that provide energy feedstocks, food, and fiber; developing cost-effective drying, densification, and transportation techniques to create more standard feedstock from various biomass
Comment: Already addressed in the EPWG comments.
Comment: Already addressed in the EPWG comments.
Comment: As noted before, the feedstock will not be all residues. Indicating that it will is misleading.
Comment: Disagree. The bullet title should not change or it would be too general and inconsistent with the previous subsection.
Deleted: Residues
Deleted: environmental data to make decisions on residue removal from agricultural and forest lands
Deleted: residues

5-18
sources; developing whole-crop harvest and fractionation systems; and developing methods for pretreatment of biomass at harvest locations.
Energy Crops. Crop research needs in the future include identifying genes that control growth and
characteristics important to conversion processes, developing gene maps, understanding functional genomics in model crops, and advanced management systems and enhanced cultural practices to optimize sustainable energy crop production
Photoconversion. Photoconversion research requires developing the fundamental scientific
understanding of photolytic processes through multidisciplinary approaches involving theory, mechanisms, kinetics, biological pathways and molecular genetics, natural photosynthesis, materials science, catalysts and catalytic cycles.
Advanced Hydropower. Research challenges include computational fluid dynamics modeling;
advanced instrumentation, sensor, and control systems; improvements to understand how fish respond to turbulent flows and other physical stresses inside turbines and downstream of dams; and field testing of new technology to measure fish survival rates.
Geothermal Energy. Future research needs include developing improved methodologies for
predicting reservoir performance and lifetime; finding and characterizing underground fracture permeability; developing low-cost innovative drilling technologies; reducing the cost and improving the efficiency of conversion systems; and developing technology that will allow the use of geothermal areas that are deeper, less permeable, or dryer than those currently considered as reserves.
5.4 Nuclear Fission
There are 440 nuclear power plants in 31 nations currently that generate 17 percent of world electricity (see Figure 5-1 earlier in the chapter), providing 7 percent of total world energy (see Figure 5-2). Because they emit no greenhouse gases, today’s nuclear power plants avoid the CO2 emissions associated with combustion of coal or other fossil fuels. Over the past 30 years, operators of nuclear power plants have steadily improved economic performance, reduced costs for maintenance and operations, improved power plant availability and efficiency, established a proven record of reliability and safety, and advanced the science and technology for the safe storage of nuclear waste. Waste from nuclear energy must be isolated from the environment. High-level nuclear wastes from fission reactors (used fuel assemblies) are stored in contained, steel-lined pools or in robust dry casks at limited-access reactor sites, until a deep geologic repository is ready to accept and permanently isolate them from the environment. However, used nuclear fuel contains a substantial quantity of fissile materials that although not economically desirable today, could be valuable in the future. Recycling would have the added benefit of reducing needed repository space. Hence, research continues to develop improved processes for recycling used nuclear fuel.
Comment: Already addressed in the EPWG comments.
Deleted: residues
Deleted: environmental research
Comment: Already addressed in the EPWG comments.
Deleted: to optimize energy crop sustainable production techniques.

5-19
While the current application of nuclear energy is the production of electricity, other applications are possible, such as co-generation of process heat, the generation of hydrogen from water or from methane (with carbon capture or integration with other materials production or manufacturing).
5.4.1 Potential Role of Technology
The goal of R&D for nuclear facility optimization is to increase the efficiency, reliability, and power generation of existing nuclear power plants to the advantage of the environment. Extending the lifetimes of currently-operating nuclear plants for 20 more years and optimizing their generation, as is being done in the United States, will offer a cost-effective resource for carbon-dioxide mitigation well into the middle part of this century. Through the early months of 2004, 23 nuclear units in the United States have received approval to extend their operating licenses to 60 years; 43 others have filed or announced their intent to file for license extensions; and most, or all, of the remaining plants are expected to follow suit. To the extent that new nuclear power plant technologies can address prevailing concerns, the nuclear option can continue to be an important part of a greenhouse gas emissions-free energy portfolio. Research and development on near-term advanced reactor concepts that offer enhancements to safety and economics should continue to enable these new technologies to be competitive in the deregulated electricity market, and support energy supply diversity and security. Evolutionary light water reactors of standardized design are now available and have received Nuclear Regulatory Commission design certification and been constructed on schedule in Japan and South Korea. However, newer nuclear energy systems in the long-term have the potential to offer significant advances in the areas of sustainability, proliferation resistance and physical protection, safety, and economics. These newer nuclear energy systems will be required to replace or add to existing light water reactor capacity.
5.4.2 Technology Strategy
The strategy for the near-term is to increase the efficiency, reliability, and power generation of existing nuclear power plants; and to help make the economic and clean air benefits of the plants available through current and renewed license terms and to provide technology to predict and measure the extent of materials damage from plant aging. In order to expand current nuclear capacity significantly in markets other than Asia and Eastern Europe (see Figure 5-9), by deploying new, advanced nuclear power plants in the relatively near-term, United States leadership is essential. The untested federal regulatory and licensing processes for the siting, construction, and operation of new nuclear plants must be demonstrated. In addition, other major obstacles (including the initial high capital costs of the first few plants and the business risks resulting from this and the regulatory uncertainty) must be addressed. In the longer-term, next-generation nuclear energy systems can serve a vital role in the Nation’s long-term, diversified energy supply. By successfully addressing the fundamental research and development issues of system concepts that excel in safety, sustainability, cost-effectiveness and proliferation resistance, the systems are highly likely to attract future private-sector sponsorship and ultimate commercialization by the private sector. Advanced nuclear systems (fission reactors and accelerator-driven systems) aim to reduce the longevity of the waste from current-generation fission reactors and aim to extract the full energy potential of the spent nuclear fuel from current fission reactors, while reducing or eliminating the potential for proliferation of nuclear materials and technologies, and reducing the

5-20
amount of waste produced. Additionally they can include energy conversion systems that can produce non-electricity products such as hydrogen, desalinated water, and process heat. A key objective of nuclear energy research and development is to enhance the basic technology, and through advanced civilian technology research, chart the way toward the next leap in technology. From these efforts, and those of industry and our overseas partners, nuclear energy will fulfill its promise as a safe, advanced, inexpensive, and environmentally sound approach to providing reliable energy throughout the world.
Figure 5-9. Nuclear Reactors Under Construction
Source: IAEA
5.4.3 Current Portfolio
The current Federal portfolio focuses on four areas: Existing plant R&D is focused on improving availability and maintainability of nuclear plants;
providing technology to predict and measure the extent of materials damage from plant aging; operating plants at higher power levels, based on more accurate measurement and knowledge of safety margins, reduced consumption of onsite electrical power, and power uprates. See: http://www.climatetechnology.gov/library/2003/tech-options/tech-options-2-4-1.pdf The Nuclear Energy Plant Optimization (NEPO) Program has supported the use of nuclear energy in the United States by conducting research and development focused on improving the operations and reliability of currently operating nuclear power plants while maintaining a high level of safety. Improved efficiency is reflected in increases in power generating capacity and improvements in reliability are reflected in increased operating predictability. The NEPO program has supported the Secretary of Energy’s priority to ensure U.S. energy security by protecting critical infrastructure that supports the production and delivery of electricity in the United States and focusing on programs that help increase the supply of domestically produced energy. Additionally, it has made significant progress toward addressing many of the aging material and generation optimization issues which have been identified as the key long-term issues facing current operating plants. Further information about current projects and recent results of the NEPO program can be obtained at the NEPO web site: http://nuclear.gov/nepo2/default-nepo.asp
Research on nuclear power plant technologies for near-term deployment is focused on
advanced fission reactor designs that are currently available or could be made available with limited additional work to complete design development and deployment in the 2010 timeframe. See: http://www.climatetechnology.gov/library/2003/tech-options/tech-options-2-4-3.pdf The Near-Term Deployment Roadmap was issued in October 2001 and advises DOE on actions and resource requirements needed to support deployment of new nuclear power plants by 2010. The primary focus of the roadmap is to identify the generic and design-specific prerequisites to near-term deployment, to identify those designs that best promise to meet the needs of the marketplace, and to propose recommended actions that would support deployment. This includes, but is not limited to, actions to achieve economic competitiveness and timely regulatory approvals.

5-21
The Nuclear Power 2010 program is designed to pave the way for an industry decision by 2005 to order at least one new nuclear power plant for deployment in the 2010 timeframe. R&D under this program supports cost-shared demonstration of the Early Site Permit (ESP) and combined Construction and Operating License (COL) processes to reduce licensing uncertainties and minimize the attendant financial risks to the licensee. In addition, the program includes technology research and development to finalize and license a standardized advanced reactor design, which U.S. power generation companies will find to be more competitive in the deregulated electricity market. The economics and business case for building new nuclear power plants is also being evaluated as part of the Nuclear Power 2010 program to identify the necessary financial conditions under which power generation companies would add new nuclear capacity.
Research on the Next-Generation Fission Energy Systems will lead to newer nuclear energy
systems that offer significant advances in the areas of sustainability, proliferation resistance and physical protection, safety, and economics. These newer nuclear energy systems will replace or add to existing light water reactor capacity and should be available starting in 2015. To develop these next-generation systems, DOE manages the Generation IV Nuclear Energy Systems Initiative. See: http://www.climatetechnology.gov/library/2003/tech-options/tech-options-2-4-2.pdf Development of next-generation nuclear energy systems is being pursued by the Generation IV International Forum, a group of ten leading nuclear nations (Argentina, Brazil, Canada, France, Japan, the Republic of Korea, the Republic of South Africa, Switzerland, the United Kingdom, and the United States) plus Euratom, who have selected six promising technologies as candidates for next-generation nuclear energy systems concepts. The Gen IV Initiative addresses the fundamental research and development issues necessary to establish the viability of next-generation nuclear energy system concepts. By successfully addressing the fundamental research and development issues of system concepts that excel in safety, sustainability, cost-effectiveness and proliferation resistance, the systems are highly likely to attract future private-sector sponsorship and ultimate commercialization by the private sector. Generation IV nuclear energy systems will not only be safe, economic and secure, but also include energy conversion systems that produce non-electricity products such as hydrogen, desalinated water, and process heat (see Figure 5-10).
Figure 5-10. Generation IV Nuclear Power Research The Advanced Fuel Cycle Initiative (AFCI) is focused on developing advanced fuel cycle
technologies, which include spent fuel treatment, advanced fuels, and transmutation technologies, for application to current operating commercial reactors and next-generation reactors and to inform a recommendation by the Secretary of Energy in the 2007-2010 timeframe on the need for a second geologic repository. See: http://www.climatetechnology.gov/library/2003/tech-options/tech-options-2-4-4.pdf
The AFCI program will develop technologies to address intermediate and long-term issues associated with spent nuclear fuel. The intermediate-term issues are the reduction of the volume and heat generation (short-term) of material requiring geologic disposal. The program will develop

5-22
proliferation-resistant processes and fuels for application to current light water reactor systems and advanced gas-cooled reactor systems to enable the energy value of these materials to be recovered, while destroying significant quantities of plutonium. This work provides the opportunity to optimize use of the Nation’s first repository and reduce the technical need for an additional repository. The longer-term issues to be addressed by the AFCI program are the development of fuel cycle technologies to destroy minor actinides, greatly reducing the long-term radiotoxicity and heat load of high-level waste sent to a geologic repository. This will be accomplished through the development of Generation IV fast reactor fuel cycle technologies and possibly accelerator-driven systems.
5.4.4 Future Research Directions
Most R&D challenges remaining for near-term deployment options relate to advanced light water and gas reactors, including fuel development, characterization, manufacture, testing and regulatory acceptance; power conversion system design and testing, including resolution of uncertainties regarding materials, reliability, and maintainability; and fission reactor internals design and verification. Additional research needs to support deployment of nuclear plant systems include: Support resolution of the technical, institutional, and regulatory barriers to the deployment of new
nuclear power plants in the 2010 timeframe, consistent with recommendations in the Near-Term Deployment Roadmap.
In cooperation with the nuclear industry, demonstrate the untested regulatory processes for Early
Site Permit and combined Construction and Operating Licenses to reduce licensing uncertainties and attendant financial risk to the licensees.
Provide for conduct of R&D to enable finalization and NRC certification of those advanced nuclear
power plant designs that the U.S. power generation companies are willing to build. Provide for development and demonstration of advanced technologies to reduce construction time
for new nuclear power plants and to minimize schedule uncertainties and associated costs for construction.
Of the other challenges that must be addressed to enable a future expansion in the use of nuclear energy in the United States and worldwide, none is more important or more difficult than that of dealing effectively with spent nuclear fuel. Compared to other industrial waste, the spent nuclear fuel generated during the production of electricity is relatively small in quantity. However, it is highly toxic for many thousands of years, and its disposal requires that many political, societal, technical, and regulatory issues be addressed. For many years, several countries around the world have pursued advanced technologies that could treat and transmute spent nuclear fuel from nuclear power plants. These technologies have the potential to dramatically reduce the quantity and toxicity of waste requiring geologic disposal. Over the last four years, the United States has joined this international effort and found considerable merit in this area of advanced research.

5-23
5.5 Fusion Energy
Fusion energy holds the possibility of an almost inexhaustible supply of zero-GHG electricity. Fusion is the power source of the sun and the stars. Lighter elements are “fused” together in the core of the sun, making heavier elements and prodigious amounts of energy. On Earth, fusion has been demonstrated in the laboratory at powers of five to fifteen million watts, with pulse lengths in the range of one to ten seconds. Today there is little doubt that fusion power can be produced at much larger scales. The two principal approaches for confining the fusion reaction are magnetic and inertial. Magnetic fusion relies on magnetic forces to confine the charged particles of the hot plasma fuel for sustained periods of fusion energy production. Inertial fusion relies on intense lasers, x-rays, or particle beams to rapidly compress a pellet of fuel to the point where fusion occurs; yielding a burst of energy that would be repeated to produce sustained energy production. Fusion power generation offers a number of advantageous features. The basic sources of fusion fuel, deuterium and tritium, are actually heavy forms of hydrogen and abundantly available. Deuterium occurs naturally in water and tritium is derived from lithium, a light metal found in the earth’s crust. Tritium is radioactive but has a relatively short half-life.(a) There are no chemical pollutants or carbon dioxide emissions from the fusion process. With appropriate advances in material technology, the radioactivity of the fusion by-products would be relatively short-lived, thereby obviating the need for extreme waste management measures. From a safety perspective, the fusion process poses little radiation risk to anyone outside the facility. Also, since only a small quantity of fuel is in the fusion system at any given time, there is little after heat to be managed in the event of an accident. The potential usefulness of fusion systems is great, but the technological challenges barring implementation are many.
5.5.1 Potential Role of Technology
Fusion energy is an attractive option to consider for long-term sustainable energy generation. It would be particularly suited for base-load electricity supply. With the growth of world population expected to occur in cities and megacities, concentrated energy sources that are not constrained with respect to where they can be located, such as fusion energy, may be particularly attractive. Additionally, the fusion process does not produce greenhouse gases and has well-attested and attractive inherent safety and environmental characteristics to gain public acceptance. Energy scenarios imposing reasonable constraints on non-sustainable energy sources show that fusion energy could contribute significantly to large-scale electricity production during the second half of the century. Also, the cost of fusion electricity is likely to be comparable to other environmentally responsible sources of electricity generation. Much basic research remains to be accomplished to make fusion energy practical and economic, but the time required for the development of fusion power is consistent with the need to bring major new non-polluting energy sources on line in mid-century. A sound approach to accomplishing the goal of making fusion a reality would be for U.S. and international laboratories and universities to continue to work together. Supporting technologies and research that are needed include:
(a) For example, the exit lights in airplanes use tritium.

5-24
Advance the scientific understanding of fusion plasmas
Develop the approaches and configurations for both magnetic and inertial fusion energy that will
take the best advantage of the newest scientific insight. Develop predictive simulations of fusion plasmas using the evolving terascale computing
capabilities Develop wave/particle heating and fueling technologies that will be used to establish and control
fusion plasmas Establish the technological basis for efficient, low-cost ion beams; develop high-average-power,
durable and cost-effective solid-state and gas laser systems; demonstrate useful gain from compression and burn of fusion energy-relevant targets in the National Ignition Facility
Extend the limits of superconducting magnet technology to improve magnetic confinement of
fusion plasmas Structural materials with low-activation properties will be required to fulfill the ultimate potential of
fusion devices Tritium generation and heat-recovery systems are other common nuclear system technologies
required for both magnetic and inertial fusion.
5.5.2 Technology Strategy
Given the substantial scientific and technological uncertainties that now exist; the U.S. government will employ an optimized portfolio strategy that explores a variety of magnetic and inertial confinement approaches that lead to the most promising commercial fusion concept. Advanced computational modeling is central to guiding and designing experiments that cannot be readily investigated in the laboratory, such as testing the agreement between theory and experiment, and exploring innovative concepts and designs for fusion plants. To ensure the highest possible scientific return on limited resources, the fusion program within the U.S. Department of Energy (DOE) will work with other DOE programs and other agencies and the international scientific community in areas such as materials science, ion beam physics, and laser physics. Large-scale experimental facilities are necessary to test approaches for self-heated (burning) fusion plasmas; for inertial fusion experiments; and for testing materials and components under extreme conditions. There are many overlapping challenges to be met (Figure 5-11). Where appropriate, the rewards, risks, and costs of major facilities will be shared through international collaborations.
Figure 5-11. Overlapping Scientific and Technological Challenges Associated with Fusion Energy Production

5-25

5-26
The overall research effort is organized around a set of four broad goals: Demonstrate with burning plasmas the scientific and technological feasibility of fusion energy
Develop a fundamental understanding of plasma behavior sufficient to provide a reliable predictive
capability for fusion energy systems Determine the most promising approaches and configurations to confining hot plasmas for practical
fusion energy systems Develop the new materials, components, and technologies necessary to make fusion energy a
reality.
5.5.3 Current Portfolio
The current Federal portfolio focuses on the basic sciences needed to better understand and to answer the major scientific questions and overcome the many technical challenges that will make it possible to harness fusion power. See: http://www.climatetechnology.gov/library/2003/tech-options/tech-options-2-5-1.pdf] In one major effort, the United States, Europe, Japan, China, Russia, and the Republic of Korea are negotiating an agreement to construct a magnetic fusion-burning plasma science and engineering test facility. Referred to as ITER, this international magnetic fusion experiment is part of a U.S. strategy to achieve magnetic confinement fusion (see Figure 5-12). Prior to ITER operation in about 2014, experiments on a wide range of tokamaks(a) worldwide will continue to develop tokamak physics in preparation for ITER operations. These experiments will include detailed simulations of ITER behavior as well as innovative new ways of operating tokamaks to achieve the optimum efficiency from this magnetic geometry. Because of the sophisticated diagnostics on the tokamaks, detailed data are already available to validate computer models.
5.5.4 Future Research Directions
The ITER design is based on the use of existing, well-qualified materials, which are not yet able to sustain the lifetime neutron irradiation required in a fusion power station. Materials resistant to radioactivity and neutron damage are needed for high performance, environmentally benign, and economically attractive power plants. Promising candidate materials already exist in industrial quantities and are under characterization. These have not been tested in fusion power conditions, although similar materials have been successfully tested in fission irradiations. In a number of areas, the fruits of basic research, not specific to fusion, could assist the development of fusion power. Basic science developments bearing on fusion plasma science relate to obtaining a better first-principles understanding and predictive capability of the non-linear dynamics of plasma behavior, including improved understanding and modeling of turbulence; self-organizing non-linear systems; particle and plasma accelerations; high energy density physics; and interpretation of very large data series (a) Tokamak, a Russian invention, refers to a donut-shaped configuration of magnetic fields that is the most
developed and well-characterized fusion configuration in the world.

5-27
by statistical modeling. Additionally, basic science developments bearing on fusion materials science relate to improvements in nano-structural engineering of materials for specific roles; predictive modeling over the complete range of scales of material behavior; and advanced instrumentation and advanced computational physics.
5.6 Conclusions
Among the many thrusts for addressing climate change with the aid of technology, improved energy efficiency, CO2 capture and sequestration, and reduced emissions of non-CO2 greenhouse gases, soot and aerosols, are all important, if not essential, to goal attainment. Large quantities of energy supplied by low or near net-zero emissions technology, however, form the core of any long-term technology component of the overall strategy. Just meeting the expected growth in world energy demand over the span of the 21st century will likely be challenging enough. Meeting such demand, while simultaneously reducing emissions and maintaining economic prosperity, would be doubly challenging. Advanced technology in energy supply can facilitate progress in this direction.
5-1
5 Reducing Emissions from Energy Supply
As discussed in Chapters 3 and 4, by 2100 global energy demand is projected to grow by a factor of three from today’s level (from about 400 to 1200 EJ), even under scenarios that assume energy efficiency improves over time. Growth in global electricity demand is projected to increase faster than direct use of fuels in end use applications; electricity use grows by a factor of eight – from about 50 EJ/year in 2000 to almost 400 EJ/year in 2100 in the Reference Case. In addition, use of petroleum products for transportation is also projected to rise with growing population and increased standard of living. In the Reference Case, transportation energy use grows by almost a factor of four – from about 80 EJ/year in 2000 to almost 300 EJ/year in 2100. If the mix of energy supply options does not change, a large portion of energy demand in the future will be met by combustion of fossil fuels, and the resulting emissions of CO2 would be expected to grow steadily over the course of the 21st Century. The development of advanced technologies that can significantly reduce emissions of CO2 from energy supply is a central component of the U.S. Climate Change Technology Strategy. Many technological opportunities exist for pursuing low or near-net-emissions energy supplies, which a coordinated Federal R&D investment plan can facilitate. Some build on the existing energy infrastructure, dominated by coal and other fossil fuels. They attempt to “close the loop on carbon.” The central technology in this technology scenario is advanced coal-based production facilities, usually starting with coal gasification and production of syngas, which can generate electricity, hydrogen, other valued fuels and chemicals, while also capturing and sequestering emissions of CO2 and emitting very low levels of other pollutants. Other options envision a “new energy backbone” based, in part, on continuing advances in coal-based and other energy technology systems, but significantly augmented by new and advanced, low- or near-net zero GHG-emitting energy supply technologies. These include advanced forms of: renewable energy, such as wind, photovoltaics, solar thermal applications, and others; biologically based open and closed energy cycles, such as enhanced systems for bio-mass, bio-energy, bio-fuels, and refuse-derived fuels and energy; and forms of nuclear energy, including fuel recycling, that can also meet expectations for safety and security concerns. If GHG emissions need to be reduced significantly, deployment of all of these technology options would have to scale up several orders of magnitude from that of today. In all of the Advanced Technology Scenarios examined by CCTP, zero-carbon energy sources played a role in reducing emissions toward the target trajectories (see Chapter 3). The cumulative (2000-2100) CO2 reduction attributable to carbon-free energy supply (biomass, nuclear, and renewable energy, such as biomass, wind, and solar) ranged from 8 GtC in the Closing the Loop on Carbon case that led to the low emission reduction trajectory, to 324 GtC in the New Energy Backbone case that led to the very high emission reduction trajectory. (In that New Energy Backbone case, nuclear, biomass and renewable energy make about equal contributions to the 360 GtC reduction). All of the above technology options may succeed to one extent or another. All might compete successfully in various segments of global markets for energy supply. All may satisfactorily address their attendant environmental challenges. The extent of their successes, in terms of absolute contributions to energy supply, may in fact turn out to be many times larger than their respective markets of today. Yet, even with such great successes, the total amount of energy supplied from these sources may not be sufficient to meet the clean energy demands of future generations.
Formatted: Bullets andNumbering
Comment: Please note that the figures were deleted from this review draft so that it could be emailed. With figures, it exceeded our email system limits.
Comment: It must be noted that biomass is BOTH a renewable energy feedstock as well as a carbon-free one in the terminology of this chapter. It belongs in both categories.
Comment: Disagree: “Biomass” is renewable. It does not have to be called out separately. The parenthetical should read: (nuclear energy and renewables such as wind, solar, geothermal, hydropower, and biomass)

5-2
Figure 5-1. World Electricity Generation
Figure 5-2. World Primary Energy Supply Source: IEA “Key World Energy Statistics—2003”
In this event, there may be a need for additional technology options “beyond the standard suite.” These might include advanced fuel cycles based on combinations of nano-technology and new forms of bio-assisted energy production, using genetically designed organisms for more efficient photosynthesis, hydrogen production or photon-water splitting, and CO2 capture and sequestration. They might include breakthrough designs in fusion energy. They might include advanced technologies for capturing solar energy in Earth orbit, on the moon, or in the vast desert areas of Earth, enabled, in part, by new forms of energy carriers and/or low-resistance power transmission over long-distances. Since outcomes of these technology development scenarios are not known, a prudent plan for R&D planning in the face of uncertainty is to diversify. The current Federal portfolio supports technology R&D important to all three of these technology scenarios. The analysis of the scearios, in turn, suggests that, if such technolgies were successful, the UNFCCC goal could be attainded across a wide range of hypothesized concentration levels, and so accomplished both sooner and with significant cost savings over what would otherwise be the case without such technological advance. A range of CCTP planning scenarios were designed to explore the potential roles for advanced energy technologies to slow the rate of CO2 emissions. These scenarios examined ways to reduce emissions from energy supply, while also supporting the energy demands of robust economic growth. All of the “energy supply” scenarios assumed, a priori, that the other important components of any comprehensive technology strategy were successful, e.g., the scenarios also included large gains in energy efficiency (see Chapter 3). The scenarios show that no single technology or energy source would likely meet all of the world’s energy needs or serve as the perfect solution for reducing carbon emissions. Some technologies with significant potential fell into the following categories: Low-Emission, Fossil-Based Fuels and Power Hydrogen as an Energy Carrier Renewable Energy and Fuels Nuclear Fission Nuclear Fusion
This chapter explores each of these technologies in depth, explaining the current research portfolio as well as future research directions.
Comment: As written, the sentence was not very readable and the language did not camoflage the intent of organisms designed for specific functions.
Deleted: designed molecules
Comment: It needs to be made clear here what the three technology scenarios are. It is not clear from previous material in this chapter.
Comment: Please note – biomass must be assumed to be in the Renewable Energy and Fuels category in this list because it doesn’t fit in any of the others.

5-3
5.1 Low-Emission, Fossil-Based Power
Today, fossil fuels are an indispensable part of the U.S. and global energy mix. Because of its abundance and low cost, coal now accounts for more than half of the electricity generated in the United States, and it is projected to continue to supply over one half of our electricity demands through the year 2025.
5.1.1 Potential Role of Technology
Because coal is America’s most plentiful and readily available energy resource, the United States Department of Energy (DOE) has directed a portion of its research and development (R&D) resources toward finding ways to use coal in a more efficient, cost-effective, and environmentally benign manner, ultimately leading to near-zero emissions. Even small improvements in efficiency of the installed base of coal-fueled power stations result in a significant lowering of carbon emissions. For example, increasing the efficiency of all coal-fired electric generation capacity in the United States by one percentage point would avoid the emission of 14 million tons of carbon. That reduction is equivalent to replacing about 170 million incandescent light bulbs with florescent lights or weatherizing 140 million homes. New U.S. government-industry collaborative efforts are expected to continue to find ways to improve our ability to decrease emissions from coal power generation at lower costs. The goal for future power plant designs is to both increase efficiency and reduce environmental issues by developing coal-based zero emission power plants. Moreover, the focus is on designs that are compatible with carbon sequestration technology.
5.1.2 Technology Strategy
The current U.S fossil research portfolio is a fully integrated program with mid- and long-term market entry offerings. The principle goal is a zero emissions, 60 percent efficient, coal-based electricity generation plant that has the ability to co-produce low-cost hydrogen. The mid-term manifestation for that goal is expected to be the FutureGen project, which will be a cost-shared $1 billion venture that will combine electricity and hydrogen production with the elimination of virtually all emissions of air pollutants such as sulfur dioxide, nitrogen oxides, and mercury, as well as almost complete elimination of CO2, through a combination of efficiency improvements and sequestration (see Figure 5-3). This prototype power plant will serve as the test bed for proving the most advanced technologies, such as hydrogen fuel cells.
5.1.3 Current Portfolio
The low emissions fossil-based power system portfolio has several major thrusts: Advanced Power Systems: Advanced coal-fired power generation technologies can achieve very
significant reduction in CO2 emissions while providing a reliable, efficient supply of electricity. See: http://www.climatetechnology.gov/library/2003/tech-options/tech-options-2-1-2.pdf] Significant improvements in reducing CO2 have been demonstrated via efficiency improvements and co-firing of coal, biomass, and other carbonatious fuels. While current fleet average power plant efficiencies are around 33 percent, increasing efficiencies to 50 percent in the mid-term, and ultimately to 60 percent (with the integration of fuel cell technology) or more will nearly halve emissions of CO2 per unit of electricity. Development/deployment of CO2 sequestration technology

5-4
could reduce carbon emissions to near-zero levels. Recent R&D activities have focused on a portfolio of high-efficiency coal power systems including integrated gasification, combined-cycle (IGCC), pressurized fluidized bed combustion, and Vision 21 plants. Four IGCC demonstration plants are in various stages of completion.
Distributed Generation/Fuel Cells: The fuel cell program is focused on reducing the cost of fuel
cell technology by an order of magnitude. See: http://www.climatetechnology.gov/library/2003/tech-options/tech-options-2-1-3.pdf In the near and mid-term, this will enable the widespread deployment of natural gas fueled, clean, reliable fuel cells for distributed generation. In the mid-to long-term, this technology, along with others being develop as part of the Distributed Generation effort, will support coal-based FutureGen/central station applications. The goal is to develop a modular power system with lower cost, high quality electricity, and significantly lower carbon dioxide emissions than current plants. Examples of current R&D projects in this area include: (1) high-temperature fuel cell performance advancement for fuel cell turbine (FCT) hybrid application, (2) large gas turbines for hybrid FCT application, (3) hybrid systems and component demonstration, (4) low-cost fuel cell systems, (5) hydrogen storage, separation, transport, and storage, (6) high-performance materials, catalysts, and processes for reforming methane, and (7) membranes for separation of air, hydrogen, and CO2.
Co-Production/Hydrogen: Co-production technology focuses on developing technology to co-
produce electricity and hydrogen from coal and perhaps coal/biomass blends with very large reductions in CO2 emissions compared to present technologies. See: http://www.climatetechnology.gov/library/2003/tech-options/tech-options-2-1-1.pdf The technology uses synthesis gas generated from coal gasification to produce the hydrogen.
Carbon emissions are expected to be reduced in the near-term principally by improving process efficiency and in the longer term via more advanced system components such as high-efficiency fuel cells. In both the near and long-term, incorporating CO2 collection into the process, followed by permanent sequestration will be required to achieve zero emissions. Current R&D activities have focuses on: (1) Vision 21 ion transport oxygen separation membranes, (2) Vision 21 hydrogen separation membranes, and (3) early-entrance co-production plant designs. 5.1.4 Future Research Directions
The current low-emission fossil-based power portfolio supports all of the components needed to achieve the stated objectives. However, there are areas where increased R&D could reduce risk and accelerate the introduction of technologies. Some of these include: (1) enhancing the hydrogen production technology effort, (2) adding advanced hybrid gasification/combustion – which offers an alternate path to achieve many of the program goals, (3) accelerating testing at FutureGen in 2008, and (4) broadening advanced research in materials development – which offers enormous potential benefits in system efficiency, durability, and performance.

5-5
5.2 Hydrogen
As discussed above, in a long-term future characterized by low or near net-zero emissions of greenhouse gases, global energy primary supply could continue its reliance on fossil fuels, provided there were suitable means for capturing and sequestering the resulting emissions of carbon dioxide (CO2). Alternatively, the world could increase reliance on low carbon and non-fossil energy sources. These approaches share a need for carbonless energy carriers, such as electricity or some alternative, to store and deliver energy on demand to end-users. Electricity is increasingly the carbonless energy carrier of choice for stationary energy consumers, but hydrogen could prove to be an attractive carrier for the

5-6
transportation sector (e.g. highway vehicles and aircraft). If successful, hydrogen may enable reductions in petroleum use and potentially eliminate concomitant air pollutants and CO2 emissions on a global scale.
Figure 5-3. Coal-Based Energy Complex (For more information, see: http://www.fossil.energy.gov/programs/powersystems/futuregen/futuregen_report_march_04.pdf) Today hydrogen is used in various chemical processes and is made from natural gas, producing CO2
emissions. In theory, however, hydrogen can be produced from water or biomass using various energy sources, several of which do not emit CO2. GHG-free energy sources that can produce hydrogen from these sources include renewable energy-based electrolysis; various bio- and chemical processes; water shift reactions with coal and natural gas, if accompanied by CO2 capture and sequestration; nuclear energy; and direct photoconversion. Hydrogen can be stored as a pressurized gas, cryogenic liquid, or absorbed within metal powders or carbon-based physical absorbent materials. If progress can be made on a number of technical fronts and costs of producing hydrogen can be reduced, hydrogen could play valuable, enabling and synergistic roles in all aspects of heat and power generation, transport and energy end-use.
5.2.1 Potential Role for Technology
Hydrogen is ubiquitous as the major constituent of the world’s water, biomass, and fossil hydrocarbons. It accounts for 30 percent of the fuel-energy in petroleum, and over 50 percent of the fuel-energy in natural gas. A fundamental distinction between hydrogen and fossil fuels, however, is that the production of hydrogen, whether from water, methane or other hydrocarbons, is a net-energy consumer. This makes H2 not an energy source, per se, but a carrier of energy, similar to electricity. Like electricity, the potential GHG emissions associated with hydrogen use would arise from the methods of production, storage, and distribution. H2 can be generated at any scale, including central plants, fuel stations, businesses, homes, and perhaps onboard vehicles. In principle, the diversity of scales, methods, and sources of production make H2 a highly versatile fuel, capable of transforming transportation and potentially other energy services by enabling compatibility with any blend of primary energy sources. This versatility opens up possibilities for long-term dynamic optimization of CO2 emissions, technology development lead times, economics, and other factors along many and varied trajectories toward low or near net-zero GHG emissions. In a future “hydrogen economy,” H2 may ultimately serve as a means of linking energy sources to energy uses in ways that are more flexible, secure, reliable, and responsive to consumer demands than today, while also integrating transportation and electricity markets. While its simple molecular structure makes H2 an efficient synthetic fuel to produce, use, and/or convert to electricity, hydrogen’s physical properties make storage and delivery more challenging than most fuels. Consequently, most H2 today is produced at or near its point of use, consuming other fuels (e.g. natural gas) that are easier to handle and distribute. Large H2 demands at petroleum refineries or ammonia (NH3) synthesis plants can justify investment in dedicated H2 pipelines, but smaller or variable demands for H2 are usually met more economically by truck transport of compressed gaseous H2 or cryogenic and liquefied hydrogen (LH2) produced by steam methane reforming. These methods have evolved over

5-7
decades of industrial experience, with H2 as a niche chemical commodity, produced in amounts (8 billion kg H2/yr) equivalent to about 1 percent (~1EJ/yr) of current primary energy use in the United States. In order for H2 use to scale up from its current position to a global carbonless energy carrier (alongside electricity), new energetically and economically efficient technical approaches would be required for delivery, storage and production methods. Hydrogen production can be a value-added complement to other advanced climate change technologies, such as those aimed at the use of fossil fuels or biomass with CO2 capture and sequestration, and may be the key and enabling component for full deployment of carbonless electricity technologies (advanced fission, fusion, and/or intermittent renewables). In the context of technologies that address climate change, the overarching role for hydrogen is that of a universal, carbonless transportation fuel with other potentially important roles in stationary energy storage and/or distributed combined heat and power (CHP) applications. In the near term, initial deployment of H2 fleet vehicles and uninterrupted power systems may provide early adoption opportunities and exercise the existing H2 delivery and on-site production infrastructure. This will also contribute in other ways, such as improving urban air quality and strengthening electricity supply reliability. This phase of H2 use may also serve as a commercial proving ground for advanced distributed H2 production and conversion technologies using existing storage technology, both stationary and vehicular. In the mid-term, light-duty vehicles likely will be the first large mass market (10-15 EJ/yr in the U.S) for hydrogen. Fuel cells may be particularly attractive in automobiles given their efficiency vs. load characteristics and typical driving patterns. Hydrogen production could occur either in large centralized plants or using distributed production technologies on a more localized level. In the long-term, production technologies must be able to produce hydrogen at a price competitive with gasoline for bulk commercial fuel use in automobiles, freight trucks, aircraft, rail, and ships. This would likely require efficient production means and large quantities of low-cost energy supplies, say, from sequestered coal, advanced nuclear power, fusion energy, solar, wind, or biomass. Other important factors in the long-term include the cost of hydrogen storage and transportation. Finally, basic science advances in direct water splitting and solid-state hydrogen storage could possibly permit even lower cost H2 production, and safer storage, delivery, and utilization in the context of low or near net-zero emission futures for transportation and electricity generation.
5.2.2 Technology Strategy
Introducing H2 into the mix of competitive fuel options and building the foundation for a global hydrogen economy will require a balanced technical approach that envisions a plausible commercialization path, but also respects a triad of long-run uncertainties on a global scale regarding: (i) the scale, composition, and energy intensity of future worldwide transportation demand, and potential substitutes; (ii) the viability and endurance of CO2 sequestration; and (iii) the long-term economics of carbonless energy sources. The influences of these factors shape the urgency, relative importance, economic status, and ideal end-state of a future H2 infrastructure.

5-8
The Department of Energy’s Hydrogen Fuel Cells and Infrastructure Technologies Program plans to research, develop, and demonstrate the critical technologies (and implement codes and standards for safe use) needed for H2 light-duty vehicles (see Figure 5-4). The program plans to operate in cooperation with automakers and related interests in refueling infrastructure to develop technology necessary to enable a
Figure 5-4. Timeline from the DOE Hydrogen Posture Plan

5-9
commercialization decision by 2015. Success for the program is designed as validation, by 2015, of technology for: Hydrogen storage systems enabling minimum 300-mile vehicle range while meeting identified
packaging, cost, and performance requirements. Hydrogen production to safely and efficiently deliver hydrogen to consumers at prices competitive
with gasoline without adverse environmental impacts. Fuel cells to enable engine costs of less than $50/kg (in high volume production) while meeting
performance and durability requirements. (MYPP of 6/3/03, p. iii) In addition, the Department of Energy is also pursuing the production of hydrogen from nuclear power and, as discussed in Section 5.1, from coal.
5.2.3 Current Portfolio
Within the constraints of available resources, the current Federal hydrogen technology research portfolio balances the emphasis on near-term technologies that will enable a commercialization decision for H2 automobiles by 2015, and on longer-term ultimate development of a mature hydrogen economy founded on advanced H2 production, storage, and delivery technologies. Elements of the portfolio include: Hydrogen Production Using Nuclear Power. High efficiency, high temperature fission
(ultimately fusion) power plants are projected to produce H2 economically without CO2. Hydrogen would be produced by cyclic thermochemical decomposition of water or high efficiency electrolysis of high temperature steam. See: http://www.climatetechnology.gov/library/2003/tech-options/tech-options-2-2-1.pdf
Hydrogen Production Using Electricity and Fossil/Alternative Energy. Development of small-
scale steam reformers, alternative reactor technologies for producing hydrogen from natural gas, and hydrogen membrane/separation technologies for improving the economics of hydrogen production from coal with CO2 sequestration. Demonstration of on-site electrolysis integrated with renewable electricity and laboratory-scale direct water splitting by photoelectrochemical and photobiological methods. See: http://www.climatetechnology.gov/library/2003/tech-options/tech-options-2-2-3.pdf
Hydrogen Storage and Distribution. High density, energy efficient storage of hydrogen by
five (5) methods: in composite pressure vessels as a compressed gas or cryogenic vapor, liquid hydrogen (LH2) tanks, physical absorption on high surface area lightweight carbon structures, reversible metal hydrides, and chemical hydrides. Improvement of hydrogen compression and/or liquefaction equipment as well as materials compatibility of existing natural gas pipeline infrastructure for hydrogen distribution. See: http://www.climatetechnology.gov/library/2003/tech-options/tech-options-2-2-4.pdf]
Hydrogen Use. Demonstrate high efficiency solid oxide fuel cell/turbine hybrid electric generation
systems operating on coal with carbon sequestration. Also develop efficient and durable PEM fuel
5-10
cells appropriate for automotive use and stationary combined heat and power (CHP). See: http://www.climatetechnology.gov/library/2003/tech-options/tech-options-2-2-5.pdf
Integrated Hydrogen Energy Systems. Demonstrate integrated hydrogen production, hydrogen
delivery, storage, refueling of hydrogen vehicles, and use in stationary fuel cells. Provide hydrogen in gaseous and liquid form as well as blended with natural gas. See: http://www.climatetechnology.gov/library/2003/tech-options/tech-options-2-2-2.pdf
Hydrogen Infrastructure Safety. Expand the hydrogen infrastructure, building on current delivery
approaches, work with DOT to test and refine existing hydrogen technologies in compliance with Federal Standards while developing new technologies that can improve hydrogen distribution, as well as reduce or eliminate leaks or other risks. See: http://www.climatetechnology.gov/library/2003/tech-options/tech-options-2-2-6.pdf
5.2.4 Future Research Directions
Expanding beyond the current portfolio, future research directions might enable hydrogen to make its full contribution to reducing GHG’s by developing the technologies critical for hydrogen-fueled commercial transportation, integrating future electricity and H2 transportation sectors, and understanding the physical limits to efficiency of the hydrogen economy. Some elements of future research might include: Commercial Transportation Modes. If efficient hydrogen-fueled or hybrid-electric vehicles begin
to dominate the light duty passenger vehicle market (beyond 2025), commercial transportation modes (freight trucks, aircraft, marine, and rail) may become the dominant sources of transportation related CO2 emissions later in the 21st century. Therefore the future CCTP portfolio should aim at reducing the cost of hydrogen production and liquefaction of H2 for these modes and explore the infrastructure implications of H2 production and/or liquefaction on-site at airports, harbors, railyards, etc. In the case of hydrogen aircraft, the average length of future flights, and whether significant demand for supersonic passenger aircraft develops over the 21st century, will be important to determining the relative fuel economy advantages of hydrogen over conventional jet fuel. Scenarios of a worldwide shift toward hydrogen aircraft, and substitutes for shorter trips (high speed rail) could be considered.
Integration of Electricity and H2 Transportation Sectors. Eventual full deployment of solar,
wind, biomass, and nuclear electricity may require significant storage/or large flexible electricity demand for optimal utilization. Electrolytic (co)production of H2 for transportation fuel would provide such a demand. This important possibility needs to be examined to determine the economic and technical parameters for electric demand, generation, storage and hydrogen production, storage, and utilization needed to achieve a synergistic effect between H2 vehicles and carbonless electricity generation.
Develop Fundamental Understanding of the Physical Limits to Efficiency of the Hydrogen
Economy. Finally, the fundamental electrochemistry and material science of electrolyzers, fuel cells, and reversible devices needs to be fully explored. For example, the theoretical limits on electrolyte conductivity bound the power density and efficiency of both fuel cells and electrolyzers. Advancing our knowledge of these limits should allow efficiency gains in the conversion of

5-11
electricity to hydrogen (and reconversion to electricity) to approach theoretical limits before hydrogen technology is deployed on a global scale.
5.3 Renewable Energy and Fuels
Renewable sources of energy include the heat and photonic energy of the sun, the kinetic energy of wind, the thermal energy of the earth itself, the kinetic energy of flowing water, and the chemical energy of biomass. These sources of energy, available in one or more forms across the United States, are converted and/or delivered to end users as electricity, direct heat, fuels, hydrogen, and useful chemicals and materials. Box 5-1 lists the eleven individual renewable energy technologies discussed in Technology Options for the Near- and Long-Term. Of the entire 71 quads of energy produced in the U.S. in 2002, renewable resources contributed 5.9 quads (8 percent). Of that, 2.7 quads came from hydropower, 2.8 quads from biomass (wood and waste), 0.3 quads from geothermal and 0.2 quads from solar and wind. (Ref: Annual Energy Review 2002, Table 1.2). Renewable energy constituted 5.9 quads out of a total consumption of 97 quads (6 percent) in the United States in 2002. Figure 5-5 shows U.S. availability of key renewable resources. The suite of renewable energy technologies is in various states of market readiness. For example, hydropower is well established but improvements in the technology could improve its efficiency and applicability. Geothermal technologies are established in some areas and applications, but significant improvements are needed to tap broader resources. Renewable energy supply technologies with the highest rates of market growth at this time include solar photovoltaic and wind energy technologies, where global shipments have been growing at 30 to 35 percent per year over the last 4 years (see graph of wind energy capacity in Figure 5-6, next page). However, the next generation of solar and wind technologies—with improved performance and lower cost—are in various stages of concept identification, laboratory research, engineering development, and process scale-up. Also, the development of integrated and advanced systems involving solar photovoltaics, concentrating solar power, solar buildings, and wind energy are still in quite early stages. Biochemical and thermo-chemical conversion technologies also range broadly in their stages of development, from some that need only to be proved at an industrial scale, to others that need more research, to others in early stages of scientific exploration. In the general category of photo-conversion, most technical ideas are at the earliest stages of concept development, theoretical modeling, and laboratory experiment.
Box 5-1 Renewable Energy and Fuels Technologies
Wind Energy Solar Photovoltaic Power Solar Buildings Concentrating Solar Power Biochemical Conversion of Biomass Thermochemical Conversion of
Biomass Biomass Residues Energy Crops Photoconversion Advanced Hydropower Geothermal Energy
Formatted: Bulleted + Level:1 + Aligned at: 18 pt + Tabafter: 36 pt + Indent at: 36pt, Tabs: 18 pt, Left

5-12
Figure 5-5. U.S. Renewable Energy Resources
Figure 5-6. Global Wind Capacity Growth

5-13
Renewable energy technologies are generally modular, and can be used effectively to meet the energy needs of a standalone application or building, an industrial plant or community, or the larger needs of a national electrical grid or fuel network. Renewable energy technologies can also be used in various combinations, including hybrids with fossil-fuel based energy sources. Because of this flexibility, technologies and standards to safely and reliably interconnect individual renewable electric technologies, individual loads or buildings, and the electric grid are of high importance (see Section 4.4).
5.3.1 Potential Role of Technology
The diversity of renewable energy sources offers a broad array of technology choices that can reduce CO2 emissions. The generation of electricity from biomass, solar, wind, geothermal, or hydro sources contributes no CO2 or other greenhouse gases to the atmosphere. Increasing the contribution of renewables to the Nation’s energy portfolio will directly lower greenhouse gas intensity (greenhouse gases emitted per unit of economic activity) in proportion to the amount of carbon-emitting energy sources displaced. Analogous to crude oil, biomass can be converted to heat, electrical power, fuels, hydrogen, chemicals, and intermediates. The CO2 consumed when the biomass is grown essentially offsets the CO2 released during combustion or processing. Biomass systems actually represent a net sink for greenhouse gas emissions when biomass residues are used, because this avoids methane emissions that result from landfilling unused biomass (see Figure 5-7).
Figure 5-7. Bioenergy Cycle
5.3.2 Technology Strategy
Given the diversity of the stages of development of the technologies, impacts on different economic sectors, and geographic dispersion of renewable energy sources, it is likely that a portfolio of renewable energy technologies, not just one, will contribute to lowering CO2 emissions. The composition of this portfolio will change as R&D continues and markets change. Appropriately balancing investments in developing this portfolio will be important to maximizing the impact of renewable energy technologies on greenhouse gas emissions in the future. Transitioning from today’s reliance on fossil fuels to a national energy portfolio including significant renewable energy sources requires continued improvements in cost and performance of renewable technologies. For example, Figure 5-8 shows the improvement goals for photovoltaics. This transition also requires shifts in the energy infrastructure to allow a more diverse mix of technologies to be delivered efficiently to consumers in forms they can readily use.
Figure 5-8. Photovoltaic Performance Goals
Comment: Biomass is considered carbon-free energy in other chapters of this report.

5-14
In general, as performance continues to improve and costs continue to decline, improved generations of technologies will replace today’s renewable technologies. Combinations of renewable and conventional technologies and systems, and therefore integration and interconnection issues, will grow in importance. The transition from today’s energy mix to a state of greenhouse gas stabilization can be projected as an interweaving of individual renewable energy technology and market developments through the upcoming decades. Today, grid-connected wind energy, geothermal, and biopower systems are well-established and in some cases growing throughout the country. Solar hot water technologies are reasonably established, though improvements continue. Market penetration of renewable technologies is growing rapidly for smaller, high-value or remote applications of solar photovoltaics, wind energy, biomass-based combined heat and power, some hydropower, and integrated systems that may include natural gas or diesel generators. Other technologies and applications today are in various stages of research, development, and demonstration. In the near term, as system costs continue to decrease, the penetration of off-grid systems should continue to increase rapidly, including integration of renewable systems such as photovoltaics into buildings. As interconnection issues are resolved, the number of grid-connected renewable systems should increase quite rapidly, meeting local energy needs such as uninterruptible power, community power, or peak shaving. Wind energy may expand the most rapidly among grid-connected applications, with solar expanding as system costs are reduced and geothermal expanding as research reduces costs and extends access to resources. Environment-friendly hydropower systems should be developed. Demonstrations of biorefinery concepts should begin in the near term, producing one or more products (electricity, heat, fuel, etc.) from one plant using local waste and residues as the feedstock. In the mid-term, low-wind and offshore wind energy should begin to expand significantly. Reductions in cost should encourage penetration by solar technologies into more large-scale markets, first distributed markets such as commercial buildings and communities and later utility-scale systems. Solar cooling systems should become cost effective in new construction. The first hit dry rock plants should come on line, greatly extending access to geothermal resources. Hydropower should benefit from full acceptance of new turbines and operational improvements that enhance environmental performance, lowering barriers to new development. Biorefineries should begin using both waste products and energy crops as primary feedstocks. In the long-term, hydrogen from solar, wind, and possibly geothermal energy should be the backbone of the economy, powering vehicles and stationary fuel cells. Solar technologies should also be providing electricity and heat for commercial buildings, industrial plants, and entire communities in major sections of the country, and most residential and commercial buildings should generate their own energy onsite. Wind energy should be the lowest cost option for electricity generation in favorable wind regimes for grid power, and offshore systems should be prevalent. Geothermal systems should be a major source of baseload electricity for large regions. Biorefineries should be providing a wide range of cost-effective products as rural areas embrace the economic advantages of widespread demand for energy crops.
5.3.3 Current Federal Portfolio
The current Federal portfolio of renewable energy supply technologies encompasses eleven areas.

5-15
Wind Energy. Generating electricity from wind energy focuses on using aerodynamically designed blades to drive generators that produce electric power in proportion to wind speed. Utility-scale turbines range in size up to several megawatts, and smaller turbines (under 100 kilowatts) serve a range of distributed, remote, and standalone power applications. Research activities include wind characteristics and forecasting; aerodynamics; structural dynamics and fatigue; control systems; design and testing of new prototypes; component and system testing; power systems integration; and standards development. See: http://www.climatetechnology.gov/library/2003/tech-options/tech-options-2-3-1.pdf
Solar Photovoltaic Power. Generating electricity from solar energy focuses on using
semiconductor devices to convert sunlight directly to electricity. A variety of semiconductor materials can be used, varying in conversion efficiency and cost. Today’s commercial modules are 13 to 17 percent efficient and generate electricity for about 20c-32c/kWh. Efficiencies of experimental cells range from 12 to 19 percent for low-cost thin-film amorphous and polycrystalline materials, and 25 to 37 percent for higher cost multijunction cells. Research activities, conducted with strong partnerships between the federal laboratories and the private sector, include the fundamental understanding and optimization of photovoltaic materials, process and devices; module validation and testing; process research to lower costs and scale up production; and technical issues with inverters and batteries. See: http://www.climatetechnology.gov/library/2003/tech-options/tech-options-2-3-2.pdf
Solar Buildings. Solar buildings focus on combining very energy-efficient building designs,
energy-efficient lighting and appliances, and solar technologies to deliver heat, light and cooling such that a building would require zero net off-site energy on an annual basis. Technologies include solar collectors for solar hot water and space heating, solar cooling using absorption chillers or desiccant regeneration, and solar daylighting. See: http://www.climatetechnology.gov/library/2003/tech-options/tech-options-2-3-2.pdf
Concentrating Solar Power. Concentrating solar power technology involves concentrating solar
energy 50 to 5,000 times to produce high-temperature thermal energy, which is then used to produce electricity. Parabolic trough systems (1 – 100 MWe) generating electricity for 12c-14c/kWh have been demonstrated commercially; power towers (30-200 MWe) have been demonstrated; and prototype dish/Stirling engine systems (2 kWe – 10 MWe) are operating in several states. See: http://www.climatetechnology.gov/library/2003/tech-options/tech-options-2-3-4.pdf
Biochemical Conversion of Biomass. Biochemical technology can be used to convert the cellulose
and hemicellulose polymers in biomass (agricultural crops and residues, trees and forest and wood residues, grasses, and municipal waste) to their building blocks such as sugars and glycerides. Using either acid hydrolysis (well-established) or enzymatic hydrolysis (being developed), sugars can then be converted to liquid fuels such as ethanol, chemical intermediates and products such as lactic acid, and hydrogen. Glycerides can be converted to a biobased alternative for diesel fuel and other products. Producing multiple products from biomass feedstocks in a biorefinery will ultimately resemble today’s oil refinery. See: http://www.climatetechnology.gov/library/2003/tech-options/tech-options-2-3-5.pdf
Comment: Moved to put all of forest material together and make it easier on the reader.
Deleted: trees,

5-16
Thermochemical Conversion of Biomass. Thermochemical technology uses heat to convert biomass into a very wide variety of products. Pyrolysis or gasification of biomass produces an oil-rich vapor or synthesis gas, which can be used to generate heat, electricity, liquid fuels, and chemicals. Combustion of biomass (or combinations of biomass and coal) generates steam for electricity production and/or space, water, or process heat, occurring today in the wood products industry and biomass power plants. Analogous to an oil refinery, a biorefinery can use one or more of these methods to convert a variety of biomass feedstocks into multiple products. See: http://www.climatetechnology.gov/library/2003/tech-options/tech-options-2-3-6.pdf
Biomass Biomass (agricultural crops and residues, trees and forest and wood residues, animal
wastes, pulp, and paper waste) must be harvested, stored, and transported on a very large scale to be used in a biorefinery. Research activities include improving and adapting the existing harvest, collection, densification, storage, transportation, and information technologies to bioenergy supply systems, and developing robust machines for multiple applications. See: http://www.climatetechnology.gov/library/2003/tech-options/tech-options-2-3-7.pdf
Energy Crops. Energy crops are fast-growing, often genetically improved trees and grasses grown
under sustainable conditions to provide feedstocks that can be converted to heat, electricity, fuels such as ethanol, and chemicals and intermediates. Research activities include genetic improvement, pest and disease management, and harvest equipment development to maximize yields and sustainability See: http://www.climatetechnology.gov/library/2003/tech-options/tech-options-2-3-8.pdf
Photoconversion. Photoconversion processes use solar photons to drive a variety of quantum
conversion processes other than solid-state photovoltaics. These processes can produce electrical power or fuels, materials, and chemicals directly from simple renewable susbstrates such as water, carbon dioxide, and nitrogen. Photoconversion processes that mimic nature (termed “bio-inspired”) can also convert CO2 into liquid and gaseous fuels. Most of these technologies are at early stages of research where technical feasibility must be demonstrated, but a few (such as dye-sensitized solar cells) are at the development level. See: http://www.climatetechnology.gov/library/2003/tech-options/tech-options-2-3-9.pdf
Advanced Hydropower. The goal of advanced hydropower technology is to maximize the use of
water for generation of electricity, while eliminating harmful environmental side effects. Representative technologies include new turbine designs that improve survivability of fish passing through the power plant and increase dissolved oxygen in downstream discharges, new assessment methods to optimize operation of reservoir system, and advanced instrumentation and control systems that modify turbine operation to maximize environmental benefits and energy production. See: http://www.climatetechnology.gov/library/2003/tech-options/tech-options-2-3-10.pdf
Geothermal Energy. Geothermal sources of energy include hot rock masses, highly pressured hot
fluids, and shallow warm groundwater. Exploration techniques locate resources to drill, well fields and distribution systems allow the hot fluids to move to the point of use, and utilization systems apply the heat directly or convert it to electricity. Geothermal heat pumps use the shallow earth as a heat source and heat sink for heating and cooling applications. The U.S. installed capacity for electrical generation is currently about 2 gigawatts, but with improved technology, the U.S. resource
Comment: Please note that this issue does not just apply to residues, but to the ag and forest crops used for energy feedstocks. The harvest, collection, transport, and handling research is needed to support the use of biomass in whatever way it is used – biochemical, thermochemical, direct combustion, or any other.
Deleted: Residues.
Deleted: residues
Deleted: forest residues,

5-17
base is capable of producing up to 100 gigawatts of electricity at 3c-5c/kWh. See: http://www.climatetechnology.gov/library/2003/tech-options/tech-options-2-3-11.pdf
5.3.4 Future Research Directions
Promising areas identified for consideration for new or increased emphasis in future portfolio planning include: Wind Energy. Research challenges include developing wind technology that will be economically
competitive at low wind-speed sites (13 mph), optimizing larger turbine designs for 30-year life, developing offshore wind technology to take advantage of the immense wind resources in U.S. coastal areas and the Great Lakes, and exploring the role of wind-generated electricity to produce hydrogen from the electrolysis of water.
Solar Photovoltaic Power. Research will be required to lower the cost of solar electricity further.
This can occur through developing “third-generation” materials such as quantum dots and nanostructures for ultra-high efficiencies or lower-cost organic or polymer materials; solving complex integrated processing problems to lower the cost of large-scale production of thin-film polycrystalline devices; optimizing cells and optic systems using concentrated sunlight; and improving the performance and lowering the cost of inverters and batteries.
Solar Buildings. Required research includes reducing cost and improving reliability of components
and systems, optimizing energy efficiency and renewable energy combinations, integrating solar technologies into building designs, and incorporating solar technologies into building codes and standards.
Concentrating Solar Power. Future challenges include reducing cost and improving reliability;
demonstating Stirling engine performance in the field; developing systems to generate electricity using photovoltaic cells designed for concentrated sunlight rather than heat engines; and technology to produce hydrogen from concentrated sunlight and water.
Biochemical Conversion of Biomass. Research must focus on improving the cost, yield, and
equipment reliability for harvesting, collecting, and transporting biomass; pretreating biomass before conversion; lowering the cost of the genetically engineered cellulose enzymes needed to hydrolyze biomass; developing and improving fermentation organisms; and developing integrated processing applicable to a large, continuous-production commercial facility.
Thermochemical Conversion of Biomass. Research is needed to improve the production,
preparation and handling of biomass; improve the operational reliability of thermochemical biorefineries; remove contaminants from synthesis gas; and study synthesis gas use in various applications. All the processes in the entire conversion system must be integrated to maximize efficiency and reduce costs.
Biomass. Research challenges include developing sustainable agriculture and forest management
systems that provide energy feedstocks, food, and fiber; developing cost-effective drying, densification, and transportation techniques to create more standard feedstock from various biomass
Comment: As noted before, the feedstock will not be all residues. Indicating that it will is misleading.
Deleted: Residues
Deleted: environmental data to make decisions on residue removal from agricultural and forest lands
Deleted: residues

5-18
sources; developing whole-crop harvest and fractionation systems; and developing methods for pretreatment of biomass at harvest locations.
Energy Crops. Crop research needs in the future include identifying genes that control growth and
characteristics important to conversion processes, developing gene maps, understanding functional genomics in model crops, and advanced management systems and enhanced cultural practices to optimize sustainable energy crop production
Photoconversion. Photoconversion research requires developing the fundamental scientific
understanding of photolytic processes through multidisciplinary approaches involving theory, mechanisms, kinetics, biological pathways and molecular genetics, natural photosynthesis, materials science, catalysts and catalytic cycles.
Advanced Hydropower. Research challenges include computational fluid dynamics modeling;
advanced instrumentation, sensor, and control systems; improvements to understand how fish respond to turbulent flows and other physical stresses inside turbines and downstream of dams; and field testing of new technology to measure fish survival rates.
Geothermal Energy. Future research needs include developing improved methodologies for
predicting reservoir performance and lifetime; finding and characterizing underground fracture permeability; developing low-cost innovative drilling technologies; reducing the cost and improving the efficiency of conversion systems; and developing technology that will allow the use of geothermal areas that are deeper, less permeable, or dryer than those currently considered as reserves.
5.4 Nuclear Fission
There are 440 nuclear power plants in 31 nations currently that generate 17 percent of world electricity (see Figure 5-1 earlier in the chapter), providing 7 percent of total world energy (see Figure 5-2). Because they emit no greenhouse gases, today’s nuclear power plants avoid the CO2 emissions associated with combustion of coal or other fossil fuels. Over the past 30 years, operators of nuclear power plants have steadily improved economic performance, reduced costs for maintenance and operations, improved power plant availability and efficiency, established a proven record of reliability and safety, and advanced the science and technology for the safe storage of nuclear waste. Waste from nuclear energy must be isolated from the environment. High-level nuclear wastes from fission reactors (used fuel assemblies) are stored in contained, steel-lined pools or in robust dry casks at limited-access reactor sites, until a deep geologic repository is ready to accept and permanently isolate them from the environment. However, used nuclear fuel contains a substantial quantity of fissile materials that although not economically desirable today, could be valuable in the future. Recycling would have the added benefit of reducing needed repository space. Hence, research continues to develop improved processes for recycling used nuclear fuel.
Deleted: residues
Deleted: environmental research
Deleted: to optimize energy crop sustainable production techniques.

5-19
While the current application of nuclear energy is the production of electricity, other applications are possible, such as co-generation of process heat, the generation of hydrogen from water or from methane (with carbon capture or integration with other materials production or manufacturing).
5.4.1 Potential Role of Technology
The goal of R&D for nuclear facility optimization is to increase the efficiency, reliability, and power generation of existing nuclear power plants to the advantage of the environment. Extending the lifetimes of currently-operating nuclear plants for 20 more years and optimizing their generation, as is being done in the United States, will offer a cost-effective resource for carbon-dioxide mitigation well into the middle part of this century. Through the early months of 2004, 23 nuclear units in the United States have received approval to extend their operating licenses to 60 years; 43 others have filed or announced their intent to file for license extensions; and most, or all, of the remaining plants are expected to follow suit. To the extent that new nuclear power plant technologies can address prevailing concerns, the nuclear option can continue to be an important part of a greenhouse gas emissions-free energy portfolio. Research and development on near-term advanced reactor concepts that offer enhancements to safety and economics should continue to enable these new technologies to be competitive in the deregulated electricity market, and support energy supply diversity and security. Evolutionary light water reactors of standardized design are now available and have received Nuclear Regulatory Commission design certification and been constructed on schedule in Japan and South Korea. However, newer nuclear energy systems in the long-term have the potential to offer significant advances in the areas of sustainability, proliferation resistance and physical protection, safety, and economics. These newer nuclear energy systems will be required to replace or add to existing light water reactor capacity.
5.4.2 Technology Strategy
The strategy for the near-term is to increase the efficiency, reliability, and power generation of existing nuclear power plants; and to help make the economic and clean air benefits of the plants available through current and renewed license terms and to provide technology to predict and measure the extent of materials damage from plant aging. In order to expand current nuclear capacity significantly in markets other than Asia and Eastern Europe (see Figure 5-9), by deploying new, advanced nuclear power plants in the relatively near-term, United States leadership is essential. The untested federal regulatory and licensing processes for the siting, construction, and operation of new nuclear plants must be demonstrated. In addition, other major obstacles (including the initial high capital costs of the first few plants and the business risks resulting from this and the regulatory uncertainty) must be addressed. In the longer-term, next-generation nuclear energy systems can serve a vital role in the Nation’s long-term, diversified energy supply. By successfully addressing the fundamental research and development issues of system concepts that excel in safety, sustainability, cost-effectiveness and proliferation resistance, the systems are highly likely to attract future private-sector sponsorship and ultimate commercialization by the private sector. Advanced nuclear systems (fission reactors and accelerator-driven systems) aim to reduce the longevity of the waste from current-generation fission reactors and aim to extract the full energy potential of the spent nuclear fuel from current fission reactors, while reducing or eliminating the potential for proliferation of nuclear materials and technologies, and reducing the

5-20
amount of waste produced. Additionally they can include energy conversion systems that can produce non-electricity products such as hydrogen, desalinated water, and process heat. A key objective of nuclear energy research and development is to enhance the basic technology, and through advanced civilian technology research, chart the way toward the next leap in technology. From these efforts, and those of industry and our overseas partners, nuclear energy will fulfill its promise as a safe, advanced, inexpensive, and environmentally sound approach to providing reliable energy throughout the world.
Figure 5-9. Nuclear Reactors Under Construction
Source: IAEA
5.4.3 Current Portfolio
The current Federal portfolio focuses on four areas: Existing plant R&D is focused on improving availability and maintainability of nuclear plants;
providing technology to predict and measure the extent of materials damage from plant aging; operating plants at higher power levels, based on more accurate measurement and knowledge of safety margins, reduced consumption of onsite electrical power, and power uprates. See: http://www.climatetechnology.gov/library/2003/tech-options/tech-options-2-4-1.pdf The Nuclear Energy Plant Optimization (NEPO) Program has supported the use of nuclear energy in the United States by conducting research and development focused on improving the operations and reliability of currently operating nuclear power plants while maintaining a high level of safety. Improved efficiency is reflected in increases in power generating capacity and improvements in reliability are reflected in increased operating predictability. The NEPO program has supported the Secretary of Energy’s priority to ensure U.S. energy security by protecting critical infrastructure that supports the production and delivery of electricity in the United States and focusing on programs that help increase the supply of domestically produced energy. Additionally, it has made significant progress toward addressing many of the aging material and generation optimization issues which have been identified as the key long-term issues facing current operating plants. Further information about current projects and recent results of the NEPO program can be obtained at the NEPO web site: http://nuclear.gov/nepo2/default-nepo.asp
Research on nuclear power plant technologies for near-term deployment is focused on
advanced fission reactor designs that are currently available or could be made available with limited additional work to complete design development and deployment in the 2010 timeframe. See: http://www.climatetechnology.gov/library/2003/tech-options/tech-options-2-4-3.pdf The Near-Term Deployment Roadmap was issued in October 2001 and advises DOE on actions and resource requirements needed to support deployment of new nuclear power plants by 2010. The primary focus of the roadmap is to identify the generic and design-specific prerequisites to near-term deployment, to identify those designs that best promise to meet the needs of the marketplace, and to propose recommended actions that would support deployment. This includes, but is not limited to, actions to achieve economic competitiveness and timely regulatory approvals.

5-21
The Nuclear Power 2010 program is designed to pave the way for an industry decision by 2005 to order at least one new nuclear power plant for deployment in the 2010 timeframe. R&D under this program supports cost-shared demonstration of the Early Site Permit (ESP) and combined Construction and Operating License (COL) processes to reduce licensing uncertainties and minimize the attendant financial risks to the licensee. In addition, the program includes technology research and development to finalize and license a standardized advanced reactor design, which U.S. power generation companies will find to be more competitive in the deregulated electricity market. The economics and business case for building new nuclear power plants is also being evaluated as part of the Nuclear Power 2010 program to identify the necessary financial conditions under which power generation companies would add new nuclear capacity.
Research on the Next-Generation Fission Energy Systems will lead to newer nuclear energy
systems that offer significant advances in the areas of sustainability, proliferation resistance and physical protection, safety, and economics. These newer nuclear energy systems will replace or add to existing light water reactor capacity and should be available starting in 2015. To develop these next-generation systems, DOE manages the Generation IV Nuclear Energy Systems Initiative. See: http://www.climatetechnology.gov/library/2003/tech-options/tech-options-2-4-2.pdf Development of next-generation nuclear energy systems is being pursued by the Generation IV International Forum, a group of ten leading nuclear nations (Argentina, Brazil, Canada, France, Japan, the Republic of Korea, the Republic of South Africa, Switzerland, the United Kingdom, and the United States) plus Euratom, who have selected six promising technologies as candidates for next-generation nuclear energy systems concepts. The Gen IV Initiative addresses the fundamental research and development issues necessary to establish the viability of next-generation nuclear energy system concepts. By successfully addressing the fundamental research and development issues of system concepts that excel in safety, sustainability, cost-effectiveness and proliferation resistance, the systems are highly likely to attract future private-sector sponsorship and ultimate commercialization by the private sector. Generation IV nuclear energy systems will not only be safe, economic and secure, but also include energy conversion systems that produce non-electricity products such as hydrogen, desalinated water, and process heat (see Figure 5-10).
Figure 5-10. Generation IV Nuclear Power Research The Advanced Fuel Cycle Initiative (AFCI) is focused on developing advanced fuel cycle
technologies, which include spent fuel treatment, advanced fuels, and transmutation technologies, for application to current operating commercial reactors and next-generation reactors and to inform a recommendation by the Secretary of Energy in the 2007-2010 timeframe on the need for a second geologic repository. See: http://www.climatetechnology.gov/library/2003/tech-options/tech-options-2-4-4.pdf
The AFCI program will develop technologies to address intermediate and long-term issues associated with spent nuclear fuel. The intermediate-term issues are the reduction of the volume and heat generation (short-term) of material requiring geologic disposal. The program will develop

5-22
proliferation-resistant processes and fuels for application to current light water reactor systems and advanced gas-cooled reactor systems to enable the energy value of these materials to be recovered, while destroying significant quantities of plutonium. This work provides the opportunity to optimize use of the Nation’s first repository and reduce the technical need for an additional repository. The longer-term issues to be addressed by the AFCI program are the development of fuel cycle technologies to destroy minor actinides, greatly reducing the long-term radiotoxicity and heat load of high-level waste sent to a geologic repository. This will be accomplished through the development of Generation IV fast reactor fuel cycle technologies and possibly accelerator-driven systems.
5.4.4 Future Research Directions
Most R&D challenges remaining for near-term deployment options relate to advanced light water and gas reactors, including fuel development, characterization, manufacture, testing and regulatory acceptance; power conversion system design and testing, including resolution of uncertainties regarding materials, reliability, and maintainability; and fission reactor internals design and verification. Additional research needs to support deployment of nuclear plant systems include: Support resolution of the technical, institutional, and regulatory barriers to the deployment of new
nuclear power plants in the 2010 timeframe, consistent with recommendations in the Near-Term Deployment Roadmap.
In cooperation with the nuclear industry, demonstrate the untested regulatory processes for Early
Site Permit and combined Construction and Operating Licenses to reduce licensing uncertainties and attendant financial risk to the licensees.
Provide for conduct of R&D to enable finalization and NRC certification of those advanced nuclear
power plant designs that the U.S. power generation companies are willing to build. Provide for development and demonstration of advanced technologies to reduce construction time
for new nuclear power plants and to minimize schedule uncertainties and associated costs for construction.
Of the other challenges that must be addressed to enable a future expansion in the use of nuclear energy in the United States and worldwide, none is more important or more difficult than that of dealing effectively with spent nuclear fuel. Compared to other industrial waste, the spent nuclear fuel generated during the production of electricity is relatively small in quantity. However, it is highly toxic for many thousands of years, and its disposal requires that many political, societal, technical, and regulatory issues be addressed. For many years, several countries around the world have pursued advanced technologies that could treat and transmute spent nuclear fuel from nuclear power plants. These technologies have the potential to dramatically reduce the quantity and toxicity of waste requiring geologic disposal. Over the last four years, the United States has joined this international effort and found considerable merit in this area of advanced research.

5-23
5.5 Fusion Energy
Fusion energy holds the possibility of an almost inexhaustible supply of zero-GHG electricity. Fusion is the power source of the sun and the stars. Lighter elements are “fused” together in the core of the sun, making heavier elements and prodigious amounts of energy. On Earth, fusion has been demonstrated in the laboratory at powers of five to fifteen million watts, with pulse lengths in the range of one to ten seconds. Today there is little doubt that fusion power can be produced at much larger scales. The two principal approaches for confining the fusion reaction are magnetic and inertial. Magnetic fusion relies on magnetic forces to confine the charged particles of the hot plasma fuel for sustained periods of fusion energy production. Inertial fusion relies on intense lasers, x-rays, or particle beams to rapidly compress a pellet of fuel to the point where fusion occurs; yielding a burst of energy that would be repeated to produce sustained energy production. Fusion power generation offers a number of advantageous features. The basic sources of fusion fuel, deuterium and tritium, are actually heavy forms of hydrogen and abundantly available. Deuterium occurs naturally in water and tritium is derived from lithium, a light metal found in the earth’s crust. Tritium is radioactive but has a relatively short half-life.(a) There are no chemical pollutants or carbon dioxide emissions from the fusion process. With appropriate advances in material technology, the radioactivity of the fusion by-products would be relatively short-lived, thereby obviating the need for extreme waste management measures. From a safety perspective, the fusion process poses little radiation risk to anyone outside the facility. Also, since only a small quantity of fuel is in the fusion system at any given time, there is little after heat to be managed in the event of an accident. The potential usefulness of fusion systems is great, but the technological challenges barring implementation are many.
5.5.1 Potential Role of Technology
Fusion energy is an attractive option to consider for long-term sustainable energy generation. It would be particularly suited for base-load electricity supply. With the growth of world population expected to occur in cities and megacities, concentrated energy sources that are not constrained with respect to where they can be located, such as fusion energy, may be particularly attractive. Additionally, the fusion process does not produce greenhouse gases and has well-attested and attractive inherent safety and environmental characteristics to gain public acceptance. Energy scenarios imposing reasonable constraints on non-sustainable energy sources show that fusion energy could contribute significantly to large-scale electricity production during the second half of the century. Also, the cost of fusion electricity is likely to be comparable to other environmentally responsible sources of electricity generation. Much basic research remains to be accomplished to make fusion energy practical and economic, but the time required for the development of fusion power is consistent with the need to bring major new non-polluting energy sources on line in mid-century. A sound approach to accomplishing the goal of making fusion a reality would be for U.S. and international laboratories and universities to continue to work together. Supporting technologies and research that are needed include:
(a) For example, the exit lights in airplanes use tritium.

5-24
Advance the scientific understanding of fusion plasmas
Develop the approaches and configurations for both magnetic and inertial fusion energy that will
take the best advantage of the newest scientific insight. Develop predictive simulations of fusion plasmas using the evolving terascale computing
capabilities Develop wave/particle heating and fueling technologies that will be used to establish and control
fusion plasmas Establish the technological basis for efficient, low-cost ion beams; develop high-average-power,
durable and cost-effective solid-state and gas laser systems; demonstrate useful gain from compression and burn of fusion energy-relevant targets in the National Ignition Facility
Extend the limits of superconducting magnet technology to improve magnetic confinement of
fusion plasmas Structural materials with low-activation properties will be required to fulfill the ultimate potential of
fusion devices Tritium generation and heat-recovery systems are other common nuclear system technologies
required for both magnetic and inertial fusion.
5.5.2 Technology Strategy
Given the substantial scientific and technological uncertainties that now exist; the U.S. government will employ an optimized portfolio strategy that explores a variety of magnetic and inertial confinement approaches that lead to the most promising commercial fusion concept. Advanced computational modeling is central to guiding and designing experiments that cannot be readily investigated in the laboratory, such as testing the agreement between theory and experiment, and exploring innovative concepts and designs for fusion plants. To ensure the highest possible scientific return on limited resources, the fusion program within the U.S. Department of Energy (DOE) will work with other DOE programs and other agencies and the international scientific community in areas such as materials science, ion beam physics, and laser physics. Large-scale experimental facilities are necessary to test approaches for self-heated (burning) fusion plasmas; for inertial fusion experiments; and for testing materials and components under extreme conditions. There are many overlapping challenges to be met (Figure 5-11). Where appropriate, the rewards, risks, and costs of major facilities will be shared through international collaborations.
Figure 5-11. Overlapping Scientific and Technological Challenges Associated with Fusion Energy Production

5-25

5-26
The overall research effort is organized around a set of four broad goals: Demonstrate with burning plasmas the scientific and technological feasibility of fusion energy
Develop a fundamental understanding of plasma behavior sufficient to provide a reliable predictive
capability for fusion energy systems Determine the most promising approaches and configurations to confining hot plasmas for practical
fusion energy systems Develop the new materials, components, and technologies necessary to make fusion energy a
reality.
5.5.3 Current Portfolio
The current Federal portfolio focuses on the basic sciences needed to better understand and to answer the major scientific questions and overcome the many technical challenges that will make it possible to harness fusion power. See: http://www.climatetechnology.gov/library/2003/tech-options/tech-options-2-5-1.pdf] In one major effort, the United States, Europe, Japan, China, Russia, and the Republic of Korea are negotiating an agreement to construct a magnetic fusion-burning plasma science and engineering test facility. Referred to as ITER, this international magnetic fusion experiment is part of a U.S. strategy to achieve magnetic confinement fusion (see Figure 5-12). Prior to ITER operation in about 2014, experiments on a wide range of tokamaks(a) worldwide will continue to develop tokamak physics in preparation for ITER operations. These experiments will include detailed simulations of ITER behavior as well as innovative new ways of operating tokamaks to achieve the optimum efficiency from this magnetic geometry. Because of the sophisticated diagnostics on the tokamaks, detailed data are already available to validate computer models.
5.5.4 Future Research Directions
The ITER design is based on the use of existing, well-qualified materials, which are not yet able to sustain the lifetime neutron irradiation required in a fusion power station. Materials resistant to radioactivity and neutron damage are needed for high performance, environmentally benign, and economically attractive power plants. Promising candidate materials already exist in industrial quantities and are under characterization. These have not been tested in fusion power conditions, although similar materials have been successfully tested in fission irradiations. In a number of areas, the fruits of basic research, not specific to fusion, could assist the development of fusion power. Basic science developments bearing on fusion plasma science relate to obtaining a better first-principles understanding and predictive capability of the non-linear dynamics of plasma behavior, including improved understanding and modeling of turbulence; self-organizing non-linear systems; particle and plasma accelerations; high energy density physics; and interpretation of very large data series (a) Tokamak, a Russian invention, refers to a donut-shaped configuration of magnetic fields that is the most
developed and well-characterized fusion configuration in the world.

5-27
by statistical modeling. Additionally, basic science developments bearing on fusion materials science relate to improvements in nano-structural engineering of materials for specific roles; predictive modeling over the complete range of scales of material behavior; and advanced instrumentation and advanced computational physics.
5.6 Conclusions
Among the many thrusts for addressing climate change with the aid of technology, improved energy efficiency, CO2 capture and sequestration, and reduced emissions of non-CO2 greenhouse gases, soot and aerosols, are all important, if not essential, to goal attainment. Large quantities of energy supplied by low or near net-zero emissions technology, however, form the core of any long-term technology component of the overall strategy. Just meeting the expected growth in world energy demand over the span of the 21st century will likely be challenging enough. Meeting such demand, while simultaneously reducing emissions and maintaining economic prosperity, would be doubly challenging. Advanced technology in energy supply can facilitate progress in this direction.

CCTP Proposed Plan for FY 2008
Meeting of WG chairs to recap FY09 budget o What is the path? o What are the gaps? o How will over-target programs cover gaps? o What gaps remain?
WG meetings to review where we are and what gaps remain assuming FY 09
budget o Form expert groups to assess FY 09 portfolio program outputs o Have IWG conduct the modeling
Labs suggest how gaps can be closed and suggest other agencies participation
o Opportunities in the parking lot
Program offices (all agencies) review gaps and suggested lab solutions Program offices (all agencies) review opportunities WG meetings to review identified gaps and missing agency help Revitalize and broaden Working Group’s membership across all relevant agencies Program offices (all agencies) identify above target needs for FY 10
o Consider the Opportunities o IWG model target versus above target
Propose initiatives, as appropriate, to accelerate technical progress. Assess the potential impact of the adjustments, if adopted, on the likelihood of
success Identify non-technical barriers to emissions reduction and explore options for
addressing them Support the “major economies” process, particularly on technology and
mitigation, and other efforts to augment RD&D activity via enhanced international cooperation

J:\FOIA Library\FOIA_Documents\Department of Energy\828_829_geoengineering\NCCTI Disk 2\Workshop Background Qs 7.doc Contact: Mark Friedrichs
1
KEY QUESTIONS AND ISSUES
I. Introduction to Background Papers This paper is one in a series that identifies issues and options involved in developing revisions to the Department of Energy’s Voluntary Greenhouse Gas Reporting Program (VGGRP), which was created pursuant to Section 1605(b) of the Energy Policy Act of 1992. Other papers are available at: http://www.pi.energy.gov/enhancingGHGregistry. The reporting program, in operation since 1994, records voluntarily submitted data on greenhouse gas (GHG) emissions and the results of actions to reduce, avoid, or sequester greenhouse gas emissions. On February 14, 2002, the President announced his Climate Change Initiative which includes a GHG intensity target, research programs and tax incentives to advance the development and adoption of new technologies, voluntary programs to promote actions to reduce GHGs, and improvements to the existing Voluntary Greenhouse Gas Reporting Program GHG reporting program. Specifically, the President:
Directed the Secretary of Energy, in consultation with the Secretary of Commerce, the Secretary of Agriculture, and the Administrator of the Environmental Protection Agency, to propose improvements to the current voluntary emissions reduction registration program under section 1605(b) of the 1992 Energy Policy Act within 120 days. These improvements will enhance measurement accuracy, reliability, and verifiability, working with and taking into account emerging domestic and international approaches. Directed the Secretary of Energy to recommend reforms to ensure that businesses and individuals that register reductions are not penalized under a future climate policy and to give transferable credits to companies that can show real emissions reductions. Directed the Secretary of Agriculture, in consultation with the Environmental Protection Agency and the Department of Energy, to develop accounting rules and guidelines for crediting sequestration projects, taking into account emerging domestic and international approaches.
On May 6, 2002, the Department of Energy solicited comments on various issues relevant to its efforts to implement the President's directives. The request for comments and the comments received are located at the website above. On July 8, 2002, after considering public comments, the Secretaries of Energy, Commerce and Agriculture, and the Administrator of the Environmental Protection Agency provided the President with ten recommended improvements to the VGGRP:

J:\FOIA Library\FOIA_Documents\Department of Energy\828_829_geoengineering\NCCTI Disk 2\Workshop Background Qs 7.doc Contact: Mark Friedrichs
2
1. Develop fair, objective, and practical methods for reporting baselines, reporting boundaries, calculating real results, and awarding transferable credits for actions that lead to real reductions.
2. Standardize widely accepted, transparent accounting methods. 3. Support independent verification of registry reports. 4. Encourage reporters to report greenhouse gas intensity (emissions per unit
of output) as well as emissions or emissions reductions. 5. Encourage corporate or entity-wide reporting. 6. Provide credits for action to remove carbon dioxide from the atmosphere as
well as for actions to reduce emissions. 7. Develop a process for evaluating the extent to which past reductions may
qualify for credits. 8. Assure the voluntary reporting program is an effective tool for reaching the
18 percent goal. 9. Factor in international strategies as well as state-level efforts. 10. Minimize transactions costs for reporters and administrative costs for the
Government, where possible, without compromising the foregoing recommendations.
In addition to these recommendations, the Secretaries of Energy, Commerce and Agriculture, and the Administrator of the Environmental Protection Agency proposed a process leading to revising the guidelines by January 2004. The process includes the workshops for which these background papers are prepared. The workshops are intended to foster an open dialog to assist the DOE and the other participating agencies in improving the reporting guidelines as authorized by existing law and directed by the President. By focusing the dialogue on specific issues and questions, many of which are addressed in the background papers, we hope the workshops can provide as much constructive input to this process as possible.
II. Introduction to Key Questions and Issues
ADD GENERAL INTRODUCTIN AND INCLUDE THESE PARAS ON CROSS CUTTING ISSUES In implementing the President’s directives, any number of cross-cutting issues will arise. Two important cross-cutting issues are: rigor versus practicality, and consistency with other reporting programs. Rigor versus Practicality. There are likely to be conflicts between the desire to ensure reports are accurate, reliable and verifiable, and the desire to establish practical guidelines that can be implemented at modest cost by a broad range of utilities, businesses and institutions. This potential conflict raises cross-cutting questions which are relevant to most of the specific issues likely to be addressed during each workshop:

J:\FOIA Library\FOIA_Documents\Department of Energy\828_829_geoengineering\NCCTI Disk 2\Workshop Background Qs 7.doc Contact: Mark Friedrichs
3
1. Should the new guidelines set different requirements for different types of entities in order to reflect differences in their capabilities and characteristics?
2. Should the new, more rigorous guidelines be applied to all program participants, or should participants that are not seeking special recognition or credit be permitted to continue to report under more flexible guidelines?
Consistency with other international- and state-level reporting programs. Specific definitions of boundaries, conversion factors, output measures and other factors often differ from one reporting protocol to another:
1. Should DOE try to standardize such definitions? 2. When should DOE defer to definitions and methods developed by others
rather than create or maintain its own?
III. Emissions Reporting Setting procedures for identifying, measuring, and verifying greenhouse gas (GHG) emissions is the first step to any reporting program. DOE's existing Voluntary Greenhouse Gas Reporting Program (VGGRP) enables reporters to determine the scope of their reports and the specific GHGs covered by these reports, and provides other types of flexibility. To comply with the President’s directives to “enhance measurement accuracy, reliability, and verifiability,” the current program needs to be revised. While these objectives are clear, a number of questions must still be addressed. A. Organizational and Geographic Boundaries (See Background Paper:
Organizational Boundaries; and Background Paper: Treatment of International Emissions)
i) If the revised guidelines specify reporting all of an entity’s (corporation’s) emissions, how should the guidelines define the entity boundaries? Should corporate entities be determined by equity share (or ownership), operational control (financial responsibility) or lines of business activity? Should program participants be given some flexibility to define their own boundaries?
ii) Should the boundaries of institutional and governmental entities be determined by ownership, financial responsibility, governance or other factors? Should institutional reporters be given some flexibility to define their own organizational boundaries?
iii) How can entity-wide reporting be most effectively encouraged? If entity-wide reporting is the basis for reporting, should the guidelines place any constraints on how participants define sub-entity or project

J:\FOIA Library\FOIA_Documents\Department of Energy\828_829_geoengineering\NCCTI Disk 2\Workshop Background Qs 7.doc Contact: Mark Friedrichs
4
boundaries for the purpose of reporting emissions?
iv) Should participants submit reports on their non-U.S. emissions? (or only their U.S. emissions?) Should U.S. emissions be distinguished from non-U.S. emissions?
B. Operational Boundaries and Related Issues
i) Direct versus indirect emissions (See Background Paper: Direct and Indirect Emissions). The existing program requests participants to calculate the indirect emissions associated with electricity (and purchased steam/hot water?)
(a) Should participants report the indirect emissions associated with their use of electricity (and purchased steam)?
(b) Should they report other types of indirect emissions, such as those associated with the production materials that they purchase; those associated with business travel or employee commuting; emissions associated with the use of the products they produce? Are there practical ways of measuring such emissions?
(c) If electricity use is to be reported, how should emissions associated with electricity use be calculated? Because users of electricity generally have no control over or responsibility for the carbon intensity of electricity generation, should DOE specify the use of fixed conversion factors for electricity (or steam)? If so, how should DOE determine these conversion factors? Are there any circumstances when a user of electricity should be permitted to calculate their own conversion factors?
ii) Gases and sources covered. The existing guidelines cover the six major greenhouse gases covered by the UNFCCC.
(a) Should participants report their emissions of these six gases? Should this list of gases be expanded (or shortened)?
(b) Converting to carbon dioxide equivalent values: Under the existing program, DOE asks participants to report emissions in terms of physical units of fossil fuels consumed or in the physical units of other covered greenhouse gases. DOE then converts these physical units into estimated total greenhouse gas emissions using the carbon dioxide equivalency factors (derived using Global Warming Potential estimates for each greenhouse gas and, in the case of fossil fuels, the estimated release of CO2 per unit of fuel consumed) established by the most recent assessment of the IPCC. Because carbon dioxide equivalency factors established by the IPCC's Third Assessment Report and

J:\FOIA Library\FOIA_Documents\Department of Energy\828_829_geoengineering\NCCTI Disk 2\Workshop Background Qs 7.doc Contact: Mark Friedrichs
5
used by DOE's Energy Information Administration do not correspond to the older factors still being used by the UNFCCC, there is some possibility for confusion. Which equivalency factors should be used? And when should they be updated?
(c) Practical limits to emission measurement and reporting: Very small or fugitive emissions: Some entities emit only very small quantities of certain greenhouse gases. Others may be responsible for "fugitive" emissions that cannot be readily monitored or quantified [such as the methane emissions associated with coal mining or the releases (and sequestration) of carbon and other gases associated with all agricultural operations]. Still others may have very small subsidiaries or organizational elements for which the necessary record keeping could be burdensome. Under what circumstances should entities be permitted to exclude certain emissions from their reports?
C. Measurement and Accounting Methods
i. Initial reporting year(s) (See Background Paper: Intensity Baselines and Base Years). Should all emissions reporting under the revised guidelines be start no earlier than a given year, e.g. 2003? Should participants be permitted to report emissions for prior years, if these reports meet the requirements of the new guidelines? The existing forms allow for reports back to 1987? Should this updated?
ii. Emissions measurement / estimation methods. Should the new guidelines specify the methods to be used in measuring and recording emissions? Should quantities of the specific fossil fuels combusted be considered sufficient basis to estimate greenhouse gas emissions? Under what circumstances should participants be required to monitor and report their actual emissions? If emissions are derived from an estimation technique, how might the guidelines help ensure that those estimation techniques are valid?
iii. Confidentiality issues (See Background Paper: Confidentiality of Reported Data). Some entities may be concerned that annual reports of their greenhouse gas emissions may reveal information that is valuable to their competitors. Should DOE collect and try to protect such data? Or should such companies be exempted from any emission reporting guidelines? Are their other possible solutions to such problems?
iv. Consideration of state-level and international reporting programs (See Background Paper: Emission Databases and Registries – The International Context). A number of different protocols for measuring and reporting greenhouse gas emissions have been developed (and most of these protocols are continuing to evolve). Should DOE give special

J:\FOIA Library\FOIA_Documents\Department of Energy\828_829_geoengineering\NCCTI Disk 2\Workshop Background Qs 7.doc Contact: Mark Friedrichs
6
consideration to the provisions of such protocols? If so, how?
v. Comparability across sectors. Should the DOE guidelines for measuring and reporting emissions be the same for all sectors or should they take into account the unique characteristics and capabilities of different types of entities?
IV. Emission Reductions
Determining when a creditable reduction in GHG emissions has been achieved and how to quantify and certify such emission reductions is perhaps the most difficult and controversial issue requiring resolution. There are many factors that affect the annual emissions of specific corporations, institutions or other entities. Emission reductions (or increases) by one entity may or may not indicate that that entity has contributed to a net reduction in U.S. and global greenhouse gas emissions or greenhouse gas emissions intensity. There are two types of questions that need to be addressed to enable the crediting of emission reductions: (1) questions regarding what types of emission reductions should be recognized as "creditable"; and (2) questions regarding the practicality and reliability of various methods used to quantify such reductions. A. Characteristics of Creditable Reductions. In order to identify the types of
emissions reductions that should be recognized, a useful first step is to define the desirable characteristics of "creditable" reductions. One way of distinguishing different types of emission reductions is to identify their cause.
i) Output effects. Increases in production or decreases in production are often reflected in comparable increases or decreases in greenhouse gas emissions, especially those emissions associated with fuel use. Should all or some emission reductions be calculated so as to exclude the effects of such output changes? E.g. Should a company that is growing rapidly, but which has successfully kept its greenhouse gas emissions level, be credited for emission reductions? Or should a company that has reduced substantially its production or divested some of its operations be permitted to claim emission reductions that resulted from such production declines?
ii) Other Causation Issues. There are many other "causes" of decreased or increased emissions. Can or should these different "causes" be used to help identify creditable emission reductions. For example, does it matter whether an emission reduction resulted from:
a) a warm winter or an unusually wet year? b) actions taken by some other entity, e.g. actions by a utility to
reduce the emissions associated with the electricity that is being reported by an industrial customer?
c) improvements to the operation and maintenance of an existing facility? or an investment in existing or new technology?

J:\FOIA Library\FOIA_Documents\Department of Energy\828_829_geoengineering\NCCTI Disk 2\Workshop Background Qs 7.doc Contact: Mark Friedrichs
7
d) an investment that was economically attractive or one that was not?
e) an investment that was mandated by government regulation, encouraged by a government incentive or encouraged by a government program?
f) Does it matter whether an emission reduction resulted from actions that were also taken by most other companies (or institutions) within the same industry, e.g. should a creditable emission reduction be demonstrably greater than the emission reductions achieved by other companies within the same industry?
iii) Durability. Should it matter whether an emission reduction is temporary or sustained for more than one year? Should it matter whether sequestered carbon remains sequestered?
iv) Corporate-wide or sub-corporate emission reductions. Most large corporations are likely to have some plants or facilities that are decreasing emissions and others that are increasing emissions. Should corporations or other participating entities be permitted to claim only net, entity-wide emission reductions or should they be permitted to claim reductions that were achieved in only one part of the corporation or institution?
v) Comparability within and across sectors. Should the definitions and methods of calculating emission reductions be sufficiently similar to permit comparisons from one corporation to another within the same industry? Or from one industry to another?
vi) Offsets. Should it matter whether an emission reduction achieved by a particular entity occurs outside the boundaries of that entity? What if such an offsetting emission reduction occurs within the boundaries of another reporting entity?
vii) U.S. v. non-U.S. reductions. Should it matter whether an emission reduction is achieved outside the U.S.?
B. Calculation Methods. It is unlikely that program guidelines can be designed
so as to identify only those emission reductions that were fully consistent with a particular set of ideal characteristics. Inevitably, the methods developed to identify and calculate emission reductions will only be able to approximate the desired objectives. i) Emissions intensity measures. Measures of emission intensity are
intended to control automatically for changes in output. Should the guidelines specify all reporting entities use a measure of greenhouse gas

J:\FOIA Library\FOIA_Documents\Department of Energy\828_829_geoengineering\NCCTI Disk 2\Workshop Background Qs 7.doc Contact: Mark Friedrichs
8
emissions intensity to adjust for changes in output? What other ways might be used to take into account the effects of output changes? Many entities will not be able to identify a single measure of output for all of their operations. Should they be encouraged, required or permitted to use emissions intensity measures for sub-corporate (sub-entity) estimates of emission reductions? Should DOE specify or approve the measures of output used by different entities? Should each company/institution be permitted to develop their own measure of output? Should all companies within the same industry be required to use the same measures of output?
ii) Net emission reductions. What methods might be used to ensure that only net, entity-wide emission reductions are credited? How could entities be encouraged or required to report emission reductions at the highest level of aggregation possible?
iii) Double counting. Users and producers of electricity might both report and claim credit for the same emissions and emissions reductions. How can double counting of these emissions and emission reductions be minimized? Double counting might also occur if emission reduction credits can be earned both by owners/users as well as manufacturers/producers of products or fuels that reduce greenhouse gas emissions. Who should be able to claim credit for such reductions?
iv) Fixed or dynamic emissions intensity baselines. Any decline in emissions intensity over time could be credited as an emissions reduction (in this case, an entity's emissions intensity in any given year could serve as a fixed baseline from which to calculate the emission reductions achieved in future years). Because most companies and institutions increase their energy efficiency and productivity over time, the emissions intensity of most entities tends to decline over time. In order to exclude such "business-as-usual" reductions, some argue that the baseline emissions intensity from which emission reductions are calculated should be gradually reduced. If such dynamic baselines were desired, how might they be calculated?
v) Projects. Projects are usually specific actions or investments that result in emission reductions, such as the construction of a wind machine that generates electric power, installation of a cogeneration facility, investments in energy efficiency or the planting of trees to sequester carbon. Projects can be within or outside of corporate or institutional boundaries. Some projects have measurable effects, such as the generation of electricity, while others have effects that can only be estimated. When (if at all) should entities be permitted to claim emission reductions associated with a specific project? For those projects where direct or indirect measurement of emission reductions is

J:\FOIA Library\FOIA_Documents\Department of Energy\828_829_geoengineering\NCCTI Disk 2\Workshop Background Qs 7.doc Contact: Mark Friedrichs
9
impossible, how might such effects be estimated? Should any project that results in emission reductions be recognized, or should DOE set thresholds that have to be exceeded before the emission reductions from a project are credited?
vi) Absolute emissions and other possible alternatives to emission intensity measures or projects. If no useable measure of output exists and the use of project-based estimates would be inappropriate, how might emission reductions be estimated? Should changes in total emissions be used if no measure of emission intensity is available.
vii) Base years and baselines. Should emission reductions be credited only if they occur after the new guidelines have been issued? Should emission reductions that occurred in prior years, but which have been demonstrated to comply with the new guidelines, be recognized as well? Should the emissions or emission intensity of the base year serve as a fixed baseline from which all future emission reductions are calculated, or should this baseline be modified annually or periodically. If it should be modified, on what basis should such modifications be made?
viii) Multiyear reporting / averaging. Should multiyear reporting and/or averaging be used to minimize recognition of temporary emission reductions, such as those that result from annual weather changes, or temporary shifts in capacity utilization? Should entities claiming reductions be required to continue to report even after being given credit for certain reductions? What if emissions or emissions intensity increase in future years?
ix) Confidentiality issues. What data associated with the calculation of emission reductions should be made public? Under what circumstances should entities be allowed to withhold data relevant to calculation of their emission reductions or to request that such data remain protected from public release?
x) Consideration of state-level and international methods for crediting emission reductions. A number of different methods have been developed for identifying and recognizing emission reductions (and most of these methods continue to evolve). Should DOE base its guidelines on one (or more) of these non-government protocols? Should DOE give special consideration to specific requirements contained in such protocols or should DOE base its guidelines on its own determination of what is the best, most accurate approach?
xi) Relationship to other voluntary programs. There are many different government programs designed to encourage voluntary reductions in greenhouse gas emissions by giving special recognition to efforts that

J:\FOIA Library\FOIA_Documents\Department of Energy\828_829_geoengineering\NCCTI Disk 2\Workshop Background Qs 7.doc Contact: Mark Friedrichs
10
reduce emissions (e.g., The President's Energy Partners for Climate Action, Climate Leaders and the existing Voluntary Greenhouse Gas Reporting Program, which is the focus of these workshops). Should the actions recognized under these programs also be credited as emission reductions under the new, more rigorous guidelines that are the focus of these workshops? Or should these programs use the new, more rigorous guidelines to quantify the emission reductions that they recognize?
V. Breakout Session Key Questions and Issues
A. Electricity generation
i. Can reductions in emissions-per-kwh-generated be used to calculate the total emissions reductions that should be credited to specific utilities/generators?
ii. How should acquisitions/divestitures of existing plants be treated? How should plant retirements or the production from new plants be treated?
iii. Should any distinctions be made among different types of reductions, e.g. investments in new renewable generation v. increased production from existing nuclear plants?
iv. What methods might be used to minimize the credit given to transitory changes in emissions that result from cyclical changes in weather, rainfall or loads, while still enabling participating entities to begin receiving credit for their reductions within the next few years?
v. If customers pay higher rates for renewable generation, should they be able to obtain credit for the resulting emission reductions? If utilities provide incentives to encourage their customers to reduce electricity demand, should they be able to claim credit for emission reduction? How can double counting be minimized?
B. Industrial and other large sources
i. Which industries have broadly accepted physical measures of output, e.g. tons of cement or tons of steel? Can these measures of output be usefully applied to all emissions for individual corporations?
ii. Should DOE specify certain output measures? Should industry trade associations or individual companies be permitted to develop and propose their own measures of output?
iii. If there is no generally accepted physical measure of output that can be applied to whole industries or whole corporations, what other approaches might be used to take into account changes in output? Could economic measures of output, such as value added, serve as a meaningful indicator or year-to-year changes in output?
iv. Should companies that are unable to develop an entity-wide measure of emission intensity be encouraged or required to use sub-entity measures of emissions intensity, e.g. for a specific business line or plant?

J:\FOIA Library\FOIA_Documents\Department of Energy\828_829_geoengineering\NCCTI Disk 2\Workshop Background Qs 7.doc Contact: Mark Friedrichs
11
v. Should changes in "output" be taken into account when estimating real reductions in the emissions of all non-carbon gases?
vi. Since emissions intensity is based on production data, and such production data is often treated as a trade secret, some companies are very concerned about the type of the data that might have to be reported. How might a company provide an independently verified estimate of its emissions and emission reductions, without disclosing its production data at the same time?
C. Independent renewable energy production
i. Renewable energy that is produced by entities that report their total emissions and emission reductions is likely to be automatically accounted for in entity-wide reports. Under what circumstances should a producer of renewable energy be permitted to claim credit for the emission reductions resulting from specific renewable energy projects?
ii. Should such renewable energy producers be required to take into account and report any greenhouse gas emissions for which they are responsible?
iii. If electricity is being produced by a renewable energy project, how should the emissions displaced by such electricity production be calculated?
iv. If ethanol is being produced by a renewable energy project, how should the emissions displaced by such ethanol production be calculated?
D. Agricultural and forestry sequestration
i. How can there be some assurance that the benefits claimed by an entity responsible for a specific sequestration project are not being offset by other actions by the same entity?
ii. The benefits of some sequestration projects can be easily reversed by some future action. How can there be some assurance that credited emission reductions achieved through sequestration will be sustained?
E. Small distributed sources (residential and commercial buildings; transportation). Because it is unlikely that individual households or small and medium sized businesses will choose to report directly their emissions or emission reductions, how might the Voluntary Greenhouse Gas Reporting Program be designed to credit efforts to reduce emissions in these sectors?
i. Should DOE recognize the emission reductions that result from the manufacturing of more energy efficient products or vehicles, or the construction of more efficient buildings? Are there other types of actions that result in reduced emissions by small emitters that might also be recognized?

J:\FOIA Library\FOIA_Documents\Department of Energy\828_829_geoengineering\NCCTI Disk 2\Workshop Background Qs 7.doc Contact: Mark Friedrichs
12
ii. If emission reduction credits are given to certain product manufacturers or builders, how can there be some assurance that the resulting emission reductions are not also being claimed by the users of these products or buildings?
iii. How might the emission reductions associated with energy efficient products, vehicles or buildings be calculated?
iv. Many products, vehicles and buildings are subject to minimum efficiency standards set by Federal, state or local governments. Should manufacturers or builders be given credit for emission reductions that result such standards?
VI. Verifying Emissions and Reductions (See Background Paper: Verification
Issues and Background Paper: Confidentiality of Reported Data).
A. Types and frequency of verification.
i) Should independent verification be required for each (annual) report, less frequently or only if challenged?
ii) Should program participants independently verify: process and methods; the actual data upon which emission reports and emission reduction estimates are based; and/or the physical means by which emissions are measured (e.g. meters for fuel consumption or monitors that measure actual emissions)?
iii) Even after they have been independently verified, should all participants be required to maintain records of the data, measurement and testing methods used to develop emissions inventories and to calculate emission reductions so that these records could be audited if a report is challenged?
B. Verification methods, Should independent verification include on-site inspections of processes, data and/or equipment? Should the verification methods used be comparable to those used by financial auditors, or should they be comparable to those used by facility health or safety inspectors?
C. Approving/certifying verifiers i) Should all participants be required to have an independent organization
verify their emissions inventory and their estimated emission reductions?
ii) What types of organizations are qualified to serve as independent verifiers? How might these organizations be identified?
D. Confidentiality issues i) Should all data be available for review by government representatives? ii) Should non-government organizations be able to review the data upon
which emission reports or claimed emission reductions are based?

J:\FOIA Library\FOIA_Documents\Department of Energy\828_829_geoengineering\NCCTI Disk 2\Workshop Background Qs 7.doc Contact: Mark Friedrichs
13
VII. Managing the Registry of Emission Inventories and Reductions
A. Certifying real reductions. Once DOE has received a report that has been independently verified to be in compliance with the revised guidelines, what actions should it take? What should DOE provide to entities that have successfully met the requirements of the new, more rigorous guidelines?
B. Tracking and transferring reductions. How should DOE identify the entity responsible for specific emission reductions and when should DOE transfer this responsibility to a different entity? In order for DOE to transfer responsibility for a credited emission reduction from one entity to another, what should DOE require from the entities involved?
C. Confidentiality issues. Should data submitted to DOE be made publicly available? Can DOE effectively protect confidential data?
D. Prior year reports. What should DOE do with the reports already submitted under the existing guidelines? Should previous reporters be permitted to redo prior-year reports to comply with the revised guidelines? Should DOE permit entities to document prior year emission reductions (under the new guidelines), regardless of the year in which they were achieved?

J:\FOIA Library\FOIA_Documents\Department of Energy\828_829_geoengineering\NCCTI Disk 2\Workshop Background Qs v5.doc
1
Revised draft, Mark Friedrichs, 4/6/2010 3:51 PM
Draft BACKGROUND AND QUESTIONS FOR WORKSHOPS ON 1605b Background These workshops are intended to assist the Department of Energy and the other participating agencies to enhance the reporting of greenhouse gas emissions and emission reductions, as authorized by existing law and directed by the President. Section 1605b of the Energy Policy Act of 1992 require(s)(d) DOE to establish guidelines for accurate voluntary reporting on:
Greenhouse gas emissions Annual reductions of greenhouse gas emissions and carbon fixation achieved
through any measures Reductions in greenhouse gas emissions achieved as a result of:
o Voluntary reductions o Plant or facility closings o State or Federal requirements, and
An aggregate calculation of greenhouse gas emissions by each reporting entity Section 1605b also provides for the protection of trade secrets and commercial or financial information that is privileged or confidential. While DOE's existing Voluntary Greenhouse Gas Reporting Program fulfills these statutory requirements, considerable flexibility is incorporated into the program's existing guidelines. Consequently, the reports of greenhouse gas emissions or emissions reductions submitted to DOE are often not consistent, complete or verifiable. On February 14, 2002, the President:
Directed the Secretary of Energy, in consultation with the Secretary of Commerce, the Secretary of Agriculture, and the Administrator of the Environmental Protection Agency, to propose improvements to the current voluntary emissions reduction registration program under section 1605(b) of the 1992 Energy Policy Act within 120 days. These improvements will enhance measurement accuracy, reliability, and verifiability, working with and taking into account emerging domestic and international approaches.
Directed the Secretary of Energy to recommend reforms to ensure that businesses and individuals that register reductions are not penalized under a future climate policy and to give transferable credits to companies that can show real emissions reductions.
To achieve these objectives it will be necessary to reduce considerably the flexibility provided by the Department's existing reporting guidelines. Once developed, these new,

J:\FOIA Library\FOIA_Documents\Department of Energy\828_829_geoengineering\NCCTI Disk 2\Workshop Background Qs v5.doc
2
more rigorous reporting requirements might supplement or supplant the program's existing guidelines. On May 6, 2002, the Department of Energy solicited public comments on various issues relevant to its efforts to implement the President's directives. After consideration of these public comments, the Secretaries of Energy, Commerce and Agriculture, and the Administrator of the Environmental Protection Agency wrote the President on July 8, 2002, to indicate that the improvements to the existing Voluntary Greenhouse Gas Reporting Program would:
1. Develop fair, objective, and practical methods for reporting baselines, reporting boundaries, calculating real results, and awarding transferable credits for actions that lead to real reductions.
2. Standardize widely accepted, transparent accounting methods.
3. Support independent verification of registry reports. 4. Encourage reporters to report greenhouse gas intensity (emissions per unit of
output) as well as emissions or emissions reductions.
5. Encourage corporate or entity-wide reporting. 6. Provide credits for action to remove carbon dioxide from the atmosphere as well
as for actions to reduce emissions. 7. Develop a process for evaluating the extent to which past reductions may qualify
for credits. 8. Assure the voluntary reporting program is an effective tool for reaching the 18
percent goal. 9. Factor in international strategies as well as State-level efforts. 10. Minimize transactions costs for reporters and administrative costs for the
Government, where possible, without compromising the foregoing recommendations.
These workshops are intended to help us determine the specific improvements that should be made to the Department's guidelines by encouraging open dialogue among all of the utilities, businesses, organizations and individuals affected. By focusing this dialogue on the many specific questions that must still be resolved, we hope to ensure that the workshops can provide as much constructive input to this process as possible.

J:\FOIA Library\FOIA_Documents\Department of Energy\828_829_geoengineering\NCCTI Disk 2\Workshop Background Qs v5.doc
3
The Presidential directives that began our review of the existing program guidelines, and the objectives identified in the July 8 letter to the President are the starting point of our current efforts. Most of the issues that need to be addressed and resolved as part of this process fall into two broad categories: Emission Reporting and Emission Reductions. In both areas, we will be endeavoring to develop more rigorous guidelines that will help ensure that future reports are reliable, objective, and verifiable. Other key objectives are to develop guidelines that: are practical to implement; encourage participation by a broad spectrum of utilities, businesses and institutions; and take into consideration parallel efforts by various international and state organizations. Crosscutting Issues The many different objectives of this effort suggest that there will, inevitably, be some conflicts that require resolution. Reliable, Objective and Verifiable v. Practical, with Broad Voluntary
Participation. There is an obvious potential conflict between our desire to ensure future reports are reliable, objective and verifiable, and our desire to establish practical guidelines that can be implemented at modest cost by a broad range of utilities, businesses and institutions. This potential conflict raises several cross-cutting questions which are relevant to most of the specific issues likely to be addressed during each workshop:
o Should the new guidelines set different requirements for different types of entities in order to reflect differences in their capabilities and characteristics?
o Should the new, more rigorous guidelines be applied to all program participants, or should participants that are not seeking special recognition or credit be permitted to continue to report under more flexible guidelines?
Rigorous guidelines v. consistency with other international and state efforts Specific definitions of boundaries, conversion factors, output measures and other factors often differ from one reporting protocol to another.
o To what extent should DOE try to standardize all such definitions? o Under what circumstances should DOE use a definition already adopted by
another organization, even if it is flawed?
Emissions Reporting: Setting the procedures for the identification, measurement and verification of greenhouse gas emissions is the essential first step of any reporting program. Any estimate of greenhouse gas emissions intensity or emission reductions must be based on a sound inventory of emissions. DOE's existing Voluntary Greenhouse Gas Reporting Program enables reporting entities to determine the scope of their reports and the specific greenhouse gases covered by these reports, as well as providing other types of flexibility. The Department of Energy has concluded that more rigorous guidelines are needed to ensure that reporting entities provide emission inventories that are complete, internally consistent and comparable to the emission inventories submitted by other participating entities. DOE believes that these more rigorous guidelines should encourage reports on entity-wide emissions of all major greenhouse gases. While this objective is clear, a number of questions must still be addressed.

J:\FOIA Library\FOIA_Documents\Department of Energy\828_829_geoengineering\NCCTI Disk 2\Workshop Background Qs v5.doc
4
1) Organizational and Geographic Boundaries [See background papers on
Organizational Boundaries; and International Emissions] a) If DOE is to require or encourage program participants to report all of their
emissions, how should the guidelines define the boundaries of corporations? Should corporate entities be determined by equity share (or ownership), operational control (financial responsibility) or lines of business activity? Should program participants be given some flexibility to define their own boundaries?
b) Should the boundaries of institutional and governmental entities be determined by ownership, financial responsibility, governance or other factors? Should institutional reporters be given some flexibility to define their own organizational boundaries?
c) If entity-wide reporting is not required, should the guidelines place any constraints on how participants define sub-entity or project boundaries for the purpose of reporting emissions?
d) Should participants be required or allowed to submit reports on their non-U.S. emissions? (or only their U.S. emissions?) Should U.S. emissions be distinguished from non-U.S. emissions?
2) Operational Boundaries and Related Issues a) Direct v. indirect emissions [See background paper on Direct and Indirect
Emissions] The existing program requests participants to calculate the indirect emissions associated with electricity (and purchased steam/hot water?) use. i) Should participants be required to report the indirect emissions associated
with their use of electricity (and purchased steam)? ii) Should they be required to report other types of indirect emissions, such as
those associated with the production materials that they purchase? or those associated with business travel or employee commuting? or the emissions associated with the use of the products they produce? [Are there any practical ways of measuring such emissions?]
iii) If electricity use is to be reported, how should the emissions associated with electricity use be calculated? Since users of electricity generally have no control over or responsibility for the carbon intensity of electricity generation, should DOE specify the use of fixed conversion factors for electricity (or steam)? If so, how should DOE determine these conversion factors? Are there any circumstances when a user of electricity should be permitted to calculate their own conversion factors?
b) Gases and sources covered – The existing guidelines cover the six major greenhouse gases covered by the UNFCCC. i) Should participants be required to report their emissions of these six gases?
Should this list of gases be expanded (or shortened)? ii) Converting to carbon dioxide equivalent values: Under the existing program,
DOE asks participants to report emissions in terms of physical units of fossil fuels consumed or in the physical units of other covered greenhouse gases. DOE then converts these physical units into estimated total greenhouse gas emissions using the carbon dioxide equivalency factors (derived using Global Warming Potential estimates for each greenhouse gas and, in the case of fossil

J:\FOIA Library\FOIA_Documents\Department of Energy\828_829_geoengineering\NCCTI Disk 2\Workshop Background Qs v5.doc
5
fuels, the estimated release of CO2 per unit of fuel consumed) established by the most recent assessment of the IPCC. Since the carbon dioxide equivalency factors established by the IPCC's Third Assessment Report and used by DOE do not correspond to the older factors still being used by the UNFCCC, there is some possibility for confusion. Which equivalency factors should be used? And when should they be updated?
iii) Practical limits to emission measurement and reporting: Very small or fugitive emissions -- Some entities emit only very small quantities of certain greenhouse gases. Others may be responsible for "fugitive" emissions that cannot be readily monitored or quantified [such as the methane emissions associated with coal mining or the releases (and sequestration) of carbon and other gases associated with all agricultural operations]. Still others may have very small subsidiaries or organizational elements for which the necessary record keeping could be burdensome. Under what circumstances should entities be permitted to exclude certain emissions from their reports?
3) Measurement and Accounting Methods a) Initial reporting year(s) [See background paper on Intensity Baselines and Base
Years] Should all emissions reporting under the new, more rigorous guidelines be required to start no earlier than a given year? Should participants be permitted to report emissions for prior years, if these reports meet the requirements of the new guidelines?
b) Emissions measurement/estimation methods – Should the new guidelines specify the methods to be used in measuring and recording emissions? Should quantities of the specific fossil fuels combusted be considered sufficient basis to estimate greenhouse gas emissions? Under what circumstances should participants be required to monitor and report their actual emissions? If emissions are derived from an estimation technique, how might the guidelines help ensure that those estimation techniques are valid?
c) Confidentiality issues [See background paper on Confidentiality] Some entities may be concerned that annual reports of their greenhouse gas emissions may reveal information that is valuable to their competitors. Should DOE collect and try to protect such data? Or should such companies be exempted from any emission reporting guidelines? Are their other possible solutions to such problems?
d) Consideration of State and international reporting programs – A number of different protocols for measuring and reporting greenhouse gas emissions have been developed (and most of these protocols are continuing to evolve). Should DOE base its guidelines on one (or more) of these non-government protocols? Should DOE give special consideration to specific requirements contained in such protocols or should DOE base its guidelines on its own determination of what is the best, most accurate approach?
e) Comparability across sectors – Should the DOE guidelines for measuring and reporting emissions be the same for all sectors or should they take into account the unique characteristics and capabilities of different types of entities?

J:\FOIA Library\FOIA_Documents\Department of Energy\828_829_geoengineering\NCCTI Disk 2\Workshop Background Qs v5.doc
6
Emission Reductions: Specifying how to determine when a creditable reduction in greenhouse gas emissions has been achieved and how to quantify and certify such emission reductions is perhaps the most difficult and controversial issue requiring resolution. There are many factors that affect the annual emissions of specific corporations, institutions or other entities. Emission reductions (or increases) by one entity may or may not indicate that that entity has contributed to a net reduction in U.S. and global greenhouse gas emissions or greenhouse gas emissions intensity. There are two types of questions that need to be addressed to enable the crediting of emission reductions: (1) questions regarding what types of emission reductions should be recognized as "creditable"; and (2) questions regarding the practicality and reliability of various methods used to quantify such reductions. 1) Characteristics of Creditable Reductions. In order to identify the types of
emissions reductions that should be recognized, a useful first step is to define the desirable characteristics of "creditable" reductions. Some of the factors that might be considered in defining creditable emission reductions include. a) Output changes. Increases in production or decreases in production are often
reflected in comparable increases or decreases in greenhouse gas emissions. Should all or some emission reductions be calculated so as to exclude the effects of such output changes? E.g. Should a company that is growing rapidly, but which has successfully kept its greenhouse gas emissions level, be permitted to report emission reductions? Or should a company that has reduced substantially its production or divested some of its operations be permitted to claim emission reductions that resulted from such production declines?
b) Corporate-wide or sub-corporate emission reductions. Should corporations or other participating entities be permitted to claim only net, entity-wide emission reductions or should they be permitted to claim reductions that were achieved in only one part of the corporation or institution?
c) Comparability within and across sectors. Should the definitions and methods of calculating emission reductions be sufficiently similar to permit comparisons from one corporation to another within the same industry? Or from one industry to another?
d) Causation. To what extent is the cause of an emission reduction important? For example, does it matter whether an emission reduction resulted from: i) a warm winter or an unusually wet year? ii) actions taken by some other entity, e.g. actions by a utility to reduce the
emissions associated with electricity consumed by an industry? iii) improvements to the operation and maintenance of an existing facility? Or an
investment in existing or new technology? iv) an investment that was economically attractive or one that was not? v) an investment that was mandated by government regulation, encouraged by a
government incentive or encouraged by a government program? vi) does it matter whether an emission reduction resulted from actions that were
also taken by most other companies (or institutions) within the same industry, e.g. does a creditable emission reduction have to demonstrably greater than the emission reductions achieved by other companies within the same industry?
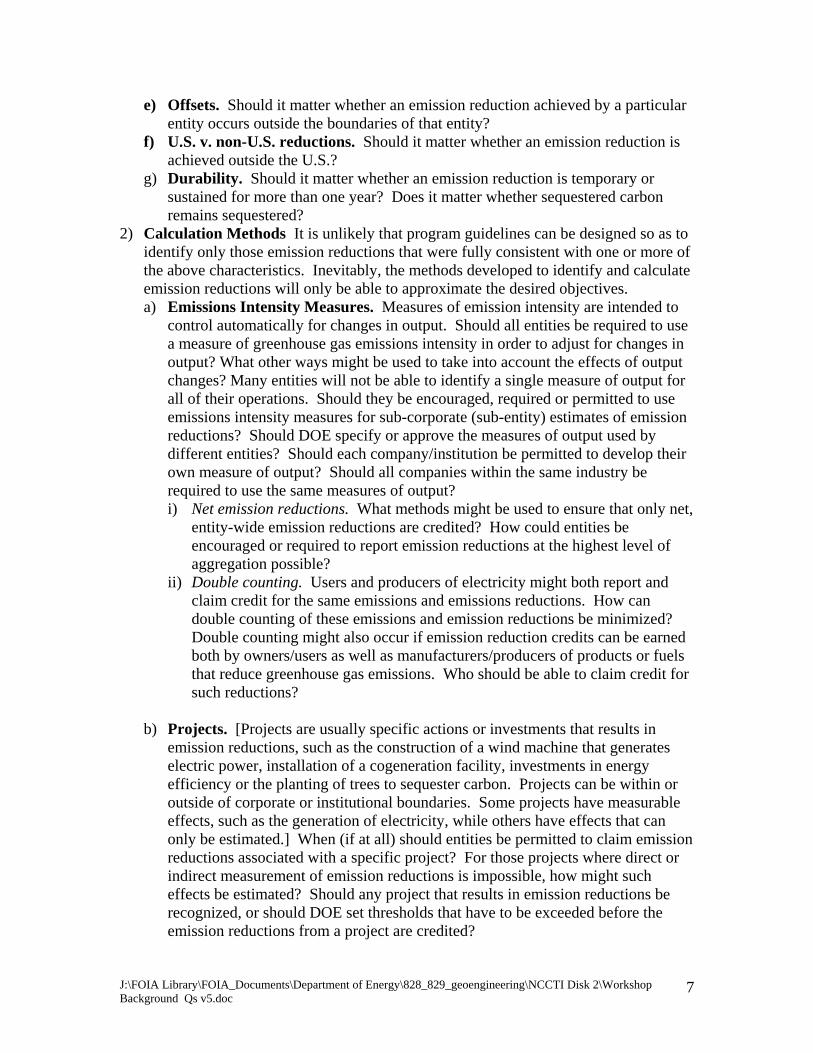
J:\FOIA Library\FOIA_Documents\Department of Energy\828_829_geoengineering\NCCTI Disk 2\Workshop Background Qs v5.doc
7
e) Offsets. Should it matter whether an emission reduction achieved by a particular entity occurs outside the boundaries of that entity?
f) U.S. v. non-U.S. reductions. Should it matter whether an emission reduction is achieved outside the U.S.?
g) Durability. Should it matter whether an emission reduction is temporary or sustained for more than one year? Does it matter whether sequestered carbon remains sequestered?
2) Calculation Methods It is unlikely that program guidelines can be designed so as to identify only those emission reductions that were fully consistent with one or more of the above characteristics. Inevitably, the methods developed to identify and calculate emission reductions will only be able to approximate the desired objectives. a) Emissions Intensity Measures. Measures of emission intensity are intended to
control automatically for changes in output. Should all entities be required to use a measure of greenhouse gas emissions intensity in order to adjust for changes in output? What other ways might be used to take into account the effects of output changes? Many entities will not be able to identify a single measure of output for all of their operations. Should they be encouraged, required or permitted to use emissions intensity measures for sub-corporate (sub-entity) estimates of emission reductions? Should DOE specify or approve the measures of output used by different entities? Should each company/institution be permitted to develop their own measure of output? Should all companies within the same industry be required to use the same measures of output? i) Net emission reductions. What methods might be used to ensure that only net,
entity-wide emission reductions are credited? How could entities be encouraged or required to report emission reductions at the highest level of aggregation possible?
ii) Double counting. Users and producers of electricity might both report and claim credit for the same emissions and emissions reductions. How can double counting of these emissions and emission reductions be minimized? Double counting might also occur if emission reduction credits can be earned both by owners/users as well as manufacturers/producers of products or fuels that reduce greenhouse gas emissions. Who should be able to claim credit for such reductions?
b) Projects. [Projects are usually specific actions or investments that results in
emission reductions, such as the construction of a wind machine that generates electric power, installation of a cogeneration facility, investments in energy efficiency or the planting of trees to sequester carbon. Projects can be within or outside of corporate or institutional boundaries. Some projects have measurable effects, such as the generation of electricity, while others have effects that can only be estimated.] When (if at all) should entities be permitted to claim emission reductions associated with a specific project? For those projects where direct or indirect measurement of emission reductions is impossible, how might such effects be estimated? Should any project that results in emission reductions be recognized, or should DOE set thresholds that have to be exceeded before the emission reductions from a project are credited?
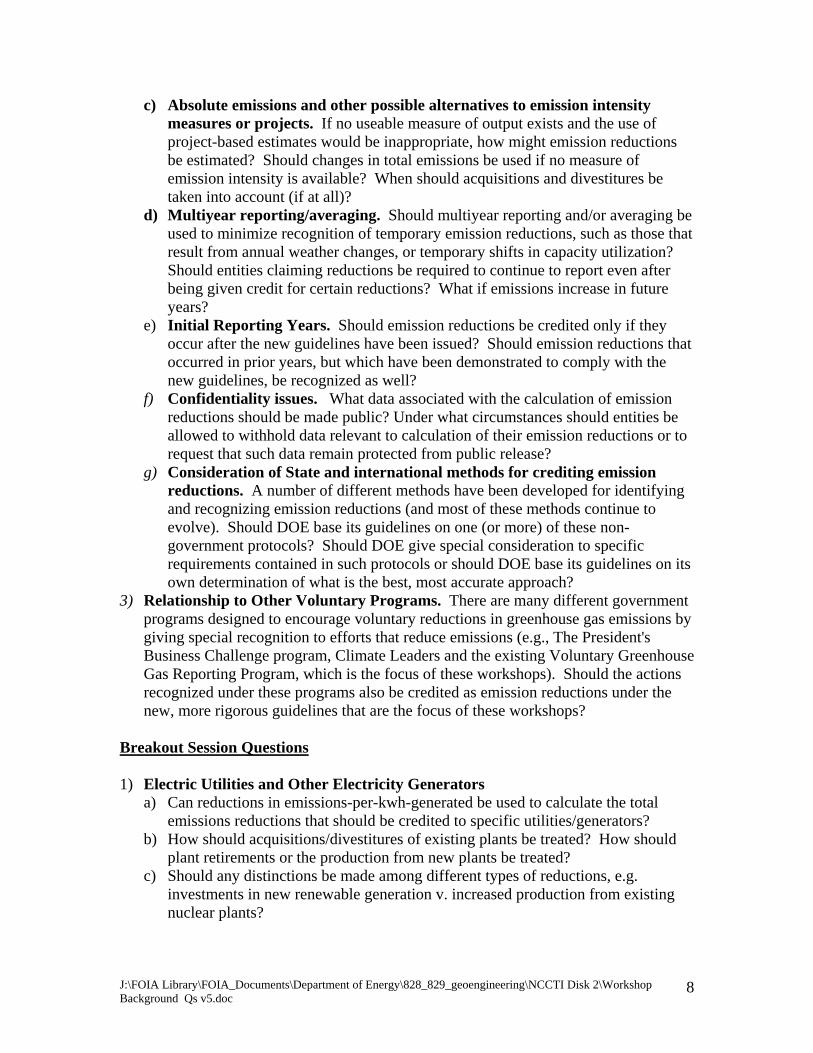
J:\FOIA Library\FOIA_Documents\Department of Energy\828_829_geoengineering\NCCTI Disk 2\Workshop Background Qs v5.doc
8
c) Absolute emissions and other possible alternatives to emission intensity measures or projects. If no useable measure of output exists and the use of project-based estimates would be inappropriate, how might emission reductions be estimated? Should changes in total emissions be used if no measure of emission intensity is available? When should acquisitions and divestitures be taken into account (if at all)?
d) Multiyear reporting/averaging. Should multiyear reporting and/or averaging be used to minimize recognition of temporary emission reductions, such as those that result from annual weather changes, or temporary shifts in capacity utilization? Should entities claiming reductions be required to continue to report even after being given credit for certain reductions? What if emissions increase in future years?
e) Initial Reporting Years. Should emission reductions be credited only if they occur after the new guidelines have been issued? Should emission reductions that occurred in prior years, but which have been demonstrated to comply with the new guidelines, be recognized as well?
f) Confidentiality issues. What data associated with the calculation of emission reductions should be made public? Under what circumstances should entities be allowed to withhold data relevant to calculation of their emission reductions or to request that such data remain protected from public release?
g) Consideration of State and international methods for crediting emission reductions. A number of different methods have been developed for identifying and recognizing emission reductions (and most of these methods continue to evolve). Should DOE base its guidelines on one (or more) of these non-government protocols? Should DOE give special consideration to specific requirements contained in such protocols or should DOE base its guidelines on its own determination of what is the best, most accurate approach?
3) Relationship to Other Voluntary Programs. There are many different government programs designed to encourage voluntary reductions in greenhouse gas emissions by giving special recognition to efforts that reduce emissions (e.g., The President's Business Challenge program, Climate Leaders and the existing Voluntary Greenhouse Gas Reporting Program, which is the focus of these workshops). Should the actions recognized under these programs also be credited as emission reductions under the new, more rigorous guidelines that are the focus of these workshops?
Breakout Session Questions 1) Electric Utilities and Other Electricity Generators
a) Can reductions in emissions-per-kwh-generated be used to calculate the total emissions reductions that should be credited to specific utilities/generators?
b) How should acquisitions/divestitures of existing plants be treated? How should plant retirements or the production from new plants be treated?
c) Should any distinctions be made among different types of reductions, e.g. investments in new renewable generation v. increased production from existing nuclear plants?

J:\FOIA Library\FOIA_Documents\Department of Energy\828_829_geoengineering\NCCTI Disk 2\Workshop Background Qs v5.doc
9
d) What methods might be used to minimize the credit given to transitory changes in emissions that result from cyclical changes in weather, rainfall or loads, while still enabling participating entities to begin receiving credit for their reductions within the next few years?
e) If customers pay higher rates for renewable generation, should they be able to obtain credit for the resulting emission reductions? If utilities provide incentives to encourage their customers to reduce electricity demand, should they be able to claim credit for emission reduction? How can double counting be minimized?
2) Large industries and other large emitters a) Which industries have broadly accepted physical measures of output, e.g. tons of
cement or tons of steel? Can these measures of output be usefully applied to all emissions for individual corporations?
b) Should DOE specify certain output measures? Should industry trade associations or individual companies be permitted to develop and propose their own measures of output?
c) If there is no generally accepted physical measure of output that can be applied to whole industries or whole corporations, what other approaches might be used to take into account changes in output? Could economic measures of output, such as value added, serve as a meaningful indicator or year-to-year changes in output?
d) Should companies that are unable to develop an entity-wide measure of emission intensity be encouraged or required to use sub-entity measures of emissions intensity, e.g. for a specific business line or plant?
e) Should changes in "output" be taken into account when estimating real reductions in the emissions of all non-carbon gases?
f) Since emissions intensity is based on production data, and such production data is often treated as a trade secret, some companies are very concerned about the type of the data that might have to be reported. How might a company provide an independently verified estimate of its emissions and emission reductions, without disclosing its production data at the same time?
3) Independent renewable energy producers a) Renewable energy that is produced by entities that report their total emissions and
emission reductions is likely to be automatically accounted for in entity-wide reports. Under what circumstances should a producer of renewable energy be permitted to claim credit for the emission reductions resulting from specific renewable energy projects?
b) Should such renewable energy producers be required to take into account and report any greenhouse gas emissions for which they are responsible?
c) If electricity is being produced by a renewable energy project, how should the emissions displaced by such electricity production be calculated?
d) If ethanol is being produced by a renewable energy project, how should the emissions displaced by such ethanol production be calculated?
4) Agricultural and forestry sequestration projects a) How can there be some assurance that the benefits claimed by an entity
responsible for a specific sequestration project are not being offset by other actions by the same entity?

J:\FOIA Library\FOIA_Documents\Department of Energy\828_829_geoengineering\NCCTI Disk 2\Workshop Background Qs v5.doc
10
b) The benefits of some sequestration projects can be easily reversed by some future action. How can there be some assurance that credit emission reductions will be sustained?
5) Small emitters (residential/commercial buildings; transportation) Since it is very unlikely that individual households or small and medium sized businesses will choose to report directly their emissions or emission reductions, how might the Voluntary Greenhouse Gas Reporting Program be designed to credit efforts to reduce emissions in these sectors? a) Should DOE recognize the emission reductions that result from the manufacturing
of more energy efficient products or vehicles, or the construction of more efficient buildings? Are there other types of actions that result in reduced emissions by small emitters that might also be recognized?
b) If emission reduction credits are given to certain product manufacturers or builders, how can there be some assurance that the resulting emission reductions are not also being claimed by the users of these products or buildings?
c) How might the emission reductions associated with energy efficient products, vehicles or buildings be calculated?
d) Many products, vehicles and buildings are subject to minimum efficiency standards set by Federal, state or local governments. Should manufacturers or builders be given credit for emission reductions that result such standards?
Verifying Emissions and Reductions 1) Types and frequency of verification
a) Should independent verification be required for each (annual) report, less frequently or only if challenged?
b) Should program participants be required have independently verified: their process and methods; and/or the actual data upon which emission reports and emission reduction estimates are based?
c) Even after they have been independently verified, should all participants be required to maintain records of the data, measurement and testing methods used to develop emissions inventories and to calculate emission reductions so that these records could be audited if a report is challenged?
2) Approving/certifying verifiers a) Should all participants be required to have an independent organization verify
their emissions inventory and their estimated emission reductions? b) What types of organizations are qualified to serve as independent verifiers? How
might these organizations be identified? 3) Confidentiality issues
a) Should all data be available for review by government representatives? b) Should non-government organizations be able to review the data upon which
emission reports or claimed emission reductions are based? Managing the Registry of Emission Inventories and Reductions Once 1) Certifying real reductions. Once DOE has received a report that has been
independently verified to be in compliance with the new, more rigorous guidelines, what actions should it take? Should there be any opportunity for public review before

J:\FOIA Library\FOIA_Documents\Department of Energy\828_829_geoengineering\NCCTI Disk 2\Workshop Background Qs v5.doc
11
DOE certifies to the entity that its emissions report and emission reductions meet DOE guidelines? What should DOE provide to entities that have successfully met the requirement of the new, more rigorous guidelines?
2) Tracking and transferring reductions. How should DOE identify the entity responsible for specific emission reductions and when should DOE transfer this responsibility to a different entity? In order for DOE to transfer responsibility for a credited emission reduction from one entity to another, what should DOE require from the entities involved?
3) Confidentiality issues. Should all data submitted to DOE be made publicly available? Can DOE effectively protect confidential data?
4) Maintenance of prior year reports. What should DOE do with the reports already submitted under the existing guidelines? Should previous reporters be permitted to redo prior-year reports to comply with the new, more rigorous guidelines? Should DOE permit entities to documents prior year emission reductions (under the new guidelines), regardless of the year in which they were achieved?

J:\FOIA Library\FOIA_Documents\Department of Energy\828_829_geoengineering\NCCTI Disk 2\Workshop Background Qs v6.doc
1
Revised draft, Mark Friedrichs, 4/6/2010 3:52 PM
Draft BACKGROUND AND QUESTIONS FOR WORKSHOPS ON 1605b Background These workshops are intended to assist the Department of Energy and the other participating agencies to enhance the reporting of greenhouse gas emissions and emission reductions, as authorized by existing law and directed by the President. Section 1605b of the Energy Policy Act of 1992 require(s)(d) DOE to establish guidelines for accurate voluntary reporting on:
Greenhouse gas emissions Annual reductions of greenhouse gas emissions and carbon fixation achieved
through any measures Reductions in greenhouse gas emissions achieved as a result of:
o Voluntary reductions o Plant or facility closings o State or Federal requirements, and
An aggregate calculation of greenhouse gas emissions by each reporting entity Section 1605b also provides for the protection of trade secrets and commercial or financial information that is privileged or confidential. While DOE's existing Voluntary Greenhouse Gas Reporting Program fulfills these statutory requirements, considerable flexibility is incorporated into the program's existing guidelines. Consequently, the reports of greenhouse gas emissions or emissions reductions submitted to DOE are often not consistent, complete or verifiable. On February 14, 2002, the President:
Directed the Secretary of Energy, in consultation with the Secretary of Commerce, the Secretary of Agriculture, and the Administrator of the Environmental Protection Agency, to propose improvements to the current voluntary emissions reduction registration program under section 1605(b) of the 1992 Energy Policy Act within 120 days. These improvements will enhance measurement accuracy, reliability, and verifiability, working with and taking into account emerging domestic and international approaches.
Directed the Secretary of Energy to recommend reforms to ensure that businesses and individuals that register reductions are not penalized under a future climate policy and to give transferable credits to companies that can show real emissions reductions.
To achieve these objectives it is likely to be necessary to reduce some of the flexibility provided by the Department's existing reporting guidelines. Once developed, the new,

J:\FOIA Library\FOIA_Documents\Department of Energy\828_829_geoengineering\NCCTI Disk 2\Workshop Background Qs v6.doc
2
more rigorous reporting requirements might supplement or supplant the program's existing guidelines. On May 6, 2002, the Department of Energy solicited public comments on various issues relevant to its efforts to implement the President's directives. After consideration of these public comments, the Secretaries of Energy, Commerce and Agriculture, and the Administrator of the Environmental Protection Agency wrote the President on July 8, 2002, to indicate that the improvements to the existing Voluntary Greenhouse Gas Reporting Program would:
1. Develop fair, objective, and practical methods for reporting baselines, reporting boundaries, calculating real results, and awarding transferable credits for actions that lead to real reductions.
2. Standardize widely accepted, transparent accounting methods.
3. Support independent verification of registry reports. 4. Encourage reporters to report greenhouse gas intensity (emissions per unit of
output) as well as emissions or emissions reductions.
5. Encourage corporate or entity-wide reporting. 6. Provide credits for action to remove carbon dioxide from the atmosphere as well
as for actions to reduce emissions. 7. Develop a process for evaluating the extent to which past reductions may qualify
for credits. 8. Assure the voluntary reporting program is an effective tool for reaching the 18
percent goal. 9. Factor in international strategies as well as State-level efforts. 10. Minimize transactions costs for reporters and administrative costs for the
Government, where possible, without compromising the foregoing recommendations.
These workshops are intended to help us determine the specific improvements that should be made to the Department's guidelines by encouraging open dialogue among all of the utilities, businesses, organizations and individuals affected. By focusing this dialogue on the many specific questions that must still be resolved, we hope to ensure that the workshops can provide as much constructive input to this process as possible.

J:\FOIA Library\FOIA_Documents\Department of Energy\828_829_geoengineering\NCCTI Disk 2\Workshop Background Qs v6.doc
3
The Presidential directives that began our review of the existing program guidelines, and the objectives identified in the July 8 letter to the President, are the starting point of our current efforts. Most of the issues that need to be addressed and resolved as part of this process fall into two broad categories: Emission Reporting and Emission Reductions. In both areas, we will be endeavoring to develop more rigorous guidelines that will help ensure that future reports are reliable, objective, and verifiable. Other key objectives are to develop guidelines that: are practical to implement; encourage participation by a broad spectrum of utilities, businesses and institutions; and take into consideration parallel efforts by various international and state organizations. Crosscutting Issues The many different objectives of this effort suggest that there will, inevitably, be some conflicts that require resolution. Rigor v. Practicality. There may be some conflicts between our desire to ensure
future reports are accurate, reliable and verifiable, and our desire to establish practical guidelines that can be implemented at modest cost by a broad range of utilities, businesses and institutions. This potential conflict raises cross-cutting questions which are relevant to most of the specific issues likely to be addressed during each workshop:
o Should the new guidelines set different requirements for different types of entities in order to reflect differences in their capabilities and characteristics?
o Should the new, more rigorous guidelines be applied to all program participants, or should participants that are not seeking special recognition or credit be permitted to continue to report under more flexible guidelines?
Consistency with other international- and state-level reporting programs. Specific definitions of boundaries, conversion factors, output measures and other factors often differ from one reporting protocol to another.
o Should DOE try to standardize such definitions? o When should DOE defer to definitions and methods developed by others
rather than create or maintain its own? Emissions Reporting: Setting the procedures for the identification, measurement and verification of greenhouse gas emissions is the essential first step of any reporting program. Any estimate of greenhouse gas emissions intensity or emission reductions must be based on a sound inventory of emissions. DOE's existing Voluntary Greenhouse Gas Reporting Program enables reporting entities to determine the scope of their reports and the specific greenhouse gases covered by these reports, and provides other types of flexibility. The Department of Energy has concluded that more rigorous guidelines are needed to ensure that reporting entities provide emission inventories that are complete, internally consistent and comparable to the emission inventories submitted by other participating entities. DOE believes that these more rigorous guidelines should encourage reports on entity-wide emissions of all major greenhouse gases. While these objectives are clear, a number of questions must still be addressed.

J:\FOIA Library\FOIA_Documents\Department of Energy\828_829_geoengineering\NCCTI Disk 2\Workshop Background Qs v6.doc
4
1) Organizational and Geographic Boundaries [See background papers on Organizational Boundaries; and International Emissions] a) If DOE is to require or encourage program participants to report all of their
emissions, how should the guidelines define the boundaries of corporations? Should corporate entities be determined by equity share (or ownership), operational control (financial responsibility) or lines of business activity? Should program participants be given some flexibility to define their own boundaries?
b) Should the boundaries of institutional and governmental entities be determined by ownership, financial responsibility, governance or other factors? Should institutional reporters be given some flexibility to define their own organizational boundaries?
c) How can entity-wide reporting be most effectively encouraged? If entity-wide reporting is not required, should the guidelines place any constraints on how participants define sub-entity or project boundaries for the purpose of reporting emissions?
d) Should participants be required or allowed to submit reports on their non-U.S. emissions? (or only their U.S. emissions?) Should U.S. emissions be distinguished from non-U.S. emissions?
2) Operational Boundaries and Related Issues a) Direct v. indirect emissions [See background paper on Direct and Indirect
Emissions] The existing program requests participants to calculate the indirect emissions associated with electricity (and purchased steam/hot water?) use. i) Should participants be required to report the indirect emissions associated
with their use of electricity (and purchased steam)? ii) Should they be required to report other types of indirect emissions, such as
those associated with the production materials that they purchase? or those associated with business travel or employee commuting? or the emissions associated with the use of the products they produce? [Are there any practical ways of measuring such emissions?]
iii) If electricity use is to be reported, how should the emissions associated with electricity use be calculated? Since users of electricity generally have no control over or responsibility for the carbon intensity of electricity generation, should DOE specify the use of fixed conversion factors for electricity (or steam)? If so, how should DOE determine these conversion factors? Are there any circumstances when a user of electricity should be permitted to calculate their own conversion factors?
b) Gases and sources covered – The existing guidelines cover the six major greenhouse gases covered by the UNFCCC. i) Should participants be required to report their emissions of these six gases?
Should this list of gases be expanded (or shortened)? ii) Converting to carbon dioxide equivalent values: Under the existing program,
DOE asks participants to report emissions in terms of physical units of fossil fuels consumed or in the physical units of other covered greenhouse gases. DOE then converts these physical units into estimated total greenhouse gas emissions using the carbon dioxide equivalency factors (derived using Global Warming Potential estimates for each greenhouse gas and, in the case of fossil

J:\FOIA Library\FOIA_Documents\Department of Energy\828_829_geoengineering\NCCTI Disk 2\Workshop Background Qs v6.doc
5
fuels, the estimated release of CO2 per unit of fuel consumed) established by the most recent assessment of the IPCC. Since the carbon dioxide equivalency factors established by the IPCC's Third Assessment Report and used by DOE's Energy Information Administration do not correspond to the older factors still being used by the UNFCCC, there is some possibility for confusion. Which equivalency factors should be used? And when should they be updated?
iii) Practical limits to emission measurement and reporting: Very small or fugitive emissions -- Some entities emit only very small quantities of certain greenhouse gases. Others may be responsible for "fugitive" emissions that cannot be readily monitored or quantified [such as the methane emissions associated with coal mining or the releases (and sequestration) of carbon and other gases associated with all agricultural operations]. Still others may have very small subsidiaries or organizational elements for which the necessary record keeping could be burdensome. Under what circumstances should entities be permitted to exclude certain emissions from their reports?
3) Measurement and Accounting Methods a) Initial reporting year(s) [See background paper on Intensity Baselines and Base
Years] Should all emissions reporting under the new, more rigorous guidelines be required to start no earlier than a given year, e.g. 2003? Should participants be permitted to report emissions for prior years, if these reports meet the requirements of the new guidelines? The existing forms allow for reports back to 1987? Should this updated?
b) Emissions measurement / estimation methods – Should the new guidelines specify the methods to be used in measuring and recording emissions? Should quantities of the specific fossil fuels combusted be considered sufficient basis to estimate greenhouse gas emissions? Under what circumstances should participants be required to monitor and report their actual emissions? If emissions are derived from an estimation technique, how might the guidelines help ensure that those estimation techniques are valid?
c) Confidentiality issues [See background paper on Confidentiality] Some entities may be concerned that annual reports of their greenhouse gas emissions may reveal information that is valuable to their competitors. Should DOE collect and try to protect such data? Or should such companies be exempted from any emission reporting guidelines? Are their other possible solutions to such problems?
d) Consideration of state-level and international reporting programs – A number of different protocols for measuring and reporting greenhouse gas emissions have been developed (and most of these protocols are continuing to evolve). Should DOE give special consideration to the provisions of such protocols? If so, how?
e) Comparability across sectors – Should the DOE guidelines for measuring and reporting emissions be the same for all sectors or should they take into account the unique characteristics and capabilities of different types of entities?
Emission Reductions: Specifying how to determine when a creditable reduction in greenhouse gas emissions has been achieved and how to quantify and certify such

J:\FOIA Library\FOIA_Documents\Department of Energy\828_829_geoengineering\NCCTI Disk 2\Workshop Background Qs v6.doc
6
emission reductions is perhaps the most difficult and controversial issue requiring resolution. There are many factors that affect the annual emissions of specific corporations, institutions or other entities. Emission reductions (or increases) by one entity may or may not indicate that that entity has contributed to a net reduction in U.S. and global greenhouse gas emissions or greenhouse gas emissions intensity. There are two types of questions that need to be addressed to enable the crediting of emission reductions: (1) questions regarding what types of emission reductions should be recognized as "creditable"; and (2) questions regarding the practicality and reliability of various methods used to quantify such reductions. 1) Characteristics of Creditable Reductions. In order to identify the types of
emissions reductions that should be recognized, a useful first step is to define the desirable characteristics of "creditable" reductions. One way of distinguishing different types of emission reductions is to identify their cause. a) Output effects. Increases in production or decreases in production are often
reflected in comparable increases or decreases in greenhouse gas emissions, especially those emissions associated with fuel use. Should all or some emission reductions be calculated so as to exclude the effects of such output changes? E.g. Should a company that is growing rapidly, but which has successfully kept its greenhouse gas emissions level, be credited for emission reductions? Or should a company that has reduced substantially its production or divested some of its operations be permitted to claim emission reductions that resulted from such production declines?
b) Other Causation Issues. There are many other "causes" of decreased or increased emissions. Can or should these different "causes" be used to help identify creditable emission reductions. For example, does it matter whether an emission reduction resulted from: i) a warm winter or an unusually wet year? ii) actions taken by some other entity, e.g. actions by a utility to reduce the
emissions associated with the electricity that is being reported by an industrial customer?
iii) improvements to the operation and maintenance of an existing facility? or an investment in existing or new technology?
iv) an investment that was economically attractive or one that was not? v) an investment that was mandated by government regulation, encouraged by a
government incentive or encouraged by a government program? Does it matter whether an emission reduction resulted from actions that were also taken by most other companies (or institutions) within the same industry, e.g. should a creditable emission reduction be demonstrably greater than the emission reductions achieved by other companies within the same industry?
c) Durability. Should it matter whether an emission reduction is temporary or sustained for more than one year? Should it matter whether sequestered carbon remains sequestered?
d) Corporate-wide or sub-corporate emission reductions. Most large corporations are likely to have some plants or facilities that are decreasing emissions and others that are increasing emissions. Should corporations or other participating entities be permitted to claim only net, entity-wide emission

J:\FOIA Library\FOIA_Documents\Department of Energy\828_829_geoengineering\NCCTI Disk 2\Workshop Background Qs v6.doc
7
reductions or should they be permitted to claim reductions that were achieved in only one part of the corporation or institution?
e) Comparability within and across sectors. Should the definitions and methods of calculating emission reductions be sufficiently similar to permit comparisons from one corporation to another within the same industry? Or from one industry to another?
f) Offsets. Should it matter whether an emission reduction achieved by a particular entity occurs outside the boundaries of that entity? What if such an offsetting emission reduction occurs within the boundaries of another reporting entity?
g) U.S. v. non-U.S. reductions. Should it matter whether an emission reduction is achieved outside the U.S.?
2) Calculation Methods It is unlikely that program guidelines can be designed so as to
identify only those emission reductions that were fully consistent with a particular set of ideal characteristics. Inevitably, the methods developed to identify and calculate emission reductions will only be able to approximate the desired objectives. a) Emissions Intensity Measures. Measures of emission intensity are intended to
control automatically for changes in output. Should all entities be required to use a measure of greenhouse gas emissions intensity in order to adjust for changes in output? What other ways might be used to take into account the effects of output changes? Many entities will not be able to identify a single measure of output for all of their operations. Should they be encouraged, required or permitted to use emissions intensity measures for sub-corporate (sub-entity) estimates of emission reductions? Should DOE specify or approve the measures of output used by different entities? Should each company/institution be permitted to develop their own measure of output? Should all companies within the same industry be required to use the same measures of output? i) Net emission reductions. What methods might be used to ensure that only net,
entity-wide emission reductions are credited? How could entities be encouraged or required to report emission reductions at the highest level of aggregation possible?
ii) Double counting. Users and producers of electricity might both report and claim credit for the same emissions and emissions reductions. How can double counting of these emissions and emission reductions be minimized? Double counting might also occur if emission reduction credits can be earned both by owners/users as well as manufacturers/producers of products or fuels that reduce greenhouse gas emissions. Who should be able to claim credit for such reductions?
iii) Fixed or Dynamic Emissions Intensity Baselines. Any decline in emissions intensity over time could be credited as an emissions reduction (in this case, an entity's emissions intensity in any given year could serve as a fixed baseline from which to calculate the emission reductions achieved in future years). Since most companies and institutions increase their energy efficiency and productivity over time, the emissions intensity of most entities tends to decline over time. In order to exclude such "business-as-usual" reductions, some argue that the baseline emissions intensity from which

J:\FOIA Library\FOIA_Documents\Department of Energy\828_829_geoengineering\NCCTI Disk 2\Workshop Background Qs v6.doc
8
emission reductions are calculated should be gradually reduced. If such dynamic baselines were desired, how might they be calculated?
b) Projects. [Projects are usually specific actions or investments that result in emission reductions, such as the construction of a wind machine that generates electric power, installation of a cogeneration facility, investments in energy efficiency or the planting of trees to sequester carbon. Projects can be within or outside of corporate or institutional boundaries. Some projects have measurable effects, such as the generation of electricity, while others have effects that can only be estimated.] When (if at all) should entities be permitted to claim emission reductions associated with a specific project? For those projects where direct or indirect measurement of emission reductions is impossible, how might such effects be estimated? Should any project that results in emission reductions be recognized, or should DOE set thresholds that have to be exceeded before the emission reductions from a project are credited?
c) Absolute emissions and other possible alternatives to emission intensity measures or projects. If no useable measure of output exists and the use of project-based estimates would be inappropriate, how might emission reductions be estimated? Should changes in total emissions be used if no measure of emission intensity is available.
d) Base years and Baselines. Should emission reductions be credited only if they occur after the new guidelines have been issued? Should emission reductions that occurred in prior years, but which have been demonstrated to comply with the new guidelines, be recognized as well? Should the emissions or emission intensity of the base year serve as a fixed baseline from which all future emission reductions are calculated, or should this baseline be modified annually or periodically. If it should be modified, on what basis should such modifications be made?
e) Multiyear reporting / averaging. Should multiyear reporting and/or averaging be used to minimize recognition of temporary emission reductions, such as those that result from annual weather changes, or temporary shifts in capacity utilization? Should entities claiming reductions be required to continue to report even after being given credit for certain reductions? What if emissions or emissions intensity increase in future years?
f) Confidentiality issues. What data associated with the calculation of emission reductions should be made public? Under what circumstances should entities be allowed to withhold data relevant to calculation of their emission reductions or to request that such data remain protected from public release?
g) Consideration of state-level and international methods for crediting emission reductions. A number of different methods have been developed for identifying and recognizing emission reductions (and most of these methods continue to evolve). Should DOE base its guidelines on one (or more) of these non-government protocols? Should DOE give special consideration to specific requirements contained in such protocols or should DOE base its guidelines on its own determination of what is the best, most accurate approach?
3) Relationship to Other Voluntary Programs. There are many different government programs designed to encourage voluntary reductions in greenhouse gas emissions by

J:\FOIA Library\FOIA_Documents\Department of Energy\828_829_geoengineering\NCCTI Disk 2\Workshop Background Qs v6.doc
9
giving special recognition to efforts that reduce emissions (e.g., The President's Energy Partners for Climate Action, Climate Leaders and the existing Voluntary Greenhouse Gas Reporting Program, which is the focus of these workshops). Should the actions recognized under these programs also be credited as emission reductions under the new, more rigorous guidelines that are the focus of these workshops? Or should these programs use the new, more rigorous guidelines to quantify the emission reductions that they recognize?
Breakout Session Questions 1) Electricity generation
a) Can reductions in emissions-per-kwh-generated be used to calculate the total emissions reductions that should be credited to specific utilities/generators?
b) How should acquisitions/divestitures of existing plants be treated? How should plant retirements or the production from new plants be treated?
c) Should any distinctions be made among different types of reductions, e.g. investments in new renewable generation v. increased production from existing nuclear plants?
d) What methods might be used to minimize the credit given to transitory changes in emissions that result from cyclical changes in weather, rainfall or loads, while still enabling participating entities to begin receiving credit for their reductions within the next few years?
e) If customers pay higher rates for renewable generation, should they be able to obtain credit for the resulting emission reductions? If utilities provide incentives to encourage their customers to reduce electricity demand, should they be able to claim credit for emission reduction? How can double counting be minimized?
2) Industrial and other large sources a) Which industries have broadly accepted physical measures of output, e.g. tons of
cement or tons of steel? Can these measures of output be usefully applied to all emissions for individual corporations?
b) Should DOE specify certain output measures? Should industry trade associations or individual companies be permitted to develop and propose their own measures of output?
c) If there is no generally accepted physical measure of output that can be applied to whole industries or whole corporations, what other approaches might be used to take into account changes in output? Could economic measures of output, such as value added, serve as a meaningful indicator or year-to-year changes in output?
d) Should companies that are unable to develop an entity-wide measure of emission intensity be encouraged or required to use sub-entity measures of emissions intensity, e.g. for a specific business line or plant?
e) Should changes in "output" be taken into account when estimating real reductions in the emissions of all non-carbon gases?
f) Since emissions intensity is based on production data, and such production data is often treated as a trade secret, some companies are very concerned about the type of the data that might have to be reported. How might a company provide an

J:\FOIA Library\FOIA_Documents\Department of Energy\828_829_geoengineering\NCCTI Disk 2\Workshop Background Qs v6.doc
10
independently verified estimate of its emissions and emission reductions, without disclosing its production data at the same time?
3) Independent renewable energy production a) Renewable energy that is produced by entities that report their total emissions and
emission reductions is likely to be automatically accounted for in entity-wide reports. Under what circumstances should a producer of renewable energy be permitted to claim credit for the emission reductions resulting from specific renewable energy projects?
b) Should such renewable energy producers be required to take into account and report any greenhouse gas emissions for which they are responsible?
c) If electricity is being produced by a renewable energy project, how should the emissions displaced by such electricity production be calculated?
d) If ethanol is being produced by a renewable energy project, how should the emissions displaced by such ethanol production be calculated?
4) Agricultural and forestry sequestration a) How can there be some assurance that the benefits claimed by an entity
responsible for a specific sequestration project are not being offset by other actions by the same entity?
b) The benefits of some sequestration projects can be easily reversed by some future action. How can there be some assurance that credited emission reductions achieved through sequestration will be sustained?
5) Small distributed sources (residential and commercial buildings; transportation) Since it is very unlikely that individual households or small and medium sized businesses will choose to report directly their emissions or emission reductions, how might the Voluntary Greenhouse Gas Reporting Program be designed to credit efforts to reduce emissions in these sectors? a) Should DOE recognize the emission reductions that result from the manufacturing
of more energy efficient products or vehicles, or the construction of more efficient buildings? Are there other types of actions that result in reduced emissions by small emitters that might also be recognized?
b) If emission reduction credits are given to certain product manufacturers or builders, how can there be some assurance that the resulting emission reductions are not also being claimed by the users of these products or buildings?
c) How might the emission reductions associated with energy efficient products, vehicles or buildings be calculated?
d) Many products, vehicles and buildings are subject to minimum efficiency standards set by Federal, state or local governments. Should manufacturers or builders be given credit for emission reductions that result such standards?
Verifying Emissions and Reductions 1) Types and frequency of verification
a) Should independent verification be required for each (annual) report, less frequently or only if challenged?
b) Should program participants be required to have independently verified: their process and methods; the actual data upon which emission reports and emission reduction estimates are based; and/or the physical means by which emissions are

J:\FOIA Library\FOIA_Documents\Department of Energy\828_829_geoengineering\NCCTI Disk 2\Workshop Background Qs v6.doc
11
measured (e.g. meters for fuel consumption or monitors that measure actual emissions)?
c) Even after they have been independently verified, should all participants be required to maintain records of the data, measurement and testing methods used to develop emissions inventories and to calculate emission reductions so that these records could be audited if a report is challenged?
2) Verification methods – Should independent verification include on-site inspections of processes, data and/or equipment? Should the verification methods used be comparable to those used by financial auditors, or should they be comparable to those used by facility health or safety inspectors?
3) Approving/certifying verifiers a) Should all participants be required to have an independent organization verify
their emissions inventory and their estimated emission reductions? b) What types of organizations are qualified to serve as independent verifiers? How
might these organizations be identified? 4) Confidentiality issues
a) Should all data be available for review by government representatives? b) Should non-government organizations be able to review the data upon which
emission reports or claimed emission reductions are based? Managing the Registry of Emission Inventories and Reductions 1) Certifying real reductions. Once DOE has received a report that has been
independently verified to be in compliance with the new, more rigorous guidelines, what actions should it take? What should DOE provide to entities that have successfully met the requirements of the new, more rigorous guidelines?
2) Tracking and transferring reductions. How should DOE identify the entity responsible for specific emission reductions and when should DOE transfer this responsibility to a different entity? In order for DOE to transfer responsibility for a credited emission reduction from one entity to another, what should DOE require from the entities involved?
3) Confidentiality issues. Should all data submitted to DOE be made publicly available? Can DOE effectively protect confidential data?
4) Prior year reports. What should DOE do with the reports already submitted under the existing guidelines? Should previous reporters be permitted to redo prior-year reports to comply with the new, more rigorous guidelines? Should DOE permit entities to documents prior year emission reductions (under the new guidelines), regardless of the year in which they were achieved?
Emission Reductions from Energy Supply
CCTP “Gaps and Opportunities” Workshop #2 Friday, November 18, 2005
Topics to be covered: --Hydrogen Production --Renewable and Low Carbon Fuels --Renewable Power --Nuclear Fission Power --Fusion Energy --Low Emission Fossil-Based Power
Participants from the CCTP Working Group:
John Stamos -- CCTP Working Group Chair (DOE)
“Integrator”:
Bill Fulkerson, University of Tennessee-Knoxville (LERDWG, Exec Secretary)
Other Possible Participants:
Bobi Garrett or Stan Bull, NREL (Renewable Energy) Lee Lynd, Dartmouth University (Bioenergy) Maxine Savitz, Retired VP of Honeywell (Distributed Generation) John Holdren, Harvard University and President, AAAS (Energy R&D) Dale Krumen, American Electric Power (Electric Power) Jim Zucchetto, National Academies John Schmidt, Princeton Plasma Physics Laboratory (Fusion Energy) Richard Meserve, Carnegie Institute and former NRC Chairman (Nuclear) Bob Hirsch, SAIC and NRC Hydrogen Committee Tom Casten, Primary Energy (Combined Heat and Power) Mark Spurr, District Energy Systems Joe Turnage, Constellation Generation Group (Natural Gas)
Gordon Michaels, ORNL (Nuclear Power) Richard Balzhiser, retired EPRI President