
21 September 2017 - Investors | Capita plcinvestors.capita.com/~/media/Files/C/Capita-IR-V2/...21...
52
1 21 September 2017 Half year results for the 6 months to 30 June 2017 Creating a simpler business well positioned for the future Financial highlights - continuing operations Underlying 1 2017 Underlying 1 2016 YOY change Reported 2017 Reported 2016 Reported YOY change Revenue £2,066m £2,131m (3%) £2,127m £2,156m (1%) Operating profit £228m £166m +38% £63m £87m (28%) Profit before tax £195m £134m +46% £28m £37m (26%) Earnings/(loss) per share 22.92p 16.12p +42% (0.11)p 4.66p (102%) Interim dividend per share 11.1p 11.1p — 11.1p 11.1p — Free cash flow £179m £214m (16%) £182m £199m (9%) Highlights Strategic initiatives: re-positioning going to plan • Disposal of our Asset Services businesses for £888m to Link Group, expected to complete in Q4 2017 • Completed disposal of transactional specialist recruitment businesses • Cost initiatives on track to realise around £57m savings by the end of 2018 • Implemented new simplified market facing organisation structure. 2017 H1 financial summary: trading broadly in line with expectations • Early adopted IFRS 15 from 1 January 2017 on a fully retrospective basis • Underlying revenue declined by 3%. Growth on a like for like basis 1 was 1% including 0.5% organic decline • Underlying profit before tax 1 up 46% to £195m (H1 2016: £134m) • Underlying earnings per share 1 up 42% to 22.92p (H1 2016: 16.12p) • Maintained interim dividend of 11.1p (H1 2016: 11.1p) • Free cash flow before non-underlying items 1 £179m (H1 2016: £214m) and after non-underlying items £182m (H1 2016: £199m) • Net debt at end June 2017 of £1,596m (H1 2016 £1,901m) • Reported profit before tax £28m (H1 2016: £37m) • Reported loss per share (0.11)p (H1 2016: 4.66p). Major sales: win rate improved in quiet market • £403m of major contract wins (H1 2016: £879m) • Major contract win rate 1 in 2 (2016: 1 in 3) • Bid pipeline £3.1bn (March 2017: £3.8bn), with a weighted average contract length of 5.5 years (March 2017: 7 years). Annual value of bids maintained. Outlook • Underlying pre-tax profits before significant new contracts and restructuring to rise modestly in the second half, compared to the first half of 2017 • Leverage at the end of 2017 around the bottom of our 2.0 to 2.5 times range, prior to the impact of IFRS 15 and potential unwind of receivables financing • We remain confident that the actions we commenced last year are making Capita a simpler business, well positioned for the future under new leadership. Nick Greatorex of Capita plc, commented:
Transcript of 21 September 2017 - Investors | Capita plcinvestors.capita.com/~/media/Files/C/Capita-IR-V2/...21...

1
21 September 2017
Half year results for the 6 months to 30 June 2017
Creating a simpler business well positioned for the future
Financial highlights - continuing operations
Underlying1 2017
Underlying1 2016
YOY change
Reported 2017
Reported 2016
Reported YOY
change
Revenue £2,066m £2,131m (3 %) £2,127m £2,156m (1 %)
Operating profit £228m £166m +38 % £63m £87m (28 %)
Profit before tax £195m £134m +46 % £28m £37m (26 %)
Earnings/(loss) per share 22.92p 16.12p +42 % (0.11)p 4.66p (102 %)
Interim dividend per share 11.1p 11.1p —
11.1p 11.1p —
Free cash flow £179m £214m (16 %) £182m £199m (9 %)
Highlights
Strategic initiatives: re-positioning going to plan
• Disposal of our Asset Services businesses for £888m to Link Group, expected to complete in Q4 2017
• Completed disposal of transactional specialist recruitment businesses
• Cost initiatives on track to realise around £57m savings by the end of 2018
• Implemented new simplified market facing organisation structure.
2017 H1 financial summary: trading broadly in line with expectations
• Early adopted IFRS 15 from 1 January 2017 on a fully retrospective basis
• Underlying revenue declined by 3%. Growth on a like for like basis1 was 1% including 0.5% organic decline
• Underlying profit before tax1 up 46% to £195m (H1 2016: £134m)
• Underlying earnings per share1 up 42% to 22.92p (H1 2016: 16.12p)
• Maintained interim dividend of 11.1p (H1 2016: 11.1p)
• Free cash flow before non-underlying items1 £179m (H1 2016: £214m) and after non-underlying items £182m (H1
2016: £199m)
• Net debt at end June 2017 of £1,596m (H1 2016 £1,901m)
• Reported profit before tax £28m (H1 2016: £37m)
• Reported loss per share (0.11)p (H1 2016: 4.66p).
Major sales: win rate improved in quiet market
• £403m of major contract wins (H1 2016: £879m)
• Major contract win rate 1 in 2 (2016: 1 in 3)
• Bid pipeline £3.1bn (March 2017: £3.8bn), with a weighted average contract length of 5.5 years (March 2017: 7
years). Annual value of bids maintained.
Outlook
• Underlying pre-tax profits before significant new contracts and restructuring to rise modestly in the second half,
compared to the first half of 2017
• Leverage at the end of 2017 around the bottom of our 2.0 to 2.5 times range, prior to the impact of IFRS 15 and
potential unwind of receivables financing
• We remain confident that the actions we commenced last year are making Capita a simpler business, well
positioned for the future under new leadership.
Nick Greatorex of Capita plc, commented:

2
“In the first half of 2017, we made good progress on executing the plans laid out at the end of last year to reposition
the Group: we announced the sale of our Asset Services businesses, completed the disposal of our specialist
recruitment business and commenced a number of cost initiatives. We remain confident that these actions are
making Capita a simpler business, well positioned for the future under new leadership."
1 Refer to appendix 1 for calculation of Alternative Performance Measures. Capita Asset Services has been treated
as a discontinued operation.
____________________________________________________________________________________________
__________
Analyst & investor presentation:
Ian Powell Chairman and Nick Greatorex Interim CEO and Group Finance Director of Capita plc will host a presentation
of our results in London at 08:30 UK time today.
There will also be a live video webcast and a telephone dial-in facility of the presentation on the day, at 08.30am UK
time, with an on-demand version available on our website www.capita.com/investors later that day.
Please find the webcast link and dial-in details below:
Webcast link
http://www.investis-live.com/capita/594d0292e8adb21200ac6f59/hsre
To register for the webcast please paste the link above into your browser and follow the on-screen instructions.
Telephone dial-in:
Location you are dialling from: Number to dial:
United Kingdom 020 3059 8125
All other locations + 44 20 3059 8125
Participant password: Capita - this must be quoted to the Operator in order for participants to gain access to the
conference.
_____________________________________________________________________________________
For further information:
Capita plc
Tel: 020 7799 1525
Shona Nichols, Executive Director, Communications
Andrew Ripper, Head of Investor Relations
Media enquiries
Powerscourt Tel: 020 7250 1446
Victoria Palmer-Moore, Peter Ogden and Andy Jones

3
This announcement contains inside information.
About Capita
Capita is a leading UK provider of technology enabled customer and business process services and integrated
professional support services. With 73,000 people at over 500 sites, including 94 business centres across the UK,
Europe, India and South Africa, Capita uses its expertise, infrastructure and scale benefits to transform its clients'
services, driving down costs and adding value. Capita is quoted on the London Stock Exchange (CPI.L). Further
information on Capita can be found at: http://www.capita.com.

4
Capita plc
Results for the 6 months to 30 June 2017
Overview
Capita has early adopted IFRS 15, the new revenue recognition standard, and is reporting its performance in 2017
against the comparative period in 2016 under this new standard.
Trading was broadly in line with our expectations in the first half of 2017. The turn-around of our IT Services division
progressed better than expected, following restructuring of the management team and operating model, but we
continued to be impacted by weakness in a number of discretionary services. We improved our major contract win
rate in a relatively subdued business process management market in the public sector.
Capita made good progress in the first half of 2017 on executing the plans laid out at the end of last year to
reposition the Group. We announced the disposal of our Asset Services businesses for £888m to Link Group, which
is expected to complete in Q4 2017 following regulatory approvals, completed the disposal of our transactional
specialist recruitment businesses, implemented our new organisation structure and progressed a number of cost
initiatives.
These actions increase the Group's focus upon technology-enabled Business Process Management, reduce
leverage and leave us better placed to return to sustainable growth over the course of 2018 and beyond.
Financial review
IFRS 15 Revenue from Contracts with Customers
We have adopted IFRS 15 fully retrospectively from 1 January 2017 to provide investors with clarity on the impact of
the new accounting standard in what is a transitional year for the Group. IFRS 15 gives rise to changes in the timing
of revenue and cost recognition, better aligning Capita’s financial results with the delivery of its high value complex
solutions to clients.
IFRS 15 will not impact upon the lifetime profitability of contracts, the cash flow of contracts or the majority of our
transactional businesses. The main changes for Capita from the adoption of IFRS 15 are on its long term contracts
and software businesses, in particular:
• Revenue is more evenly phased over the life of contracts and active software licences in line with the delivery of
outcomes to clients and, consequently, the timing of profits is re-profiled.
• Capita will potentially recognise lower profits or losses in the early years of contracts where there are significant
upfront restructuring costs or higher operating costs prior to transformation, with a compensating increase in
profits in later years. The total net impact at Group level is a function of the balance of contracts in early or late
stage of their life cycle at transition to IFRS 15 and in subsequent years. As a result contract profits, and in
certain cases contract losses, are now reported in the comparative periods.
• The Group's balance sheet includes:
▪ new “contract fulfilment assets” created in the process of transforming services; and
▪ an increased level of deferred income in relation to contracts where payments have been received from
clients to undertake transformation prior to the planned outcomes being delivered. The majority of
deferred income will unwind within the following 12 months and is expected to be replaced by similar
advanced payments subject to additions or changes to the Group’s contract portfolio.

5
Major contracts performance
We have concluded discussions with the Ministry of Defence in relation to the Defence Infrastructure Organisation
('DIO'), which is now expected to end in 2019. The H1 2017 results include a £16m benefit from the re-shaping of the
DIO contract which is not expected to recur in 2018. We are currently not expecting to recognise the benefit of any
gain share up to the contract modification date in the second half of 2017. For the remaining two years, we will focus
on supporting the DIO in achieving its goal of being able to operate effectively in a delegated environment.
Service delivery across our NHS Primary Care Support England ('PCSE) contract has continued to improve but we
are still addressing a number of challenges. We are continuing to invest in completing the transformation of this
service prior to an inflection point in profitability being achieved. As previously announced, the cash cost of these
continuing improvements has been and will remain high for the remainder of 2017.
We are still in discussion with a major life and pensions client which may lead to the continuation of the contract with
amended terms or a termination of the contract. Subject to the outcome of this discussion, we will review the carrying
value of assets related to the contract and may incur associated costs.
Revenue
Reported revenue decreased by 1% to £2,127m (H1 2016 £2,156m) and underlying revenue1 decreased by 3% to
£2,066m (H1 2016: £2,131m). Underlying revenue on a like for like basis1, excluding results from businesses exited
and assets held for sale in both years, increased by 1% including 0.5% organic decline and 1.5% growth from
acquisitions. Revenue benefited from new contracts with Tesco Mobile and mobilcom-debital, continued expansion
of Department for Work and Pensions (DWP) PIP assessments, an increase in BBC TV Licencing revenue after
contract modification and improved performances in network solutions and our other IT businesses. This was offset
by attrition from the loss of part of our Civil Service Learning contract and weakness in real estate and central
government services. Our revenue mix in H1 2017 was 71% long term contractual, 16% short term contractual and
13% transactional.
Cost initiatives
We have commenced a number of short and long term cost initiatives, including reductions in overheads, the offshoring
of some IT applications support, centralising more of our procurement and rationalising our property estate, to further
increase the efficiency of the Group. The net benefit from these actions is still expected to be around £57m by the end
of 2018, albeit with slightly less benefit than originally anticipated being realised in the current year.
Underlying operating profit
Underlying operating profit1 increased by 38% to £228.4m (H1 2016: £166.0m). Profit rose as a result of a significant
improvement in the performance of our IT Services division and higher profits from a number of major contracts
which either reached post transformation inflection points or were renegotiated. This was partially offset by an
increase in central costs, reflecting a re-phasing of incentive schemes and higher professional fees, and a decline in
profits in the Digital & Software Solutions division.
Divisional performance
We have modified our segmental reporting to align it with our management view of divisional performance. This
includes allocating only direct overheads, such as payroll administration, pension and insurance costs, to the
divisions, and showing central costs separately. The impact of IFRS 15 is to re-profile the timing of revenue and
costs, which is reflected in the discussion of divisional performance below:
Private Sector Partnerships - underlying revenue increased by 6%, driven by growth in Capita Europe and
an increase in BBC TV Licencing. Profitability improved due to the dropping out of one-off contract
modifications in the prior year and the renegotiation of our Co-operative Bank contract, partially offset by
lower contributions from remediation services and employee solutions.
Public Services Partnerships - underlying revenue fell by 6% due to weakness in central government
services and real estate, which is not recovering as quickly as expected. Underlying profits increased as a
result of TfL, which went live in H2 2016, the aforementioned re-shaping of DIO, lower costs on PCSE and a
good performance from our DWP PIP contract.

6
Professional Services - underlying revenue fell by 29% as a result of the disposal of specialist recruitment.
Underlying revenue on a like for like basis fell by 4% due to the loss of part of our Civil Service Learning
contract, which was partially offset by growth in the Army Recruiting Partnering Project (RPP). Underlying
profits increased due to costs reducing on RPP and growth in Fera and some of our trading businesses.
Digital & Software Solutions - underlying revenue fell by 1% and underlying profits fell by 13%, as a result
of two major long-term active software licences ending in H2 2016. We are making good progress on the
offshoring of development work to enhance capability and efficiency.
IT Services - underlying revenue increased by 14% due to the acquisitions of Trustmarque and Acutest and
increased volumes in network solutions. Underlying profits doubled, following our restructuring of the
business in the second half of 2016.
Underlying operating margin
Underlying operating margin1 was 11.1% (H1 2016: 7.8%).
Underlying net finance costs
The underlying net interest charge1 was £33.4m (H1 2016: £32.3m). Capita terminated its higher coupon fixed rate
interest rate swaps in the first half and we now expect underlying interest costs to be in the range of £65m to £70m
in the full year to December 2017, subject to the timing of the completion of disposals.
Profit before tax
Underlying profit before tax1 increased by 46% to £195.0m (H1 2016: £133.7m). Reported profit before tax1 was
£27.6m (H1 2016: £37.2m), reflecting the impact of business exits and specific charges detailed in notes 5 and 7 of
this statement.
Discontinued operations
The results above exclude Capita Asset Services, which was treated as a discontinued operation, as detailed in note
6 of this statement.
Earnings per share
Underlying earnings per share1 for continuing operations rose by 42% to 22.9p (H1 2016: 16.1p). Our underlying tax
rate was 18.5% (H1 2016: 15.7%) and we expect our underlying tax rate to be around 19% in the full year to
December 2017. Reported loss per share1 for total operations was (0.11)p (H1 2016: 4.66p).
Dividend
The Board is recommending an interim dividend of 11.1p per ordinary share (H1 2016: 11.1p). The interim dividend
will be payable on 30 November 2017 to shareholders on the register at the close of business on 20 October 2017.
Cash flow
Free cash flow1 before non-underlying expenses was £179.2m (H1 2016: £213.8m) and free cash flow1 after non-
underlying expenses was £182.0m (H1 2016: £199.2m). Net capital expenditure was £50m (H1 2016: £80m) and we
expect capital expenditure in the full year to be slightly lower than 2016.
Balance sheet and net debt
Net liabilities at end June 2017 were £668.3m (H1 2016: £552.9m). This includes significant deferred income
balances recognised on the adoption of IFRS 15, as explained in Appendix 2.
Net debt at end June 2017 was £1,596m (H1 2016: £1,901m). This included £1,568m outstanding private placement
bond debt, of which £90.3m matures in the next 12 months and the remainder at various maturities to 2027. In
addition, we have £620m of bank debt which matures in 2018 and 2019, and an undrawn £600m revolving credit
facility of which £81m matures in August 2020 and £519m in August 2021.

7
At 30 June 2017, our net debt to annualised EBITDA1 ratio was 2.9 and annualised interest cover1 was 7.8 times.
Following the receipt of proceeds from the disposal of our Asset Services businesses and expected cash flow in the
second half of the year, we expect leverage to fall to around the bottom of our 2.0 to 2.5 times range at the end of
2017. Subject to the completion of this disposal, we may choose to unwind our receivables financing which was a
balance of £120m at 30 June 2017 and, in conjunction with the impact of IFRS 15 upon contingent obligations under
bonds and guarantees, this may result in leverage being around the middle of our range.
Return on capital employed
Our post-tax return on average capital employed in the first half of 2017 was 15.2% (FY 2016: 12.9%).
Pension
Capita's pension deficit increased to £381m at 30 June 2017 (FY 2016: £345m), reflecting a decrease in the discount
rate. The latest triennial valuation commenced in April 2017. We continue to expect a £12m increase in the IAS 19
pension charge this year and an increase in cash contributions from June 2018.
Capita has consulted with affected parties and their representatives concerning its decision to close to future accrual
the Group defined benefit scheme. The defined benefit scheme will be replaced by a defined contribution scheme for
the affected employees. We will provide a further update on our plans to close the financial deficit in due course,
once we have reached agreement with the scheme's trustees.
Connaught
This is an update on the potential costs in resolving matters relating to the Connaught Income Series 1 Fund (“The
Fund”), of which Capita Financial Managers Limited ("CFM") was the Operator until September 2009, when it was
replaced by an unrelated company as Operator, following which CFM had no further involvement with the Fund. The
Fund went into liquidation in 2012 and its liquidator brought a claim against both former Operators, which for its part,
the Group settled in 2016 for a sum of £18.5m.
The Financial Conduct Authority's (FCA) formal review of the activities of both operators is ongoing. The FCA has
recently indicated to the Company that it is minded to seek a financial penalty against CFM in connection with its
conduct as operator of the Fund and to seek redress for the substantial losses incurred by all investors when the
Fund collapsed three years after CFM’s involvement, notwithstanding the amount settled during 2016.
The Company is continuing discussions with the FCA in relation to its findings in respect of CFM‘s conduct and the
associated potential financial penalty. While these discussions with the FCA take place, provision at this time has
been made for the full potential amount of the financial penalty and associated legal costs (£37m). The Company
has taken a prudent approach to this provision reflecting the early stages of our discussions with the FCA and the
lack of clarity on the basis supporting the FCA's position.
In respect of the redress the Board does not consider that the Company is liable to pay further sums in addition to
the amounts already paid in respect of the settled claims and therefore no provision has been made at this
time. Based on the information available to date it is not possible at this stage to determine what the ultimate
outcome of the FCA review might be.
1 Refer to appendix for calculation of Alternative Performance Measures. Capita Asset Services has been treated
as a discontinued operation.
Major sales and business development
Our Group Business Development team work on major transformation contracts, which are reported in our sales bid
pipeline, and campaigns of replicable solutions, such as in local government. They also engage with divisional sales
teams to enhance their capability and sales performance.
Capita has secured major contracts with an aggregate total value of £403m in the year to date (H1 2016 £879m),
comprised of 27% new contracts and 73% renewals and extensions. Our win rate increased to 1 in 2 by value. The
market for major transformation contracts has remained subdued in the public sector to date in 2017.
8
We secured a new contract to deliver apprenticeship services to the Civil Service. Extensions were secured to our
Personal Independence Payments contract with the Department for Communities, Northern Ireland until end July
2019 and our IT services contract with the Northern Ireland Education Authority to March 2019. The London Borough
of Lambeth intends to extend our revenue, benefits and customer services contract until 2026. We have also
renewed our RSPCA customer management contract, Royal London life and pensions contracts and mortgage
administration contract with Tesco Bank.
In addition to the above, we have also secured £45m of new local government campaign wins in the year to date.
We are continuing with our period of exclusive engagement with British Airways to explore forming a potential
partnership to support its global customer contact operations, which currently handles approximately 9.5 million calls
per annum.
Bid pipeline
Our bid pipeline shows the total contract value of our major sales bids at a specific point in time. It contains all bids
with total contracted revenue worth between £25m and a capped ceiling of £1bn, where we have been short-listed to
the last 4 or fewer. The total contract value of the bid pipeline currently stands at £3.1bn (March 2017: £3.8bn),
comprised of 28 bids including 79% new business and 21% renewals and extensions. The weighted average
contract length of bids in the pipeline is 5.5 years (March 2017: 7 years) and the annual value of the bid pipeline has
been maintained. We expect decisions on the majority of bids within the next 12 months and continue to have a
large, active prospect list of opportunities behind the pipeline.
Rebids
There are no material contracts, defined as being in excess of 1% of Group revenue, up for rebid in 2017 and 2018.
Our next major contract renewal is the Department for Work & Pensions Personal Independence Payments contract
in mid 2019.
Disposals and acquisitions
In June, we announced the sale of our Asset Services businesses to Link Administration Holdings ("Link Group") for
a cash free, debt free consideration of £888m. The transaction is subject to certain regulatory and other approvals
and is expected to complete in Q4 2017.
Upon completion of the sale, after the deduction of transaction expenses (including certain separation related costs
and a £17 million one-off pension contribution) of approximately £72 million, the net cash proceeds are intended to
be used to reduce indebtedness.
We have completed the disposal of our stand-alone, transactional specialist recruitment businesses (education,
social care and health personnel) to Endless. We are committed to our remaining Workplace Services businesses
which include our public and private recruitment process outsourcing (‘RPO’), executive search, vetting, employer
branding agency and learning services businesses.
We made two small acquisitions in the first half of 2017, Acutest, a provider of software testing services, and NYS, a
travel management business. The aggregate consideration for these businesses was £10m, excluding deferred and
contingent consideration.
Group Board
Andy Parker stepped down from the Board and left Capita on 15 September 2017. Andy has contributed strongly to
the Company over the last 17 years and played a key role in leading Capita, as Chief Executive, for the past three
years and through the challenges of 2016. Nick Greatorex, Capita’s Group Finance Director, was appointed as
Interim Chief Executive from that date until a successor takes up the post as Capita’s new Chief Executive. During
this interim period, Nick will also continue with his responsibilities as Group Finance Director. The Board is pleased
with progress in our search process for a successor.

9
Future prospects
We expect underlying pre-tax profits before significant new contracts and restructuring to rise modestly in the second
half, compared to the first half of 2017, supported by the cumulative benefit from cost initiatives, partially offset by
some of our trading businesses which are not improving as quickly as expected.
Following the receipt of proceeds from the disposal of our Asset Services businesses and expected cash flow in the
second half of the year, we expect leverage to fall to around the bottom of our 2.0 to 2.5 times range at the end of
2017. Subject to the completion of this disposal, we may choose to unwind our receivables financing and, in
conjunction with the impact of IFRS 15 upon contingent obligations under bonds and guarantees, this may result in
leverage being around the middle of our range.
We remain confident that the actions we commenced last year are making Capita a simpler business, well positioned
for the future under new leadership.
-Ends-

10
Half year condensed consolidated income statement for the 6 months ended 30 June 2017
Notes
30 June 2017 30 June 2016 (restated)
Underlying Business
exit Specific
items Total Underlying Business
exit Specific
items Total
£m £m £m £m £m £m £m £m
Continuing operations: Revenue 3 2,065.9 61.4 — 2,127.3 2,131.3 24.6 — 2,155.9
Cost of sales (1,524.3 ) (49.7 ) — (1,574.0 ) (1,656.6 ) (17.9 ) — (1,674.5 )
Gross profit 541.6 11.7 — 553.3 474.7 6.7 — 481.4
Administrative expenses 5,7 (313.2 ) (75.6 ) (101.9 ) (490.7 ) (308.7 ) (6.7 ) (78.7 ) (394.1 )
Operating profit 3 228.4 (63.9 ) (101.9 ) 62.6 166.0 — (78.7 ) 87.3
Net finance costs 8 (33.4 ) — 2.1 (31.3 ) (32.3 ) — (17.7 ) (50.0 )
Loss on disposal 5 — (3.7 ) — (3.7 ) — (0.1 ) — (0.1 )
Profit before tax 3 195.0 (67.6 ) (99.8 ) 27.6 133.7 (0.1 ) (96.4 ) 37.2
Income tax expense (36.0 ) (0.1 ) 12.2 (23.9 ) (21.0 ) — 18.2 (2.8 )
Profit for the period from continuing operations 159.0
(67.7 ) (87.6 ) 3.7
112.7
(0.1 ) (78.2 ) 34.4
Discontinued operations: Profit for the period 6 — 25.8 — 25.8 — 23.5 (2.2 ) 21.3
Total profit for the period 159.0 (41.9 ) (87.6 ) 29.5 112.7 23.4 (80.4 ) 55.7
Attributable to: Owners of the Company 152.5 (41.9 ) (85.5 ) 25.1 106.9 23.4 (78.1 ) 52.2
Non-controlling interests 6.5 — (2.1 ) 4.4 5.8 — (2.3 ) 3.5
159.0 (41.9 ) (87.6 ) 29.5 112.7 23.4 (80.4 ) 55.7
Earnings/(loss) per share 9 Continuing operations: – basic 22.92 p (10.18 )p (12.85 )p (0.11 )p 16.12 p (0.02 )p (11.44 )p 4.66 p
– diluted 22.87 p (10.15 )p (12.83 )p (0.11 )p 16.03 p (0.01 )p (11.38 )p 4.64 p
Total operations: – basic 22.92 p (6.30 )p (12.85 )p 3.77 p 16.12 p 3.53 p (11.78 )p 7.87 p
– diluted 22.87 p (6.29 )p (12.82 )p 3.76 p 16.03 p 3.51 p (11.71 )p 7.83 p
Half year condensed consolidated statement of comprehensive income for the 6 months ended 30 June 2017
30 June 2017 30 June 2016
(restated)
£m £m £m £m
Profit for the period 29.5 55.7
Other comprehensive (expense)/income Items that will not be reclassified subsequently to profit or loss Actuarial loss on defined benefit pension schemes (25.5 ) (88.9 ) Deferred tax effect 4.3 16.0
(21.2 ) (72.9 )
Items that will or may be reclassified subsequently to profit or loss Exchange differences on translation of foreign operations 1.9 36.9
Net investment hedge (2.4 ) (20.0 )
Gain on cash flow hedges 2.8 4.2 Reclassification adjustments for losses included in the income statement — 1.5 Income tax effect (0.5 ) (1.0 )
2.3 4.7
1.8 21.6
Other comprehensive expense for the period net of tax (19.4 ) (51.3 )
Total comprehensive income for the period net of tax 10.1 4.4
Attributable to: Owners of the Company 5.7 0.9
Non-controlling interests 4.4 3.5
10.1 4.4

11
Half year condensed consolidated balance sheet at 30 June 2017
30 June 2017 31 December
2016 (restated)
Notes £m £m
Non-current assets Property, plant and equipment 311.8 394.7
Intangible assets 2,449.1 2,754.2
Contract fulfilment assets 12 255.3 240.6
Financial assets 16 274.9 337.6
Deferred taxation 177.1 222.4
Trade and other receivables 37.6 48.8
3,505.8 3,998.3
Current assets Financial assets 16 63.9 92.6
Contract fulfilment assets 12 43.1 41.6
Disposal group assets held for sale 5 755.3 —
Funds assets — 173.6
Trade and other receivables 692.7 801.1
Cash 1,122.6 1,098.3
2,677.6 2,207.2
Total assets 6,183.4 6,205.5
Current liabilities Trade and other payables 797.0 977.0
Deferred income 1,472.9 1,374.9
Overdrafts 16 577.3 532.5
Financial liabilities 16 292.2 224.2
Disposal group liabilities held for sale 5 346.3 —
Funds liabilities — 173.6
Provisions 14 182.9 112.5
Income tax payable 8.8 18.6
3,677.4 3,413.3
Non-current liabilities Trade and other payables 21.9 21.0
Deferred income 212.9 216.7
Financial liabilities 16 2,526.1 2,694.4
Deferred taxation 17.5 19.6
Provisions 14 15.1 48.2
Employee benefits 380.8 345.2
3,174.3 3,345.1
Total liabilities 6,851.7 6,758.4
Net liabilities (668.3 ) (552.9 )
Capital and reserves Issued share capital 13.8 13.8
Share premium 501.3 501.3
Employee benefit trust and treasury shares (0.2 ) (0.2 )
Capital redemption reserve 1.8 1.8
Foreign currency translation reserve (6.7 ) (6.2 )
Cash flow hedging reserve 2.3 —
Retained earnings (1,253.2 ) (1,131.6 )
Equity attributable to owners of the Company (740.9 ) (621.1 )
Non-controlling interests 72.6 68.2
Total equity (668.3 ) (552.9 )

12
Half year condensed consolidated statement of changes in equity for the 6 months ended 30 June 2017
Share
capital Share
premium
Employee benefit trust &
treasury shares
Capital redemption
reserve Retained earnings
Foreign currency
translation reserve
Cash flow hedging reserve Total
Non-controlling
interests Total
equity
£m £m £m £m £m £m £m £m £m £m
At 1 January 2016, as reported 13.8 500.7 (0.3 ) 1.8 196.5 (21.2 ) (12.0 ) 679.3 74.0 753.3
Impact of change in accounting standards - IFRS 15 — — — — (934.7 ) — — (934.7 ) (7.6 ) (942.3 )
At 1 January 2016, restated 13.8 500.7 (0.3 ) 1.8 (738.2 ) (21.2 ) (12.0 ) (255.4 ) 66.4 (189.0 )
Profit for the period, restated — — — — 52.2 — — 52.2 3.5 55.7
Other comprehensive (expense)/income — — — — (72.9 ) 16.9 4.7 (51.3 ) — (51.3 )
Total comprehensive (expense)/income for the period — — — — (20.7 ) 16.9 4.7 0.9 3.5 4.4
Share based payment — — — — 5.0 — — 5.0 — 5.0
Income tax deduction on exercise of share options — — — — 0.9 — — 0.9 — 0.9
Deferred income tax relating to share based payments — — — — (11.7 ) — — (11.7 ) — (11.7 )
Fair value movement in put option of non-controlling interest — — — — (2.4 ) — — (2.4 ) — (2.4 )
Shares issued — 0.6 — — — — — 0.6 — 0.6
Equity dividends paid — — — — (140.9 ) — — (140.9 ) (4.2 ) (145.1 )
At 30 June 2016, restated 13.8 501.3 (0.3 ) 1.8 (908.0 ) (4.3 ) (7.3 ) (403.0 ) 65.7 (337.3 )
At 1 January 2017, as reported 13.8 501.3 (0.2 ) 1.8 (102.3 ) (6.2 ) — 408.2 75.2 483.4
Impact of change in accounting standards - IFRS 15 — — — — (1,029.3 ) — — (1,029.3 ) (7.0 ) (1,036.3 )
At 1 January 2017, restated 13.8 501.3 (0.2 ) 1.8 (1,131.6 ) (6.2 ) — (621.1 ) 68.2 (552.9 )
Profit for the period — — — — 25.1 — — 25.1 4.4 29.5
Other comprehensive (expense)/income — — — — (21.2 ) (0.5 ) 2.3 (19.4 ) — (19.4 )
Total comprehensive income/(expense) for the period — — — — 3.9 (0.5 ) 2.3 5.7 4.4 53.5
Share based payment — — — — 3.5 — — 3.5 — 3.5
Fair value movement in put option of non-controlling interests — — — — 8.1 — — 8.1 — 8.1
Equity dividends declared (see note 10) — — — — (137.1 ) — — (137.1 ) — (137.1 )
At 30 June 2017 13.8 501.3 (0.2 ) 1.8 (1,253.2 ) (6.7 ) 2.3 (560.3 ) 72.6 (632.0 )

13
Half year condensed consolidated cash flow statement for the 6 months ended 30 June 2017
30 June 2017 30 June 2016
(restated)
Total Total
Notes £m £m
Cash generated from operations before non-underlying cash items 15 241.6
355.2
Non-underlying trading 5 0.5 —
Asset Services insurance recovery received 9.0 —
Business exit costs paid 14 (6.7 ) (11.3 )
Pension settlement paid — (3.3 )
Cash generated from continuing operations 244.4 340.6
Cash generated from discontinued operations 13.6 7.4
Income tax refunded/(paid) 16.0 (32.0 )
Net interest paid (28.7 ) (29.1 )
Net cash inflow from operating activities 245.3 286.9
Cash flows from investing activities Purchase of property, plant and equipment (30.5 ) (44.5 )
Purchase of intangible assets (19.2 ) (35.8 )
Acquisition of subsidiary undertakings and businesses 13 (16.7 ) (91.6 )
Cash acquired on acquisition of subsidiary undertakings 13 4.2 12.3
Debt repaid on acquisition of subsidiary undertakings — —
Proceeds on disposal of subsidiary undertakings 5 16.4 25.0
Cash disposed of with subsidiary undertakings — (5.4 )
Deferred consideration received 3.0 —
Public sector subsidiary partnership payment (4.7 ) —
Deferred consideration paid (0.8 ) (6.7 )
Contingent consideration paid (2.1 ) (9.0 )
Purchase of financial assets — (0.2 )
Investing activities from discontinued operations (7.5 ) (8.4 )
Net cash outflow from investing activities (57.9 ) (164.3 )
Cash flows from financing activities Issue of ordinary share capital — 0.6
Dividends paid 10 — (145.1 )
Capital element of finance lease rental payments 15 (1.8 ) (2.4 )
Proceeds from term loans 15 — 500.0
Repayment of fixed rate swaps 15 (84.6 ) —
Repayment of term loan 15 (30.0 ) —
Repayment of bonds 15 (33.8 ) (70.0 )
Financing arrangement costs 15 (1.2 ) —
Net cash (outflow)/inflow from financing activities (151.4 ) 283.1
Net increase in cash and cash equivalents 36.0 405.7
Cash and cash equivalents at the beginning of the period 565.8 85.3
Impact of movement in exchange rates 15 (3.2 ) 8.9
Cash and cash equivalents at 30 June 598.6 499.9
Cash and cash equivalents comprise: Cash at bank and in hand 1,122.6 935.0
Cash held by discontinued operations 53.3 —
Overdraft (577.3 ) (435.1 )
Total 15 598.6 499.9

14
Notes to the half year condensed consolidated financial statements for the 6 months ended 30 June 2017
1 Corporate information
Capita plc is a public limited company incorporated in England and Wales whose shares are publicly traded. The half year
condensed consolidated financial statements of the Company and its subsidiaries (‘the Group’) for the 6 months ended 30 June
2017 were authorised for issue in accordance with a resolution of the Directors on 20 September 2017.
2 Basis of preparation, judgements and estimates, significant accounting policies, principal risks and uncertainties and
going concern
(a) Basis of preparation
The half year condensed consolidated financial statements for the 6 months ended 30 June 2017 have been prepared in accordance
with the Disclosure and Transparency Rules (DTR) of the Financial Conduct Authority and with IAS 34 Interim Financial Reporting.
The half year condensed consolidated financial statements do not include all the information and disclosures required in the annual
financial statements and should be read in conjunction with the Group’s annual financial statements as at 31 December 2016, which
have been prepared in accordance with IFRSs as adopted by the European Union.
The half year condensed consolidated financial statements do not comprise statutory accounts within the meaning of Section 434
of the Companies Act 2006. The statutory accounts for the year ended 31 December 2016 were approved by the Board of Directors
on 1 March 2017 and delivered to the Registrar of Companies. The report of the auditors on those accounts was unqualified, did
not contain an emphasis of matter paragraph and did not contain any statement under Section 498 of the Companies Act 2006.
The half year condensed consolidated financial statements for the 6 months ended 30 June 2017 have been reviewed by the
Group's auditors pursuant to the Auditing Practices Board guidance on Review of Interim Financial Information.
(b) Judgements and estimates
In preparing these half year condensed consolidated financial statements, management make judgements, estimates and
assumptions that affect the application of accounting policies and the reported amount of assets, liabilities, income and expense.
Actual results may differ from these estimates. The significant judgements made by management in applying the Group’s accounting
policies and the key sources of estimation uncertainty were the same as those that applied to the consolidated financial statements
as at the year ended 31 December 2016 other than those additional areas which have arisen as a consequence of the early adoption
of IFRS 15 Revenue from Contracts with Customers - see appendix 2 where these are explained.
(c) Significant accounting policies
The accounting policies adopted in preparation of the half year condensed consolidated financial statements are consistent with
those followed in the preparation of the Group’s annual financial statements for the year ended 31 December 2016, except for the
early adoption of IFRS 15 Revenue from Contracts with Customers.
Initial adoption of IFRS 15 Revenue from Contracts with Customers
The standard has an effective date of 1 January 2018 but the Group has decided to early adopt this standard with a date of initial
application to the Group of 1 January 2017.
IFRS 15 replaces all existing revenue requirements in IFRS and applies to all revenue arising from contracts with customers
unless the contracts are within the scope of other standards such as IAS 17 Leases.
The standard outlines the principles entities must apply to measure and recognise revenue with the core principle being that
entities should recognise revenue at an amount that reflects the consideration to which the entity expects to be entitled in
exchange for fulfilling its performance obligations to a customer.
The principles in IFRS 15 must be applied using the following 5 step model:
1 Identify the contract(s) with a customer
2 Identify the performance obligations in the contract
3 Determine the transaction price
4 Allocate the transaction price to the performance obligations in the contract
5 Recognise revenue when or as the entity satisfies its performance obligations
The standard requires entities to exercise considerable judgement taking into account all the relevant facts and circumstances
when applying each step of this model to its contracts with customers. The standard also specifies how to account for the
incremental costs of obtaining a contract and the costs directly related to fulfilling a contract, as well as requirements covering

15
matters such as licences of intellectual property, warranties, principal versus agent assessment and options to acquire additional
goods or services.
The Group has applied IFRS 15 fully retrospectively in accordance with paragraph C3 (a) of the standard, restating the prior
period’s comparatives and electing to use the following expedients:
• in respect of completed contracts, the Group will not restate contracts that (i) begin and end within the same annual
reporting period; or (ii) are completed contracts at the beginning of the earliest period presented (para. C5(a));
• in respect of completed contracts that have variable consideration, the Group will use the transaction price at the date
the contract was completed rather than estimating variable consideration amounts in the comparative periods (para.
C5(b)); and
• for all reporting periods presented before the date of initial application, the Group will not disclose the amount of the
transaction price allocated to the remaining performance obligations or an explanation of when the Group expects to
recognise that amount as revenue (para C5(c)).
Details of the change in the Group’s accounting policy in respect of revenue recognition, related matters consequent upon the
early adoption of IFRS 15 and an explanation of the impact on the Group’s prior period financial statements are set out in
appendix 2.
IFRS 16 Leases
The adoption of IFRS 16 Leases is mandatory for the Group for the financial year beginning 1 January 2019.
IFRS 16 replaces the existing accounting requirements in IAS 17 Leases. A single model for lessees will be required, eliminating
off balance sheet accounting for non-exempt operating leases. As a result, lease liabilities and corresponding right of use lease
assets would come onto the balance sheet and would generally be unwound and depreciated over the term of the lease. The
presentation and timing of income and expense recognition in the income statement would change, however the total income and
expense over the term of the lease remains the same. There would be no impact on cash flows as the payments received or paid
under the leases remain the same, although there would be a change in presentation of cash flows. The application of the new
standard would have a varying impact on opening retained earnings at the initial date of adoption dependent upon which
transition method is chosen.
The Group is assessing the potential impact on its consolidated financial statements resulting from the application of IFRS 16 and
expects to disclose a range of estimates for the quantitative impact prior to initial adoption. It is not practicable to provide a
reasonable estimate of the effect of IFRS 16 or to conclude on the transition approach to be taken until the detailed reviews have
been completed.
(d) Principal risks and uncertainties and going concern
The Directors have considered the principal risks and uncertainties affecting the Group’s financial position and prospects in 2017
and out 12 months beyond the reporting date. As described on pages 46 to 55 of the Group’s annual report for 2016, the Group
continues to be exposed to a number of risks and has well established systems and procedures in place to identify, assess and
mitigate those risks.
The principal risks include those arising from: significant failures in internal control systems; lack of corporate financial stability;
failures in information security controls; legal and regulatory risk; adverse financial/business performance; failure to innovate;
increased internal business complexity; adverse changes in the national or international political landscape; operational issues
leading to reputational risk; operational IT risks; failure to effectively manage the Group’s talent and human resources; and
weaknesses in the acquisition and contracting life cycle.
The Directors continue to review the principal risks on an ongoing basis and confirm that there are no further principal risks,
although noting that the residual risk arising from the lack of corporate financial stability has reduced during 2017 as the mitigating
measures undertaken have impacted our position. Further the residual risk from Operational IT risk has increased due to
identified dependencies on certain aged infrastructure which the Group will address through its longer term IT strategy.
In assessing the basis of preparation for the period 30 June 2017, the Directors have considered the principles of the FRC's
“Guidance on Risk Management, Internal Control and Related Financial and Business Reporting 2014”, namely assessing the
applicability of the going concern basis, the review period and disclosures.
The Group has net debt of £1,595.5m at 30 June 2017 (31 December 2016: £1,778.8m).
The Group’s committed revolving credit facility, bank term loan facilities and private placement notes are subject to compliance
with covenant requirements including maximum ratios of adjusted net debt to adjusted EBITDA before exceptional items. The
Group's covenanted maximum ratio for all debt instruments is currently 3.5 times falling to 3.0 times under some debt instruments
following receipt of the proceeds of the sale of the Capita Asset Services businesses. They are tested semi-annually. The

16
Group’s calculation of adjusted net debt to adjusted EBITDA at 30 June 2017 is 2.86 times and is in compliance with the relevant
ratios.
The Board has undertaken a rigorous assessment of the forecast assumptions that support the going concern basis, taking into
account the financial forecasts, the Group’s existing debt levels, the committed funding and liquidity positions, the Group’s historic
experience in generating cash from trading activities, and the working capital management strategies available to it. They have
applied sensitivity analysis to these forecasts through both reductions in cash collections, underperformance against the 2017
business plan, a potential delay of the completion of the sale of the Capita Asset Services businesses into 2018, and the possible
range of settlements described in note 19 Contingent Liabilities. They have considered mitigating actions available to the Group
in response to these sensitivities. After applying these sensitivities and mitigating actions, the Group forecasts that it will continue
to operate within its covenants.
Accordingly and notwithstanding that the half year condensed consolidated balance sheet shows a net liability position (which
from December 2017 will have the effect of adding all outstanding contingent liabilities under performance bonds and bank
guarantees to adjusted net debt under the covenant calculation), the Board has a reasonable expectation that the Company and
the Group will be able to operate as a going concern for the foreseeable future and are satisfied that the half year condensed
consolidated financial statements should be prepared on a going concern basis.

17
3 Segmental information
The Group’s operations are managed separately according to the nature of the services provided, with each segment
representing a strategic business division offering a different package of client outcomes across the markets the Group
serves. As announced at the 2016 year end, the Group from 1 January 2017 introduced a new simplified structure that better
aligns sales and operations to the markets and customers that the Group addresses. This is now reflected in the segment
reporting and the comparatives have been restated on this same basis. No segments are aggregated to form the operating
segments below, and the information presents the information as it is reported to the Group Board. In preparing these interim
statements, the Board has considered how business performance is assessed internally and in addition to the announced new
business divisions, Group trading and central functions will also be reported separately going forwards. Comparative information
has been restated accordingly. The Board believe the changes improve accountability and transparency across the Group.
Digital & Software
Solutions IT
Services Public Sector Partnerships
Professional Services
Private Sector
Partnerships
Group trading
and central
functions
Total underlying
Total non-underlying Total
6 months to 30 June 2017 £m £m £m £m £m £m £m £m £m
Continuing operations Contract length > 2 years 185.7 169.6 382.9 109.5 601.7 5.0 1,454.4 — 1,454.4
Contract length < 2 years 17.2 31.8 86.2 44.3 156.0 — 335.5 0.9 336.4
Transactional (point in time) 4.0 72.5 69.7 96.8 33.0 — 276.0 60.5 336.5
Total segment revenue 206.9 273.9 538.8 250.6 790.7 5.0 2,065.9 61.4 2,127.3
Trading revenue 224.1
378.5
577.6
310.0
857.7
40.2
2,388.1
—
2,388.1
Inter-segment revenue (17.2 ) (104.6 ) (38.8 ) (59.4 ) (67.0 ) (35.2 ) (322.2 ) — (322.2 )
Total underlying segment revenue 206.9 273.9 538.8 250.6 790.7 5.0 2,065.9 — 2,065.9 Non-underlying revenue — — 5.9 54.6 0.9 — 61.4 61.4
Total segment revenue 206.9 273.9 544.7 305.2 791.6 5.0 2,127.3
Underlying trading result 58.6 46.2 45.8 51.2 81.5 (54.9 ) 228.4 — 228.4
Non-underlying trading result — — 0.2 0.2 0.1 — 0.5 0.5
Total trading result 58.6 46.2 46.0 51.4 81.6 (54.9 ) 228.9
Non-trading items: Business exit costs (64.4 )
Intangible amortisation (63.9 )
Acquisition costs (1.1 )
Contingent consideration movement 0.1
Asset Services settlement provision (37.0 )
Operating profit 62.6 Net finance costs (31.3 )
Loss on business disposal (3.7 )
Profit before tax 27.6 Income tax expense (23.9 )
Profit for the period - continuing operations 3.7 Profit for the period - discontinued operations 25.8
Profit for the period - total 29.5
18
Digital & Software Solutions
IT Services
Public Sector Partnerships
Professional Services
Private Sector Partnerships
Group trading
and central functions
Total underlying
Total non-underlying Total
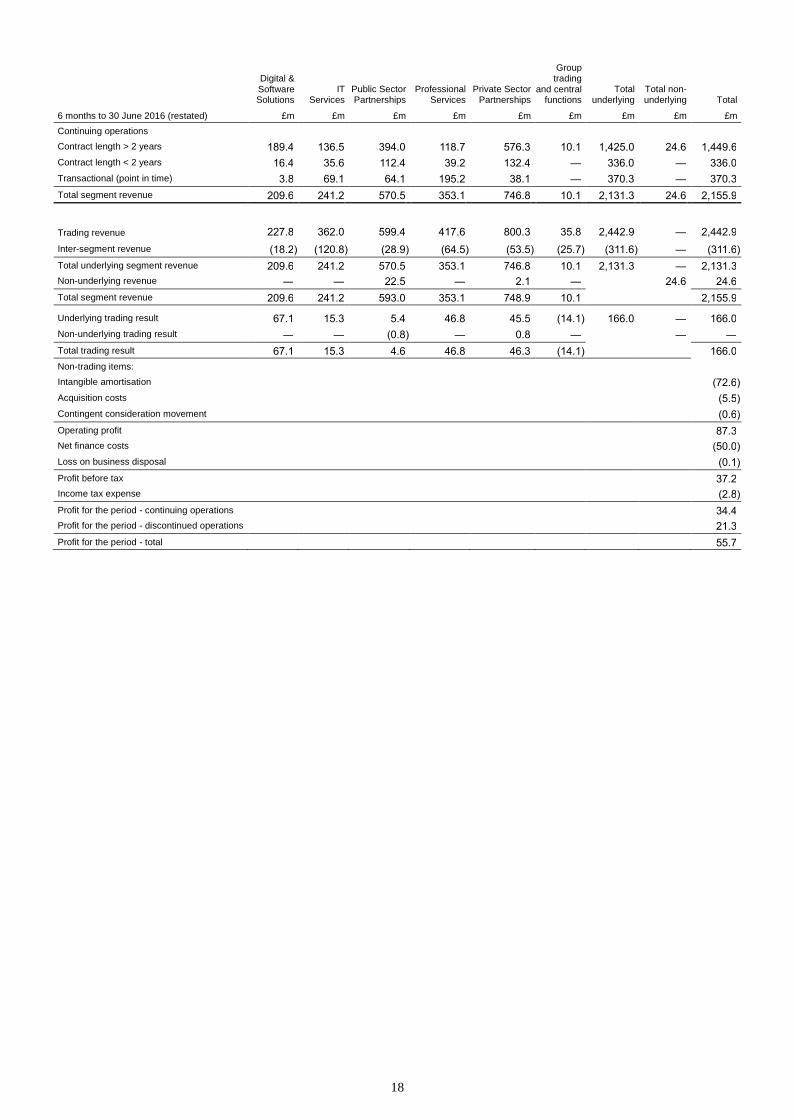
6 months to 30 June 2016 (restated) £m £m £m £m £m £m £m £m £m
Continuing operations Contract length > 2 years 189.4 136.5 394.0 118.7 576.3 10.1 1,425.0 24.6 1,449.6
Contract length < 2 years 16.4 35.6 112.4 39.2 132.4 — 336.0 — 336.0
Transactional (point in time) 3.8 69.1 64.1 195.2 38.1 — 370.3 — 370.3
Total segment revenue 209.6 241.2 570.5 353.1 746.8 10.1 2,131.3 24.6 2,155.9
Trading revenue 227.8
362.0
599.4
417.6
800.3
35.8
2,442.9
—
2,442.9
Inter-segment revenue (18.2 ) (120.8 ) (28.9 ) (64.5 ) (53.5 ) (25.7 ) (311.6 ) — (311.6 )
Total underlying segment revenue 209.6 241.2 570.5 353.1 746.8 10.1 2,131.3 — 2,131.3 Non-underlying revenue — — 22.5 — 2.1 — 24.6 24.6
Total segment revenue 209.6 241.2 593.0 353.1 748.9 10.1 2,155.9
Underlying trading result 67.1 15.3 5.4 46.8 45.5 (14.1 ) 166.0 — 166.0
Non-underlying trading result — — (0.8 ) — 0.8 — — —
Total trading result 67.1 15.3 4.6 46.8 46.3 (14.1 ) 166.0
Non-trading items: Intangible amortisation (72.6 )
Acquisition costs (5.5 )
Contingent consideration movement (0.6 )
Operating profit 87.3 Net finance costs (50.0 )
Loss on business disposal (0.1 )
Profit before tax 37.2 Income tax expense (2.8 )
Profit for the period - continuing operations 34.4 Profit for the period - discontinued operations 21.3
Profit for the period - total 55.7

19
4 Underlying operating profit
30 June 2017 30 June 2016 (restated)
Underlying before
significant new contracts and restructuring
Significant new contracts
and restructuring
Total underlying
Underlying before
significant new contracts and restructuring
Significant new contracts
and restructuring
Total underlying
£m £m £m £m £m £m
Continuing operations:
Revenue 2,065.9 — 2,065.9 2,131.3 — 2,131.3
Cost of sales (1,524.3 ) — (1,524.3 ) (1,656.6 ) — (1,656.6 )
Gross profit 541.6 — 541.6 474.7 — 474.7
Administrative expenses (313.2 ) — (313.2 ) (308.7 ) — (308.7 )
Operating profit 228.4 — 228.4 166.0 — 166.0
Following the adoption of IFRS 15, the Board has adopted a policy to separately disclose the in-period operating profit/loss from
significant new contract wins and significant restructuring, in order for users of the financial statements to obtain a proper
understanding of the financial information and the performance of the business.
A new contract is assessed as that which is either entirely new to the Group, or a significant amendment to the scope and scale of
an existing contract.
The Group continually assesses the resourcing levels, both at a divisional level and also in relation to the management and
delivery of individual contracts. This results in restructuring in the normal course of business and any such charges are recorded
in "Underlying before significant new contracts and restructuring" results. A significant restructuring is assessed as that above
this normal level of restructuring.
Contract terminations arising in the normal course of business and which result in the disposal of a contract fulfilment asset
and/or a true-up of revenue recognised, will be included within "Underlying before significant new contracts and restructuring",
and separately disclosed if considered material.
5 Business exits
2017 business exits
Business exits are businesses that have been exited during the year or in the process of being disposed of. None of these
business exits meet the definition of “discontinued operations” as stipulated by IFRS 5, which requires disclosure and
comparatives to be restated where the relative size of a disposal or business closure is significant, which is normally understood
to mean a reported segment. Accordingly, the separate presentation described below does not fall within the requirements of
IFRS 5 concerning discontinued operations. The expected disposal of Capita Asset Services does meet the definition of a
discontinued operation, and is disclosed separately in note 6 - Discontinued Operations.
In the 2016 annual report, we disclosed that the Group intended to dispose of the majority of our specialist recruitment
businesses which no longer fit the Group's core business strategy. At 31 December 2016, neither of these businesses met the
criteria to be treated as held for sale.
During the period, the disposal of the specialist recruitment businesses has been completed, along with the disposal of part of the
Capita Europe business, and the closure of an events business, and their results are all included within business exits for the
period. As at 30 June 2017, the Group was in an active process to sell a non core property business and has treated this as a
disposal group held for sale at this date.

20
Income statement impact
Non-trading
Trading £m
Cash £m
Non-cash £m
Total £m
Total £m
Revenue 61.4 — — — 61.4
Cost of sales (49.7 ) — — — (49.7 )
Gross profit 11.7 — — — 11.7
Administrative expenses (11.2 ) (56.4 ) (8.0 ) (64.4 ) (75.6 )
Operating profit/(loss) 0.5 (56.4 ) (8.0 ) (64.4 ) (63.9 )
Profit/(loss) on business disposal (see below) — 16.3 (20.0 ) (3.7 ) (3.7 )
Profit/(loss) before tax 0.5 (40.1 ) (28.0 ) (68.1 ) (67.6 )
Income tax expense (0.1 ) — — — (0.1 )
Profit/(loss) for the period 0.4 (40.1 ) (28.0 ) (68.1 ) (67.7 )
Trading revenue and costs represent the current period trading performance of those businesses being exited or disposed.
There are no cumulative income or expenses included in other comprehensive income relating to the disposal group.
Loss on business disposal Cash Non-cash Total
£m £m £m
Property, plant and equipment — 1.2 1.2
Intangible assets — 6.9 6.9
Trade and other receivables — 24.0 24.0
Cash 0.1 — 0.1
Trade and other payables — (11.0 ) (11.0 )
Income tax — (0.2 ) (0.2 )
Deferred tax — (0.8 ) (0.8 )
Provisions — (0.1 ) (0.1 )
Total net assets disposed of 0.1 20.0 20.1
Cash consideration received 17.0 — 17.0
Costs of disposal (0.6 ) — (0.6 )
Proceeds, less costs, on disposal 16.4 — 16.4
Loss on business disposal 16.3 (20.0 ) (3.7 )
Non-trading administrative expenses Disposal/
closure Held for disposal Total
£m £m £m
Cash paid or to be paid:
Separation costs paid (0.5 ) (5.0 ) (5.5 )
Provision in respect of disposal and closure costs (3.4 ) (47.5 ) (50.9 )
(3.9 ) (52.5 ) (56.4 )
Non-cash:
Accelerated depreciation on property, plant and equipment (1.7 ) — (1.7 )
Accelerated amortisation on goodwill — (6.3 ) (6.3 )
(1.7 ) (6.3 ) (8.0 )
(5.6 ) (58.8 ) (64.4 )
Analysed above are non-trading administrative expenses which include cash costs from exiting the disposed business, the
ongoing stranded costs such as property and redundancy payments and impairment losses recognised in the disposal group.
These include costs in respect of the disposal of Capita Asset Services as at 30 June 2017.
As at 30 June 2017, the Group was in an active process to sell a non core property business and has treated this as a disposal
group held for sale at this date.

21
Assets and liabilities of disposal group held for sale - continuing operations
As at
30 June 2017 As at
31 December 2016
£m £m
Property, plant and equipment — 0.1
Intangible assets 2.4 —
Trade and other receivables 3.5 4.2
Assets held for sale 5.9 4.3
Trade and other payables (1.7 ) (9.1 )
Provisions (0.2 ) —
Liabilities held for sale (1.9 ) (9.1 )
Disposal group as reported on balance sheet Continuing operations
Discontinued operations Total
£m £m £m
Assets held for sale 5.9 749.4 755.3
Liabilities held for sale (1.9 ) (344.4 ) (346.3 )
2016 business exits
In the 6 months to 30 June 2016, the Group exited some of its small non-core health businesses.
Income statement impact Non-trading
Trading £m
Cash £m
Non-cash £m
Total £m
Total £m
Revenue 24.6 — — — 24.6
Cost of sales (17.9 ) — — — (17.9 )
Gross profit 6.7 — — — 6.7
Administrative expenses (6.7 ) — — — (6.7 )
Operating loss — — — — —
Loss on business disposal — 39.6 (39.7 ) (0.1 ) (0.1 )
Loss before tax — 39.6 (39.7 ) (0.1 ) (0.1 )
Income tax expense — — — — —
Loss for the period — 39.6 (39.7 ) (0.1 ) (0.1 )
Trading revenue and costs represent the trading performance of these businesses in the period to the date of exit.
Non-trading costs include the costs of exiting a number of small non-core health businesses and ongoing stranded costs such as
IT, property lease and redundancy payments.
Loss on business disposal Cash Non-cash Total
£m £m £m
Disposal group assets — 63.7 63.7
Disposal group liabilities — (20.0 ) (20.0 )
Total net assets disposed of — 43.7 43.7
Cash (net of cash disposed of) 19.6 — 19.6
Deferred consideration receivable 20.0 — 20.0
Fair value of residual interest — 4.0 4.0
Proceeds on disposal 39.6 4.0 43.6
Loss on business disposal 39.6 (39.7 ) (0.1 )
6 Discontinued operations
In the 2016 annual report, we disclosed that the Group intended to dispose of the majority of the Capita Asset Services Division.
At 31 December 2016, this business did not meet the criteria to be treated as held for sale as the sale process had not
progressed sufficiently to be reasonably certain at that time, but at 30 June 2017 the disposal process met the criteria to be
treated as held for sale.

22
The disposal meets the definition of a discontinued operation as stipulated by IFRS 5. The comparatives have been restated.
The following presentation, and that included in other notes, follows the requirements of IFRS 5.
30 June 2017 30 June 2016
Trading Non-trading Total Trading Non-trading Total
£m £m £m £m £m £m
Discontinued operations: Revenue 157.9 — 157.9 147.3 — 147.3
Cost of sales (56.4 ) — (56.4 ) (57.2 ) — (57.2 )
Gross profit 101.5 — 101.5 90.1 — 90.1
Administrative expenses (70.7 ) (0.6 ) (71.3 ) (62.2 ) (2.6 ) (64.8 )
Operating profit 30.8 (0.6 ) 30.2 27.9 (2.6 ) 25.3
Net finance costs — 0.6 0.6 — (0.1 ) (0.1 )
Profit before tax 30.8 — 30.8 27.9 (2.7 ) 25.2
Income tax expense (5.0 ) — (5.0 ) (4.4 ) 0.5 (3.9 )
Profit for the period 25.8 — 25.8 23.5 (2.2 ) 21.3
Non-trading items include amortisation on acquired intangibles within administrative expenses, and fair value movements on
available for sale assets in net finance costs.
Note 30 June 2017 31 December 2016
£m £m
Non-current assets Property, plant and equipment 72.6 76.3
Intangible assets 250.5 250.8
Financial assets — 3.5
Deferred taxation 1.1 0.6
Trade and other receivables 1.9 5.9
326.1 337.1
Current assets Financial assets 5.0 10.5
Funds assets 282.6 173.6
Income tax receivable 4.6 3.0
Trade and other receivables 77.8 113.6
Cash 53.3 37.7
423.3 338.4
Assets held for sale 749.4 675.5
Current liabilities Trade and other payables 36.4 109.9
Deferred income 13.9 7.9
Funds liabilities 282.6 173.6
Provisions 14 0.2 24.4
333.1 315.8
Non-current liabilities Trade and other payables 0.3 0.4
Deferred taxation 11.0 5.1
11.3 5.5
Liabilities held for sale 344.4 321.3
Net assets held for sale 405.0 354.2
30 June 2017 30 June 2016
£m £m
Cash flows from (used in) discontinued operations
Net cash inflow from operating activities 13.6 7.4
Net cash outflow from investing activities (7.5 ) (8.4 )
Net cash flow for period 6.1 (1.0 )

23
7 Specific items
Included within the specific items column are:
6 months to 30 June 2017 6 months to 30 June 2016 (restated)
Cash in
year Cash in
future Non-cash
Total
Cash in year
Cash in future
Non-cash
Total
Notes £m £m £m £m £m £m £m £m
Amortisation of acquired intangibles — — 63.9 63.9 — — 72.6 72.6
Contingent consideration movements 16 — — (0.1 ) (0.1 ) — — 0.6 0.6
Asset Services settlement provision — 37.0 — 37.0 — — — —
Professional fees regarding acquisitions 0.7 0.3 — 1.0 3.3 2.0 — 5.3
Stamp duty paid on acquisitions 0.1 — — 0.1 0.2 — — 0.2
Total 0.8 37.3 63.8 101.9 3.5 2.0 73.2 78.7
The above items are presented as specific items as the Board has concluded that these items are not reflective of the in-period
performance of the Group. The tax impact of the above items is a £12.6m credit (30 June 2016: £14.6m credit). These items are
discussed below:
Amortisation of acquired intangible assets: the Group carries on its balance sheet significant balances related to acquired
intangible assets. The amortisation of these assets, and any impairment charges, are reported separately as they distort the in-
year trading results and performance of the acquired businesses is assessed through the underlying operational results.
Contingent consideration movements: in accordance with IFRS 3, movements in the fair value of contingent consideration on
acquisitions go through the Group income statement. These are reported separately because performance of the acquired
businesses is assessed through the underlying operational results and such a charge/credit movement would distort underlying
results.
Asset services settlement provision: these costs relate to the litigation and regulatory review concerning the Connaught Income
series 1 Fund (“The Fund”) (see note 14), and are included in specific items as they are not reflective of the in-year performance
of the Group's operational activities.
Acquisition related costs and stamp duty: these costs incurred with acquisitions are not included in the assessment of business
performance which is based on the underlying results. IFRS requires certain costs incurred in connection with acquired
businesses to be recorded within the Group income statement. These charges are not included in the internal assessment of
business performance which as above is based on the underlying operational results. These charges are therefore separately
disclosed as specific items.
8 Net finance costs
6 months to 6 months to
30 June 2017 30 June 2016
£m £m
Interest receivable (0.1 ) (0.1 )
Bonds 18.8 18.0
Fixed rate interest rate swaps - realised 3.2 5.9
Finance lease — 0.1
Bank loans and overdrafts 6.8 5.2
Net interest cost on defined benefit pension schemes 4.7 3.2
Interest payable 33.5 32.4
Underlying net finance costs 33.4 32.3
Fixed rate interest rate swaps – mark to market (0.5 ) 22.8
Discount unwind on public sector subsidiary partnership payment 1.0 1.0
Fair value movement in trade investments — 0.1
Non-designated foreign exchange forward contracts – mark to market (1.6 ) (7.3 )
Derivatives’ counterparty credit risk adjustment – mark to market (1.0 ) 0.9
Derivatives’ own credit risk adjustment – mark to market — 0.2
Non-underlying net finance (income)/costs (2.1 ) 17.7
Total net finance costs 31.3 50.0
9 Earnings/(loss) per share
Basic earnings per share have been calculated using the weighted average number of shares in issue during the period of 665.3m
(30 June 2016: 663.2m). The diluted average number of shares is 666.7m (30 June 2016: 666.9m) having adjusted the weighted
average number of shares for shares yet to be issued that will be dilutive.

24
The profits used to calculate the measures are:
30 June 2017 30 June 2016
Continuing operations
Total operations
Continuing operations Total operations
£m £m £m £m
Underlying profit attributable to shareholders 152.5 152.5 106.9 106.9
Total profit/(loss) attributable to shareholders (0.7 ) 25.1 30.9 52.2
As at 20 September 2017, there were 670.2m shares in issue.
10 Dividends
The interim dividend of 11.1p (2016: 11.1p) per share (not recognised as a liability at 30 June 2017) will be payable on
20 October 2017 to ordinary shareholders on the register at the close of business on 30 November 2017. The dividend disclosed
in the statement of changes in equity represents the final ordinary dividend of 20.6p (2016: 21.2p) per share as proposed in the 31
December 2016 financial statements and approved at the Group’s AGM (not recognised as a liability at 31 December 2016) that
was paid on 3 July 2017 and so recognised as a financial liability at 30 June 2017.
11 Goodwill
Goodwill acquired through business combinations has been allocated to Cash-Generating Units (CGUs), for impairment testing
purposes, on the basis of the expected benefit that will accrue to the individual CGU through synergies realised from the
acquisitions and integration with the Group as a whole. These represent the lowest level within the Group at which goodwill can
be allocated on a reasonable and consistent basis.
Following the difficult trading conditions witnessed in 2016 as a result of certain economic and political factors and having
reviewed the constituent businesses and markets in which Capita operates and the underlying assumptions used to calculate the
value in use for each CGU, goodwill was impaired by £66.6m as at 31 December 2016.
In the 2016 annual financial statements, it was noted that the CGUs impaired in the year are the most sensitive to a change in a
single or combination of assumptions and therefore any deterioration in assumptions would lead to further impairment. In
preparing these half year condensed consolidated financial statements, the Group undertook a review to identify indicators of
impairment of goodwill for those CGUs. Consideration was given to their operating performance in 2017 versus the 1 year budget
forecast used in identifying the cash flows for each CGU during the impairment testing performed for the 2016 annual financial
statements. Where this gave rise to an indicator of potential impairment, further review was performed.
No impairments were identified as at 30 June 2017.
12 Contract fulfilment assets
In preparing these half year condensed consolidated financial statements, the Group undertook a review to identify indicators of
impairment of contract fulfilment assets. The Group determined whether or not the contract fulfilment assets and capitalised costs
to obtain a contract were impaired by comparing the carrying amount of the asset to the remaining amount of consideration that
the Group expects to receive less the costs that relate to providing services under the relevant contract. In determining the
estimated amount of consideration, the Group used the same principles as it does to determine the contract transaction price,
except that any constraints used to reduce the transaction price were removed for the impairment test.
In line with our accounting policy, as set out in Appendix 2, if a contract or specific performance obligation exhibited marginal
profitability or other indicators of impairment, judgement was applied to ascertain whether or not the future economic benefits
from these contracts were sufficient to recover these assets. In performing this impairment assessment, management is required
to make an assessment of the costs to complete the contract. The ability to accurately forecast such costs involves estimates
around cost savings to be achieved over time, anticipated profitability of the contract, as well as future performance against any
contract-specific KPIs that could trigger variable consideration, or service credits.
No contract fulfilment asset impairments were identified as at 30 June 2017 (31 December 2016: £nil).

25
13 Business combinations
The Group has made two acquisitions in the period which are shown in aggregate below:
Provisional fair value to
Group
£m
Intangible assets 5.6
Trade and other receivables < 1 year 7.0
Cash and cash equivalents 4.2
Trade and other payables < 1 year (0.6 )
Accruals < 1 year (2.4 )
Income tax (0.4 )
Deferred tax (1.0 )
Total identifiable net assets 12.4
Goodwill arising on acquisition 9.4
Total 21.8
Discharged by:
Cash consideration paid 15.6
Contingent consideration accrued 6.2
Total consideration 21.8
The full exercise to determine the fair value of intangible assets acquired is still to be completed, thus the above numbers are
provisional. In respect of the acquisitions made in 2017, the Group has agreed to pay the vendors additional consideration
dependent on the achievement of performance targets in the periods post-acquisition. These performance periods are of up to 3
years in duration and will be settled in cash on their payment date on achieving the relevant target. The range of the additional
consideration payment is between £nil and £7.0m and the Group has included £6.2m as contingent consideration related to the
additional consideration, which represents its fair value at the acquisition date. The fair value of the contingent consideration has
been calculated based on the Group’s expectation of what it will pay in relation to the post-acquisition performance of the
acquired entities by weighting the probability of a range of payments to give an estimate of the final obligation.
Further cash consideration was paid in respect of previous acquisitions of £7.6m.
Detail on the total amount of contingent consideration the Group has provided as at 30 June 2017 is disclosed in note 16.
Acquisition related costs
The Group incurred acquisition related costs of £1.1m related to professional fees paid for due diligence, general professional fees
and legal related costs. These costs have been included in specific items administrative costs in the Group's consolidated income
statement.
14 Provisions
Restructuring
provision Business exit
provision
Asset services
settlement provision
Claims and litigation
provision Property
provision Other Total
£m £m £m £m £m £m £m
At 1 January 2017 49.4 6.0 23.1 41.5 28.0 12.7 160.7
Utilisation (15.4 ) (6.7 ) (0.2 ) (6.6 ) (0.6 ) (8.5 ) (38.0 )
Provided/(released) in the period - net —
56.4
37.5
0.5
(1.0 ) (1.5 ) 91.9
Provisions acquired — — — — (0.1 ) — (0.1 )
Transfer to accruals — — (16.1 ) — — — (16.1 )
Transfer to disposal group (0.1 ) — — — (0.3 ) — (0.4 )
At 30 June 2017 33.9 55.7 44.3 35.4 26.0 2.7 198.0
The provisions made above have been shown as current or non-current on the balance sheet to indicate the Group’s expected
timing of the matters reaching conclusion.
Restructuring provision: the provision is in respect of the cost of the major restructuring activities undertaken by the Group
commencing in the last quarter of 2016. It represents the cost of reducing role count where there is a constructive obligation
created through communication to affected employees which has crystallised a valid expectation that roles are at risk.
Additionally it reflects the onerous nature of property lease provisions (net of any sub-letting opportunity) on a discounted basis,
where due to the reduced requirement for space due to the redundancy programme there is additional surplus capacity. The
provision, due to the tail of the property lease run-offs, is expected to unwind over 2 years.

26
Business exit provision: the provision relates to the cost of exiting businesses through disposal or closure, including
professional fees related to business exits and the costs of separating the businesses being disposed. Refer to note 5 for further
detail. The provision is expected to unwind over 2 years.
Asset Services settlements:
1. Arch Cru: the parties to the CF Arch Cru Funds litigation have entered into a full and final settlement of the proceedings
on confidential terms.
2. Connaught: the potential costs in resolving matters relating to the Connaught Income Series 1 Fund (“The Fund”), of
which Capita Financial Managers Limited ("CFM") was the Operator until September 2009, when it was replaced by an
unrelated company as Operator, following which CFM had no further involvement with the Fund. The Fund went into
liquidation in 2012 and its liquidator brought a claim against both former Operators, which for its part, the Group settled
in 2016 for a sum of £18.5m.
The Financial Conduct Authority's (FCA) formal review of the activities of both operators is ongoing. The FCA has
recently indicated to the Company that it is minded to seek a financial penalty against CFM in connection with its conduct
as operator of the Fund and to seek redress for the substantial losses incurred by all investors when the Fund collapsed
three years after CFM’s involvement, notwithstanding the amount settled during 2016 as noted above.
The Company is continuing discussions with the FCA in relation to its findings in respect of CFM‘s conduct and the
associated potential financial penalty. While these discussions with the FCA take place, provision at this time has been
made for the full potential amount of the financial penalty and associated legal costs. The Company has taken a prudent
approach to this provision reflecting the early stages of our discussions with FCA and the lack of clarity on the basis
supporting the FCA's position.
In respect of the redress the Board does not consider that the Company is liable to pay further sums in addition to the
amounts already paid in respect of the settled claims and therefore no provision has been made at this time. Based on
the information available to date it is not possible at this stage to determine what the ultimate outcome of the FCA review
might be.
3. Capita plc as part of the sale of the Asset Services business has provided an indemnity against certain legacy claims.
The provisions held, namely the Asset Services settlement provision which includes provisions for Arch Cru, Connaught
and other legacy claims, have therefore been retained within the Group and not transferred to held for sale
assets. Legacy claims have been settled post the balance sheet date and as the precise value of settlement is known,
the provision reflects a transfer from provisions to accruals, the cash settlement of these claims occurring in July 2017.
Giving due consideration to these claims, the Group has a provision of £44.3m at 30 June 2017 (31 December 2016: £23.1m).
Claims and litigation provision: in addition to the Asset Services Settlement provision the Group is exposed to other claims
and litigation. The Group makes a provision when a claim has been made where it is more probable than not that a loss might
occur. These provisions are reassessed regularly to ensure that the level of provisioning is consistent with the claims that have
been reported. The range of values attached to these claims can be significant and where obligations are probable and estimable,
provisions are made representing the Group's best estimate of the expenditure to be incurred. The Group robustly defends its
position on each claim and they are often settled for amounts significantly smaller than the initial claim and may result in no
transfer of economic benefits.
In the period the Group has settled a number of insurance liabilities which it had provided for in previous years. Additionally, it
has made provision for new claims, which originate due to the nature of the Group's operations and existing provisions where
more information on the progress of the claim has become apparent. The Group's exposure to claims is mitigated by having a
number of large insurers providing cover for the Group's activities, albeit insurance recoveries are only recognised as an asset
at the point the recovery is virtually certain. As at 30 June 2017, £5.0m of such assets are held on the Group's consolidated
balance sheet (31 December 2016: £15.5m). Due to the nature of these claims the Group can not give an estimate of the period
over which the provision will unwind.
Property provisions: includes a discounted provision for the difference between the market value of the property leases
acquired in 2011 with Ventura and Vertex Private Sector and the lease obligations committed to at the date the leases were
signed by the previous owners. This is in accordance with IFRS 3 (revised) which requires the use of fair value measurement.
The remaining property provision is made on a discounted basis for the future rent expense and related cost of leasehold property
(net of estimated sub-lease income) where the space is vacant or currently not planned to be used for ongoing operations. The
expectation is that this expenditure will be incurred over the remaining periods of the leases which range from 1 to 24 years.
Other provision: relates to provisions in respect of potential claims arising due to the nature of some of the operations that the
Group provides, and an onerous contract provision. These are likely to unwind over a period of 1 to 3 years.

27
15 Additional cash flow information
Operating cash flow for the 6 months ended 30 June 2017 2016
Notes £m £m
Cash flows from operating activities Operating profit before interest and taxation from continuing operations 62.6 87.3
Adjustment for underlying non-cash items: Depreciation 33.4 36.0
Amortisation of intangible assets (treated as depreciation) 9.9 8.1
Share based payment expense 3.5 5.0
Employee benefits 5.4 (1.8 )
Adjustment for non-underlying non-cash items: Accelerated depreciation on business closure 5 1.7 —
Accelerated amortisation on business exit 5 6.3 —
Amortisation of intangible assets recognised on acquisition 7 63.9 72.6
Contingent consideration 7 (0.1 ) 0.6
Non-underlying provisions 14 93.4 —
Non-underlying trading (0.5 ) —
Movement in underlying provisions - net (32.3 ) 0.2
Net movement in payables and receivables (5.6 ) 147.2
Cash generated from continuing operations before non-underlying cash items1 241.6 355.2
Income tax refunded/(paid) 16.0 (32.0 )
Net interest paid (28.7 ) (29.1 )
Purchase of property, plant and equipment (30.5 ) (44.5 )
Purchase of intangible assets (19.2 ) (35.8 )
Free cash flow before non-underlying items 179.2 213.8
Non-underlying trading 0.5 —
Asset Services insurance recovery received 9.0 —
Business exit costs paid (6.7 ) (11.3 )
Pension settlement paid — (3.3 )
Free cash flow after non-underlying items 182.0 199.2
1see cash flow statement
Reconciliation of net cash flow to movement in net debt
Non-cash flow movements
Net debt at 1
January 2017 £m
Cash flow movements
£m Acquisitions in 2017 £m
Foreign exchange
movements £m
Fair value changes £m
Amortisation of bond issue
costs £m
Net debt at 30 June
2017 £m
Cash+ 565.8 36.0 — (3.2 ) — — 598.6
Loan notes (0.3 ) — — — — — (0.3 )
Bonds* (1,961.7 ) 35.0 — (7.6 ) 79.9 (0.6 ) (1,855.0 )
Currency swaps in relation to US $ denominated bonds* 357.9
—
—
—
(77.7 ) —
280.2
Interest rate swaps in relation to GBP denominated bonds* 7.7
—
—
—
(1.2 ) —
6.5
Term loan (650.0 ) 30.0 — — — — (620.0 )
Finance leases (2.3 ) 1.8 — — — — (0.5 )
Total net liabilities from financing activities (2,248.7 ) 66.8 — (7.6 ) 1.0 (0.6 ) (2,189.1 )
Underlying net debt (1,682.9 ) 102.8 — (10.8 ) 1.0 (0.6 ) (1,590.5 )
Fixed rate interest rate swaps (85.1 ) 84.6 — — 0.5 — —
Deferred consideration (10.8 ) 5.8 — — — — (5.0 )
(1,778.8 ) 193.2 — (10.8 ) 1.5 (0.6 ) (1,595.5 )
+ Cash comprises cash, cash equivalents and overdrafts. Included in overdrafts on the Group's consolidated balance sheet are
balances totalling £577.3m (2016: £532.5m) held in the Group's notional cash pools under which the bank has the right of offset
against cash at bank of the same amount.
* The aggregate bond fair value above of £1,855.0m (30 June 2016: £1,843.1m) includes the GBP value of the US$ denominated
bonds. To remove the Group’s exposure to currency fluctuations it has entered into currency swaps which effectively hedge the
movement in the underlying bond fair value. The interest rate swaps are being used to hedge the exposure to changes in the fair

28
value of GBP denominated bonds. The sum of these items held at fair value equates to the underlying value of the Group’s bond
debt of £1,568.3m (30 June 2016: £1,491.2m).
In June 2017, the Group repaid USD$50m of Series A bonds at maturity, equivalent to £33.8m. Of the Group’s bond debt,
£90.3m matures in the next 12 months and the remainder at various maturities to 2027. In February 2017, the Group elected to
terminate all of its fixed rate interest rate swaps. In the period ended 30 June 2017, the Group prepaid £30m on a term loan. Of
the remaining outstanding term loans of £620m, having agreed amendments and extensions, £520m now matures in September
2018 and £100m matures in May 2019. In addition as at 30 June 2017, the Group has available to it a committed Revolving
Credit Facility of £600m of which £81m matures in August 2020 and £519m matures in August 2021. This facility is available for
the Group's immediate use and £nil was drawn down at 30 June 2017.
Non-cash flow movements
Net debt at 1
January 2016 £m
Cash flow movements
£m
Acquisitions in 2016
£m
Foreign exchange
movements £m
Fair value changes £m
Amortisation of bond issue costs
£m
Net debt at 30 June
2016 £m
Cash+ 85.3 405.7 — 8.9 — — 499.9
Bonds* (1,749.4 ) 70.0 — (31.1 ) (132.3 ) (0.3 ) (1,843.1 )
Currency swaps in relation to US $ denominated bonds* 213.9
—
—
—
128.7
—
342.6
Interest rate swaps in relation to GBP denominated bonds* 6.9
—
—
—
2.4
—
9.3
Term loan (300.0 ) (500.0 ) — — — — (800.0 )
Finance leases (7.0 ) 2.4 (0.8 ) — — — (5.4 )
Total net liabilities from financing activities (1,835.6 ) (427.6 ) (0.8 ) (31.1 ) (1.2 ) (0.3 ) (2,296.6 )
Underlying net debt (1,750.3 ) (21.9 ) (0.8 ) (22.2 ) (1.2 ) (0.3 ) (1,796.7 )
Fixed rate interest rate swaps (67.0 ) — — — (22.8 ) — (89.8 )
Deferred consideration (21.5 ) 6.7 — — — — (14.8 )
(1,838.8 ) (15.2 ) (0.8 ) (22.2 ) (24.0 ) (0.3 ) (1,901.3 )

29
16 Financial instruments
Carrying values and fair values of financial instruments
The following table analyses by classification and category the Group’s financial instruments (excluding short term debtors,
creditors, fund payables/receivables and cash in hand) that are carried in the financial statements. The values below represent
the carrying amounts. The fair values are the same as the carrying values other than twelve fixed rate bonds totalling £601.0m
(31 December 2016: £593.1m), included below in the bond value of £1,855.0m (31 December 2016: £1,961.7m), with a carrying
value of £601.0m (31 December 2016: £593.1m) and a fair value of £632.9m (31 December 2016: £616.9m).
As at 30 June 2017 Available-
for-sale
At fair value through the
income statement
Loans and receivables
Derivatives used for hedging
Other financial liabilities Total
£m £m £m £m £m £m
Financial assets Unlisted equity securities 2.3 — — — — 2.3
Investment loan — — 5.0 — — 5.0
Investment — — 4.0 — — 4.0
Deferred consideration receivable — — 14.0 — — 14.0
Insurance asset recoverable — — 5.0 — — 5.0
Cash flow hedges — — — 8.7 — 8.7
Non-designated foreign exchange forwards and swaps — 7.5 — — — 7.5
Interest rate swaps in relation to GBP denominated bonds — — — 6.5 — 6.5
Currency swaps in relation to USD denominated bonds — — — 285.8 — 285.8
2.3 7.5 28.0 301.0 — 338.8
Financial liabilities Overdrafts — — — — 577.3 577.3
Unsecured loan notes — — — — 0.3 0.3
Bonds — — — — 1,855.0 1,855.0
Term loan — — — — 620.0 620.0
Cash flow hedges — — — 3.1 — 3.1
Non-designated foreign exchange forwards and swaps — 1.7 — — — 1.7 Foreign exchange swaps held for foreign net investment
— — — 0.1 — 0.1
Currency swaps in relation to USD denominated bonds
— — — 5.6 — 5.6
Contingent consideration — — — — 27.0 27.0
Deferred consideration — — — — 5.0 5.0
Obligations under finance leases — — — — 0.5 0.5
Public sector subsidiary partnership payment — — — — 55.1 55.1
Put options of non-controlling interests — — — — 107.8 107.8
Dividends declared — — — — 137.1 137.1
— 1.7 — 8.8 3,385.1 3,395.6

30
As at 31 December 2016 Available-
for-sale
At fair value through the
income statement
Loans and receivables
Derivatives used for hedging
Other financial liabilities Total
£m £m £m £m £m £m
Financial assets: Available-for-sale assets 5.6 — — — — 5.6
Investment loan — — 5.0 — — 5.0
Investment — — 4.0 — — 4.0
Deferred consideration — — 17.0 — — 17.0
Insurance asset recoverable — — 15.5 — — 15.5
Cash flow hedges — — — 7.0 — 7.0
Non-designated foreign exchange forwards and swaps — 7.4 — — — 7.4
Interest rate swaps in relation to GBP denominated bonds — — — 7.7 — 7.7
Currency swaps in relation to USD denominated bonds — — — 361.0 — 361.0
5.6 7.4 41.5 375.7 — 430.2
Financial liabilities: Overdraft — — — — 532.5 532.5
Unsecured loan notes — — — — 0.3 0.3
Bonds — — — — 1,961.7 1,961.7
Term loan — — — — 650.0 650.0
Cash flow hedges — — — 4.2 — 4.2
Non-designated foreign exchange forwards and swaps — 3.3 — — — 3.3
Foreign exchange swaps held for foreign net investment — — — 0.1 — 0.1 Currency swaps in relation to USD denominated bonds
— — — 3.1 — 3.1
Contingent consideration — — — — 23.0 23.0
Deferred consideration — — — — 10.8 10.8
Obligations under finance leases — — — — 2.3 2.3
Public sector subsidiary partnership payment — — — — 58.8 58.8
Put options of non-controlling interests — — — — 115.9 115.9
Fixed rate interest rate swaps — 85.1 — — — 85.1
— 88.4 — 7.4 3,355.3 3,451.1 The fair value of financial instruments has been calculated by discounting the expected future cash flows at prevailing interest
rates, except for unlisted equity securities and investment loans. The valuation models incorporate various inputs including
foreign exchange spot and forward rates and interest rate curves. Unlisted equity securities and investment loans are held at
amortised cost. The Group enters into derivative financial instruments with multiple counterparties, all of which are financial
institutions with investment grade credit ratings.
Fair value hierarchy
The Group uses the following hierarchy for determining and disclosing the fair value of financial instruments by valuation
technique:
Level 1: quoted (unadjusted) prices in active markets for identical assets or liabilities
Level 2: other techniques for which all inputs which have a significant effect on the recorded fair value are observable, either
directly or indirectly
Level 3: techniques which use inputs which have a significant effect on the recorded fair value that are not based on observable
market data.

31
As at 30 June 2017, the Group held the following financial instruments measured at fair value:
30 June 2017 31 December
2016
£m £m
Assets measured at fair value Cash flow hedges 8.7 7.0
Non-designated foreign exchange forwards and swaps 7.5 7.4
Interest rate swaps in relation to GBP denominated bonds 6.5 7.7
Currency swaps in relation to USD denominated bonds 285.8 361.0
308.5 383.1
Liabilities measured at fair value Bonds 1,254.0 1,368.6
Cash flow hedges 3.1 4.2
Non-designated foreign exchange forwards and swaps 1.7 3.3
Foreign exchange swaps held for foreign net investment
0.1 0.1
Currency swaps in relation to USD denominated bonds 5.6 3.1
Fixed rate interest rate swaps — 85.1
Public sector subsidiary partnership payment 55.1 58.8
Put options of non-controlling interests 107.8 115.9
Contingent consideration 27.0 23.0
1,454.4 1,662.1
During both periods the Group only had Level 2 assets or liabilities measured at fair value apart from contingent consideration,
the public sector subsidiary partnership payment and the put options of non-controlling interests which are Level 3 liabilities. It is
the Group’s policy to recognise transfers between levels of the fair value hierarchy at the end of the reporting period during which
the transfer occurred. During the 6 months ended 30 June 2017, there were no transfers between Level 1 and Level 2 fair value
measurements and no transfers into or out of Level 3 fair value measurements.
Contingent consideration arises in business acquisitions where the Group has agreed to pay the vendors additional consideration
dependent on the achievement of performance targets in the periods post-acquisition. These performance periods are of up to 3
years in duration and will be settled in cash on their payment date on achieving the performance criteria. The Group makes
provision for such contingent consideration for each acquisition based on an assessment of its fair value at the acquisition date.
Contingent consideration has been calculated based on the Group’s expectation of what it will pay in relation to the post-
acquisition performance of the acquired entities by weighting the probability of a range of payments to give an estimate of the final
obligation. A sensitivity analysis was performed on the expected contingent consideration of £27.0m. The sensitivity analysis
performed adjusted the probability of payment of the contingent amounts. A 10% increase in the probability of contingent
consideration being paid results in an increase in potential contingent consideration of £3.9m. A 10% decrease in the probability
of the contingent consideration being paid results in a decrease in potential contingent consideration of £3.3m.
The public sector subsidiary partnership payment liability is an estimate of the annual preferred payments to be made by Axelos
Limited (the partnership formed with the Cabinet Office) to the Cabinet Office in years 2017 to 2023. This payment is funded by
Axelos Limited and is contingent on profits. The fair value has been derived by discounting the expected payment at the Group
cost of debt to arrive at its present value. If the discount rate was to increase/decrease by 1% the present value would
decrease/increase by £2.0m.
The put options of the non-controlling interests are measured at amortised cost based on the expected redemption value of the
shares that will be paid in cash by the Group. This value is determined by reference to the expected date of exercise of the
options, which is then discounted to arrive at a present value. The sensitivity of the valuation to movements in both the discount
rate and the cash flows that have been used to calculate it, are as follows: a 10% increase/decrease in the earnings potential of
the business results in a £10.7m increase/decrease in the valuation; a 1% increase/decrease in the discount rate applied to the
valuation results in a £2.0m decrease/£2.0m increase in the valuation.

32
The following table shows the reconciliation from the opening balances to the closing balances for level 3 fair values:
Contingent
consideration
Subsidiary partnership
payment
Put options of non-controlling
interests
£m £m £m
At 1 January 2017 23.0 58.8 115.9
Arising from business combinations in the period 6.2 — —
Profit and loss movement - administrative expenses (0.1 ) — —
Discount unwind - net finance costs — 1.0 —
Movement of put options recognised in equity — — (8.1 )
Utilised (2.1 ) (4.7 ) —
At 30 June 2017 27.0 55.1 107.8
17 Capital commitments
At 30 June 2017, amounts contracted for but not provided in the financial statements for the acquisition of property, plant and
equipment amounted to £7.5m (31 December 2016: £10.0m).
18 Related party transactions
Transactions between the Company and its subsidiaries, which are related parties, have been eliminated on consolidation and
are not disclosed in this note.
Compensation of key management personnel (including Directors of the parent company):
6 months 30
June 2017 6 months 30
June 2016
£m £m
Short term employment benefits 4.2 3.5
Post employment benefits 0.2 0.1
Share based payments 0.4 2.4
4.8 6.0
Gains on share options exercised in the period by key management personnel totalled £0.4m (30 June 2016: £9.9m).
The following companies are substantial shareholders in the Company and therefore a related party of the Company (in each
case, for the purposes of the Listing Rules of the UK Listing Authority). The number of shares held on 15 September 2017 was as
below:
Shareholder No. of shares % of voting
rights
Veritas Asset Management LLP 92,861,962 13.91%
Invesco Asset Management 59,067,929 8.85%
Woodford Investment Management LLP 56,727,196 8.50%
The Capital Group Companies, Inc. 52,017,183 7.79%
Baillie Gifford & Co Limited 48,627,828 7.29%
BlackRock, Inc. 47,468,674 7.11%
T. Rowe Price 25,441,630 3.81%
Marathon Asset Management LLP 22,093,405 3.31%
19 Contingent liabilities
The Group has provided, through the normal course of its business, performance bonds and bank guarantees of £91.1m (31
December 2016: £91.7m).
One of the Group’s major life and pensions clients is conducting a strategic review, the outcome of which is uncertain but could
result in the continuation of the contract with amended terms or the termination of the contract. If the operation is terminated, the

33
Group will incur associated costs, including the costs of transferring the service provided, and the impairment of associated
contract assets, off-set by the release of contract liabilities. As the outcome of the client's review is uncertain, the Group has not
made any provision for a future outflow of funds or for any asset impairments that might result from the eventual outcome. The
review is expected to conclude in 2017 and any outflow of funds will likely be in late 2017 or early 2018.
Further narrative on contingent liabilities, specifically in regard to the Connaught Fund matter, can be seen in note 14.

34
INDEPENDENT REVIEW REPORT TO CAPITA PLC
Conclusion
We have been engaged by the company to review the condensed set of financial statements in the half-yearly financial report for
the six months ended 30 June 2017 which comprises the condensed consolidated income statement, condensed consolidated
statement of comprehensive income, condensed consolidated balance sheet, condensed consolidated statement of changes in
equity, condensed consolidated cash flow statement and the related explanatory notes.
Based on our review, nothing has come to our attention that causes us to believe that the condensed set of financial statements in
the half-yearly financial report for the six months ended 30 June 2017 is not prepared, in all material respects, in accordance with
IAS 34 Interim Financial Reporting as adopted by the EU and the Disclosure Guidance and Transparency Rules (“the DTR”) of the
UK’s Financial Conduct Authority (“the UK FCA”).
Scope of review
We conducted our review in accordance with International Standard on Review Engagements (UK and Ireland) 2410 Review of
Interim Financial Information Performed by the Independent Auditor of the Entity issued by the Auditing Practices Board for use in
the UK. A review of interim financial information consists of making enquiries, primarily of persons responsible for financial and
accounting matters, and applying analytical and other review procedures. We read the other information contained in the half-
yearly financial report and consider whether it contains any apparent misstatements or material inconsistencies with the information
in the condensed set of financial statements.
A review is substantially less in scope than an audit conducted in accordance with International Standards on Auditing (UK) and
consequently does not enable us to obtain assurance that we would become aware of all significant matters that might be identified
in an audit. Accordingly, we do not express an audit opinion.
Whilst the company has previously produced a half-yearly report containing a condensed set of financial statements, those financial
statements have not previously been subject to a review by an independent auditor. As a consequence, the review procedures set
out above have not been performed in respect of the comparative period for the six months ended 30 June 2016.
Directors’ responsibilities
The half-yearly financial report is the responsibility of, and has been approved by, the directors. The directors are responsible for
preparing the half-yearly financial report in accordance with the DTR of the UK FCA.
As disclosed in note 1, the annual financial statements of the group are prepared in accordance with International Financial
Reporting Standards as adopted by the EU. The directors are responsible for preparing the condensed set of financial statements
included in the half-yearly financial report in accordance with IAS 34 as adopted by the EU.
Our responsibility
Our responsibility is to express to the company a conclusion on the condensed set of financial statements in the half-yearly financial
report based on our review.
The purpose of our review work and to whom we owe our responsibilities
This report is made solely to the company in accordance with the terms of our engagement to assist the company in meeting the
requirements of the DTR of the UK FCA. Our review has been undertaken so that we might state to the company those matters
we are required to state to it in this report and for no other purpose. To the fullest extent permitted by law, we do not accept or
assume responsibility to anyone other than the company for our review work, for this report, or for the conclusions we have
reached.
Robert Brent
for and on behalf of KPMG LLP
Chartered Accountants
15 Canada Square
London
E14 5GL
20 September 2017

35
Statement of Directors’ responsibilities
The Directors confirm, to the best of their knowledge, that this condensed set of financial statements has been prepared in
accordance with IAS 34 as adopted by the European Union and that the Half Year Management Report includes a fair review of the
information required by Rules 4.2.4, 4.2.7 and 4.2.8 of the Disclosure and Transparency Rules of the United Kingdom Financial
Conduct Authority.
The names and functions of the Directors of Capita plc are as listed in the Group’s Annual Report for 2016. A list of current Directors
is maintained on the Group website: www.capita.com.
By order of the Board
A N Greatorex
Interim Chief Executive & Group Finance Director
20 September 2017

36
Appendix 1 - Alternative Performance Measures (APMs) used in the half yearly report for
the 6 months to 30 June 2017
The Group presents various APMs as the Directors believe that these are useful for users of the financial statements in helping to provide a balanced view of, and
relevant information on, the Group’s financial performance, position and cash flows. These APMs are mainly measures which disclose the ‘underlying’ performance of
the Group excluding specific items which are regarded as non-underlying.
The Group separately presents intangible amortisation, asset impairments, acquisition contingent consideration movements, acquisition expenses, the financial impact
of business exits or businesses in the process of being exited, movements in the mark to market valuation of certain financial instruments and other specific items in the
income statement which, in the Directors’ judgement, need to be disclosed separately (see notes 5, 6 and 7) by virtue of their nature, size and incidence in order for
users of the financial statements to obtain a proper understanding of the financial information and the underlying performance of the business.
In addition, the Group presents other APMs including Key Performance Indicators (KPIs) such as return on capital employed and interest cover by which we monitor our
performance and others such as organic and acquisition revenue growth which provide useful information to users which is not otherwise readily available from the
financial statements.
APMs presented 2017 2016 (restated) % change Source or calculation
Revenue Total revenue as reported £2,127.3 m £2,155.9 m (1.3)% Line item in income statement
2016 disposals reported H1 2016 £— m (£24.6 m) Line item in income statement
2017 disposals (£61.4 m) £— m Underlying revenue £2,065.9 m £2,131.3 m (3.1)% 2016 disposals reclassed from business exit in H2 £— m £16.5 m 2017 disposals £— m (£101.9 m) Line item in income statement
Underlying revenue on a like-for-like basis £2,065.9 m £2,045.9 m 1.0% Underlying revenue excluding businesses exited
2016 acquisitions (24.0 ) £0.0 m (1.2)% Additional contribution in H1 2017 of acquisitions acquired in 2016
2017 acquisitions (6.5 ) £0.0 m (0.3)% Contribution in H1 2017 of acquisitions acquired in 2017
Underlying organic revenue £2,035.4 m £2,045.9 m (0.5)% Underlying revenue excluding businesses exited
Profit Operating profit from continuing operations as reported £62.6 m £87.3 m (28.3)% Line item in income statement
Business exit £63.9 m £— m Line item in income statement
Specific items £101.9 m £78.7 m Line item in income statement
Underlying operating profit from continuing operations £228.4 m £166.0 m 37.6% Line item in income statement
Businesses held for sale like-for-like comparison n/a (£5.6 m) Businesses reported in H1 2016 as underlying reported in H1 2017 as non-underlying
Like-for-like operating profit £228.4m £160.4 m 42.4% Underlying operating profit excluding businesses exited
Underlying profit before tax from continuing operations
£195.0 m £133.7 m 45.8%
Line item on income statement
Underlying operating margin 11.1 % 7.8 % Calculation (underlying operating profit/underlying revenue)
Like-for-like operating margin 11.2 % 7.8 % 340 b.p. Calculation (like-for-like operating profit/like-for-like underlying revenue)
Profit before tax from continuing operations as reported
£27.6 m £37.2 m (25.8)% Line item in income statement
Underlying profit before tax from continuing operations
£195.0 m £133.7 m 45.8% Line item in income statement
Basic earnings per share from continuing operations as reported
(0.11)p 4.66p (102.4)% Line item in income statement
Underlying earnings per share 22.92p 16.12p 42.2% Line item in income statement and note 9
Cash flow Cash generated by continuing operations before non-underlying cash items
£241.6m £355.2 m (32.0)% Line item in note 15 – additional cash flow information
Underlying free cash flow from continuing operations
£179.2m £213.8m (16.2)%
Line item in note 15 – additional cash flow information
Free cash flow after non-underlying items from continuing operations
£182.0m £199.2m (8.6)% Line item in note 15 – additional cash flow information

37
APMs presented (continued) 2017 2016
(as reported†) Source or calculation
Gearing Annualised underlying EBIT
£482.8 m £667.8 m
This is underlying operating profit. To arrive at an annualised figure, HY1 results are added to the prior year's HY2 results which can be deduced by subtracting the prior year's HY1 results from the FY results.
Deduct: non-controlling interest (£14.8 m) (£12.6 m) Annualised result from income statement before tax charge
Deduct: acquisition costs (£4.6 m) (£13.0 m) Annualised result from line item in note 7
Add back: share based payment expense
£— m £11.0 m
Annualised result from line item in note 15 - expense only
Add back: disposal of non-current assets £0.8 m (£1.5 m) Annualised results from line item in note 15
Add back: non-current service pension charge £2.8 m £2.4 m Annualised adjusted EBIT a £467.0 m £654.1 m Add back: pre-acquisition underlying profit £1.4 m £17.8 m Annualised adjusted EBIT £468.4 m £671.9 m Depreciation and amortisation £99.5 m £95.3 m Line items per cash flow
Annualised adjusted EBITDA b £567.9 m £767.2 m Underlying net interest charge £33.4 m £32.3 m Line item in income statement
Interest charge attributable to pensions (£4.7 m) (£3.2 m) Line item in note 8
Borrowing costs
£28.7 m £29.1 m
Calculation (underlying interest charge excluding pension interest)
Annualised underlying interest charge c £59.6 m £55.5 m
To arrive at an annualised figure, HY1 results are added to the prior year's HY2 results which can be deduced by subtracting the prior year's HY1 results from the FY results.
Equity attributable to shareholders d £408.2 m £679.3 m Last reported December shareholders funds
15% of equity attributable to shareholders e £61.2 m £101.9 m Calculation (d x 15%), minimum £nil
Contingent obligations under bonds and guarantees
f £91.1m £88.1m
g £29.9 m £0.0m If f>e, the difference is treated as debt
Net debt h 1,595.5 m £1,901.3 m Line item in note 13
Adjusted net debt i £1,625.4 m £1,901.3 m Calculation (g + h)
Annualised underlying interest cover 7.8 x 11.8 x Calculation (a / c)
Annualised adjusted net debt to Annualised adjusted EBITDA ratio
2.86 x 2.48 x
Calculation i / b)
†Prior period debt covenants are not required to be restated
(Dec 16 restated)
Return on capital employed (ROCE) Underlying operating profit A £457.0 £394.6
Annualised underlying operating profit, per Note 4
Tax rate B 18.5 % 18.5 %
Tax C = A x B £84.5m £73.0m Calculation (underlying profit multiply tax rate)
Underlying operating profit after tax D = A - C £372.5m £321.6m Calculation (underlying profit less tax)
Current period net assets E (£668.3m) (£552.9m) Line item in balance sheet
Current period underlying net debt F £1,590.5m £1,682.9m
Line item in note 15 - additional cash flow information
Adjustments to capita employed G £1,385.9m £1,226.8m
Includes post-tax impact of accumulated acquired intangible amortisation, fixed rate swaps, put options and pensions
H = E+F+G £2,308.1m £2,356.8m Used in 2017 average capital employed
Less acquisition spend in the period I (£19.8m) (£89.5m)
Consideration paid - cash acquired + debt acquired, per note 13
Current period capital employed M1 = I H £2,288.3m £2,267.3m
Prior period net assets J (£337.3m) (£189.0m)
Prior period underlying net debt K £1,796.7m £1,750.3m
Comparative prior period adjustments L £1,129.9m £1,046.2m
Includes post-tax impact of accumulated
acquired intangible amortisation, fixed rate swaps, put options and pensions
Prior period capital employed M2 = J+K+L £2,589.3m £2,607.5m
Average capital employed pre-acquisitions N = (M1+M2)/2 £2,438.8m £2,437.4m
Weighted average acquisition spend in the period O £12.8m £59.7m Pro-rata no. of months post-acquisition profit
Average capital employed P = N+O £2,451.6m £2,497.1m
ROCE Q = D / P 15.2 % 12.9 %

38
Appendix 2 - Financial statements restatement under IFRS 15
The Group early adopted IFRS 15 Revenue from Contracts with Customers ("IFRS 15") on 1 January 2017 using the full
retrospective method. This appendix details the Group's new accounting policy for revenue and shows the impact of the adoption
of IFRS 15 on the Group’s primary financial statements.
The cumulative effect of the adoption of IFRS 15 has resulted in a decrease in net assets of £942.3 million as at 1 January 2016
(31 December 2016: £1,036.3million). This reflects an important change in accounting policy as the Group moves from one
based predominantly on percentage of completion revenue recognition to a methodology that is focused on aligning revenue
recognition to the delivery of solutions and value to its customers.
Accounting policy for revenue
The Group generates revenue largely in the UK and Europe.
The Group operates a number of diverse businesses and accordingly applies a variety of methods for revenue recognition, based
on the principles set out in IFRS 15. Many of the contracts entered into are long term and complex in nature given the breadth of
solutions the Group offers.
The revenue and profits recognised in any period are based on the delivery of performance obligations and an assessment of
when control is transferred to the customer.
In determining the amount of revenue and profits to record, and related balance sheet items (such as contract fulfilment assets,
capitalisation of costs to obtain a contract, trade receivables, accrued income and deferred income) to recognise in the period,
management is required to form a number of key judgements and assumptions. This includes an assessment of the costs the
Group incurs to deliver the contractual commitments and whether such costs should be expensed as incurred or capitalised.
These judgements are inherently subjective and may cover future events such as the achievement of contractual milestones,
performance KPIs and planned cost savings. In addition, for certain contracts, key assumptions are made concerning contract
extensions and amendments, as well as opportunities to use the contract developed systems and technologies on other similar
projects.
Revenue is recognised either when the performance obligation in the contract has been performed (so 'point in time' recognition)
or 'over time' as control of the performance obligation is transferred to the customer.
For all contracts, the Group determines if the arrangement with a customer creates enforceable rights and obligations. This
assessment results in certain Master Service Agreements (‘MSA’s’) not meeting the definition of a contract under IFRS 15 and as
such the individual call-off agreements, linked to the MSA, are treated as individual contracts.
The Group enters into contracts which contain extension periods, where either the customer or both parties can choose to extend
the contract or there is an automatic annual renewal, and/or termination clauses that could impact the actual duration of the
contract. Judgement is applied to assess the impact that these clauses have when determining the appropriate contract term.
The term of the contract impacts both the period over which revenue from performance obligations may be recognised and the
period over which contract fulfilment assets and capitalised costs to obtain a contract are expensed.
For contracts with multiple components to be delivered such as transformation, transitions and the delivery of outsourced
services, management applies judgement to consider whether those promised goods and services are (i) distinct - to be
accounted for as separate performance obligations; (ii) not distinct - to be combined with other promised goods or services until a
bundle is identified that is distinct or (iii) part of a series of distinct goods and services that are substantially the same and have
the same pattern of transfer to the customer.
At contract inception the total transaction price is estimated, being the amount to which the Group expects to be entitled and has
rights to under the present contract. This includes an assessment of any variable consideration where the Group's performance
may result in additional revenues based on the achievement of agreed KPIs. Such amounts are only included based on the
expected value or the most likely outcome method, and only to the extent that it is highly probable that no revenue reversal will
occur.
The transaction price does not include estimates of consideration resulting from change orders for additional goods and services
unless these are agreed.
Once the total transaction price is determined, the Group allocates this to the identified performance obligations in proportion to
their relative stand-alone selling prices and recognises revenue when (or as) those performance obligations are satisfied. The
Group infrequently sells standard products with observable standalone prices due to the specialised services required by
customers and therefore the Group applies judgement to determine an appropriate standalone selling price. More frequently, the
Group sells a customer bespoke solution, and in these cases the Group typically uses the expected cost plus margin or a
contractually stated price approach to estimate the standalone selling price of each performance obligation.

39
The Group may offer price step downs during the life of a contract, but with no change to the underlying scope of services to be
delivered. In general, any such variable consideration, price step down or discount is included in the total transaction price to be
allocated across all performance obligations unless it relates to only one performance obligation in the contract.
For each performance obligation, the Group determines if revenue will be recognised over time or at a point in time. Where the
Group recognises revenue over time for long term contracts, this is in general due to the Group performing and the customer
simultaneously receiving and consuming the benefits provided over the life of the contract.
For each performance obligation to be recognised over time, the Group applies a revenue recognition method that faithfully
depicts the Group’s performance in transferring control of the goods or services to the customer. This decision requires
assessment of the real nature of the goods or services that the Group has promised to transfer to the customer. The Group
applies the relevant output or input method consistently to similar performance obligations in other contracts.
When using the output method the Group recognises revenue on the basis of direct measurements of the value to the customer
of the goods and services transferred to date relative to the remaining goods and services under the contract. Where the output
method is used, in particular for long term service contracts where the series guidance is applied (see below for further details),
the Group often uses a method of time elapsed which requires minimal estimation. Certain long term contracts use output
methods based upon estimation of number of users, level of service activity or fees collected.
If performance obligations in a contract do not meet the over time criteria, the Group recognises revenue at a point in time (see
below for further details).
The Group disaggregates revenue from contracts with customers by contract type, as management believe this best depicts how
the nature, amount, timing and uncertainty of the Group’s revenue and cash flows are affected by economic factors:
Contract term longer than 2 years
The Group provides a range of services in the majority of its reportable segments under customer contracts with a duration of
more than two years.
The nature of contracts or performance obligations categorised within this revenue type is diverse and includes (i) long term
outsourced service arrangements in the public and private sectors; and (ii) active software licence arrangements (see definition
below).
The service contracts in this category include contracts with either a single or multiple performance obligations.
The Group considers that the services provided meet the definition of a series of distinct goods and services as they are (i)
substantially the same and (ii) have the same pattern of transfer (as the series constitutes services provided in distinct time
increments (e.g., daily, monthly, quarterly or annual services)) and therefore treats the series as one performance obligation. Even
if the underlying activities performed by the Group to satisfy a promise vary significantly throughout the day and from day to day,
that fact, by itself, does not mean the distinct goods or services are not substantially the same. For the majority of long service
contracts with customers in this category, the Group recognises revenue using the output method as it best reflects the nature in
which the Group is transferring control of the goods or services to the customer.
Active software licences are those where the Group has a continuing involvement after the sale or transfer of control to the
customer, which significantly affects the intellectual property to which the customer has rights. The Group is in a majority of cases
responsible for any maintenance, continuing support, updates and upgrades and accordingly the sale of the initial software is not
distinct. The Group’s accounting policy for licences is discussed in more detail below.
Over time service with contract length less than 2 years
The nature of contracts or performance obligations categorised within this revenue type is diverse and includes (i) short term
outsourced service arrangements in the public and private sectors; and (ii) software maintenance contracts.
The Group has assessed that maintenance and support (i.e. on-call support, remote support) for software licences is a
performance obligation that can be considered capable of being distinct and separately identifiable in a contract if the customer
has a passive licence. These recurring services are substantially the same as the nature of the promise is for the Group to 'stand
ready' to perform maintenance and support when required by the customer. Each day of standing ready is then distinct from each
following day and is transferred in the same pattern to the customer.
Transactional (Point in time) contracts
The Group delivers a range of goods or services in all reportable segments that are transactional services for which revenue is
recognised at the point in time when control of the goods or services has transferred to the customer. This may be at the point of
physical delivery of goods and acceptance by a customer or when the customer obtains control of an asset or service in a
contract with customer-specified acceptance criteria.

40
The nature of contracts or performance obligations categorised within this revenue type is diverse and includes (i) provision of IT
hardware goods; (ii) passive software licence agreements; (iii) commission received as agent from the sale of third party software;
and (iv) fees received in relation to delivery of professional services.
Passive software licences are licences which have significant stand-alone functionality and the contract does not require, and the
customer does not reasonably expect, the Group to undertake activities that significantly affect the licence. Any ongoing
maintenance or support services for passive licences are likely to be separate performance obligations. The Group’s accounting
policy for licences is discussed in more detail below.
Contract modifications
The Group’s contracts are often amended for changes in contract specifications and requirements. Contract modifications exist
when the amendment either creates new or changes the existing enforceable rights and obligations. The effect of a contract
modification on the transaction price and the Group’s measure of progress for the performance obligation to which it relates, is
recognised as an adjustment to revenue in one of the following ways:
a. prospectively as an additional separate contract;
b. prospectively as a termination of the existing contract and creation of a new contract;
c. as part of the original contract using a cumulative catch up; or
d. as a combination of b) and c).
For contracts for which the Group has decided there is a series of distinct goods and services that are substantially the same and
have the same pattern of transfer where revenue is recognised over time, the modification will always be treated under either a)
or b). d) may arise when a contract has a part termination and a modification of the remaining performance obligations.
The facts and circumstances of any contract modification are considered individually as the types of modifications will vary
contract by contract and may result in different accounting outcomes.
Judgement is applied in relation to the accounting for such modifications where the final terms or legal contracts have not been
agreed prior to the period end as management need to determine if a modification has been approved and if it either creates new
or changes existing enforceable rights and obligations of the parties. Depending upon the outcome of such negotiations, the
timing and amount of revenue recognised may be different in the relevant accounting periods. Modification and amendments to
contracts are undertaken via an agreed formal process. For example, if a change in scope has been approved but the
corresponding change in price is still being negotiated, management use their judgement to estimate the change to the total
transaction price. Importantly any variable consideration is only recognised to the extent that it is highly probably that no revenue
reversal will occur.
Principal versus agent
The Group has arrangements with some of its customers whereby it needs to determine if it acts as a principal or an agent as
more than one party is involved in providing the goods and services to the customer. The Group acts as a principal if it controls a
promised good or service before transferring that good or service to the customer. The Group is an agent if its role is to arrange
for another entity to provide the goods or services. Factors considered in making this assessment are most notably the discretion
the Group has in establishing the price for the specified good or service, whether the Group has inventory risk and whether the
Group is primarily responsible for fulfilling the promise to deliver the service or good.
This assessment of control requires judgement in particular in relation to certain service contracts. An example, is the provision of
certain recruitment and learning services where the Group may be assessed to be agent or principal dependent upon the facts
and circumstances of the arrangement and the nature of the services being delivered.
Where the Group is acting as a principal, revenue is recorded on a gross basis. Where the Group is acting as an agent revenue is
recorded at a net amount reflecting the margin earned.
Licences
Software licences delivered by the Group can either be right to access (‘active’) or right to use (‘passive’) licences. Active licences
are licences which require continuous upgrade and updates for the software to remain useful, all other licences are treated as
passive licences. The assessment of whether a licence is active or passive involves judgement. The key determinant of whether
a licence is active is whether the Group is required to undertake activities that significantly affect the licensed intellectual property
(or the customer has a reasonable expectation that it will do so) and the customer is, therefore, exposed to positive or negative
impacts resulting from those changes.
When software upgrades are sold as part of the software licence agreement (i.e. software upgrades are promised to the
customer), the Group applies judgement to assess whether the software upgrade is distinct from the licence (i.e. a separate

41
performance obligation). If the upgrade is considered fundamental to the ongoing use of the software by the customer, the
upgrades are not considered distinct and not accounted for as a separate performance obligation.
The Group considers for each contract that includes a separate licence performance obligation all the facts and circumstances in
determining whether the licence revenue is recognised over time or at a point in time from the go live date of the licence.
Contract related assets and liabilities
As a result of the contracts which the Group enters into with its customers, a number of different assets and liabilities are
recognised on the Group’s balance sheet. These include but are not limited to:
• Property, plant and equipment*
• Intangible assets*
• Contract fulfilment assets^
• Contract assets derived from costs to obtain a contract^
• Trade receivables*
• Accrued income^
• Deferred income^
* No change in the accounting policies for these assets as a result of the adoption of IFRS 15
^ Refer below for the accounting policy applied following the adoption of IFRS 15
Contract fulfilment assets
Contract fulfilment costs are divided into (i) costs that give rise to an asset; and (ii) costs that are expensed as incurred.
When determining the appropriate accounting treatment for such costs, the Group firstly considers any other applicable
standards. If those other standards preclude capitalisation of a particular cost, then an asset is not recognised under IFRS 15.
If other standards are not applicable to contract fulfilment costs, the Group applies the following criteria which, if met, result in
capitalisation: (i) the costs directly relate to a contract or to a specifically identifiable anticipated contract; (ii) the costs generate or
enhance resources of the entity that will be used in satisfying (or in continuing to satisfy) performance obligations in the future;
and (iii) the costs are expected to be recovered. The assessment of this criteria requires the application of judgement, in
particular when considering if costs generate or enhance resources to be used to satisfy future performance obligations and
whether costs are expected to be recoverable.
The Group regularly incurs costs to deliver its outsourcing services in a more efficient way (often referred to as ‘transformation’
costs). These costs may include process mapping and design, system development, project management, hardware (generally in
scope of the Group’s accounting policy for property, plant and equipment), software licence costs (generally in scope of the
Group’s accounting policy for intangible assets), recruitment costs and training.
The Group has determined that, where the relevant specific criteria are met, the costs for (i) process mapping and design; (ii)
system development; and (iii) project management are likely to qualify to be capitalised as contract fulfilment assets.
Capitalisation of costs to obtain a contract
The incremental costs of obtaining a contract with a customer are recognised as an asset if the Group expects to recover them.
The Group incurs costs such as bid costs, legal fees to draft a contract and sales commissions when it enters into a new contract.
Judgement is applied by the Group when determining what costs qualify to be capitalised in particular when considering whether
these costs are incremental and whether these are expected to be recoverable. For example, the Group considers which type of
sales commissions are incremental to the cost of obtaining specific contracts and the point in time when the costs will be
capitalised.
The Group has determined that the following costs may be capitalised as contract assets (i) legal fees to draft a contract (once
the Group has been selected as a preferred supplier for a bid); and (ii) sales commissions that are directly related to winning a
specific contract.
Costs incurred prior to selection as preferred supplier are not capitalised but are expensed as incurred.
Utilisation, derecognition and impairment of contract fulfilment assets and capitalised costs to obtain a contract
The Group utilises contract fulfilment assets and capitalised costs to obtain a contract to cost of sales over the expected contract
period using a systematic basis that mirrors the pattern in which the Group transfers control of the service to the customer. The

42
utilisation charge is included within cost of sales. Judgement is applied to determine this period, for example whether this
expected period would be the contract term or a longer period such as the estimated life of the customer relationship for a
particular contract if, say, renewals are expected.
A contract fulfilment asset or capitalised costs to obtain a contract is derecognised either when it is disposed of or when no further
economic benefits are expected to flow from its use or disposal.
Management is required to determine the recoverability of contract related assets within property, plant and equipment, intangible
assets as well as contract fulfilment assets, capitalised costs to obtain a contract, accrued income and trade receivables. At each
reporting date, the Group determines whether or not the contract fulfilment assets and capitalised costs to obtain a contract are
impaired by comparing the carrying amount of the asset to the remaining amount of consideration that the Group expects to
receive less the costs that relate to providing services under the relevant contract. In determining the estimated amount of
consideration, the Group uses the same principles as it does to determine the contract transaction price, except that any
constraints used to reduce the transaction price will be removed for the impairment test.
Where the relevant contracts or specific performance obligations are demonstrating marginal profitability or other indicators of
impairment, judgement is required in ascertaining whether or not the future economic benefits from these contracts are sufficient
to recover these assets. In performing this impairment assessment, management is required to make an assessment of the costs
to complete the contract. The ability to accurately forecast such costs involves estimates around cost savings to be achieved over
time, anticipated profitability of the contract, as well as future performance against any contract-specific KPIs that could trigger
variable consideration, or service credits. Where a contract is anticipated to make a loss, these judgements are also relevant in
determining whether or not an onerous contract provision is required and how this is to be measured.
Deferred and accrued income
The Group’s customer contracts include a diverse range of payment schedules dependent upon the nature and type of goods and
services being provided. The Group often agrees payment schedules at the inception of long term contracts under which it
receives payments throughout the term of the contracts. These payment schedules may include performance-based payments or
progress payments as well as regular monthly or quarterly payments for ongoing service delivery. Payments for transactional
goods and services may be at delivery date, in arrears or part payment in advance.
Where payments made are greater than the revenue recognised at the period end date, the Group recognises a deferred income
contract liability for this difference. Where payments made are less than the revenue recognised at the period end date, the
Group recognises an accrued income contract asset for this difference.
Property commercialisation
Part of the Group’s strategy is to create and deliver maximum value from assets that are either owned by its customers or are
acquired by the Group as part of a wider transaction. By combining the Group’s capabilities with the expertise and assets of any
organisation, the Group can significantly increase the value that can be generated from often under-utilised assets. Our strategy
often involves the commercialisation of property assets, where the Group will invest in real estate improvements to maximise the
future capital value or commercial letting potential. Such an investment approach can generate substantial benefits that can be
realised up-front or over time. Examples of up-front value creation include entering into transactions when current market values
offer opportunities to generate immediate shareholder returns, with opportunities for continued investment in the underlying asset.
For example, the Group will acquire property with a view to resale and subsequently complete a sale and lease back transaction
resulting in revenue and profit recorded in the year. The Group applies judgement over the categorisation of such transactions as
operating or finance leases.

43
Consolidated income statement restatement under IFRS 15
Adjustment As reported, six months ended 30 June 2016 Discontinued
operations Impact of IFRS 15 Restated, six months ended 30 June 2016
Underlying Business
exit Specific
items Total
Underlying / reclasification
to business exit
Specific items Underlying
Specific items Underlying
Business exit
Specific items Total
£m £m £m £m £m £m £m £m £m £m £m £m
Revenue A,B,C 2,405.4 24.6 — 2,430.0 (147.3 ) — (126.8 ) — 2,131.3 24.6 — 2,155.9
Cost of sales A,D (1,716.9 ) (17.9 ) — (1,734.8 ) 57.2 — 3.1 — (1,656.6 ) (17.9 ) — (1,674.5 )
Gross profit 688.5 6.7 — 695.2 (90.1 ) — (123.7 ) — 474.7 6.7 — 481.4
Administrative expenses H (370.9 ) (6.7 ) (81.3 ) (458.9 ) 62.2 2.6 — — (308.7 ) (6.7 ) (78.7 ) (394.1 )
Operating profit 317.6 — (81.3 ) 236.3 (27.9 ) 2.6 (123.7 ) — 166.0 — (78.7 ) 87.3
Net finance costs (32.3 ) — (17.8 ) (50.1 ) — 0.1 — — (32.3 ) — (17.7 ) (50.0 )
Loss on disposal — (0.1 ) — (0.1 ) — — — — — (0.1 ) — (0.1 )
Profit before tax 285.3 (0.1 ) (99.1 ) 186.1 (27.9 ) 2.7 (123.7 ) — 133.7 (0.1 ) (96.4 ) 37.2
Income tax expense E (52.8 ) — 18.7 (34.1 ) 4.4 (0.5 ) 27.4 — (21.0 ) — 18.2 (2.8 )
Profit for the period from continuing operations 232.5
(0.1 ) (80.4 ) 152.0
(23.5 ) 2.2
(96.3 ) —
112.7
(0.1 ) (78.2 ) 34.4
Profit for the period from discontinued operations
—
—
—
—
23.5
(2.2 ) —
—
—
23.5
(2.2 ) 21.3
Total profit for the period 232.5 (0.1 ) (80.4 ) 152.0 — — (96.3 ) — 112.7 23.4 (80.4 ) 55.7
Attributable to: Owners of the Company 227.1 (0.1 ) (78.1 ) 148.9 (96.7 ) — 106.9 23.4 (78.1 ) 52.2
Non-controlling interests 5.4 — (2.3 ) 3.1 0.4 — 5.8 — (2.3 ) 3.5
232.5 (0.1 ) (80.4 ) 152.0 (96.3 ) — 112.7 23.4 (80.4 ) 55.7
Earnings per share Continuing operations: – basic 34.24 p (0.02 )p (11.78 )p 22.44 p (3.54 )p 0.33 p (14.58 )p — p 16.12 p (0.02 )p (11.44 )p 4.66 p
– diluted 34.05 p (0.01 )p (11.71 )p 22.33 p (3.52 )p 0.33 p (14.50 )p — p 16.03 p (0.01 )p (11.38 )p 4.64 p
Total operations: – basic 34.24 p (0.02 )p (11.78 )p 22.44 p — p — p (14.58 )p — p 16.12 p 3.53 p (11.78 )p 7.87 p
– diluted 34.05 p (0.01 )p (11.71 )p 22.33 p — p — p (14.50 )p — p 16.03 p 3.51 p (11.71 )p 7.83 p

44
Consolidated income statement restatement under IFRS 15 (continued)
Adjustment As reported, year ended 31 December 2016 Discontinued operations
Impact of IFRS 15 Restated, year ended 31 December 2016
Underlying Business
exit Specific
items Total
Underlying / reclasification
to business exit
Specific items Underlying
Specific items Underlying
Business exit
Specific items Total
£m £m £m £m £m £m £m £m £m £m £m £m
Revenue A,B,C 4,897.9 11.3 — 4,909.2 (316.3 ) — (224.3 ) — 4,357.3 11.3 — 4,368.6
Cost of sales A,D (3,627.7 ) (6.7 ) (7.5 ) (3,641.9 ) 111.8 — 97.4 (34.8 ) (3,418.5 ) (6.7 ) (42.3 ) (3,467.5 )
Gross profit 1,270.2 4.6 (7.5 ) 1,267.3 (204.5 ) — (126.9 ) (34.8 ) 938.8 4.6 (42.3 ) 901.1
Administrative expenses H (728.9 ) (1.8 ) (388.3 ) (1,119.0 ) 144.5 4.3 (19.8 ) 59.4 (604.2 ) (1.8 ) (324.6 ) (930.6 )
Operating profit 541.3 2.8 (395.8 ) 148.3 (60.0 ) 4.3 (146.7 ) 24.6 334.6 2.8 (366.9 ) (29.5 )
Net finance costs (66.0 ) — (7.6 ) (73.6 ) (0.1 ) (0.1 ) — — (66.1 ) — (7.7 ) (73.8 )
Loss on disposal — 0.1 — 0.1 — — — — — 0.1 — 0.1
Profit before tax 475.3 2.9 (403.4 ) 74.8 (60.1 ) 4.2 (146.7 ) 24.6 268.5 2.9 (374.6 ) (103.2 )
Income tax expense E (87.9 ) 0.5 54.9 (32.5 ) 9.5 (0.9 ) 32.0 (3.9 ) (46.4 ) 0.5 50.1 4.2
Profit for the period from continuing operations 387.4
3.4
(348.5 ) 42.3
(50.6 ) 3.3
(114.7 ) 20.7
222.1
3.4
(324.5 ) (99.0 )
Profit for the period from discontinued operations —
—
—
—
50.6
(3.3 ) —
—
—
50.6
(3.3 ) 47.3
Total profit for the period 387.4 3.4 (348.5 ) 42.3 — — (114.7 ) 20.7 222.1 54.0 (327.8 ) (51.7 )
Attributable to: Owners of the Company 376.7 3.4 (343.2 ) 36.9 (115.5 ) 20.7 210.6 54.0 (322.5 ) (57.9 )
Non-controlling interests 10.7 — (5.3 ) 5.4 0.8 — 11.5 — (5.3 ) 6.2
387.4 3.4 (348.5 ) 42.3 (114.7 ) 20.7 222.1 54.0 (327.8 ) (51.7 )
Earnings per share Continuing operations: – basic 56.67 p 0.51 p (51.63 )p 5.55 p (7.61 )p 0.50 p (17.38 )p 3.11 p 31.68 p 0.51 p (48.02 )p (15.83 )p
– diluted 56.67 p 0.51 p (51.63 )p 5.55 p (7.61 )p 0.50 p (17.38 )p 3.11 p 31.68 p 0.51 p (48.02 )p (15.83 )p
Total operations: – basic 56.67 p 0.51 p (51.63 )p 5.55 p — p — p (17.38 )p 3.11 p 31.68 p 8.12 p (48.52 )p (8.71 )p
– diluted 56.67 p 0.51 p (51.63 )p 5.55 p — p — p (17.38 )p 3.11 p 31.68 p 8.12 p (48.52 )p (8.71 )p
Total adjustment to Total profit for the period due to the adoption of IFRS 15 is £(114.7)m to underlying + £20.7m to specific items, being £94.0m.

45
Consolidated balance sheet restatement under IFRS 15
Adjustment
As reported
1 Jan 2016
Impact of
IFRS 15
Restated
1 Jan 2016 As reported
31 Dec 2016 Impact of IFRS 15
Restated
31 Dec 2016
£m £m £m £m £m £m
Non-current assets Property, plant and equipment 406.0 — 406.0 394.7 — 394.7
Intangible assets 2,810.0 — 2,810.0 2,754.2 — 2,754.2
Contract fulfilment assets D — 277.6 277.6 — 240.6 240.6
Financial assets 186.6 — 186.6 337.6 — 337.6
Deferred taxation E 18.8 162.8 181.6 32.0 190.4 222.4
Trade and other receivables F 86.1 (41.7 ) 44.4 128.4 (79.6 ) 48.8
3,507.5 398.7 3,906.2 3,646.9 351.4 3,998.3
Current assets Financial assets 44.3 — 44.3 92.6 — 92.6
Contract fulfilment assets D — 40.4 40.4 41.6 41.6
Disposal group assets held for sale 84.1 — 84.1 — — —
Funds assets 161.7 — 161.7 173.6 — 173.6
Trade and other receivables F 1,011.9 (284.1 ) 727.8 976.0 (174.9 ) 801.1
Cash 534.0 — 534.0 1,098.3 — 1,098.3
1,836.0 (243.7 ) 1,592.3 2,340.5 (133.3 ) 2,207.2
Total assets 5,343.5 155.0 5,498.5 5,987.4 218.1 6,205.5
Current liabilities Trade and other payables G 1,144.0 (271.0 ) 873.0 1,297.6 (320.6 ) 977.0
Deferred income B,C,G — 1,157.3 1,157.3 — 1,374.9 1,374.9
Overdrafts 448.7 — 448.7 532.5 — 532.5
Financial liabilities 230.8 — 230.8 224.2 — 224.2
Disposal group liabilities held for sale 40.4 — 40.4 — — —
Funds liabilities 161.7 — 161.7 173.6 — 173.6
Provisions 69.4 — 69.4 112.5 — 112.5
Income tax payable E 46.2 — 46.2 18.6 — 18.6
2,141.2 886.3 3,027.5 2,359.0 1,054.3 3,413.3
Non-current liabilities Trade and other payables G 29.3 (15.5 ) 13.8 35.1 (14.1 ) 21.0
Deferred income B,C,G — 228.5 228.5 — 216.7 216.7
Financial liabilities 2,163.4 — 2,163.4 2,694.4 — 2,694.4
Deferred taxation E 19.0 (2.0 ) 17.0 22.1 (2.5 ) 19.6
Provisions 49.0 — 49.0 48.2 — 48.2
Employee benefits 188.3 — 188.3 345.2 — 345.2
2,449.0 211.0 2,660.0 3,145.0 200.1 3,345.1
Total liabilities 4,590.2 1,097.3 5,687.5 5,504.0 1,254.4 6,758.4
Net assets 753.3 (942.3 ) (189.0 ) 483.4 (1,036.3 ) (552.9 )
Capital and reserves Issued share capital 13.8 — 13.8 13.8 — 13.8
Share premium 500.7 — 500.7 501.3 — 501.3
Employee benefit trust and treasury shares (0.3 ) —
(0.3 ) (0.2 ) —
(0.2 )
Capital redemption reserve 1.8 — 1.8 1.8 — 1.8
Foreign currency translation reserve (21.2 ) — (21.2 ) (6.2 ) — (6.2 )
Cash flow hedging reserve (12.0 ) — (12.0 ) — — —
Retained earnings 196.5 (934.7 ) (738.2 ) (102.3 ) (1,029.3 ) (1,131.6 )
Equity attributable to
owners of the Company 679.3
(934.7 ) (255.4 ) 408.2
(1,029.3 ) (621.1 )
Non-controlling interests 74.0 (7.6 ) 66.4 75.2 (7.0 ) 68.2
Total equity 753.3 (942.3 ) (189.0 ) 483.4 (1,036.3 ) (552.9 )
46
Consolidated cash flow statement restatement under IFRS 15 As a result of the adoption of IFRS 15, certain reclassifications are required in relation to the following cash flow movements
between relevant balance sheet accounts. There has been no change in the net cash generated from operations as a result of
these reclassifications or restatement of these balance sheet accounts:
• As identified in adjustment H (below), in 2016, the Group recognised a write down of accrued income in underlying profit
and specific items in relation to certain long term service contracts. Under IFRS 15 this accrued income would not have
been originally recognised and hence has been reversed out of the income statement on adoption of IFRS 15.
Movements in the operating cash flow note reflect the reversal of this non-cash movement;
• As identified in adjustment D (below), the Group has recognised new contract fulfilment assets on adoption of IFRS 15
from 1 January 2016 with amortisation and impairment expenses recorded through the income statement in the six
months ended 30 June 2016 and year ended 31 December 2016. Movements in the operating cash flow note reflect
these non-cash movements recorded in the income statement; and
• As identified in adjustments D, B and C, on transition to IFRS 15 as at 1 January 2016, the Group has recognised
contract fulfilment assets and restated the accrued income and deferred revenue accounts recorded in the balance
sheet. Movements in the operating cash flow note reflect the relevant cash and non-cash movements in reclassified line
items.
Consolidated statement of changes in equity restatement under IFRS 15 No reconciliation of the restated consolidated statement of changes in equity is presented as the only changes to this primary
statement for the relevant period presented are as follows:
• Consolidated statement of changes in equity as at 1 January 2016: recognition of the restated retained earnings
figure as presented in the restated consolidated balance sheet as at this date.
• Consolidated statement of changes in equity as at 30 June 2016: recognition of the restated profit for the six month
period ended 30 June 2016 as presented in the restated consolidated income statement for this period.
• Consolidated statement of changes in equity as at 31 December 2016: recognition of the restated profit for the year
ended 31 December 2016 as presented in the restated consolidated income statement for this year.

47
Notes to the financial statements restatement under IFRS 15
Management has undertaken an extensive exercise to consider the Group's major contractual arrangements as part of the
implementation of IFRS 15. A number of significant areas have been identified for adjustment which include:
• Recognition of revenue by the Group as agent or principal (Adjustment A);
• Accounting for software licences (Adjustment B);
• Recognition of profit from service contracts over time in line with the output method (Adjustment C);
• Recognition, utilisation and derecognition of contract fulfilment assets (Adjustment D);
• Impact on tax balances as a result of adoption of IFRS 15 (Adjustment E);
• Decrease in trade and other receivables (Adjustment F);
• Reclassification of trade and other payables (Adjustment G);
• Reversal of prior period accrued income impairment within specific items (Adjustment H); and
• Reclassification of significant restructuring costs to underlying (Adjustment I).
These adjustments are discussed in the relevant sections below.
Under IFRS 15, the pattern and timing of revenue recognition has changed resulting in an overall decrease of £126.8m in
revenue for the 6 months ended 30 June 2016 (year ended 31 December 2016: £224.3m), increase in deferred income of
£1,099.3m at the 1 January 2016 opening balance sheet date (31 December 2016: £1,256.9m) and decrease in accrued income
of £325.8m at the 1 January 2016 opening balance sheet date (31 December 2016: £254.5m).
Table 1 on the following page reconciles the movements in relation to IFRS 15 for the income statement for the six months ended
30 June 2016 and the year ended 31 December 2016 and the balance sheet as at 1 January 2016 and as at 31 December 2016.
Table 2 provides further detail on the reconciling movements for the income statement for the year ended 31 December 2016.
Following the tables are explanatory notes for each of the adjustments referred to above.

48
The table below reconciles movements in relation to IFRS 15 for the income statement for the six months ended 30 June 2016 and the year ended 31 December 2016 and the balance sheet
as at 1 January 2016 and as at 31 December 2016. Refer to below the tables for explanatory notes on each of the adjustments.
Table 1: Consolidated income statement for the six months ended 30 June 2016
Adjustment
to net assets at 1
January 2016
Underlying Specific items
Profit for the period
Trade and other
receivables Deferred income Trade and other
payables Contract fulfilment
asset Deferred tax Adjustment
to net liabilities at
31 December
2016 Adjustment Revenue
Cost of sales
Admin expenses Tax
Cost of sales
Admin expenses Tax
Non-current Current Current
Non-current Current
Non-current
Non-current Current Asset Liability
£m £m £m £m £m £m £m £m £m £m £m £m £m £m £m £m £m £m £m £m
A - Agent vs. principal — 0.7 (0.7 ) — — — — — —
B - Software licences (163.2 ) (7.2 ) — — — — — — (7.2 )
C - Recognition in line with output (1,214.8 ) (120.3 ) —
—
—
—
—
—
(120.3 )
D - Recognition of non-current contract fulfilment assets 214.7
—
(3.7 ) —
—
—
—
—
(3.7 )
D - Recognition of software contract fulfilment assets 62.9
—
1.7
—
—
—
—
—
1.7
D - Recognition of current contract fulfilment assets 40.4
—
5.8
—
—
—
—
—
5.8
E - Tax 164.8 — — — 27.4 — — — 27.4
H - Reversal of accrued income impairment (47.1 ) —
—
—
—
—
—
—
—
I - Reclassification of significant restructuring —
—
—
—
—
—
—
—
—
Total (942.3 ) (126.8 ) 3.1 — 27.4 — — — (96.3 )
Consolidated income statement for the year ended 31 December 2016 Consolidated balance sheet for the year ended 31 December 2016
A - Agent vs. principal — (90.9 ) 90.9 — — — — — — — — — — — — — — — — —
B - Software licences (163.2 ) (15.3 ) — — — — — — (15.3 ) — — (104.8 ) (73.7 ) — — — — — — (178.5 )
C - Recognition in line with output (1,214.8 ) (118.1 ) — — — — — — (118.1 ) (79.6 ) (174.9 ) (949.5 ) (128.9 ) — — — — — — (1,332.9 )
D - Recognition of non-current contract fulfilment assets 214.7
—
(0.6 ) —
—
(42.3 ) —
—
(42.9 ) —
—
—
—
—
—
171.8
—
—
—
171.8
D - Recognition of software contract fulfilment assets 62.9
—
5.9
—
—
—
—
—
5.9
—
—
—
—
—
—
68.8
—
—
—
68.8
D - Recognition of current contract fulfilment assets 40.4
—
1.2
—
—
—
—
—
1.2
—
—
—
—
—
—
—
41.6
—
—
41.6
E - Tax 164.8 — — — 32.0 — — (3.9 ) 28.1 — — — — — — — — 190.4 2.5 192.9
G - Reclassification of trade and other payables —
—
—
—
—
—
—
—
—
—
—
(320.6 ) (14.1 ) 320.6
14.1
—
—
—
—
—
H - Reversal of accrued income impairment (47.1 ) —
—
39.6
—
7.5
—
—
47.1
—
—
—
—
—
—
—
—
—
—
—
I - Reclassification of significant restructuring —
—
—
(59.4 ) —
—
59.4
—
—
—
—
—
—
—
—
—
—
—
—
—
Total (942.3 ) (224.3 ) 97.4 (19.8 ) 32.0 (34.8 ) 59.4 (3.9 ) (94.0 ) (79.6 ) (174.9 ) (1,374.9 ) (216.7 ) 320.6 14.1 240.6 41.6 190.4 2.5 (1,036.3 )

49
The table below provides further detail on the reconciling movements for the income statement for the year ended 31 December 2016. Refer to below the table for explanatory notes in
respect of each adjustment.
Table 2: Consolidated income statement for the year ended 31 December 2016
Adjustment As reported Discontinued
operations
As reported - continuing operations
Adjustments: from pre 1 Jan 16 and
recognised in 2016
Adjustments: previously recognised
in 2016 now spread forward Reclassifications Restated
£m £m £m £m £m £m £m
Agent vs. Principal A - — — (90.9 ) Software revenue from pre 1 Jan 16 and recognised in 2016 B - 100.0 — — Software revenue previously recognised in 2016 now spread forward B - — (115.3 ) — Recognition in line with output from pre 1 Jan 16 and recognised in 2016 C - 1,096.6 — — Recognition in line with output previously recognised in 2016 now spread forward C - — (1,214.7 ) — Underlying Revenue 4,897.9 (316.3 ) 4,581.6 1,196.6 (1,330.0 ) (90.9 ) 4,357.3
Agent vs. Principal A - - - — — 90.9 Non-current contract fulfilment asset utilisation in 2016 D - - - (47.1 ) — — Non-current contract fulfilment asset disposals in 2016 D - - - (17.0 ) — — Non-current contract fulfilment asset additions in 2016 D - - - — 63.5 — Software contract fulfilment asset utilisation in 2016 D - - - (7.1 ) — — Software contract fulfilment asset additions in 2016 D - - - — 13.0 — Completion of point in time performance obligations D - - - (40.4 ) — — Costs deferred to future point in time performance obligations D - - - — 41.6 — Underlying cost of sales (3,627.7 ) 111.8 (3,515.9 ) (111.6 ) 118.1 90.9 (3,418.5 )
Reversal of accrued income impairment H 39.6 — — Reclassification of 2016 group restructuring to underlying from specific items I — — (59.4 ) Underlying admin expenses (728.9 ) 144.5 (584.4 ) 39.6 — (59.4 ) (604.2 )
Underlying operating profit 541.3 (60.0 ) 481.3 1,124.6 (1,211.9 ) (59.4 ) 334.6
Underlying profit before tax 475.3 (60.1 ) 415.2 1,124.6 (1,211.9 ) (59.4 ) 268.5
Specific items - contract fulfilment asset disposal D — — — (42.3 ) — Specific items - reversal of accrued income impairment H — — — 7.5 — — Specific items cost of sales (7.5 ) — (7.5 ) (34.8 ) — — (42.3 )
Reclassification of 2016 group restructuring to underlying from specific items I — — — — — 59.4 Specific Items admin expenses (388.3 ) 4.3 (384.0 ) — — 59.4 (324.6 )
Specific items profit before tax (403.4 ) 4.2 (399.2 ) (34.8 ) — 59.4 (374.6 )
Profit before tax 74.8 (55.9 ) 18.9 1,089.8 (1,211.9 ) — (103.2 )

50
Adjustment A - Accounting for agent vs. principal
The previous agent vs. principal guidance contained in IAS 18 has been revisited by the Group in light of the revised guidance
under IFRS 15 in assessing whether it acts as an agent or as a principal in its major contractual arrangements.
As a result of this assessment, the Group concluded that for certain contracts it is appropriate to move from principal to agency
accounting or vice versa. In respect to moving from principal to agency, this related to certain software sales arrangements as the
Group has concluded that the Group does not control the good or service being provided to the customer. As a result, there is a
net adjustment of £0.7m to increase revenue and cost of sales for the 6 months period ended 30 June 2016, and of £90.9m to
reduce revenue and cost of sales for the year ended 31 December 2016.
Adjustment B - Accounting for software licences
Under previous accounting, revenue in relation to certain software licences was recognised at a point in time. Under IFRS 15, the
Group has determined that a number of these arrangements result in the customer having the right to access the licence (an
‘active’ licence) rather than having the right to use the licence (a ‘passive’ licence). Under an active licence the ongoing support
and upgrades are fundamental to the ongoing use of the licences by the customer.
Hence total revenue for the licence and upgrades are combined with these revenues now recognised over the term of the
customer contract rather than at a point in time resulting in a net decrease in accrued/deferred income at 1 January 2016 of
£163.2m, 31 December 2016: £178.5m; and a net decrease in revenue in the six months ended 30 June 2016 of £7.2m and in
the year ended 31 December 2016 of £15.3m.
For the year ended 31 December 2016 the net decrease in revenue comprises the recognition of £100.0m of revenue from pre 1
January 2016 and the deferral of £115.3m of revenue previously recognised in 2016.
Adjustment C - Revenue recognition in line with output
Under the previous accounting, revenue for certain contracts was recognised under the percentage of completion method based
upon costs incurred to date as a proportion of the estimated full cost of completing the contract, and applying the percentage to
the total revenue expected to be earned. Such percentage of completion accounting would typically result in higher levels of
revenue recognised in the earlier stages of a contract in line with the profile of costs incurred.
Under IFRS 15, all elements of the contract, including transformation activity, are combined. Due to the application of the series
guidance and output methodology within IFRS 15, these contracts now have revenue recognised in line with their output
measured on a contract specific basis.
As such, revenue is now spread over the expected life of the contract rather than in line with the costs profile, which has resulted
in a reduction in revenue recognised in periods prior to 1 January 2016 and a net increase in deferred/accrued income as at 1
January 2016 of £1,214.8m, as at 31 December 2016: £1,332.9m; and a decrease in opening retained earnings as at 1 January
2016 of £1,214.8m, a decrease in revenue in the six months ended 30 June 2016 of £120.3m, and year ended 31 December
2016 of £118.1m.
For the year ended 31 December 2016 the net decrease in revenue comprises the recognition of £1,096.6m of revenue from pre
1 January 2016 and the deferral of £1,214.7m of revenue previously recognised in 2016.
Adjustment D - Recognition, utilisation and derecognition of contract fulfilment assets
IFRS 15 specifies that certain costs to fulfil a contract are to be capitalised as contract fulfilment assets if relevant criteria are met.
The Group incurred costs that were previously expensed and which related to resources to allow it to deliver services under its
long term contracts and active software licence arrangements. In certain situations, costs associated with the installation of
certain IT equipment in contracts have also been capitalised as contract fulfilment assets.
The adjustments to recognise contract fulfilment assets on the balance sheet as at 1 January 2016 of £318.0m recognises the net
book value of the identified contract fulfilment assets at the opening balance sheet date.
These adjustments also include the recognition of certain costs of obtaining a contract. IFRS 15 specifies that the incremental
costs of obtaining a contract with a customer are capitalised if the entity expects to recover them.
The cost of utilising these assets is recognised within cost of sales on a consistent basis over the life of the relevant customer
contract.
The adjustment of £3.8m for the 6 months period ended 30 June 2016 (year ended 31 December 2016: £6.5m) is to recognise a
net decrease in cost of sales due to the de-recognition of contract costs now capitalised as contract fulfilment assets net of the
utilisation charge recorded for the period in relation to these assets and the de-recognition of certain contract fulfilment assets.
For the year ended 31 December 2016, the above net adjustment of £6.5m comprises: non-current contract fulfilment additions of
£63.5m, utilisation of £47.1m, and disposals of £17.0m; software contract fulfilment additions of £13.0m, and utilisation of £7.1m;
and current contract fulfilment additions of £41.6m, and utilisation of £40.4m.

51
Specific item
As disclosed in the 31 December 2016 financial statements, Capita ceased to work on the IT system transformation in respect of
its contract with The Co-operative Bank plc. Under IFRS 15 this modification has led to an impairment of a contract fulfilment
asset in respect of this contract as these costs were no longer considered recoverable.
The adjustment of £42.3m in the year ended 31 December 2016 recognises the charge incurred on derecognising this contract
fulfilment asset. This item has been included within the other non-underlying column because it is one-off in nature and is due to a
contractual dispute rather than arising as a result of service credit penalties
Adjustment E - Tax
Due to the changes in assets, liabilities, income and expenses recognised as a result of the application of IFRS 15, there are
consequent IAS 12 Income taxes differences that arise as discussed below.
Deferred tax
Due to the changes in the pattern and timing of revenue recognition under IFRS 15, a deferred income liability is recognised on
the balance sheet from 1 January 2016, which will be recognised through the income statement in later periods. The impact of
these revenue recognition changes is only recognised for tax purposes via a one-off transitional tax adjustment on 1 January
2017, so no tax deduction is available in 2016 for the reduction in historic revenue recognised.
Contract fulfilment assets have also been recognised on the balance sheet from 1 January 2016, which will be charged to the
income statement in later periods. Under IAS 12, the tax base of an asset is the amount that will be deductible for tax purposes
against any taxable economic benefits that will flow to an entity when it recovers the carrying amount of the asset. The tax base of
the contract fulfilment asset recognised on the balance sheet prior to 1 January 2017 is therefore reduced by the amounts for
which tax deductions have already been taken, creating a temporary difference.
Under the principles of IAS 12, a movement of £164.8m in deferred tax therefore arises, recognised as an increase in the
deferred tax asset of £162.8m and a reduction in the deferred tax liability of £2.0m as at 1 January 2016 (31 December 2016:
£192.9m movement, increase in deferred tax asset of £190.4m, and reduction in deferred tax liability of £2.5m) as a result of the
transition to IFRS 15.
Income statement deferred tax credit
The deferred tax asset balance increase of £190.4m and the deferred tax liability decrease of £2.5m as at 31 December 2016,
give rise to an income statement deferred tax credit of £27.4m for the 6 month period to 30 June 2016 and of £28.1m for the year
ended 31 December 2016.
Income statement current tax expense
There is no income statement current tax expense impact for the 6 months ended 30 June 2016 or the year ended 31 December
2016.
Adjustment F - decrease in trade and other receivables
The decrease in trade and other receivables relates to the restatement of accrued revenues as detailed in Adjustments B and C
above. The decrease in non-current accrued income is £41.7m as at 1 January 2016, and £79.6m at 31 December 2016, and the
decrease in current accrued income is £284.1m and £174.9m at 31 December 2016.
Adjustment G - Reclassification of trade and other payables
In order to provide users with relevant financial information in the primary financial statements, the Group has decided to
reclassify deferred income into its own primary statement line item reflecting the materiality and nature of this balance in the
context of the Group’s business.
The decrease in trade and other payables relates to the reclassification and restatement of deferred income as discussed above.
Prior to adoption of IFRS 15, deferred income was classified within ‘Trade and other payables’ although this was not accounted
for as a financial liability.
Adjustment H - Reversal of accrued income impairments
In 2016, the Group recognised an impairment of £47.1m historic accrued income, of which £39.6m was recognised in underlying
profit, and £7.5m within the specific items column in relation to the dispute with The Co-operative Bank plc. Under IFRS 15 this
accrued income would not have been originally recognised as the timing of revenue recognition has changed in comparison to the
previous accounting policy as discussed in Adjustment C above, hence the adjustment of £47.1m for the year ended 31
December 2016 recognises the reversal of these previous impairments.
Adjustment I - Reclassification of significant restructuring
Following the adoption of IFRS 15, the Board has adopted a policy to separately disclose the in year operating profit/loss from
significant new contract wins and related, or significant, restructuring ("Significant new contract wins and restructuring") within

52
underlying results, in order for users of the financial statements to obtain a proper understanding of the financial information and
the performance of the business.
The Group continually assesses the resourcing levels, both at a divisional level and also in relation to the management and
delivery of individual contracts. This results in restructuring in the normal course of business and any such charges are recorded
in "underlying before significant new contract wins and restructuring" results. A significant restructuring is assessed as that above
this normal level of restructuring.
In the year ended 31 December 2016, the Board announced a major programme, with the restructuring of the Group into 6 new
reporting divisions under a Group-wide programme. The cost of this Group-wide programme, £59.4m, was charged to specific
items, being the element above the normal level of restructuring undertaken by the Group. Following the adoption of the above
policy, the 2016 income statement has been restated to reclassify the cost of this programme to 'Significant new contract wins
and restructuring' within underlying.