21, rue d’Artois, F-75008 PARIS C1-303 CIGRE 2012 http ... · PDF filehigher need of...
8
[email protected] Dynamic Compensation of Reactive Power by Variable Shunt Reactors; - Control Strategies and Algorithms C. BENGTSSON* Z. GAJIC M. KHORAMI ABB AB, Transformers ABB AB, SA Products ABB AB, SA Products Ludvika/Sweden Västerås/Sweden Västerås/Sweden SUMMARY There are two main reasons for compensation of reactive power. First, stability reasons especially on long transmission lines and cables (EHV and HV lines/cables); and second, for the purpose of voltage control. Shunt reactors are widely used in order to compensate for capacitive charging of the transmission lines. A Variable Shunt Reactor (VSR) is a shunt reactor where the inductance can be varied in steps. The reactive power consumption of a VSR can increase up to twice its initial value over the whole regulating range. Generally, when there is a slow variation of the load the VSR works as an efficient reactive power compensator in order to fine tune the voltage in the system. VSRs provide dynamic reactive power compensation with the regulation range around 100% (e.g. 50-100 MVAr) and ratings up to 250 MVAr, 500 kV [1]. The market interest in Variable Shunt Reactors is steadily increasing and from a manufacturer’s perspective, tender requests for VSRs become more frequent. Although a few VSRs have been in service for several years and such application is not new, it is within the last years that utilities and network planners have become more interested in this option. With increasing market interest in the application of VSRs, the control strategy of VSRs has become an important issue. This paper discusses a possible control strategy of tap-change Variable Shunt Reactors in order to control the voltage level during different load conditions. The operation of a VSR under various network conditions has been simulated and changes in different parameters of the network have been observed. The study includes investigations of the voltage behaviour after running load flow simulations, and results in the formulation of a control strategy of the VSR through modelling and simulation. In order to find an intelligent and accurate tap changing process, various practical issues have been taken into account and several simulations have been done. It is concluded that a combination of both reactive power and voltage can provide an effective and robust control strategy for VSRs. To implement this new strategy, several simulation studies have been done and corresponding parameters have been determined. Finally, the robustness of the proposed control signal has been demonstrated. KEYWORDS Variable Shunt Reactor - Reactive power balance - Voltage stability - Voltage control - Tap changer – Simulation - Load Flow 21, rue d’Artois, F-75008 PARIS C1-303 CIGRE 2012 http : //www.cigre.org
Transcript of 21, rue d’Artois, F-75008 PARIS C1-303 CIGRE 2012 http ... · PDF filehigher need of...

Dynamic Compensation of Reactive Power by Variable Shunt Reactors; - Control Strategies and Algorithms
C. BENGTSSON* Z. GAJIC M. KHORAMI
ABB AB, Transformers ABB AB, SA Products ABB AB, SA Products Ludvika/Sweden Västerås/Sweden Västerås/Sweden
SUMMARY
There are two main reasons for compensation of reactive power. First, stability reasons especially on long transmission lines and cables (EHV and HV lines/cables); and second, for the purpose of voltage control. Shunt reactors are widely used in order to compensate for capacitive charging of the transmission lines. A Variable Shunt Reactor (VSR) is a shunt reactor where the inductance can be varied in steps. The reactive power consumption of a VSR can increase up to twice its initial value over the whole regulating range. Generally, when there is a slow variation of the load the VSR works as an efficient reactive power compensator in order to fine tune the voltage in the system. VSRs provide dynamic reactive power compensation with the regulation range around 100% (e.g. 50-100 MVAr) and ratings up to 250 MVAr, 500 kV [1].
The market interest in Variable Shunt Reactors is steadily increasing and from a manufacturer’s perspective, tender requests for VSRs become more frequent. Although a few VSRs have been in service for several years and such application is not new, it is within the last years that utilities and network planners have become more interested in this option. With increasing market interest in the application of VSRs, the control strategy of VSRs has become an important issue.
This paper discusses a possible control strategy of tap-change Variable Shunt Reactors in order to control the voltage level during different load conditions. The operation of a VSR under various network conditions has been simulated and changes in different parameters of the network have been observed. The study includes investigations of the voltage behaviour after running load flow simulations, and results in the formulation of a control strategy of the VSR through modelling and simulation.
In order to find an intelligent and accurate tap changing process, various practical issues have been taken into account and several simulations have been done. It is concluded that a combination of both reactive power and voltage can provide an effective and robust control strategy for VSRs. To implement this new strategy, several simulation studies have been done and corresponding parameters have been determined. Finally, the robustness of the proposed control signal has been demonstrated.
KEYWORDS Variable Shunt Reactor - Reactive power balance - Voltage stability - Voltage control - Tap changer – Simulation - Load Flow
21, rue d’Artois, F-75008 PARIS C1-303 CIGRE 2012 http : //www.cigre.org

1
1. INTRODUCTION
The voltage level along an AC transmission line is influenced by two main factors; the capacitive charging and the loading of the line. The capacitive charging, which is the source of reactive power generation (QC), depends on the line geometry and the line voltage level; and arises because of the capacitance between its conductors and the earth. On the other hand, when the line is loaded, both the load and the line consume reactive power (QL) as inductive electrical elements [2]. Reactive power consumption depends on loading of the line. In an AC transmission system, it is important to keep the balance between generated and consumed reactive power since it is the reactive power balance which decides the voltage stability of the line [3].
In order to achieve the reactive power balance, the line should be loaded at its natural load (SIL) where the generation and consumption of reactive power along the line are equal. When the load varies in the system, the consumption of reactive power changes, and consequently the voltage fluctuates along the line. If the generated reactive power is more than the consumed reactive power, the voltage increases, whereas the voltage decreases if the consumption is more than generation of reactive power [4], [5].
Shunt Reactors are widely used in transmission and distribution networks. They absorb (consume) reactive power by connecting them to the transmission line. Since they decrease the voltage level, they are typically used during light load conditions. Although reactors reduce over voltages during light load conditions, they can also reduce the line loadability if they are not removed under full-load condition [1].
In some applications there is a need to vary the inductive reactive power consumption in steps. In such a case, several shunt reactor units are needed to connect and disconnect frequently which requires more circuit breakers and foot prints at substation. Instead of having several units, one unit that covers the entire power range could be an economical solution [6].
2. VSR DESIGN General A Variable Shunt Reactor (VSR) is a reactor where the inductance can be varied in steps, typically by a factor of two. The speed of regulation is in the order of seconds per step as determined by the operation time of the tap changers used [1].
Compared to shunt reactors with a fixed rating, Variable Shunt Reactors provide several benefits to the operators. The dip in the voltage that occurs when the shunt reactor is switched into the network can be reduced by tuning of the reactor. It will also provide a possibility to reduce the number of circuit breakers by replacing several fixed reactors by one variable and thereby also reducing the needed foot print. The variable shunt reactor makes it also simpler to compensate for the voltage variations depending on load variations during summer/winter and day/night. In addition, other benefits exist such as increased flexibility to move reactors to different positions in the network. One example of applications for VSRs is for wind power energy where the generated power as well as the reactive power exchange varies with wind conditions [7]. Due to new added generation, the system requirements on the existing grid will change and new transmission lines (or cables with an even higher need of reactive power compensation) may have to be constructed, or existing ones will be upgraded. Variable Shunt Reactors become an interesting alternative to stabilise the system voltage.
Design Aspects Regulated shunt reactors are based on the same concept as a standard shunt reactor. Nevertheless, the design requires special attention and the regulated shunt reactor should be regarded as a separate product type [1]. To be able to regulate the power in the shunt reactor a separate regulating winding or windings is used. This winding is located outside the main winding around the core limb. The High Voltage (HV) inlet to the main winding could either be located as a yoke entrance or as a centre entrance to the winding. High voltage centre entry design is normally used.
Maximum reactive power injection is achieved when minimum number of electrical turns is connected and vice versa. When using plus/minus regulation the highest current flows when all turns (highest resistance) are connected. The reactor will get higher losses. This is especially valid for large power
2
rated regulated shunt reactors. A so-called coarse/fine regulation consists of two physical regulating windings in comparison with plus/minus that only use one physical winding. At maximum power minimum number of turns is achieved when the whole regulating arrangement is disconnected. Minimum resistance in the reactor winding at highest current will give much lower losses than for plus/minus regulation. Therefore, at high loss evaluations and voltages equal or less than 400 kV a yoke entry with a coarse/fine regulation is normally used. At low loss evaluations, plus/minus regulation is an alternative. At voltages higher than 400 kV a centre entry solution with a plus/minus regulation should be chosen [3].
The design and selection of the tap changer has impact on the shunt reactor application and must be carefully considered in the design. Especially due to the long electrical length of the regulation, the leakage flux inductance in the regulating circuit could reduce the available valid step power and step voltage for the tap changer [6].
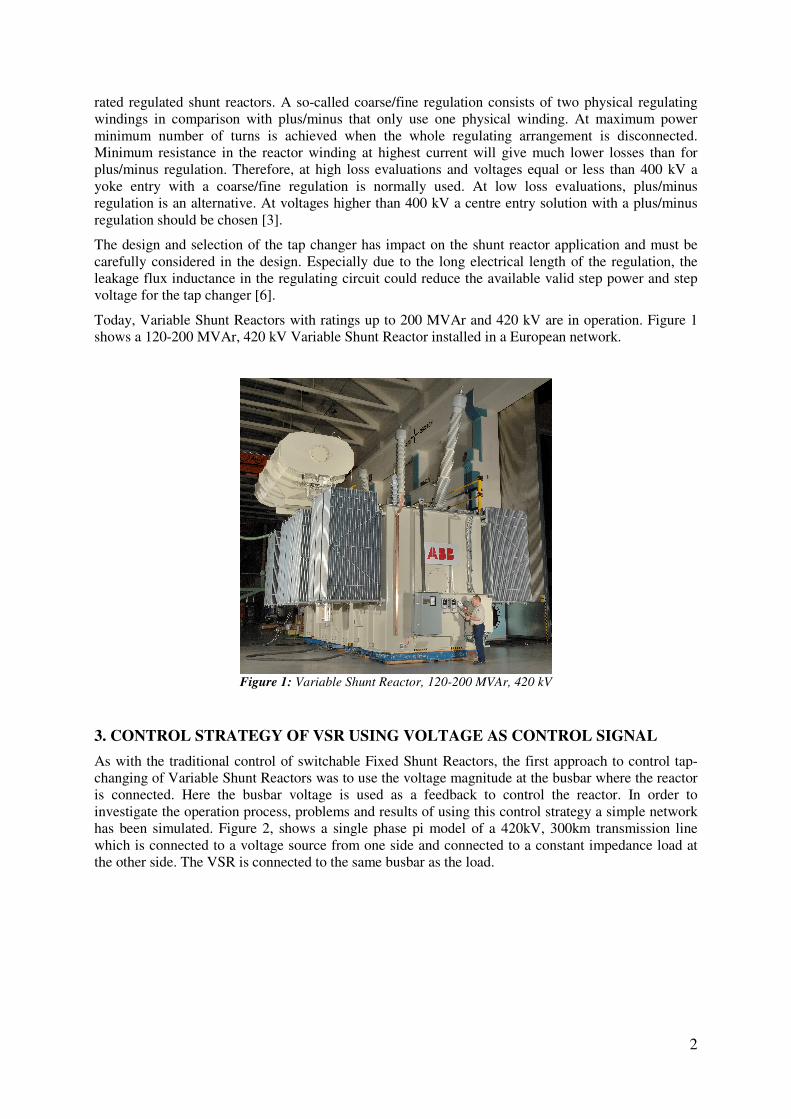
Today, Variable Shunt Reactors with ratings up to 200 MVAr and 420 kV are in operation. Figure 1 shows a 120-200 MVAr, 420 kV Variable Shunt Reactor installed in a European network.
Figure 1: Variable Shunt Reactor, 120-200 MVAr, 420 kV
3. CONTROL STRATEGY OF VSR USING VOLTAGE AS CONTROL SIGNAL As with the traditional control of switchable Fixed Shunt Reactors, the first approach to control tap-changing of Variable Shunt Reactors was to use the voltage magnitude at the busbar where the reactor is connected. Here the busbar voltage is used as a feedback to control the reactor. In order to investigate the operation process, problems and results of using this control strategy a simple network has been simulated. Figure 2, shows a single phase pi model of a 420kV, 300km transmission line which is connected to a voltage source from one side and connected to a constant impedance load at the other side. The VSR is connected to the same busbar as the load.

3
Figure 2: The Single Phase pi model of 300 km 420kV transmission line
Table I, indicates source and line parameters of this simple network. These parameters are taken from an existing transmission network. According to these parameters, the SIL level of this line is about 194MW.
Table I: The parameters of the simple simulated network
Source Parameters Line Parameters
Vs 242.5 kV rms/ph Length 300 km
fs 50 Hz RL 0.02 �/ph.km Rs 2.645 � XL 0.31 �/ph.km Ls 70.2e-03 H b 3.37 µs/ph.km
Figure 3, shows the voltage signal changes during the operation of On Load Tap Changer (OLTC). In this figure, each voltage step is corresponding to one tap of OLTC. These small changes are referred as “signal step size” further in this text.
Figure 3: The voltage steps during simulated tap-change VSR operation
In conclusion, the VSR is working properly when using the voltage as the Control Signal. However, the voltage steps are small and in the range of 0.3kV – 0.43kV (i.e. 0.12% - 0.17% of the reference voltage) which are so small that they can barely be detected by the IED (Intelligent Electronic

4
Device). In practice, considering the measurement devices errors and noise, the control relay cannot detect such small changes in voltage which is a problem to obtain accurate tap-changer control [8].
4. CONTROL STRATEGY OF VSR USING COMBINATION OF VOLTAGE AND REACTIVE POWER AS CONTROL SIGNAL A more robust control signal is hence needed in order to have more precise tap changing process.
In order to achieve this for different network conditions, it is favourable to take advantage of both voltage and reactive power to control the VSR tap changing process. To make a new Control Signal, which comprises both voltage and reactive power, one approach is to add up voltage and reactive power balance and make a new Control Signal. However, since the reactive signal variation is a couple of thousand times greater than the voltage signal variation, the contribution of voltage will be neglected. For this reason, both signals should have comparable values and have same dimensions. On the other hand, due to practical issues regarding measuring and calculation of reactive power consumption on the line, to make the control strategy insensitive to the remained reactive power unbalance value (Residual Reactive Power), it is desired to reduce the contribution of this reactive signal by making it smaller as much as possible.
In order to choose a factor to scale down the reactive power contribution, some considerations should be taken. First, the dimension of this factor should be Volts/VAr in order to make the final dimension as Volts. Second, as this factor has a direct effect on the signal’s step size, it should be proportional to the voltage regulating range (e.g. ±2% of reference voltage). Third, it is a reasonable decision to use the rated reactive power of each VSR step (approx. 2.5MVAr for this particular VSR design) to make this signal relatively small and make the desired dimension. As a result, factor K is defined as follows:
(1)
Where, Vref is the single phase reference voltage for a 420kV voltage level and is equal to 242.5kV.
Consequently, the final combined control signal would be as follows:
(2)
Where, VBusbar is the voltage magnitude at the busbar which is intended for regulation, QC2 is the capacitive reactive power generated by the respective equivalent line capacitance at the load side (C2), QI is the inductive reactive power consumed by the equivalent line inductance (L), and QIR is the inductive reactive power consumed by VSR itself. K1 and K2 are setting parameters which change the influence of the respective contributions of capacitive and inductive reactive powers of the line.
In a real network there are always a percentage of the target line which should be taken into account in the reactive power balance equation, i.e. the VSR is intended to compensate for a part of the line’s generated capacitive reactive power according to the network topology. It is assumed that in the pi model, the equivalent line capacitance which is closer to the busbar (C2) has more contribution on reactive power balance and voltage stability on that busbar. QC2 is calculated from capacitance of the line (C2) and the voltage level (V), while QI is calculated based on line inductance (L) and current flowing in the line (IL).
As can be inferred from expression (2), this new combined control signal has the contribution of both voltage and reactive power.
There is a correlation between different K values and signal’s step sizes which needs a trade-off between these two in order to find the optimal K value. For this reason, several simulations with different K factors have been done. Table II indicates the results of all these experiments for each load level. The results from pure voltage control strategy have been repeated in every part of the table which makes it easier to compare the results.

5
Table II: The comparison between the results of pure voltage control and combined voltage and reactive power control strategy with different K values
MW MVAR K1=1 K2=1 K1=1 K2=1 K1=1 K2=1 K1=1 K2=1
1 0,5 0.16% 0.23%
0.17% 0.27%
0.19% 0.29%
0.21% 0.31%
10 5 0.16% 0.21%
0.14% 0.24%
0.16% 0.27%
0.17% 0.29%
20 10 0.16% 0.21%
0.16% 0.23%
0.16% 0.25%
0.17% 0.28%
30 15 0.16%0.14% 0.23%
0.15% 0.25%
0.17% 0.27%
40 20 0.15%0.16% 0.18%
0.18% 0.20%
45 22,5
50 25
33 33 33 33
33 33 33 33
17
25 24 23 22
33 32 30 29
6 7 7 8
VS
R Tap P
osition
11 11 11 12
18
V-Q Control ±2% Signal Step Size
V-Q Control ±2% Signal Step Size
��������������� ��2% K= 2.5%*(0.002) K= 5%*(0.002) K= 7.5%*(0.002) K= 10%*(0.002)
33
33
26
33
18 17 17
6
11
V-Q Control ±2% Load Pure Voltage Control Signal Step Size
V-Q Control ±2% Signal Step Size
MW MVAR K1=1 K2=1 K1=1 K2=1 K1=1 K2=1 K1=1 K2=1
1 0,5 0.22% 0.34%
0.20% 0.36%
0.22% 0.37%
0.24% 0.41%
10 5 0.19% 0.31%
0.23% 0.33%
0.22% 0.36%
0.27% 0.39%
20 10 0.18% 0.30%
0.20% 0.33%
0.22% 0.35%
0.23% 0.38%
30 15 0.18% 0.30%
0.19% 0.32%
0.21% 0.34%
0.22% 0.36%
40 20 0.20% 0.22%
0.22% 0.24%
0.23% 0.27%
0.26% 0.29%
45 22,5 0.20% 0.22% 0.23%
0.23% 0.25%
0.25% 0.26%
50 25 0.25%
32 31 30 29
33 33 33 32
16
22 21 21 20
28 27 26 26
8 8 8 9
VS
R Tap P
osition
12 12 12 12
16
V-Q Control ±2% Signal Step Size
V-Q Control ±2% Signal Step Size
��������������� ��2% K= 12.5%*(0.002) K= 15%*(0.002) K= 17.5%*(0.002) K= 20%*(0.002)
33
33
26
33
18 16 16
6
11
V-Q Control ±2% Load Pure Voltage Control Signal Step Size
V-Q Control ±2% Signal Step Size
MW MVAR K1=1 K2=1 K1=1 K2=1 K1=1 K2=1 K1=1 K2=1
1 0,5 0.25% 0.44%
0.27% 0.46%
0.28% 0.50%
0.30% 0.52%
10 5 0.25% 0.41%
0.27% 0.45%
0.27% 0.47%
0.29% 0.50%
20 10 0.24% 0.40%
0.26% 0.42%
0.27% 0.45%
0.28% 0.48%
30 15 0.24% 0.39%
0.25% 0.42%
0.26% 0.44%
0.28% 0.45%
40 20 0.23% 0.31%
0.24% 0.33%
0.26% 0.42%
0.27% 0.45%
45 22,5 0.26% 0.27%
0.28% 0.30%
0.29% 0.33%
0.32% 0.34%
50 25 0.26% 0.27% 0.28%
0.29% 0.31%
0.31% 0.32%
28 28 27 27
32 31 30 30
15
20 20 20 19
25 25 24 24
9 9 9 9
VS
R Tap P
osition
12 12 12 12
16
V-Q Control ±2% Signal Step Size
V-Q Control ±2% Signal Step Size
��������������� ��2% K= 22.5%*(0.002) K= 25%*(0.002) K= 27.5%*(0.002) K= 30%*(0.002)
33
33
26
33
18 15 15
6
11
V-Q Control ±2% Load Pure Voltage Control Signal Step Size
V-Q Control ±2% Signal Step Size
MW MVAR K1=1 K2=1 K1=1 K2=1 K1=1 K2=1
1 0,5 0.36% 0.61%
0.6% 1.02%
0.84% 1.2%
10 5 0.36% 0.59%
0.58% 1%
0.7% 1.2%
20 10 0.35% 0.56%
0.58% 0.96%
0.69% 1.12%
30 15 0.33% 0.55%
0.56% 0.93%
0.68% 1.12%
40 20 0.32% 0.55%
0.55% 0.9%
0.67% 1.09%
45 22,5 0.32% 0.43%
0.55% 0.85%
0.65% 1.09%
50 25 0.38% 0.40%
0.53% 0.9%
0.65% 1.07%
25 22 22
28 24 24
19 17 17
23 21 20
10 10 10
VS
R Tap P
osition
12 12 12
15
V-Q Control ±2% Signal Step Size
��������������� ��2% K= 40%*(0.002) K= 80%*(0.002) K= 100%*(0.002)
33
33
26
33
18 14 14
6
11
V-Q Control ±2% Load Pure Voltage Control Signal Step Size
V-Q Control ±2% Signal Step Size
This particular reactor has 33 tap positions, and the tap-changing order is in opposite direction, i.e. it starts from tap position 33 (Lowest amount of reactive power consumption) and final position is 1 (highest amount of reactive power consumption). The VSR lowers the voltage by tapping from tap

6
position 33 to tap position 1. Table II indicates the finally reached tap position number after all tap changer operation for each load level.
The control signal step sizes presented in Table II are provided as the percentage of reference voltage. These values correspond to minimum and maximum changes in the control signal amplitude during OLTC operation in each load level. In order to achieve signal’s step sizes higher than 0.5% of reference voltage, the scaling factor (K) could be either 80% (K=0.0016) or 100% (K=0.002) of its original value. However, since there is no significant difference between the tap positions in these two cases, a more robust signal will be achieved by choosing K equal to its original value (i.e. K=0.002) as there are larger signal’s step sizes available in this case.
K1 and K2 scale the respective contributions of capacitive and inductive reactive powers of the line. Since QC2 is almost 50% of total generated capacitive reactive power, keeping K1 equal to 1 means that the contribution of capacitive reactive power is 50%, i.e. 50% of the line capacitive effect is contributing the reactive power balance signal. Similarly, to have 50% of the line inductive effect contribution, factor K2 could be selected as 0.5. Table III indicates the final resulting tap positions and step sizes after changing the factor K2.
Table III: The final tap position of VSR and signal’s step size using K2=0.5 for different load levels and using combined control strategy
MW MVAR K1=1 K2=0.5 K1=1 K2=0.5
1 0,50.57%
1%0.68% 1.2%
10 50.56% 0.95%
0.67% 1.15%
20 100.55% 0.9%
0.65% 1.1%
30 150.53% 0.88%
0.64% 1.08%
40 200.52% 0.86%
0.62% 1.02%
45 22,50.52% 0.84%
0.63% 1.03%
50 250.5% 0.83%
0.60% 1%1818
6
11
18
33
33
17
19
18
16
33
16
1314
12
26
12
1010
9
VS
R T
ap Positio
n
98
K= 80%*(0.002)��������������� ��2%
V-Q Control ±2% Signal Step Size
K= 100%*(0.002)
Signal Step Size
V-Q Control ±2% Load Pure Voltage Control
As can be seen, although the signal’s step sizes have been slightly decreased in both cases (K equal to 80% and 100% of its original value), they are still higher than 0.5% of reference voltage. However, there is a tangible decrease in final tap position’s number which makes it closer to the results of pure voltage control; especially in case of K equal to 80% of its original value. It should be noted that having more taps up (smaller tap position number), which is happened at higher load levels, is favourable since it makes the final voltage level to become closer to the reference voltage.
5. CONCLUSION It is concluded that a combination of both reactive power and voltage can provide an effective and robust control strategy for VSRs. To implement this new strategy, several simulation studies have been done and corresponding parameters have been determined. A control signal comprising both reactive power and voltage with appropriate scaling factors is proposed. It is demonstrated that this strategy is robust and can provide a reliable control of Variable Shunt Reactors.

7
BIBLIOGRAPHY [1] C. Bengtsson, T. Olsson and L. Lidén, “Recent Advances in Shunt Reactor Design” (GCC
Power, Riyadh, Nov. 2009). [2] Åke Carlson, “Shunt Reactor Manual” (ABB Power Technology Products/Transformers,
Ludvika-Sweden, 2002-08-20). [3] L. Yamazaki, J C Mendes and C. Bengtsson, “VSR – Variable Shunt Reactors” (Cigré VI
Workspot, Foz Du Iguacu, April 2010). [4] Zoran Gaji�, Birger Hillström, Fahrudin Meki�, “HV Shunt Reactor Secrets for Protection
Engineers” (ABB paper published at WPRC 2003 Conference). [5] Claes Bengtsson, Tomas Olosson, Kent Olsson, Riyadh S. Al-Nassar, Luis Chavez, “Design and
testing of 300 Mvar shunt reactors” (CIGRÉ 2008, Paper A2-305). [6] “ABB Variable Shunt Reactors; Applications” (ABB VSR pamphlet 1ZSE954001-21). [7] M. Bollen et al., “Application of Regulated Shunt Reactor for Off-shore Wind Farms” (Cigré
A2/D1 Colloquium Bruges 2007, paper PS3-42). [8] M. Khorami, “Application Fields and Control Principles of Variable Shunt Reactors with Tap-
Changer” (M.Sc Thesis, Chalmers University of Technology, Västerås-Sweden 2011).