21 October 2017 - Ping An...
25
Ping An Bank Co., Ltd. 2017 Third Quarterly Report 21 October 2017
Transcript of 21 October 2017 - Ping An...

Ping An Bank Co., Ltd.
2017 Third Quarterly Report
21 October 2017

1
Part I. Important Notes
1.1 The board of directors (hereinafter referred to as the “Board”), the supervisory committee, the directors, the supervisors and senior management of Ping An Bank Co., Ltd. (hereinafter referred to as the “Bank”), guarantee and assume several and joint responsibilities for the authenticity, accuracy and completeness of the contents of this report and there are no false representations, misleading statements, or material omissions.
1.2 The 11th meeting of the 10th session of the Board considered the 2017 Third Quarterly Report (hereinafter referred to as the “Report”). All the required 12 directors attended the meeting. The Report was unanimously approved at the meeting.
1.3 Xie Yonglin, the Chairman of the Board, Hu Yuefei, the President, and Han Xu, the Accounting Manager, guarantee the authenticity, accuracy and completeness of the financial statements in the Report.
1.4 Reminder on non-standard audit opinions □Applicable √ Not applicable
This quarterly financial report has not been audited; PricewaterhouseCoopers Zhong Tian LLP conducted agreed-upon procedures on selected items and the preparation process of the financial statements of the Report.
2
Part II. Corporate Profile
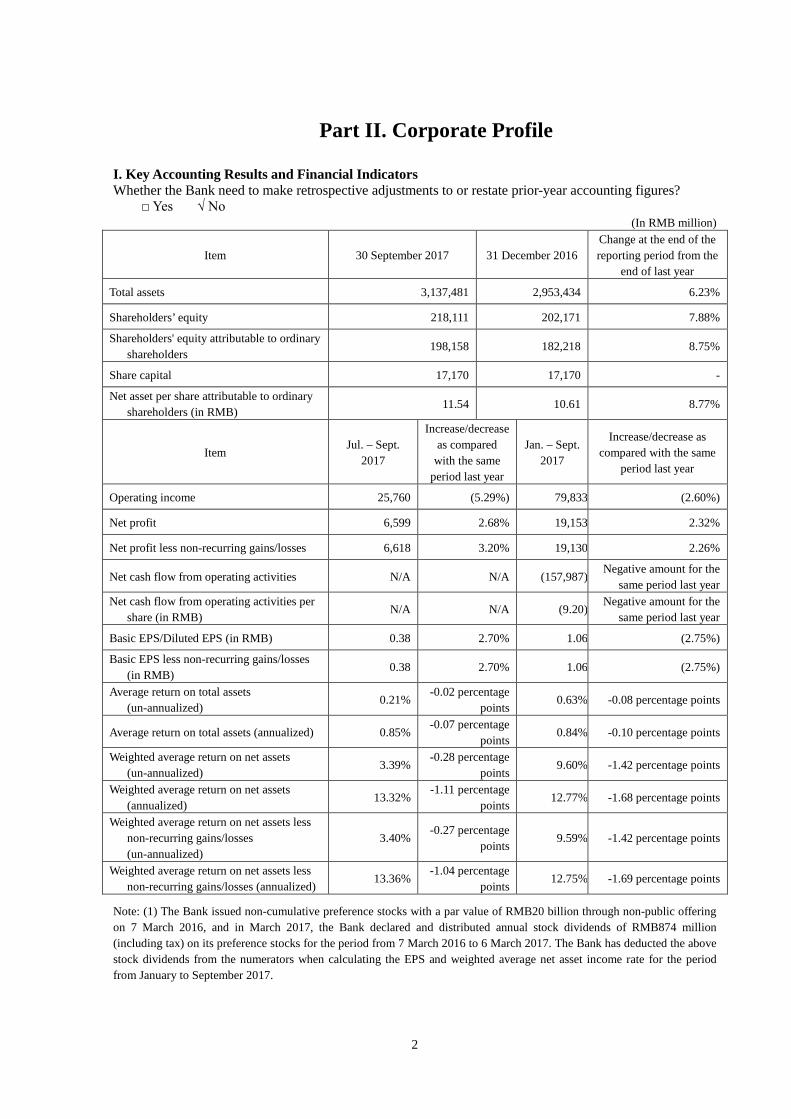
I. Key Accounting Results and Financial Indicators Whether the Bank need to make retrospective adjustments to or restate prior-year accounting figures? □ Yes √ No
(In RMB million)
Item 30 September 2017 31 December 2016 Change at the end of the reporting period from the
end of last year
Total assets 3,137,481 2,953,434 6.23%
Shareholders’ equity 218,111 202,171 7.88%
Shareholders' equity attributable to ordinary shareholders
198,158 182,218 8.75%
Share capital 17,170 17,170 -
Net asset per share attributable to ordinary shareholders (in RMB)
11.54 10.61 8.77%
Item Jul. – Sept.
2017
Increase/decrease as compared
with the same period last year
Jan. – Sept. 2017
Increase/decrease as compared with the same
period last year
Operating income 25,760 (5.29%) 79,833 (2.60%)
Net profit 6,599 2.68% 19,153 2.32%
Net profit less non-recurring gains/losses 6,618 3.20% 19,130 2.26%
Net cash flow from operating activities N/A N/A (157,987) Negative amount for the
same period last year Net cash flow from operating activities per
share (in RMB) N/A N/A (9.20)
Negative amount for the same period last year
Basic EPS/Diluted EPS (in RMB) 0.38 2.70% 1.06 (2.75%)
Basic EPS less non-recurring gains/losses (in RMB)
0.38 2.70% 1.06 (2.75%)
Average return on total assets (un-annualized)
0.21% -0.02 percentage
points 0.63% -0.08 percentage points
Average return on total assets (annualized) 0.85% -0.07 percentage
points 0.84% -0.10 percentage points
Weighted average return on net assets (un-annualized)
3.39% -0.28 percentage
points 9.60% -1.42 percentage points
Weighted average return on net assets (annualized)
13.32% -1.11 percentage
points 12.77% -1.68 percentage points
Weighted average return on net assets less non-recurring gains/losses (un-annualized)
3.40% -0.27 percentage
points 9.59% -1.42 percentage points
Weighted average return on net assets less non-recurring gains/losses (annualized)
13.36% -1.04 percentage
points 12.75% -1.69 percentage points
Note: (1) The Bank issued non-cumulative preference stocks with a par value of RMB20 billion through non-public offering on 7 March 2016, and in March 2017, the Bank declared and distributed annual stock dividends of RMB874 million (including tax) on its preference stocks for the period from 7 March 2016 to 6 March 2017. The Bank has deducted the above stock dividends from the numerators when calculating the EPS and weighted average net asset income rate for the period from January to September 2017.

3
(In RMB million)
Item 30 September 2017 31 December 2016 31 December 2015
Change at the end of the reporting
period from the end of last year
Customer deposits 1,911,741 1,921,835 1,733,921 (0.53%) Including: Corporate deposits 1,585,730 1,652,813 1,453,590 (4.06%)
Personal deposits 326,011 269,022 280,331 21.18% Total loans and advances to
customers 1,646,824 1,475,801 1,216,138 11.59%
Including: Corporate loans 899,686 934,857 774,996 (3.76%) General corporate
loans 880,970 920,011 761,331 (4.24%)
Discounted bills 18,716 14,846 13,665 26.07% Personal loans 494,725 359,859 293,402 37.48% Receivables from
credit cards 252,413 181,085 147,740 39.39%
Impairment allowance for loans and advances
(43,802) (39,932) (29,266) 9.69%
Loans and advances, net 1,603,022 1,435,869 1,186,872 11.64%
Note: Pursuant to the Notice of the People’s Bank of China regarding Adjustments to the Statistical Bases for Deposits and Loans of Financial Institutions (Yin Fa [2015] No.14), starting from 2015, the deposits placed in deposit-taking financial institutions by non-deposit-taking financial institutions are accounted under “total deposits”, while loans made by deposit-taking financial institutions to non-deposit-taking financial institutions are accounted under “total loans”. Accordingly, as at 30 September 2017, total deposits and total loans amounted to RMB2,375 billion and RMB1,681 billion, respectively.
Total share capital of the Bank as at the last trading day prior to the date of disclosure: Total share capital of the Bank as at the last trading day prior to
the date of disclosure (shares) 17,170,411,366
Fully diluted earnings per share based on the latest share capital figure (RMB/share, January - September)
1.06
Whether had there been changes in the share capital from the end of the last reporting period to the date of issue of the quarterly report as a result of new share issues, additional issues, right issues, exercise of share options and/or repurchase of shares, and whether the changes, if any, had affected the amount of owners’ interests
□ Yes √ No
Non-recurring items and amounts √ Applicable □ Not applicable
(In RMB million) Item Jan. – Sept. 2017
Gains/losses on disposal of non-current assets 89
Other non-operating income and expense (59)
Impact of the above items on income tax (7)
Total 23
Note: The non-recurring gains/losses are calculated as per the Explanatory Announcement on Information Disclosure by Companies Offering Securities to the Public No. 1 – Non-recurring Gains/Losses issued by China Securities Regulatory Commission (“CSRC”). During the reporting period, the Bank had no recurring gain/losses items that are defined or listed as non-recurring gains/losses as per the Explanatory Announcement on Information Disclosure by Companies Offering Securities to the Public No. 1 – Non-recurring Gains/Losses.
4
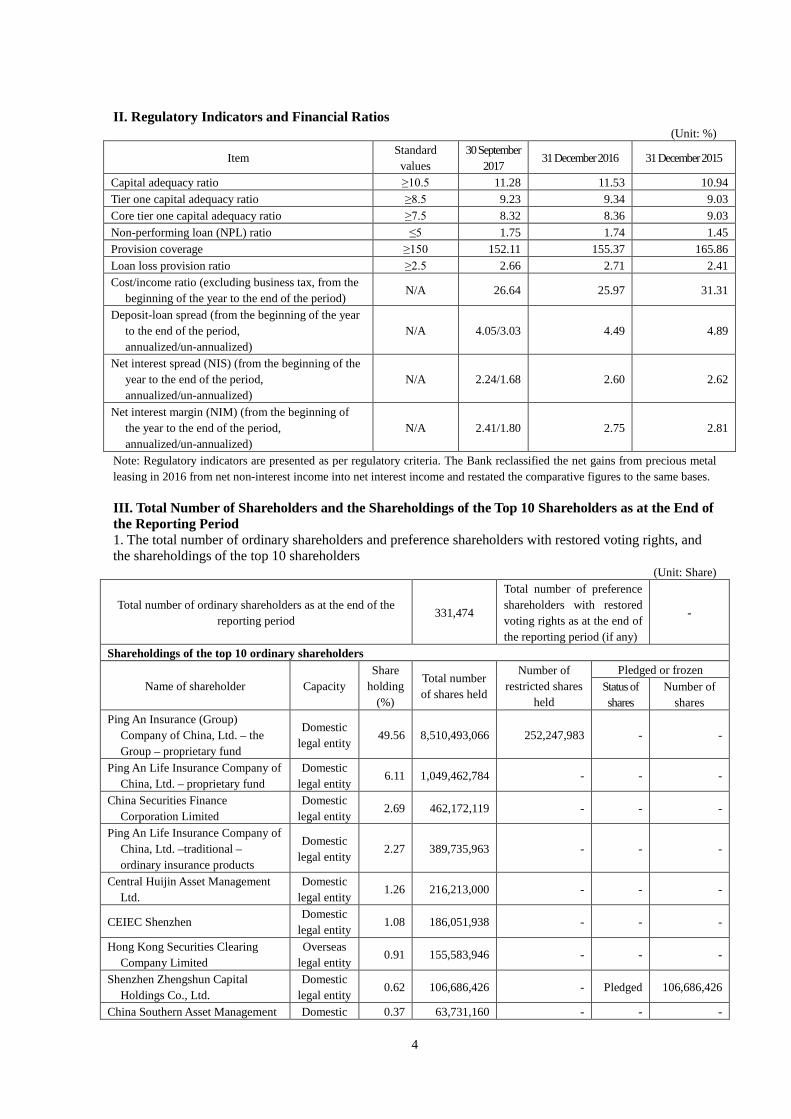
II. Regulatory Indicators and Financial Ratios
(Unit: %)
Item Standard values
30 September 2017
31 December 2016 31 December 2015
Capital adequacy ratio ≥10.5 11.28 11.53 10.94 Tier one capital adequacy ratio ≥8.5 9.23 9.34 9.03 Core tier one capital adequacy ratio ≥7.5 8.32 8.36 9.03 Non-performing loan (NPL) ratio ≤5 1.75 1.74 1.45 Provision coverage ≥150 152.11 155.37 165.86 Loan loss provision ratio ≥2.5 2.66 2.71 2.41 Cost/income ratio (excluding business tax, from the
beginning of the year to the end of the period) N/A 26.64 25.97 31.31
Deposit-loan spread (from the beginning of the year to the end of the period, annualized/un-annualized)
N/A 4.05/3.03 4.49 4.89
Net interest spread (NIS) (from the beginning of the year to the end of the period, annualized/un-annualized)
N/A 2.24/1.68 2.60 2.62
Net interest margin (NIM) (from the beginning of the year to the end of the period, annualized/un-annualized)
N/A 2.41/1.80 2.75 2.81
Note: Regulatory indicators are presented as per regulatory criteria. The Bank reclassified the net gains from precious metal leasing in 2016 from net non-interest income into net interest income and restated the comparative figures to the same bases.
III. Total Number of Shareholders and the Shareholdings of the Top 10 Shareholders as at the End of the Reporting Period 1. The total number of ordinary shareholders and preference shareholders with restored voting rights, and the shareholdings of the top 10 shareholders
(Unit: Share)
Total number of ordinary shareholders as at the end of the reporting period
331,474
Total number of preference shareholders with restored voting rights as at the end of the reporting period (if any)
-
Shareholdings of the top 10 ordinary shareholders
Name of shareholder Capacity Share
holding (%)
Total number of shares held
Number of restricted shares
held
Pledged or frozen Status of shares
Number of shares
Ping An Insurance (Group) Company of China, Ltd. – the Group – proprietary fund
Domestic legal entity
49.56 8,510,493,066 252,247,983 - -
Ping An Life Insurance Company of China, Ltd. – proprietary fund
Domestic legal entity
6.11 1,049,462,784 - - -
China Securities Finance Corporation Limited
Domestic legal entity
2.69 462,172,119 - - -
Ping An Life Insurance Company of China, Ltd. –traditional – ordinary insurance products
Domestic legal entity
2.27 389,735,963 - - -
Central Huijin Asset Management Ltd.
Domestic legal entity
1.26 216,213,000 - - -
CEIEC Shenzhen Domestic
legal entity 1.08 186,051,938 - - -
Hong Kong Securities Clearing Company Limited
Overseas legal entity
0.91 155,583,946 - - -
Shenzhen Zhengshun Capital Holdings Co., Ltd.
Domestic legal entity
0.62 106,686,426 - Pledged 106,686,426
China Southern Asset Management Domestic 0.37 63,731,160 - - -

5
– Agricultural Bank of China – China Southern CSI Financial Asset Management Plan
legal entity
Lombarda China Fund Management Co., Ltd. – Agricultural Bank of China – Lombarda China CSI Financial Asset Management Plan
Domestic legal entity
0.37 63,731,160 - - -
Shareholdings of the top 10 unrestricted shareholders
Name of shareholder Number of unrestricted shares held
Type of shares
Type of shares Number of shares
Ping An Insurance (Group) Company of China, Ltd. – the Group – proprietary fund
8,258,245,083 RMB ordinary
shares 8,258,245,083
Ping An Life Insurance Company of China, Ltd. – proprietary fund
1,049,462,784 RMB ordinary
shares 1,049,462,784
China Securities Finance Corporation Limited 462,172,119 RMB ordinary
shares 462,172,119
Ping An Life Insurance Company of China, Ltd. –traditional – ordinary insurance products
389,735,963 RMB ordinary
shares 389,735,963
Central Huijin Asset Management Ltd. 216,213,000 RMB ordinary
shares 216,213,000
CEIEC Shenzhen 186,051,938 RMB ordinary
shares 186,051,938
Hong Kong Securities Clearing Company Limited 155,583,946 RMB ordinary
shares 155,583,946
Shenzhen Zhengshun Capital Holdings Co., Ltd. 106,686,426 RMB ordinary
shares 106,686,426
China Southern Asset Management - Agricultural Bank of China – China Southern CSI Financial Asset Management Plan
63,731,160 RMB ordinary
shares 63,731,160
Lombarda China Fund Management Co., Ltd. – Agricultural Bank of China – Lombarda China CSI Financial Asset Management Plan
63,731,160 RMB ordinary
shares 63,731,160
Description of related-party relationships or concerted actions among the above shareholders
1. Ping An Life Insurance Company of China, Ltd. is a controlled subsidiary of and acting in concert with Ping An Insurance (Group) Company of China, Ltd. “Ping An Insurance (Group) Company of China, Ltd. – the Group – proprietary fund”, “Ping An Life Insurance Company of China, Ltd. – proprietary fund” and “Ping An Life Insurance Company of China, Ltd. – traditional – ordinary insurance product” are related parties. 2. The Bank is not aware of any related-party relationship or parties acting in concert among other shareholders.
Description of the top 10 ordinary shareholders who engage in securities margin trading (if any)
N/A
Whether the top 10 ordinary shareholders and the top 10 unrestricted ordinary shareholders executed any agreed repurchase transactions within the reporting period
□ Yes √ No

6
2. Total number of preference shareholders, and the shareholdings of the top 10 preference shareholders
√ Applicable □ Not applicable
(Unit: Share) Total number of preference
shareholders at the end of the reporting period
15
Shareholdings of the top 10 preference shareholders
Name of shareholder Capacity Share
holding (%)
Total number of shares held
Number of restricted
shares held
Pledged or frozen
Status of shares Number of
shares Ping An Life Insurance Company of
China, Ltd. – dividend – dividends for individual insurance
Domestic legal
entity 29.00 58,000,000 - - -
Ping An Life Insurance Company of China, Ltd. – universal – individual universal insurance
Domestic legal
entity 19.34 38,670,000 - - -
Ping An Property & Casualty Insurance Company of China, Ltd. – traditional – ordinary insurance products
Domestic legal
entity 9.67 19,330,000 - - -
China Post & Capital Fund – Hua Xia Bank – Hua Xia Bank Co., Ltd.
Domestic legal
entity 8.95 17,905,000 - - -
Bank of Communications Schroder Fund Management – Bank of Communications – Bank of Communications Co., Ltd.
Domestic legal
entity 8.95 17,905,000 - - -
Bank of China Limited Shanghai Branch
Domestic legal
entity 4.47 8,930,000 - - -
Postal Savings Bank of China Co., Ltd.
Domestic legal
entity 2.98 5,950,000 - - -
China Resources SZITIC Trust Co. Ltd – investment No.1– trust funds
Domestic legal
entity 2.98 5,950,000 - - -
Hwabao Trust Co., Ltd. – investment No.2 – trust funds
Domestic legal
entity 2.98 5,950,000 - - -
China Merchants Wealth – PSBC – Postal Savings Bank of China Co., Ltd.
Domestic legal
entity 2.98 5,950,000 - - -
Description of related-party relationships or concerted actions among the above shareholders
1. Ping An Life Insurance Company of China, Ltd. and Ping An Property & Casualty Insurance Company of China, Ltd. are controlled subsidiaries of and acting in concert with the Ping An Insurance (Group) Company of China, Ltd. “Ping An Life Insurance Company of China, Ltd. – dividend – dividends for individual insurance”, “Ping An Life Insurance Company of China, Ltd. – universal – individual universal insurance” and “Ping An Property & Casualty Insurance Company of China, Ltd. – traditional – ordinary insurance products” are related parties. 2. The Bank is not aware of any related relationship or parties action in concert among other shareholders.
Note: (1) The preference shares issued by the Company are all unrestricted with no restricted period imposed. (2) The Bank had no preference shareholders with restored voting rights.

7
Part III. Significant Events
I. Description of and Reasons for Changes in Excess of 30% in Financial Results and Indicators during the Reporting Period √ Applicable □ Not applicable
(In RMB million)
Item 30
September 2017
Change at the end of period from the
end of last year
Change rate at the end of period from the end of
last year
Reasons for change
Financial assets purchased under agreements to resell
19,136 10,260 115.59% Increase in bonds purchased under agreements to resell
Accounts receivable 25,308 19,740 354.53% Increase in factoring receivables without recourse
Available-for-sale financial assets
35,113 33,934 2,878.20% A small base, increase in investment in available-for-sale securities
Other assets 14,930 3,831 34.52% Increase in liquidation transition fund receivable
Borrowings from the Central Bank
115,607 96,470 504.10% A small base, increase in borrowings from the Central Bank over a small base
Financial liabilities at fair value through profit or loss
10,591 (11,322) (51.67%) Decrease in payables for tradable gold lease
Provisions 60 (30) (33.33%) A small base, with a RMB90 million balance at the end of last year
Other liabilities 24,118 15,096 167.32% Increase in liquidation transition fund payable
Other comprehensive income
(435) 374 Negative amount at the end of last
year
Increase in change in the fair value of available-for-sale financial assets
Item Jan. – Sept.
2017
Increase/decrease as compared with the same period
last year
Increase/decrease rate as compared
with the same period last year
Reasons for change
Fee and commission expense
3,485 1,169 50.47%
Increase in commission expense arising from increase in the number of credit cards issued and in the transaction volume
Investment income 644 (1,822) (73.88%) Decrease in profit/loss on price difference in the negotiation of bills
Gains or losses on changes in fair value
34 (76) (69.09%) A small base, with a RMB110 million balance at the end of last year
Exchange gains and losses
280 (288) (50.70%) Decrease in exchange gains and losses due to exchange rate fluctuation
Revenue from other operations
130 43 49.43% A small base, with a RMB87 million balance at the end of last year
Other income 102 102 Nil for the same period last year
Recognized as income from government subsidy in this year in accordance with the standard
Taxes and surcharges 745 (2,355) (75.97%) Adoption of BT to VAT policy as from 1 May last year

8
Non-operating income 28 (24) (46.15%) A small base, with a RMB52 million balance at the end of last year
Non-operating expenses 89 52 140.54% A small base, with a RMB37 million balance at the end of last year
II. Description of Significant Events and their Progress, Impact and Solutions √ Applicable □ Not applicable On 14 August 2017, the 2017 first extraordinary general meeting of the Bank deliberated and approved the Proposal of Ping An Bank Co., Ltd. on the Solution of Public Issuance and Listing of A-share Convertible Corporate Bonds, for the Bank’s proposed public issuance of no more than RMB26 billion of A-share convertible corporate bonds (hereinafter referred to as "the Issuance"). The Issuance requires approval from China Banking Regulatory Commission, China Securities Regulatory Commission and other relevant authorities, and shall proceed as approved by these authorities.
For details, please refer to announcements released by the Bank in China Securities Journal, Securities Times, Shanghai Securities News, Securities Daily and on CNINFO (www.cninfo.com.cn) on 15 August 2017.
Description of significant events Date of disclosure Index of website disclosing temporary reports The Bank proposed to make a
public issuance of no more than RMB26 billion of A-share convertible corporate bonds
15 August 2017 China Securities Journal, Securities Times, Shanghai Securities
News, Securities Daily and CNINFO (www.cninfo.com.cn)
III. Commitments not Delivered by the Specified Dates during the Reporting Period by Parties, including the De Facto Controller, Shareholders, Connected Parties, Acquirers, and the Bank □ Applicable √ Not applicable There was no commitment not delivered by the specified dates during the reporting period by the de facto controller, shareholders, connected parties, acquirers or the Bank.
IV. 2017 Performance Forecast Warnings and the causes of potential loss in accumulated net profit from the beginning of the year to the end of the next reporting period or significant potential movement as compared with the same period of last year □Applicable √ Not applicable
V. Securities Investments At the end of the reporting period, the book value of financial bonds (including policy bank notes, ordinary financial bonds and subordinated financial bonds, excluding corporate bonds) held by the Bank was RMB101.7 billion, and the top 10 financial bonds in terms of nominal value are as follows:
(In RMB million) Name of Bond Nominal Value
Nominal annual interest rate (%)
Maturity date Impairment provision
2010 policy bank notes 3,860 2.09 2020/2/25 -
2015 policy bank notes 3,280 3.85 2018/1/8 -
2011 policy bank notes 3,030 2.35 2021/2/17 -
2016 commercial bank notes 3,000 3.20 2021/3/29 -
2016 commercial bank notes 3,000 3.25 2021/3/7 -
2016 policy bank notes 2,640 2.96 2021/2/18 -
2017 commercial bank notes 2,500 4.30 2020/9/5 -
2009 policy bank notes 2,420 2.53 2019/5/19 -
2011 policy bank notes 2,250 4.25 2018/3/24 -
2011 policy bank notes 1,770 2.16 2018/1/14 -
9
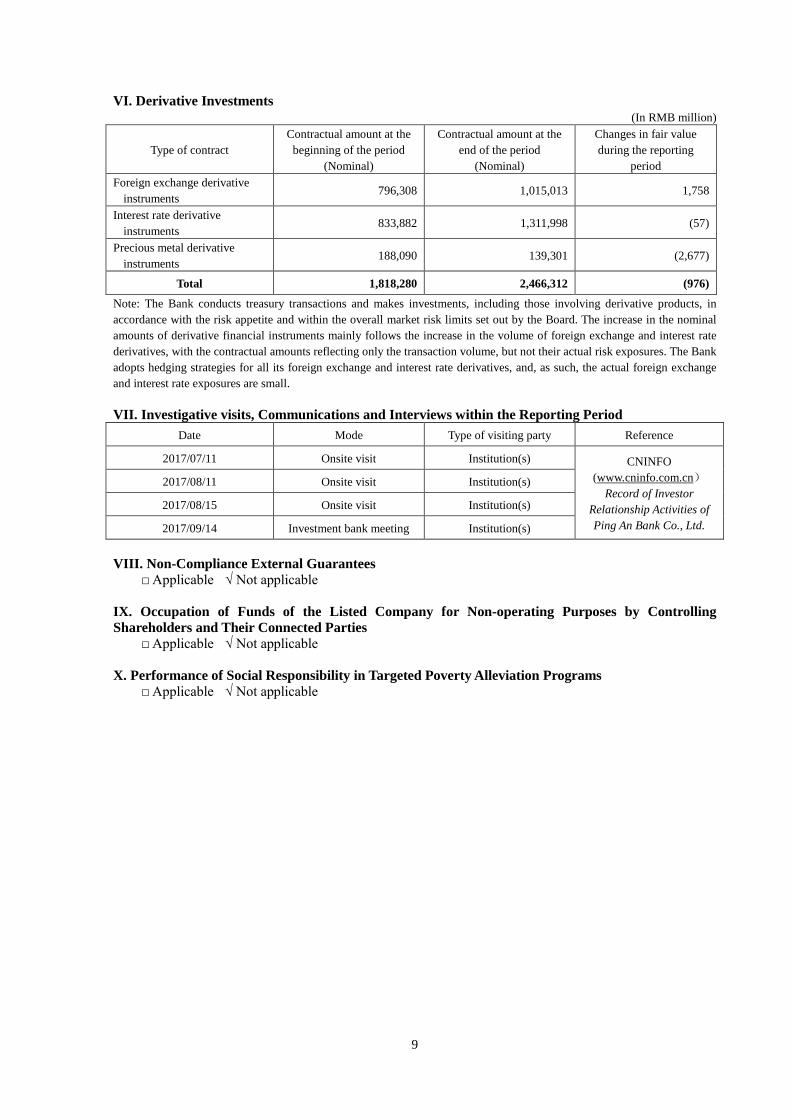
VI. Derivative Investments (In RMB million)
Type of contract Contractual amount at the
beginning of the period (Nominal)
Contractual amount at the end of the period
(Nominal)
Changes in fair value during the reporting
period Foreign exchange derivative
instruments 796,308 1,015,013 1,758
Interest rate derivative instruments
833,882 1,311,998 (57)
Precious metal derivative instruments
188,090 139,301 (2,677)
Total 1,818,280 2,466,312 (976)
Note: The Bank conducts treasury transactions and makes investments, including those involving derivative products, in accordance with the risk appetite and within the overall market risk limits set out by the Board. The increase in the nominal amounts of derivative financial instruments mainly follows the increase in the volume of foreign exchange and interest rate derivatives, with the contractual amounts reflecting only the transaction volume, but not their actual risk exposures. The Bank adopts hedging strategies for all its foreign exchange and interest rate derivatives, and, as such, the actual foreign exchange and interest rate exposures are small. VII. Investigative visits, Communications and Interviews within the Reporting Period
Date Mode Type of visiting party Reference
2017/07/11 Onsite visit Institution(s) CNINFO (www.cninfo.com.cn)
Record of Investor Relationship Activities of Ping An Bank Co., Ltd.
2017/08/11 Onsite visit Institution(s)
2017/08/15 Onsite visit Institution(s)
2017/09/14 Investment bank meeting Institution(s)
VIII. Non-Compliance External Guarantees □ Applicable √ Not applicable
IX. Occupation of Funds of the Listed Company for Non-operating Purposes by Controlling Shareholders and Their Connected Parties □ Applicable √ Not applicable
X. Performance of Social Responsibility in Targeted Poverty Alleviation Programs □ Applicable √ Not applicable

10
XI. Management Discussion and Analysis (I) Description of overall operations From January to September 2017, the domestic economy maintained stable growth, with the "Belt and Road Initiative" progressing solidly, the supply-side structural reform delivering increasingly greater benefits, and new driving forces continuously emerging to advance economic development. In response to the needs and requirements for development in a new period, the Bank promoted the overall strategy for retail transformation. Based on the strategy of "Technology driven; Breakthroughs in retail banking; Thoughtful service in corporate banking", the Bank drove the retail banking to become more Internet-based and more smart, and its corporate banking to become more industry-specific, specialised, investment-banking-oriented, and lighter in capital and assets. Besides, the Bank prioritized the seamless integration of FinTech into bank operations and management in adherence to principles of compliance and risk prevention and control. The strategic transformation has delivered remarkable results as all business lines continue to grow robustly. Highlights of the operations are as follows: 1. Stable development on the whole From January to September 2017, the Bank realized an operation revenue of RMB79.833 billion, down by 2.60% year on year (operation revenue before value-added tax reform increased by 0.85% year on year), in which, net commission income was RMB23.161 billion, up by 5.54% year on year. The operation profits before the provision were RMB57.820 billion, up by 2.96% year on year; the net profit was RMB19.153 billion, up by 2.32% year on year, while the profitability remained stable. The operation income ratio was 26.64%, down by 1.06 percentage points year on year. As at the end of September 2017, total assets of the Bank were RMB3,137.481 billion, up by 6.23% as compared with the end of last year. The Bank had a deposit balance of RMB1,911.741 billion, basically the same as the end of last year. As the Bank adapted to the market changes and actively engaged in promoting high-quality projects and programs, the loans and advances (including discounted bills) increased 11.59% to RMB1,646.824 billion, as compared with that at the end of last year, of which retail loans (credit cards included) increased by 8 percentage points to 45% as compared with that at the end of last year. The year-end balance of principal-guaranteed wealth management products (WMPs) across the Bank was RMB327.795 billion, up 78.23% compared with the end of last year; the year-end balance of non-principal-guaranteed WMPs was RMB564.274 billion, down 24.00% compared with the end of last year. 2. Significant process in retail banking transformation Bringing its comprehensive financial capability into full play, the Bank further promoted the transformation of intelligent retail banking and provided customers with differentiated and exquisite banking experience while maintaining rapid business growth. (1) Rapid growth in scale and profits As at the end of September 2017, assets under management (AUM) of retail customers of the Bank reached RMB1,021.503 billion, up by 28.07% as compared with the end of last year. The number of retail customers (debit cardholders and credit cardholders included) increased to 65.7426 million, up by 25.48% as compared with the end of last year, in which private wealth management customers and qualified private banking customers reached 431,600 and 21,900 respectively, up by 25.52% and 29.43% respectively as compared with the end of last year. The number of credit cards in circulation was 33.89 million, up by 32.33% as compared with the end of last year. Balance of retail deposits totalled RMB326.011 billion, up by 21.18% as compared to the end of last year; balance of retail loans (credit card loans included) reached RMB747.138 billion, up by 38.12% year on year. The total transactions through credit cards were RMB1,046.770 billion, up by 27.5% year on year. The number of active users of the Ping An Pabank App was 12,450,000 on a monthly basis, the best among joint-stock banks. From January to September 2017, the operating income of the retail business totalled RMB33.599 billion, up by 38.03% year on year and accounting for 42% of the total operating income of the Bank. The net profit of the retail business reached RMB12.506 billion, up by 94.15% year on year and accounting for 65% of the total net profit of the Bank. (2) Continued improvement in asset quality From January to September 2017, the retail business of the Bank maintained a stable and downward non-performing loan (NPL) ratio (excluding credit cards), as the NPL ratio was down 0.37 percentage points to 1.20% for retail loans as compared with the end of last year, while the NPL ratio of retail loans (excluding credit cards and personal business loans) was down by 0.25 percentage points to 0.35% as compared with the end of last year. The NPL ratio for credit cards was 1.18%, down by 0.25 percentage
11
points as compared with the end of last year. The quality of credit card assets remained stable, as latest NPL ratio in September 2017 represented the best performance in the past three years. For the principal retail loan products (Xin Yi Dai and auto loans), the migration ratio of non-overdue loans to loans overdue for over 30 days continued to decrease, as the risk warning indicator demonstrated an improvement trend. (3) Constant breakthroughs in all businesses The credit card business of the Bank experienced rapid and stable growth. As at the end of September 2017, the number of new credit cards issued by the Bank reached 9,909,700, up by 54.81% year on year and 57.38% quarter on quarter. The Bank continued to improve its risk management system for the whole credit card process by deploying a special scoring system for on-line credit card applications and developing its big data application strategy model. In addition, the Bank built its intelligent risk control system based on state-of-art technologies, including facial recognition, equipment “fingerprint recognition”, and blockchain fraud prevention. From January to September 2017, newly issued Xin Yi Dai loans of the Bank totalled RMB82.557 billion, with a period-end balance of RMB113.747 billion and a NPL ratio of 0.69%. In response to the varied preferences and needs of different customers, the Bank applied big data, Internet+ and other technologies to push forward the upgrade of its consumer finance model as well as product innovation, so as to their financing needs in different stages. In this way, the Bank was able to expand its consumer finance business to more white-collar employees and small and micro businesses, and provide banking services to broader customer segments. Moreover, the Bank actively took advantage of online channels for its consumer finance business and built its one-stop platform for self-service consumer loans through Internet-based channels, including online banking, mobile banking, WeChat, and web portals, in its efforts to make the most use of Internet technologies to develop more competitive products, improve the intelligence and automation in application processing for consumer financial services, provide better customer experience, pursue sustaining operation and drive the consumption upgrade. From January to September 2017, newly issued auto finance loans of the Bank amounted to RMB79.533 billion, up by 38.8% year on year, and the balance of auto loans across the Bank totalled RMB116.295 billion, up 22.08% compared with the end of last year, as the Bank maintained its leading position in the auto loan market. Through product innovation, credit process optimization, application of the scientific risk quantification model as well as adopting the big data strategy, the Bank increased the rate of automatic credit approval to 60% in its auto finance business system, including an automatic approval rate of 33% for second-hand cars, which effectively enhanced customer experience and consolidated its leading position in the industry. From January to September 2017, the Bank optimized its customer scenarios, embraced life insurance, continued product innovation, implemented the point-based sales performance assessment system, and enhanced the research and development of AI. At the end of August 2017, AUM of the Bank exceeded one trillion and the Bank was a market leader in terms of retail deposit growth. (4) Technology driven and service innovation On 29 August 2017, the first retail-only outlet of the Bank, "Liuhua Branch, Guangzhou", was officially open for business. The outlet endeavours to be fully involved in the life and activities of the communities and build a service system focusing on "Intelligence+O2O+Customer Experience" to provide customers with home-like experience. Besides, it creates multiple daily life scenarios for customer interactions and strives to build itself as a “know-you-better” one-stop comprehensive financial O2O service platform offering "light banking, community integration, smart banking and diversity". Besides, the Bank continued to develop Ping An Pabank App into a one-stop comprehensive financial mobile service platform. In August 2017, the Bank rolled out Pabank 4.0. With biological recognition and AI advisory embedded, the App is capable of providing customers with customized product portfolio solution based on transaction records and risk appetites, and it could analyze customer needs by means of big data analysis, and then offer customers with differentiated products and services through push notifications and presentation. (5) Comprehensive finance to promote transformation Comprehensive finance, including comprehensive retail business development and innovation and sales of credit cards and insurance products through Group channels, continued to improve in its performance. From January to September 2017, the number of customer migrating via comprehensive development channels increased by 3,044,000, including 29,900 for private banking and wealth management customers and an increase in asset balance of RMB74.668 billion, representing growth of 42.93%, 34.09% and 33.35% respectively. 32.52% of the Xin Yi Dai loans totalling RMB26.851 billion were made through the comprehensive channels. The number of credit cards newly issued via the group channel was 4.33 million,

12
representing growth of 44%. In Q3 2017, the number of credit cards newly issued via the group channel was 2.58 million, representing growth rose up to 54%. Cumulative net non-interest income from insurance products sold through the retail channels was RMB1.379 billion, up by 105.82% year on year. 3. Greater specialisation in corporate banking The Bank elaborated its business philosophy of "transforming to be more industry-specific, specialised, investment-banking-oriented, and lighter in capital and assets", and formulated the "1234 implementation strategy" to further clarify its future development direction and profit-making approach for its corporate banking operations. The "1234 implementation strategy" refers to 1: the one lifeline (asset quality); 2: the two development concepts (industry-specific and lighter on capital and assets); 3: the three fundamental guarantee cornerstones (the systems, performance assessment and the people); and 4: the four implementation routes (pure deposits, real investment bank, lead bank and KYB (SME data loan)). Through the 1234 strategy, the Bank will drive the transformation of its large corporate businesses from focus on interest margins to a banking model that focus on comprehensive customer services and end-to-end efficiency enhancement. From January to September 2017, the Bank continuously pushed forward the transformation of its corporate banking business to achieve sustainable business development. In terms of business platform strategy, we continued to expand the influence of our four main platforms, namely, "Orangebank.com, cross-border E-financing platform, Factoring Cloud, ET-BANK", to provide exquisite products and services to our customers. At the end of September 2017, "Orangebank.com" had provided services to 992 e-commerce platforms, 176 more than that at the end of last year, as the industry standards for digitized supply chain financial system of the Bank are being constantly rolled out, giving the Bank a leading edge in the area. From January to September 2017, the Bank's transactions through the "cross-border E-financing platform" amounted to RMB363.778 billion, up by 20.95% year on year. The "Factoring Cloud platform" was updated and expanded continuously, and the total number of users increased by 1,351 to 5,717 as compared with the end of last year. It was awarded the "Third Prize for Financial Innovation in Shenzhen" in 2016 for its innovative efforts and practical applications in asset receivable operations. As a comprehensive financing asset transaction platform, the "ET-BANK platform" continued to expand its customer base. The cooperative partners increased more than 400 to over 1,800 customers as compared with the end of last year, as the platform delivered remarkable channel synergies. In terms of lighter capital and assets, the Bank strived to develop businesses with to lower risk weights, occupying low or no capital, and fully utilized the Group’s financial resources and platforms to enhance channel cooperation and expand sources of revenue from operations light on capital and assets. From January to September 2017, although the scale of bond issuing in the market experienced a dramatic drop, the Bank's bond underwriting business witnessed a steady increase. At the end of September, the amount of bond underwriting amounted to RMB71.030 billion, in which, 80% was issued for the AAA customers and 95% to customers with an AA+ or above rating. The market share increased to 2.4% from 1.9% at the end of last year. Despite fierce competition and decreasing fee rates, the Bank's net income from custody business reached RMB2.550 billion, maintaining the same level as compared with the same period of last year. At the end of September 2017, net value of custody business amounted to RMB6.17 trillion, up by 13% as compared to the end of last year. The Bank maintained a leading position among joint-stock banks in terms of the volumes of proprietary and agency precious metal trading. From January to September of 2017, 1.26 million new accounts were opened for gold transactions and the number of existing customers were 4.76 million, as the Bank maintained a leading position among joint-stock banks in terms of the volume of sales of physical gold. (1) Precise control of scale The Bank actively restructured its business structure and asset structure, and kept the scale of its corporate banking assets at a reasonable level to improve capital usage. At the end of September of 2017, corporate banking assets were optimised in structure; corporate loan (including discounted bills) balance was RMB899.686 billion, accounting for 55% of total loans and down by 8 percentage points as compared with the end of last year; the weighted risk assets of corporate loans decreased by RMB42.9 billion as compared with the end of last year. (2) Precise development and cultivation of customers The Bank focused on large-scale, moderately cyclical industries with strong growth potentials, such as medical health, cultural tourism and electronic information, and strengthened forward-looking industry researches, planning for industry development, optimization of industrial customer structure, maximization of the potential of quality customers, and the control of industrial financial risks. In industry financing, the Bank actively applied the "C+SIE+R" industry financing model (Core

13
customers+Supply chain/ Industrial chain/Ecological circle customers+Retail customers). Acting as a lead bank, the Bank put together quality resources and provided them to quality customers with high potentials, in an effort to develop and drive upstream and downstream customers in supply chains, as well as customers in industrial chains and ecological circles, enabling the Bank to develop 958 mainstream customers from January to September 2017. The Bank adopted differentiated marketing strategies. For large and medium-sized customers, the Bank used lists and implemented a strategy combining "financing+intellectual solution, capital+investment, and the lead bank" to establish itself as the customers’ choice of lead bank for both "commercial bank+investment bank". For small-sized customers, the Bank focused on delivering swift and large number of financial services through its light-weight platforms, so as to control risks and deliver value. (3) Strict control over asset quality The Bank built a comprehensive risk management system to standardize the procedures before, during and after loan issuance, and implemented the strategy of "customized policies for each and every bank and customer". The Bank strictly controlled the quality of newly developed businesses, and prioritized its credit resources and risk assets to lead banks and KYB borrowers with more controllable risks. In terms of existing assets, the Bank strengthened follow-up monitoring and disengagement of high-risk and low-profitability borrowers, applied innovative tailored management solutions, and increased efforts in asset recovery. The Special Asset Management Department of the Bank has delivered good performance since its establishment at the end of 2016, and the amount it had recovered from January to September 2017 was 2.1 time that of the same period in the last year thanks to precise management, cost-effective operations and specialized efforts; of the amount recovered, 89% was in cash, with the rest in foreclosed assets. It has adopted innovative NPL recovery solutions, including platform-based recovery, batch recovery, and those drawing on the strength of Internet and big data technology, and made significant contributions in ensuring the profitability of the Bank by mitigating asset quality risks. (4) Greater efficiency The Bank is committed to improving staff capacity and customer experience through platform empowerment, training promotion and team restructuring, etc. On 20 September 2017, the first KYB SME data loan was issued by the Bank. Currently, it takes only 26 seconds to complete the process from application of a loan to the calculation of the credit line; the borrower can draw down the loan in 2 minutes after face-to-face review and approval, so that it has become a reality to disburse a loan in the same day the application is made. At present, the KYB SME data loans are being rolled out to the whole market. 4. Enhanced and orderly risk control Since the foundation of the Special Asset Management Department at the end of 2016, the Special Asset Management Department of the Bank has improved its capability in terms of systematic treatment and specialised operation has started to come into force. The Bank actively responded to external risks and continued to optimise its credit structure, strictly controlled incremental business risks, prevented and alleviated various risks in existing loans, enhanced the efforts in the recovery of, so as to maintain relative stability of its asset quality. From January to September of 2017, the Bank recognised a provision of RMB32.820 billion for its asset impairment losses, up by 3.81% year on year, including a provision for loan impairment losses of RMB31.588 billion; the impairment allowance for loans at the end of September 2017 was RMB43.802 billion, up by 9.69% as compared with the end of last year; the provision-to-loans ratio was 2.66%, down by 0.05 percentage points as compared with the end of last year; the provision coverage ratio was 152.11%, down by 3.26 percentage points; the NPL ratio was 1.75%, down slightly by 0.01 percentage points as compared with the end of June 2017 and up slightly by 0.01 percentage point as compared with the end of last year. From January to September of 2017, a total of RMB7.428 billion of non-performing assets had been recovered, up by 95% year on year, in which, credit assets (principals of loans) amounted to RMB6.933 billion; among the principals recovered, RMB2.726 billion had been written off and RMB4.207 billion had not been written off; over 80% of recovered non-performing assets were recovered in cash, with the rest in foreclosed assets. 5. Robust network building The Bank continued to improve the smart banking capability of its network outlets and improve the overall distribution of its network presence. From January to September of 2017, the Bank newly established 8 branches, including 4 in the third quarter (namely, Jinzhong, Nanchang, Yichang and Jining). By the end of September 2017, the Bank had 68 branches and a total of 1,080 business locations.

14
(II) Asset quality 1. Five-category classification of loans and advances
(In RMB million)
Item 30 September 2017 31 December 2016 Change from the end of
period over the end of last year Balance Proportion Balance Proportion
Pass loans 1,554,016 94.36% 1,389,396 94.15% 11.85%
Special mention loans 64,012 3.89% 60,703 4.11% 5.45%
Non-performing loans 28,796 1.75% 25,702 1.74% 12.04%
Incl.: Substandard 16,671 1.01% 13,833 0.94% 20.52%
Doubtful 3,357 0.21% 4,494 0.30% (25.30%)
Loss 8,768 0.53% 7,375 0.50% 18.89%
Total loans and advances 1,646,824 100.00% 1,475,801 100.00% 11.59%
Impairment provisions for loans and advances
(43,802) (39,932) 9.69%
NPL ratio 1.75% 1.74% +0.01 percentage points
Provision coverage ratio 152.11% 155.37% -3.26 percentage points
Provision coverage ratio of loans overdue for more than 90 days
101.89% 98.51% +3.38 percentage points
Provision/loan ratio 2.66% 2.71% -0.05 percentage points
2. Structure and quality of loans and advances by products
(In RMB million)
Item 30 September 2017 31 December 2016
Increase/decrease in NPL ratio Balance NPL ratio Balance NPL ratio
Corporate Loans 899,686 2.21% 934,857 1.87% +0.34 percentage points
Incl.: General corporate loans 880,970 2.26% 920,011 1.90% +0.36 percentage points
Discounted bills 18,716 - 14,846 - -
Personal Loans 494,725 1.20% 359,859 1.57% -0.37 percentage points
Incl.: Housing mortgage loans 135,818 0.08% 85,229 0.13% -0.05 percentage points
Business loans 106,011 4.32% 97,534 4.17% +0.15 percentage points
Auto loans 116,295 0.55% 95,264 0.89% -0.34 percentage points
Others (Note) 136,601 0.46% 81,832 0.75% -0.29 percentage points
Accounts receivable from credit cards
252,413 1.18% 181,085 1.43% -0.25 percentage points
Total loans and advances 1,646,824 1.75% 1,475,801 1.74% +0.01 percentage points
Note: Other retail loans include “Xin Yi Dai” loans, certificate pledged consumer loans, small balance consumer loans and other guaranteed or pledged consumer loans.
The non-performing corporate loans increased mainly due to unfavourable macro-economic conditions, where certain small- and medium-sized enterprises and low-end manufacturing businesses experience various problems, including poor performance, lower profits and financing difficulties, which caused funding strains, funding chain crises, and inability on the part of these borrowers to repay their loans.

15
Non-performing personal loans slightly decreased as compared with the end of last year, thanks to: (1) The Bank further adjusted the structure of housing mortgage loan customers and enhanced its efforts in quality customers, effectively improved quality of loans issued and maintained a low level of NPLs. (2) The Bank continued to improve its existing business structure, withdrew from relatively high-risk credit loans, or adopted credit enhancements to transform them into low-risk loans; in the meantime, the Bank enhanced its issuance of loans with strong guarantees, such as housing mortgage loans, strictly controlled risks in new businesses, thus ensuring that the risks are properly managed. (3) Auto loans structure was improved and the proportion of low-risk loans was increased. The risk acceptance policy was further optimized, and the scientific risk measurement instruments and external big data were fully used to enhance our capability to identify risks and control overall risks. At the same time, the Bank constantly enhanced the building of its NPL recovery team, actively took various useful recovery measures to strengthen our work in recovering NPLs. The overall asset quality of personal loans was stable and controllable as a whole. The Bank followed the risk management philosophy regarding the comprehensive flow of credit card business, and fully used quantified instruments to effectively control risks. On the one hand, the Bank stuck to the risk management philosophy while constantly optimizing the risk management strategy across the credit card process through big data and adoption of the evaluation model and other scientific tools and building a more effective structure to attract quality customers. Besides, the balance structure for existing customers was effectively improved, so as to ensure sustainable development. On the other hand, it optimized its strategy and management capability in NPL collection and improved its NPL recovery. The Bank expects that the credit portfolio and risks level can be maintained stable and under control, and the revenue can cover its risks.
3. Overdue loans
(In RMB million)
Item 30 September 2017 30 June 2017 31 December 2016
Balance % of total
loans Balance
% of total loans
Balance % of total
loans Loans with principal and interest
overdue for less than 90 days 17,381 1.06% 23,922 1.50% 18,572 1.26%
Loans with principal and interest overdue for more than 90 days
42,991 2.61% 43,209 2.71% 40,536 2.75%
As at the end of September of 2017, the Bank's loans that were overdue for less than 90 days (loans with principal not overdue but interest overdue for less than 90 days inclusive) amounted to RMB17.381 billion, down by 6.41% as compared with the end of last year and by 27.34% as compared with the end of June 2017; the balance of loans that were overdue for more than 90 days (loans with principal not overdue but interest overdue for over 90 days inclusive) was RMB42.991 billion, up by 6.06% as compared with the end of last year and down by 0.50% as compared with the end of June 2017. The balance and proportion of loans overdue for more than 90 days both decreased as compared with the end of June 2017.
16
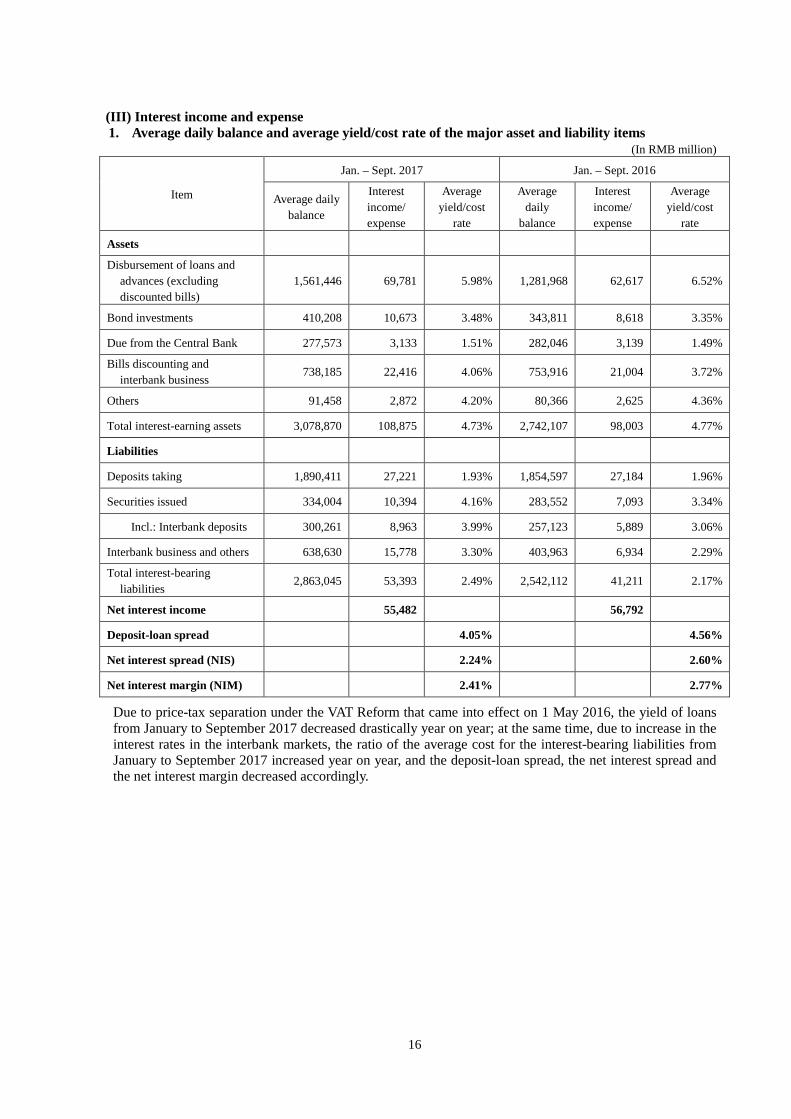
(III) Interest income and expense 1. Average daily balance and average yield/cost rate of the major asset and liability items
(In RMB million)
Item
Jan. – Sept. 2017 Jan. – Sept. 2016
Average daily balance
Interest income/ expense
Average yield/cost
rate
Average daily
balance
Interest income/ expense
Average yield/cost
rate
Assets
Disbursement of loans and advances (excluding discounted bills)
1,561,446 69,781 5.98% 1,281,968 62,617 6.52%
Bond investments 410,208 10,673 3.48% 343,811 8,618 3.35%
Due from the Central Bank 277,573 3,133 1.51% 282,046 3,139 1.49%
Bills discounting and interbank business
738,185 22,416 4.06% 753,916 21,004 3.72%
Others 91,458 2,872 4.20% 80,366 2,625 4.36%
Total interest-earning assets 3,078,870 108,875 4.73% 2,742,107 98,003 4.77%
Liabilities
Deposits taking 1,890,411 27,221 1.93% 1,854,597 27,184 1.96%
Securities issued 334,004 10,394 4.16% 283,552 7,093 3.34%
Incl.: Interbank deposits 300,261 8,963 3.99% 257,123 5,889 3.06%
Interbank business and others 638,630 15,778 3.30% 403,963 6,934 2.29%
Total interest-bearing liabilities
2,863,045 53,393 2.49% 2,542,112 41,211 2.17%
Net interest income 55,482 56,792
Deposit-loan spread 4.05% 4.56%
Net interest spread (NIS) 2.24% 2.60%
Net interest margin (NIM) 2.41% 2.77%
Due to price-tax separation under the VAT Reform that came into effect on 1 May 2016, the yield of loans from January to September 2017 decreased drastically year on year; at the same time, due to increase in the interest rates in the interbank markets, the ratio of the average cost for the interest-bearing liabilities from January to September 2017 increased year on year, and the deposit-loan spread, the net interest spread and the net interest margin decreased accordingly.

17
Item
Jul. – Sept. 2017 Apr. – Jun. 2017 Average
daily balance
Interest income/expense
Average yield/cost
rate
Average daily
balance
Interest income/exp
ense
Average yield/cost
rate Assets Disbursement of loans and
advances (excluding discounted bills)
1,604,481 23,975 5.93% 1,576,835 23,356 5.94%
Bond investments 445,261 4,014 3.58% 399,955 3,432 3.44% Due from the central bank 271,303 1,048 1.53% 283,029 1,057 1.50% Bills discounting and
interbank business 677,400 7,162 4.19% 755,022 7,766 4.13%
Others 97,175 1,028 4.20% 95,702 992 4.16% Total interest-earning assets 3,095,620 37,227 4.77% 3,110,543 36,603 4.72% Liabilities Deposits taking 1,879,439 9,679 2.04% 1,901,085 9,115 1.92% Bonds issued 347,351 3,938 4.50% 306,945 3,213 4.20% Incl.: Interbank deposits 306,472 3,374 4.37% 276,828 2,777 4.02% Interbank business and others 648,054 5,489 3.36% 682,182 5,783 3.40% Total interest-bearing
liabilities 2,874,844 19,106 2.64% 2,890,212 18,111 2.51%
Net interest income 18,121 18,492 Deposit-loan spread 3.89% 4.02% Net interest spread (NIS) 2.13% 2.21% Net interest margin (NIM) 2.32% 2.38%
The Bank continuously optimized its business structure. Driven by the increase in the amount and proportion of personal loans, a slight increase was seen in earnings per share of interest-earning assets over the last quarter; however, affected by market conditions, the ratio of the average cost for the interest-bearing liabilities increased year on year, causing the deposit-loan spread, the net interest spread and the net interest margin to decrease year on year.
2. Average daily balance and average yield rate of loans and advances
(In RMB million)
Item Jan. – Sept. 2017 Jan. – Sept. 2016
Average daily balance
Interest income
Average yield
Average daily balance
Interest income
Average yield
Corporate loans (excluding discounted bills)
934,006 31,621 4.53% 823,272 31,019 5.03%
Personal loans 627,440 38,160 8.13% 458,696 31,598 9.20% Disbursement of loans and
advances (excluding discounted bills)
1,561,446 69,781 5.98% 1,281,968 62,617 6.52%
Item
Jul. – Sept. 2017 Apr. – Jun. 2017
Average daily balance
Interest income
Average yield
Average daily
balance
Interest income
Average yield
Corporate loans (excluding discounted bills)
915,359 10,374 4.50% 954,126 10,708 4.50%
Personal loans 689,122 13,601 7.83% 622,709 12,648 8.15% Disbursement of loans and
advances (excluding 1,604,481 23,975 5.93% 1,576,835 23,356 5.94%

18
discounted bills) 3. Average daily balance and cost rate of customer deposits
(In RMB million)
Item
Jan. – Sept. 2017 Jan. – Sept. 2016
Average daily
balance
Interest expenses
Average cost rate
Average daily
balance
Interest expenses
Average cost rate
Corporate deposits 1,352,336 19,876 1.97% 1,266,626 19,363 2.04%
Incl.: Demand deposits 508,229 2,357 0.62% 456,381 1,845 0.54%
Time deposits 844,107 17,519 2.77% 810,245 17,518 2.89%
Incl.: Treasury and negotiated deposits
98,081 3,318 4.52% 139,973 4,644 4.43%
Margin deposits 274,825 3,948 1.92% 335,513 4,695 1.87%
Personal deposits 263,250 3,397 1.73% 252,458 3,126 1.65%
Incl.: Demand deposits 130,712 307 0.31% 122,003 300 0.33%
Time deposits 132,538 3,090 3.12% 130,455 2,826 2.89%
Deposits taking 1,890,411 27,221 1.93% 1,854,597 27,184 1.96%
Item
Jul. – Sept. 2017 Apr. – Jun. 2017
Average daily
balance
Interest expenses
Average cost rate
Average daily
balance
Interest expenses
Average cost rate
Corporate deposits 1,364,341 7,088 2.06% 1,355,206 6,607 1.96%
Incl.: Demand deposits 486,066 760 0.62% 513,955 804 0.63%
Time deposits 878,275 6,328 2.86% 841,251 5,803 2.77%
Incl.: Treasury and negotiated deposits
100,275 1,154 4.57% 97,864 1,090 4.47%
Margin deposits 247,122 1,335 2.14% 270,869 1,286 1.90%
Personal deposits 267,976 1,256 1.86% 275,010 1,222 1.78%
Incl.: Demand deposits 133,457 105 0.31% 132,821 104 0.31%
Time deposits 134,519 1,151 3.39% 142,189 1,118 3.15%
Deposits taking 1,879,439 9,679 2.04% 1,901,085 9,115 1.92%

19
XII. Capital Adequacy Ratio, Leverage Ratio and Liquidity Coverage Ratio (I) Capital adequacy ratio
(In RMB million) Item 30 September 2017 31 December 2016
Net core tier one capital 182,763 170,088
Other tier one capital 19,953 19,953
Net tier one capital 202,716 190,041
Tier two capital 45,122 44,346
Net capital 247,838 234,387
Total risk-weighted assets 2,197,329 2,033,715
Credit risk-weighted assets 1,992,521 1,828,931
On-balance-sheet risk-weighted assets 1,804,243 1,607,471
Off-balance-sheet risk-weighted assets 185,165 217,364
Risk-weighted assets of counterparty credit risk exposure
3,113 4,096
Market risk-weighted assets 31,008 30,984
Operational risk-weighted assets 173,800 173,800
Core tier one capital adequacy ratio 8.32% 8.36%
Tier one capital adequacy ratio 9.23% 9.34%
Capital adequacy ratio 11.28% 11.53%
(II) Leverage ratio
(In RMB million)
Item 30 September 2017 30 June 2017 31 March 2017 31 December 2016
Leverage ratio 5.75% 5.62% 5.58% 5.49%
Net tier one capital 202,716 196,648 194,051 190,041
On/off-balance-sheet assets balance after adjustment
3,526,424 3,501,389 3,476,192 3,458,490
Note: The leverage ratio increased at the end of reporting period as compared with that in the end of June 2017 due to the increase in net core tier one capital.
(III) Liquidity coverage ratio
(In RMB million)
Item 30 September 2017 31 December 2016
Liquidity coverage ratio 90.02% 95.76%
Qualified assets with high liquidity 271,454 383,670
Cash outflow, net 301,546 400,670
Note: Pursuant to the requirements of the Administrative Measures on Liquidity Risks of Commercial Banks (Trial), the liquidity coverage ratio of commercial banks shall reach 100% by the end of 2018; during the transitional period, the liquidity coverage shall reach 80% by the end of 2016 and 90% by the end of 2017, respectively.

20
Part IV. Financial Statements
I. Financial Statements (I) Balance Sheet (unaudited) (II) Income Statement (unaudited) (III) Cash Flow Statement (unaudited)

21
Ping An Bank Co., Ltd. Balance Sheet
30 September 2017 (In RMB million)
ASSETS 30 September,2017 December 31,2016 Cash on hand and due from the Central Bank 279,706 311,258 Placements of deposits with other banks 167,090 166,882 Precious metals 89,534 93,787 Funds loaned to banks and other financial institutions 79,892 97,450 Financial assets at fair value through profit or loss 41,327 57,179 Derivative financial assets 6,275 8,730 Financial assets held under resale agreements 19,136 8,876 Accounts receivable 25,308 5,568 Interest receivable 18,724 15,770 Loans and advances 1,603,022 1,435,869 Available-for-sale financial assets 35,113 1,179 Held-to-maturity investments 329,181 286,802 Investment receivables 385,680 414,278 Investment properties 212 221 Fixed assets 7,883 8,316 Intangible assets 4580 4,771 Goodwill 7,568 7,568 Deferred income tax assets 22,320 17,831 Other assets 14,930 11,099 Total assets 3,137,481 2,953,434 LIABILITIES AND SHAREHOLDERS’ EQUITY Due to the Central Bank 115,607 19,137 Deposits from banks and other financial institutions 407,088 392,351 Funds from banks and other financial institutions 44,756 52,586 Financial liabilities at fair value through profit or loss 10,591 21,913 Derivative financial liabilities 6,732 8,349 Financial assets sold under repurchase agreements 19,646 18,941 Doposits taking 1,911,741 1,921,835 Salaries and welfare payable 8,574 9,289 Taxes payable 9,685 12,754 Interest payable 22,466 21,532 Bonds payable 338,306 263,464 Predicted liability 60 90 Other liabilities 24,118 9,022 Total liabilities 2,919,370 2,751,263
SHAREHOLDERS’ EQUITY: Share capital 17,170 17,170 Other equity instruments 19,953 19,953
Including: Preference shares 19,953 19,953 Capital reserve 56,465 56,465 Other comprehensive income (435) (809) Surplus reserve 10,781 10,781 General reserve 34,468 34,468 Retain earnings 79,709 64,143 Total shareholders’ equity 218,111 202,171 TOTAL LIABILITIES AND SHAREHOLDERS’ EQUITY 3,137,481 2,953,434
Xie Yonglin
Hu Yuefei
Han Xu Chairman
Legal Representative President
Head of Accounting Department Accounting Manager

22
Ping An Bank Co., Ltd.
Income statement January – September 2017
(In RMB million)
Item Jul -
Sept 2017 Jul - Sept
2016 Jan - Sept
2017 Jan - Sept
2016 I. Operating income 25,760 27,199 79,833 81,968
Net interest income 18,121 19,197 55,482 56,792 Interest income 37,227 32,919 108,875 98,003 Interest expense 19,106 13,722 53,393 41,211
Net fee and commission income 7,413 6,896 23,161 21,945 Fee and commission income 8,777 7,678 26,646 24,261 Fee and commission expense 1,364 782 3,485 2,316
Investment income (95) 858 644 2,466 Gains or losses on fair value changes 17 (50) 34 110 Exchange gains or losses 228 285 280 568 Other operating income 35 13 130 87 Other gains 41 - 102 -
II. Operating costs 8,124 7,195 22,013 25,808 Tax and surcharges 242 261 745 3,100 General and administrative expenses 7,882 6,934 21,268 22,708
III. Operating profit before impairment losses on assets
17,636
20,004
57,820
56,160
Impairment losses on assets 9,104 11,615 32,820 31,615 IV. Operating profit 8,532 8,389 25,000 24,545
Add: Non-operating income 13 23 28 52 Less: Non-operating expenses 38 6 89 37
V. Total Profits 8,507 8,406 24,939 24,560 Less: Income tax expense 1,908 1,979 5,786 5,841
VI. Net profit 6,599 6,427 19,153 18,719 VII. Other Comprehensive Income, net of tax 58 101 374 245
Other comprehensive income to be reclassified subsequently to profit or loss 58
101
374
245
1. Share of other comprehensive income of the investee accounted for using the equity method - - - (4)
2. Gains/losses on changes in the fair value of available-for-sale financial assets 58
101
374
249
VIII. Total comprehensive income 6,657 6,528 19,527 18,964 IX. Earnings per share
(I) Basic earnings per share 0.38 0.37 1.06 1.09 (II) Diluted earnings per share 0.38 0.37 1.06 1.09
Xie Yonglin
Hu Yuefei Han Xu Chairman
Legal Representative President
Head of Accounting Department Accounting Manager

23
Ping An Bank Co., Ltd.
Cash Flow statement January –September 2017
(In RMB million) Item Jan – Sept 2017 Jan – Sept 2016
I. CASH FLOWS FROM OPERATING ACTIVITIES: Net increase of amounts from the Central Bank 96,421 7,553
Net increase in customer deposit and deposits from banks and other financial institutions 3,641 113,563 Net increase in placements from banks and other financial institutions - 785 Net increase in financial assets sold under repurchase agreements 697 - Net decrease in accounts receivable - 920 Net decrease in financial assets held under resale agreements 1,914 27,800 Cash received from interest, fee and commission income 113,328 99,405 Cash received relating to other operating activities 22,845 7,946
Subtotal of cash inflows from operating activities 238,846 257,972 Net increase in placements with and loans to banks and other financial institutions 53,754 59,220 Net increase in placements with banks and other financial institutions 21,900 14,475 Net decrease in placements from banks and other financial institutions 7,829 - Net increase in accounts receivables 19,740 - Net decrease in accounts payables - 44 Net increase in loans and advances 202,265 239,188 Net decrease in financial assets sold under repurchase agreements - 11,001 Cash payments for interest, fee and commission expenses 44,250 37,291 Cash paid to and on behalf of employees 11,310 11,060 Cash payments for taxes and surcharges 19,966 11,059 Cash payments relating to other operating activities 15,819 27,576
Subtotal of cash outflows from operating activities 396,833 410,914 Net cash flows from operating activities (157,987) (152,942)
II. CASH FLOWS FROM INVESTING ACTIVITIES: Cash received from investment upon disposal/maturity 403,935 1,626,197 Cash received from investment income 24,149 21,757 Cash received from disposal of fixed assets, investment properties and other long-term assets 4 -
Subtotal of cash inflows from investing activities 428,088 1,647,954 Cash payments for investments 445,698 1,744,210 Cash payments for fixed assets, intangible assets and other long-term assets 857 906
Subtotal of cash outflows from investing activities 446,555 1,745,116 Net cash flows from investing activities (18,467) (97,162)
III.CASH FLOWS FROM FINANCING ACTIVITIES: Cash received from other equity instruments issued - 20,000 Cash received from bonds issued 721,719 609,764
Subtotal of cash inflows from financing activities 721,719 629,764 Cash repayments of principal of bonds 644,980 503,190 Cash payments for bond interest 1,884 1,369 Cash payments for transaction cost of other equity instruments issued - 48 Cash payments for dividend and profit appropriation 3,587 2,189
Subtotal of cash outflows from financing activities 650,451 506,796 Net cash flows from financing activities 71,268 122,968
IV. EFFECT OF EXCHANGE RATE CHANGES ON CASH AND CASH EQUIVALENTS (2,285) 1,546 V. NET DECREASE IN CASH AND CASH EQUIVALENTS (107,471) (125,590) Add: Balance of cash and cash equivalents at beginning of the period 233,414 261,341 IV. BALANCE OF CASH AND CASH EQUIVALENTS AT END OF THE PERIOD 125,943 135,751
Xie Yonglin
Hu Yuefei
Han Xu Chairman
Legal Representative President
Head of Accounting Department Accounting Manager

24
II. Auditor’s Report Has the third quarterly report been audited □ Yes √ No The third quarterly report has not been audited.
Board of Directors of Ping An Bank Co., Ltd. 21 October 2017
This report was originally drafted in Chinese and the English translation of the report is for your reference only. In case of any inconsistencies between the Chinese and the English version, the Chinese version shall prevail.