21 October 2002 EIGHTY-FOURTH SESSION
23
MC/INF/251 Original: English 21 October 2002 EIGHTY-FOURTH SESSION _____________________________________________________________________________ HUMAN RESOURCES REPORT
Transcript of 21 October 2002 EIGHTY-FOURTH SESSION

MC/INF/251
Original: English21 October 2002
EIGHTY-FOURTH SESSION_____________________________________________________________________________
HUMAN RESOURCES REPORT

MC/INF/251Page i
CONTENTS
Page
I. INTRODUCTION ………………………………………………..…………………………… 1
II. SELECTION AND RECRUITMENT PRACTICES …………………..………………….. 1
Recruitment …………..…………….……………………………………………….……… 1Gender and geographical balance …………………………………………………………... 2Staffing guidelines ……………………………………………………………….…………. 2Staffing processes ……………………………………………………………….…………. 2The General Internal Roster (GIR) and Emergency Response Roster (ERR) …….…..……. 2Associate Experts …………………………………………………….……………………. 3
III. CURRENT PRACTICES AND RECENT DEVELOPMENTS INWORKING CONDITIONS …………………………………………………………………... 3
Harmonization of conditions of service for General Service field staff ……..…….……… 3Entitlement to assignment grant of General Service staff ………………………….……… 3Paternity leave pilot exercise ……………………..………………………………………… 3Conditions of service for staff under special contract ……….………..…………………… 3Policy towards a respectful working environment …………..………..…………………… 4
IV. STAFF DEVELOPMENT AND TRAINING (SDT) ……….….…………………………… 4
V. PERFORMANCE MANAGEMENT ………………………………………………………… 4
VI. JOB CLASSIFICATION …………………………….……………………………………….. 5
VII. STAFF MOBILITY ………………..………………………………………………………….. 5
VIII. STAFF RELATIONS ……………………………………………………………….………... 6
ANNEX - Statistical Overview

MC/INF/251Page 1
HUMAN RESOURCES REPORT
I. INTRODUCTION
1. For the third year, in response to the wishes of Member States and the Staff AssociationCommittee (SAC), an information document on human resources management in IOM ispresented by the Administration to the Council, outlining IOM’s personnel policies and progressmade on issues of concern to the staff. A statistical overview of the composition of the staff,together with information on recruitment and staff development and training, is attached.
II. SELECTION AND RECRUITMENT PRACTICES
2. The staffing policy outlined in document MC/INF/242 dated 24 October 2000 remains inforce, although under constant review. Some of the concrete measures include: (i) permanentplanning and monitoring of recruitment needs and best practices; (ii) drafting of clearer andmore comprehensive guidelines; (iii) proactive approach to increase the number of AssociateExperts; (iv) improvement of the recruitment strategy for emergency and post-conflict activitiesand services; and (v) standardization of a number of key positions for both job classification andrecruitment purposes.
Recruitment
3. A number of steps have been taken in order to improve methods of recruitment:
(a) Vacancies are studied by the Staffing Unit (STU), the Services and project managersand/or supervisors in order to establish the post description and to align the duties andresponsibilities to the needs of the project, programme or activity. Most vacancynotices are issued only internally to give preference to qualified internal candidates,and the SAC is consulted when it is necessary to post vacancies externally.
(b) Panel interviews of short-listed candidates are given preference to ensure theobjectivity and transparency of the process. Whenever feasible, the supervisor, theDepartment of Human Resources Management (HRM) and a representative of thetechnical area related to the job compose the panel.
(c) Competency-based recruitment and selection methodology continue to be applied andreinforced.
(d) Expansion of the network to advertise posts, including advertisements in specializedentities, newspapers, international magazines and on web sites.
(e) Establishment and/or reinforcement of closer working relations with specific entitieswithin governments in charge of overseeing the recruitment of their nationals ininternational organizations.
(f) Facilitation of the recruitment process by updating the roster of internal and externalcandidates.

MC/INF/251Page 2
Gender and geographical balance
4. Improvement has been achieved in this field since 1998. At present, from a total of3,344 staff members there are 177 women and 112 men at Headquarters and 1,217 women and1,838 men in Field Missions. It is recognized that recruitment should focus on achieving a betterrepresentation of women at the P5 level and above. An effort is also being made to increaserepresentation of nationals from Member States not yet represented in IOM.
Staffing guidelines
5. Guidelines on selection and recruitment of staff under special contracts were issued toimprove the capacity to identify emergency, post-conflict and project personnel. The recruitmentand selection process for staff members appointed under a one-year fixed-term renewablecontract and subject to selection through the Appointments and Postings Board (APB) wasreviewed by the STU. After an agreement on the definition of ’’internal candidate’’ was reachedwith the SAC, these guidelines are now being finalized.
Staffing processes
6. Simplifying IOM’s selection and recruitment process entails delegating responsibility anddeveloping flexible systems. Field Missions are able to recruit international staff through theirown network, in close consultation with the STU, to increase the pool of qualified candidates.
7. Efforts are being made to accelerate the recruitment process. However, a limit on thepossibilities of streamlining procedures has been reached and this task cannot be taken furtherwithout additional resources and updated information technology tools. The acquisition of acomprehensive HR software package to improve, inter alia, the staffing function, is thereforebecoming a necessity.
The General Internal Roster (GIR) and Emergency Response Roster (ERR)
8. Within the framework of strengthening IOM’s preparedness and response for emergencyoperations, the Director General invited all staff in 2001 to express their interest in andavailability for future deployment. In cooperation with the Emergency and Post ConflictDivision, the Occupational Health Unit and the Staff Development and Training Unit, the STUcaptured information on staff availability and qualifications in a database, with funding receivedfrom the Government of the United Kingdom (DFID). This tool enables quick searches for staffmembers with any required profiles. Since the inclusion in the ERR was subject to specificcriteria, staff not selected for the ERR were automatically included in the GIR. The latter enablesidentification of staff for short- or long-term assignments at Headquarters or other non-emergency duty stations.
9. It is foreseen to update the rosters in the near future through the deployment of the databaseto all Field Missions. It is also planned to extend the roster to other internal/external categoriessuch as interns, consultants and internal/external applicants through web-enabled applications. Inthe long term, this application should be integrated into an overall HR Information Management

MC/INF/251Page 3
System. Although the financial resources for upgrading the existing personnel software arecurrently not available, a feasibility study has been carried out to assess needs and priorities, aswell as the amount of resources required.
Associate Experts
10. IOM adopted the Associate Experts (AE) programme in 1975 (see MC/INF/242,paragraphs 38 and 39). A new agreement has recently been concluded with the Netherlands,which facilitates the recruitment of Dutch nationals, as well as nationals of developing countries,and gives priority to job offers in least developed countries.
III. CURRENT PRACTICES AND RECENT DEVELOPMENTS IN WORKINGCONDITIONS
Harmonization of conditions of service for General Service field staff
11. The main tool of harmonization is the implementation of the Staff Regulations and Rules(SRRs). It should be noted that the number of Missions which need SRRs follows the expansionof IOM. Since September 2001, seven new Missions have had SRRs implemented and anothersix Missions have had their SRRs updated in order to grant standard conditions. Since autumn2001, the Medical Service Plan has been implemented in seven additional Field Offices and theProvident Fund in nine additional Field Offices.
Entitlement to assignment grant for General Service staff
12. As part of the Organization’s efforts to ensure equal treatment of staff, a new practicerelated to the transfer of General Service staff from one country to another was approved by theDirector General. The entitlement gives General Service staff, selected for a one-year fixed-termpost and having been with IOM for at least three years, the same transfer benefits as for officials.
Paternity leave pilot exercise
13. Since the introduction of this pilot exercise in September 2000, 24 fathers (both in theProfessional and General Service categories) have benefited from paternity leave. Theentitlement was introduced on an initial two-year trial basis which is coming to an end. It istherefore suggested that IOM establish paternity leave on a permanent basis and include theentitlement in the Staff Rules.
Conditions of service for staff under special contract
14. Of the 3,344 staff members in IOM, a total of 1,410 are on short-term contracts and havebeen with the Organization for less than 12 months. In 2001, IOM recruited 148 officials fortemporary positions; from January to June 2002, the number of professional temporary positionsfilled reached 143. There was a clear need to establish guidelines for conditions of service,benefits and obligations of staff under such contracts; these are presently being coordinatedbefore publication.

MC/INF/251Page 4
Policy towards a respectful working environment
15. This policy, which was announced in the Human Resources Report for 2001 (MC/INF/247)has now been published and distributed to all staff. It is included in the material handed over tonew staff in the “Staff Induction” programme. An Open Forum is planned at Headquartersbefore the end of 2002, for discussion of the policy with the staff and a panel from theAdministration. It will be filmed and distributed to all Field Missions.
IV. STAFF DEVELOPMENT AND TRAINING (SDT)
16. The Staff Development and Training Steering Committee, composed of representatives ofthe SAC and the Administration, continued to provide advice and endorsement to SDT ontraining priorities, new initiatives and the implementation of the annual training plans.
17. SDT provided support in organizing targeted training programmes for Chiefs of Mission,Administrative Support Officers, project developers and project managers, as well for learningprogrammes in other priority areas such as negotiation, report writing, mediation, managementand information technology. SDT cooperated with the Emergency and Post-Conflict Division inimplementing three regional emergency management workshops. SDT also organized inductionand orientation briefing programmes for new staff at Headquarters, as well as management andteamwork video-learning sessions for specific work units.
18. SDT traditionally allocates some 70 per cent of its resources to the support of learningactivities for staff in the Field and has continued to develop distance learning tools. The unit hasrecently enhanced its Learning Resource Centre consisting of over 400 learning tools (books,videos, CD-ROMs, etc.) and has introduced a monthly learning theme for all IOM staff. SDT hasupdated and distributed IOM guidelines on language training and will also circulate thecomprehensive updated IOM Learning Reference Guide (LRG).
19. Current activities include: the development of a handbook for Chiefs of Mission; supportand advice in updating the 1997 training module entitled "An Overview of InternationalMigration"; and the identification of additional distance-learning techniques and approaches toassist in providing learning opportunities for field staff. SDT is also involved in the developmentand phased introduction of a revised performance appraisal system.
V. PERFORMANCE MANAGEMENT
20. As part of the effort to introduce elements of performance management in IOM, theAdministration created two new processes in 2001, which were described in MC/INF/247,paragraphs 41 to 44.
21. The Senior Review Panel met on two cases in the period under review, under thechairmanship of the Executive Officer and with the participation of senior managers, includingone from the Field, and the SAC Chairperson.
22. The processing of Career Threshold Reviews, in order to make recommendations forgranting regular contracts, is being carried out for a number of pending cases. The Director

MC/INF/251Page 5
General has decided that up to one-third of the staff in each category should have a regularcontract; once documentation is completed for these cases, the APB will make arecommendation to the Director General.
23. During 2002, HRM coordinated the development of a new performance managementsystem. The system will be introduced by a phased, pilot approach, beginning in early 2003, inorder to extend the system to the entire Organization by the end of 2004. The new systemincludes the identification and rating of key competencies required for successful performance ina given post, as well as a process of setting and assessing work objectives between the staffmember and supervisor. The possibility of including a 360-degree assessment (including peersand supervisees) for certain categories of staff is under review. The internal working groupinvolved in developing the system has focused on establishing a process that is simple, effectiveand comprehensive.
VI. JOB CLASSIFICATION
24. The Administration streamlined the procedures for classification of positions and hiredadditional professional job classifiers to work freelance whenever needed. New participants inthe Classifications Appeals Review Committee (CARC) were identified, designated and trainedin Job Classification Standards and are now operational. The backlog of cases has beenprocessed and a number of new positions have been rated. Between 1 July 2001 and30 June 2002, 42 positions (32 officials and 10 employees) were rated and 13 desk audits (eightofficials and five employees) were carried out. Four classification appeals (one official and threeemployees) were processed by the CARC.
25. In order to streamline and expedite the processes of documenting and measuring work, theAdministration is creating occupational profiles for the most common occupations in theOrganization. A profile for Heads of Office/Chiefs of Mission/Regional Representatives is in thefinal stages of drafting, and two more profiles have been started. The profiles will establishclearly what duties, responsibilities and outputs are expected of staff in the function at each gradelevel, and will facilitate recruitment, training and staff mobility.
VII. STAFF MOBILITY
26. In 2001, the Director General invited a number of senior staff who had been in their postfor four years to enter into a dialogue with the Administration regarding options for a newposting during 2002. As a result, two staff members applied to and were selected for VacancyNotices and have been transferred. In addition, three other senior officials were transferred, andthe plans for their re-assignment were shared and discussed with the SAC within the APB. Againin 2002, the Director General wrote to the senior officials who will have been at the same postexercising leadership responsibility for five years by the summer of 2003.
27. At the request of the SAC, the Administration has begun to review the staff mobility policycontained in the Staff Rules, in order to simplify the process and adapt it to the current needs ofthe Organization.

MC/INF/251Page 6
VIII. STAFF RELATIONS
28. The Administration has continued to meet with representatives of the SAC within theJASAC (Joint Administration/Staff Association Committee) to discuss matters of commoninterest. The cooperation between the Administration and the SAC continued through otherworking groups or initiatives, such as the group designing the new Performance ManagementSystem, the Staff Development and Training Steering Committee and the Joint Working Groupon the Provident Fund. Furthermore, a special meeting of the APB was convened to discusssimplified recruitment procedures for the German Forced Labour Compensation Programme.
29. Concerning staff grievances, between 1 July 2001 and 30 June 2002, five staff appeals werereceived by the Joint Administrative Review Board (JARB) and two appeals were subsequentlylodged with the ILO Administrative Tribunal.
30. The IOM Ombudsperson resigned in summer 2002 and his replacement is being recruitedjointly between the Administration and the SAC.

MC/INF/251Annex - English onlyPage 1
Annex
Statistical Overview
IOM STAFF COMPOSITION ………………………………………………………………………….. 2
1. IOM Field Offices (including suboffices), 1998-2002 ……………………………………….. 22. IOM staffing trends, 1998-2002 …………………………………………………………….... 23. Staff by category, location and gender, June 2002 ……………………………………..……. 24 and 5. Officials by age group and location, June 2002 ………………………………………………. 36 and 7. Officials and employees by gender and location, June 2002 …………………………………. 38. Officials within grade - distribution by gender, 1998-2002 ………………………………….. 49. Evolution of the representation of women among officials, 1998-2002 ……………………… 410. Officials by country of nationality and grade, June 2002 …………………………………….. 511. Officials - grade distribution and gender, June 2002 ………………………………………... 612. Headquarters employees by country of nationality and gender, June 2002 ………………….. 713. Field employees by country of nationality and gender, June 2002 ………………………….… 7
RECRUITMENT AND SELECTION … … … … … … … … … … … … … … … … … … … … … … … … … .. 9
14. Vacancy notices issued for officials, 1998-June 2002 … … … … … … … … … … … … … … … .. 915. Officials appointed through vacancy notices, 1998-June 2002 … … … … … … … … … … … … 916. Officials appointed through vacancy notices by gender, 1998-June 2002 … … … … … … … … 917. Mobility of internal staff, 1998-2002 … … … … … … … … … … … … … … … … … … … … … … 1018. Officials appointed through vacancy notices by country of nationality, 1998-2002 … … … … 1019. Vacancy notices issued for employees at Headquarters, 1998-June 2002 … … … … … … … ... 1120. Summary of recruitment and selection processes, 1998-June 2002 … … … … … … … … … … . 12
ALTERNATIVE STAFFING RESOURCES … … … … … … … … … … … … … … … … … … … … … … . 12
21. Associate Experts by nationality, 1996-June 2002… … … … … … … … … … … … … … … … … 12
OTHER CATEGORIES … … … … … … … … … … … … … … … … … … … … … … … … … … … … … … .. 13
22. Interns by gender and duty station, June 2001-June 2002 … … … … … … … … … … … … … … 13
STAFF DEVELOPMENT AND TRAINING … … … … … … … … … … … … … … … … … … … … … … 14
23. Staff development and training activities, 1998-2002 … … … … … … … … … … … … … … … .. 1424. Staff trained by gender, 1998-June 2002 … … … … … … … … … … … … … … … … … … … … .. 1425. Staff trained by location, 1998-June 2002 … … … … … … … … … … … … … … … … … … … … 1426. Staff trained by category, 1998-June 2002 … … … … … … … … … … … … … … … … … … … .. 1527. Staff trained by areas of training and development activity … … … … … … … … … … … … … 15

MC/INF/251Annex – English onlyPage 2
IOM STAFF COMPOSITION
1. IOM Field Offices (includingsuboffices), 1998-2002 2. IOM staffing1 trends, 1998-2002
3. Staff by category, location and gender, June 2002
Headquarters FieldCategory
Women Men Women MenTotal
Officials 2 56 60 79 179 374
Officials, short-term 10 5 58 77 150
Employees 2 81 33 634 736 1 484
Employees, short-term 29 13 409 809 1 260
National Officers 0 0 31 31 62
Associate Experts 1 1 6 6 14
TOTAL 177 112 1 217 1 838 3 344
1 Staff members holding a short-term contract included.2 Unless otherwise specified in this report, all data refers to staff members holding a regular or one-year contract or
having been with the Organization for more than 12 months. The Director General, Deputy Director General,consultants, interns and staff on special leave without pay are excluded.
119 126142
158 165
0
20
40
60
80
100
120
140
160
180
1998 1999 2000 2001 2002
0
250500750
100012501500
175020002250
2500
275030003250
1998 1999 2000 2001 2002
Officials Employees Total

MC/INF/251Annex - English onlyPage 3
4 and 5. Officials by age group and location, June 2002
Officials - age distribution at HQs, June 2002 Officials - age distribution in the Field, June 2002
6 and 7. Officials and employees by gender and location, June 2002
Officials by gender and location, June 2002 Employees by gender and location, June 2002
60 +0.00%
21 - 295.06%
50 - 5916.46
%
40 - 4926.58
%
30 - 3951.90
%
HQs Field0%
10%20%30%40%50%60%70%80%90%
100%
HQs FieldF M
0%10%20%30%40%50%60%70%80%90%
100%
HQs FieldF M
60 +0.00%
21 - 293.57%
50 - 5923.21
%
40 - 4930.36
%
30 - 3942.86
%

MC/INF/251Annex – English onlyPage 4
8. Officials within grade - distribution by gender, 1998-2002
Grade Dec.1998
Dec.1999
Dec.2000
Dec.2001
June2002
% ofwomen 27.7 % 30.6 % 28.1% 35.3% 36.1%
Out of the above percentages women were distributed within grades as follows:P5 and above 13.5% 16.1% 14.1% 10.5% 9.6%
P3-P4 67.3% 62.5% 67.6% 56.4% 54.1% P1-P2 9.6% 16.1% 15.5% 27.4% 29.6% PU 9.6% 5.3% 2.8% 5.7% 6.7% Total 100.0% 100.0% 100.0% 100.0% 100.0%Total number
of women 52 56 71 124 135
% ofmen 72.3% 69.4% 71.9% 64.7% 63.9%
Out of the above percentages men were distributed within grades as follows:P5 and above 36.0% 35.4% 25.8% 20.3% 22.2%
P3-P4 50.7% 53.5% 54.4% 59.5% 59.4% P1-P2 8.1% 7.9% 17.1% 15.8% 14.6% PU 5.2% 3.2% 2.7% 4.4% 3.8% Total 100.0% 100.0% 100.0% 100.0% 100.0%
Total numberof men 136 127 182 227 239
9. Evolution of the representation of women among officials, 1998-2002
(Percentage of women in a grade compared to the total staff in that grade)
Grade Dec.1998
Dec.1999
Dec.2000
Dec.2001
June2002
D2 0.0 % 0.0% 0.0% 0.0% 0.0%
D1 15.8 % 17.6% 17.6% 22.2% 26.3%P5 12.1 % 16.7% 17.9% 22.5% 17.4%P4 37.5 % 32.0% 33.3% 36.0% 40.1%P3 29.4 % 35.8% 32.4% 32.8% 29.8%P2 27.3 % 50.0% 24.2% 48.2% 53.1%P1 100.0 % 50.0% 30.0% 50.0% 54.5%PU 36.4 % 37.5% 28.6% 41.2% 50.0%
Total % ofwomen 27.7 % 30.6% 28.1% 35.3% 36.1%
Total officials 188 183 253 351 374
MC/INF/251Annex - English onlyPage 5
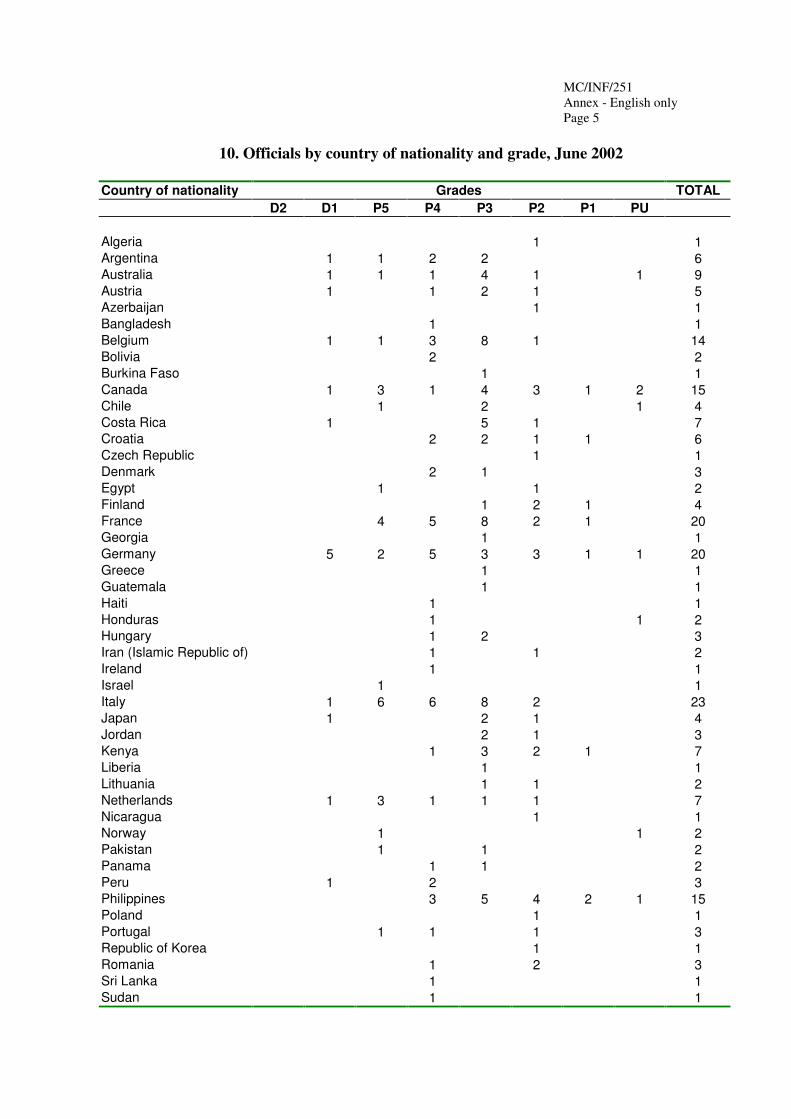
10. Officials by country of nationality and grade, June 2002
Country of nationality Grades TOTALD2 D1 P5 P4 P3 P2 P1 PU
Algeria 1 1Argentina 1 1 2 2 6Australia 1 1 1 4 1 1 9Austria 1 1 2 1 5Azerbaijan 1 1Bangladesh 1 1Belgium 1 1 3 8 1 14Bolivia 2 2Burkina Faso 1 1Canada 1 3 1 4 3 1 2 15Chile 1 2 1 4Costa Rica 1 5 1 7Croatia 2 2 1 1 6Czech Republic 1 1Denmark 2 1 3Egypt 1 1 2Finland 1 2 1 4France 4 5 8 2 1 20Georgia 1 1Germany 5 2 5 3 3 1 1 20Greece 1 1Guatemala 1 1Haiti 1 1Honduras 1 1 2Hungary 1 2 3Iran (Islamic Republic of) 1 1 2Ireland 1 1Israel 1 1Italy 1 6 6 8 2 23Japan 1 2 1 4Jordan 2 1 3Kenya 1 3 2 1 7Liberia 1 1Lithuania 1 1 2Netherlands 1 3 1 1 1 7Nicaragua 1 1Norway 1 1 2Pakistan 1 1 2Panama 1 1 2Peru 1 2 3Philippines 3 5 4 2 1 15Poland 1 1Portugal 1 1 1 3Republic of Korea 1 1Romania 1 2 3Sri Lanka 1 1Sudan 1 1

MC/INF/251Annex – English onlyPage 6
10. Officials by country of nationality and grade, June 2002 (cont.)
Country of nationality Grades TOTALD2 D1 P5 P4 P3 P2 P1 PU
Sweden 1 4 5Switzerland 1 2 6 2 3 14Thailand 3 3 6Ukraine 1 1United Kingdom of Great
Britain and NorthernIreland
2 3 7 4 16
United Republic ofTanzania 1 1
United States of America 4 9 14 26 4 1 2 60Uruguay 1 3 1 2 7Venezuela 1 1Yugoslavia, FR 1 2 3 6Non-Member States 4 8 15 8 2 3 40
TOTAL 1 19 46 84 131 64 11 18 374Member State nationals currently employed on short-term contracts: Albania (2), Slovakia (1) and South Africa (3).
11. Officials - grade distribution and gender, June 2002
0%
20%
40%
60%
80%
100%
M 1 14 38 50 92 30 5 9
F 5 8 34 39 34 6 9
D2 D1 P5 P4 P3 P2 P1 PU

MC/INF/251Annex - English onlyPage 7
12. Headquarters employees by country of nationality and gender, June 2002
Gender GenderCountry of nationality F M Total Country of nationality F M Total
Albania 1 1 Netherlands 1 1Argentina 2 2 Peru 1 1Australia 1 1 Philippines 1 1Azerbaijan 1 1 Portugal 1 1Bosnia and Herzegovina 3 2 5 Romania 1 1 2Canada 1 1 Senegal 1 1Colombia 1 1 Spain 1 1Costa Rica 1 1 Sri Lanka 1 1Croatia 1 1 Switzerland 16 3 19France 22 12 34 The former Yugoslav
Republic of Macedonia2 2
Germany 5 1 6 Turkmenistan 2 2Indonesia 1 1 United Kingdom of
Great Britain andNorthern Ireland
11 1 12
Israel 1 1 Uruguay 2 2Italy 4 4 8 Yugoslavia, FR 2 2 4
Grand total 81 33 114
13. Field employees by country of nationality and gender, June 2002
Gender GenderCountry of nationality F M Total Country of nationality F M Total
Afghanistan 22 372 394 Colombia 51 31 82Albania 26 18 44 Congo 7 27 34Algeria 1 2 3 Costa Rica 13 7 20Angola 7 7 Côte d'Ivoire 1 1 2Argentina 12 2 14 Croatia 16 9 25Armenia 9 6 15 Czech Republic 5 2 7Australia 9 2 11 Dominican Republic 1 1Austria 5 6 11 East Timor 11 131 142Azerbaijan 8 17 25 Ecuador 13 19 32Bangladesh 5 6 11 Egypt 21 15 36Belarus 5 1 6 El Salvador 2 4 6Belgium 8 11 19 Ethiopia 12 11 23Bolivia 1 2 3 Fiji 2 2Bosnia and Herzegovina 38 40 78 Finland 6 5 11Brazil 1 1 France 1 4 5Bulgaria 4 2 6 Gambia 2 1 3Cambodia 8 19 27 Georgia 7 5 12Canada 3 5 8 Germany 20 12 32Cape Verde 1 1 Ghana 14 14 28Chad 1 1 Greece 6 6 12Chile 3 6 9 Guatemala 11 22 33China, Hong Kong Special
Administrative Region4 4 Guinea 3 7 10

MC/INF/251Annex – English onlyPage 8
13. Field employees by country of nationality and gender, June 2002 (cont.)
Gender GenderCountry of nationality F M Total Country of nationality F M Total
Guinea-Bissau 1 1 2 Romania 10 7 17Honduras 3 6 9 Russian Federation 86 39 125Hungary 9 5 14 Rwanda 1 1India 1 2 3 Senegal 12 11 23Indonesia 15 20 35 Sierra Leone 18 47 65Iran (Islamic Republic of) 4 13 17 Slovakia 6 2 8Ireland 1 1 Slovenia 3 3Italy 25 13 38 Somalia 5 2 7Japan 3 3 South Africa 8 7 15Jordan 5 6 11 Spain 3 3Kazakhstan 8 3 11 Sudan 3 10 13Kenya 37 54 91 Sweden 2 2Kiribati 4 4 Switzerland 1 1Kyrgyzstan 3 8 11 Syrian Arab Republic 7 5 12Latvia 1 1 2 Tajikistan 7 24 31Lebanon 2 2 Thailand 11 4 15Lesotho 5 5 The former Yugoslav
Republic of Macedonia19 27 46
Liberia 4 5 9 Tunisia 2 2 4Lithuania 4 4 Turkey 5 7 12Mali 1 1 Turkmenistan 2 3 5Mexico 2 1 3 Tuvalu 1 1Myanmar 1 1 Uganda 2 1 3Nauru 12 14 26 Ukraine 23 17 40Netherlands 27 19 46 United Kingdom of
Great Britain andNorthern Ireland
3 1 4
New Caledonia 1 1 United States of America 22 31 53Nicaragua 3 1 4 Uruguay 1 1Norway 1 1 Uzbekistan 1 1Pakistan 6 12 18 Venezuela 1 2 3Paraguay 1 1 Viet Nam 31 17 48Peru 7 5 12 Yemen 1 1Philippines 10 12 22 Yugoslavia, FR 73 57 130Poland 3 3 Kosovo 86 178 264Portugal 8 2 10 Zambia 2 1 3Republic of Korea 1 1 Zimbabwe 1 1 2Republic of Moldova 5 5 10
Grand total 1 074 1 576 2 650

MC/INF/251Annex - English onlyPage 9
RECRUITMENT AND SELECTION
14. Vacancy notices issued for officials, 1998-June 2002
Vacancy notices issued 1998 1999 2000 2001 June2002
Total number of vacancies issued 22 41 79 87 42 Headquarters positions 6 20 31 33 12 Field positions 16 21 48 54 30 Advertised internally only 14 37 42 58 34 Headquarters positions 1 18 11 13 7 Field positions 13 19 31 45 27 Advertised internally and externally 8 4 37 29 8 Headquarters positions 5 2 20 20 5 Field positions 3 2 17 9 3
15. Officials appointed through vacancy notices3, 1998-June 2002
1998 1999 2000 2001 June2002
Vacancies filled internally 17 31 40 61 21 Headquarters 3 17 10 17 9 Field 14 14 30 44 12Vacancies filled externally 3 5 25 18 5 Headquarters 2 4 15 11 4 Field 1 1 10 7 1
Cancelled / reissued 2 7 16 9 8Pending 10
Total 22 43 81 88 44
16. Officials appointed through vacancy notices by gender, 1998-June 2002
1998 1999 2000 2001 June2002
Officials appointed in Headquarters 5 21 25 28 13 Of which women 2 7 14 16 6Officials appointed in the Field 15 15 40 51 13 Of which women 5 1 12 20 4Total number of officials appointed 20 36 65 79 26Of which women recruited externally 1 3 14 9 1Of which former General Services staff 3 4 7 10 4 Of which women 1 1 3 4 3Percentage of women appointed 35.0% 22.2% 40.0% 45.6% 38.5%
3 The total number of officials is different from the total number of vacancies issued because some vacancies were
issued for more than one position or may have been filled by more than one official on a part-time basis

MC/INF/251Annex – English onlyPage 10
17. Mobility of internal staff, 1998-2002
1998 1999 2000 2001 June2002
From Headquarters to the Field 5 2 1 3 1From the Field to Headquarters 1 3 5 8 4From the Field to the Field 8 9 24 19 10Reassignment within same duty
station 3 17 10 31 6
Total 17 31 40 61 21
18. Officials appointed through vacancy notices by country of nationality, 1998-2002
Nationality 1998 1999 2000 2001 June2002
Afghanistan 4 1 1Albania 1Algeria 1Argentina 1 1 2Australia 2 2 1Austria 1Bangladesh 1Belgium 1 2Bosnia and Herzegovina 4 1Burkina Faso 1Canada 2 4 3 2Chile 1 1 2Costa Rica 1 2 2 1Croatia 1 1 1Czech Republic 1Denmark 1Egypt 1Eritrea 5 1Finland 1France 4 6 5 1Germany 1 4 4 2 4Greece 1Haiti 1 1India 4 1 1Iran (Islamic Republic of) 1Ireland 1 1Israel 1Italy 1 2 5 6 1Japan 2Jordan 1Kenya 1 1 2Liberia 1Mozambique 4 1 1 1
4 Observer State5 Non-Member State

MC/INF/251Annex - English onlyPage 11
18. Officials appointed through vacancy notices by country of nationality, 1998-2002 (cont.)
Nationality 1998 1999 2000 2001 June2002
Netherlands 1 1 1New Zealand 4 1 2Nicaragua 1Norway 1 1Pakistan 2Panama 1 1Peru 1Philippines 1 1 1 5Poland 1 1Portugal 1 1Romania 1 1Russian Federation 4 1Spain 4 1 1 1Sri Lanka 1Sweden 1 2 1 1Switzerland 3 4 3Thailand 1The former Yugoslav Republic of Macedonia 4 1Ukraine 1 1United Kingdom of Great Britain and Northern Ireland 2 2 2 4United Republic of Tanzania 1United States of America 2 5 13 18 3Uruguay 2 1 1Yugoslavia, FR 2 1Total 20 36 65 79 26Number of country nationalities 15 23 29 34 19
19. Vacancy notices issued for employees at Headquarters, 1998-June 2002
Vacancy notices issued 1998 1999 2000 2001 June2002
Total number of vacancies issued 8 7 16 33 9 Advertised internally only 8 7 8 18 5 Advertised internally and externally 8 15 4Total number of positions vacant 8 7 20 36 15
Vacancies filled internally 8 6 11 18 8 Employees from Headquarters 6 2 7 14 5 Employees from the Field 2 4 4 4 3
Vacancies filled externally - 5 8 4Cancelled/reissued 1 4 10
Pending 3
MC/INF/251Annex – English onlyPage 12
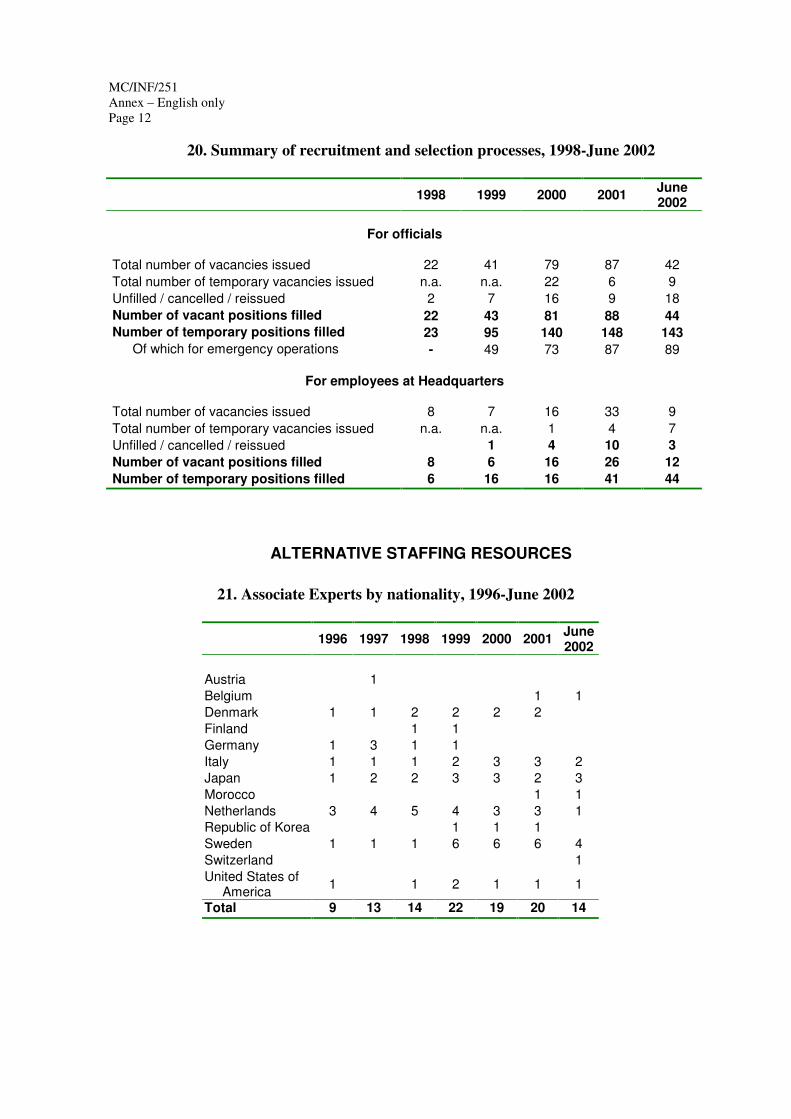
20. Summary of recruitment and selection processes, 1998-June 2002
1998 1999 2000 2001 June2002
For officials
Total number of vacancies issued 22 41 79 87 42 Total number of temporary vacancies issued n.a. n.a. 22 6 9 Unfilled / cancelled / reissued 2 7 16 9 18 Number of vacant positions filled 22 43 81 88 44 Number of temporary positions filled 23 95 140 148 143
Of which for emergency operations - 49 73 87 89
For employees at Headquarters
Total number of vacancies issued 8 7 16 33 9 Total number of temporary vacancies issued n.a. n.a. 1 4 7 Unfilled / cancelled / reissued 1 4 10 3 Number of vacant positions filled 8 6 16 26 12 Number of temporary positions filled 6 16 16 41 44
ALTERNATIVE STAFFING RESOURCES
21. Associate Experts by nationality, 1996-June 2002
1996 1997 1998 1999 2000 2001 June2002
Austria 1Belgium 1 1Denmark 1 1 2 2 2 2Finland 1 1Germany 1 3 1 1Italy 1 1 1 2 3 3 2Japan 1 2 2 3 3 2 3Morocco 1 1Netherlands 3 4 5 4 3 3 1Republic of Korea 1 1 1Sweden 1 1 1 6 6 6 4Switzerland 1United States of
America 1 1 2 1 1 1
Total 9 13 14 22 19 20 14

MC/INF/251Annex - English onlyPage 13
OTHER CATEGORIES
22. Interns by gender and duty station, June 2001-June 2002
Duty station Women Men Total
Headquarters 19 8 27
Director General’s Office 2 2 4 Budget 1 1 Emergency and Post-Conflict Division 1 1 2 External Relations 1 1 Information Technology 1 1 2 Legal Services 1 1 Migration Health Services 2 2 Migration Management Services 1 1 Migration Policy and Research Programme 1 1 Research and Publications 1 1 German Forced Labour Compensation Programme 5 2 7 Staff Development and Training 4 4
Field 28 11 39
Almaty 1 1 Bern 2 2 Brussels 5 3 8 Helsinki 5 1 6 Kyiv 1 1 Manila 1 1 2 Rome 12 12 Sarajevo 2 1 3 Washington, D.C. 3 3 Zagreb 1 1TOTAL 47 19 66

MC/INF/251Annex – English onlyPage 14
STAFF DEVELOPMENT AND TRAINING
23. Staff development and training activities, 1998-2002
1998 1999 2000 2001June2002
Activities organized or financed by SDT 31 62 80 88 45
Total staff members 1 367 1 836 2 466 2 742 3 344
Staff members trained 140 389 440 611 341
24. Staff trained by gender, 1998-June 2002
25. Staff trained by location, 1998-June 2002
307 283394
209
157
217
132
65
82
75
0100200300
400500600700
1998 1999 2000 2001 Jun-02
Field Headquarters
67206
263358
20073
183177
253
141
0
100
200
300
400
500
600
700
1998 1999 2000 2001 Jun-02
Female Male

MC/INF/251Annex - English onlyPage 15
26. Staff trained by category, 1998-June 2002
27. Staff trained by areas of training and development activity
Main Areas 2001 % of totaltrained
June
2002
% of totaltrained
Administration and Management 177 29% 51 15%
Capacity-Building/Communications - - 61 18%
Chiefs of Mission - - 13 4%
Information Technology 41 7% 43 13%
Language Courses 83 14% 82 24%
Migration Health 29 5% 1 0%
Migration and Emergency Management 58 10% 55 16%
Movement Management 11 2% - -Others (Induction, Strategic Planning,
Project Development) 145 24% 35 10%
Report Writing and Computer Layout Skills 41 6% * *
Security 6 1% - -
Stress Management 20 2% - -TOTAL 611 100% 341 100%
* Report writing course in 2002 included under Communications (13 participants)
144
42
163
221
343
163
6
102
43 34
92124
225
190
29
0
50
100
150
200
250
300
350
400
1998 1999 2000 2001 Jun-02
Officials Employees Ungraded