2.1 Exercis es - College of the...
50
Section 2.1 Introduction to Functions 87 Version: Fall 2007 2.1 Exercises In Exercises 1-6, state the domain and range of the given relation. 1. R = {(1, 3), (2, 4), (3, 4)} 2. R = {(1, 3), (2, 4), (2, 5)} 3. R = {(1, 4), (2, 5), (2, 6)} 4. R = {(1, 5), (2, 4), (3, 6)} 5. x 5 y 5 6. x 5 y 5 Copyrighted material. See: http://msenux.redwoods.edu/IntAlgText/ 1 In Exercises 7-12, create a mapping di- agram for the given relation and state whether or not it is a function. 7. The relation in Exercise 1. 8. The relation in Exercise 2. 9. The relation in Exercise 3. 10. The relation in Exercise 4. 11. The relation in Exercise 5. 12. The relation in Exercise 6. 13. Given that g takes a real number and doubles it, then g : x -→?. 14. Given that f takes a real number and divides it by 3, then f : x -→ ?. 15. Given that g takes a real number and adds 3 to it, then g : x -→ ?. 16. Given that h takes a real number and subtracts 4 from it, then h : x -→ ?. 17. Given that g takes a real number, doubles it, then adds 5, then g : x -→ ?. 18. Given that h takes a real number, subtracts 3 from it, then divides the re- sult by 4, then h : x -→ ?. Given that the function f is defined by the rule f : x -→ 3x - 5, determine where the input number is mapped in Exercises 19-22. 19. f :3 -→ ?
Transcript of 2.1 Exercis es - College of the...

Section 2.1 Introduction to Functions 87
Version: Fall 2007
2.1 Exercises
In Exercises 1-6, state the domain andrange of the given relation.
1. R = {(1, 3), (2, 4), (3, 4)}
2. R = {(1, 3), (2, 4), (2, 5)}
3. R = {(1, 4), (2, 5), (2, 6)}
4. R = {(1, 5), (2, 4), (3, 6)}
5.
x5
y5
6.
x5
y5
Copyrighted material. See: http://msenux.redwoods.edu/IntAlgText/1
In Exercises 7-12, create a mapping di-agram for the given relation and statewhether or not it is a function.
7. The relation in Exercise 1.
8. The relation in Exercise 2.
9. The relation in Exercise 3.
10. The relation in Exercise 4.
11. The relation in Exercise 5.
12. The relation in Exercise 6.
13. Given that g takes a real numberand doubles it, then g : x −→?.
14. Given that f takes a real numberand divides it by 3, then f : x −→ ?.
15. Given that g takes a real numberand adds 3 to it, then g : x −→ ?.
16. Given that h takes a real numberand subtracts 4 from it, then h : x −→ ?.
17. Given that g takes a real number,doubles it, then adds 5, then g : x −→ ?.
18. Given that h takes a real number,subtracts 3 from it, then divides the re-sult by 4, then h : x −→ ?.
Given that the function f is defined bythe rule f : x −→ 3x − 5, determinewhere the input number is mapped inExercises 19-22.
19. f : 3 −→ ?

88 Chapter 2 Functions
Version: Fall 2007
20. f : −5 −→ ?
21. f : a −→ ?
22. f : 2a+ 3 −→ ?
Given that the function f is defined bythe rule f : x −→ 4 − 5x, determinewhere the input number is mapped inExercises 23-26.
23. f : 2 −→ ?
24. f : −3 −→ ?
25. f : a −→ ?
26. f : 2a+ 11 −→ ?
Given that the function f is defined bythe rule f : x −→ x2 − 4x − 6, deter-mine where the input number is mappedin Exercises 27-30.
27. f : 1 −→ ?
28. f : −2 −→ ?
29. f : −1 −→ ?
30. f : a −→ ?
Given that the function f is defined bythe rule f : x −→ 3x − 9, determinewhere the input number is mapped inExercises 31-34.
31. f : a −→ ?
32. f : a+ 1 −→ ?
33. f : 2a− 5 −→ ?
34. f : a+ h −→ ?
Given that the functions f and g are de-fined by the rules f : x −→ 2x + 3 andg : x −→ 4− x, determine where the in-put number is mapped in Exercises 35-38.
35. f : 2 −→ ?
36. g : 2 −→ ?
37. f : a+ 1 −→ ?
38. g : a− 3 −→ ?
39. Given that g takes a real numberand triples it, then g(x) = ?.
40. Given that f takes a real numberand divides it by 5, then f(x) = ?.
41. Given that g takes a real numberand subtracts it from 10, then g(x) = ?.
42. Given that f takes a real number,multiplies it by 5 and then adds 4 to theresult, then f(x) = ?.
43. Given that f takes a real number,doubles it, then subtracts the result from11, then f(x) = ?.
44. Given that h takes a real number,doubles it, adds 5, then takes the squareroot of the result, then h(x) = ?.
In Exercises 45-54, evaluate the givenfunction at the given value b.
45. f(x) = 12x+ 2 for b = 6.
46. f(x) = −11x− 4 for b = −3.
47. f(x) = −9x− 1 for b = −5.
48. f(x) = 11x+ 4 for b = −4.

Section 2.1 Introduction to Functions 89
Version: Fall 2007
49. f(x) = 4 for b = −12.
50. f(x) = 7 for b = −7.
51. f(x) = 0 for b = −7.
52. f(x) = 12x+ 8 for b = −3.
53. f(x) = −9x+ 3 for b = −1.
54. f(x) = 6x− 3 for b = 3.
In Exercises 55-58, given that the func-tion f is defined by the rule f(x) = 2x+7, determine where the input number ismapped.
55. f(a) = ?
56. f(a+ 1) = ?
57. f(3a− 2) = ?
58. f(a+ h) = ?
In Exercises 59-62, given that the func-tion g is defined by the rule g(x) = 3 −2x, determine where the input number ismapped.
59. g(a) = ?
60. g(a+ 3) = ?
61. g(2− 5a) = ?
62. g(a+ h) = ?
Given that the functions f and g aredefined by the rules f(x) = 1 − x andg(x) = 2x+ 13, determine where the in-put number is mapped in Exercises 63-66.
63. f(a) = ?
64. g(a) = ?
65. f(a+ 3) = ?
66. g(4− a) = ?
Given that the functions f and g are de-fined by the rules f(x) = 3x + 4 andg(x) = 2x−5, determine where the inputnumber is mapped in Exercises 67-70.
67. f(g(2)) = ?
68. g(f(2)) = ?
69. f(g(a)) = ?
70. g(f(a)) = ?
Given that the functions f and g are de-fined by the rules f(x) = 2x − 9 andg(x) = 11, determine where the inputnumber is mapped in Exercises 71-74.
71. f(g(2)) = ?
72. g(f(2)) = ?
73. f(g(a)) = ?
74. g(f(a)) = ?
Use set-builder notation to describe thedomain of each of the functions definedin Exercises 75-78.
75. f(x) = 93x+ 98
76. f(x) = 54x+ 65
77. f(x) = − 87x− 88
78. f(x) = − 30x− 52

90 Chapter 2 Functions
Version: Fall 2007
Use set-builder and interval notation todescribe the domain of the functions de-fined in Exercises 79-82.
79. f(x) =√x+ 69
80. f(x) =√x+ 62
81. f(x) =√x− 81
82. f(x) =√x− 98
Two integers are said to be relatively primeif their greatest common divisor is 1. Forexample, the greatest common divisor of6 and 35 is 1, so 6 and 35 are relativelyprime. On the other hand, the greatestcommon divisor of 14 and 21 is not 1(it is 7), so 14 and 21 are not relativelyprime. The Euler !-function is definedas follows:
• If n = 1, then !(n) = 1.• If n > 1, then !(n) is the number of
positive integers less than n that arerelatively prime to n. In Exercises 83-84, evaluate the Euler !-function atthe given input.
83. !(12)
84. !(36)

Section 2.1 Introduction to Functions 91
Version: Fall 2007
2.1 Answers
1. Domain = {1, 2, 3}, Range = {3, 4}
3. Domain = {1, 2}, Range = {4, 5, 6}
5. Domain = {1, 2, 3}, Range = {1, 2, 3, 4}
7.
R
123
34
Function.
9.
R
12
456
Not a function.
11.
R
123
1234
Not a function.
13. g : x −→ 2x
15. g : x −→ x+ 3
17. g : x −→ 2x+ 5
19. f : 3 −→ 4
21. f : a −→ 3a− 5
23. f : 2 −→ −6
25. f : a −→ 4− 5a
27. f : 1 −→ −9
29. f : −1 −→ −1
31. f : a −→ 3a− 9
33. f : 2a− 5 −→ 6a− 24
35. f : 2 −→ 7
37. f : a+ 1 −→ 2a+ 5
39. g(x) = 3x
41. g(x) = 10− x
43. f(x) = 11− 2x
45. 74
47. 44
49. 4
51. 0
53. 12
55. f(a) = 2a+ 7
57. f(3a− 2) = 6a+ 3
59. g(a) = 3− 2a
61. g(2− 5a) = 10a− 1
63. f(a) = 1− a
65. f(a+ 3) = −a− 2

92 Chapter 2 Functions
Version: Fall 2007
67. f(g(2)) = 1
69. f(g(a)) = 6a− 11
71. f(g(2)) = 13
73. f(g(a)) = 13
75. Domain = {x : x $= −98}
77. Domain = {x : x $= 88}
79. Domain = [−69,∞) = {x : x ≥−69}
81. Domain = [81,∞) = {x : x ≥ 81}
83. !(12) = 4

Section 2.2 The Graph of a Function 109
Version: Fall 2007
2.2 Exercises
Perform each of the following tasks forthe functions defined by the equations inExercises 1-8.
i. Set up a table of points that satisfythe given equation. Please place thistable of points next to your graph onyour graph paper.
ii. Set up a coordinate system on a sheetof graph paper. Label and scale eachaxis, then plot each of the points fromyour table on your coordinate system.
iii. If you are confident that you “see”the shape of the graph, make a “leapof faith” and plot all pairs that sat-isfy the given equation by drawinga smooth curve (free-hand) on yourcoordinate system that contains allpreviously plotted points (use a ruleronly if the graph of the equation isa line). If you are not confident thatyou “see” the shape of the graph, thenadd more points to your table, plotthem on your coordinate system, andsee if this helps. Continue this processuntil you “see” the shape of the graphand can fill in the rest of the pointsthat satisfy the equation by drawinga smooth curve (or line) on your co-ordinate system.
1. f(x) = 2x+ 1
2. f(x) = 1! x
3. f(x) = 3! 12 x
4. f(x) = !1 + 12 x
5. f(x) = x2 ! 2
6. f(x) = 4! x2
Copyrighted material. See: http://msenux.redwoods.edu/IntAlgText/1
7. f(x) = 12 x
2 ! 6
8. f(x) = 8! 12 x
2
Perform each of the following tasks forthe functions Exercises 9-10.
i. Set up a coordinate system on a sheetof graph paper. Label and scale eachaxis.
ii. Use the table feature of your graph-ing calculator to evaluate the func-tion at the given values of x. Recordthese results in a table next to yourcoordinate system on your graph pa-per.
iii. Plot the points in the table on yourcoordinate system then use them todraw the graph of the given function.Label the graph with its equation.
9. f(x) ="x! 4 at x = 4, 5, 6, 7, 8,
9, and 10.
10. f(x) ="
4! x at x = !10, !8,!6, !4, !2, 0, 2, and 4.
In Exercises 11-14, the graph of thegiven function is a parabola, a graph thathas a “U-shape.” A parabola has onlyone turning point. For each exercise, per-form the following tasks.
i. Load the equation into the Y= menuof your graphing calculator. Adjustthe WINDOW parameters so that the“turning point” (actually called thevertex) is visible in the viewing win-dow.
ii. Make a reasonable copy of the imagein the viewing window on your home-

110 Chapter 2 Functions
Version: Fall 2007
work paper. Draw all lines with aruler (including the axes), but drawcurves freehand. Label and scale eachaxis with xmin, xmax, ymin, and ymax.Label the graph with its equation.
11. f(x) = x2 ! x! 30
12. f(x) = 24! 2x! x2
13. f(x) = 11 + 10x! x2
14. f(x) = x2 + 11x! 12
Each of the equations in Exercises 15-18 are called “cubic polynomials.” Eachequation has been carefully chosen so thatits graph has exactly two “turning points.”For each exercise, perform each of thefollowing tasks.
i. Load the equation into the Y= menuof your graphing calculator and ad-just the WINDOW parameters so thatboth “turning points” are visible inthe viewing window.
ii. Make a reasonable copy of the graphin the viewing window on your home-work paper. Label and scale eachaxis with xmin, xmax, ymin, and ymax,then label the graph with its equa-tion. Remember to draw all lines witha ruler.
15. f(x) = x3 ! 2x2 ! 29x+ 30
16. f(x) = !x3 + 2x2 + 19x! 20
17. f(x) = x3 + 8x2 ! 53x! 60
18. f(x) = !x3 + 16x2 ! 43x! 60
Perform each of the following tasks forthe equations in Exercises 19-22.
i. Load the equation into the Y= menu.Adjust the WINDOW parameters untilyou think all important behavior (“turn-ing points,” etc.) is visible in theviewing window. Note: This is moredi!cult than it sounds, particularlywhen we have no advance notion ofwhat the graph might look like. How-ever, experiment with several settingsuntil you “discover” the settings thatexhibit the most important behavior.
ii. Copy the image on the screen ontoyour homework paper. Label and scaleeach axis with xmin, xmax, ymin, andymax. Label the graph with its equa-tion.
19. f(x) = 2x2 ! x! 465
20. f(x) = x3 ! 24x2 + 65x+ 1050
21. f(x) = x4 ! 2x3 ! 168x2 + 288x+3456
22. f(x) = !x4!3x3 +141x2 +523x!660

Section 2.2 The Graph of a Function 111
Version: Fall 2007
2.2 Answers
1.
x f(x) = 2x+ 1 (x, f(x))!2 !3 (!2,!3)!1 !1 (!1,!1)0 1 (0, 1)1 3 (1, 3)
x5
y5 f(x)=2x+1
3.
x f(x) = 3! x/2 (x, f(x))!2 4 (!2, 4)0 3 (0, 3)2 2 (2, 2)4 1 (4, 1)
x5
y5f(x)=3!x/2
5.
x f(x) = x2 ! 2 (x, f(x))!3 7 (!3, 7)!2 2 (!2, 2)!1 !1 (!1,!1)0 !2 (0,!2)1 !1 (1,!1)2 2 (2, 2)3 7 (3, 7)
x10
y10 f(x)=x2!2
7.
x f(x) = x2/2! 6 (x, f(x))!4 2 (!4, 2)!2 !4 (!2,!4)0 !6 (0,!6)2 !4 (2,!4)4 2 (4, 2)

112 Chapter 2 Functions
Version: Fall 2007
x10
y10 f(x)=x2/2!6
9.
x f(x) ="x! 4 (x, f(x))
4 0 (4, 0)5 1 (5, 1)6 1.4142 (6, 1.4142)7 1.7321 (7, 1.7321)8 2 (8, 2)9 2.2361 (9, 2.2361)10 2.4495 (10, 2.4495)
x10
y10
f(x)="x!4
11.
x!10 10
y
!50
50f(x)=x2!x!30
13.
x!5 15
y
!50
50
f(x)=11+10x!x2
15.
x!10 10
y
!100
100f(x)=x3!2x2!29x+30

Section 2.2 The Graph of a Function 113
Version: Fall 2007
17.
x!15 10
y
!400
400
f(x)=x3+8x2!53x!60
19.
x!20 20
y
!600
600
f(x)=2x2!x!465
21.
x!15 15
y
!6000
6000
f(x)=x4!2x3!168x2+288x+3456


Section 2.3 Interpreting the Graph of a Function 129
Version: Fall 2007
2.3 Exercises
For Exercises 1-6, perform each of thefollowing tasks.
i. Make a copy of the graph on a sheetof graph paper and apply the verticalline test.
ii. Write a complete sentence stating whetheror not the graph represents a func-tion. Explain the reason for your re-sponse.
1.
x
y
5
5
2.
x
y
5
5
Copyrighted material. See: http://msenux.redwoods.edu/IntAlgText/1
3.
x
y
5
5
4.
x
y
5
5
5.
x
y
5
5

130 Chapter 2 Functions
Version: Fall 2007
6.
x
y
5
5
In Exercises 7-12, perform each of thefollowing tasks.
i. Make an exact copy of the graph ofthe function f on a sheet of graph pa-per. Label and scale each axis. Re-member to draw all lines with a ruler.
ii. Use the technique of Examples 3 and4 in the narrative to evaluate the func-tion at the given value. Draw and la-bel the arrows as shown in Figures 4and 5 in the narrative.
7. Use the graph of f to determine f(2).
x
y
5
5
f
8. Use the graph of f to determine f(3).
x
y
5
5
f
9. Use the graph of f to determine f(!2).
x
y
5
5
f
10. Use the graph of f to determinef(1).
x
y
5
5
f

Section 2.3 Interpreting the Graph of a Function 131
Version: Fall 2007
11. Use the graph of f to determinef(1).
x
y
5
5
f
12. Use the graph of f to determinef(!2).
x
y
5
5
f
In Exercises 13-18, perform each of thefollowing tasks.
i. Make an exact copy of the graph ofthe function f on a sheet of graph pa-per. Label and scale each axis. Re-member to draw all lines with a ruler.
ii. Use the technique of Example 5 in thenarrative to find the value of x thatmaps onto the given value. Draw andlabel the arrows as shown in Figure 6in the narrative.
13. Use the graph of f to solve theequation f(x) = !2.
x
y
5
5
f
14. Use the graph of f to solve theequation f(x) = 1.
x
y
5
5
f
15. Use the graph of f to solve theequation f(x) = 2.
x
y
5
5f

132 Chapter 2 Functions
Version: Fall 2007
16. Use the graph of f to solve theequation f(x) = !2.
x
y
5
5
f
17. Use the graph of f to solve theequation f(x) = 2.
x
y
5
5f
18. Use the graph of f to solve theequation f(x) = !3.
x
y
5
5
f
In the Exercises 19-22, perform each ofthe following tasks.
i. Make a copy of the graph of f on asheet of graph paper. Label and scaleeach axis.
ii. Using a di!erent colored pen or pen-cil, project each point on the graphof f onto the x-axis. Shade the re-sulting domain on the x-axis.
iii. Use both set-builder and interval no-tation to describe the domain.
19.
x
y5
5
f
20.
x
y5
5f

Section 2.3 Interpreting the Graph of a Function 133
Version: Fall 2007
21.
x
y5
5
f
22.
x
y5
5
f
In Exercises 23-26, perform each of thefollowing tasks.
i. Make a copy of the graph of f on asheet of graph paper. Label and scaleeach axis.
ii. Using a di!erent colored pen or pen-cil, project each point on the graphof f onto the y-axis. Shade the re-sulting range on the y-axis.
iii. Use both set-builder and interval no-tation to describe the range.
23.
x
y5
5
f
24.
x
y5
5
f
25.
x
y5
5
f

134 Chapter 2 Functions
Version: Fall 2007
26.
x
y5
5
f
In Exercises 27-30, perform each of thefollowing tasks.
i. Use your graphing calculator to drawthe graph of the given function. Makea reasonably accurate copy of the im-age in your viewing screen on yourhomework paper. Label and scale eachaxis with the WINDOW parameters xmin,xmax, ymin, and ymax. Label thegraph with its equation.
ii. Using a colored pencil, project eachpoint on the graph onto the x-axis;i.e., shade the domain on the x-axis.Use interval and set-builder notationto describe the domain.
iii. Use a purely algebraic technique, asdemonstrated in Example 8 in the nar-rative, to find the domain. Comparethis result with that found in part (ii).
iv. Using a di!erent colored pencil, projecteach point on the graph onto the y-axis; i.e., shade the range on the y-axis. Use interval and set-builder no-tation to describe the range.
27. f(x) ="x+ 5.
28. f(x) ="
5! x.
29. f(x) = !"
4! x.
30. f(x) = !"x+ 4.

Section 2.3 Interpreting the Graph of a Function 135
Version: Fall 2007
2.3 Answers
1. Note that in the figure below a ver-tical line cuts the graph more than once.Therefore, the graph does not representthe graph of a function.
x
y
5
5
3. No vertical line cuts the graph morethan once (see figure below). Therefore,the graph represents a function.
x
y
5
5
5. Note that in the figure below a ver-tical line cuts the graph more than once.Therefore, the graph does not representthe graph of a function.
x
y
5
5
7. f(2) = !1
x
y
5
5
f
2f(2)
9. f(!2) = 1
x
y
5
5
f
!2f(!2)

136 Chapter 2 Functions
Version: Fall 2007
11. f(1) = 3
x
y
5
5
f 1
f(1)
13. The solution of f(x) = !2 is x =!3.
x
y
5
5
f
!2
!3
15. The solution of f(x) = 2 is x = !2.
x
y
5
5f
2
!2
17. The solution of f(x) = 2 is x = !1.
x
y
5
5f
2
!1
19. {x : x > !3} = (!3,#)
x
y5
5
f
21. {x : x < 0} = (!#, 0)
x
y5
5
f

Section 2.3 Interpreting the Graph of a Function 137
Version: Fall 2007
23. {y : y < 1} = (!#, 1)
x
y5
5
f
25. {y : y > !2} = (!2,#)
x
y5
5
f
27. Domain = [!5,#)={x : x $ !5}
x10!10
y10
!10
f
!5
Range = {y : y $ 0} = [0,#)
x10!10
y10
!10
f
0
29. Domain = (!#, 4] = {x : x % 4}
x10!10
y10
!10
f
4
Range = {y : y % 0} = (!#, 0]
x10!10
y10
!10
f
0


Section 2.4 Solving Equations and Inequalities by Graphing 153
Version: Fall 2007
2.4 Exercises
In Exercises 1-6, you are given the de-finition of two functions f and g. Com-pare the functions, as in Example 1 ofthe narrative, at the given values of x.
1. f(x) = x+2, g(x) = 4!x at x = !3,1, and 2.
2. f(x) = 2x ! 3, g(x) = 3 ! x at x =!4, 2, and 5.
3. f(x) = 3!x, g(x) = x+9 at x = !4,!3, and !2.
4. f(x) = x2, g(x) = 4x+ 5 at x = !2,1, and 6.
5. f(x) = x2, g(x) = !3x ! 2 at x =!3, !1, and 0.
6. f(x) = |x|, g(x) = 4! x at x = 1, 2,and 3.
In Exercises 7-12, perform each of thefollowing tasks. Remember to use a rulerto draw all lines.
i. Make an accurate copy of the imageon graph paper (label each equation,label and scale each axis), drop a dashedvertical line through the point of in-tersection, then label and shade thesolution of f(x) = g(x) on the x-axis.
ii. Make a second copy of the image ongraph paper, drop a dashed, verticalline through the point of intersection,then label and shade the solution off(x) > g(x) on the x-axis. Use set-builder and interval notation to de-scribe your solution set.
iii. Make a third copy of the image on
Copyrighted material. See: http://msenux.redwoods.edu/IntAlgText/1
graph paper, drop a dashed, verticalline through the point of intersection,then label and shade the solution off(x) < g(x) on the x-axis. Use set-builder and interval notation to de-scribe your solution set.
7.
x5
y5 f
g
8.
x5
y5
f
g

154 Chapter 2 Functions
Version: Fall 2007
9.
x5
y5
f
g
10.
x5
y5
f
g
11.
x5
y5
f
g
12.
x5
y5
f
g
In Exercises 13-16, perform each of thefollowing tasks. Remember to use a rulerto draw all lines.
i. Make an accurate copy of the imageon graph paper, drop dashed, verti-cal lines through the points of inter-section, then label and shade the so-lution of f(x) " g(x) on the x-axis.Use set-builder and interval notationto describe your solution set.
ii. Make a second copy of the image ongraph paper, drop dashed, vertical linesthrough the points of intersection, thenlabel and shade the solution of f(x) <g(x) on the x-axis. Use set-builderand interval notation to describe yoursolution set.

Section 2.4 Solving Equations and Inequalities by Graphing 155
Version: Fall 2007
13.
x5
y5
f
g
14.
x5
y5 f
g
15.
x5
y5 f
g
16.
x5
y5
f
g
In Exercises 17-20, perform each of thefollowing tasks. Remember to use a rulerto draw all lines.
i. Load each side of the equation intothe Y= menu of your calculator. Ad-just the WINDOW parameters so thatthe point of intersection of the graphsis visible in the viewing window. Usethe intersect utility in the CALC menuof your calculator to determine thex-coordinate of the point of intersec-tion.
ii. Make an accurate copy of the imagein your viewing window on your home-work paper. Label and scale eachaxis with xmin, xmax, ymin, and ymax,and label each graph with its equa-tion.
iii. Draw a dashed, vertical line throughthe point of intersection. Shade andlabel the solution of the equation onthe x-axis.
17. 1.23x! 4.56 = 3.46! 2.3x
18. 2.23x! 1.56 = 5.46! 3.3x
19. 5.46! 1.3x = 2.2x! 5.66
20. 2.46! 1.4x = 1.2x! 2.66

156 Chapter 2 Functions
Version: Fall 2007
In Exercises 21-26, perform each of thefollowing tasks. Remember to use a rulerto draw all lines.
i. Load each side of the inequality intothe Y= menu of your calculator. Ad-just the WINDOW parameters so thatthe point(s) of intersection of the graphsis visible in the viewing window. Usethe intersect utility in the CALC menuof your calculator to determine thecoordinates of the point(s) of inter-section.
ii. Make an accurate copy of the imagein your viewing window on your home-work paper. Label and scale eachaxis with xmin, xmax, ymin, and ymax,and label each graph with its equa-tion.
iii. Draw a dashed, vertical line throughthe point(s) of intersection. Shadeand label the solution of the inequal-ity on the x-axis. Use both set-builderand interval notation to describe thesolution set.
21. 1.6x+ 1.23 " !2.3x! 4.2
22. 1.24x+ 5.6 < 1.2! 0.52x
23. 0.15x! 0.23 > 8.2! 0.6x
24. !1.23x! 9.76 # 1.44x+ 22.8
25. 0.5x2 ! 5 < 1.23! 0.75x
26. 4! 0.5x2 # 0.72x! 1.34
In Exercises 27-30, perform each of thefollowing tasks. Remember to use a rulerto draw all lines.
i. Make an accurate copy of the imageon graph paper (label the graph withthe letter f and label and scale eachaxis), drop a dashed vertical line throughthe x-intercept of the graph of f , thenlabel and shade the solution of f(x) =0 on the x-axis. Use set-builder no-tation to describe your solution.
ii. Make a second copy of the image ongraph paper, drop a dashed, verti-cal line through the x-intercept of thegraph of f , then label and shade thesolution of f(x) > 0 on the x-axis.Use set-builder and interval notationto describe your solution set.
iii. Make a third copy of the image ongraph paper, drop a dashed, verti-cal line through the x-intercept of thegraph of f , then label and shade thesolution of f(x) < 0 on the x-axis.Use set-builder and interval notationto describe your solution set.
27.
x5
y5
f

Section 2.4 Solving Equations and Inequalities by Graphing 157
Version: Fall 2007
28.
x5
y5
f
29.
x5
y5
f
30.
x5
y5 f
In Exercises 31-34, perform each of thefollowing tasks. Remember to use a rulerto draw all lines.
i. Make an accurate copy of the imageon graph paper, drop dashed, ver-tical lines through the x-intercepts,then label and shade the solution off(x) " 0 on the x-axis. Use set-builder and interval notation to de-scribe your solution set.
ii. Make a second copy of the image ongraph paper, drop dashed, vertical linesthrough the x-intercepts, then labeland shade the solution of f(x) < 0 onthe x-axis. Use set-builder and inter-val notation to describe your solutionset.
31.
x5
y5
f

158 Chapter 2 Functions
Version: Fall 2007
32.
x5
y5 f
33.
x5
y5
f
34.
x5
y5
f
In Exercises 35-38, perform each of thefollowing tasks. Remember to use a rulerto draw all lines.
i. Load the given function f into theY= menu of your calculator. Adjustthe WINDOW parameters so that the x-intercept(s) of the graph of f is vis-ible in the viewing window. Use thezero utility in the CALC menu of yourcalculator to determine the coordi-nates of the x-intercept(s) of the graphof f .
ii. Make an accurate copy of the imagein your viewing window on your home-work paper. Label and scale eachaxis with xmin, xmax, ymin, and ymax,and label the graph with its equation.
iii. Draw a dashed, vertical line throughthe x-intercept(s). Shade and labelthe solution of the inequality f(x) >0 on the x-axis. Use both set-builderand interval notation to describe thesolution set.
35. f(x) = !1.25x+ 3.58
36. f(x) = 1.34x! 4.52
37. f(x) = 1.25x2 + 4x! 5.9125
38. f(x) = !1.32x2 ! 3.96x+ 5.9532
In Exercises 39-42, perform each of thefollowing tasks. Remember to use a rulerto draw all lines.
i. Load the given function f into theY= menu of your calculator. Adjustthe WINDOW parameters so that the x-intercept(s) of the graph of f is vis-ible in the viewing window. Use thezero utility in the CALC menu of yourcalculator to determine the coordi-nates of the x-intercept(s) of the graphof f .
ii. Make an accurate copy of the image

Section 2.4 Solving Equations and Inequalities by Graphing 159
Version: Fall 2007
in your viewing window on your home-work paper. Label and scale eachaxis with xmin, xmax, ymin, and ymax,and label the graph with its equation.
iii. Draw a dashed, vertical line throughthe x-intercept(s). Shade and labelthe solution of the inequality f(x) #0 on the x-axis. Use both set-builderand interval notation to describe thesolution set.
39. f(x) = !1.45x! 5.6
40. f(x) = 1.35x+ 8.6
41. f(x) = !1.11x2!5.9940x+ 1.2432
42. f(x) = 1.22x2 ! 6.3440x+ 1.3176

160 Chapter 2 Functions
Version: Fall 2007
2.4 Answers
1. f(!3) < g(!3), f(1) = g(1), andf(2) > g(2).
3. f(!4) > g(!4), f(!3) = g(!3), andf(!2) < g(!2).
5. f(!3) > g(!3), f(!1) = g(!1), andf(0) > g(0).
7. The solution of f(x) = g(x) is x = 3.
x5
y5 f
g
3
The solution of f(x) > g(x) is (3,$) ={x : x > 3}.
x5
y5 f
g
3
The solution of f(x) < g(x) is (!$, 3) ={x : x < 3}.
x5
y5 f
g
3
9. The solution of f(x) = g(x) is x =!2.
x5
y5
f
g
!2

Section 2.4 Solving Equations and Inequalities by Graphing 161
Version: Fall 2007
The solution of f(x) > g(x) is (!$,!2) ={x : x < !2}.
x5
y5
f
g
!2
The solution of f(x) < g(x) is (!2,$) ={x : x > !2}.
x5
y5
f
g
!2
11. The solution of f(x) = g(x) is x =3.
x5
y5
f
g3
The solution of f(x) > g(x) is (3,$) ={x : x > 3}.
x5
y5
f
g3
The solution of f(x) < g(x) is (!$, 3) ={x : x < 3}.
x5
y5
f
g3
13. The solution of f(x) " g(x) is [!3, 3] ={x : !3 # x # 3}.
x5
y5
f
g
!3 3

162 Chapter 2 Functions
Version: Fall 2007
The solution of f(x) < g(x) is(!$,!3) % (3,$)={x : x < !3 or x > 3}.
x5
y5
f
g
!3 3
15. The solution of f(x) " g(x) is(!$,!2] % [2,$)={x : x # !2 or x " 2}.
x5
y5 f
g
!2 2
The solution of f(x) < g(x) is (!2, 2) ={x : !2 < x < 2}.
x5
y5 f
g
!2 2
17. x = 2.271955
x10!10
y10
!10
y=1.23x!4.56
y=3.46!2.3x
2.271955
19. x = 3.177143
x10!10
y10
!10
y=5.46!1.3x
y=2.2x!5.66
3.177143

Section 2.4 Solving Equations and Inequalities by Graphing 163
Version: Fall 2007
21. [!1.392308,$) = {x : x " !1.392308}
x10!10
y10
!10
y=1.6x+1.23
y=!2.3x!4.2
!1.392308
23. (11.24,$) = {x : x > 11.24}
x!5 15
y
!10
10
y=0.15x!0.23
y=8.2!0.6x11.24
25. (!4.358670, 2.858670)= {x : !4.358670 < x < 2.858670}
x10!10
y10
!10
y=0.5x2!5
y=1.23!0.75x
!4.358670 2.858670
27. The solution of f(x) = 0 is x = !1.
x5
y5
f
!1
The solution of f(x) > 0 is (!1,$) ={x : x > !1}.
x5
y5
f
!1
The solution of f(x) < 0 is (!$,!1) ={x : x < !1}
x5
y5
f
!1

164 Chapter 2 Functions
Version: Fall 2007
29. The solution of f(x) = 0 is x = 2.
x5
y5
f
2
The solution of f(x) > 0 is (!$, 2) ={x : x < 2}.
x5
y5
f
2
The solution of f(x) < 0 is (2,$) = {x :x > 2}
x5
y5
f
2
31. The solution of f(x) " 0 is [!3, 2] ={x : !3 # x # 2}.
x5
y5
f
!3 2
The solution of f(x) < 0 is (!$,!3) %(2,$) = {x : x < !3 or x > 2}.
x5
y5
f
!3 2
33. The solution of f(x) " 0 is (!$,!2]%[1,$) = {x : x # !2 or x " 1}.
x5
y5
f
!2 1

Section 2.4 Solving Equations and Inequalities by Graphing 165
Version: Fall 2007
The solution of f(x) < 0 is (!2, 1) = {x :!2 < x < 1}.
x5
y5
f
!2 1
35. (!$, 2.8640) = {x : x < 2.8640}
x10!10
y10
!10 f(x)=!1.25x+3.58
2.8640
37. (!$,!4.3) % (1.1,$) = {x : x <!4.3 or x > 1.1}
x10!10
y10
!10
f(x)=1.25x2+4x!5.9125
!4.3 1.1
39. [!3.8621,$) = {x : x " !3.8621}
x10!10
y10
!10
f(x)=!1.45x!5.6
!3.8621
41. (!$,!5.6] % [0.2,$) = {x : x #!5.6 or x " 0.2}
x10!10
y10
!10
f(x)=!1.11x2!5.9940x+1.2432
!5.6 0.2


Section 2.5 Vertical Geometric Transformations 183
Version: Fall 2007
2.5 Exercises
Pictured below is the graph of a functionf .
x10
y10
f
The table that follows evaluates thefunction f in the plot at key values of x.Notice the horizontal format, where thefirst point in the table is the ordered pair(!4, 0).
x !4 !3 0 2 5 6f(x) 0 4 4 !4 !4 0
Use the graph and the table to completeeach of following tasks for Exercises 1-10.
i. Set up a coordinate system on graphpaper. Label and scale each axis, thencopy and label the original graph off onto your coordinate system. Re-member to draw all lines with a ruler.
ii. Use the original table to help com-plete the table for the given functionin the exercise.
iii. Using a di!erent colored pencil, plotthe data from your completed tableon the same coordinate system as theoriginal graph of f . Use these points
Copyrighted material. See: http://msenux.redwoods.edu/IntAlgText/1
to help complete the graph of the givenfunction in the exercise, then labelthis graph with its equation given inthe exercise.
1. y = 2f(x).
x !4 !3 0 2 5 6y
2. y = (1/2)f(x).
x !4 !3 0 2 5 6y
3. y = !f(x).
x !4 !3 0 2 5 6y
4. y = f(x)! 2.
x !4 !3 0 2 5 6y
5. y = f(x) + 4.
x !4 !3 0 2 5 6y
6. y = !2f(x).
x !4 !3 0 2 5 6y

184 Chapter 2 Functions
Version: Fall 2007
7. y = (!1/2)f(x).
x !4 !3 0 2 5 6y
8. y = !f(x) + 3.
x !4 !3 0 2 5 6y
9. y = !f(x)! 2.
x !4 !3 0 2 5 6y
10. y = (!1/2)f(x) + 3.
x !4 !3 0 2 5 6y
11. Use your graphing calculator to drawthe graph of y = "x. Then, draw thegraph of y = !"x. In your own words,explain what you learned from this exer-cise.
12. Use your graphing calculator to drawthe graph of y = |x|. Then, draw thegraph of y = !|x|. In your own words,explain what you learned from this exer-cise.
13. Use your graphing calculator to drawthe graph of y = x2. Then, in succession,draw the graphs of y = x2!2, y = x2!4,and y = x2 ! 6. In your own words, ex-plain what you learned from this exer-cise.
14. Use your graphing calculator to drawthe graph of y = x2. Then, in succession,
draw the graphs of y = x2+2, y = x2+4,and y = x2 + 6. In your own words, ex-plain what you learned from this exer-cise.
15. Use your graphing calculator to drawthe graph of y = |x|. Then, in succession,draw the graphs of y = 2|x|, y = 3|x|,and y = 4|x|. In your own words, explainwhat you learned from this exercise.
16. Use your graphing calculator to drawthe graph of y = |x|. Then, in succession,draw the graphs of y = (1/2)|x|, y =(1/3)|x|, and y = (1/4)|x|. In your ownwords, explain what you learned fromthis exercise.
Pictured below is the graph of a functionf . In Exercises 17-22, use this graphto perform each of the following tasks.
x10
y10
f
i. Set up a coordinate system on a sheetof graph paper. Label and scale eachaxis. Make an exact copy of the graphof f on your coordinate system. Re-member to draw all lines with a ruler.
ii. In the narrative, a shadow box at theend of the section summarizes the con-cepts and technique of vertical scal-ing, vertical reflection, and verticaltranslation. Use the shortcut ideaspresented in this summary shadow box

Section 2.5 Vertical Geometric Transformations 185
Version: Fall 2007
to draw the graphs of the functionsthat follow without using tables.
iii. Use a di!erent colored pencil to drawthe graph of the function given in theexercise. Label this graph with itsequation. Be sure that key points areaccurately plotted. In each exercise,please plot exactly two plots per co-ordinate system, the graph of originalfunction f and the graph of the func-tion in the exercise.
17. y = (1/2)f(x).
18. y = 2f(x).
19. y = !f(x).
20. y = f(x)! 1.
21. y = f(x) + 3.
22. y = f(x)! 4.
Pictured below is the graph of a functionf . In Exercises 23-28, use this graphto perform each of the following tasks.
x10
y10
f
i. Set up a coordinate system on a sheetof graph paper. Label and scale eachaxis. Make an exact copy of the graphof f on your coordinate system. Re-member to draw all lines with a ruler.
ii. In the narrative, a shadow box at the
end of the section summarizes the con-cepts and technique of vertical scal-ing, vertical reflection, and verticaltranslation. Use the shortcut ideaspresented in this summary shadow boxto draw the graphs of the functionsthat follow without using tables.
iii. Use a di!erent colored pencil to drawthe graph of the function given in theexercise. Label this graph with itsequation. Be sure that key points areaccurately plotted. In each exercise,please plot exactly two plots per co-ordinate system, the graph of originalfunction f and the graph of the func-tion in the exercise.
23. y = 2f(x).
24. y = (1/2)f(x).
25. y = !f(x).
26. y = f(x) + 3.
27. y = f(x)! 2.
28. y = f(x)! 1.
Pictured below is the graph of a functionf . In Exercises 29-34, use this graphto perform each of the following tasks.
x10
y10
f
i. Set up a coordinate system on a sheet

186 Chapter 2 Functions
Version: Fall 2007
of graph paper. Label and scale eachaxis. Make an exact copy of the graphof f on your coordinate system. Re-member to draw all lines with a ruler.
ii. In the narrative, a shadow box at theend of the section summarizes the con-cepts and technique of vertical scal-ing, vertical reflection, and verticaltranslation. Use the shortcut ideaspresented in this summary shadow boxto draw the graphs of the functionsthat follow without using tables.
iii. Use a di!erent colored pencil to drawthe graph of the function given in theexercise. Label this graph with itsequation. Be sure that key points areaccurately plotted. In each exercise,please plot exactly two plots per co-ordinate system, the graph of originalfunction f and the graph of the func-tion in the exercise.
29. y = (!1/2)f(x).
30. y = !2f(x).
31. y = !f(x) + 2.
32. y = !f(x)! 3.
33. y = 2f(x)! 3.
34. y = (!1/2)f(x) + 1.

Section 2.5 Vertical Geometric Transformations 187
Version: Fall 2007
2.5 Answers
1.
x10
y10
f
y=2f(x)
3.
x10
y10
f
y=!f(x)
5.
x10
y10
f
y=f(x)+4
7.
x10
y10
f
y=(!1/2)f(x)

188 Chapter 2 Functions
Version: Fall 2007
9.
x10
y10
f
y=!f(x)!2
11. Mutiplying by !1, as in y = !"x,reflects the graph across the x-axis.
13. Subtracting c, where c > 0, movesthe graph c units downward.
15. Multiply by a scalar a, such thata is larger than 1, stretches the graphvertically by a factor of a.
17.
x10
y10
f
y=(1/2)f(x)
19.
x10
y10
f
y=!f(x)
21.
x10
y10
f
y=f(x)+3
23.
x10
y10
f
y=2f(x)
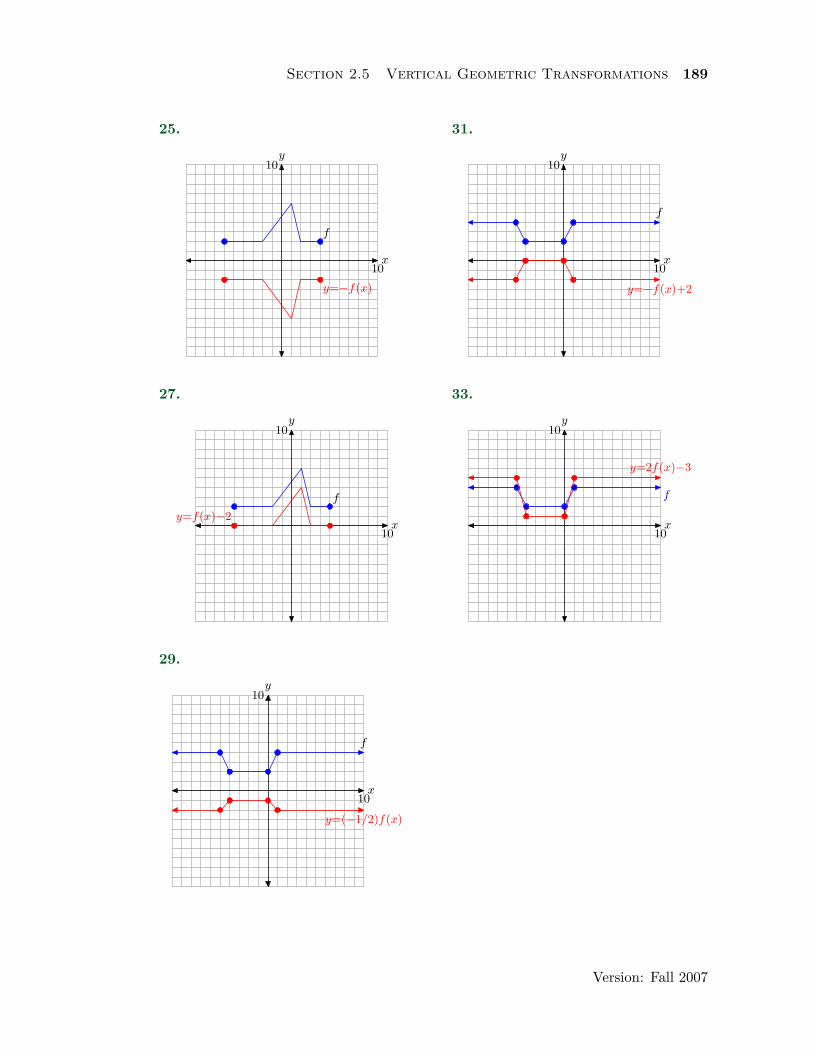
Section 2.5 Vertical Geometric Transformations 189
Version: Fall 2007
25.
x10
y10
f
y=!f(x)
27.
x10
y10
f
y=f(x)!2
29.
x10
y10
f
y=(!1/2)f(x)
31.
x10
y10
f
y=!f(x)+2
33.
x10
y10
f
y=2f(x)!3


Section 2.6 Horizontal Geometric Transformations 209
Version: Fall 2007
2.6 Exercises
Pictured below is the graph of a functionf .
x10
y10
f
The table that follows evaluates thefunction f in the plot at key values of x.Notice the horizontal format, where thefirst point in the table is the ordered pair(!6, 0).
x !6 !4 !2 0 2 4f(x) 0 4 4 0 !2 0
Use the graph and the table to completeeach of following tasks for Exercises 1-10.
i. Set up a coordinate system on graphpaper. Label and scale each axis, thencopy and label the original graph off onto your coordinate system. Re-member to draw all lines with a ruler.
ii. Use the original table to help com-plete the table for the given functionin the exercise.
iii. Using a di!erent colored pencil, plotthe data from your completed tableon the same coordinate system as theoriginal graph of f . Use these points
Copyrighted material. See: http://msenux.redwoods.edu/IntAlgText/1
to help complete the graph of the givenfunction in the exercise, then labelthis graph with its equation given inthe exercise.
1. y = f(2x).
x !3 !2 !1 0 1 2y
2. y = f((1/2)x).
x !12 !8 !4 0 4 8y
3. y = f(!x).
x !4 !2 0 2 4 6y
4. y = f(x+ 3).
x !9 !7 !5 !3 !1 1y
5. y = f(x! 1).
x !5 !3 !1 1 3 5y
6. y = f(!2x).
x !2 !1 0 1 2 3y

210 Chapter 2 Functions
Version: Fall 2007
7. y = f((!1/2)x).
x !8 !4 0 4 8 12y
8. y = f(!x! 2).
x !6 !4 !2 0 2 4y
9. y = f(!x+ 1).
x !3 !1 1 3 5 7y
10. y = f(!x/4).
x !16 !8 0 8 16 24y
11. Use your graphing calculator to drawthe graph of y = "x. Then, draw thegraph of y =
"!x. In your own words,
explain what you learned from this exer-cise.
12. Use your graphing calculator to drawthe graph of y = |x|. Then, draw thegraph of y = | ! x|. In your own words,explain what you learned from this exer-cise.
13. Use your graphing calculator to drawthe graph of y = x2. Then, in succession,draw the graphs of y = (x ! 2)2, y =(x! 4)2, and y = (x! 6)2. In your ownwords, explain what you learned fromthis exercise.
14. Use your graphing calculator to drawthe graph of y = x2. Then, in succession,
draw the graphs of y = (x + 2)2, y =(x+ 4)2, and y = (x+ 6)2. In your ownwords, explain what you learned fromthis exercise.
15. Use your graphing calculator to drawthe graph of y = |x|. Then, in succession,draw the graphs of y = |2x|, y = |3x|,and y = |4x|. In your own words, explainwhat you learned from this exercise.
16. Use your graphing calculator to drawthe graph of y = |x|. Then, in succession,draw the graphs of y = |(1/2)x|, y =|(1/3)x|, and y = |(1/4)x|. In your ownwords, explain what you learned fromthis exercise.
Pictured below is the graph of a functionf . In Exercises 17-22, use this graphto perform each of the following tasks.
x10
y10
f
i. Set up a coordinate system on a sheetof graph paper. Label and scale eachaxis. Make an exact copy of the graphof f on your coordinate system. Re-member to draw all lines with a ruler.
ii. In the narrative, a shadow box at theend of the section summarizes the con-cepts and technique of horizontal scal-ing, horizontal reflection, and hori-zontal translation. Use the shortcutideas presented in this summary shadow

Section 2.6 Horizontal Geometric Transformations 211
Version: Fall 2007
box to draw the graphs of the func-tions that follow without using ta-bles.
iii. Use a di!erent colored pencil to drawthe graph of the function given in theexercise. Label this graph with itsequation. Be sure that key points areaccurately plotted. In each exercise,please plot exactly two plots per co-ordinate system, the graph of originalfunction f and the graph of the func-tion in the exercise.
17. y = f(2x).
18. y = f((1/2)x).
19. y = f(!x).
20. y = f(x! 1).
21. y = f(x+ 3).
22. y = f(x! 2).
Pictured below is the graph of a functionf . In Exercises 23-28, use this graphto perform each of the following tasks.
x10
y10
f
i. Set up a coordinate system on a sheetof graph paper. Label and scale eachaxis. Make an exact copy of the graphof f on your coordinate system. Re-
member to draw all lines with a ruler.ii. In the narrative, a shadow box at the
end of the section summarizes the con-cepts and technique of horizontal scal-ing, horizontal reflection, and hori-zontal translation. Use the shortcutideas presented in this summary shadowbox to draw the graphs of the func-tions that follow without using ta-bles.
iii. Use a di!erent colored pencil to drawthe graph of the function given in theexercise. Label this graph with itsequation. Be sure that key points areaccurately plotted. In each exercise,please plot exactly two plots per co-ordinate system, the graph of originalfunction f and the graph of the func-tion in the exercise.
23. y = f(2x).
24. y = f((1/2)x).
25. y = f(!x).
26. y = f(x+ 3).
27. y = f(x! 2).
28. y = f(x+ 1).

212 Chapter 2 Functions
Version: Fall 2007
2.6 Answers
1.
x10
y10
f
y=f(2x)
3.
x10
y10
f
y=f(!x)
5.
x10
y10
f
y=f(x!1)
7.
x10
y10
f
y=f((!1/2)x)

Section 2.6 Horizontal Geometric Transformations 213
Version: Fall 2007
9.
x10
y10
f
y=f(!x+1)
11. Mutiplying on the inside by !1, asin y =
"!x, reflects the graph across
the y-axis.
13. Replacing x with x ! c, where c ispositive, moves the graph c units to theright.
15. Multiplying by a scalar a, such thata is larger than 1, compresses the graphhorizonally by a factor of a.
17.
x10
y10
f
y=f(2x)
19.
x10
y10
fy=f(!x)
21.
x10
y10
f
y=f(x+3)
23.
x10
y10
fy=f(2x)

214 Chapter 2 Functions
Version: Fall 2007
25.
x10
y10
f
y=f(!x)
27.
x10
y10
f
y=f(x!2)