2.1 Chemistry’s Building Block: The Atom
34
Human Impacts
Transcript of 2.1 Chemistry’s Building Block: The Atom

Human Impacts

The Carbon Cycle
Figure 36.1
atmospheric CO2
photosynthesis
respiration
plants animals
respiration
decomposition by bacteria and fungi
dead organisms fossil fuels
burning of fossil fuels
4 3
2
1
5
Nutrient cycles

The Nitrogen Cycle
Figure 36.2
atmospheric N2
bacteria in root nodules of plants and in soil
assimilation into animals
assimilation into plants
nitrogen fixation animal waste dead organisms
decomposition by bacteria and fungi
denitrifying bacteria
ammonia (NH3) ammonium (NH4
+)
nitrifying bacteria
nitrate (NO3–)
3
1
2
4
5
Nutrient cycles

Aldo Leopold: Odyssey, from Sketches Here and There (1949)
Nutrient cycles

Fertilizer Labels Nutrient cycles
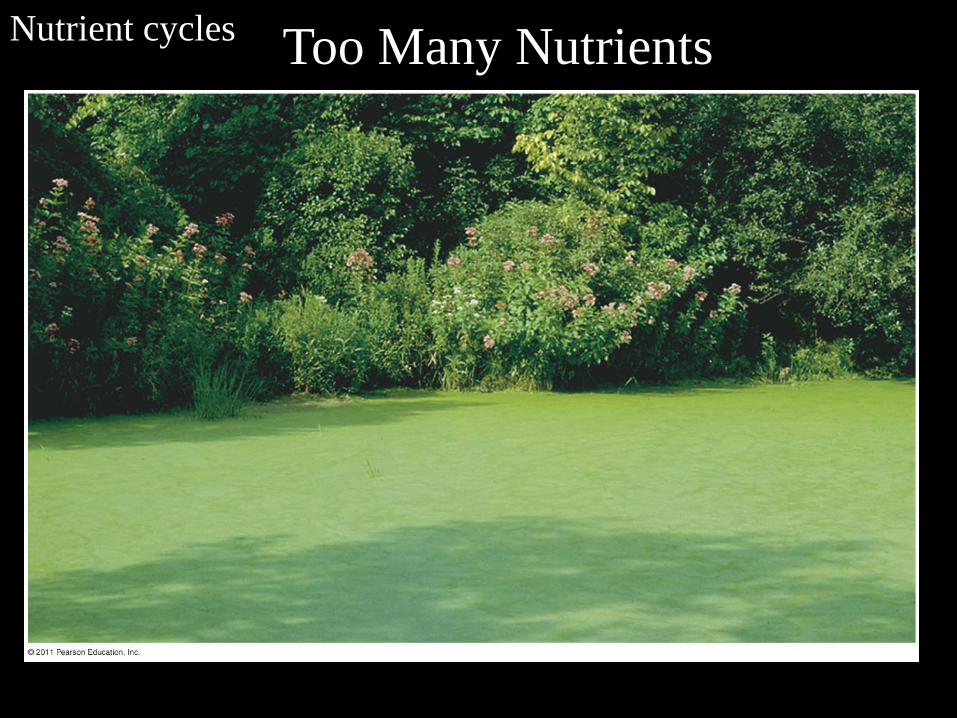
Too Many Nutrients
Figure 36.36
Nutrient cycles

http://microbiology.science.oregonstate.edu/
miseagrant.umich.edu
Too Many Nutrients Nutrient cycles

student.societyforscience.org
Too Many Nutrients Nutrient cycles

New Orleans
mouth of Atchafalaya River Mississippi
River delta
direction of prevailing wind
sediment
sediment and/or algae
dead zone
Gulf of Mexico
New Orleans dead zone
LA
TX
OK AR
MS
AL
TN
Memphis
KS
Nitrogen runoff from the enormous Mississippi watershed runs down the river to the Gulf of Mexico.
IA
MO IL
Des Moines
St. Louis
Chicago
Gulf of Mexico “Dead Zone”
Figure 36.3
Nutrient cycles

student.societyforscience.org
Nutrient cycles Other Dead Zones

http://earthobservatory.nasa.gov/
Other Dead Zones Nutrient cycles

water vapor
evaporation
10% precipitation over land
90% precipitation over ocean
ocean
surface runoff
groundwater
groundwater runoff
transpiration, evaporation
The Hydrologic Cycle
Figure 36.4

Figure 36.6
source of water for confined
aquifer source of water for unconfined aquifer
wells
unconfined aquifer
confined aquifer impermeable rock layers

Enormous Stores of Underground Water
Figure 36.7

Local groundwater sources: United States Geological Survey (USGS),
Water Replenishment District (WRD) documents

Water Replenishment District of So. Cal., 2004
Groundwater: local aquifers

USGS 2003
Groundwater: seasonal changes

USGS 2003
Groundwater

USGS 2012
Groundwater

Trophic Levels
Figure 36.10
Trophic levels:
producers (photosynthesizers)
primary consumers (plant predators)
secondary consumers (herbivore predators)
tertiary consumers (carnivore predators)
1
2
3
4
Energy flow

Figure 36.13
2% of available solar energy is assimilated in photosynthesis
gross primary production
(total material produced through photosynthesis)
15-70%
30-85%
heat
cellular respiration (“overhead”)
net primary production (amount of material plant accumulates)
Energy flow

Energy Pyramid
Figure 36.14
tertiary consumer secondary consumer primary consumer
primary producer
Energy flow

Figure 36.16
Mount Everest
sea level
50
40
30
20
10
0
Altit
ude
(kilo
met
ers)
0
10
20
30
25
15
5
Altit
ude
(mile
s)
Stratosphere (contains ozone layer)
ozone layer (O3)
transitional zone
Troposphere contains most of atmospheric gases
Mount Everest
sea level
James May U2 flight
Atmosphere

Growing Concentration of Atmospheric CO2
Figure 36.17
58.5
58.0
57.5
57.0
56.5 1880 1900 1920 1940 1960 1980 2000
260
280
300
320
340
360
380
400
Glo
bal t
empe
ratu
re (o F
)
Car
bon
diox
ide
conc
entr
atio
n (p
arts
per
mill
ion)
Year
Atmosphere

Old carbon vs. new carbon, or, coal vs. banana
http://www.youtube.com/watch?v=uStoBFtjy8U
Atmosphere
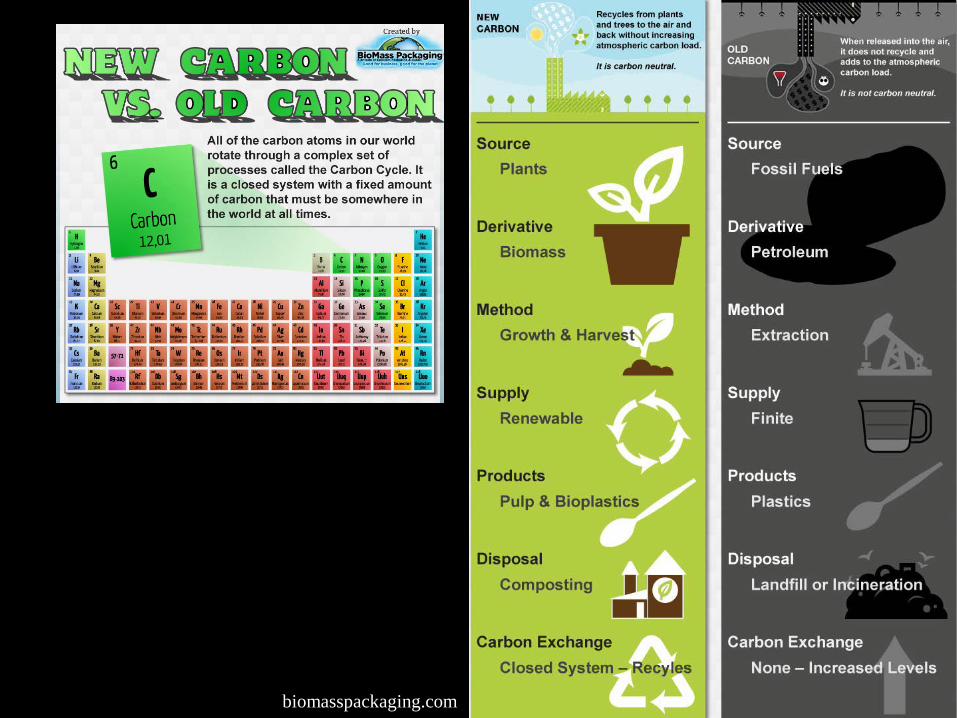
biomasspackaging.com

http://ngm.nationalgeographic.com/2010/10/gulf-oil-spill/gulf-map-interactive?rptregcta=reg_free_np&rptregcampaign=20131016_rw_membership_n1p_us_ot_w#finished
Geography of Offshore Oil
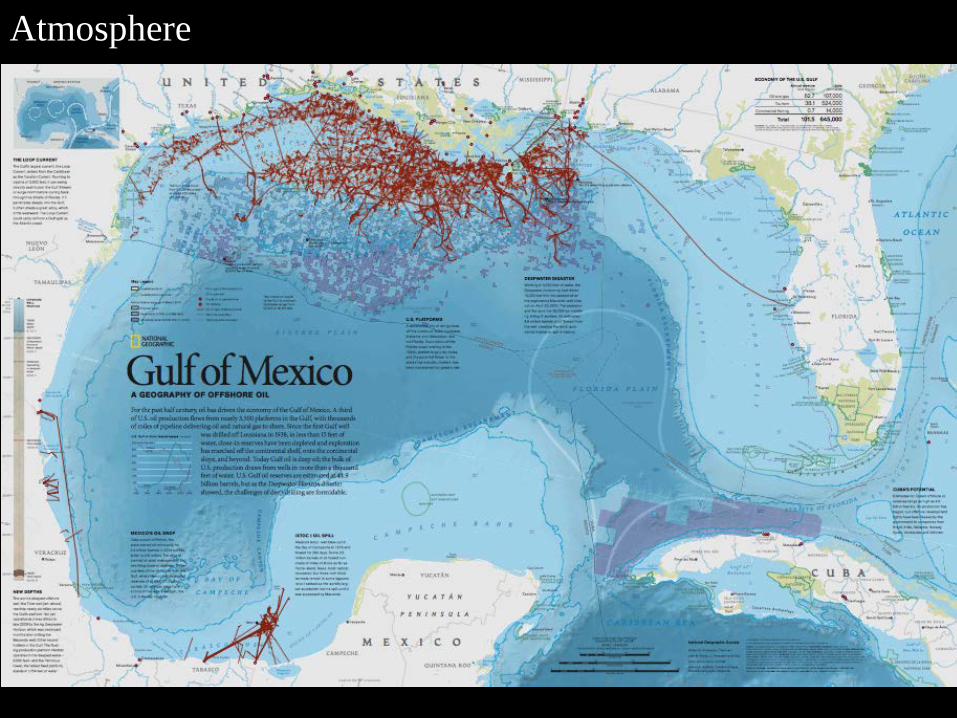
Atmosphere

Atmosphere

Atmosphere

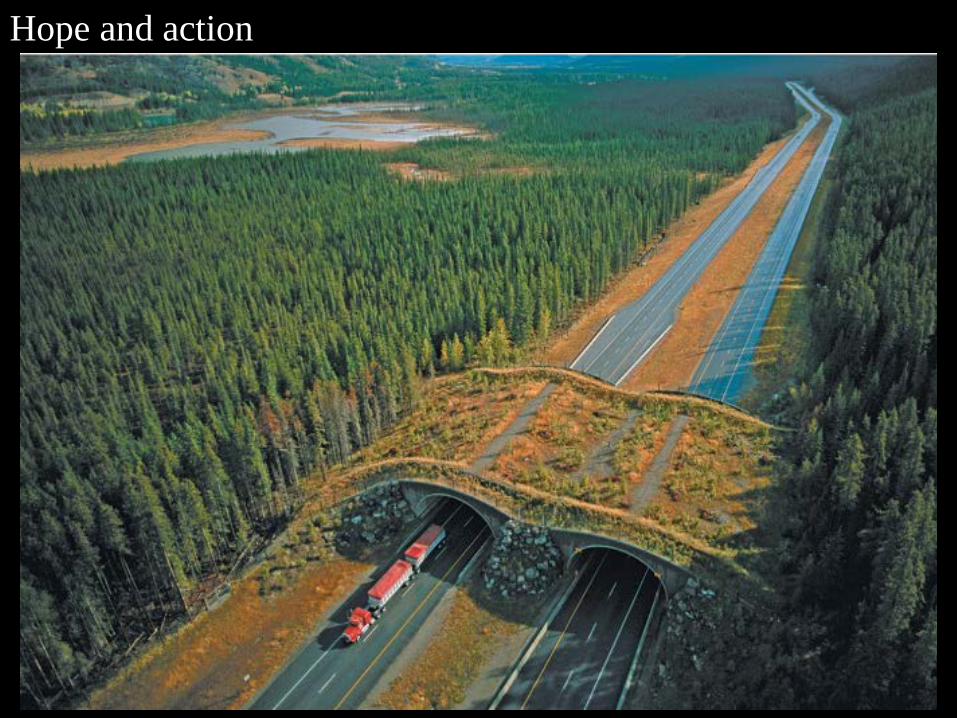
Hope and action

conbio.org
Hope and action

theSCA.org
Hope and action
Hope and action