20/5/2009 | pag. 1 Base Flow. Base flow definition Base Flow Separation techniques Base Flow...
18
20/5/2009 | pag. 1 Base Flow
-
date post
22-Dec-2015 -
Category
Documents
-
view
215 -
download
0
Transcript of 20/5/2009 | pag. 1 Base Flow. Base flow definition Base Flow Separation techniques Base Flow...
20/5/2009 | pag. 1
Base Flow

• Base flow definition• Base Flow Separation techniques• Base Flow Programmes• WHAT• Application & Results• Correlation• Conclusion
Contents

Definition
Images of low-flow and base-flow in Virginia streams , Kappahunnouh County stream.
Base flow—That part of the Stream discharge that is not attributable to direct runoff from precipitation or melting snow ;it is usually sustained by groundwater (AMS glossary).

Base flow
– Base flow is the ground water contribution to streamflow.
– Necessary to understand the hydrologic budgets of surface and ground water basins.
– Provide a ground water discharge flow measurement for calibration of numerical models, (Yu and Schwartz
1999).

Baseflow separation
Baseflow separation techniques
– Graphical Separation techniques
– Filtering Separation techniques

Graphical Separation Methods
(1a) constant discharge method
(1b) constant slope method
(1c) concave method
Estimating the point where the baseflow intersects the falling limb
D = 0.827 A0.2 (Linsley et al, 1958).
D Number of days between the storm crest and the end of quickflow
A Area of the catchment in square kilometres

Filtering Separation Methods
— Filtering methods tend not to have any hydrological basis (Nathan and McMahon, 1990) .
— Aim to generate an objective, repeatable and easily automated index that can be related to the baseflow response of a catchment.
— The baseflow index (BFI) or reliability index, is commonly generated from this analysis.
— It includes :Smoothed minima techniqueFixed interval method Sliding-interval method Recursive digital filters

Recursive digital filters
Filter Name Filter Equation Source Commentsqb(i) £ q(i)
Applied as a single pass through the data.
Boughton (1993) qb(i) £ q(i)
Applied as a single pass through the dataAllows calibration against other baseflow information such as tracers, by
IHACRES three-parameter algorithm
Jakeman and Hornberger (1993)
Extension of Boughton two-parameter algorithm
qf(i) ³0
a value of 0.925 recommended for daily stream datafilter recommended to be applied in three passesBaseflow is qb = q - qf
Chapman and Maxwell (1996)
Lyne and Hollick (1979)
Nathan and McMahon, (1990)
Lyne and Hollick algorithm
One-parameter algorithm
Chapman and Maxwell (1996)
Boughton two-parameter algorithm
)()1()( 2
1
2 iibib qk
kqk
kq
)()1()( 11 iibib qC
Cq
C
kq
)(11 )1()()1()(
iqiibib qqC
Cq
C
kq
2
1)( )1()()1()(
iiifif qqqq
(Grayson et al, 1996; Chapman, 1999; Furey and Gupta, 2001

Filtering Separation Methods
Filter Name Filter Equation Source Comments
Chapman (1991)Mau and Winter (1997)
Furey and Gupta filter Furey and
Gupta (2001)
Physically-based filter using mass balance equation for baseflow through a hillside
Remove the high-frequency quickflow signal to derive the low-frequency baseflow signal (Nathan and McMahon, 1990)
BFImax 0.80 for perennial streams with porous aquifers, BFImax 0.50 for ephemeral streams with porous aquifersBFImax 0.25 for perennial streams with hard rock aquifers
Eckhardt (2005)
Eckhardt Recursive digital
filter
Baseflow is qb = q - qf
Chapman algorithm
)(3
2
3
13)1()()1()(
iiifif qqqq
)()1( )1()1(1
3)1()( dibdiibib qq
c
cqq
max
max)1(max)( 1
)1()1(
aBFI
qBFIaaqBFIq iib
ib

Base FlowIndex (BFI)
– BFI is a dimensionless ratio, developed by Lvovich (1979) and the Institute of Hydrology (1980).
– BFI = the volume of base flow divided by the volume of total runoff for each year or for total period of record
– This index can present some information about the proportion of the stream flow that originates from stored sources
– The index can be calculated from stream flow data or estimated from basin geology

Base Flow Programs
– HYSEP: Hydrograph Separation Program (Sloto, R.A., and Crouse, M.Y., 1996 )http://water.usgs.gov/software/HYSEP/
– PART: A computerized method of base-flow-record estimation (Rutledge A T 2007)
http://water.usgs.gov/ogw/part/
– BFI: A Computer Program for Determining an Index to Base Flow (Wahl, K.L., and Wahl, K. L., 1995 )
– http://www.usbr.gov/pmts/hydraulics_lab/twahl/bfi/
– BASEFLOWHEC1 (Excel spreadsheet) (Center for Research in Water Resources)http://www.crwr.utexas.edu/gis/gishydro03/LibHydro/libhydro/baseflow.htm.
– WETSPRO (Excel spreadsheet) (Willems, 2009)ftp://bb50.bwk.kuleuven.be/hydr/patrick/programs
– WHAT ( Lim et al 2005)http://cobweb.ecn.purdue.edu/~what/,
– RAP ( River Analysis Pacakge) ( Marsh et al 2003)http://toolkit.ewater.com.au/Tools/RAP\

WHAT ( Web based Hydrograph Analysis Tool)

WHAT (Web based Hydrograph Analysis Tool)
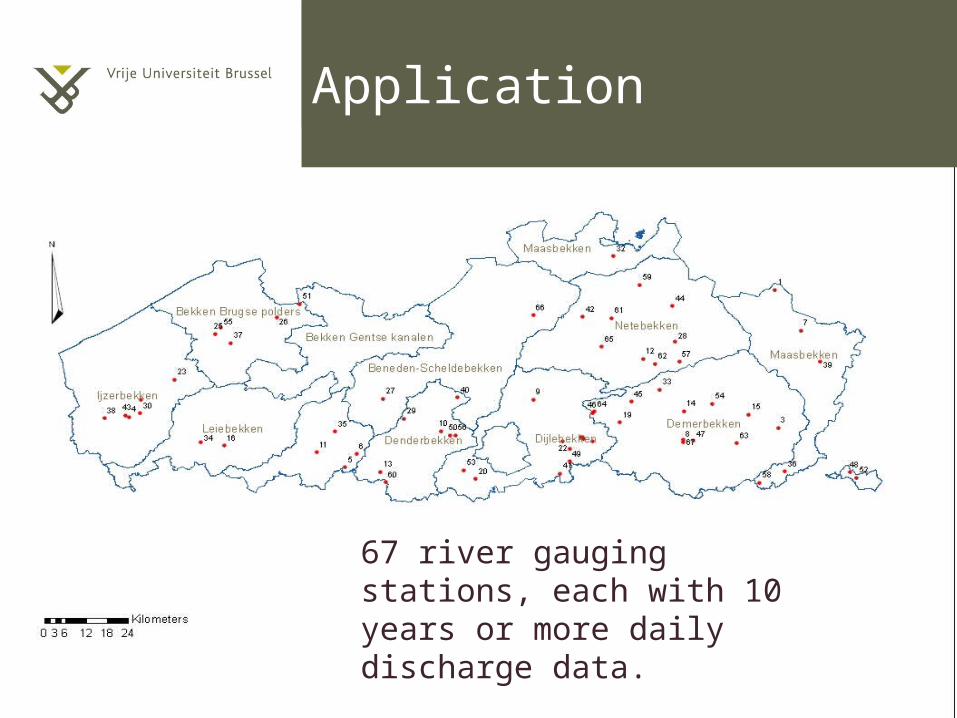
67 river gauging stations, each with 10 years or more daily discharge data.
Application

Base Flow Separation Rummen/Melsterbeek L09_156
0
1
2
3
4
5
6
01.0
1.19
84
12.0
1.19
84
23.0
1.19
84
03.0
2.19
84
14.0
2.19
84
25.0
2.19
84
07.0
3.19
84
18.0
3.19
84
29.0
3.19
84
09.0
4.19
84
20.0
4.19
84
01.0
5.19
84
12.0
5.19
84
23.0
5.19
84
03.0
6.19
84
14.0
6.19
84
25.0
6.19
84
06.0
7.19
84
17.0
7.19
84
28.0
7.19
84
08.0
8.19
84
19.0
8.19
84
30.0
8.19
84
10.0
9.19
84
21.0
9.19
84
02.1
0.19
84
13.1
0.19
84
24.1
0.19
84
04.1
1.19
84
15.1
1.19
84
26.1
1.19
84
07.1
2.19
84
18.1
2.19
84
29.1
2.19
84
Q (
m3 /s
)
Qt Qb(LMM) Qb(OPM) Qb(RDF)
Total flow Qt= 1.09 m3/sBase flow Qb = 0.88 m3/s
Base Flow Index (LMM)= 0.84 BFI (OPM)= 0.83 BFI (RDF)= 0.77

Correlation
LMM
OP
MR
DF
LMM OPM RDF
0.79
0.84 0.95
0.950.79
0.84

Conclusion
• Hydrograph separation procedures are still, to a large extent, arbitrary (Nathan and McMahon, 1990; Chapman and Maxwell, 1996; Chapman, 1999; Eckhardt, 2005).
• It provide a repeatable methodology to derive objective measures or indexes related to a particular streamflow source.
• The filtering results will probably be influenced by the size of the considered catchment as well. The longer the travel time to the catchment outlet, the more runoff peaks are dispersed. (K. Eckhardt, 2005).

Conclusion
• Six software was tested on Korea , ( WHAT, PART, RORA,
PULSE, BFI, and RAP), the WHAT methods was the simplest and easiest to apply prediction stability. Overall, the WHAT-RDF method gave the most stable results over other methods (E A Combalicer et al., 2008).
• It always recommended to separate the Base flow with more than one method.