205109Orig1s000 - Food and Drug Administration · (CKD), particularly those in ESRD requiring...
26
CENTER FOR DRUG EVALUATION AND RESEARCH APPLICATION NUMBER: 205109Orig1s000 STATISTICAL REVIEW(S)
Transcript of 205109Orig1s000 - Food and Drug Administration · (CKD), particularly those in ESRD requiring...

CENTER FOR DRUG EVALUATION AND RESEARCH
APPLICATION NUMBER:
205109Orig1s000
STATISTICAL REVIEW(S)
U.S. Department of Health and Human ServicesFood and Drug Administration Center for Drug Evaluation and ResearchOffice of Translational SciencesOffice of Biostatistics
STATISTICAL REVIEW AND EVALUATION CLINICAL STUDIES
NDA/Serial Number: NDA20-5109/000
Drug Name: PA21 (Velphoro Tablets)
Indication(s): Control of Serum Phosphorus Levels in Patients with End-Stage Renal Disease (ESRD)
Applicant: Vifor Fresenius Medical Care Renal Pharma
Date(s): Date of Document: February 01, 2013PDUFA Due Date: December 01, 2013
Review Priority: Standard
Biometrics Division: Biometrics I, HFD-710
Statistical Reviewer: Ququan Liu, M.D., M.S.
Concurring Reviewers: James Hung, Ph.D.
Medical Division: Division of Cardio-Renal Drug Products, HFD-110
Clinical Team: Shen Xiao, M.D., Norman Stockbridge, M.D., Ph.D.
Project Manager: Anna Park
Keywords: PA21, Serum phosphorus, Hyperphosphataemia, ESRD, Hemodialysis
Reference ID: 3377256
NDA 20-5109/S-000 PA21 (Velphoro™) - 2 -
Table of Contents
1. EXECUTIVE SUMMARY ..................................................................................- 4 -1.1 CONCLUSIONS AND RECOMMENDATIONS ............................................................................. - 4 -1.2 BRIEF OVERVIEW OF CLINICAL STUDIES .............................................................................. - 4 -1.3 STATISTICAL ISSUES AND FINDINGS ..................................................................................... - 4 -
2. INTRODUCTION...............................................................................................- 5 -2.1 OVERVIEW............................................................................................................................ - 5 -2.2 DATA SOURCES .................................................................................................................... - 5 -
3. STATISTICAL EVALUATION........................................................................- 5 -3.1 DATA AND ANALYSIS QUALITY............................................................................................ - 5 -3.1.1 STUDY 3A.......................................................................................................................... - 5 -3.1.2 STUDY 5A.......................................................................................................................... - 6 -3.2 EVALUATION OF EFFICACY................................................................................................... - 6 -3.2.1 STUDY 3A............................................................................................................................. - 6 -3.2.2 STUDY 5A........................................................................................................................... - 14 -3.3 EVALUATION OF SAFETY....................................................................................................... - 19 -
4. FINDINGS IN SPECIAL/SUBGROUP POPULATIONS............................- 19 -4.1 STUDY 3A.............................................................................................................................. - 19 -4.2 STUDY 5A.............................................................................................................................. - 20 -
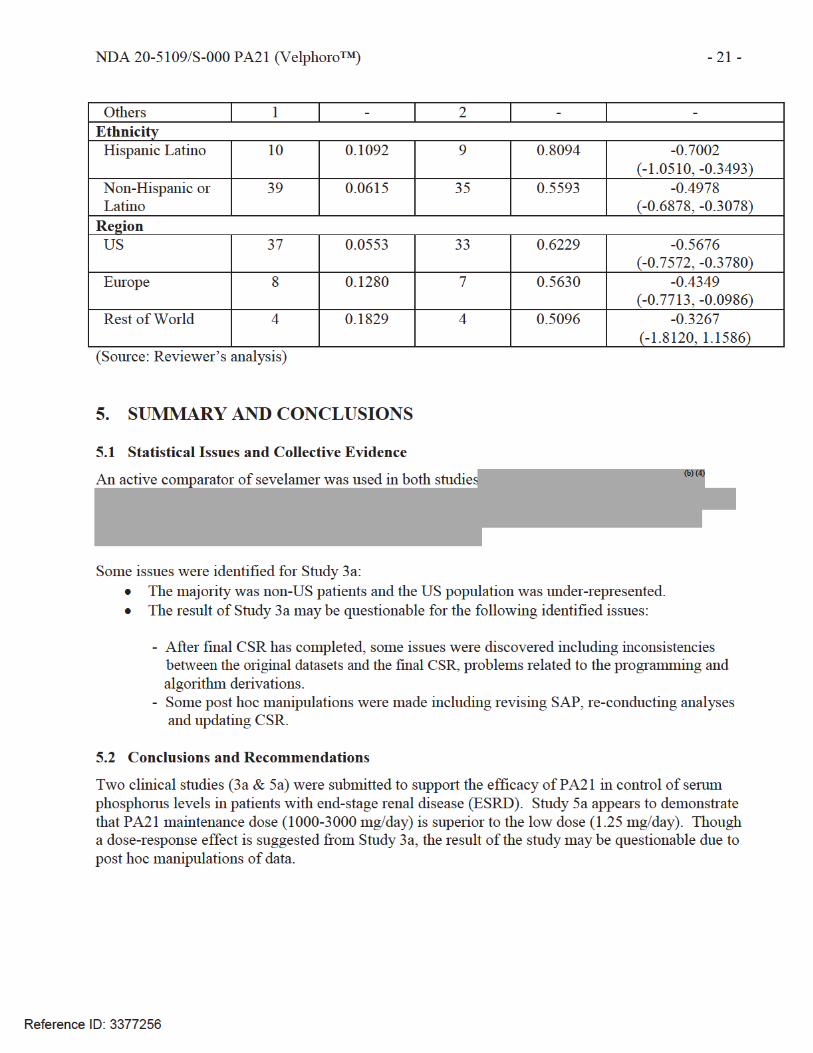
5. SUMMARY AND CONCLUSIONS ...............................................................- 21 -5.1 STATISTICAL ISSUES AND COLLECTIVE EVIDENCE ................................................................ - 21 -5.2 CONCLUSIONS AND RECOMMENDATIONS.............................................................................. - 21 -
Reference ID: 3377256

NDA 20-5109/S-000 PA21 (Velphoro™) - 3 -
List of Tables
Table 1 List of Study Included in Analysis ....................................................................................- 4 -Table 2 Number of Subjects Randomised, Treated, Withdrawn and Completed, Study 3a
All Subjects Randomised, SAP Addendum..............................................................................- 8 -Table 3 Number of Patients Randomised, Treated, Withdrawn and Completed, Study 3a
All Patients Randomised, Original SAP ...................................................................................- 8 -Table 4 Patient disposition, demographic and baseline characteristics, Full ITT, Study 3a ..........- 9 -Table 5 Absolute Change in Serum Phosphorus from Baseline at End of Treatment (FAS), Study 3a
.................................................................................................................................................- 10 -Table 6 Absolute Change in Serum Phosphorus from Baseline at End of Treatment, ANCOVA
(FAS), Study 3a ......................................................................................................................- 11 -Table 7 Serum Phosphate (mmol/L): Change from Baseline at End of Treatment, ANCOVA (FAS),
Study 3a ..................................................................................................................................- 12 -Table 8 Analysis Output ...............................................................................................................- 12 -Table 9 Goodness-Fit of Model ....................................................................................................- 12 -Table 10 Subject Disposition in Stage 2, Study 5a.......................................................................- 16 -Table 11 Summary of Demographic and Baseline Characteristics, Study 5a ..............................- 17 -Table 12 Chang in Serum Phosphorus Levels from Baseline (Week 24) at Week 27, LOCF, Study
5a.............................................................................................................................................- 18 -Table 13 Analysis of Serum Phosphorus Change from Baseline (Week 24)
(MMRM-MAR), Study 5a ......................................................................................................- 19 -Table 14 Subgroup Analysis of Primary Endpoint, Study 3a.......................................................- 20 -Table 15 Subgroup Analysis of Primary Endpoint, Study 5a.......................................................- 20 -
List of Figures
Figure 1 Study Design, Study 3a .....................................................................................................- 6 -Figure 2 Change from Baseline in Serum Phosphorus Levels at End of Treatment (FAS and PPS),
Study 3a ..................................................................................................................................- 10 -Figure 3 Residual Plots .................................................................................................................- 13 -Figure 4 Study Design, Study 5a ...................................................................................................- 15 -
Reference ID: 3377256


NDA 20-5109/S-000 PA21 (Velphoro™) - 5 -
! The result of Study 3a may be questionable for the following identified issues:
- After final CSR has completed, some issues were discovered including inconsistencies between the original datasets and the final CSR, problems related to the programming and algorithm derivations. - Some post hoc manipulations were made including revising SAP, re-conducting analyses and updating CSR.
2. INTRODUCTION
2.1 Overview
Hyperphosphataemia is a common and serious complication in patients with chronic kidney disease (CKD), particularly those in ESRD requiring dialysis. Hyperphosphataemia has been shown to be an independent risk factor for cardiovascular mortality in dialysis patients.
Velphoro is a phosphate binder to control serum phosphorus levels by absorbing the dietary phosphate in the GI tract, preventing its uptake into the blood, and thereby reducing the serum level of phosphorus in patients with ESRD.
2.2 Data Sources
The sponsor’s SAS transport datasets were stored in the directory of \\cdsesub1\EVSPROD\NDA205109 of the Center’s electronic document room.
3. STATISTICAL EVALUATION
3.1 Data and Analysis Quality
3.1.1 Study 3a
The sponsor stated that during the mapping of the raw and derived legacy datasets some issues were discovered. The issues included inconsistencies between the original datasets and the final CSR,problems related to the programming and algorithm derivations due to lack of clarity indocumentation and insufficiently validation. At that time the final CSR has been completed (June 15, 2010).
An independent clinical research organization was requested to perform a review of the datasets, programming algorithm and analysis (March 30, 2012). A SAP addendum was then developed (May 29, 2012). Analyses affected by the issues were re-conducted and the final CSR was updated(October 21, 2012).
One of the identified issues related to efficacy was no visit windows pre-defined in the original SAP for any of the efficacy parameters and problems occurred in the identification of subjects in the FAS. Some subjects were identified as being treated, with returned post-baseline efficacy assessment and
Reference ID: 3377256
(b) (4)

NDA 20-5109/S-000 PA21 (Velphoro™) - 6 -
still on treatment, but all values recorded in the follow-up visits. These data inconsistencies can mislead the principles of the ITT and the LOCF approach.
The statistical reviewer created a sample of subjects with the issue and asked the sponsor to verify the values of primary efficacy endpoint. The sponsor’s responses to the identified issues seem to be acceptable. More discussions on the issues will be given in the section 3.2.1.
3.1.2 Study 5a
The quality of the data and analyses are acceptable. A consistent result of the primary efficacy analysis can be generated from both raw and derived data.
3.2 Evaluation of Efficacy
3.2.1 Study 3a
3.2.1.1 Study Objectives
The primary objective was to investigate the ability of different doses of PA21 to lower serum phosphorus levels in subjects with CKD.
3.2.1.2 Study Design
Study 3a was a parallel group, randomised, open-label, active-controlled, multicentre, dose-ranging study. The study consisted of a screening phase (up to 1 week), a washout phase of 2 weeks, a 6-week treatment phase, and a 2-week run-out phase. The detail of the study design is described as follows (Figure 1).
Figure 1 Study Design, Study 3a
(Source: Sponsor’s Figure 1)
Reference ID: 3377256
NDA 20-5109/S-000 PA21 (Velphoro™) - 7 -
3.2.1.3 Efficacy Measures
1) Primary Efficacy Endpoint: Change from baseline in serum phosphorus levels at the end of treatment
2) Secondary Efficacy Endpoints: • Change from baseline in serum phosphorus levels at each time point (apart from end of treatment) • Percentage of patients achieving controlled serum phosphorus levels (i.e., ≥1.13 to 1.78 mmol/L (≥3.5 to ≤5.5 mg/dL)) after 1, 2, 3, 4, 5 and 6 weeks of treatment, separately • Time to reach the first controlled serum phosphorus level • Serum phosphorus level at each time point • Serum calcium phosphorus product at each time point • Change in serum calcium phosphorus products from baseline at each time point • Serum iPTH levels at each time point • Change in serum iPTH levels from baseline at each time point
3) Statistical Analysis Methodology: - The primary efficacy analysis: The primary endpoint was analyzed with a single sample t-test
within each treatment group. A hierarchical testing procedure was applied to preserve the overall alpha level of 0.05, testing from the highest PA21 dose (12.5 g/day) to the lowest dose (1.25 g/day) until all doses were tested or the first p-value above 0.05 was observed.
- The secondary primary efficacy analysis: The primary endpoint was also analyzed using an analysis of covariance (ANCOVA) model with dose group as fixed effect and baseline serum phosphorus levels as covariates. Pair-wise comparisons of the 4 higher-dose groups versus the lowest dose group were performed by means of the Dunnett procedure using the lowest dose group as the control group.
3.2.1.4 Patient Disposition, Demographic and Baseline Characteristics
1) Patient Disposition:
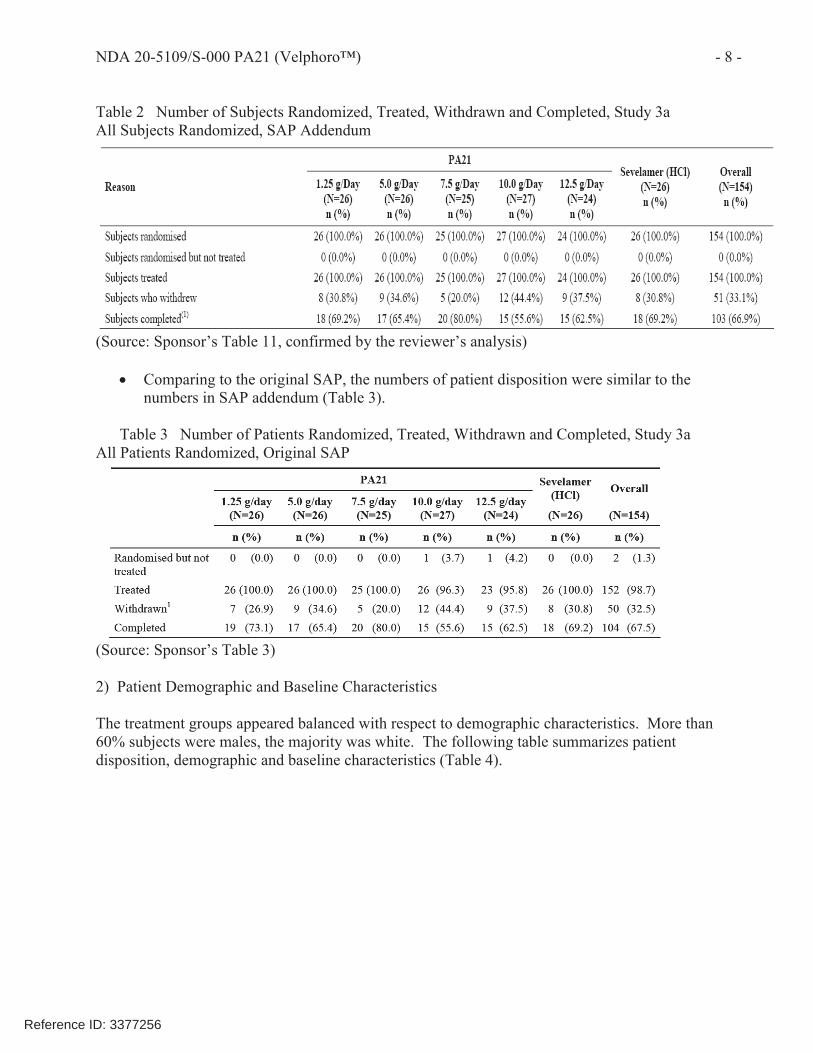
! Using the SAP addendum, of the 154 randomized subjects, 103 subjects (66.9%) completed the study and 51 subjects (33.1%) were withdrawn from the study (Table 2). The highest drop-out rate was in the 10.0 g/day group, and lowest in the 7.5 g/day group (Table 11). The most common reason for withdrawn was exceeding the upper safety limit (n=8, 6.3%) or decreasing below safety limit (n=20, 15.6%) of serum phosphorus level. The withdrawn criterion was pre-defined for patient safety purpose.
Reference ID: 3377256
NDA 20-5109/S-000 PA21 (Velphoro™) - 8 -
Table 2 Number of Subjects Randomized, Treated, Withdrawn and Completed, Study 3a All Subjects Randomized, SAP Addendum
(Source: Sponsor’s Table 11, confirmed by the reviewer’s analysis)
! Comparing to the original SAP, the numbers of patient disposition were similar to the numbers in SAP addendum (Table 3).
Table 3 Number of Patients Randomized, Treated, Withdrawn and Completed, Study 3a All Patients Randomized, Original SAP
(Source: Sponsor’s Table 3)
2) Patient Demographic and Baseline Characteristics
The treatment groups appeared balanced with respect to demographic characteristics. More than 60% subjects were males, the majority was white. The following table summarizes patientdisposition, demographic and baseline characteristics (Table 4).
Reference ID: 3377256

NDA 20-5109/S-000 PA21 (Velphoro™) - 9 -
Table 4 Patient disposition, demographic and baseline characteristics, Full ITT, Study 3a
Serum Phosphorus Baseline Level (mg/dL) Mean 6.8 6.6 6.9 6.8 6.5 6.7 SD 1.64 1.08 1.15 1.75 1.19 1.38 Median 7.0 6.6 6.7 6.7 6.6 6.7 Range 3.4-10.3 4.2-8.3 4.5-9.0 4.3-9.3 4.1- 9.2 3.4-10.3
(Source: Sponsor’s Tables 15 & 16, confirmed by the reviewer’s analysis)
3.2.1.5 Sponsor’s Primary Efficacy Results
Reference ID: 3377256

NDA 20-5109/S-000 PA21 (Velphoro™) - 10 -
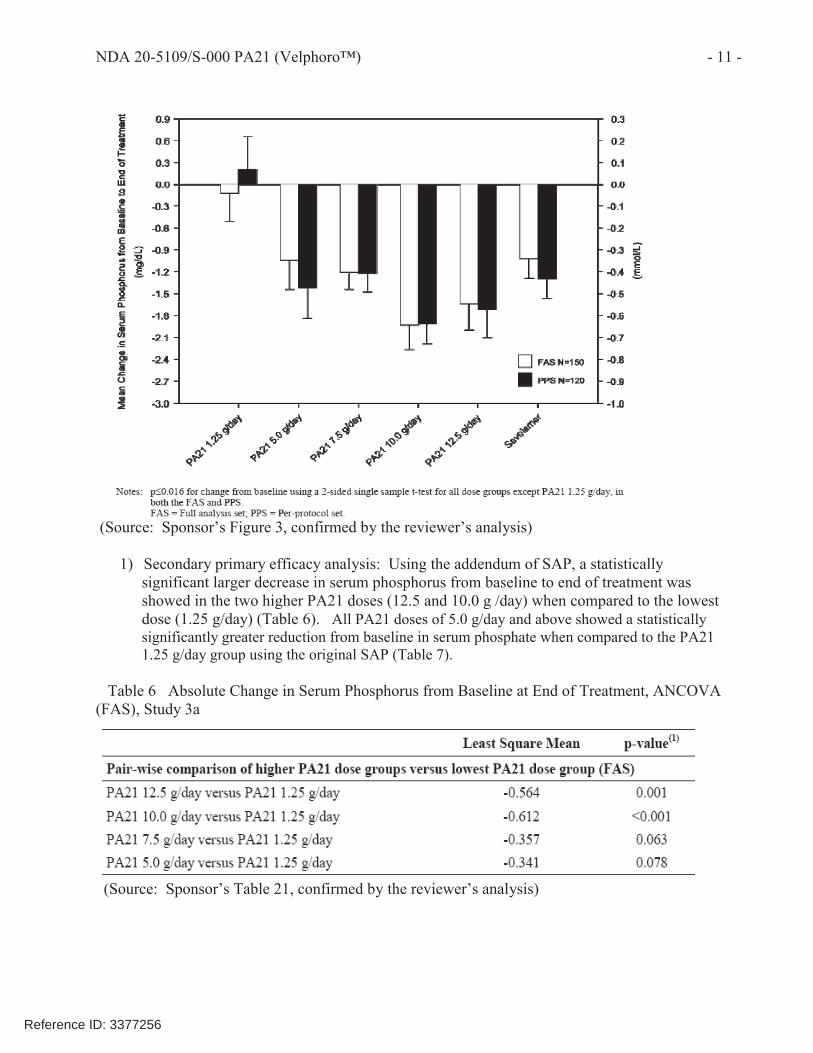
1) Primary efficacy analysis: Two SAPs produce a similar result. A statistically significant decrease (p≤0.016) in serum phosphorus levels from baseline to end of treatment was showed for all dose groups except for the dose of 1.25 g/day group (Table 5, Figure 2).
Table 5 Absolute Change in Serum Phosphorus from Baseline at End of Treatment (FAS), Study 3a
VariablePA21
Sevelamer (HCL)1.25 g/day 5.0 g/day 7.5 g/day 10.0 g/day 12.5 g/day
Using the Addendum of SAP n=26 n=26 n=25 n=25 n=24 n=24
Using the Original SAP n=25 n=26 n=25 n=25 n=23 n=23
(Source: Sponsor’s Tables 10 & 20, confirmed by the reviewer’s analysis)
Figure 2 Change from Baseline in Serum Phosphorus Levels at End of Treatment (FAS and PPS), Study 3a
Reference ID: 3377256
NDA 20-5109/S-000 PA21 (Velphoro™) - 11 -
(Source: Sponsor’s Figure 3, confirmed by the reviewer’s analysis)
1) Secondary primary efficacy analysis: Using the addendum of SAP, a statisticallysignificant larger decrease in serum phosphorus from baseline to end of treatment was showed in the two higher PA21 doses (12.5 and 10.0 g /day) when compared to the lowestdose (1.25 g/day) (Table 6). All PA21 doses of 5.0 g/day and above showed a statisticallysignificantly greater reduction from baseline in serum phosphate when compared to the PA21 1.25 g/day group using the original SAP (Table 7).
Table 6 Absolute Change in Serum Phosphorus from Baseline at End of Treatment, ANCOVA (FAS), Study 3a
(Source: Sponsor’s Table 21, confirmed by the reviewer’s analysis)
Reference ID: 3377256

NDA 20-5109/S-000 PA21 (Velphoro™) - 12 -
Table 7 Serum Phosphate (mmol/L): Change from Baseline at End of Treatment, ANCOVA (FAS), Study 3a
(Source: Sponsor’s Table 11)
3.2.1.6 Reviewer’s Results
1) The reviewer verified the sponsor’s primary and secondary primary efficacy analyses and concurred with their results.
2) The reviewer also conducted analyses to explore the dose response of PA21:
! Assessment of dose response: Analysis of ANCOVA is conducted, and linear and quadratic contrasts are tested. The result of analysis shows that a liner dose response seems appropriate to the data (P<.0001) (Table 8).
Table 8 Analysis Output
The GLM Procedure
Dependent Variable: CHG Contrast DF Contrast SS Mean Square F Value Pr > F
linear 1 49.50922891 49.50922891 17.99 <.0001 quadratic 1 3.08865849 3.08865849 1.12 0.2916
! Diagnosis of model fit: Data are fitted to linear, quadratic and Emax models. The goodness-fit of the model is assessed by AIC criteria and residual plot. The AIC criteria seem to indicate that a linear model fits data better (Table 9,). The residual plots appear to suggest that both linear and quadratic models are good fits for the data (Figure 3). Overall a linear model seems sufficient for the data. The Emax model has poor fit based on the residual plotand AIC value.
Table 9 Goodness-Fit of ModelModel AIC
Linear Model: Response= edosebaseline ∀∀∀ 210 ### 130.9
Quadratic Model: Response= edosedosebaseline ∀∀∀∀ 23210 #### 131.0
Reference ID: 3377256

NDA 20-5109/S-000 PA21 (Velphoro™) - 14 -
- A statistically significant decrease in serum phosphorus level from baseline to the end of treatment was shown for all PA21 doses (5.0, 7.5, 10.0, 12.5 g/day) except the lowest dose (1.25 g/day). A linear dose response seems appropriate for the data.
- A statistically significant larger decrease in serum phosphorus levels from baseline at end of treatment was shown in the two higher doses (10.0 and 12.5 g/day) compared to the lowest dose (1.25 g/day).
3.2.2 Study 5a
3.2.2.1 Study Objectives
The primary objective of this study was to establish the superiority of PA21 maintenance doseversus PA21 low dose in maintaining the phosphorus lowering effect in subjects undergoing haemodialysis (HD) in Stage 2.
3.2.2.2 Study Design
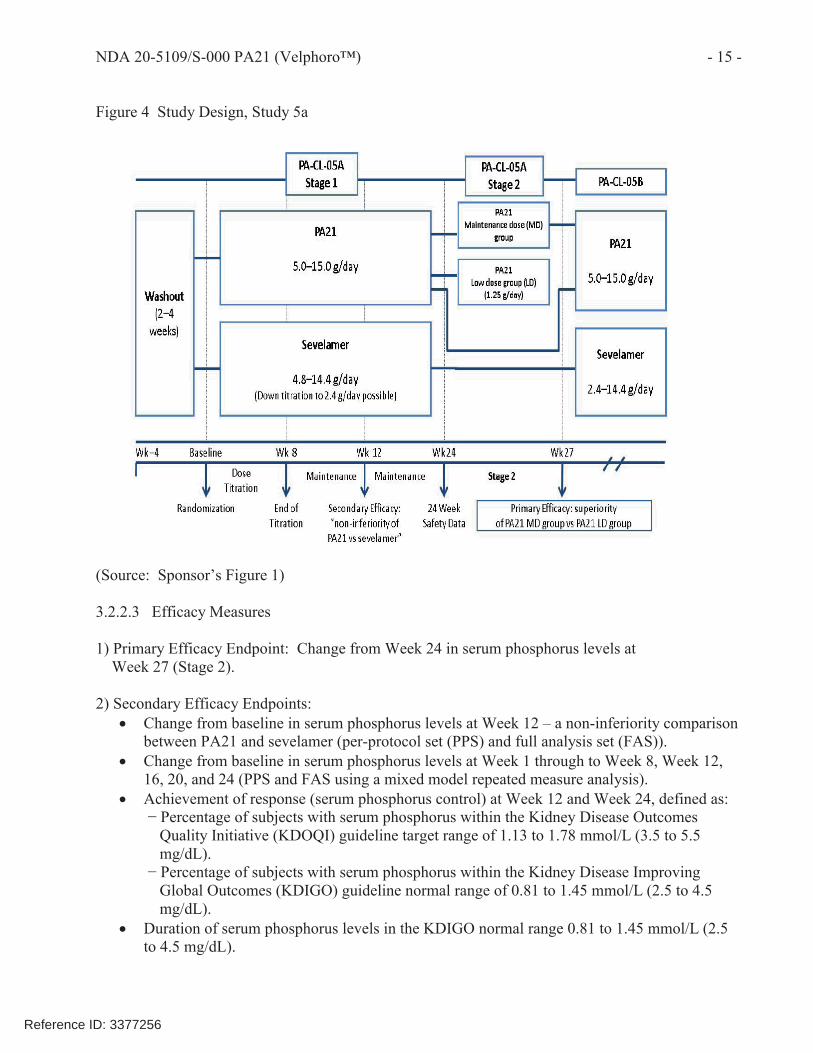
Study 5a consisted of two stages. Stage 1 was a prospective, randomised, parallel group, open-label, active controlled, 24-week study of PA21 compared to sevelamer to establish a non-inferiority at week 12; Stage 2 was a prospective, randomized, parallel group, open-label, 3-week study assessing the superiority of PA21 maintenance dose to PA21 low dose (Figure 4).
Reference ID: 3377256
NDA 20-5109/S-000 PA21 (Velphoro™) - 15 -
Figure 4 Study Design, Study 5a
(Source: Sponsor’s Figure 1)
3.2.2.3 Efficacy Measures
1) Primary Efficacy Endpoint: Change from Week 24 in serum phosphorus levels at Week 27 (Stage 2).
2) Secondary Efficacy Endpoints:! Change from baseline in serum phosphorus levels at Week 12 – a non-inferiority comparison
between PA21 and sevelamer (per-protocol set (PPS) and full analysis set (FAS)).! Change from baseline in serum phosphorus levels at Week 1 through to Week 8, Week 12,
16, 20, and 24 (PPS and FAS using a mixed model repeated measure analysis).! Achievement of response (serum phosphorus control) at Week 12 and Week 24, defined as: − Percentage of subjects with serum phosphorus within the Kidney Disease Outcomes Quality Initiative (KDOQI) guideline target range of 1.13 to 1.78 mmol/L (3.5 to 5.5 mg/dL). − Percentage of subjects with serum phosphorus within the Kidney Disease Improving Global Outcomes (KDIGO) guideline normal range of 0.81 to 1.45 mmol/L (2.5 to 4.5 mg/dL).! Duration of serum phosphorus levels in the KDIGO normal range 0.81 to 1.45 mmol/L (2.5
to 4.5 mg/dL).
Reference ID: 3377256


NDA 20-5109/S-000 PA21 (Velphoro™) - 17 -
(Source: Sponsor’s Table14.1.2.2, confirmed by the reviewer’s analysis)
2) Patient Demographic and Baseline Characteristics
PA21 maintenance dose and PA21 low dose treatment groups seemed balanced with respect to demographic characteristics; there were more white and non-Hispanic. The details of patient demographic and baseline characteristics are summarized below (Table 11).
Table 11 Summary of Demographic and Baseline Characteristics, Study 5a
Serum Phosphorus Level (mg/dL) n 44 45 93 Mean (SD) 4.7 (1.0) 5.0 (1.1) 4.9 (1.1) Median 4.9 5.0 4.9 Min/Max 2.3/7.1 2.1/7.6 2.1/7.6
Reference ID: 3377256

NDA 20-5109/S-000 PA21 (Velphoro™) - 18 -
(Source: Sponsor’s Tables 19 & 21, confirmed by the reviewer’s analysis)
3.2.2.5 Sponsor’s Primary Efficacy Results
1) The primary efficacy analysis showed that the PA 21 maintenance dose was superior to the PA 21 low dose (p<0.001) at Week 27 (Table 12).
Table 12 Chang in Serum Phosphorus Levels from Baseline (Week 24) at Week 27, LOCF, Study 5a
(Source: Sponsor’s Table 35, confirmed by the reviewer’s analysis)
2) The MMRM-MAR analysis confirmed that the PA 21 maintenance dose is superior to
Reference ID: 3377256

NDA 20-5109/S-000 PA21 (Velphoro™) - 19 -
the PA 21 low dose at all time points (p<0.001) (Table 13).
Table 13 Analysis of Serum Phosphorus Change from Baseline (Week 24) (MMRM-MAR), Study 5a
(Source: Sponsor’s Table 36, confirmed by the reviewer’s analysis)
3.2.2.6 Reviewer’s Results
The reviewer verified the sponsor’s primary efficacy analyses and concurred with their results.
3.2.2.7 Conclusions
PA 21 maintenance dose is superior to PA21 low dose in control of serum phosphorus level.
3.3 Evaluation of Safety
Please refer to Dr. Xiao’s review for safety assessment.
4. FINDINGS IN SPECIAL/SUBGROUP POPULATIONS
4.1 Study 3a
Comparing to baseline, a statistically significant decrease (p≤0.0356) in serum phosphorus was shown in the three higher doses (7.5, 10.0 and 12.5 mmol/L) across age groups. The US population was under represented (13%) in the study, the majority of the subjects were from Europe (87%).
Reference ID: 3377256

NDA 20-5109/S-000 PA21 (Velphoro™) - 20 -
Serum phosphorus level was statistically significantly reduced (p≤0.0081) for all doses except the lowest dose (1.25 mmol/L) in European region; no statistical significant change in serum phosphorus level was observed in any dose in US region (Table 14).
Table 14 Subgroup Analysis of Primary Endpoint, Study 3a1.25 (mmol/L) 5.0 (mmol/L) 7.5 (mmol/L) 10.0 (mmol/L) 12.5 (mmol/L)
MeanChange
(n)
95% CIo f Mean Change
MeanChange
(n)
95% CIo f Mean Change
MeanChange
(n)
95% CI of Mean Change
MeanChang
e(n)
95% CI of Mean Change
MeanChange
(n)
95% CIo f Mean Change
Age <65(N=75)
-0.0014(14)
-0.4323, 0.4295
0.3628(18)
-0.0125, 0.7381
0.4614(14)
0.2635, 0.6594
0.5333(15)
0.1899, 0.8768
0.4357(14)
0.0636, 0.8079
=>65(N=51)
0.0925(12)
-0.2530, 0.4380
0.3138(8)
-0.1340, 0.7615
0.330(11)
0.0271, 0.6329
0.8110(10)
0.5251, 1.0969
0.7020(10)
0.3634, 1.0406
Region US(N=16)
0.2425(4)
-0.1635, 0.6485
0.0475(4)
-0.4191, 1.5141
0.2167(3)
-0.2224, 0.6557
0.2567(3)
-1.767, 2.2803
0.3750(2)
-8.4558, 9.2058
Europe(N=110)
0.0055(22)
-0.3030, 0.3139
0.4023(22)
0.1164, 0.6881
0.4291(22)
0.2485, 0.6097
0.6973(22)
0.4715, 0.9230
0.5623(22)
0.310, 0.8146
(Source: Reviewer’s analysis)
4.2 Study 5a
The superiority of PA21 MD appears to be consistent across age, race, ethnicity and region (Table 15)
Table 15 Subgroup Analysis of Primary Endpoint, Study 5aPA21 MD PA21 LD
N LS Means(mmol/L)
N LS Means(mmol/L)
Difference of LS Means(95% CI)
Age <65 38 0.0701 28 0.6532 -0.5831
(-0.8079, -0.3583) >=65 11 0.074 16 0.4612 -0.3872
(-0.6094, -0.1651)Sex Male 24 0.1109 20 0.6322 -0.5213
(-0.7083, -0.3342) Female 25 0.0586 24 0.5697 -0.5111
(-0.7803, -0.2419)Race Black 18 -0.0171 14 0.5229 -0.54
(-0.8535, -0.2265) White 30 0.06462 28 0.6578 -0.5931
(-0.7928, -0.3934)
Reference ID: 3377256

---------------------------------------------------------------------------------------------------------This is a representation of an electronic record that was signedelectronically and this page is the manifestation of the electronicsignature.---------------------------------------------------------------------------------------------------------/s/----------------------------------------------------
QUQUAN LIU09/20/2013
HSIEN MING J HUNG09/21/2013
Reference ID: 3377256


STATISTICS FILING CHECKLIST FOR A NEW NDA/BLA
File name: 5_Statistics Filing Checklist for a New NDA_BLA205109
Ququan Liu 03/13/2013 Reviewing Statistician Date
Supervisor/Team Leader Date
Reference ID: 3278247
---------------------------------------------------------------------------------------------------------This is a representation of an electronic record that was signedelectronically and this page is the manifestation of the electronicsignature.---------------------------------------------------------------------------------------------------------/s/----------------------------------------------------
QUQUAN LIU03/18/2013
HSIEN MING J HUNG03/25/2013
Reference ID: 3278247

![Apolipoproteins A and B and PCSK9: Nontraditional ...downloads.hindawi.com/journals/jdr/2019/6906278.pdf · ulation and CKD/ESRD patients [11, 12]. It is not currently clear whether](https://static.fdocuments.us/doc/165x107/6068a7076d7ed02541165140/apolipoproteins-a-and-b-and-pcsk9-nontraditional-ulation-and-ckdesrd-patients.jpg)
![Cardiac abnormalities in chronic kidney disease...(CKD)[1] and are facing an increased risk of end-stage renal disease (ESRD), cardiovascular (CV) disease and death [2]. Cardiovascular](https://static.fdocuments.us/doc/165x107/5e54d7d48df1ba3c1a77ad8a/cardiac-abnormalities-in-chronic-kidney-disease-ckd1-and-are-facing-an-increased.jpg)