2021 Municipal Infrastructure
50
Municipal Infrastructure 2021 A Review of Ontario's Municipal Infrastructure and an Assessment of the State of Repair
Transcript of 2021 Municipal Infrastructure

MunicipalInfrastructure
2021
A Review of Ontario's Municipal Infrastructure and an Assessment of the State of Repair

About this document
Established by the Financial Accountability Officer Act, 2013, the Financial Accountability Office (FAO) provides
independent analysis on the state of the Province’s finances, trends in the provincial economy and related matters
important to the Legislative Assembly of Ontario.
The FAO produces independent analysis on the initiative of the Financial Accountability Officer. Upon request from
a member or committee of the Assembly, the Officer may also direct the FAO to undertake research to estimate
the financial costs or financial benefits to the Province of any bill or proposal under the jurisdiction of the legislature.
This report was prepared on the initiative of the Financial Accountability Officer in response to a request from a
member of the Assembly, and completes the second phase of a three-part project that aims to estimate the
financial implications of certain climate change hazards on Provincial and municipal infrastructure. In keeping with
the FAO’s mandate to provide the Legislative Assembly of Ontario with independent economic and financial
analysis, this report makes no policy recommendations.
This report was prepared by Mavis Yang, Sabrina Afroz, and Nicolas Rhodes under the direction of Edward
Crummey and Paul Lewis.
This report relies on information collected, standardized, and estimated by the FAO. Due to data gaps and the lack
of a standardized definition of asset condition across municipalities, there is uncertainty around the exact condition
of the majority of assets analyzed in this report. As a result, the FAO produced a range of estimates for the
municipal infrastructure backlog. Throughout the report the average result of these simulations is presented unless
otherwise stated.
The FAO’s methodology was based on the Ontario Ministry of Infrastructure’s asset deterioration model, which the
FAO further developed to incorporate municipal assets.
The FAO is grateful for the support of numerous asset management and engineering experts in the preparation of
this report. While external reviewers provided comments on early drafts, their assistance implies no responsibility
for this final report, which rests solely with the FAO.
Financial Accountability Office of Ontario 2 Bloor Street West, Suite 900 Toronto, Ontario M4W 3E2 | fao-on.org | [email protected] | 416-644-0702
This document is also available in an accessible format and as a downloadable PDF on our website.
ISBN 978-1-4868-5454-7
© Queen’s Printer for Ontario, 2021

Table of Contents
Summary 1
Introduction and Background 4
Overview of Public Infrastructure 4
State of Repair and Infrastructure Backlog 5
Purpose of this Report 5
Municipal Infrastructure 6
6
6
9
11
11
11
13
18
What Infrastructure do Municipalities Own?
Data and Scope
The Value of Municipal Infrastructure
The State of Repair of Municipal Infrastructure
Why State of Repair is Important
Details on the State of Repair of Municipal
Infrastructure The Municipal Infrastructure Backlog
Appendices
Appendix A: State of Repair by Economic Region 18
Appendix B: State of Repair by Sector 35Appendix C: Comparison between the State of Repair of Provincial and Municipal Assets 36
Appendix D: Data and Methodology 38

1
Summary Overview and Background
• This report reviews the infrastructure assets owned by Ontario municipalities, estimates their current
replacement value (CRV) and current condition, and estimates the costs to bring municipal assets into
a state of good repair in 2020.
• Ontario’s 444 municipalities own and manage the majority of public infrastructure in the province,
more than both the federal and provincial governments combined.
• Despite the importance of municipal infrastructure, a comprehensive municipal asset dataset does not
exist. While Ontario’s municipalities are in the process of improving their asset data, current data
varies in quality and availability. The results presented in this report are based on an asset inventory
compiled by the FAO from currently available data sources and are subject to the FAO’s
methodology.1
The Composition and Value of Municipal Infrastructure
• Ontario’s municipalities2 own a wide range of infrastructure assets. This report focuses on roads and
bridges, potable water, storm water and wastewater systems, parks and recreational facilities, social
housing, solid waste disposal facilities, police stations, fire stations, public transit and other buildings.3
• The FAO estimates that the CRV of municipal infrastructure was $484 billion in 2020. CRV is the
current cost of rebuilding an asset with the equivalent capacity, functionality and performance.
o Municipal roads and bridges are valued at almost $171 billion (35 per cent of total municipal CRV).
o Municipal water infrastructure, including potable water, storm water and wastewater, is valued
at $229 billion (47 per cent of total CRV).
o The remaining $84 billion of assets (about 17 per cent) include transit sector infrastructure and
buildings and facilities in other sectors.
State of Repair and the Municipal Infrastructure Backlog
• Keeping assets in a state of good repair4 helps to maximize the benefits of public infrastructure, and
ensures assets are delivering their intended services in a condition that is considered acceptable from
both an engineering and a cost management perspective.
• The FAO was able to assess the condition of about 90 per cent of municipal assets in Ontario,
representing about $437 billion (in CRV) of assets.
1 Municipalities may have more accurate data on the replacement cost and condition of their infrastructure than the FAO was able to obtain.
Additionally, municipalities may evaluate their assets through different performance standards and asset management practices than used by the
FAO. For more details on the FAO’s municipal data and methodology see Appendix D. 2 For more information about Ontario’s municipalities see Ministry of Municipal Affairs and Housing: List of Ontario municipalities. 3 Table 3-1 summarizes the scope of municipal infrastructure assets examined in this report. 4 Appendix D provides details on the performance standards the FAO used in this report to determine “state of good repair”.
2
• For municipal assets with condition data, the FAO estimates that 54.7 per cent are in a state of good
repair. However, given the uncertainty around actual asset conditions, this share could be
approximately five percentage points higher or lower. The remaining 45.3 per cent of assets (+/- five
percentage points) are estimated to be not in a state of good repair.5
• Generally, when an asset is no longer in a state of good repair, asset managers endeavor to bring the
asset back into a state of good repair where appropriate and possible. The capital spending required
to bring assets up to a state of good repair is defined in this report as the infrastructure backlog.6
These costs do not include ongoing operations and maintenance expenses or any repair or
replacement costs over the lifecycle of assets.
• The FAO estimates that the current municipal infrastructure backlog is about $52 billion. This would be
the cost to bring municipal assets that require capital spending into a state of good repair in 2020.
o However, there is uncertainty on the precise condition of many municipal assets. The FAO
estimates that the backlog could range from $45 billion to $59 billion.
o On a sector level, municipal roads represent the largest share of the infrastructure backlog at
$21.1 billion, followed by ‘other’ buildings and facilities ($9.5 billion), wastewater ($7.3 billion),
potable water ($5.3 billion), bridges and culverts ($4.3 billion), storm water ($3.8 billion) and
transit ($1.0 billion).
o In addition, there is $47 billion of municipal assets whose condition is unknown. These assets
are not included in the FAO’s infrastructure backlog estimates. If these assets were
incorporated the size of the backlog would be larger.
• Maintaining public infrastructure in a state of good repair is generally the most cost-effective strategy
over an asset’s life cycle but is not the only consideration for asset managers with multiple budgetary
priorities. However, further postponing repairs raises the risk of service disruption and increases the
costs associated with municipal infrastructure over time.
• For information on the state of repair and infrastructure backlog by economic region, see Appendix
A. For a complete sectoral and asset-type breakdown of the state of repair and infrastructure
backlog, see Appendix B. For a comparison between the state of repair of Ontario’s provincial
infrastructure and municipal infrastructure, see Appendix C. For a description of FAO’s data and
methodology, see Appendix D.
5 State of good repair thresholds are defined based on modelling performance standards developed by Ontario’s Ministry of Infrastructure and
further supplemented by the FAO. For more information see Appendix D.
6 There is no common definition of the infrastructure backlog. See Appendix D for a description of how the infrastructure backlog is
calculated in this report.

3
Figure 1-1: Municipal infrastructure, the state of repair and the infrastructure backlog, 2020
Notes: The estimates presented under the state of repair of municipal infrastructure, type of repair required, cost of repair and infrastructure backlog are the average
values from the FAO’s Monte Carlo analysis.
* Rehabilitation is the repair of all or part of an asset, extending its life beyond that of the original asset, without adding to its capacity, functionality or performance.
Renewal is the replacement of an existing asset, resulting in a new or as-new asset with an equivalent capacity, functionality and performance as the original asset.
Renewal is different from rehabilitation, as renewal rebuilds the entire asset.
** This box represents older assets that will be left to deteriorate for several years before being completely replaced.
Source: FAO analysis of municipal data as detailed in Appendix D.
$52.1 billionTotal Infrastructure
Backlog
$239.2 billion(54.7%)
CRV of Assets in a State of Good Repair
$197.8 billion(45.3%)
CRV of Assets Not in a State of
Good Repair
State of Repair of Municipal Infrastructure
Infrastructure Backlog
Type of Repair Required
Cost of Repair
$484.2 billionCurrent
Replacement Value(CRV)
Municipal Infrastructure
$437.0 billion(90.2%)
Condition Data Available
Condition Data Availability
$47.2 billion(9.8%)
No Condition Data Available
$2.4 billion**CRV of Assets not
currently in need of Rehabilitation/Renewal
$24.3 billion*CRV of Assets in need of Renewal
$171.2 billion*CRV of Assets
in need of Rehabilitation
$27.9 billionCost of
Rehabilitation
$24.3 billionCost of Renewal

4
Introduction and Background Overview of Public Infrastructure Public infrastructure and its state of repair has a direct impact on communities, facilitating the day-to-day
operation of the economy and society, as well as providing capacity to deal with economic and social
challenges that arise.7
Infrastructure assets are generally capital intensive, require extended development periods, and tend to have
long useful lives.8 Public infrastructure assets in Ontario include buildings, such as schools and hospitals;
engineering infrastructure, such as the highway network and sewage and water systems; and machinery and
equipment (M&E), such as transit buses and hospital equipment. Ownership of public infrastructure varies by
the type of asset. For example, sewage infrastructure is largely owned by municipalities, while ownership of
transportation infrastructure (road and highway networks and transit assets) is distributed largely between the
Province and municipalities.9
Ontario’s 444 municipalities own the majority of public infrastructure assets in the province, a larger share of
assets than both the provincial and federal governments combined.10 Funds for municipal infrastructure come
largely from municipal own-source revenues (51 per cent), although significant funding is also provided by
federal (11 per cent) and provincial government transfers (8 per cent), along with government and private
donations (11 per cent) and debt issuance (18 per cent).11
Despite the importance of municipal infrastructure, a comprehensive dataset of these assets is not available. In
2017, the Province passed Ontario Regulation 588/17,12 mandating that municipalities must develop detailed
asset inventories for their core infrastructure assets and eventually expand these inventories to cover all
municipal assets. The deadline for municipalities to fulfill these requirements is July 1, 2022 for core
infrastructure and July 1, 2024 for all assets. As these data sets are still in development, current municipal
infrastructure data varies in quality and availability. To assess municipal infrastructure, the FAO compiled a
municipal asset inventory from currently available sources.13
7 Investing in Canada — Canada’s Long-Term Infrastructure Plan, Infrastructure Canada, Government of Canada, 2018. 8 For a technical discussion on what constitutes public infrastructure see Baldwin, John R. and Dixon, Jay, Infrastructure Capital: What is it?
Where is it? How Much of it is There? (March 12, 2008). Canadian Productivity Review Research Paper No. 16. 9 Statistics Canada, “Table 36-10-0608-01 Infrastructure Economic Accounts, investment and net stock by asset, industry, and asset function (x
1,000,000).” 10 See the FAO’s 2020 Provincial Infrastructure report. 11 Based on analysis of the Ontario Ministry of Municipal Affairs’ Financial Information Return. The figures represent average shares from 2009 to 2018. 12 See O. Reg. 588/17: Asset Management Planning for Municipal Infrastructure and Ontario's Regulatory Registry. 13 For a detailed description of how the FAO compiled its municipal asset inventory, see Appendix D.

5
State of Repair and Infrastructure Backlog Assessing the state of repair of public infrastructure, and keeping assets in a state of good repair14 helps to
maximize the benefits of public infrastructure and ensures assets are delivering their intended services in a
condition that is considered acceptable from both an engineering and a cost management perspective.15
New assets enter service in a state of good repair. However, over time an asset deteriorates due to aging and
ongoing use and eventually falls out of a state of good repair, at which point capital rehabilitation projects
could be undertaken to maximize the service life of the asset. Falling out of a state of good repair does not
necessarily mean that the asset is unsafe for use or is not functioning adequately.
Generally, when an asset is no longer in a state of good repair, asset managers endeavor to bring it back into a
state of good repair when appropriate and possible. The cost required to bring assets into a state of good repair is
defined in this report as the infrastructure backlog.16 This cost includes both rehabilitating17 assets that have fallen
out of a state of good repair and renewing18 assets that have fallen out of a state of good repair but cannot or
should not be rehabilitated. These costs do not include ongoing operations and maintenance expenses or any repair
or replacement costs over the lifecycle of assets. The estimates presented in this report are largely based on data
standardization and forecasting methodology developed by Ontario’s Ministry of Infrastructure and further
refined by the FAO.19
Purpose of this Report The purpose of this report is to provide an overview of the infrastructure assets owned by Ontario’s
municipalities, estimate their current replacement value, and assess their state of repair. The first section of this
report reviews the infrastructure owned by municipalities and estimates their value. The second section assesses
the state of repair of municipal infrastructure and provides an estimate of the infrastructure backlog.
This report does not analyze the fiscal capacity of municipalities to undertake the amount of capital investment
required to eliminate the infrastructure backlog, nor does it assess the stock of municipal infrastructure against
current demand and future expansion needs. This report does not provide any comparisons with other
reports20 on the state of repair of municipal infrastructure within Ontario or outside the province because of
differences in definitions and methodologies which could cause inaccurate comparisons. Appendix A assesses
municipal infrastructure’s state of repair by Economic Region. Appendix B lists the state of repair of municipal
infrastructure by sector. Appendix C compares the state of repair of Ontario’s Provincial infrastructure with
that of Ontario’s municipalities, while Appendix D describes the FAO’s data and methodology.
14 In this report, state of good repair depends on performance standards of acceptable asset conditions (i.e., repair targets), which vary across
asset-types. Appendix D provides details on the repair targets used in this report. 15 2017 Long-term Infrastructure Plan: Technical Appendix, Ministry of Infrastructure, Government of Ontario. 16 There is no common definition of the infrastructure backlog. For example, some infrastructure assessments describe the backlog as the capital
spending required to address deferred renewal investments, while others consider the costs associated to bring and maintain existing assets to a
“perfect” condition over the next three years. Some assessments of the backlog may also include costs to satisfy the future demand for
infrastructure capacity and service improvements. See Appendix D for a description of how the infrastructure backlog is calculated in this report. 17 Rehabilitation is the repair of all or part of an asset, extending its life beyond that of the original asset, without adding to its capacity,
functionality or performance. Rehabilitation is different from maintenance, which is the routine activities performed on an asset that maximize
service life and minimize service disruptions. Assets are rehabilitated to a state of good repair (the repair target) and not to a new condition. 18 Renewal is the replacement of an existing asset, resulting in a new or as-new asset with an equivalent capacity, functionality and performance
as the original asset. Renewal is different from rehabilitation, as renewal rebuilds the entire asset. 19 The FAO’s estimates of the state of repair and the infrastructure backlog are sensitive to the data and methodology used in this report.
Appendix D include more information on the sources and quality of data as well as the methodology used in the FAO’s analysis. 20 See The State of Ontario’s Water and Wastewater Infrastructure, Provincial-Municipal Fiscal and Service Delivery Review , and Canadian
Infrastructure Report Card 2016 for details.

6
Municipal Infrastructure What Infrastructure do Municipalities Own? Ontario’s 444 municipalities own more public infrastructure than both the provincial and federal government
combined.21 Municipal infrastructure includes a wide range of assets such as: potable water; storm water and
wastewater systems; parks and recreational facilities; social housing, solid waste disposal; roads and bridges;
police stations; fire stations; and public transit, among others.22 These municipal assets are essential to
economic and social activity in Ontario.
Data and Scope There is no single data source that provides a complete picture of the value and condition of all infrastructure
assets owned by Ontario’s municipalities. While work is underway by municipalities to document assets either
through their own municipal datasets or Asset Management Plans (AMP), as required by Ontario Regulation
588/17,23 publicly available asset data varies in quality and coverage.
Apart from individual municipal datasets and AMPs, there are also several other datasets that compile
municipal infrastructure information, including:
• Statistics Canada’s Canadian Core Public Infrastructure (CCPI) survey
• Ontario Ministry of Municipal Affairs’ Financial Information Return (FIR)
• Ontario Ministry of Infrastructure’s (MOI) Municipal Asset Inventory.
These datasets present different types of information. For example, Statistics Canada’s CCPI dataset includes
detailed information of municipal asset composition, condition and age, but not estimates of asset value, while
the FIR presents accounting information reported by municipalities. Ontario Ministry of Infrastructure’s
Municipal Asset Inventory provides condition and CRV estimates for the majority of municipal infrastructure.
However, many of the sources used in MOI’s inventory have since been updated. As a result, the FAO
compiled data from all these sources to develop an updated Municipal Asset Inventory (MAI). See Appendix D
for additional details.
Due to data limitations, this report focusses on all “core” municipal assets24 as well as some “non-core” assets
including many types of municipal buildings. Excluded from the analysis were land, forestry, information
technology, machinery and equipment and specific types of non-linear engineering infrastructure, such as
artificial turf sports fields or playgrounds.
21 Based on analysis of the Ontario Ministry of Municipal Affairs and Housing’s Financial Information Return, Public Accounts of Ontario, and
Public Accounts of Canada the FAO estimates that municipalities own roughly 52 per cent of public infrastructure assets in Ontario, while the
Government of Ontario owns 38 per cent and the federal government owns 10 per cent. These estimates include only tangible capital assets that
are consolidated on government balance sheets and exclude non-consolidated assets. Importantly, since these estimates are based on
accounting information they will not align with the current replacement value estimates presented in this report or the FAO’s 2020 Provincial
Infrastructure report. 22 Different municipalities deliver different services depending on their tier. See Ontario Municipalities for details on services provided by different
tiers of municipalities in Ontario. 23 See O. Reg. 588/17: Asset Management Planning for Municipal Infrastructure. 24 Statistics Canada defines core public infrastructure assets to include: roads, bridges and tunnels; storm water, wastewater, and potable water;
culture, recreation and sports facilities; public social and affordable housing; public transit and solid waste.

7
Table 3-1 summarizes the scope of municipal infrastructure assets examined in this report. For each sector,
the table shows the different types of infrastructure assets included – buildings and facilities or engineering
infrastructure – and provides a brief description of those assets.
Table 3-1: Municipal infrastructure assets by sector
Sector Asset-Types Description
Transit
Buildings and
Facilities
Linear Engineering
• Building-type transit infrastructure includes passenger stations/terminals, transit
shelters, maintenance and storage facilities, and bicycle racks and shelters.
Ontario municipalities own an estimated 207 passenger stations/terminals,
14,205 transit shelters, 197 maintenance and storage facilities and 8,236 bicycle
racks and shelters. The majority (68.0 per cent) of these infrastructure assets
were built between 2000 and 2009.
• Linear engineering transit infrastructure includes transit-owned bridges, roads,
tracks and tunnels. Ontario municipalities own an estimated 209 bridges, 13
tunnels, 141 km of transit-owned roads and 408 km of tracks.
o Nearly two-fifths (39.6 per cent) of transit-owned bridges and tunnels were
built between 1970 and 1999, followed by just above one-fifth (20.7 per
cent) constructed between 1940 and 1969.
o Nearly two-fifths (37.3 per cent) of transit-owned roads and tracks were built
between 1970 and 1999, followed by nearly one-quarter (24.4 per cent) built
between 2010 and 2016.
Roads
Linear Engineering
• Includes arterial roads, collector roads, highways, lanes and alleys, local roads,
rural highways and sidewalks. Overall, Ontario municipalities own an estimated
365,281 lane-km of roads and 44,072 km of sidewalks.
• More than half (61.4 per cent) of the road network owned by the municipalities is
local roads; followed by arterial roads (18.0 per cent), collector roads (14.7 per
cent), rural highways (3.6 per cent), lanes and alleys (1.4 per cent) and highways
(0.9 per cent).
• One-quarter (25.1 per cent) of Ontario’s municipal roads were built between
1970 and 1999, while 14.4 per cent were constructed between 2000 and 2009.
Bridges and
Culverts
Linear Engineering
• Ontario municipalities own an estimated 23,759 bridges, culverts and tunnels.
• Nearly half of these assets are culverts (47.3 per cent), followed by local bridges
(23.7 per cent), arterial bridges (13.2 per cent), collector bridges (7.7 per cent),
footbridges (4.4 per cent), highway bridges (1.8 per cent), rural highway bridges
(1.7 per cent), and tunnels (0.1 per cent).
• Around one-third (33.3 per cent) of Ontario’s municipal bridges and culverts were
built between 1970 and 1999, while one-quarter (25.5 per cent) were built
between 1940 and 1969.
Potable Water
Buildings and
Facilities
Linear Engineering
• Building-type infrastructure include potable water pump stations and treatment
facilities. Overall, the municipalities in Ontario own an estimated 643 pumping
stations and 723 water treatment facilities. An estimated 44.3 per cent of
Ontario’s building-type potable water infrastructure was built between 1970
and 1999, followed by 22.3 per cent constructed between 2000 and 2009.
• Linear engineering infrastructure includes 57,670 km of pipes, 88.3 per cent of
which are local water pipes, followed by 9.2 per cent of transmission pipes and
2.4 per cent of pipes of unknown diameter. An estimated 42.0 per cent of the
linear engineering infrastructure was built between 1970 and 1999, followed by
17.5 per cent constructed between 2000 and 2009.
Note: While the data presented in this table is largely from Statistics Canada’s Canadian Core Public Infrastructure survey, the FAO also examined Ontario’s Ministry
of Municipal Affairs and Housing Financial Information Return dataset to assess the robustness of these estimates.
Source: FAO analysis of information from Statistics Canada’s Canadian Core Public Infrastructure survey.

8
Table 3-1 (Cont.): Municipal infrastructure assets by sector
Sector Asset-Types Description
Wastewater
Buildings and
Facilities
Linear
Engineering
• Building-type infrastructure includes wastewater lift stations, pump stations and
treatment plans. Overall, municipalities in Ontario own an estimated 753 lift
stations, 1,817 pump stations and 337 treatment plants. About half (50.6 per
cent) of Ontario’s wastewater facilities were built between 1970 and 1999.
• Linear engineering infrastructure includes an estimated 2,334 km of sanitary
forcemains and 44,802 km of sewer pipes of small (less than 450 mm), medium
(450 to 1500 mm), large (more than1500 mm) and unknown diameter. Of the
sewer pipes owned by municipalities, a majority (80.8 per cent) are small pipes,
followed by medium (13.8 per cent), unknown size (3.6 per cent) and large (1.8
per cent). A large share (42.8 per cent) of Ontario’s wastewater linear
engineering infrastructure was constructed between 1970 and 1999, while
around one-fifth (19.7 per cent) was built between 1940 and 1969.
Storm water
Buildings and
Facilities
Linear
Engineering
• Building-type infrastructure includes storm water drainage pump stations.
Ontario municipalities own an estimated 282 storm water drainage pump
stations. A large share of (42.6 per cent) of Ontario’s storm water facilities were
built between 1970 and 1999, followed by another 35.9 per cent between 2000
and 2009.
• Linear engineering infrastructure includes an estimated 8,967 km of storm water
culverts, 76,423 km of open ditches, and 40,368 km of storm water pipes. More
than one-fifth (22.9 per cent) of Ontario’s storm water linear engineering
infrastructure was built between 1970 and 1999, while around 9.3 per cent was
built between 1940 and 1969.
Other Facilities
and Buildings
Buildings and
Facilities
• “Other buildings and facilities” include those in the culture, recreation and
sports sectors, social and affordable housing, and the solid waste sector as well
as those in ‘non-core’ sectors such as government administration, health,
justice, and social services.
• Culture, recreation and sports facilities include an estimated 1,332 community
centres, 76 galleries, 813 libraries, 382 museums and archives, and nearly
2,000 other facilities such as indoor sport facilities.
• Social and affordable housing facilities include an estimated 122,764 units
within buildings, of which more than half (55.8 per cent) are in apartment
buildings (five or more storeys), followed by row houses (21.1 per cent),
apartment buildings (fewer than five storeys, 18.4 per cent), semi-detached
houses (3.0 per cent) and single detached houses (1.7 per cent).
• Solid waste facilities include an estimated 242 dump sites, 181 active
engineered landfills, 625 inactive engineered landfills and dumps, 129
composting facilities, 184 materials recovery facilities and 18 anaerobic
digestion facilities.
Note: While the data presented in this table is largely from Statistics Canada’s Canadian Core Public Infrastructure survey, the FAO also examined Ontario’s Ministry
of Municipal Affairs and Housing Financial Information Return dataset to assess the robustness of these estimates.
Source: FAO analysis of information from Statistics Canada’s Canadian Core Public Infrastructure survey.

9
The Value of Municipal Infrastructure To measure the value of infrastructure, asset managers use the concept of current replacement value (CRV).
CRV is the current cost of rebuilding an asset with the equivalent capacity, functionality and performance as
the original asset. CRV is adjusted for inflation and provides an estimate of asset value in today’s dollars.25
Based on the FAO’s analysis, the total CRV of municipal infrastructure in Ontario was approximately $484
billion, as of 2020. This represents the CRV of municipal buildings and facilities and linear engineering
infrastructure in the province. Figure 3-1 and Table 3-2 provide additional information on the breakdown of
these assets.
Figure 3-1: The current replacement value of municipal infrastructure in Ontario is about $484 billion in 2020
Source: FAO analysis of municipal data as detailed in Appendix D.
25 Current replacement value also accounts for improvements in construction technology and materials, which would deliver equivalent service
capacity for an equal or lesser cost, slightly offsetting increased costs due to inflation.
Transit
$9.3B
2%
Roads
$130.1B
27%
Bridges and
culverts
$40.4B
8%Potable water
$81.5B
17%
Wastewater
$94.3B
20%
Storm water
$53.6B
11%
Other buildings
and facilities
$74.9B
15%

10
Table 3-2: $484 billion current replacement value of municipal infrastructure in 2020
Sector Total CRV
($ Billions) Description
Transit $9.3
• $1.8 billion in building-type infrastructure such as passenger stations/terminals
and transit shelters as well as maintenance and storage facilities.
• $6.1 billion in tracks and $1.4 billion in other linear engineering-type transit
infrastructure such as transit-owned bridges, roads and tunnels.
Roads $130.1
• $64.8 billion in local roads, $29.9 billion in arterial roads, $21.0 billion in
collector roads, $8.2 billion in highways, lanes and alleys, and rural highways,
and $6.2 billion in sidewalks.
Bridges and
Culverts $40.4
• $11 billion in municipally owned local bridges, $9.4 billion in arterial bridges,
$6.7 billion in culverts, and $13.3 billion in other types of bridges.
Potable
water $81.5
• $12.7 billion in building-type potable water infrastructures such as water pump
stations and water treatment facilities.
• $68.9 billion in local water pipes and transmission pipes.
Wastewater $94.3
• $23.2 billion in building-type wastewater infrastructure such as wastewater lift
stations, pump stations, and treatment plans.
• $71.1 billion in sanitary forcemains and sewer pipes of various size.
Storm water $53.6
• $0.9 billion in building-type storm water infrastructure such as storm water
drainage pump stations.
• $52.8 billion in storm water culverts, open ditches and storm water pipes.
Other
buildings
and facilities
$74.9
• $23.1 billion in social housing, $19.2 billion in government administration
buildings, $19.3 billion in tourism, culture and sport facilities, and approximately
$13 billion in justice, health, social services, waste management and other
buildings and facilities.
Source: FAO analysis of municipal data as detailed in Appendix D.

11
The State of Repair of
Municipal Infrastructure Why State of Repair is Important The state of repair of public infrastructure has a direct impact on the communities that the assets serve. Assessing
the state of repair of Ontario’s municipal infrastructure, and determining the capital investment needed for those
assets, provides an estimate of the costs to ensure that the infrastructure operates as intended.26
Keeping assets in a state of good repair27 helps to maximize the benefits of public infrastructure, and ensures
assets are delivering their intended services in a condition that is considered acceptable from both an
engineering and a cost management perspective.28
New assets enter service in a state of good repair. However, over time an asset deteriorates due to aging and
ongoing use and eventually falls out of a state of good repair, at which point capital rehabilitation projects
could be undertaken to maximize the service life of the asset. Falling out of a state of good repair does not
necessarily mean that the asset is unsafe for use or is not adequately fulfilling its function.
To assess whether assets are in a state of good repair, each asset’s condition was compared against standardized
performance targets provided by the Ontario Ministry of Infrastructure and further developed by the FAO.29 For
each asset, these performance standards include repair targets, failure thresholds and useful life assumptions.30
For a detailed discussion on the methodology used in this report to measure state of repair see Appendix D.
Details on the State of Repair of Municipal Infrastructure Ontario’s municipalities manage $484 billion of infrastructure assets. These assets can be grouped into five
condition categories ranging from ‘Very Good’ to ’Very Poor’. Figure 4-1 presents the reported condition data
of all municipal assets examined in this report. Overall, 54.5 per cent of the assets are in ‘Good’ or better
condition, while 35.8 per cent of the assets are in ‘Fair’ or worse condition. The remaining 10 per cent of
assets had no condition data.
26 2017 Long-term Infrastructure Plan: Technical Appendix, Ministry of Infrastructure, Government of Ontario. 27 The term “state of good repair” is used by some entities to refer to an asset operating as intended, delivering the services which the asset was
placed into operation to provide. In this report, state of good repair depends on performance standards of acceptable asset conditions (i.e.,
repair targets), which vary across asset-types. Appendix D provides details on the repair targets used by the FAO in this report. 28 2017 Long-term Infrastructure Plan: Technical Appendix, Ministry of Infrastructure, Government of Ontario. 29 Asset managers may also use alternative targets to evaluate their infrastructure assets. For example, one municipality may use different
standards to measure the condition of its assets relative to another municipality. For this report, the FAO has applied a standardized methodology
to calculate the state of good repair for all municipal assets based on performance targets provided by the Ontario Ministry of Infrastructure and
further developed by the FAO. 30 The repair target is the condition which, at or above, an asset is considered in a state of good repair. The failure threshold is the condition
which, at or below, an asset must be replaced with a new asset (i.e., renewal) to bring that asset into a state of good repair. The useful life is the
number of years that an asset typically remains in operation. Appendix D provides additional details on the methodology used in this report.

12
Figure 4-1: The reported condition of municipal infrastructure by sector
Source: FAO analysis of municipal data as detailed in Appendix D.
There is a considerable degree of uncertainty associated with the reported condition data. In some cases,
reported condition data was based on engineering site inspections, while in other cases the data may be
imputed based on the asset’s age, or may simply reflect the municipality’s judgement in the absence of a site
inspection.
Additional uncertainty comes from the standards by which condition is assessed across municipalities. For
example, an asset assessed to be in ‘Good’ condition in one municipality might be assessed as ‘Fair’ based on
another municipality’s framework.
To account for this uncertainty, the FAO defined a broader boundary for the condition of each asset. For
instance, an asset reported as ‘Good’ could take on a condition from ‘Very Good’ to ‘Fair’. 31 Based on this
approach, the FAO developed a range of condition estimates.
On average, the FAO estimates that 54.7 per cent of municipal assets are in a state of good repair ($239.2
billion of infrastructure). However, given the uncertainty this share could range from 59 per cent in a best-case
scenario to 50 per cent of assets at worst. On average, the remaining 45.3 per cent of assets are estimated to
be not in a state of good repair ($197.8 billion of infrastructure), with a range of 41 to 50 per cent.
There is considerable variation in the state of repair of municipal infrastructure among sectors. Based on the
results from the FAO’s analysis, the potable water sector has a relatively higher share of assets in a state of
good repair compared to the overall average of 54.7 per cent, followed by wastewater and storm water. In
contrast, the share of assets in a state of good repair in the transit, bridges and culverts, other buildings and
facilities and roads sectors was below the overall average.
31 For details, see Appendix D.
0.0
10.0
20.0
30.0
40.0
50.0
60.0
70.0
80.0
90.0
100.0
Transit Bridges and
culverts
Roads Potable
water
Storm water Wastewater Other
buildings and
facilities
Total
Co
nd
itio
n D
istr
ibu
tio
n o
f A
sse
ts b
y C
RV
(Pe
r C
en
t)
Unknown Condition Very Poor Poor Fair Good Very Good

13
Figure 4-2: State of repair of municipal infrastructure by sector
Note: The estimates presented are the average values from the FAO’s Monte Carlo analysis.
Source: FAO analysis of municipal data as detailed in Appendix D.
However, there is $47 billion of municipal assets whose condition is unknown. These assets were excluded
from the assessment above and could materially shift the estimated percentage of assets considered in a state
of good repair.
In addition, the storm water and wastewater sectors have a significantly higher share of assets without any
condition information — increasing the uncertainty associated with the state of repair of these assets.
Depending on the state of assets with unknown condition, the condition results of these sectors could be
significantly different.
The Municipal Infrastructure Backlog Generally, when an asset is no longer in a state of good repair, asset managers endeavor to bring the asset
back into a state of good repair where appropriate and possible. The cost required to bring assets up to a
state of good repair is defined in this report as the infrastructure backlog.32 This cost includes both
rehabilitating33 assets that have fallen out of a state of good repair and renewing34 assets that have fallen out of
a state of good repair but cannot or should not be rehabilitated. The infrastructure backlog does not include
operations and maintenance expenses, or the future lifecycle cost of an asset.
32 There is no common definition of the infrastructure backlog. For example, some infrastructure assessments describe the backlog as the capital
spending required to address deferred renewal investments, while others consider the costs associated to bring and maintain existing assets to a
“perfect” condition over the next three years. Some assessments of the backlog may also include costs to satisfy the future demand for
infrastructure capacity and service improvements. See Appendix D for a description of how the infrastructure backlog is calculated in this report. 33 Rehabilitation is the repair of all or part of an asset, extending its life beyond that of the original asset, without adding to its capacity, functionality, or
performance. Rehabilitation is different from maintenance, which comprises the routine activities performed on an asset that maximize service life and
minimize service disruptions. Assets are rehabilitated to a state of good repair (the repair target) and not to a new condition. 34 Renewal is the replacement of an existing asset, resulting in a new or as-new asset with an equivalent capacity, functionality, and performance
as the original asset. Renewal is different from rehabilitation, as renewal rebuilds the entire asset.
42.3 50.2 43.8
68.5 67.0 67.3
41.6 54.7
57.7 49.8 56.2
31.5 33.0 32.7
58.4 45.3
Transit Bridges and
culverts
Roads Potable water Storm water Wastewater Other
buildings and
facilities
Total
Sta
te o
f R
ep
air
by
CR
V (
Pe
r C
en
t)
Share of Assets in a State of Good Repair Share of Assets not in a State of Good Repair

14
Estimating the spending required to address the infrastructure backlog helps asset managers plan and budget
accordingly. Importantly, while some assets may not be in a state of good repair, it may be a prudent asset
management strategy to not immediately undertake rehabilitation or renewal. For example, older assets that
are no longer in a state of good repair might be left to deteriorate for several years before being completely
replaced. Optimal asset management strategies will focus on maximizing the use of an asset, minimizing
related costs, and balancing these needs against other priorities.
The calculations for the infrastructure backlog presented in this report are largely based on a modelling
framework provided by the Ontario Ministry of Infrastructure and further developed by the FAO. This
framework evaluates infrastructure data through a series of simplified asset management decisions to estimate
the infrastructure backlog.35
To account for the uncertainty associated with the condition of municipal infrastructure, the FAO conducted a
Monte Carlo analysis with 5,000 simulations. In each simulation, the model randomly selected the condition of
each asset from the condition range described in Appendix D. The results of all simulations are then averaged
to determine the average size of the municipal infrastructure backlog. Figure 4-3 shows the results for all 5,000
simulations of the municipal infrastructure backlog.
Figure 4-3: Range of total municipal infrastructure backlog in Ontario ($ Billions)
Note: The chart represents the histogram of 5,000 Monte Carlo estimates of total infrastructure backlog. The height of each bar shows the number of times estimates
from the simulations fall into the range of infrastructure backlog specified by the horizontal axis.
Source: FAO based on data and methodology described in Appendix D.
35 The FAO’s estimates of the infrastructure backlog are sensitive to the data and methodology used in this report. Municipalities manage a
diverse portfolio of assets and may use different methodologies to determine the state of repair and infrastructure backlog of their assets, which
may not align with the estimates presented in this report. Appendix D include more information on the sources and quality of data and the
methodology used in the FAO’s analysis.
Total Municipal Infrastructure Backlog ($ Billions)
Freq
uenc
y
500
400
300
200
100
0
44.8
45.3
45.8
46.3
46.8
47.3
47.8
48.3
48.8
49.3
49.8
50.3
50.8
51.3
51.8
52.3
52.8
53.3
53.8
54.3
54.8
55.3
55.8
56.3
56.8
57.3
57.8
58.3

15
Based on the simulations, the FAO estimates that the municipal infrastructure backlog in Ontario could range
from $44.8 billion to $58.7 billion, with an average value of $52.1 billion. The $52.1 billion backlog estimate is
comprised of:
• $27.9 billion in rehabilitation costs, which are required to bring the $171.2 billion of assets in need
of rehabilitation back to a state of good repair; and
• $24.3 billion in renewal costs, which are required for $24.3 billion of assets in need of replacement.
Of the $197.8 billion in municipal assets that are not in a state of good repair, about 99 per cent ($195.5
billion) currently require capital spending on rehabilitation or renewal. The remaining one per cent of assets
($2.4 billion) that are not in a state of good repair are older assets that will be left to deteriorate before eventually
being replaced entirely. These assets are not included in the current infrastructure backlog estimate.
The $52.1 billion infrastructure backlog does not include any assets that have unknown conditions. Since
some of these assets would likely be in need of rehabilitation or renewal, the FAO’s estimated backlog
represents the lower bound of the municipal infrastructure backlog in Ontario.
Figure 4-4: State of repair and the infrastructure backlog
Notes: The estimates presented under the state of repair of municipal infrastructure, type of repair required, cost of repair and infrastructure backlog are the average
values from the FAO’s Monte Carlo analysis.
* Rehabilitation is the repair of all or part of an asset, extending its life beyond that of the original asset, without adding to its capacity, functionality or performance.
Renewal is the replacement of an existing asset, resulting in a new or as-new asset with an equivalent capacity, functionality and performance as the original asset.
Renewal is different from rehabilitation, as renewal rebuilds the entire asset.
** This box represents older assets that will be left to deteriorate for several years before being completely replaced.
Source: FAO analysis of municipal data as detailed in Appendix D.
On a sector level, municipal roads represent the largest share of the infrastructure backlog at $21.1 billion,
followed by other buildings and facilities ($9.5 billion), wastewater ($7.3 billion), potable water ($5.3 billion),
bridges and culverts ($4.3 billion), storm water ($3.8 billion) and transit ($1.0 billion).
$52.1 billionTotal Infrastructure
Backlog
$239.2 billion(54.7%)
CRV of Assets in a State of Good Repair
$197.8 billion(45.3%)
CRV of Assets Not in a State of
Good Repair
State of Repair of Municipal Infrastructure
Infrastructure Backlog
Type of Repair Required
Cost of Repair
$484.2 billionCurrent
Replacement Value(CRV)
Municipal Infrastructure
$437.0 billion(90.2%)
Condition Data Available
Condition Data Availability
$47.2 billion(9.8%)
No Condition Data Available
$2.4 billion**CRV of Assets not
currently in need of Rehabilitation/Renewal
$24.3 billion*CRV of Assets in need of Renewal
$171.2 billion*CRV of Assets
in need of Rehabilitation
$27.9 billionCost of
Rehabilitation
$24.3 billionCost of Renewal

16
Figure 4-5: Ontario municipalities’ $52.1 billion infrastructure backlog by sector
Note: The estimates presented are the average values from the FAO’s Monte Carlo analysis.
Source: FAO analysis of municipal data as detailed in Appendix D.
The municipal infrastructure backlog can also be presented as a share of CRV. This ratio provides a
measurement of average asset condition36 and allows for comparisons across sectors, asset-types and
regions. Overall, the municipal infrastructure backlog of $52.1 billion represents 11.9 per cent of the CRV of
the municipal infrastructure with a known condition.
36 The poorer the condition of an asset, the higher the ratio of infrastructure backlog to CRV.
Transit
$1.0B
2%
Bridges and
culverts
$4.3B
8%
Roads
$21.1B
41%
Potable water
$5.3B
10%
Storm water
$3.8B
7%
Wastewater
$7.3B
14%
Other buildings
and facilities
$9.5B
18%
17
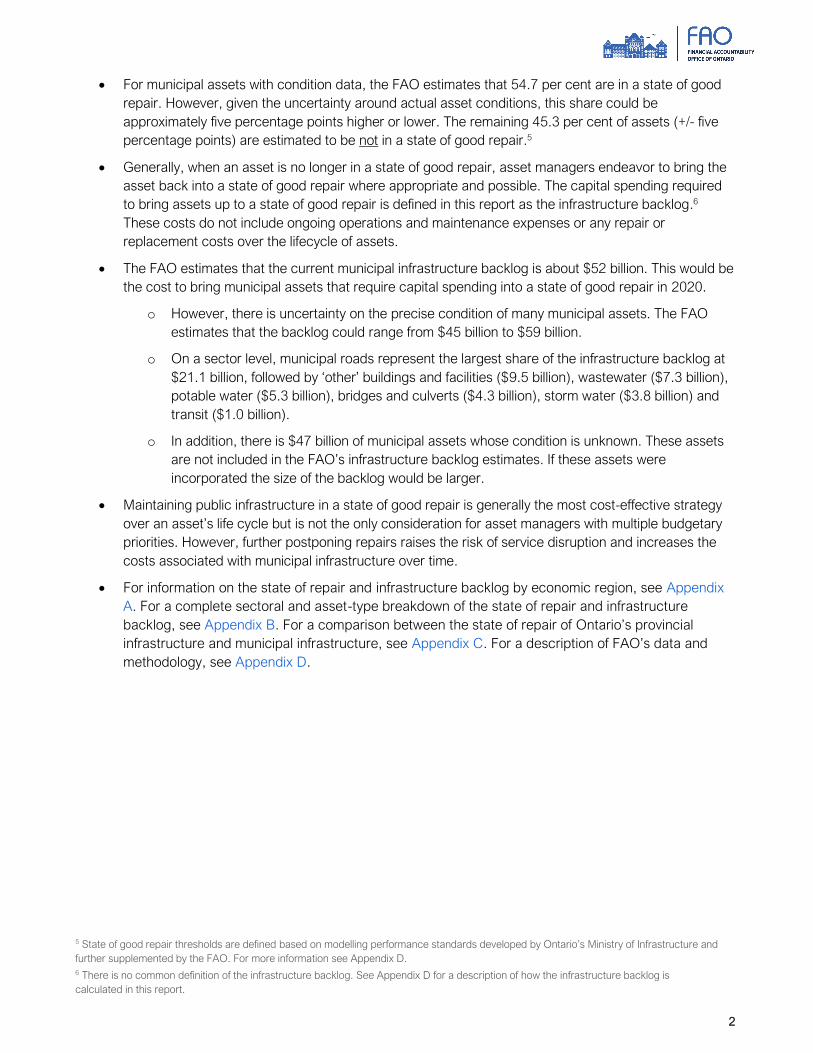
Figure 4-6: Infrastructure backlog relative to the CRV of each sector
Note: The backlog to CRV presented in this chart only represents the CRV of assets with known conditions. The estimates presented are the average values from the
FAO’s Monte Carlo analysis.
Source: FAO analysis of municipal data as detailed in Appendix D.
• Municipal roads, which represent the largest share of total backlog, also have a relatively high backlog
to CRV ratio (17.2 per cent). The backlog is mostly driven by local and arterial roads.
• Other buildings and facilities, which represent nearly 18 per cent of total backlog, have an
infrastructure backlog to CRV ratio of 13.5 per cent. The backlog in this sector is driven by municipally
owned tourism, culture and sport facilities.
• Potable water (7.1 per cent), wastewater (8.8 per cent), storm water (9.8 per cent), bridges and
culverts (11.0 per cent), and transit (11.3 per cent) have relatively lower backlog to CRV ratios,
implying that these assets are in relatively better condition compared to other sectors.
Addressing the Backlog
The estimated $52.1 billion municipal infrastructure backlog represents the current capital spending required
to bring municipal assets into a state of good repair in 2020. However, it is not practically feasible to repair and
replace all these assets in a single year. In addition, maintaining assets in a state of good repair is only one aspect of
municipal asset management and may conflict with other budgetary priorities. Nonetheless, each year the
backlog is not addressed, the cost of bringing assets into a state of good repair increases. This occurs because
assets continue to deteriorate each year, while construction prices generally increase. Further postponing
infrastructure repairs could raise the risk of service disruption and will increase the costs associated with municipal
infrastructure over time.
State of Repair and Infrastructure Backlog by Region, Sector and Level of
Government
For information on the state of repair and infrastructure backlog by economic region see Appendix A. For a
complete sectoral and asset-type breakdown of the state of repair and infrastructure backlog see Appendix
B. For a comparison of the state of repair of municipal and provincial infrastructure see Appendix C.
11.3 11.0
17.2
7.1
9.88.8
13.5
11.9
0
2
4
6
8
10
12
14
16
18
20
Transit Bridges and
culverts
Roads Potable water Storm water Wastewater Other
buildings and
facilities
Total
Infr
astr
uctu
re B
acklo
g t
o C
RV
(Pe
r C
en
t)

18
Appendices : State of Repair by Economic Region
This section examines the state of repair of municipal infrastructure by economic region.37 Each economic
region encompasses all the municipalities within it.38 For example, the Toronto economic region includes 24
different municipalities including the City of Toronto. The assets presented in this section include only those for
which geographic and condition information39 was available (90.0 per cent of municipal assets by CRV). The
remaining 10 per cent of assets have either no geographic information or no condition information and are
excluded from this regional analysis. Importantly, the results presented in this section are subject to
uncertainty, and reflect the FAO’s best estimate of the CRV, condition and costs to bring assets into a state of
repair for each economic region.
Figure A-1: Share of municipal assets in a state of good repair by economic region
Notes: Geographic location and condition data are available for 90 per cent of municipal assets. The remaining asset data did not have geographic and condition
information. The estimates presented are the average values from the FAO’s Monte Carlo analysis.
Source: FAO analysis of municipal data as detailed in Appendix D.
37 Defined by Statistics Canada, Ontario’s economic regions are groupings of census divisions used to create a standard geographical unit for
analyzing regional economic activity. For more information, see Statistics Canada’s Standard Geographical Classification – Economic Regions. 38 See Table A-2, for a list of all municipalities under each economic regions of Ontario. 39 While the physical location of municipal infrastructure is within economic regions, many assets serve residents beyond the boundaries of
economic regions. For example, roads in the Toronto economic region serve anyone driving in this region, not only the residents of the region.
62%
39%
51%Northwest
Northeast
Kitchener-Waterloo-Barrie
Stratford-Bruce Peninsula
London
Windsor-Sarnia
Muskoka-KawarthasToronto
Hamilton-Niagara Peninsula
OttawaKingston-Pembroke
Share of Assets in aState of Good Repair

19
There is a large variation in the state of repair of municipal infrastructure across Ontario’s economic regions.
The region with the largest share of assets in a state of good repair is the Toronto economic region at 62.3 per
cent, which is 7.6 percentage points higher than the provincewide average. In contrast, the Ottawa economic
region has the lowest share of assets in a state of good repair at 38.7 percent, 16.1 percentage points lower
than the provincewide average.
The infrastructure backlog can also be presented as a share of total current replacement value, which allows
for comparisons across regions. The regions of Toronto (9.0 per cent) and London (10.9 per cent) have the
lowest shares, implying that their assets are in better condition compared to other regions. In contrast, the
region with the largest infrastructure backlog relative to its total CRV is Kingston-Pembroke, at 19.7 per cent,
followed by Stratford-Bruce Peninsula at 17.9 per cent.
Figure A-2: Infrastructure backlog as a share of current replacement value by economic region
Notes: Geographic location and condition data are available for 90 per cent of municipal assets. The remaining asset data did not have geographic and condition
information. The estimates presented are the average values from the FAO’s Monte Carlo analysis.
Source: FAO analysis of municipal data as detailed in Appendix D.
20%
14%
9%
Infrastructure Backlogas a Share of CRV
Northwest
Northeast
Kitchener-Waterloo-Barrie
Stratford-Bruce Peninsula
London
Windsor-Sarnia
Muskoka-KawarthasToronto
Hamilton-Niagara Peninsula
OttawaKingston-Pembroke

20
Table A-1: State of repair and infrastructure backlog by economic region
Economic
Region
Current
Replacement
Value (CRV)
($ Billions)
CRV of
Assets
with
Condition
Data
($
Billions)
CRV of
Assets
in a
State of
Good
Repair
($
Billions)
Share of
Assets in a
State of
Good
Repair*
(% CRV
with
condition
data)
CRV of
Assets
Not
in a State
of Good
Repair
($ Billions)
Share of
Assets
Not
in a
State of
Good
Repair*
(% CRV
with
condition
data)
Infrastructure
Backlog
($ Billions)
Infrastructure
Backlog as a
Share of
CRV*
(% CRV with
condition
data)
Hamilton-
Niagara
Peninsula
62.2 56.3 29.4 52.2% 26.9 47.8% 7.9 14.1%
Kingston-
Pembroke** 18.3 15.7 7.0 44.4% 8.7 55.6% 3.1 19.7%
Kitchener-
Waterloo-
Barrie
47.5 41.1 22.1 53.7% 19.0 46.3% 5.2 12.6%
London 40.9 38.3 22.5 58.8% 15.8 41.2% 4.2 10.9%
Muskoka-
Kawarthas 14.1 13.3 6.7 50.0% 6.7 50.0% 2.1 15.4%
Northeast** 14.6 12.1 5.5 45.8% 6.5 54.2% 2.1 17.2%
Northwest** 6.3 5.4 2.8 51.4% 2.6 48.6% 0.8 14.3%
Ottawa 44.3 43.1 16.7 38.7% 26.5 61.3% 4.9 11.5%
Stratford-
Bruce
Peninsula
16.8 15.1 6.8 45.3% 8.3 54.7% 2.7 17.9%
Toronto 183.4 170.4 106.2 62.3% 64.2 37.7% 15.4 9.0%
Windsor-
Sarnia 29.7 26.2 13.5 51.6% 12.7 48.4% 3.8 14.5%
Regional
Subtotal 478.2 437.0 239.2 54.7% 197.8 45.3% 52.1 11.9%
No
Geographical
Information
6.1
Total 484.2
*Calculated as a share of the CRV of assets with known condition.
**Results are subject to higher degree of uncertainty.
Note: The estimates presented under the state of repair and infrastructure backlog are the average values from the FAO’s Monte Carlo analysis.
Source: FAO analysis of municipal data as detailed in Appendix D.
The information presented below describes the state of repair and infrastructure backlog by sector for each of
Ontario’s 11 economic regions.40 This information includes:
• Land area, population, current replacement value of assets and infrastructure backlog as a share
of the total municipal backlog.
• The share of assets in a state of good repair compared to the provincewide municipal average,
which provides a measure of the relative condition of the region’s assets.
• The infrastructure backlog to current replacement value ratio compared to the provincewide
municipal average, which indicates whether the assets in a region require higher or lower
spending, relative to the municipal average.
40 The estimates presented include only those assets which have geographic and condition information.

21
Profile of Municipal Infrastructure: Hamilton-Niagara PeninsulaKey Facts
*Calculated as a share of the CRV of assets that have condition data.
Notes: The regional figures presented in these tables only encompass assets that have geolocations. The estimates presented under the state of repair and
infrastructure backlog are the average values from the FAO’s Monte Carlo analysis.
Sources: Statistics Canada and FAO analysis of municipal data as detailed in Appendix D.
Current Replacement Value (CRV, billions) $62.2
CRV share of municipal assets in Ontario 12.8%
Municipal infrastructure backlog (billions) $7.9
Share of municipal Infrastructure backlog in Ontario 15.2%
Population 1,523,062
Population share of Ontario 10.5%
Land area (square km) 7,145
Land area share of Ontario 0.8%
Transit;
$0.2; 0% Bridges and
culverts;
$5.6; 9%
Roads;
$17.7; 29%
Potable water;
$9.1; 15%S
Storm water,
$8.2, 13%
Wastewater,
$12.7, 20%
Other buildings
and facilities,
$8.5, 14%
$62.2 billion Current Replacement Value of Assets
Transit;
$0.0; 0% Bridges and culverts,
$0.6, 7%
Roads;
$2.7; 34%
Potable water,
$0.8, 10%
Storm water,
$0.5, 7%
Wastewater,
$1.7, 22%
Other buildings
and facilities,
$1.6, 20%
$7.9 billion Infrastructure Backlog
42.3% 50.2% 43.8% 68.5% 67.0% 67.3% 41.6% 54.7%
39.8%
52.1%49.2%
64.5%69.6%
55.9%
29.5%
52.2%
Transit Bridges
and
culverts
Roads Potable
water
Storm
water
Wastewater Other
buildings
and
facilities
Total
Share of Assets in a State of Good Repair*
Ontario Municipal Average Hamilton--Niagara Peninsula
11.3% 11.0% 17.2% 7.1% 9.8% 8.8% 13.5% 11.9%
15.5%
10.4%
15.7%
9.5% 10.1%
14.5%
19.6%
14.1%
Transit Bridges
and
culverts
Roads Potable
water
Storm
water
Wastewater Other
buildings
and
facilities
Total
Infrastructure Backlog as a Share of CRV*
Ontario Municipal Average Hamilton--Niagara Peninsula

22
Profile of Municipal Infrastructure: Kingston-Pembroke
Key Facts
*Calculated as a share of the CRV of assets that have condition data.
Notes: The regional figures presented in these tables only encompass assets that have geolocations. Results of this economic region are subject to a higher degree of
uncertainty. Some results for the transit sector are excluded. The estimates presented under the state of repair and infrastructure backlog are the average values from
the FAO’s Monte Carlo analysis.
Sources: Statistics Canada and FAO analysis of municipal data as detailed in Appendix D.
Current Replacement Value (CRV, billions) $18.3
CRV share of municipal assets in Ontario 3.8%
Municipal infrastructure backlog (billions) $3.1
Share of municipal Infrastructure backlog in Ontario 5.9%
Population 486,133
Population share of Ontario 3.3%
Land area (square km) 21,230
Land area share of Ontario 2.3%
Transit;
$0.0; 0%Bridges and culverts;
$1.1; 6%
Roads;
$7.7; 42%
Potable water,
$1.9, 11%
Storm water,
$2.0, 11%
Wastewater,
$1.7, 9%
Other buildings
and facilities,
$3.8, 21%
$18.3 billion Current Replacement Value of Assets
Transit;
$0.0; 0% Bridges and culverts;
$0.2; 5%
Roads,
$1.5, 47%
Potable water,
$0.1, 4%
Storm water,
$0.3, 9%
Wastewater,
$0.2, 7%
Other buildings
and facilities,
$0.9, 28%
$3.1 billion Infrastructure Backlog
50.2% 43.8% 68.5% 67.0% 67.3% 41.6% 54.7%
46.3% 43.9%
55.3%
47.3%53.2%
36.8%
44.4%
Bridges and
culverts
Roads Potable
water
Storm water Wastewater Other
buildings and
facilities
Total
Share of Assets in a State of Good Repair*
Ontario Municipal Average Kingston--Pembroke
11.0% 17.2% 7.1% 9.8% 8.8% 13.5% 11.9%
15.8%
19.2%
12.4%
20.5%
15.7%
25.6%
19.7%
Bridges and
culverts
Roads Potable
water
Storm water Wastewater Other
buildings and
facilities
Total
Infrastructure Backlog as a Share of CRV*
Ontario Municipal Average Kingston--Pembroke

23
Profile of Municipal Infrastructure: Kitchener-Waterloo-Barrie Key Facts
*Calculated as a share of the CRV of assets that have condition data.
Notes: The regional figures presented in these tables only encompass assets that have geolocations. The estimates presented under the state of repair and
infrastructure backlog are the average values from the FAO’s Monte Carlo analysis.
Sources: Statistics Canada and FAO analysis of municipal data as detailed in Appendix D.
Current Replacement Value (CRV, billions) $47.5
CRV share of municipal assets in Ontario 9.8%
Municipal infrastructure backlog (billions) $5.2
Share of municipal Infrastructure backlog in Ontario 10.0%
Population 1,432,654
Population share of Ontario 9.8%
Land area (square km) 10,376
Land area share of Ontario 1.1%
Transit;
$0.1; 0%Bridges and culverts;
$4.8; 10%
Roads;
$14.0; 29%
Potable
water,
$5.6, 12%
Storm water,
$6.5, 14%
Wastewater,
$8.9, 19%
Other buildings
and facilities;
$7.7; 16%
$47.5 billion Current Replacement Value of Assets
42.3% 50.2% 43.8% 68.5% 67.0% 67.3% 41.6% 54.7%
60.2%
48.5% 50.3%
65.3%66.8%
60.9%
36.9%
53.7%
Transit Bridges
and
culverts
Roads Potable
water
Storm
water
Wastewater Other
buildings
and
facilities
Total
Share of Assets in a State of Good Repair*
Ontario Municipal Average Kitchener--Waterloo--Barrie
Transit;
$0.0; 0%Bridges and culverts;
$0.6; 12%
Roads;
$1.9; 37%
Potable water,
$0.4, 8%
Storm water,
$0.5, 9%
Wastewater,
$0.8, 16%
Other buildings
and facilities;
$0.9; 18%
$5.2 billion Infrastructure Backlog
11.3% 11.0% 17.2% 7.1% 9.8% 8.8% 13.5% 11.9%
6.7%
13.2%14.4%
9.8% 9.2%
11.3%
14.8%
12.6%
Transit Bridges
and
culverts
Roads Potable
water
Storm
water
Wastewater Other
buildings
and
facilities
Total
Infrastructure Backlog as a Share of CRV*
Ontario Municipal Average Kitchener--Waterloo--Barrie

24
Profile of Municipal Infrastructure: London
Key Facts
*Calculated as a share of the CRV of assets that have condition data.
Notes: The regional figures presented in these tables only encompass assets that have geolocations. Some results for the transit sector are excluded. The estimates
presented under the state of repair and infrastructure backlog are the average values from the FAO’s Monte Carlo analysis.
Sources: Statistics Canada and FAO analysis of municipal data as detailed in Appendix D.
Current Replacement Value (CRV, billions) $40.9
CRV share of municipal assets in Ontario 8.5%
Municipal infrastructure backlog (billions) $4.2
Share of municipal Infrastructure backlog in Ontario 8.0%
Population 721,409
Population share of Ontario 5.0%
Land area (square km) 7,238
Land area share of Ontario 0.8%
Transit;
$0.0; 0% Bridges and
culverts;
$3.1; 8%
Roads;
$10.0; 24%
Potable water,
$6.3, 15%
Storm water,
$9.2, 23%
Wastewater,
$9.0, 22%
Other buildings
and facilities,
$3.2, 8%
$40.9 billion Current Replacement Value of Assets
50.2% 43.8% 68.5% 67.0% 67.3% 41.6% 54.7%
48.1%
55.9%
67.5%62.6%
67.1%
28.7%
58.8%
Bridges and
culverts
Roads Potable
water
Storm water Wastewater Other
buildings and
facilities
Total
Share of Assets in a State of Good Repair*
Ontario Municipal Average London
Transit;
$0.0; 0%Bridges and culverts,
$0.3, 8%
Roads;
$1.2; 28%
Potable water,
$0.5, 13%
Storm water,
$0.8, 20%
Wastewater,
$0.8, 19%
Other buildings
and facilities,
$0.5, 12%
$4.2 billion Infrastructure Backlog
11.0% 17.2% 7.1% 9.8% 8.8% 13.5% 11.9%
11.0%11.8%
8.5%
12.1%
8.8%
16.1%
10.9%
Bridges and
culverts
Roads Potable
water
Storm water Wastewater Other
buildings and
facilities
Total
Infrastructure Backlog as a Share of CRV*
Ontario Municipal Average London
25
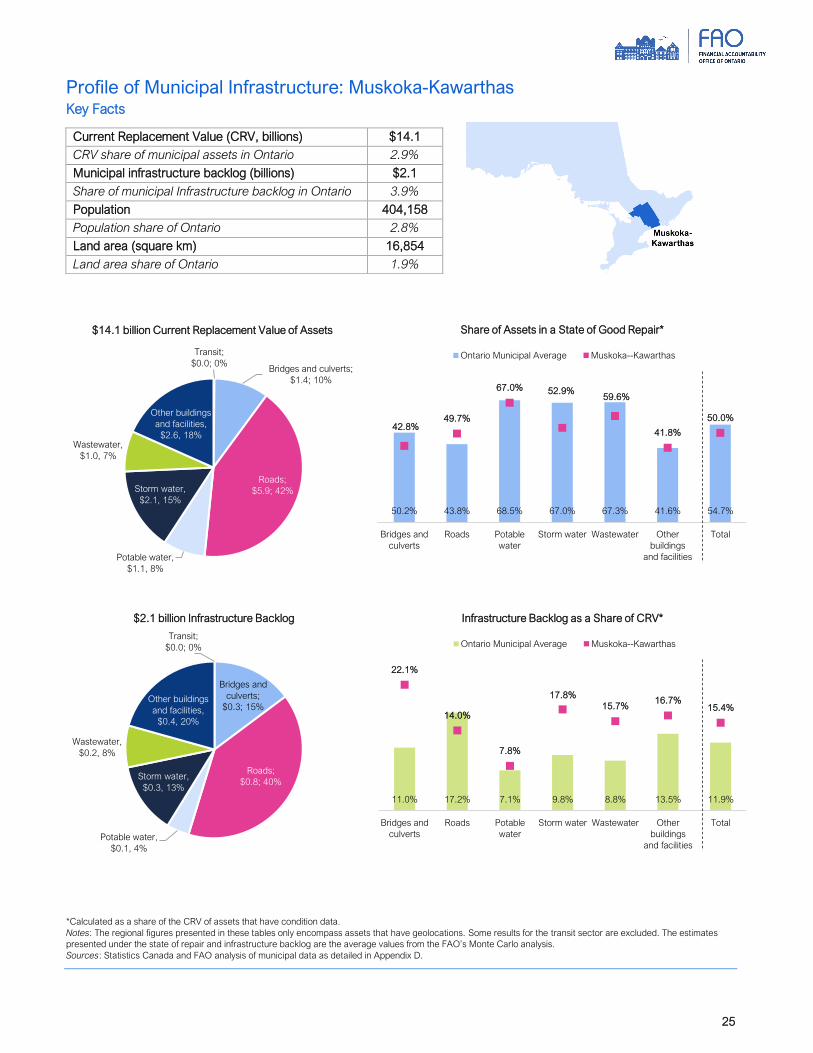
Profile of Municipal Infrastructure: Muskoka-Kawarthas Key Facts
*Calculated as a share of the CRV of assets that have condition data.
Notes: The regional figures presented in these tables only encompass assets that have geolocations. Some results for the transit sector are excluded. The estimates
presented under the state of repair and infrastructure backlog are the average values from the FAO’s Monte Carlo analysis.
Sources: Statistics Canada and FAO analysis of municipal data as detailed in Appendix D.
Current Replacement Value (CRV, billions) $14.1
CRV share of municipal assets in Ontario 2.9%
Municipal infrastructure backlog (billions) $2.1
Share of municipal Infrastructure backlog in Ontario 3.9%
Population 404,158
Population share of Ontario 2.8%
Land area (square km) 16,854
Land area share of Ontario 1.9%
Transit;
$0.0; 0%Bridges and culverts;
$1.4; 10%
Roads;
$5.9; 42%
Potable water,
$1.1, 8%
Storm water,
$2.1, 15%
Wastewater,
$1.0, 7%
Other buildings
and facilities,
$2.6, 18%
$14.1 billion Current Replacement Value of Assets
Transit;
$0.0; 0%
Bridges and
culverts;
$0.3; 15%
Roads;
$0.8; 40%
Potable water,
$0.1, 4%
Storm water,
$0.3, 13%
Wastewater,
$0.2, 8%
Other buildings
and facilities,
$0.4, 20%
$2.1 billion Infrastructure Backlog
11.0% 17.2% 7.1% 9.8% 8.8% 13.5% 11.9%
22.1%
14.0%
7.8%
17.8%
15.7%16.7%
15.4%
Bridges and
culverts
Roads Potable
water
Storm water Wastewater Other
buildings
and facilities
Total
Infrastructure Backlog as a Share of CRV*
Ontario Municipal Average Muskoka--Kawarthas
50.2% 43.8% 68.5% 67.0% 67.3% 41.6% 54.7%
42.8%49.7%
67.0% 52.9%59.6%
41.8%
50.0%
Bridges and
culverts
Roads Potable
water
Storm water Wastewater Other
buildings
and facilities
Total
Share of Assets in a State of Good Repair*
Ontario Municipal Average Muskoka--Kawarthas
26
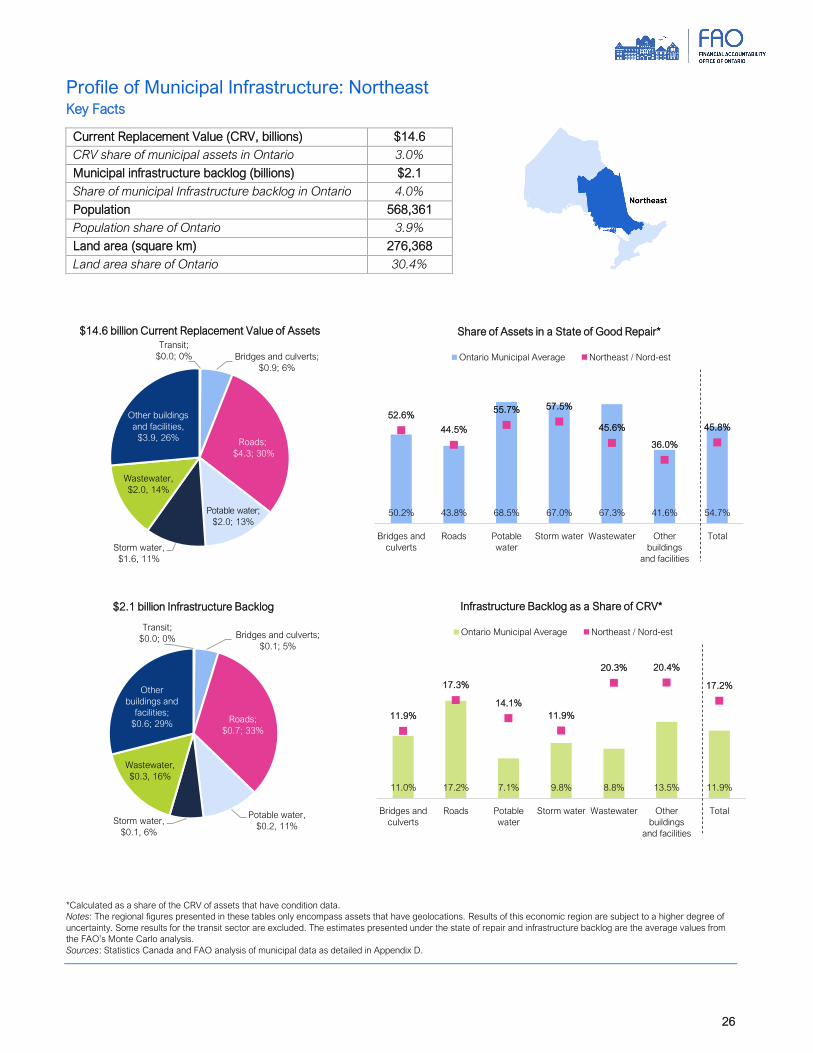
Profile of Municipal Infrastructure: Northeast Key Facts
*Calculated as a share of the CRV of assets that have condition data.
Notes: The regional figures presented in these tables only encompass assets that have geolocations. Results of this economic region are subject to a higher degree of
uncertainty. Some results for the transit sector are excluded. The estimates presented under the state of repair and infrastructure backlog are the average values from
the FAO’s Monte Carlo analysis.
Sources: Statistics Canada and FAO analysis of municipal data as detailed in Appendix D.
Current Replacement Value (CRV, billions) $14.6
CRV share of municipal assets in Ontario 3.0%
Municipal infrastructure backlog (billions) $2.1
Share of municipal Infrastructure backlog in Ontario 4.0%
Population 568,361
Population share of Ontario 3.9%
Land area (square km) 276,368
Land area share of Ontario 30.4%
Transit;
$0.0; 0% Bridges and culverts;
$0.9; 6%
Roads;
$4.3; 30%
Potable water;
$2.0; 13%
Storm water,
$1.6, 11%
Wastewater,
$2.0, 14%
Other buildings
and facilities,
$3.9, 26%
$14.6 billion Current Replacement Value of Assets
50.2% 43.8% 68.5% 67.0% 67.3% 41.6% 54.7%
52.6%
44.5%
55.7% 57.5%
45.6%
36.0%
45.8%
Bridges and
culverts
Roads Potable
water
Storm water Wastewater Other
buildings
and facilities
Total
Share of Assets in a State of Good Repair*
Ontario Municipal Average Northeast / Nord-est
Transit;
$0.0; 0% Bridges and culverts;
$0.1; 5%
Roads;
$0.7; 33%
Potable water,
$0.2, 11%Storm water,
$0.1, 6%
Wastewater,
$0.3, 16%
Other
buildings and
facilities;
$0.6; 29%
$2.1 billion Infrastructure Backlog
11.0% 17.2% 7.1% 9.8% 8.8% 13.5% 11.9%
11.9%
17.3%
14.1%
11.9%
20.3% 20.4%
17.2%
Bridges and
culverts
Roads Potable
water
Storm water Wastewater Other
buildings
and facilities
Total
Infrastructure Backlog as a Share of CRV*
Ontario Municipal Average Northeast / Nord-est

27
Profile of Municipal Infrastructure: Northwest Key Facts
*Calculated as a share of the CRV of assets that have condition data.
Notes: The regional figures presented in these tables only encompass assets that have geolocations. Results of this economic region are subject to a higher degree of
uncertainty. Some results for the transit sector are excluded. The estimates presented under the state of repair and infrastructure backlog are the average values from
the FAO’s Monte Carlo analysis.
Sources: Statistics Canada and FAO analysis of municipal data as detailed in Appendix D.
Current Replacement Value (CRV, billions) $6.3
CRV share of municipal assets in Ontario 1.3%
Municipal infrastructure backlog (billions) $0.8
Share of municipal Infrastructure backlog in Ontario 1.5%
Population 243,044
Population share of Ontario 1.7%
Land area (square km) 526,478
Land area share of Ontario 57.9%
Transit;
$0.0; 1%Bridges and culverts,
$0.1, 10%
Roads;
$0.3; 37%
Potable water,
$0.1, 10%
Storm water,
$0.0, 5%
Wastewater,
$0.1, 12%
Other
buildings and
facilities;
$0.2; 25%
$0.8 billion Infrastructure Backlog
50.2% 43.8% 68.5% 67.0% 67.3% 41.6% 54.7%
50.2%
40.5%
61.9%
71.3% 71.9%
34.2%
51.4%
Bridges and
culverts
Roads Potable
water
Storm water Wastewater Other
buildings
and facilities
Total
Share of Assets in a State of Good Repair*
Ontario Municipal Average Northwest / Nord-ouest
11.0% 17.2% 7.1% 9.8% 8.8% 13.5% 11.9%
14.3%
18.7%
11.8%
7.9%9.0%
17.0%
14.3%
Bridges and
culverts
Roads Potable
water
Storm water Wastewater Other
buildings
and facilities
Total
Infrastructure Backlog as a Share of CRV*
Ontario Municipal Average Northwest / Nord-ouest
Transit;
$0.0; 0% Bridges and culverts;
$0.5; 9%
Roads;
$1.6; 25%
Potable water,
$1.1, 18%
Storm water,
$0.7, 11%
Wastewater,
$1.1, 18%
Other buildings
and facilities,
$1.2, 19%
$6.3 billion Current Replacement Value of Assets

28
Profile of Municipal Infrastructure: Ottawa Key Facts
*Calculated as a share of the CRV of assets that have condition data.
Notes: The regional figures presented in these tables only encompass assets that have geolocations. The estimates presented under the state of repair and
infrastructure backlog are the average values from the FAO’s Monte Carlo analysis.
Sources: Statistics Canada and FAO analysis of municipal data as detailed in Appendix D.
Current Replacement Value (CRV, billions) $44.3
CRV share of municipal assets in Ontario 9.2%
Municipal infrastructure backlog (billions) $4.9
Share of municipal Infrastructure backlog in Ontario 9.5%
Population 1,419,183
Population share of Ontario 9.7%
Land area (square km) 14,523
Land area share of Ontario 1.6%
Transit;
$1.2; 3% Bridges and culverts;
$1.9; 4%
Roads;
$16.2; 36%
Potable water,
$8.6, 19%
Storm water,
$3.1, 7%
Wastewater,
$5.1, 12%
Other buildings
and facilities,
$8.3, 19%
$44.3 billion Current Replacement Value of Assets
11.3% 11.0% 17.2% 7.1% 9.8% 8.8% 13.5% 11.9%
9.6%
11.9%
16.7%
4.0%
7.6%6.3%
13.7%
11.5%
Transit Bridges
and
culverts
Roads Potable
water
Storm
water
Wastewater Other
buildings
and
facilities
Total
Infrastructure Backlog as a Share of CRV*
Ontario Municipal Average Ottawa
42.3% 50.2% 43.8% 68.5% 67.0% 67.3% 41.6% 54.7%
21.3%
32.1%27.4%
74.6%71.5%
40.6%
16.5%
38.7%
Transit Bridges
and
culverts
Roads Potable
water
Storm
water
Wastewater Other
buildings
and
facilities
Total
Share of Assets in a State of Good Repair*
Ontario Municipal Average Ottawa
Transit;
$0.1; 2% Bridges and culverts;
$0.2; 4%
Roads;
$2.7; 54%
Potable water,
$0.3, 7%
Storm water,
$0.2, 4%
Wastewater,
$0.3, 6%
Other buildings
and facilities,
$1.1, 23%
$4.9 billion Infrastructure Backlog
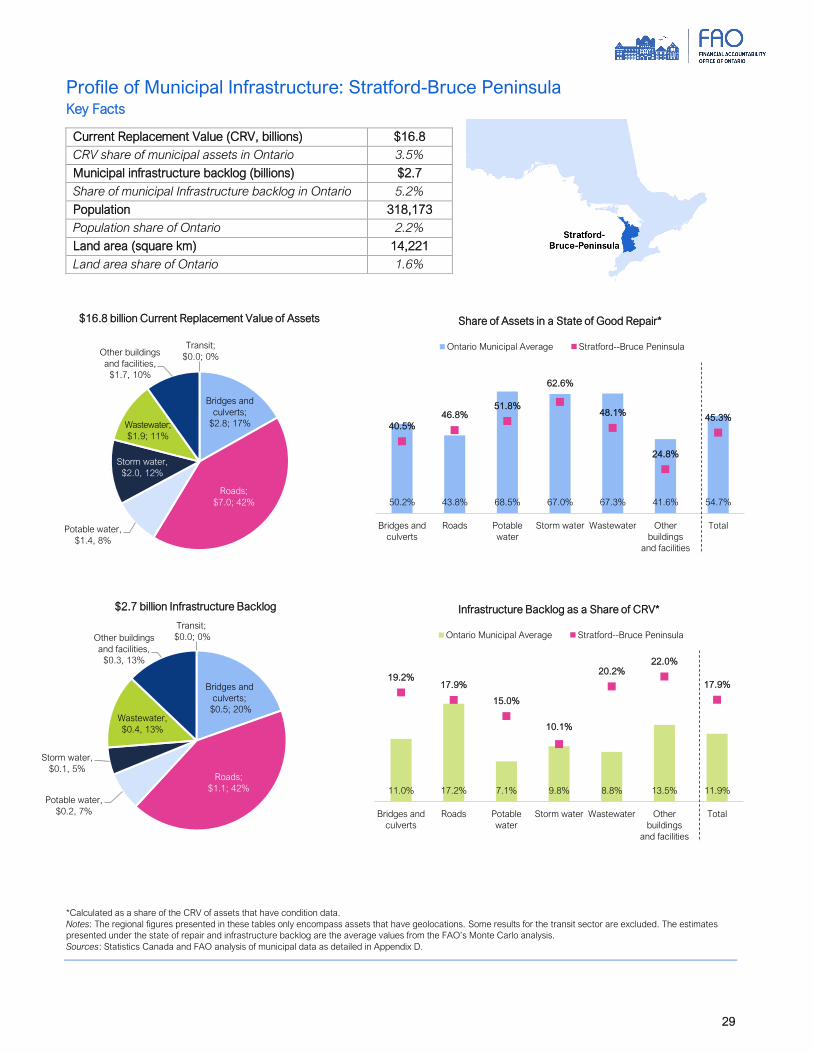
29
Profile of Municipal Infrastructure: Stratford-Bruce Peninsula Key Facts
*Calculated as a share of the CRV of assets that have condition data.
Notes: The regional figures presented in these tables only encompass assets that have geolocations. Some results for the transit sector are excluded. The estimates
presented under the state of repair and infrastructure backlog are the average values from the FAO’s Monte Carlo analysis.
Sources: Statistics Canada and FAO analysis of municipal data as detailed in Appendix D.
Current Replacement Value (CRV, billions) $16.8
CRV share of municipal assets in Ontario 3.5%
Municipal infrastructure backlog (billions) $2.7
Share of municipal Infrastructure backlog in Ontario 5.2%
Population 318,173
Population share of Ontario 2.2%
Land area (square km) 14,221
Land area share of Ontario 1.6%
Transit;
$0.0; 0%
Bridges and
culverts;
$2.8; 17%
Roads;
$7.0; 42%
Potable water,
$1.4, 8%
Storm water,
$2.0, 12%
Wastewater;
$1.9; 11%
Other buildings
and facilities,
$1.7, 10%
$16.8 billion Current Replacement Value of Assets
Transit;
$0.0; 0%
Bridges and
culverts;
$0.5; 20%
Roads;
$1.1; 42%
Potable water,
$0.2, 7%
Storm water,
$0.1, 5%
Wastewater,
$0.4, 13%
Other buildings
and facilities,
$0.3, 13%
$2.7 billion Infrastructure Backlog
11.0% 17.2% 7.1% 9.8% 8.8% 13.5% 11.9%
19.2%17.9%
15.0%
10.1%
20.2%22.0%
17.9%
Bridges and
culverts
Roads Potable
water
Storm water Wastewater Other
buildings
and facilities
Total
Infrastructure Backlog as a Share of CRV*
Ontario Municipal Average Stratford--Bruce Peninsula
50.2% 43.8% 68.5% 67.0% 67.3% 41.6% 54.7%
40.5%
46.8%51.8%
62.6%
48.1%
24.8%
45.3%
Bridges and
culverts
Roads Potable
water
Storm water Wastewater Other
buildings
and facilities
Total
Share of Assets in a State of Good Repair*
Ontario Municipal Average Stratford--Bruce Peninsula
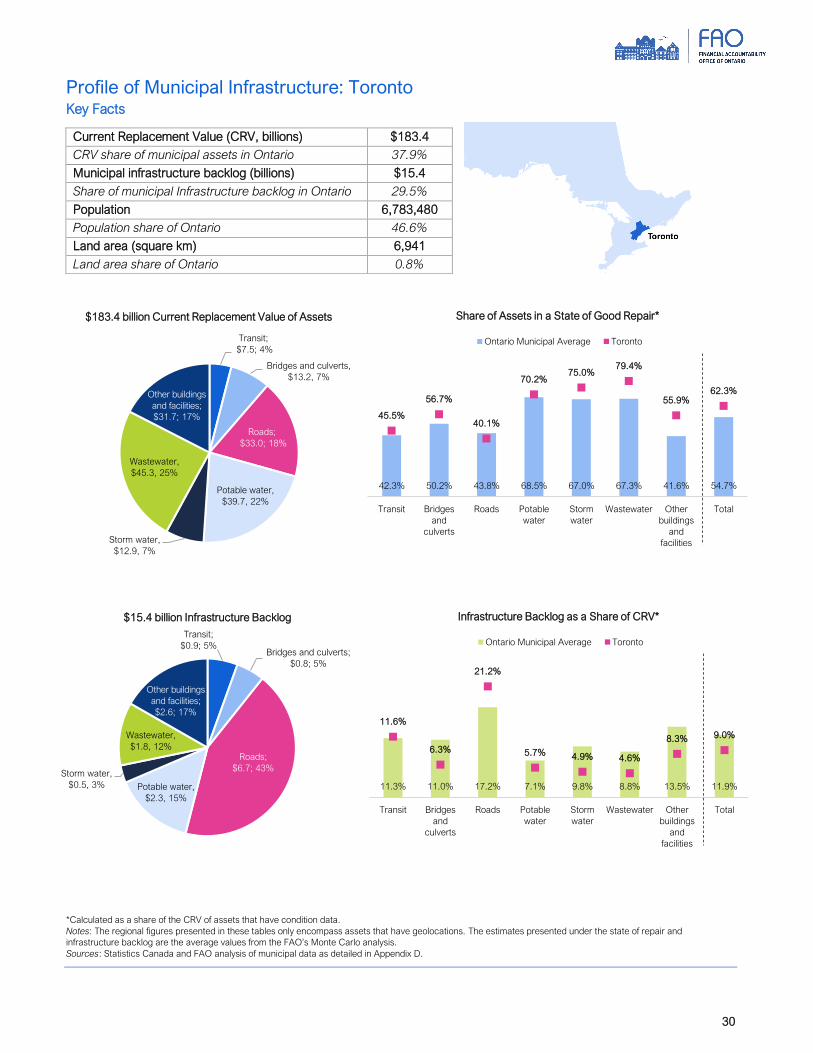
30
Profile of Municipal Infrastructure: Toronto Key Facts
*Calculated as a share of the CRV of assets that have condition data.
Notes: The regional figures presented in these tables only encompass assets that have geolocations. The estimates presented under the state of repair and
infrastructure backlog are the average values from the FAO’s Monte Carlo analysis.
Sources: Statistics Canada and FAO analysis of municipal data as detailed in Appendix D.
Current Replacement Value (CRV, billions) $183.4
CRV share of municipal assets in Ontario 37.9%
Municipal infrastructure backlog (billions) $15.4
Share of municipal Infrastructure backlog in Ontario 29.5%
Population 6,783,480
Population share of Ontario 46.6%
Land area (square km) 6,941
Land area share of Ontario 0.8%
Transit;
$7.5; 4%
Bridges and culverts,
$13.2, 7%
Roads;
$33.0; 18%
Potable water,
$39.7, 22%
Storm water,
$12.9, 7%
Wastewater,
$45.3, 25%
Other buildings
and facilities;
$31.7; 17%
$183.4 billion Current Replacement Value of Assets
Transit;
$0.9; 5%Bridges and culverts;
$0.8; 5%
Roads;
$6.7; 43%
Potable water,
$2.3, 15%
Storm water,
$0.5, 3%
Wastewater,
$1.8, 12%
Other buildings
and facilities;
$2.6; 17%
$15.4 billion Infrastructure Backlog
42.3% 50.2% 43.8% 68.5% 67.0% 67.3% 41.6% 54.7%
45.5%
56.7%
40.1%
70.2%75.0%
79.4%
55.9%62.3%
Transit Bridges
and
culverts
Roads Potable
water
Storm
water
Wastewater Other
buildings
and
facilities
Total
Share of Assets in a State of Good Repair*
Ontario Municipal Average Toronto
11.3% 11.0% 17.2% 7.1% 9.8% 8.8% 13.5% 11.9%
11.6%
6.3%
21.2%
5.7% 4.9% 4.6%
8.3% 9.0%
Transit Bridges
and
culverts
Roads Potable
water
Storm
water
Wastewater Other
buildings
and
facilities
Total
Infrastructure Backlog as a Share of CRV*
Ontario Municipal Average Toronto

31
Profile of Municipal Infrastructure: Windsor-Sarnia Key Facts
*Calculated as a share of the CRV of assets that have condition data.
Notes: The regional figures presented in these tables only encompass assets that have geolocations. The estimates presented under the state of repair and
infrastructure backlog are the average values from the FAO’s Monte Carlo analysis.
Sources: Statistics Canada and FAO analysis of municipal data as detailed in Appendix D.
Current Replacement Value (CRV, billions) $29.7
CRV share of municipal assets in Ontario 6.1%
Municipal infrastructure backlog (billions) $3.8
Share of municipal Infrastructure backlog in Ontario 7.3%
Population 666,890
Population share of Ontario 4.6%
Land area (square km) 7,324
Land area share of Ontario 0.8%
Transit;
$0.1; 0%
Bridges and
culverts;
$4.5; 15%
Roads;
$9.7; 33%
Potable
water,
$4.0, 14%
Storm water,
$4.2, 14%
Wastewater,
$4.8, 16%
Other buildings
and facilities,
$2.5, 8%
$29.7 billion Current Replacement Value of Assets
11.3% 11.0% 17.2% 7.1% 9.8% 8.8% 13.5% 11.9%
9.9%
12.5%
16.6%
10.9%
12.6%
14.8%15.8%
14.5%
Transit Bridges
and
culverts
Roads Potable
water
Storm
water
Wastewater Other
buildings
and
facilities
Total
Infrastructure Backlog as a Share of CRV*
Ontario Municipal Average Windsor--Sarnia
42.3% 50.2% 43.8% 68.5% 67.0% 67.3% 41.6% 54.7%
29.4%
49.3%46.6%
63.8% 64.0%
55.4%
40.9%
51.6%
Transit Bridges
and
culverts
Roads Potable
water
Storm
water
Wastewater Other
buildings
and
facilities
Total
Share of Assets in a State of Good Repair*
Ontario Municipal Average Windsor--Sarnia
Transit;
$0.0; 0%
Bridges and
culverts;
$0.6; 15%
Roads;
$1.6; 42%
Potable water,
$0.3, 7%
Storm water,
$0.4, 10%
Wastewater,
$0.7, 17%
Other buildings
and facilities,
$0.3, 9%
$3.8 billion Infrastructure Backlog
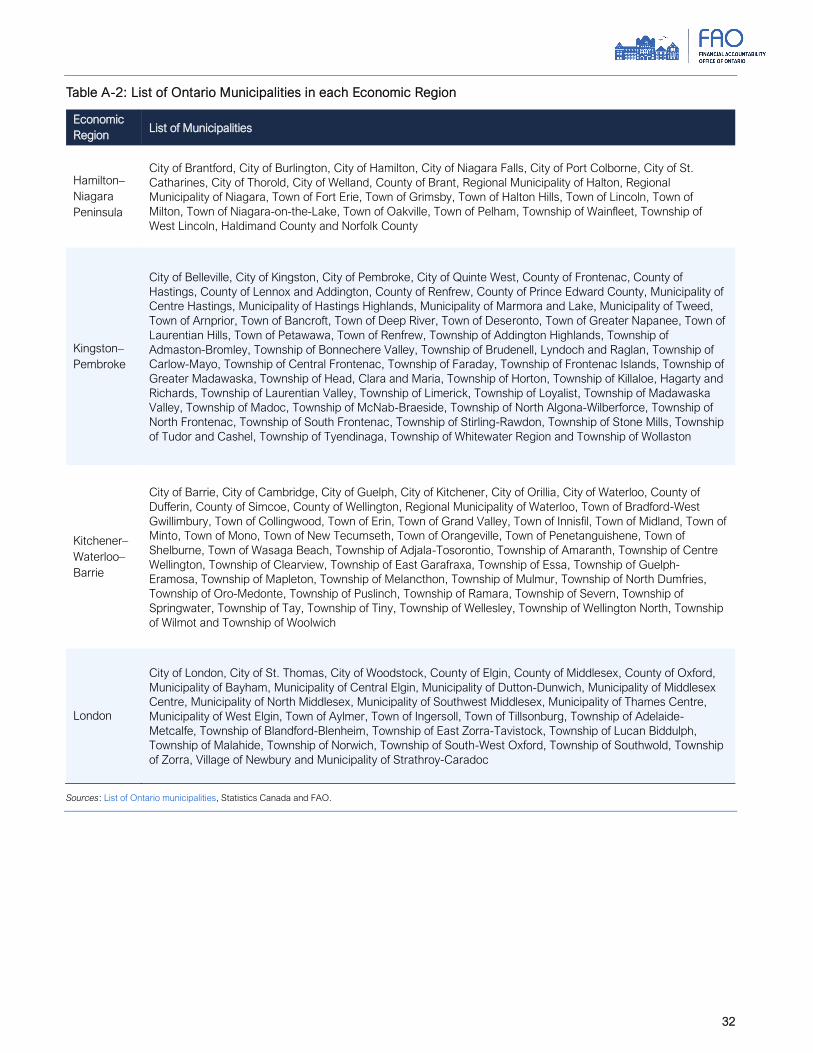
32
Table A-2: List of Ontario Municipalities in each Economic Region
Economic
Region List of Municipalities
Hamilton–
Niagara
Peninsula
City of Brantford, City of Burlington, City of Hamilton, City of Niagara Falls, City of Port Colborne, City of St.
Catharines, City of Thorold, City of Welland, County of Brant, Regional Municipality of Halton, Regional
Municipality of Niagara, Town of Fort Erie, Town of Grimsby, Town of Halton Hills, Town of Lincoln, Town of
Milton, Town of Niagara-on-the-Lake, Town of Oakville, Town of Pelham, Township of Wainfleet, Township of
West Lincoln, Haldimand County and Norfolk County
Kingston–
Pembroke
City of Belleville, City of Kingston, City of Pembroke, City of Quinte West, County of Frontenac, County of
Hastings, County of Lennox and Addington, County of Renfrew, County of Prince Edward County, Municipality of
Centre Hastings, Municipality of Hastings Highlands, Municipality of Marmora and Lake, Municipality of Tweed,
Town of Arnprior, Town of Bancroft, Town of Deep River, Town of Deseronto, Town of Greater Napanee, Town of
Laurentian Hills, Town of Petawawa, Town of Renfrew, Township of Addington Highlands, Township of
Admaston-Bromley, Township of Bonnechere Valley, Township of Brudenell, Lyndoch and Raglan, Township of
Carlow-Mayo, Township of Central Frontenac, Township of Faraday, Township of Frontenac Islands, Township of
Greater Madawaska, Township of Head, Clara and Maria, Township of Horton, Township of Killaloe, Hagarty and
Richards, Township of Laurentian Valley, Township of Limerick, Township of Loyalist, Township of Madawaska
Valley, Township of Madoc, Township of McNab-Braeside, Township of North Algona-Wilberforce, Township of
North Frontenac, Township of South Frontenac, Township of Stirling-Rawdon, Township of Stone Mills, Township
of Tudor and Cashel, Township of Tyendinaga, Township of Whitewater Region and Township of Wollaston
Kitchener–
Waterloo–
Barrie
City of Barrie, City of Cambridge, City of Guelph, City of Kitchener, City of Orillia, City of Waterloo, County of
Dufferin, County of Simcoe, County of Wellington, Regional Municipality of Waterloo, Town of Bradford-West
Gwillimbury, Town of Collingwood, Town of Erin, Town of Grand Valley, Town of Innisfil, Town of Midland, Town of
Minto, Town of Mono, Town of New Tecumseth, Town of Orangeville, Town of Penetanguishene, Town of
Shelburne, Town of Wasaga Beach, Township of Adjala-Tosorontio, Township of Amaranth, Township of Centre
Wellington, Township of Clearview, Township of East Garafraxa, Township of Essa, Township of Guelph-
Eramosa, Township of Mapleton, Township of Melancthon, Township of Mulmur, Township of North Dumfries,
Township of Oro-Medonte, Township of Puslinch, Township of Ramara, Township of Severn, Township of
Springwater, Township of Tay, Township of Tiny, Township of Wellesley, Township of Wellington North, Township
of Wilmot and Township of Woolwich
London
City of London, City of St. Thomas, City of Woodstock, County of Elgin, County of Middlesex, County of Oxford,
Municipality of Bayham, Municipality of Central Elgin, Municipality of Dutton-Dunwich, Municipality of Middlesex
Centre, Municipality of North Middlesex, Municipality of Southwest Middlesex, Municipality of Thames Centre,
Municipality of West Elgin, Town of Aylmer, Town of Ingersoll, Town of Tillsonburg, Township of Adelaide-
Metcalfe, Township of Blandford-Blenheim, Township of East Zorra-Tavistock, Township of Lucan Biddulph,
Township of Malahide, Township of Norwich, Township of South-West Oxford, Township of Southwold, Township
of Zorra, Village of Newbury and Municipality of Strathroy-Caradoc
Sources: List of Ontario municipalities, Statistics Canada and FAO.

33
Table A-2 (Cont.): List of Ontario Municipalities in each Economic Region
Economic
Region List of Municipalities
Northeast /
Nord-est
City of Elliot Lake, City of Greater Sudbury, City of North Bay, City of Sault Ste. Marie, City of Temiskaming
Shores, City of Timmins, Municipality of Callander, Municipality of Calvin, Municipality of Central Manitoulin,
Municipality of Charlton and Dack, Municipality of French River, Municipality of Gordon-Barrie Island, Municipality
of Huron Shores, Municipality of Killarney, Municipality of Magnetawan, Municipality of Markstay-Warren,
Municipality of Mattawan, Municipality of Powassan, Municipality of St.-Charles, Municipality of Temagami,
Municipality of Wawa, Municipality of West Nipissing, Municipality of Whitestone, Town of Blind River, Town of
Bruce Mines, Town of Cobalt, Town of Cochrane, Town of Englehart, Town of Espanola, Town of Gore Bay,
Town of Hearst, Town of Iroquois Falls, Town of Kapuskasing, Town of Kearney, Town of Kirkland Lake, Town of
Latchford, Town of Mattawa, Town of Moosonee, Town of Northeastern Manitoulin and The Islands, Town of
Parry Sound, Town of Smooth Rock Falls, Town of Spanish, Town of Thessalon, Township of Armour, Township
of Armstrong, Township of Assiginack, Township of Baldwin, Township of Billings, Township of Black River-
Matheson, Township of Bonfield, Township of Brethour, Township of Burpee and Mills, Township of Carling,
Township of Casey, Township of Chamberlain, Township of Chapleau, Township of Chisholm, Township of
Cockburn Island, Township of Coleman, Township of Dubreuilville, Township of Evanturel, Township of Fauquier-
Strickland, Township of Gauthier, Township of Harley, Township of Harris, Township of Hilliard, Township of
Hilton, Township of Hornepayne, Township of Hudson, Township of James, Township of Jocelyn, Township of
Johnson, Township of Joly, Township of Kerns, Township of Laird, Township of Larder Lake, Township of
Macdonald, Meredith and Aberdeen Additional, Township of Machar, Township of Matachewan, Township of
Mattice-Val Cote, Township of McDougall, Township of McGarry, Township of McKellar, Township of McMurrich-
Monteith, Township of Moonbeam, Township of Nairn and Hyman, Township of Nipissing, Township of
Opasatika, Township of Papineau-Cameron, Township of Perry, Township of Plummer Additional, Township of
Prince, Township of Ryerson, Township of Sables-Spanish Rivers, Township of Seguin, Township of South
Algonquin, Township of St. Joseph, Township of Strong, Township of Tarbutt, Township of Tehkummah,
Township of The Archipelago, Township of The North Shore, Township of Val Rita-Harty, Township of White
River, Village of Burk's Falls, Village of Hilton Beach, Village of South River, Village of Sundridge, Village of
Thornloe and Township of East Ferris
Northwest /
Nord-ouest
City of Dryden, City of Kenora, City of Thunder Bay, Municipality of Greenstone, Municipality of Neebing,
Municipality of Oliver Paipoonge, Municipality of Red Lake, Municipality of Shuniah, Municipality of Sioux
Lookout, Town of Atikokan, Town of Fort Frances, Town of Marathon, Town of Rainy River, Township of Alberton,
Township of Chapple, Township of Conmee, Township of Dawson, Township of Dorion, Township of Ear Falls,
Township of Emo, Township of Gillies, Township of Ignace, Township of La Vallee, Township of Lake of the
Woods, Township of Machin, Township of Manitouwadge, Township of Morley, Township of Nipigon, Township of
O'Connor, Township of Pickle Lake, Township of Red Rock, Township of Schreiber, Township of Sioux Narrows-
Nestor Falls and Township of Terrace Bay
Sources: List of Ontario municipalities, Statistics Canada and FAO.

34
Table A-2 (Cont.): List of Ontario Municipalities in each Economic Region
Economic
Region List of Municipalities
Muskoka–
Kawarthas
City of Kawartha Lakes, City of Peterborough, County of Haliburton, County of Northumberland, County of
Peterborough, District Municipality of Muskoka, Municipality of Brighton, Municipality of Dysart et al, Municipality
of Highlands East, Municipality of Port Hope, Municipality of Trent Hills, Municipality of Trent Lakes, Town of
Bracebridge, Town of Cobourg, Town of Gravenhurst, Town of Huntsville, Township of Algonquin Highlands,
Township of Alnwick-Haldimand, Township of Asphodel-Norwood, Township of Cavan-Monaghan, Township of
Cramahe, Township of Douro-Dummer, Township of Georgian Bay, Township of Hamilton, Township of Havelock-
Belmont-Methuen, Township of Lake of Bays, Township of Minden Hills, Township of Muskoka Lakes, Township
of North Kawartha, Township of Otonabee-South Monaghan and Township of Selwyn
Ottawa
City of Brockville, City of Clarence-Rockland, City of Cornwall, City of Ottawa, County of Lanark, Municipality of
Casselman, Municipality of Mississippi Mills, Municipality of North Grenville, Town of Carleton Place, Town of
Gananoque, Town of Hawkesbury, Town of Perth, Town of Prescott, Town of Smiths Falls, Township of Alfred
and Plantagenet, Township of Athens, Township of Augusta, Township of Beckwith, Township of Champlain,
Township of Drummond-North Elmsley, Township of East Hawkesbury, Township of Edwardsburgh-Cardinal,
Township of Elizabethtown-Kitley, Township of Front of Yonge, Township of Lanark Highlands, Township of Leeds
and the Thousand Islands, Township of Montague, Township of North Dundas, Township of North Glengarry,
Township of North Stormont, Township of Rideau Lakes, Township of Russell, Township of South Glengarry,
Township of South Stormont, Township of Tay Valley, United Counties of Leeds and Grenville, United Counties of
Prescott and Russell, United Counties of Stormont, Dundas and Glengarry, Village of Merrickville-Wolford, Village
of Westport, Municipality of South Dundas and The Nation Municipality
Stratford–
Bruce
Peninsula
City of Owen Sound, City of Stratford, County of Bruce, County of Grey, County of Huron, County of Perth,
Municipality of Arran-Elderslie, Municipality of Bluewater, Municipality of Brockton, Municipality of Central Huron,
Municipality of Grey Highlands, Municipality of Huron East, Municipality of Kincardine, Municipality of Meaford,
Municipality of Morris-Turnberry, Municipality of North Perth, Municipality of Northern Bruce Peninsula,
Municipality of South Bruce, Municipality of South Huron, Municipality of West Grey, Municipality of West Perth,
Town of Goderich, Town of Hanover, Town of Saugeen Shores, Town of South Bruce Peninsula, Town of St.
Marys, Town of The Blue Mountains, Township of Ashfield-Colborne-Wawanosh, Township of Chatsworth,
Township of Georgian Bluffs, Township of Howick, Township of Huron-Kinloss, Township of North Huron,
Township of Perth East, Township of Perth South and Township of Southgate
Toronto
City of Brampton, City of Mississauga, City of Oshawa, City of Pickering, City of Richmond Hill, City of Toronto,
City of Vaughan, Municipality of Clarington, Regional Municipality of Durham, Regional Municipality of Peel,
Regional Municipality of York, Town of Ajax, Town of Aurora, Town of Caledon, Town of East Gwillimbury, Town
of Georgina, Town of Newmarket, Town of Whitby, Town of Whitchurch-Stouffville, Township of Brock, Township
of King, Township of Scugog, Township of Uxbridge and City of Markham
Windsor–
Sarnia
City of Sarnia, City of Windsor, County of Essex, County of Lambton, Municipality of Brooke-Alvinston,
Municipality of Chatham-Kent, Municipality of Lambton Shores, Municipality of Leamington, Town of
Amherstburg, Town of Essex, Town of Kingsville, Town of Lakeshore, Town of LaSalle, Town of Petrolia, Town of
Plympton-Wyoming, Town of Tecumseh, Township of Dawn-Euphemia, Township of Enniskillen, Township of
Pelee, Township of St. Clair, Township of Warwick, Village of Oil Springs and Village of Point Edward
Sources: List of Ontario municipalities, Statistics Canada and FAO.

35
: State of Repair by Sector
This section provides information on the state of repair and infrastructure backlog of municipal infrastructure by sector and asset-type.
Table B-1: State of repair and infrastructure backlog by sector and asset -type, as of 2020
Sector
Current
Replacement
Value (CRV)
($ Billions)
CRV of Assets
with Condition
Data
($ Billions)
CRV of
Assets in a
State of Good
Repair
($ Billions)
Share of Assets in
a State of Good
Repair*
(% CRV)
CRV of
Assets Not
in a State of Good
Repair
($ Billions)
Share of
Assets
Not in a
State of Good
Repair*
(% CRV)
Infrastructure
Backlog
($ Billions)
Infrastructure Backlog as
a Share of CRV*
(% CRV)
Transit 9.3 9.1 3.8 42.3% 5.2 57.7% 1.0 11.3%
Buildings 1.8 1.6 0.7 42.2% 0.9 57.8% 0.1 6.9%
Engineering 7.5 7.5 3.2 42.3% 4.3 57.7% 0.9 12.3%
Bridges and culverts 40.4 38.8 19.5 50.2% 19.3 49.8% 4.3 11.0%
Roads 130.1 122.7 53.7 43.8% 68.9 56.2% 21.1 17.2%
Potable Water 81.5 74.7 51.1 68.5% 23.6 31.5% 5.3 7.1%
Buildings 12.7 11.9 6.1 51.0% 5.8 49.0% 1.5 12.3%
Engineering 68.9 62.8 45.1 71.8% 17.7 28.2% 3.8 6.1%
Storm water 53.6 38.6 25.9 67.0% 12.7 33.0% 3.8 9.8%
Buildings 0.9 0.7 0.5 62.5% 0.3 37.5% 0.1 7.2%
Engineering 52.8 37.9 25.4 67.1% 12.5 32.9% 3.7 9.8%
Wastewater 94.3 83.0 55.9 67.3% 27.1 32.7% 7.3 8.8%
Buildings 23.2 22.1 9.7 44.0% 12.4 56.0% 3.1 14.0%
Engineering 71.1 60.9 46.2 75.8% 14.7 24.2% 4.2 6.8%
Other Buildings and
Facilities 74.9 70.1 29.2 41.6% 40.9 58.4% 9.5 13.5%
Tourism, Culture and
Sport 19.3 17.6 5.6 32.0% 12.0 68.0% 3.6 20.2%
Social Housing 23.1 22.6 8.9 39.2% 13.7 60.8% 2.4 10.7%
Government Admin 19.2 18.0 9.1 50.3% 9.0 49.7% 1.9 10.7%
Waste Management 1.5 1.4 0.9 65.7% 0.5 34.3% 0.1 8.3%
Other 11.8 10.5 4.7 44.9% 5.8 55.1% 1.4 13.6%
Total 484.2 437.0 239.2 54.7% 197.8 45.3% 52.1 11.9%
Buildings 113.4 106.5 46.1 43.3% 60.4 56.7% 14.2 13.3%
Engineering 370.8 330.5 193.0 58.4% 137.5 41.6% 38.0 11.5%
* The share of assets is calculated based only on the CRV of those assets that have condition estimates. The estimates presented under the state of repair and infrastructure backlog are the average values from the FAO’s Monte Carlo analysis.
Source: FAO analysis of municipal data as detailed in Appendix D.

36
: Comparison between the State of Repair of Provincial
and Municipal Assets
In a 2020 report, the FAO assessed the state of repair of the Province’s infrastructure assets.41 Based on the
FAO’s analysis, 34.7 per cent of the Province’s assets (valued at $92.1 billion) were not in a state of good
repair and the total cost to bring Provincial assets into a state of good repair amounted to $16.8 billion. By
comparison, an estimated 45.3 per cent of municipal assets (valued at $197.8 billion) were not in a state of
good repair, resulting in an estimated backlog of $52.1 billion. For Provincial assets, the backlog to CRV ratio
was estimated at 6.3 per cent, considerably lower than the estimated municipal backlog to CRV ratio of 11.9
per cent.
Importantly, the Province owns and controls different types of infrastructure than Ontario’s municipalities. For
example, the province is responsible for Ontario’s hospitals and schools, while municipalities own the vast
majority of Ontario’s water infrastructure (i.e., potable water, wastewater and storm water). Of the sectors and
asset classes analyzed in this report, only transit, bridges and culverts and roads are owned by both levels of
government. The comparisons of the state of repair and infrastructure backlog as a share of CRV of assets in
these sectors (excluding the transit sector42) are presented below.
Bridges and culverts
• Types of bridges managed by municipalities in Ontario vary significantly compared to provincially
owned bridges. Local bridges represent nearly 24 per cent of municipal bridges and culverts,
compared to just 5 per cent for provincial bridges and culverts.
• An estimated 50.2 per cent of municipal bridges and culverts are in a state of good repair
compared to 82.5 per cent of provincially owned bridges.
• The backlog for municipal bridges and culverts represents an estimated 11.0 per cent of their
current replacement value, compared to just 1.0 per cent for provincially owned bridges and
culverts.
Roads
• The types of municipally managed roads vary significantly compared to provincially managed
roads. More than half of the municipally owned road network are local, while only 22 per cent of the
provincially managed roads are local.
• Only an estimated 43.8 per cent of municipal roads are in a state of good repair, compared to 74.7
per cent of provincially owned roads.
• The backlog for municipal roads represents an estimated 17.2 per cent of their current
replacement value, compared to just 2.8 per cent for provincial roads.
41 Provincial Infrastructure: A Review of the Province’s Infrastructure and an Assessment of the State of Repair. 42 The transit sector was excluded due to a lack of comparable data.

37
Figure C-1: Provincial and Municipal State of repair by sector
Note: The estimates presented under the state of repair and infrastructure backlog for municipal infrastructure are the average values from the FAO’s Monte Carlo analysis.
Sources: FAO Provincial Infrastructure report and FAO analysis of municipal data as detailed in Appendix D.
50.2
43.8
82.5
74.7
0.0
10.0
20.0
30.0
40.0
50.0
60.0
70.0
80.0
90.0
Bridges and culverts Roads
Sh
are
of A
sse
ts in
a S
tate
of G
oo
d R
ep
air
(Pe
r C
en
t)
Municipal Provincial
11.0
17.2
1.0
2.8
0.0
2.0
4.0
6.0
8.0
10.0
12.0
14.0
16.0
18.0
20.0
Bridges and culverts Roads
Infr
astr
uctu
re B
acklo
g a
s a
Sh
are
of C
RV
(Pe
r C
en
t)
Municipal Provincial

38
: Data and Methodology
Municipal Asset Inventory
This section describes how the FAO compiled a Municipal Asset Inventory (MAI) from multiple data sources.
To estimate the state of repair of municipally owned infrastructure, a detailed asset inventory that includes the
current replacement value, condition and age of individual assets owned by the 444 municipalities in Ontario is
necessary. However, there is no comprehensive or standardized inventory for Ontario’s municipal assets. At
the time of preparing this report, only partial information about municipal infrastructure was available across
multiple sources, described in Table D-1.
Table D-1: Sources of Municipal infrastructure data
Source Description Challenges
Municipal Asset
Datasets
Asset level data on municipal infrastructure assets
collected by municipalities. Includes the CRV,
condition, and age of assets, among other
information.
• Not available for all municipalities.
• Most often not publicly available, but a few
municipalities were willing to share data.
• Lack of comparability between municipalities:
condition measurements and CRV estimation
methods vary between municipalities and are not
standardized.
Asset
Management
Plans (AMPs)
Most Ontario municipalities have an AMP. AMPs
generally contain the key components outlined in
the Ontario’s 2012 Guide for Municipal Asset
Management Plans,43 such as replacement values
and condition ratings.
• Information varies considerably in terms of asset
coverage and quality.
• Lack of comparability between AMPs: condition
measurements and sector definitions vary
between municipalities and are not standardized.
Canada’s Core
Public
Infrastructure
Survey (CCPI)
Public Use
Microdata File
2018
Statistics Canada’s CCPI 2018 survey contains
information on the stock and condition of
municipally owned core infrastructure.44
• There is currently no publicly available information
on the CRV of municipal assets.
• Data is not available for all the 444 municipalities.
• The CCPI provides an aggregate snapshot of the
overall condition of infrastructure but does not
provide detailed asset-level information.
Financial
Information
Return 2018
(FIR)
FIR is a data tool used by the Ontario Ministry of
Municipal Affairs and Housing to collect standardized
financial and statistical information from
municipalities. Schedule 51 of the FIR collects the
net book value of tangible capital assets from
municipalities.45
• FIR Schedule 51 only contains accounting data
and does not include CRV, condition or age data.
Ontario Ministry
of Infrastructure
Municipal Asset
Inventory
Ontario’s Ministry of Infrastructure created its own
municipal infrastructure database using multiple
sources including AMPs and the FIR. This data
source provides condition and CRV estimates for
the majority of municipal infrastructure.
• Many data sources used in the creation of
database have since been updated.
• The asset inventory often has aggregated CRV
and condition information at the asset class level,
but not at the individual asset level.
Source: FAO.
43 For details, see Archived - Building together – Guide for municipal asset management plans. 44 See Canada's Core Public Infrastructure Survey (CCPI). 45 See Financial Information Return.
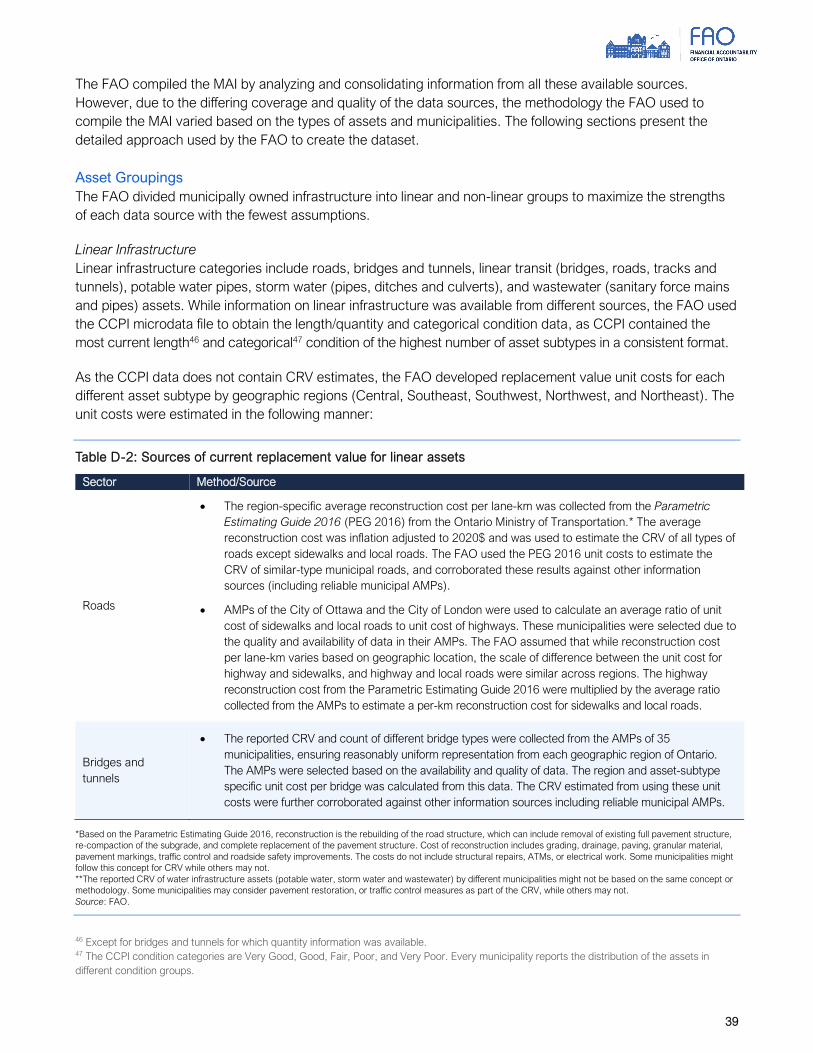
39
The FAO compiled the MAI by analyzing and consolidating information from all these available sources.
However, due to the differing coverage and quality of the data sources, the methodology the FAO used to
compile the MAI varied based on the types of assets and municipalities. The following sections present the
detailed approach used by the FAO to create the dataset.
Asset Groupings
The FAO divided municipally owned infrastructure into linear and non-linear groups to maximize the strengths
of each data source with the fewest assumptions.
Linear Infrastructure
Linear infrastructure categories include roads, bridges and tunnels, linear transit (bridges, roads, tracks and
tunnels), potable water pipes, storm water (pipes, ditches and culverts), and wastewater (sanitary force mains
and pipes) assets. While information on linear infrastructure was available from different sources, the FAO used
the CCPI microdata file to obtain the length/quantity and categorical condition data, as CCPI contained the
most current length46 and categorical47 condition of the highest number of asset subtypes in a consistent format.
As the CCPI data does not contain CRV estimates, the FAO developed replacement value unit costs for each
different asset subtype by geographic regions (Central, Southeast, Southwest, Northwest, and Northeast). The
unit costs were estimated in the following manner:
Table D-2: Sources of current replacement value for linear assets
Sector Method/Source
Roads
• The region-specific average reconstruction cost per lane-km was collected from the Parametric
Estimating Guide 2016 (PEG 2016) from the Ontario Ministry of Transportation.* The average
reconstruction cost was inflation adjusted to 2020$ and was used to estimate the CRV of all types of
roads except sidewalks and local roads. The FAO used the PEG 2016 unit costs to estimate the
CRV of similar-type municipal roads, and corroborated these results against other information
sources (including reliable municipal AMPs).
• AMPs of the City of Ottawa and the City of London were used to calculate an average ratio of unit
cost of sidewalks and local roads to unit cost of highways. These municipalities were selected due to
the quality and availability of data in their AMPs. The FAO assumed that while reconstruction cost
per lane-km varies based on geographic location, the scale of difference between the unit cost for
highway and sidewalks, and highway and local roads were similar across regions. The highway
reconstruction cost from the Parametric Estimating Guide 2016 were multiplied by the average ratio
collected from the AMPs to estimate a per-km reconstruction cost for sidewalks and local roads.
Bridges and
tunnels
• The reported CRV and count of different bridge types were collected from the AMPs of 35
municipalities, ensuring reasonably uniform representation from each geographic region of Ontario.
The AMPs were selected based on the availability and quality of data. The region and asset-subtype
specific unit cost per bridge was calculated from this data. The CRV estimated from using these unit
costs were further corroborated against other information sources including reliable municipal AMPs.
*Based on the Parametric Estimating Guide 2016, reconstruction is the rebuilding of the road structure, which can include removal of existing full pavement structure,
re-compaction of the subgrade, and complete replacement of the pavement structure. Cost of reconstruction includes grading, drainage, paving, granular material,
pavement markings, traffic control and roadside safety improvements. The costs do not include structural repairs, ATMs, or electrical work. Some municipalities might
follow this concept for CRV while others may not.
**The reported CRV of water infrastructure assets (potable water, storm water and wastewater) by different municipalities might not be based on the same concept or
methodology. Some municipalities may consider pavement restoration, or traffic control measures as part of the CRV, while others may not.
Source: FAO.
46 Except for bridges and tunnels for which quantity information was available. 47 The CCPI condition categories are Very Good, Good, Fair, Poor, and Very Poor. Every municipality reports the distribution of the assets in
different condition groups.

40
Table D-2 (Cont.): Sources of current replacement value for linear assets
Sector Method/Source
Transit • Collected from individual AMPs.
Potable water
• The reported CRV** and length of different types of potable water pipes were collected from the
AMPs of 33 municipalities, ensuring reasonably uniform representation from each geographic
region of Ontario. The AMPs were selected based on the availability and quality of data. The region
and asset-subtype specific unit cost per km of potable water pipe was calculated from this data.
The CRV estimated from using these unit costs were further corroborated against other information
sources including reliable municipal AMPs.
Storm water
• The reported CRV** and length of different types of storm water pipes were collected from the
AMPs of 33 municipalities, ensuring reasonably uniform representation from each geographic
region of Ontario. The AMPs were selected based on the availability and quality of data. The region
and asset-subtype specific unit cost per km of storm water pipe was calculated from this data. The
CRV estimated from using these unit costs were further corroborated against other information
sources including reliable municipal AMPs.
Wastewater
• The reported CRV** and length of different types of wastewater pipes were collected from the AMPs
of 33 municipalities, ensuring reasonably uniform representation from each geographic region of
Ontario. The AMPs were selected based on the availability and quality of data. The region and
asset-subtype specific unit cost per km of wastewater pipe was calculated from this data. The CRV
estimated from using these unit costs were further corroborated against other information sources
including reliable municipal AMPs.
*Based on the Parametric Estimating Guide 2016, reconstruction is the rebuilding of the road structure, which can include removal of existing full pavement structure,
re-compaction of the subgrade, and complete replacement of the pavement structure. Cost of reconstruction includes grading, drainage, paving, granular material,
pavement markings, traffic control and roadside safety improvements. The costs do not include structural repairs, ATMs, or electrical work. Some municipalities might
follow this concept for CRV while others may not.
**The reported CRV of water infrastructure assets (potable water, storm water and wastewater) by different municipalities might not be based on the same concept or
methodology. Some municipalities may consider pavement restoration, or traffic control measures as part of the CRV, while others may not.
Source: FAO.
The CRV of the various linear asset types was calculated by multiplying a municipality’s asset length/quantity
obtained from CCPI with the region-specific unit cost for the asset. However, when an individual municipality’s
unit cost was available, the municipality’s asset length/quantity from CCPI was multiplied by that municipality-
specific unit cost. To use the most detailed data possible, the CCPI-based dataset was supplemented with data
collected from individual municipalities wherever available.
At this stage of development, all linear-engineering infrastructure assets have been compiled, which include
quantity and CRV estimates and numerical/categorical condition assessments.
Non-Linear Infrastructure
Non-linear infrastructure categories include buildings and facilities in tourism, culture and recreation, social
housing, solid waste, health, justice, government administration, transit, potable water, storm water and
wastewater sectors. The various data sources had information on different sectors of buildings and facilities.
For example, the CCPI did not have any data on buildings and facilities in government administration, health or
justice sectors since these sectors are not included in the definition of “core” infrastructure.
The FAO combined numerous data sources for vertical assets in the MAI. Due to the different reporting formats
used by the various sources, a reliable estimate of the total count of all municipally owned buildings and
facilities in Ontario was not available. Given these limitations, the FAO collected and merged information from
the sources listed below to obtain the best possible estimate of the total CRV and condition of municipally
owned buildings and facilities in the province.

41
1. Information Requests: The FAO obtained highly detailed, individual asset-specific CRV, condition and
age data of buildings and facilities from numerous municipalities directly, allowing the FAO to assess
the state of repair of non-linear infrastructure assets that provide service to approximately 3.7 million
Ontarians (nearly 27.4 per cent of Ontario’s population).
2. Asset Management Plans: The FAO analyzed AMPs, collecting CRV, condition, and age data from 27
Ontario municipalities.
3. Ontario Ministry of Infrastructure’s Municipal Asset Inventory: The FAO used MOI’s dataset for any
information that was not obtained through information requests or AMPs.
4. CCPI: This survey had condition information for several municipalities that were not available
elsewhere. However, there was no CRV for these assets. The FAO used MOI’s CRV estimation
process48 to impute CRVs for those municipalities.
5. Financial Information Return (FIR): The FIR was used for the remaining municipalities with no data.
Asset age and condition was estimated based on amortization schedules, while CRV was estimated
from the reported historical costs which were inflation-adjusted based on asset age.
Summary of CRV by Source
A summary of the share of both linear and non-linear assets by data source is presented below. The majority
(70.9 per cent) of the CRV data in the FAO’s MAI is based on the estimated unit costs.
Table D-3: Share of infrastructure assets in the FAO’s MAI by source
Source of CRV Source of Condition CRV ($ Billions) Share of Assets by CRV (Per Cent)
Unit Cost CCPI 343.3 70.9
Information Request Information Request 43.0 8.9
AMP AMP 33.0 6.8
MOI CCPI 18.2 3.8
MOI FIR 14.0 2.9
MOI MOI 13.3 2.7
Information Request CCPI 10.1 2.1
Estimated CCPI 9.1 1.9
FIR FIR 0.2 0.0
Total 484.2 100.0
Source: FAO.
48 MOI’s CRV estimation involved using available data to estimate CRV based on three demographic characteristics: per capita, per household
and per usual household. The average of these three estimates is used for the final CRV estimate.

42
Standardizing Infrastructure Condition Ratings
The FAO found three major types of condition metrics used by different municipalities, presented in the table below.
Table D-4: Most common types of condition metrics used by municipalities
Type Description
Categorical Condition Condition categories, typically presented as: Very Good, Good, Fair, Poor, Very Poor.
Condition Score On a scale of 0-100, with 100 indicating an asset that needs no renewal or repair.
Facility Condition Index (FCI) FCI ranges from 0 to 1, with 0 indicating an asset that needs no renewal or repair.
Source: FAO.
Numerical Conditions
The first step the FAO took was to standardize numerical conditions that were taken from either condition
scores or FCIs. The FAO standardized all numeric condition data so that measurements range from 100 to 0,
with 100 indicating the highest condition asset and zero the lowest. For municipalities that report FCI, this
measure was taken as a proxy of the condition and converted to the 100 to 0 scale. These numerical
conditions were used directly in the FAO’s model and did not need further adjustment.
Categorical Conditions
Next, the FAO standardized categorical conditions. Municipalities use different condition categories to describe
the state of their assets. Some municipalities use the five standard condition categories which include Very
Good, Good, Fair, Poor, and Very Poor, while others used alternative categories, such as Average, Critical, or
Past Due. The FAO analyzed the AMPs of the municipalities that use non-standard assessments to understand
the definition of their conditions and aligned these measurements to the five standard categories.
During this process, the FAO found two major sources of uncertainty in the condition data:
• There was often no way of knowing how asset conditions were determined. In some cases, reported
condition data was based on engineering site inspections, while in other cases the data may have been
imputed based on the asset’s age, or may simply reflect the municipality’s judgement in the absence of
a site inspection.
• The categorical conditions across municipalities were not directly comparable. Even when municipalities
use the same label, these could mean different things. For example, a ‘Good’ condition asset in one
municipality may not mean the same thing as a ‘Good’ condition asset in another municipality.
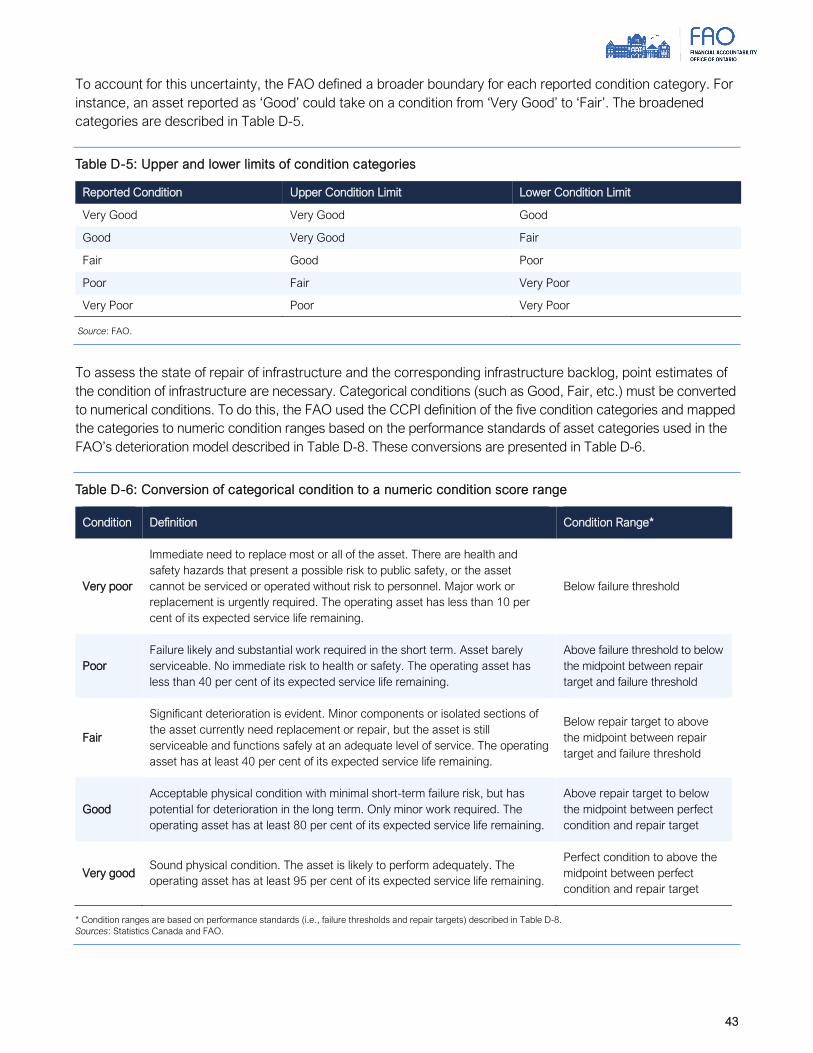
43
To account for this uncertainty, the FAO defined a broader boundary for each reported condition category. For
instance, an asset reported as ‘Good’ could take on a condition from ‘Very Good’ to ‘Fair’. The broadened
categories are described in Table D-5.
Table D-5: Upper and lower limits of condition categories
Reported Condition Upper Condition Limit Lower Condition Limit
Very Good Very Good Good
Good Very Good Fair
Fair Good Poor
Poor Fair Very Poor
Very Poor Poor Very Poor
Source: FAO.
To assess the state of repair of infrastructure and the corresponding infrastructure backlog, point estimates of
the condition of infrastructure are necessary. Categorical conditions (such as Good, Fair, etc.) must be converted
to numerical conditions. To do this, the FAO used the CCPI definition of the five condition categories and mapped
the categories to numeric condition ranges based on the performance standards of asset categories used in the
FAO’s deterioration model described in Table D-8. These conversions are presented in Table D-6.
Table D-6: Conversion of categorical condition to a numeric condition score range
Condition Definition Condition Range*
Very poor
Immediate need to replace most or all of the asset. There are health and
safety hazards that present a possible risk to public safety, or the asset
cannot be serviced or operated without risk to personnel. Major work or
replacement is urgently required. The operating asset has less than 10 per
cent of its expected service life remaining.
Below failure threshold
Poor
Failure likely and substantial work required in the short term. Asset barely
serviceable. No immediate risk to health or safety. The operating asset has
less than 40 per cent of its expected service life remaining.
Above failure threshold to below
the midpoint between repair
target and failure threshold
Fair
Significant deterioration is evident. Minor components or isolated sections of
the asset currently need replacement or repair, but the asset is still
serviceable and functions safely at an adequate level of service. The operating
asset has at least 40 per cent of its expected service life remaining.
Below repair target to above
the midpoint between repair
target and failure threshold
Good
Acceptable physical condition with minimal short-term failure risk, but has
potential for deterioration in the long term. Only minor work required. The
operating asset has at least 80 per cent of its expected service life remaining.
Above repair target to below
the midpoint between perfect
condition and repair target
Very good Sound physical condition. The asset is likely to perform adequately. The
operating asset has at least 95 per cent of its expected service life remaining.
Perfect condition to above the
midpoint between perfect
condition and repair target
* Condition ranges are based on performance standards (i.e., failure thresholds and repair targets) described in Table D-8.
Sources: Statistics Canada and FAO.

44
Figure D-1 presents an illustrative example of how the five condition categories were converted to a range of
numeric condition.
Figure D-1: Example of numeric condition ranges based on an asset deterioration curve
Source: FAO.
To account for the uncertainty in asset condition data, the FAO conducted a Monte Carlo analysis where
numerical condition estimates were generated from between the upper and lower categorical ranges presented
in Table D-5.
For example, if a municipal building asset has a categorical condition of ‘Good’, the FAO assumes that the
asset could be in any condition from ‘Very Good’ to ‘Fair.’ The highest condition score of a ‘Very Good’
municipal building is 100 while the lowest condition of a ‘Fair’ municipal building is 50. Assuming the asset has
equal probability of having any condition score within this range, a random condition score was generated from
this range of 50 to 100.
This process was repeated for each asset 5,000 times to generate a range of possible condition scores. The
state of repair and infrastructure backlog was calculated based on these randomly generated condition
estimates. The average result of the simulations has been presented throughout the report.
Estimating State of Repair and Infrastructure Backlog
The methodology used in this report to determine the state of repair of infrastructure and estimate the
infrastructure backlog is largely based on infrastructure modelling techniques developed by Ontario’s Ministry
of Infrastructure (MOI), which were further adapted by the FAO to include water engineering infrastructure
(potable water, storm water and wastewater assets).
The state of repair framework uses infrastructure deterioration modelling which, through a series of simplified
asset management decisions, estimates the current state of repair and infrastructure backlog.
Age
16 31 46 61 76 91
Con
ditio
n
100
90
80
70
60
50
40
30
20
10
01
Condition Failure TargetRepair Target
Very Good
Good
Fair
Poor
Very Poor

45
The FAO’s estimates of the state of repair and the infrastructure backlog are sensitive to the data and
methodology used in this report. Because there is no consensus on the definitions of the infrastructure backlog
and the state of good repair, it is necessary to make assumptions while recognizing that the definitions are
subject to debate.49
Measuring the State of Repair and Calculating the Infrastructure Backlog
Once the MAI was assembled and the condition values were generated based on the framework defined in the
section above, the asset data was assessed in the infrastructure deterioration model to determine whether
each asset is in a state of good repair based on the performance standards outlined in Table D-8 below. If the
asset was not in a state of good repair, the FAO then determined if that asset required capital spending, including
the type and amount of capital spending needed to bring each asset into a state of good repair (i.e., the
infrastructure backlog). The process is outlined in Table D-7 and is based on decision rules developed by MOI.
Table D-7: Model logic for assessing the state of repair and infrastructure backlog
If the Asset’s… Asset’s State of
Repair
Capital
Spending
Required
Type of
Capital
Spending
Infrastructure Backlog
1. Condition is equal to or greater than
Repair Target
In a State of Good
Repair No N/A Zero
1. Condition is less than Repair Target,
AND
2. Condition is greater than
Failure Threshold, AND
3. Age is less than or equal to 90 per
cent of asset’s useful life
Not in a State of
Good Repair Yes Rehabilitation
Amount necessary to
bring asset’s condition to
Repair Target50
1. Condition is less than Repair Target,
AND
2. Condition is greater than
Failure Threshold, AND
3. Age is greater than 90 per cent of
asset’s useful life to failure
Not in a State of
Good Repair No N/A
Zero. These assets will be
allowed to deteriorate
until Failure Threshold, at
which point they will be
renewed.
1. Condition is equal to or less than
Failure Threshold
Not in a State of
Good Repair Yes Renewal Amount equal to CRV
Source: FAO based on the Ontario Ministry of Infrastructure’s renewal model.
49 Municipalities manage a diverse portfolio of assets and may use different methodologies to determine the state of repair of their assets and the
associated infrastructure backlog, which may not align with the estimates presented in this report. 50 To estimate the cost of rehabilitation, the FAO assumes that there is a direct relationship between an asset’s measured condition and the
current replacement value of an asset. For example, if an asset’s condition index is 70 and its Repair Target is 85, rehabilitation costs are
calculated by multiplying the asset’s CRV by the difference between the Repair Target and current condition, that is, CRV x [(85-70)/100]. For
assets measured with a Facility Condition Index (FCI), this is true based on the definition and calculation of FCI. However, for assets measured
using a Pavement Condition Index (PCI), Bridge Condition Index (BCI) or other technique this relationship is assumed. Additionally, municipalities
may use different approaches to address the rehabilitation and renewal needs of their assets, which may not align with the simplified approach
taken in this report.

46
The information and performance standards used to determine an asset’s state of good repair and
infrastructure backlog are described below.
• Condition – See Standardizing Infrastructure Condition.
• Age – The actual age of an asset when available. When the actual age was not available, an implied
age was calculated based on condition.
• Current Replacement Value – The current cost of rebuilding an asset with the equivalent capacity,
functionality and performance as the original asset.
• Asset-type – The type of asset, such as building, transit engineering infrastructure, potable water
pipe, etc.
• Repair Target – The condition which, at or above, an asset does not require any current capital
spending and is considered acceptable from both an engineering quality assessment and cost
management perspective. Assets with conditions at or above the repair target are considered to be in
a state of good repair.
• Failure Threshold – The condition which, at or below, an asset must be replaced with a new asset (i.e.,
renewal) to bring that asset into a state of good repair.
• Design Life – The number of years which an asset is designed to remain in operation. Assets typically
remain in use for longer than their design life.
• Useful Life – The number of years which an asset typically remains in operation. The FAO assumes an
asset’s useful life is twice its design life.
The following table includes the performance standards used by the FAO to determine whether an asset is in a
state of good repair and estimate its respective infrastructure backlog. However, municipalities may adopt
different targets and consider other factors when making their actual capital spending decisions.51 Importantly,
estimates of the share of assets in a state of good repair and the infrastructure backlog will vary depending on
the targets used.52
51 For example, municipalities may have different targets for the state of repair of their assets than those used in this report. It is also unlikely that
municipalities use the same targets as one another. This report evaluates all municipal infrastructure using a consistent framework. 52 If the repair targets were higher than those in Table D-8, the share of assets in a state of good repair would be lower and the infrastructure
backlog would be higher than the estimates presented in this report. In contrast, if the repair targets were lower, the share of assets in a state of
good repair would be higher and the backlog would be lower.

47
Table D-8: Performance standards by sector and asset-type
Sector Asset Class Asset Type Repair
Target
Failure
Threshold
Design Life
(Years)
Transit Buildings 90 35 17
Engineering 90 35 21
Bridges and
culverts Engineering 76 40 52
Roads Engineering
Arterial Roads 80 35 31
Collector Roads 75 40 31
Freeways 80 55 32
Local Roads 70 35 31
Potable Water
Buildings Potable Water Facilities 70 15 67
Engineering
Local Pipes 45 15 66
Transmission Pipes 45 15 71
Pipes of Unknown Diameter 45 15 62
Storm Water
Buildings Storm water facilities 70 15 67
Engineering
Small Pipes 55 25 60
Medium Pipes 55 25 64
Large Pipes 55 25 73
Unknown Pipes 55 25 63
Ditch 55 25 52
Culvert 55 25 43
Wastewater
Buildings Wastewater Facilities 70 15 67
Engineering
Small Pipes 60 30 67
Medium Pipes 60 30 70
Large Pipes 60 30 74
Pipes of Unknown Diameter 60 30 63
Sanitary Mains 60 30 64
Other buildings
and facilities Buildings
Municipal Buildings and
facilities 80 20 49
Government Administration 70 15 67
Courthouses 85 20 56
Correctional facilities 85 20 49
Long-term care buildings 79 20 39
Sources: FAO and FAO analysis based on information provided by the Ontario Ministry of Infrastructure.