2021 Healthcare Breach Report
9
Healthcare Breach Report 2021 Hacking and IT Incidents on the Rise
Transcript of 2021 Healthcare Breach Report

Healthcare Breach Report 2021 Hacking and IT Incidents on the Rise

The vast majority of healthcare organizations process and store protected health information (PHI) such as Social Security numbers, medical history, and other personal data. Unquestionably, this draws the attention of malicious entities that can compromise sensitive data and use it for monetary gain. In Bitglass’ annual Healthcare Breach Report, we analyze data from the U.S. Department of Health and Human Services' “Wall of Shame” to gauge the severity of each year’s breaches. These breaches are broken into the following, mutually exclusive categories:
Hacking and IT Incidents: Breaches related to malicious hackers and improper IT security--cybersecurity debacles stemming from external parties.
Unauthorized Disclosure: All unauthorized sharing of PHI by internal parties or systems.
Loss or Theft: Breaches enabled by the loss or theft of endpoint devices.
Other: Miscellaneous breaches and leaks related to items like improper disposal of documents.
With the rapid acceleration of cloud, bring your own device (BYOD), and remote work adoption due to the global pandemic, 2020 looked significantly different than any other year in history. What kind of impacts did these changes have? Read on to learn the state of cybersecurity for healthcare organizations in 2020.

Key Findings
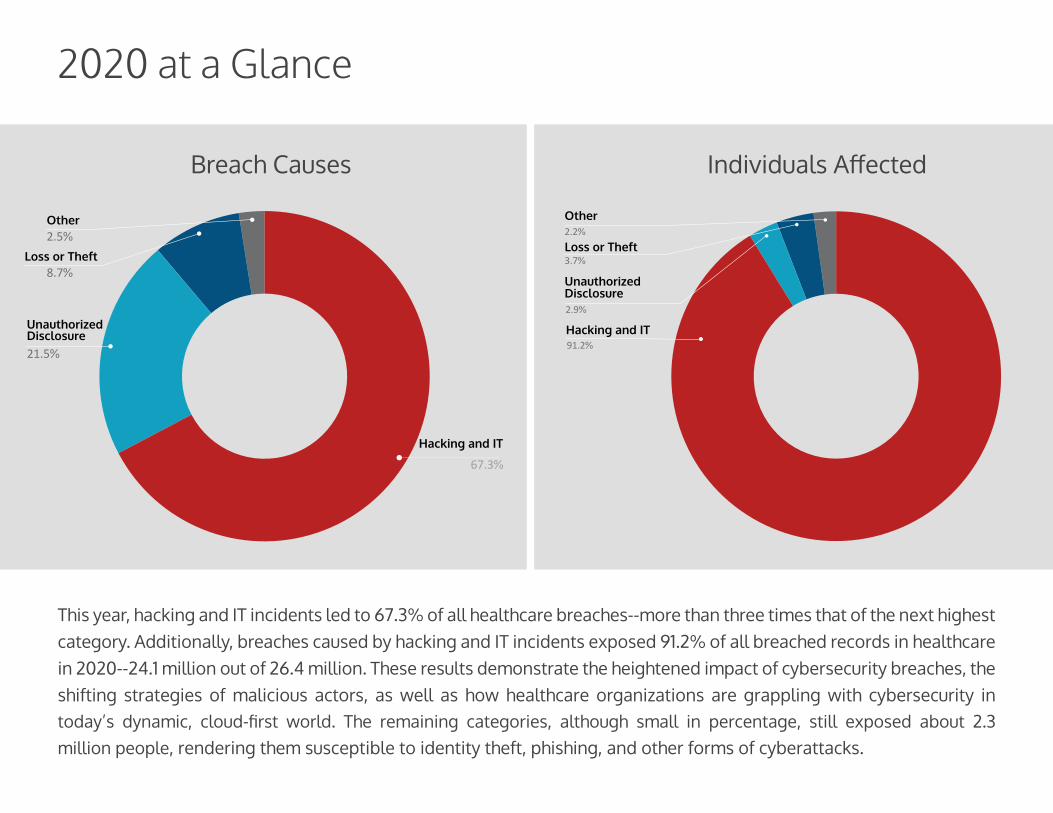
This year, hacking and IT incidents led to 67.3% of all healthcare breaches--more than three times that of the next highest category. Additionally, breaches caused by hacking and IT incidents exposed 91.2% of all breached records in healthcare in 2020--24.1 million out of 26.4 million. These results demonstrate the heightened impact of cybersecurity breaches, the shifting strategies of malicious actors, as well as how healthcare organizations are grappling with cybersecurity in today’s dynamic, cloud-first world. The remaining categories, although small in percentage, still exposed about 2.3 million people, rendering them susceptible to identity theft, phishing, and other forms of cyberattacks.
2020 at a Glance
Individuals AffectedBreach Causes
UnauthorizedDisclosure
Hacking and IT
Loss or Theft
Other
UnauthorizedDisclosure
Hacking and IT
Loss or Theft
Other

In 2014, lost and stolen devices were the leading causes of security breaches in healthcare, while hacking and IT incidents were the least common causes. Today, things have essentially inverted. Hacking and IT incidents are now the primary forces behind healthcare breaches--as they have been each year since 2017. As organizations continue to embrace cloud migration and digital transformation, healthcare organizations must leverage the proper tools and strategies to successfully protect patient records and respond to the growing volume of threats to their IT ecosystems.
Breach Causes Year Over Year
Hacking and IT
Loss or Theft
Unauthorized Disclosure
Other
400
500

Each year since 2015, hacking and IT incidents have been exposing more records than any other breach type. Additionally, the scales of these incidents have been increasing each year since 2018, suggesting that organizations are increasingly leaning on their IT resources, and criminals have been increasingly targeting them. With over 24 million individuals affected, organizations must equip themselves with modern tools capable of preventing hacking and IT incidents and stopping data leakage. This is particularly true now that most organizations have shifted at least in part to a remote style of operations.
Individuals Affected Year Over Year
Hacking and IT
Loss or Theft
UnauthorizedDisclosure
Other
10,000,000
20,000,000
30,000,000

This year, there were 49 healthcare breaches in California, which was more than that of any other state and surpassed last year’s leader, Texas, which suffered 43 breaches in 2020. Michigan had the highest count of individuals affected, but this was primarily due to the Trinity Health breach, which impacted 3.3 million victims on its own. Overall (and in keeping with prior years), states with denser populations suffered more breaches. This year, breach numbers were up across the board, with 37 out of 50 states suffering more breaches than they did in 2019.
Breaches by State
AK
OR
WA
ID
NV
MT
WY
UT
NM
CA
ND
SD
NE
KS
OK
MN
IA
MO
AR
MS AL
LA
FL
NC
VAWVKY
TN
COIL IN OH
PA
NY
VTNH
ME
MA
CTNJ
DEMD
SCGA
DC
RIMIWI
AZ
49
3
2
1
0 32
2
16
2
117
1121
25 38
39 17
7
10
252
9
0
38
12
19
0
4
61
TX
HI
43 5
6
8
4 19
216
11
13
10
317
9
18
3
8
7
14

According to Ponemon, the average cost of a breach in health-care remained higher than that of every other industry in 2020, and increased 10.5% since 2019. Likewise, the cost per breached record also increased, rising from $429 to $499 this year (a 16.3% increase). On average, healthcare firms take the longest to identify breaches, at about 96 days, and take the longest to recover from them, at about 236 days.
Year over year changes can be seen below, with total healthcare breach costs calculated by multiplying the cost per breached record each year by the number of breached records each year. As the data shows, billions of dollars are being wasted annually due to either cybersecurity negligence or the use of legacy tools that are incapable of securing data in modern work environ-ments. To address this challenge, healthcare firms should turn to comprehensive platforms designed to secure any interaction between any devices, apps, web destinations, on-premises resources, or infrastructure.
The Cost of a Breach in 2020

For more information, visitwww.bitglass.com
(406) [email protected]
Appendix
*Excludes outlier mega-breaches for 2015 that affected approximately 90M individuals
Breach Count 2014 2015* 2016 2017 2018 2019 2020
Hacking and IT 30 57 113 132 133 234 403
Loss or Theft 148 104 78 55 45 42 52
UnauthorizedDisclosure
Other
75 101 130 99 104 106 129
36 6 7 8 8 4 15
Total 289 268 328 294 290 386 599
Individuals Affected 2014 2015* 2016 2017 2018 2019 2020
Hacking and IT 1,677,469 12,812,172 13,426,813 3,348,321 7,719,964 23,862,875 24,117,842
Loss or Theft 7,380,580 798,829 1,462,403 946,037 705,528 1,108,123 970,461
UnauthorizedDisclosure
Other
3,027,697 573,752 1,641,006 399,893 2,760,037 2,542,390 763,049
477,041 82,421 125,730 27,593 338,738 12,677 584,479
Total 12,562,787 14,267,174 16,655,952 4,721,844 11,524,267 27,526,065 26,435,831
About Bitglass
Bitglass’ Total Cloud Security Platform is
the only secure access service edge
offering that combines a Gartner-MQ-
Leading cloud access security broker, the
world’s only on-device secure web
gateway, and zero trust network access
to secure any interaction. Its Polyscale
Architecture boasts an industry-leading
uptime of 99.99% and delivers unrivaled
performance and real-time scalability to
any location in the world. Based in Silicon
Valley with offices worldwide, the compa-
ny is backed by Tier 1 investors and was
founded in 2013 by a team of industry
veterans with a proven track record of
innovation and execution.