2021 2Q Earnings Release - posco.com
17
2021 2Q Earnings Release July 22, 2021
Transcript of 2021 2Q Earnings Release - posco.com

2021 2Q Earnings ReleaseJuly 22, 2021

2Q21 Earnings Release │ Jul 22, 2021
Disclaimer
This presentation was prepared and circulated to release the informations regarding the company’s business performance to shareholders and investors prior to the completion of auditing for the period of the second quarter of 2021. As figures in this presentation are based on unaudited financial statements, certain contents may be subject to modification in the course of auditing process.
This presentation contains certain forward-looking statements relating to the business, financial performance and results of the company and/or the industry in which it operates. The forward-looking statements set forth herein concern future circumstances and results and other statements that not historical facts, and are solely opinions and forecasts which are uncertain and subject to risks. Therefore, the recipients of this presentation shall be aware of that the forward-looking statements set forth herein may not correspond to the actual business performance of the company due to changes and risks in business environments and conditions.
The sole purpose of this presentation is to assist persons in deciding whether they wish to proceed with certain investments to the company. The company does not make any representation or warranty, expressly or impliedly, as to the accuracy and completeness of this presentation or of the information contained herein and shall not have any liability for the informations contained in this presentation.

2Q21 Earnings Release │ Jul 22, 2021
2Q 2021 Earnings Release
Appendix
Contents
2021 Business Outlook
Major Business Strategies- Global Steel Business Strategies- 2021 Safety Management Enhancement Strategies- Technology Development Plan to Reach Net Zero
- Business Performance (Parent/Consolidated)- Financial Structure - Subsidiary Performance
2Q21 Earnings Release │ Jul 22, 2021
7,793
7,852
△111
+988,920
9,559 9,448
9,0187,762
8,812
54.557.4
8,999
59.9
+187
+2.5%p
2Q20 2Q21
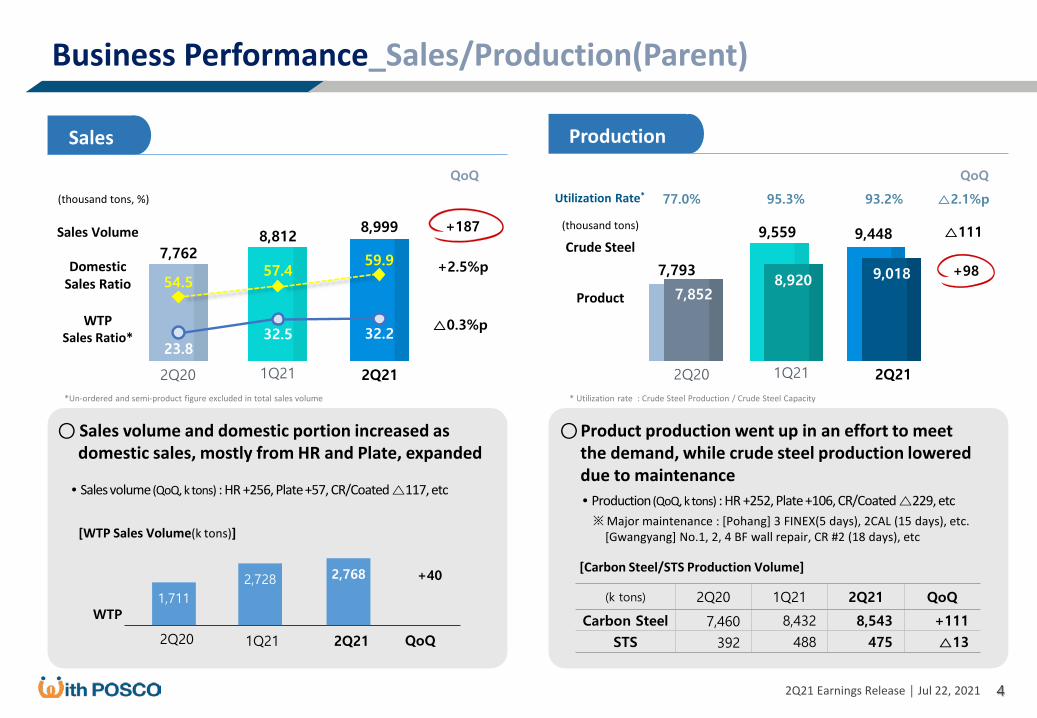
○Product production went up in an effort to meet the demand, while crude steel production lowered due to maintenance
○ Sales volume and domestic portion increased asdomestic sales, mostly from HR and Plate, expanded
• Sales volume (QoQ, k tons) : HR +256, Plate+57, CR/Coated△117, etc
※Major maintenance : [Pohang] 3 FINEX(5 days), 2CAL (15 days), etc.[Gwangyang] No.1, 2, 4 BF wall repair, CR #2 (18 days), etc
WTP
23.832.5 32.2
△0.3%p
• Production (QoQ, k tons) : HR +252, Plate+106, CR/Coated△229, etc
(k tons) 2Q20 1Q21 2Q21 QoQ
Carbon Steel 7,460 8,432 8,543 +111
STS 392 488 475 △132Q20
1,711
1Q21
2,728
4
△2.1%p77.0% 95.3% 93.2%
2Q21
2,768
QoQ
+40
Business Performance_Sales/Production(Parent)
ProductionSales
Sales Volume
DomesticSales Ratio
(thousand tons, %)
WTPSales Ratio*
QoQQoQ
* Utilization rate : Crude Steel Production / Crude Steel Capacity*Un-ordered and semi-product figure excluded in total sales volume
1Q21 2Q20 2Q211Q21
Crude Steel
Product
(thousand tons)
Utilization Rate*
[WTP Sales Volume(k tons)]
[Carbon Steel/STS Production Volume]

2Q21 Earnings Release │ Jul 22, 2021
+1,477
+535
+3.5%p
○Reached the highest OP level since 3Q10, led by priceand sales volume increase, despite raw material pricehike【Operating Profit】
7,8009,277
• Sales price (carbon steel, thousand won/t) : 1Q21) 763 → 2Q21) 901 (+138) • 2Q Raw material applied cost (’1Q21 price =100): Iron ore 122, coking coal115
5
+2,224
+649
+2.3%p
13,72216,069
18,293
○ Consolidated OP recorded 2.2 trillion KRW as both domestic and overseas steel businesses, includingPOSCO and PT.KP, outperformed
Price uptrend
1,6081,073
1Q21
+1,265
△755
Production decline, raw material cost
hike , etc
2Q21
13.8%1,073
5,885
△108
△1.8%
17.3%
1,608
(billion KRW)+25
Sales volume increase
1,552
9.7%
2,201
12.0%
1681.2%
Business Performance_Parent/Consolidated
Parent Consolidated
QoQ(billion KRW) QoQ(billion KRW)
Revenue
Operating Profit
OP Margin
Revenue
Operating Profit
OP Margin
(billion KRW) 2Q20 1Q21 2Q21 QoQ
Steel △197 1,334 2,048 +714
Overseas (U$ m) △77 212 353 +141
Global & Infra. 282 347 286 △61
New Growth △10 43 44 +1
【Aggregated Operating Profit】
2Q20 2Q211Q21 2Q20 2Q211Q21

2Q21 Earnings Release │ Jul 22, 2021
○Liabilities ratio dropped by 4.2%p QoQ, as major group affiliates as POSCO and POSCO E&C repaiddebt
○Debt/EBITDA improved as debt and cash decreaseddue to debt repayment and operating profit increased
• Debt : The 3rd Global bond △U$0.7 billion, Public Bond △150 billion KRW
△1,348△567
△885
QoQQoQ
△0.3 △0.4
△927
1.3
10,938
8,452
1.0
10,371
7,525
2.8
12,065
8,562
2.3
21,625
17,568
4.4
24,089
16,892
1.9
20,277
16,683
6
• Debt (billion KRW) : POSCO E&C △180, P-Energy △152,PT.KP △138, P-Maharashtra △109, etc
Financial Structure
Parent Consolidated
Total Debt (billion KRW)
Cash Balance (billion KRW)
Debt/EBITDA
Cash Balance(billion KRW)
Total Debt(billion KRW)
Debt/EBITDA*
2Q20 2Q211Q21 2Q20 2Q211Q21
* Based on Moody’s standard (Consider unrecorded liabilities in debt and net finance cost in EBITDA)
【Liabilities ratio, EBITDA】 【Liabilities ratio, EBITDA】
(billion KRW) 2Q20 1Q21 2Q21 QoQ
Liabilities ratio 72.5% 68.3% 64.1% △4.2%p
EBITDA 1,069 2,452 3,090 +638
(billion KRW) 2Q20 1Q21 2Q21 QoQ
Liabilities ratio 26.9% 27.6% 26.1% △1.5%p
EBITDA 482 1,673 2,209 +536

2Q21 Earnings Release │ Jul 22, 2021 7
466424
350
• OP downturned as electricity price declined as entering the slow season and LNG unit price hike pressured the margin - Capacity Price per unit declined (QoQ) : △63%- LNG direct purchase price per unit increase (QoQ) : +33%
4,6866,303
7,747
• Both revenue and OP went up supported by improved trading, as steel sector - Revenue and OP better off as steel product sales volume and price went up -Sales volume from other sectors, as agriculture and auto parts, improved
1,9121,567 1,632
109
• Profit fell QoQ due to one-off expenses, as promotionexpenses for apartment applications
329
455467
• Profit increased due to higher cathode material price, enhanced production efficiency backed by mass production, and production cost reduction
-Cathode materials price increase (QoQ) : +8%
+1,444
+26
△74
△67
+65
△20
+12
+2
QoQ
QoQ
QoQ
QoQ
12383
109 114 129
4172
5 334
36
Subsidiary Performance _Domestic
POSCO E&CPOSCO International
POSCO Energy POSCO Chemical
Revenue
OperatingProfit
(billion KRW)
Revenue
OperatingProfit
(billion KRW)
Revenue
OperatingProfit
(billion KRW)
Revenue
OperatingProfit
(billion KRW)
2Q20 1Q21 2Q21 2Q20 1Q21 2Q21
2Q20 1Q21 2Q21 2Q20 1Q21 2Q21
2Q21 Earnings Release │ Jul 22, 2021 8
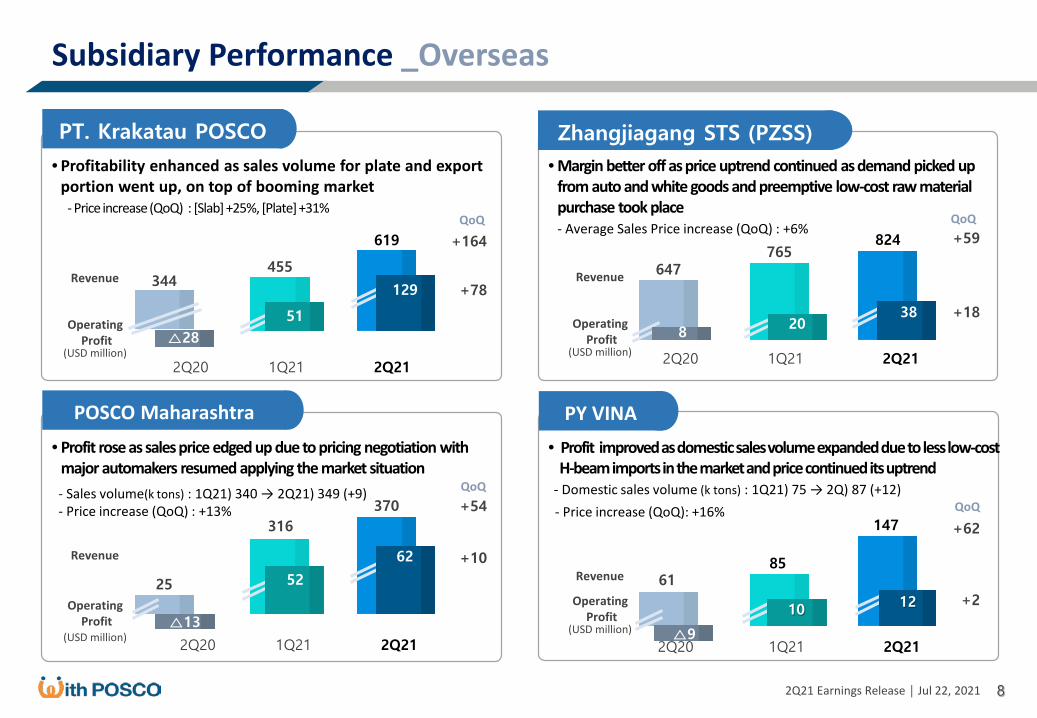
765824
647
• Margin better off as price uptrend continued as demand picked up from auto and white goods and preemptive low-cost raw materialpurchase took place - Average Sales Price increase (QoQ) : +6%
619
344455
• Profitability enhanced as sales volume for plate and export portion went up, on top of booming market
- Price increase (QoQ) : [Slab] +25%, [Plate] +31%
△28
61
△9
85
147
• Profit improved as domestic sales volume expanded due to less low-cost H-beam imports in the market and price continued its uptrend
- Domestic sales volume (k tons) : 1Q21) 75 → 2Q) 87 (+12) - Price increase (QoQ): +16%
25
△13
316316
370
• Profit rose as sales price edged up due to pricing negotiation withmajor automakers resumed applying the market situation - Sales volume(k tons) : 1Q21) 340 → 2Q21) 349 (+9)- Price increase (QoQ) : +13%
+164
+78
+54
+10
+59
+18
+62
+2
51
129
8 2038
52
62
10 12
Subsidiary Performance _Overseas
Revenue
OperatingProfit
(USD million)
Revenue
OperatingProfit
(USD million)
Revenue
OperatingProfit
(USD million)
Revenue
OperatingProfit
(USD million)2Q20 1Q21 2Q21 2Q20 1Q21 2Q21
2Q20 1Q21 2Q21 2Q20 1Q21 2Q21
QoQ
QoQQoQ
QoQ
Zhangjiagang STS (PZSS)PT. Krakatau POSCO
PY VINAPOSCO Maharashtra

2Q21 Earnings Release │ Jul 22, 2021
Global Steel Business Strategies
Build global crude steel capacity to reach over 60 million tons+α by 2030
9
Maintain the “Global Top Tier” level through stabilizing existing business and expanding in growth markets
Capacity : (2020) 46 million tons (Domestic 41, Indonesia 3, China 1, Vietnam 1) → (2030) 60 million tons, globally
Expand biz integration utilizing existing productions
Indonesia
India
Preoccupy the local market by engaging PT.KP-Continue improving profitability of existing mills, while
reviewing plans to expand up/downstream process* Current Capacity (million tons) : Crude steel 3, Plate 1.4
Pursue partnership in building integrated system in link with existing downstream - Secure high-growth market by cooperating with local
mills with P-Maharashtra* Current Capacity (million tons) : CR 1.8, Coated 0.5, Electric 0.3
Vietnam
Pursue joint business by utilizing P-Vietnam land - Form JV with local partners to build coating production
line and wind-power generating tower production line · ~’21/E) Sign contract and start construction , ’23)Complete construction
Stabilize business in cooperation with local mills
China
Mexico
Build secure supply system through JV on coated line for automobiles - Signed JV contract with HBIS (Jun, 2021)· Scheduled capacity for coated Steel 1.4 mil tons , CAPEX U$0.3 billion
· Jan 2022) Start construction, 2023/E) Complete construction
Secure stable supply source for P-Mexico and plan to expand business in the Northamerican market
- Pursue JV on EAF and downstream with local mills · Scheduled to build 1.5 million tons of crude steel production·To finalize the business model by the end of 2021
2Q21 Earnings Release │ Jul 22, 2021
2021 Safety Management Enhancement Strategies
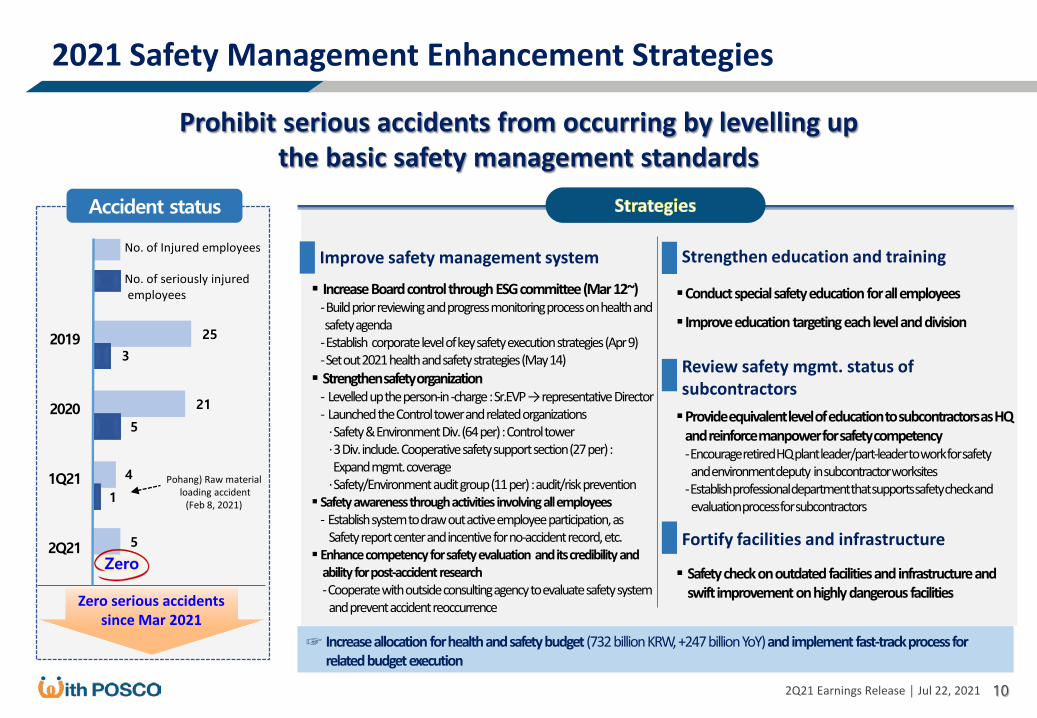
Prohibit serious accidents from occurring by levelling up the basic safety management standards
2019
2020
1Q21
2Q21
25
3
21
5
4
1
5
Zero
Zero serious accidents since Mar 2021
No. of Injured employees
No. of seriously injuredemployees
Pohang) Raw materialloading accident
(Feb 8, 2021)
Accident status
Improve safety management system
Increase Board control through ESG committee(Mar12~)-Buildprior reviewing and progress monitoring process on health and safety agenda
-Establish corporate level of key safety execution strategies (Apr9)-Set out 2021 healthand safety strategies (May14) Strengthen safety organization
- Levelled up the person-in -charge : Sr.EVP → representative Director - Launched the Control tower and related organizations
· Safety & Environment Div. (64 per) : Control tower · 3 Div. include. Cooperative safety support section (27 per) : Expand mgmt. coverage
· Safety/Environment audit group (11 per) : audit/risk prevention Safety awareness through activities involving all employees
- Establish system to draw out active employee participation, as Safety report center and incentive for no-accident record, etc.
Enhance competency for safety evaluation and its credibility and ability for post-accident research -Cooperate with outside consulting agency to evaluate safety systemand prevent accident reoccurrence
Provide equivalent level of education to subcontractors as HQand reinforce manpower for safety competency -Encourage retired HQ plant leader/part-leader to work for safety and environment deputy in subcontractor worksites
-Establish professional department that supports safety check and evaluation process for subcontractors
Strengthen education and training
Conductspecial safety education for all employees
Improve education targeting each level and division
Review safety mgmt. status of subcontractors
Fortify facilities and infrastructure
Safety check on outdated facilities and infrastructure and swift improvement on highly dangerous facilities
☞ Increase allocation for health and safety budget (732 billion KRW, +247 billion YoY) and implement fast-track process for related budget execution
10

2Q21 Earnings Release │ Jul 22, 2021
Technology Development Plan to Reach Net Zero
11
Improve efficiency of operations & energy efficiency by smartization
Fulfill the vision become net zero by 2050 through BF process enhancement and technology development for HyREX*
• Reduce coal usage through Smarttechnology (~2025)
- Detect uneven usage of raw materials by using IoT(Internet of Things) tech.
- Improve operation efficiency by using auto-control through A.I.
• Level-up the efficiency of power-generating facilities (~2030)
- Rationalize off-gas power plant- Build large-scale and highly-efficient
power plant- Implement heat-recovery facility for
FINEX and hearting furnace
• Increase scrap ratio (under progress)- Operating scrap ratio usage from 15%
to 20%
• Develop technology to increase HMR ratio to 30% (~2025)(Gradually apply from 2025)
- Introduce steelmaking facilities thatuses big volume of scraps
- Review ways to implement EAF
• Introduce Technology to reduce CO2emission from BF
- Inject Hydrogen-innate gas (LNG, COG) (‘26)- Use BF-produced scrap or HBI*
(Test underway, reviewing ways to expand the usage)
• Develop and apply CCUS technology- Make liquified CO2 by using FINEX gas(Pursue to apply the facility by 2024)
- Expand facility using FINEX-generated CO2(Applied at Pohang No.5 cokes oven, run as government-funding project until 2024)
• Expediate hydrogen-reduction technology based on FINEX fluidized reactor
- Experienced in running fluidized reactoron a commercial production level
- Have cost advantage by using low-costfine ore
• Build demo plant to test commercialproduction (~2030)
- Government-funded project in placewith steelmakers
• Upgrade & complete technology (~2040)- Secure production technology for high-qualityand high-level of steel product
• Gradually replace facilities (~2050)- Start replacing facilities by step when national level of government-backed green hydrogenand green power infrastructure completes
Develop technology to reducecarbon emission from BF process Develop technology for HyREX
* Hydrogen-based Reduction
* Hot Briquetted Iron
2Q21 Earnings Release │ Jul 22, 2021 12
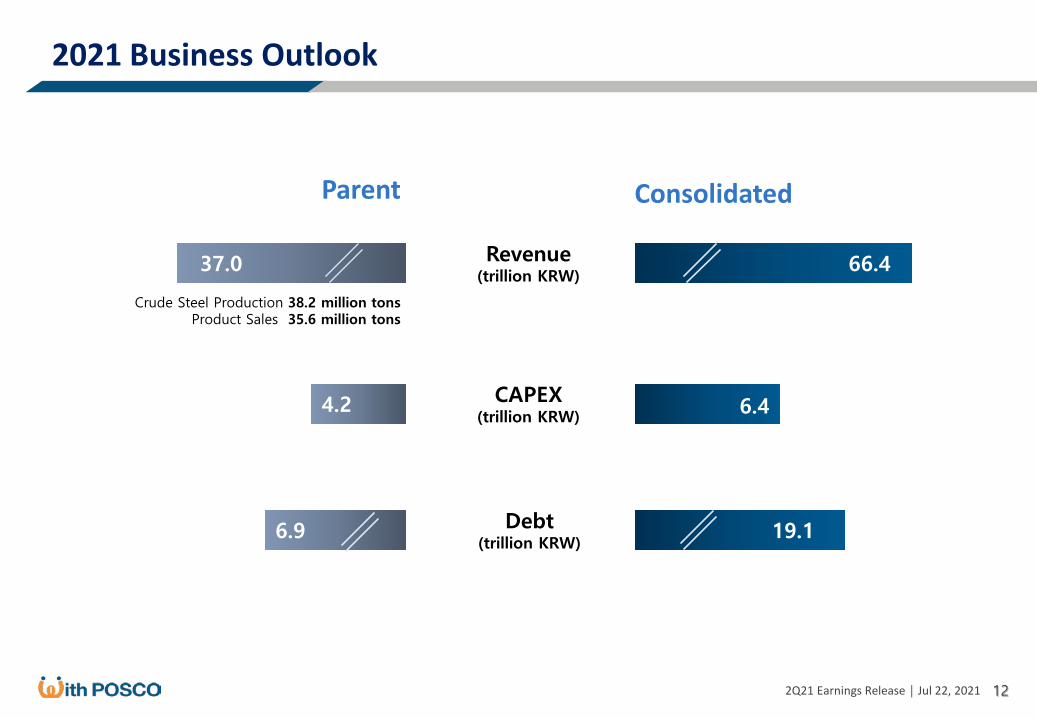
4.2 6.4
19.16.9
37.0 66.4
2021 Business Outlook
Parent Consolidated
CAPEX(trillion KRW)
Revenue(trillion KRW)
Debt(trillion KRW)
Crude Steel Production 38.2 million tonsProduct Sales 35.6 million tons

2Q21 Earnings Release │ Jul 22, 2021
Summarized Financial Statements
Appendix
- Summarized F/S_Parent (IS, BS)
- Summarized F/S_Consolidated (IS, BS)
2Q21 Earnings Release │ Jul 22, 2021 14
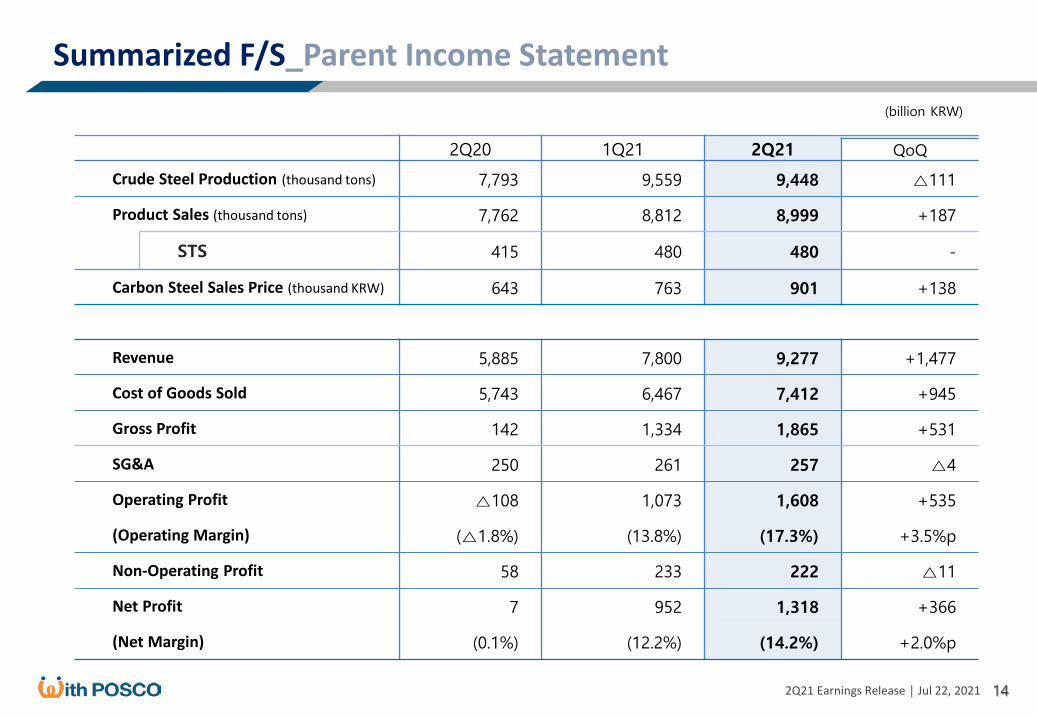
Summarized F/S_Parent Income Statement(billion KRW)
2Q20 1Q21 2Q21 QoQ
Crude Steel Production (thousand tons) 7,793 9,559 9,448 △111
Product Sales (thousand tons) 7,762 8,812 8,999 +187
STS 415 480 480 -
Carbon Steel Sales Price (thousand KRW) 643 763 901 +138
Revenue 5,885 7,800 9,277 +1,477
Cost of Goods Sold 5,743 6,467 7,412 +945
Gross Profit 142 1,334 1,865 +531
SG&A 250 261 257 △4
Operating Profit △108 1,073 1,608 +535
(Operating Margin) (△1.8%) (13.8%) (17.3%) +3.5%p
Non-Operating Profit 58 233 222 △11
Net Profit 7 952 1,318 +366
(Net Margin) (0.1%) (12.2%) (14.2%) +2.0%p

2Q21 Earnings Release │ Jul 22, 2021 15
Summarized F/S_Parent Balance Sheet(billion KRW)
2Q20 1Q21 2Q21 QoQ
Current Assets 20,017 20,398 21,058 +660
Cash Balance* 12,065 10,938 10,371 △567
Accounts Receivable 3,143 4,107 4,920 +813
Inventories 4,216 4,759 5,325 +566
Current Ratio 422.5% 354.5% 393.8% +39.2%p
Non-Current Assets 37,603 37,662 37,943 +281Other Long-term financial assets 1,176 1,190 1,282 +92
PP&E 20,187 20,079 19,931 △148
Total Assets 57,620 58,265 59,001 +736
Liabilities 12,217 12,585 12,198 △387
Current Liabilities 4,738 5,754 5,348 △406
Non-Current Liabilities 7,480 6,831 6,850 +19
Interesting-bearing Debt 8,562 8,452 7,525 △927
Liabilities Ratio 26.9% 27.6% 26.1% △1.5%p
Equity 45,403 45,680 46,803 +1,123
* Cash Balance : Cash and cash equivalents, Short-term financial instruments, Short-term trading securities, Short-term securities, Current portion of held-to-maturity securities

2Q21 Earnings Release │ Jul 22, 2021 16
Summarized F/S_Consolidated Income Statement(billion KRW)
2Q20 1Q21 2Q21 QoQ
Revenue 13,722 16,069 18,293 +2,224
Gross Profit 734 2,138 2,823 +685
(Gross Margin) (5.3%) (13.3%) (15.4%) (+2.1%p)
SG&A 566 585 623 +38
Operating Profit 168 1,552 2,201 +649
(Operating Margin) (1.2%) (9.7%) (12.0%) (+2.3%p)
Non-Operating Profit △1 - 63 +63
Share of Profit(Loss) of Equity-accounted Investees △12 78 188 +110
Finance Income and Costs △21 △71 △54 +17
Foreign Currency Transaction & Translation Gain(Loss) 49 △126 12 +138
Net Profit 105 1,139 1,807 +668
(Net Margin) (0.8%) (7.1%) (9.9%) (+2.8%p)
Profit Attributable to Owners of the Controlling Company 40 1,025 1,664 +639

2Q21 Earnings Release │ Jul 22, 2021 17
Summarized F/S_Consolidated Balance Sheet(billion KRW)
2Q20 1Q21 2Q21 QoQ
Current Assets 37,746 39,442 40,182 +740
Cash Balance* 16,892 17,568 16,683 △885
Accounts Receivable 8,562 8,954 9,422 +468
Inventories 9,744 10,253 11,427 +1,174
Current Ratio 206.7% 215.7% 226.4% +10.7%p
Non-Current Assets 44,366 43,380 43,288 △92
Other Long-term financial assets 1,596 1,711 1,891 +180
PP&E 30,162 29,472 29,334 △138
Total Assets 82,112 82,823 83,470 +647
Liabilities 34,519 33,607 32,614 △993
Current Liabilities 18,266 18,289 17,744 △545
Non-Current Liabilities 16,253 15,318 14,870 △448
Interesting-bearing Debt 24,089 21,625 20,277 △1,348
Liabilities Ratio 72.5% 68.3% 64.1% △4.2%p
Equity 47,593 49,216 50,855 +1,639
Owners of the Controlling Company 44,331 45,262 46,756 +1,494
* Cash Balance : Cash and cash equivalents, Short-term financial instruments, Short-term trading securities, Short-term securities, Current portion of held-to-maturity securities