2020/21 Annual Results
37
2020/21 Annual Results Presentation 2021.06.23
Transcript of 2020/21 Annual Results

2020/21 Annual ResultsPresentation
2021.06.23

Content
2
1 Financial Review
2
3 Outlook
Business Review

3
PART 01
Financial Review
Mr. Vincent LuiExecutive Director and Chief Financial Officer

Unit:RMB million 20/21 19/20 YOY ChangeRevenue* 1,970 1,541 +27.8%Gross profit** 1,292 1,023 +26.3%Operating profit* 2,070 530 +290.6%Operating profit excluding gains of investment segment* 59 -18 N.A
Net profit attributable to owners of the Company 1,811 366 +394.8%
Gross profit margin** 65.6% 66.4% -0.8 pptOperating profit margin* 105.1% 34.4% +70.7 pptsOperating profit margin excluding investment income* 3.0% -1.2% +4.2 ppts
Net profit margin attributable to owners of the Company 91.9% 23.8% +68.1 ppts
Basic earnings per share(RMB cents) 30.88 6.25 +394.1%
Recommended total dividend(RMB cents) 10.77 4.36 +147.0%
Results Highlight4
As at 31 March 2021 Unit:RMB million
*Japan’s business is a non-continuous operation and is not included in this performance**Before provision for/(reversal) of impairment of inventories

Offline E-ComKids wear OtherSales Analysis
As at 31 March 2021 Unit:RMB million
By Channel
1,970 MNSales
% of Sales
By Channel
E-com 19%
Kids wear 6%
Others 3%
Offline 72%YOY 0 ppt
YOY +1 ppt
YOY 0 ppt
YOY -1 ppt
% of Kappa Adults Sales
By Product*
Footwear 20.0%
Accessories 2.1%
Apparel 77.9%YOY +0.1ppt
YOY -0.2ppt
YOY +0.1ppt
*Excluding Kappa Kids and others
YOY +27.6 %
YOY +31.7%
YOY +4.6 %YOY +36.4 %
YOY +27.8%
Sales Analysis5
1,412
370120 68

Segment by products 20/21 19/20 YOY Change
Apparel 71.4% 71.9% -0.5 ppt
Footwear 55.5% 59.4% -3.9 ppts
Accessories 81.5% 80.4% +1.1 ppts
Gross margin of KAPPA Brand 68.4% 69.6% -1.2 ppts
*Before provision for/(reversal) of impairment of inventories, excluding kids wear and others
Gross Margin Analysis*As at 31 March 2021
6

921
156 26
721
151 240
200
400
600
800
1000
Advertising & sellingexpenses
Employee salaries &benefit expenses
Design & productdevelopment
20/21 19/20
Expenses AnalysisAs at 31 March 2021 Unit:RMB million
YOY
27.7%
3.3%8.3%
Sales Proportion 20/21 19/20 YOY Change
Advertising and selling expenses 47% 47% 0 ppt
Employee salaries and benefit expenses 8% 10% -2.0 ppts
Design and product development 1% 2% -1.0 ppt
7

RMB Million YOY End of Sept 2020
Net inventory 370 -16.7%
Balance of trade receivables 174 +14.5%
Balance of trade payables 125 -35.9%
Turnover days End of March 2020
Inventory 194 -54 Days
Trade receivables 27 -3 Days
Trade payables 70 -21 Days
Cash conversion cycle 151 -36 Days
Operating Efficiency AnalysisAs at 31 March 2021
8

Investment Strategy Gains from Investment Segment
Among: Gains on changes in FV of
Financial Instruments
Equity 491 186
PE Funds 750 585
Equity Funds 360 337
Single Equity Investments 327 313
Debts, Bonds and Debt Funds 165 27
Others 2 -
Total 2,095 1,448
Analysis of Investment IncomeAs at 31 March 2021 Unit:RMB million
9

Cash & Investment
RMB10.6Billion
69%15%
Quoted Securities
Cash & Investment Equivalents
Fixed Income
Investments in Financial Assets
Summary of Investment & FundsAs at 31 March 2021
10
Yunfeng Funds, Fosun & CITIC PE Funds etc.Investing in advanced technologies, financial services, new energy, medical and manufacturing, etc.
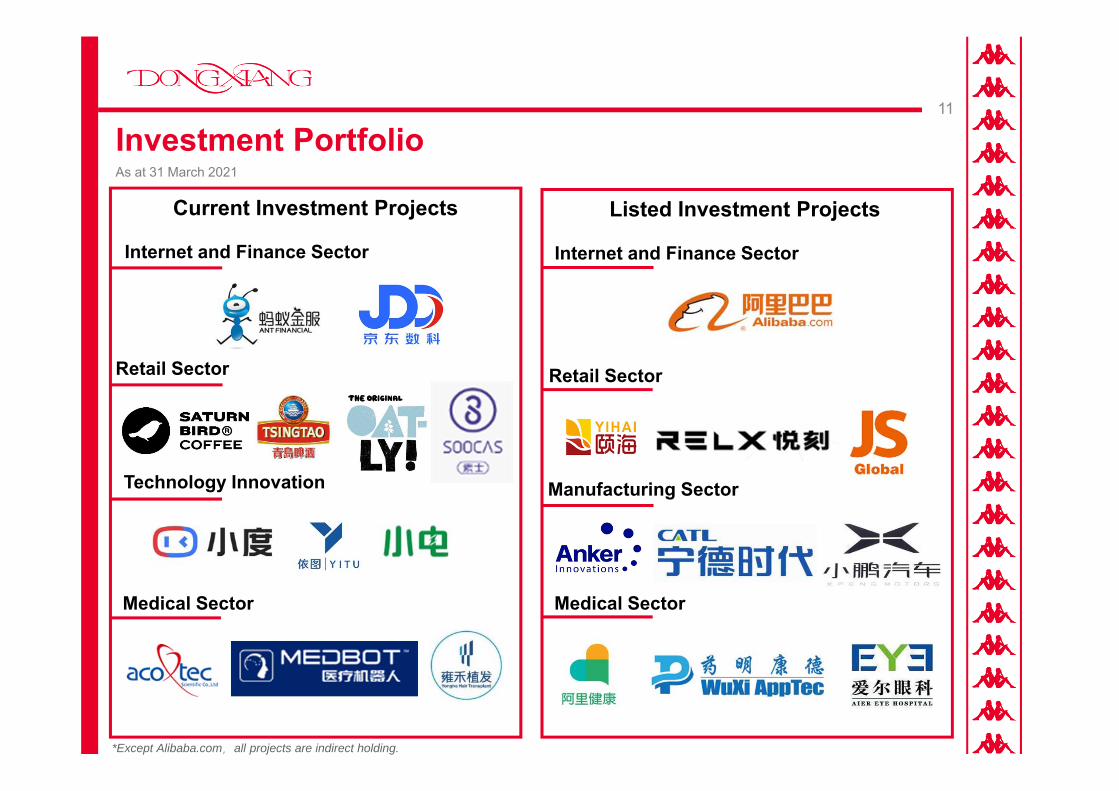
11
Investment PortfolioAs at 31 March 2021
Internet and Finance Sector
Current Investment Projects
Retail Sector
Technology Innovation
Medical Sector
Internet and Finance Sector
Listed Investment Projects
Retail Sector
Manufacturing Sector
Medical Sector
*Except Alibaba.com,all projects are indirect holding.

RMB cents 20/21 19/20 YOY Change
Basic earnings per share 30.88 6.25 +394.1%Recommended total dividend 10.77 4.36 +147.0%Interim dividend per share 5.69 1.61 +253.4%
Recommended final dividend per share 5.08 2.75 +84.7%
Recommended Final DividendAs at 31 March 2021
12

13
Return on InvestmentAs at 31 March 2021 Unit:RMB million
26%
-6% 4% 20%
9%5% 18%
-10%
-5%
0%
5%
10%
15%
20%
25%
30%
-2,000
-
2,000
4,000
6,000
8,000
10,000
12,000
2013 2014 2015 2016 2017 2018* FY2019/20
FY2020/21
Net Investment Profits Net Investment Assets ROI
Average ROI: 11%
*Year 2018 includes 15 months from January 2018 to March 2019To be comparable, the above chart included the fair value change in P&L of the financial assets before 2018 in calculating investment gains

14
Group Dividend History
*Year 2018 includes 15 months from January 2018 to March 2019** Including FY2020/21 Recommended final dividend per share
FY2020/21
Accumulated Profit Attributed to owners was RMB11.2 billion;
Accumulated Dividend Amount was RMB7.7 billion**;
Accumulated Dividend Payout Ratio was 68.8%**。
As at 31 March 2021 Unit:RMB million
54% 70%
70%
154%
70%
70% 70%60%
60%
189%
50%
70%
35%
0%
20%
40%
60%
80%
100%
120%
140%
160%
180%
200%
0
200
400
600
800
1000
1200
1400
1600
1800
2000
2008 2009 2010 2011 2012 2013 2014 2015 2016 2017 2018* 2019 2020
Net Profit Total Dividend Amount Dividend Payout Ratio

15
PART 02
Mr. Jonathan ZhangExecutive Director, CEO and President
Business Review

16
Three-year performance – China sportswear business
Revenue
*Average inventory turnover days increased in 2019 due to the adjustment of business model
Inventory turnover days*
As at 31 March 2021 Unit:RMB million
1,5411,301
1,970
YOY+18%
YOY+28%
208
248
194
+40 Days -54 Days
FY2018 FY2019 FY2020 FY2018 FY2019 FY2020

Adjustment of Business Model
From “Wholesale” to “Direct Business” Model
Highly efficient product turnover on omni-channel
National Logistics Network Coverage Planning
Connect IT system; Unify finance and operation business
Channel adjustedfrom “Wholesale channel” to “Mainstream Platform”
Expand the GMV scale on mainstream platform
Develop new channels
Whole network operation to facilitate overall sales
01
02
17
Offline
Online

18
Q1 Q2 Q3 Q4 Total
Retail PerformanceOfflineE-ComOmni-Channel
YOY change inRetail
PerformanceOffline E-Com Omni-Channel
Q110%-20%
Low TeensDecrease
30%-40%Mid-low Growth
Mid-low Single Digit
Decrease
Q2 Flat 30%-40%Mid-low Growth
Mid Single DigitGrowth
Q3 Mid Single DigitGrowth
20%-30%Mid Growth
10%-20%Low Teens Growth
Q4 70%-80%Low Growth
30%-40%High Growth
60%-70%Mid Growth
Total 10%-20%Low Teens Growth
30%-40%Low Growth
10%-20%Mid Teens Growth
KPIs of Sportswear Business
Q1 Q2 Q3 Q4 Total
Same-Store PerformanceOfflineE-ComOmni-Channel
YOY change inSame-Store
PerformanceOffline E- Com Omni-Channel
Q1 10%-20%Mid-low Decrease
30%-40%Mid-low Growth
Mid Single DigitDecrease
Q2Mid-low Single
DigitDecrease
30%-40%Mid-low Growth
Mid-low Single Digit
Growth
Q3 Low Single DigitDecrease
20%-30%Mid Growth
Mid Single DigitGrowth
Q4 Mid Single DigitGrowth
30%-40%High Growth
High Single DigitGrowth
TotalMid-low
Single DigitDecrease
30%-40%Low Growth
10%-20%Mid Teens Growth
E-Com
Omni-Channel
Offline
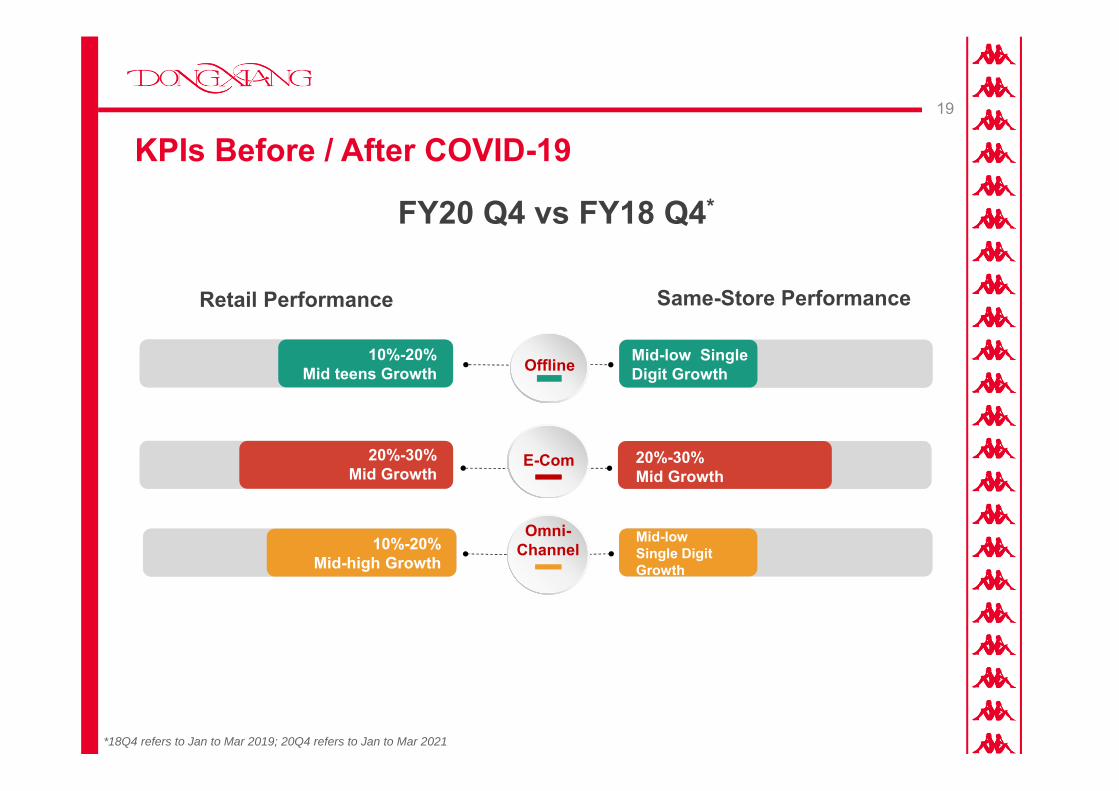
19
*18Q4 refers to Jan to Mar 2019; 20Q4 refers to Jan to Mar 2021
线下10%-20%Mid teens Growth
线下20%-30%Mid Growth
线下10%-20%Mid-high Growth
线下
Mid-low Single Digit Growth
20%-30%Mid Growth
线下
Mid-low Single Digit Growth
FY20 Q4 vs FY18 Q4*
KPIs Before / After COVID-19
Retail Performance Same-Store Performance
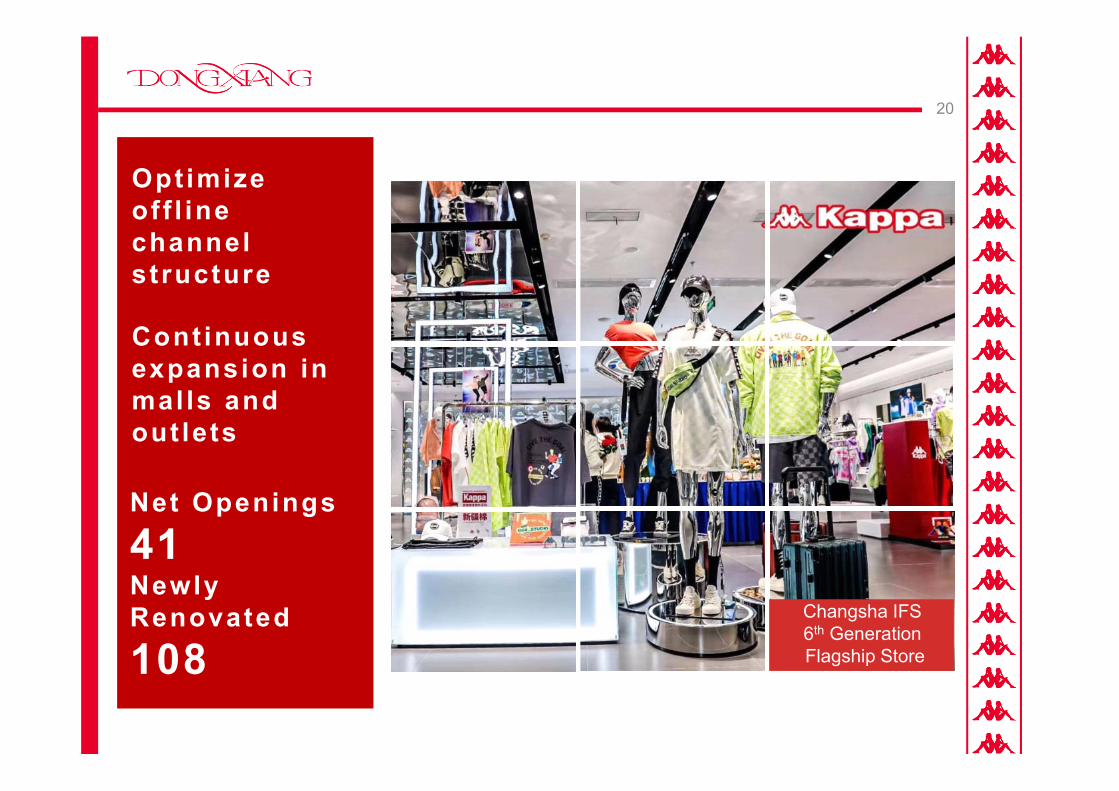
20
Changsha IFS 6th GenerationFlagship Store
Optimize off l ine channel structure
Continuous expansion in mal ls and out lets
Net Openings41Newly Renovated108

FY 19/20 FY 20/21
YOY% of total
Dept. Stores-2%
54 %
YOY% of total
Sports City0%
12%
YOY
No. of Stores+3.6%
*No. of standalone stores decreased by 4% YOY, accounting for 3.8% of total number of stores, which decreased by 0.3ppt YOY
As at 31 March 2021, excluding Kappa Kids
% YOY -4ppts
% YOY -0.4 ppt
Retail Channel Analysis21
652
46*1,129
142
289
637
44*
1,170
142
347
YOY% of total
Mall+20%
30%% YOY +4 ppts
% of OfflineRetail Performance
% Change of Retail Performance
Mall
Dept. Store
Outlet
线下线下线下
17%
51%
28% +6%
-5%
+4%
Of which:
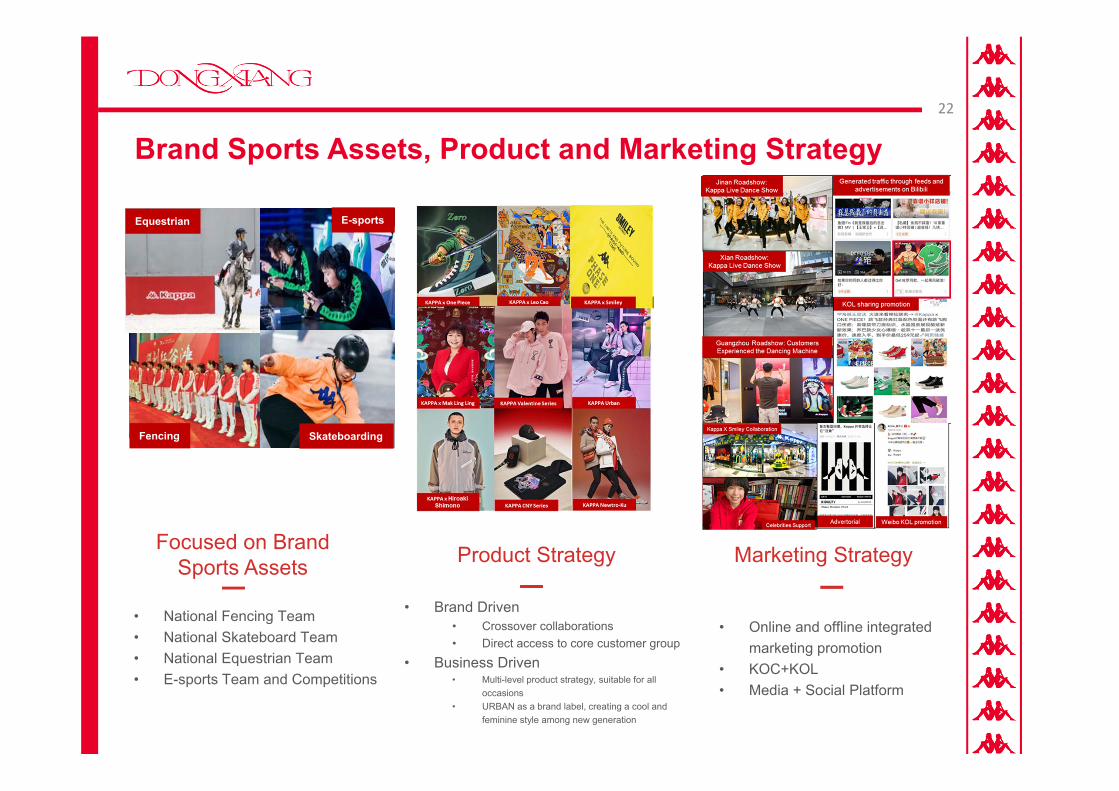
22
Focused on Brand Sports Assets Marketing Strategy
• National Fencing Team• National Skateboard Team• National Equestrian Team• E-sports Team and Competitions
• Online and offline integrated marketing promotion
• KOC+KOL• Media + Social Platform
Brand Sports Assets, Product and Marketing Strategy
Fencing
Equestrian E-sports
Skateboarding
Product Strategy
• Brand Driven• Crossover collaborations• Direct access to core customer group
• Business Driven• Multi-level product strategy, suitable for all
occasions• URBAN as a brand label, creating a cool and
feminine style among new generation

23
Digitalization Omni-Channel Digitalized Operation Plan
Optimized private network tools in order to transfer customer traffic to private network
Fully utilised the advantages of offline store network and customer traffic to enrich the SCRM7.0
Create groups with different natures through WeChat public account, in order to deliver products, events and sales to target customers effectively

Building Infrastructure
IT system
Logistics system
Realized the integration of finance and operation in overall business flow, ensuring the timeliness and the effectiveness of data. Seamless connection of financial and operational data helps reflect the real channel situation
Optimized logistics system nationwide; Completed the national layout planning
Completed both delivery and return systems; Enhanced efficiency in timely channel delivery, boosting overall sales
Reduced costs in overall logistics
24

Operational Highlights on E-commerce platforms
资源红利 BOSS/明星入直
播间
25
…
20/21
Double 11 Overall ↑22%
38 Women’s Day Overall ↑25%
GMV Change YoY (FY2019/20)
Gross Merchandise Volume (GMV) Comparison on E-commerce platform
KOL livestreaming through diversified channels
Optimized online channel structure

26
PART 03
OutlookMr. Jonathan Zhang
Executive Director, CEO and President

27
1. Rapid development in sports industry drives industry growth by multiple factors
Economic and social development stimulated rapid growth in China’s sports industry
Creates great opportunities for China’s sports industry comparing with developed countries
Favorable government policies helps promote industry development: “Opinions on Accelerating the Development of
Sports Industry and Promoting Sports Consumption” estimates that the scale of overall sports industry will reach RMB5
trillion in 2025. Sportswear equipment will be the largest segment in sports industry with an estimated contribution of over
40% in 2025
2. Massive change in Internet, retail and sports industry bring enormous opportunities for sportswear
equipment
Seeing the difficulties in further expanding in traditional ways, many sportswear companies are trying to expand through
cross-field development, though not many of them are successful
Internet technology brings new opportunities
Convenience, Efficiency, Personality, Professionalism, Experience become the key elements in retail industry
3. New opportunities: Position in three dimensions namely, Industry Value Chain, Sports Activities and Depth of
Sports
Rapid Growth in Sports Industry Drives Market ConcentrationMarket concentration significantly increased in local sportswear market, lifting industry barriers

28
Consumption Upgrade Drives Market Segmentation
1. Driven by full industry chain
Before 2013, the growth drivers of sports industry come from sportswear equipment and different products
The current driver is categories of sportswear contributed by consumption upgrade and capital, which helps
promote development of overall industry chain
2. Consumption Upgrade
Increase in consumers’ participation rate of sports drove up the demand for professional sportswear equipment
with functionalities
Accuracy in communications: Popularity of Internet triggered information explosion and fragmentation, facilitating
market communications, which calls for accuracy in consumer communications
Word-of-mouth Marketing:Word-of-mouth marketing and influence of social media become highly effective in
consumers’ decision-marking
Accurate positioning according to the consumers’ depth in playing sports helps achieve more precise product and
service performance
With the increase in per capita GDP and purchasing power, consumers will have more choices of spending in sports activities

Our Vision: To become China’s leading sportswear operator based on digital omni-channel in niche market segments
Simulation of China Dongxiang’s business focus
Simulation of China Dongxiang’s business coveragebased on digital omni-channel
Three-dimensional space assumption of China Dongxiang's business positioningThree-dimensional space assumption of China Dongxiang's business positioning
Dimensions of consumer depth
of sports
Dimensions of industrial
value chain
Running
Sports Training
Sports IP
Badminton
Participatory Sports
Spectator Sports
Sports Facilities
Sports Equipment
Sports Community
Sports Media
Sports Agent
Table
Tennis
Skiing
Yoga
Fencing
Football
Basketball
Diving……
Core Strategies – Brand Positioning – Our Vision29
Dimensions of varieties of
sports

30
核心策略-定位图-KAPPA品牌目标人群TargetConsumers
Generation Z
New white-collar class
Senior middle class
KAPPA

31
01.
02.
03.
Brand Strategies
Further develop our position as a fashionable sportswear brandStrengthen our brand DNA and sporty identity to become a trendsetter
Showcase brand DNA through crossover collaborationsIncrease communication and interaction with consumers
Further develop our brand’s asset portfolio and develop all-rounded resource masterplan
Focus on BrandDNA
Focus on Target Group
Focus on Brand Assets
Product Strategies01.
02.
Focus on Consumer Demand
Strengthen Brand Attributes
03. Upgrade Feminine Products
04. Enrich Subcategories

32
Strengthen sports endorsements; Optimize product structure; Effectively improve terminal efficiencyEstablishing conceptual barriers to sports elements such as fencing, equestrianism and skiing, extending appropriate professional products with sports attributes around the target audience
Chinese Equestrian Team
Chinese Skateboarding Team
Chinese NationalFencing Team E-Sports Ski

ChinaFirst Sport Fashion Show

Beijing SanlitunPop-up Store
The First Global Concept Store
KAPPA AZZURRO

Building a diversified team
Improving product planning and management capabilities as well as product design capabilities
Human Resources35

Core Strategies Highlight
DO 3MCore Strategies
CBDGCore Competitiveness
D ig i ta l ized operat ion
Omni-channel
M id- to-high end income group
Mul t i -brand niche market
Mul t i -product and sport category
Channel control abi l i ty
B rand leadership
D ig i ta l izat ion
G lobal v is ion, local insight
36

37
DisclaimerThis presentation contains certain forward‐looking statements in relation to the Company’s financial conditions, operating results and business. Such forward‐lookingstatements represent the Company’s expectations or beliefs regarding future events and are subject to known or unknown risks and uncertainties. Such risks and factorsmight result in significant difference between actual results, performances or events and the results, performances or events stated or implied in such statements. Certainstatements, such as those including words and expressions such as “potential,” “estimate,” “expect”, “anticipate,” “target”, “intend,” “plan,” “believe,” “project” and similarphrases expressed in different forms, can be regarded as “forward‐looking statements.” Forward‐looking statements are subject to inherent risks and uncertainties. Itshould be noted that a number of factors might result in the actual outcome deviating from conditions expected or implied in the forward‐looking statements and suchdeviation might be significant in some cases. The contents of the forward‐looking statements are accurate as at the date on which such forward‐looking statements aremade, and should not be assumed to have been revised or updated to reflect latest information or subsequent events. Market trends and factors that are expected toaffect the operating results of the Company are set out in the section headed “Financial Review” and other sections.
Website: http://www.dxsport.com Email: [email protected] Tel: +86 (10) 6783 6585 Fax: +86 (10) 6785 6606 Address: 21/F, 2 Jingyuan North
Street, Beijing Economic and Technological Development Zone, Beijing, China
IR ContactFollow our WeChat Accountvia QR Code
Join us to receive more information on Kappa, Kappa Kids and Phenix.
KappaKids Phenix
Kappa
Identify QR Code FollowingDX IR Wechat Official Account
KappaChina