2020...Vitamin D deficiency in Ireland – implications for COVID-19. Results from the Irish...
33
Vitamin D deficiency in Ireland – implications for COVID-19. Results from The Irish Longitudinal Study on Ageing (TILDA) 2020
Transcript of 2020...Vitamin D deficiency in Ireland – implications for COVID-19. Results from the Irish...

Vitamin D deficiency in Ireland – implications for COVID-19.
Results from The Irish Longitudinal Study on Ageing
(TILDA) 20
20


Vitamin D deficiency in Ireland – implications for COVID-19. Results
from the Irish Longitudinal Study on Ageing (TILDA)
Eamon Laird & Rose Anne Kenny
The Irish Longitudinal Study on Ageing
On behalf of the TILDA team
April 2020

Copyright © The Irish Longitudinal Study on Ageing 2020
The Irish Longitudinal Study on AgeingTrinity College DublinDublin 2
Tel: +353 1 896 2509Email: [email protected]: www.tilda.ieISBN: 978-1-907894-30-5https://www.doi.org/10.38018/TildaRe.2020-05

Acknowledgements
We would like to acknowledge the vision and commitment of our study funders, the Department of Health, the Health Research Board, Science Foundation Ireland, The Atlantic Philanthropies, and Irish Life plc. We would like to state that any views expressed in this report are not necessarily those of the Department of Health or of the Minister for Health. We would also like to thank the TILDA participants without whom this research would not be possible.

Contents
1. Introduction .................................................................................................1
2. The TILDA Sample .....................................................................................3
3. Vitamin D Status of Older Adults in Ireland in Winter .................................5
4. Vitamin D Status of Older Adults in Ireland in Summer ............................ 11
5. Vitamin D Status by Obesity and Respiratory Lung Conditions ...............18
6. Discussion ................................................................................................21
7. References ...............................................................................................23
7. Appendix ...................................................................................................25

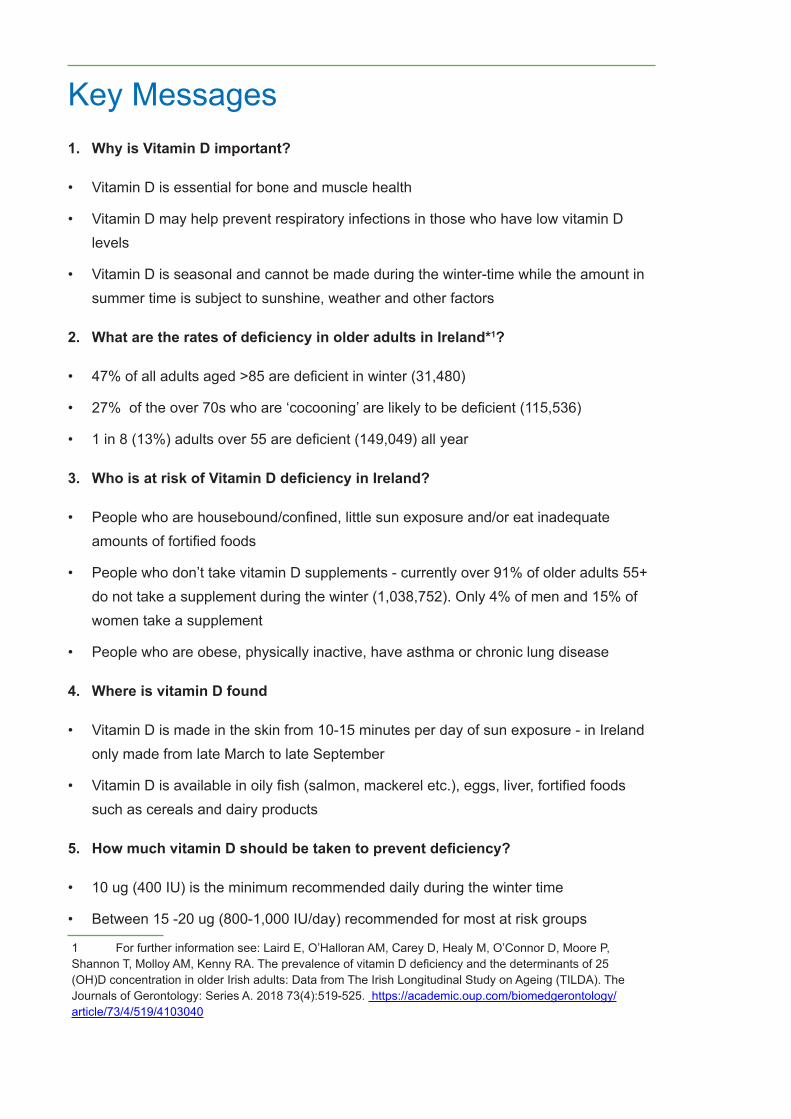
Key Messages1. Why is Vitamin D important?
• Vitamin D is essential for bone and muscle health
• Vitamin D may help prevent respiratory infections in those who have low vitamin D levels
• Vitamin D is seasonal and cannot be made during the winter-time while the amount in summer time is subject to sunshine, weather and other factors
2. What are the rates of deficiency in older adults in Ireland*1?
• 47% of all adults aged >85 are deficient in winter (31,480)
• 27% of the over 70s who are ‘cocooning’ are likely to be deficient (115,536)
• 1 in 8 (13%) adults over 55 are deficient (149,049) all year
3. Who is at risk of Vitamin D deficiency in Ireland?
• People who are housebound/confined, little sun exposure and/or eat inadequate amounts of fortified foods
• People who don’t take vitamin D supplements - currently over 91% of older adults 55+ do not take a supplement during the winter (1,038,752). Only 4% of men and 15% of women take a supplement
• People who are obese, physically inactive, have asthma or chronic lung disease
4. Where is vitamin D found
• Vitamin D is made in the skin from 10-15 minutes per day of sun exposure - in Ireland only made from late March to late September
• Vitamin D is available in oily fish (salmon, mackerel etc.), eggs, liver, fortified foods such as cereals and dairy products
5. How much vitamin D should be taken to prevent deficiency?
• 10 ug (400 IU) is the minimum recommended daily during the winter time
• Between 15 -20 ug (800-1,000 IU/day) recommended for most at risk groups
1 For further information see: Laird E, O’Halloran AM, Carey D, Healy M, O’Connor D, Moore P, Shannon T, Molloy AM, Kenny RA. The prevalence of vitamin D deficiency and the determinants of 25 (OH)D concentration in older Irish adults: Data from The Irish Longitudinal Study on Ageing (TILDA). The Journals of Gerontology: Series A. 2018 73(4):519-525. https://academic.oup.com/biomedgerontology/article/73/4/519/4103040

1
In this report, we aim to describe the importance of vitamin D for immune function, the prevalence of vitamin D deficiency and vitamin D supplement use in Ireland by age group, gender, geographic location and by obesity and lung disease (particularly vulnerable to COVID-19), describe those most at risk of deficiency and the best sources of vitamin D and recommendations to improve status. By compiling this report, we hope the information given can help in the mitigation of the negative health consequences of COVID-19.
Frailty is a dynamic process that changes over time and can be viewed on a continuum. An older person can transition in either direction between the different states of frailty, namely robustness, pre-frailty (an intermediate state) and frailty (9). Robust older people may have some health problems, but in general these problems are being well managed. Older people with pre-frailty are at an increased risk of adverse outcomes but are coping. Individuals living with frailty generally require some support for instrumental and/or basic activities of daily living, have increased susceptibility to infection, take longer to recover from infections and are less likely to recover to previous levels of functional independence. For older adults living with frailty, exposure to a stressor such as infection significantly increases the risk of disability, hospital admission, longer in-patient length of stay, transition to long-term care and death (10). It is highly likely that individuals living with frailty who contract COVID-19 are at greatest risk for admission to hospital, admission to critical and intensive care units and death. Identifying people living with frailty provides an opportunity to prevent this at-risk group from contracting COVID-19 in the community and proactively to develop healthcare service planning and delivery for our medically vulnerable population aged 70+ years (11).
1.1 Vitamin D and immune function
Vitamin D is essential for older adults to help maintain bone and muscle health, plays a key role in the prevention and the treatment of falls and fractures and helps the absorption of calcium from the gut (2). Recent research has also highlighted that it may have an important function within the immune system (3). With increased age, there is a shift in the immune response to a more pro-inflammatory state which may lead to chronic low level inflammation and a slow accumulation of damage, with subsequent progression to chronic disease. This age related pro-inflammatory state is referred to as ‘inflamm-aging’ (4). This can be particularly important in periods of metabolic stress such as infection - the body
1. Introduction
2
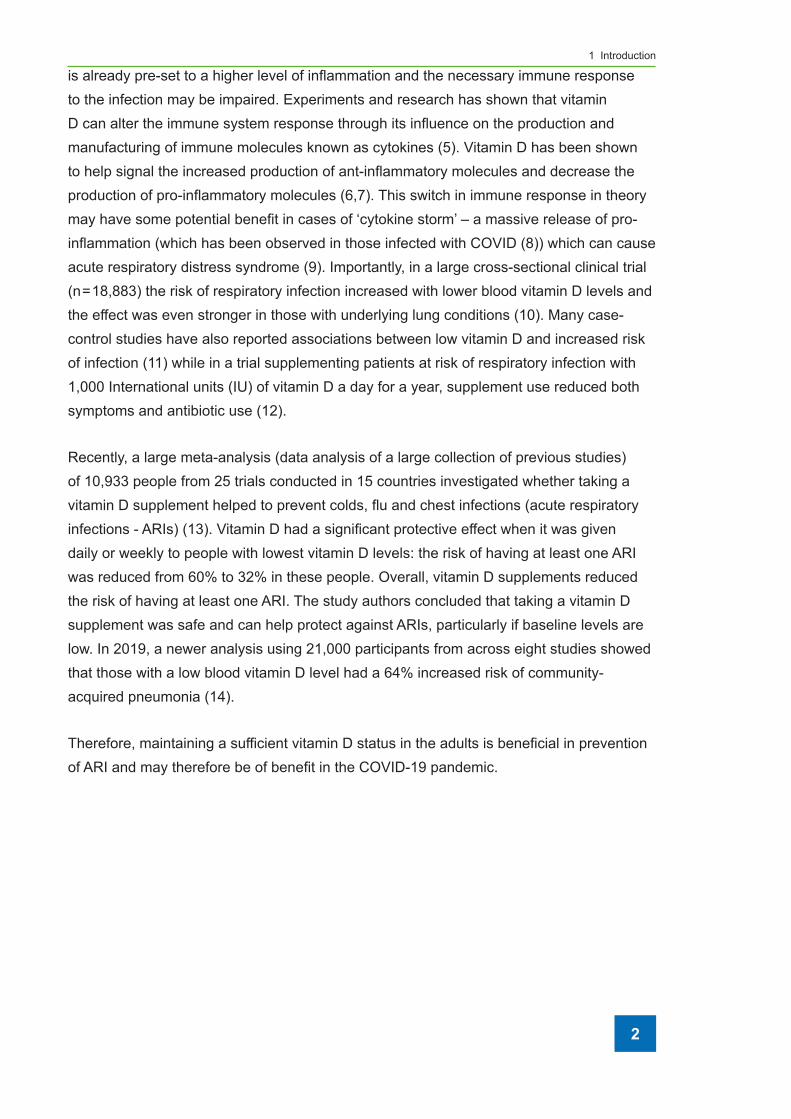
1 Introduction
is already pre-set to a higher level of inflammation and the necessary immune response to the infection may be impaired. Experiments and research has shown that vitamin D can alter the immune system response through its influence on the production and manufacturing of immune molecules known as cytokines (5). Vitamin D has been shown to help signal the increased production of ant-inflammatory molecules and decrease the production of pro-inflammatory molecules (6,7). This switch in immune response in theory may have some potential benefit in cases of ‘cytokine storm’ – a massive release of pro-inflammation (which has been observed in those infected with COVID (8)) which can cause acute respiratory distress syndrome (9). Importantly, in a large cross-sectional clinical trial (n = 18,883) the risk of respiratory infection increased with lower blood vitamin D levels and the effect was even stronger in those with underlying lung conditions (10). Many case-control studies have also reported associations between low vitamin D and increased risk of infection (11) while in a trial supplementing patients at risk of respiratory infection with 1,000 International units (IU) of vitamin D a day for a year, supplement use reduced both symptoms and antibiotic use (12).
Recently, a large meta-analysis (data analysis of a large collection of previous studies) of 10,933 people from 25 trials conducted in 15 countries investigated whether taking a vitamin D supplement helped to prevent colds, flu and chest infections (acute respiratory infections - ARIs) (13). Vitamin D had a significant protective effect when it was given daily or weekly to people with lowest vitamin D levels: the risk of having at least one ARI was reduced from 60% to 32% in these people. Overall, vitamin D supplements reduced the risk of having at least one ARI. The study authors concluded that taking a vitamin D supplement was safe and can help protect against ARIs, particularly if baseline levels are low. In 2019, a newer analysis using 21,000 participants from across eight studies showed that those with a low blood vitamin D level had a 64% increased risk of community-acquired pneumonia (14).
Therefore, maintaining a sufficient vitamin D status in the adults is beneficial in prevention of ARI and may therefore be of benefit in the COVID-19 pandemic.

3
This report uses data collected in Wave 1 of The Irish Longitudinal Study on Ageing (TILDA), a prospective study of 8,172 community-dwelling adults aged 50 years and older in Ireland. Since 2009, TILDA has collected information about the health and social circumstances of older adults using a comprehensive Computer Assisted Personal Interview (CAPI) conducted by interviewers who visited the participants in their own homes. This included detailed questions on socio-demographics, physical, mental and behavioural health. Information recorded included gender, age, habitation (living alone yes/no), currently smoking (yes/no), lung condition (yes/no), province of residence: (Leinster - East, Munster - South and the combined provinces of Ulster/Connacht - West/North) and household housing wealth (measure of economic resource “asset wealth” defined as above or below the average of 278,359 Euros). Medications taken on a daily basis including prescription, non-prescription and vitamin D supplements were also recorded. Self-reported physical activity levels were classified using the International Physical Activity Questionnaire (IPAQ) categories: physically active (minimally or health enhancing physically active) versus physically inactive (inactive or insufficiently active). Obesity was measured as a body mass index (BMI) > 30 kg/m2.
Approximately 72.1% (n = 5,895) of the study population consented to, and participated in, a health assessment. Of those, 91.3% (n = 5,382) provided a blood sample for vitamin D (25-hydroxyvitamin D (25(OH)D) measurement. In this report we use the internationally accepted definitions of vitamin D status: deficient (< 30 nmol/L); insufficient (30 -50 nmol/L) and sufficient (>50 nmol/L). Given that vitamin D is a seasonal vitamin, this had to be accounted for in any analysis of population prevalence. Thus, seasons were defined as winter (December-February), spring (March-May), summer (June-August), and autumn (September-November). Low and high vitamin D periods were defined as winter (with spring) and summer (with autumn), respectively.
2.1 Statistical Methods and Weighting
In this report, all TILDA prevalence estimates are weighted to account for age, sex, educational attainment and urban/rural residence in the 2011 Census (Wave 1 of TILDA collection). Prevalence estimates were also adjusted using modified base weights that accounted for survey non-response, non-attendance at the health assessment component of the study and whether or not respondents provided a blood sample. These weights
2. The TILDA Sample

4
2 The TILDA Sample
and adjustments ensure that these estimates are representative of the whole population aged 50 years and over in Ireland. All of the calculated population estimates are then based on figures collected from the most recent 2016 Census data (which reported a total of 1,446,460 people over 50 living in Ireland. It should be noted that the TILDA sampling frame does not include people with dementia at baseline or people living in nursing homes and as such this data may slightly underestimate prevalence for the total population in Ireland.
In light of the new HSE ‘Guidance on cocooning to protect people over 70 years and those extremely medically vulnerable from COVID-19’ (1) which came into effect from midnight on March 28th 2020, this report will also provide information in relation to vitamin D status in adults aged 70 years and over.
In light of the new HSE ‘Guidance on coccooning to protect people over 70 years and those extremely medically vulnerable from COVID-19’ which came into effect from midnight on March 28th 2020, this report will also provide information in relation to frailty on adults aged 70 and over.

5
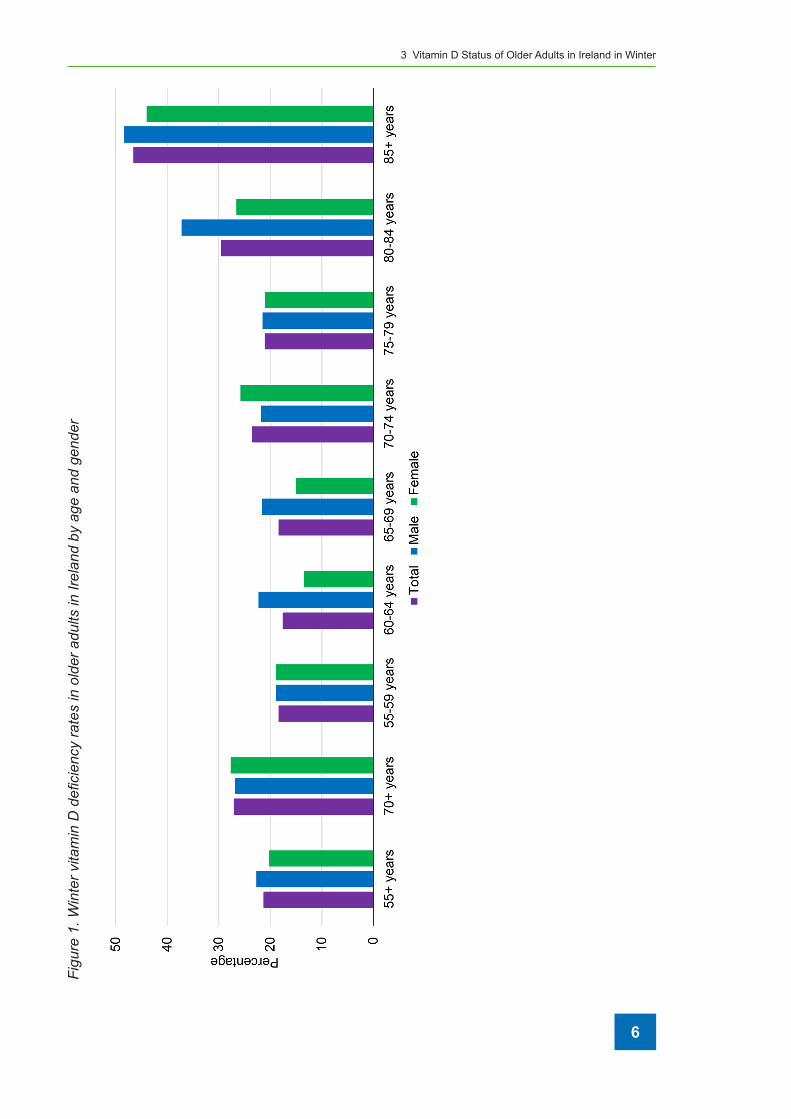
During the winter period, 21.3% (244,209) of adults aged >55 years were vitamin D deficient (Figure 1; Table 2). The highest rates of deficiency were observed for those aged 80-84 years (29.6%; 23,987) and those aged >85 years (46.6%; 31,480). For those aged >70 years, the deficiency rates were 27.1% (115,536). Across all ages, deficiency rates were similar for both men and women though with men tending to have slightly higher deficiency rates overall.
Similar high rates of deficiency were observed when examined by province of residence (Figure 2; Table 3). Again, those aged >85 years had the highest rates of deficiency regardless of province. However, those aged 85+ in the Connacht & Ulster area had the highest deficiency rate (59.5%; 8,738). For those aged >70 years, the Munster region had the highest deficiency rate (31.8%; 39,410) vs the Leinster region (21.4%; 46,231). Overall, Leinster had the lowest rate of deficiency (17.6%; 103,615) compared to those residing in either Munster (25.3%; 83,615) or Connacht & Ulster (24.5%; 55,690).
In winter, only 9.4% (107,773) of those aged 55+ and 11.5% (49,028) of those aged 70+ reported taking a vitamin D supplement (Table 4). A much higher proportion of women (14.6%; 87,181) compared to men (3.8%; 20,877) took a supplement. This sex difference was consistent when examined by age as for instance, in those aged 85+ only 5.6% (1,291) of men vs 17.7% (7,875) of women reported taking a supplement..
3. Vitamin D Status of Older Adults in Ireland in Winter
6
3 Vitamin D Status of Older Adults in Ireland in Winter
Figu
re 1
. Win
ter v
itam
in D
defi
cien
cy ra
tes
in o
lder
adu
lts in
Irel
and
by a
ge a
nd g
ende
r

7
Vitamin D deficiency in Ireland – implications for COVID-19. Results from the Irish Longitudinal Study on Ageing (TILDA)
Tabl
e 2.
Per
cent
pre
vale
nce
of v
itam
in D
sta
tus
(win
ter)
in T
ILD
A (W
ave
1) e
xtra
pola
ted
to C
SO
pop
ulat
ion
estim
ate
data
from
201
6
Win
ter t
ime
TILD
A (%
, Wav
e 1)
CSO
(n, 2
016)
Age
gro
upD
efici
ent
Insu
ffici
ent
Suffi
cien
t D
efici
ent
Insu
ffici
ent
Suffi
cien
t To
tal
Tota
l55
+ ye
ars
21.3
33.2
45.5
244,
209
380,
647
521,
669
1,14
6,52
570
+ ye
ars
27.1
29.7
43.2
115,
536
126,
620
184,
175
426,
331
55-5
9 ye
ars
18.4
38.3
43.3
49,6
9810
3,44
911
6,95
527
0,10
260
-64
year
s17
.633
49.4
42,0
3978
,823
117,
994
238,
856
65-6
9 ye
ars
18.4
34.2
47.4
38,8
6772
,243
100,
126
211,
236
70-7
4 ye
ars
23.5
32.1
44.4
38,1
3452
,089
72,0
4916
2,27
275
-79
year
s21
.130
.748
.224
,363
35,4
4955
,655
115,
467
80-8
4 ye
ars
29.6
34.5
35.9
23,9
8727
,958
29,0
9281
,037
85+
year
s46
.614
.439
31,4
809,
728
26,3
4767
,555
Mal
e
55+
year
s22
.736
.940
.412
4,71
220
2,72
622
1,95
554
9,39
370
+ ye
ars
26.8
35.0
38.2
51,3
0266
,999
73,1
2519
1,42
655
-59
year
s18
.941
40.1
25,2
9954
,882
53,6
7713
3,85
860
-64
year
s22
.337
.340
.426
,470
44,2
7447
,954
118,
698
65-6
9 ye
ars
21.6
34.1
44.3
22,6
7235
,792
46,4
9810
4,96
170
-74
year
s21
.838
.240
17,2
3330
,197
31,6
2079
,051
75-7
9 ye
ars
21.5
31.4
47.1
11,6
3516
,993
25,4
8954
,117
80-8
4 ye
ars
37.2
34.8
2813
,093
12,2
489,
855
35,1
9685
+ ye
ars
48.4
40.9
10.7
11,1
629,
432
2,46
823
,062
Fem
ale
55+
year
s20
.229
.850
120,
621
177,
945
298,
566
597,
132
70+
year
s27
.725
.347
.064
,944
59,3
2711
0,19
423
4,45
555
-59
year
s18
.941
40.1
25,7
5055
,860
54,6
3413
6,24
460
-64
year
s13
.428
.757
.916
,101
34,4
8569
,571
120,
158
65-6
9 ye
ars
1534
.250
.815
,941
36,3
4653
,988
106,
275
70-7
4 ye
ars
25.8
25.3
48.9
21,3
5520
,941
40,4
7582
,771
75-7
9 ye
ars
2129
.849
.212
,884
18,2
8230
,184
61,3
5080
-84
year
s26
.633
.739
.712
,194
15,4
4818
,199
45,8
4185
+ ye
ars
445.
250
.819
,577
2,31
422
,602
44,4
93

8
3 Vitamin D Status of Older Adults in Ireland in Winter
Figu
re 2
. Win
ter v
itam
in D
defi
cien
cy ra
tes
by a
ge a
nd p
rovi
nce
in o
lder
adu
lts in
Irel
and

9
Vitamin D deficiency in Ireland – implications for COVID-19. Results from the Irish Longitudinal Study on Ageing (TILDA)
Tabl
e 3.
Per
cent
pre
vale
nce
of v
itam
in D
sta
tus
(win
ter)
in T
ILD
A (W
ave
1) e
xtra
pola
ted
to C
SO
pop
ulat
ion
estim
ate
data
from
201
6
Win
ter t
ime
TILD
A (%
, Wav
e 1)
CSO
(n, 2
016)
Age
gro
upD
efici
ent
Insu
ffici
ent
Suffi
cien
t D
efici
ent
Insu
ffici
ent
Suffi
cien
t To
tal
Lein
ster
55+
year
s17
.633
.748
.710
3,61
519
8,40
028
6,70
958
8,72
470
+ ye
ars
21.4
2751
.646
,231
58,3
2911
1,47
421
6,03
555
-59
year
s15
.840
.843
.422
,500
58,1
0261
,805
142,
408
60-6
4 ye
ars
15.7
33.9
50.4
19,3
2541
,727
62,0
3712
3,08
965
-69
year
s15
.837
47.2
16,9
3639
,661
50,5
9510
7,19
270
-74
year
s19
.627
.752
.716
,155
22,8
3143
,437
82,4
2475
-79
year
s13
.731
.255
.18,
082
18,4
0532
,503
58,9
9080
-84
year
s17
32.2
50.8
6,93
513
,135
20,7
2340
,793
85+
year
s45
.812
.242
15,4
934,
127
14,2
0833
,828
Mun
ster
55
+ ye
ars
25.3
33.2
41.5
83,6
1510
9,72
413
7,15
533
0,49
370
+ ye
ars
31.8
33.5
34.7
39,4
1041
,517
43,0
0412
3,93
055
-59
year
s20
.734
.145
.215
,774
25,9
8634
,445
76,2
0560
-64
year
s22
.331
.146
.615
,291
22,6
9631
,953
68,5
6965
-69
year
s20
.834
.944
.312
,852
21,5
6427
,373
61,7
8970
-74
year
s21
.540
.737
.810
,229
19,3
6317
,983
47,5
7575
-79
year
s35
.225
.439
.411
,826
8,53
413
,238
33,5
9880
-84
year
s38
.540
.121
.49,
131
9,51
05,
075
23,7
1685
+ ye
ars
40.8
28.5
30.7
7,76
95,
427
5,84
619
,041
Con
nach
t & U
lste
r
55+
year
s24
.532
.642
.955
,690
74,1
0297
,515
227,
308
70+
year
s 33
30.7
36.3
28,5
0126
,514
31,3
5186
,366
55-5
9 ye
ars
21.2
37.9
40.9
10,9
1619
,514
21,0
5951
,489
60-6
4 ye
ars
14.5
34.7
50.8
6,84
416
,378
23,9
7747
,198
65-6
9 ye
ars
21.9
25.4
52.7
9,25
410
,733
22,2
6842
,255
70-7
4 ye
ars
35.8
29.3
34.9
11,5
549,
456
11,2
6332
,273
75-7
9 ye
ars
17.1
38.2
44.7
3,91
28,
740
10,2
2722
,879
80-8
4 ye
ars
36.3
36.7
276,
000
6,06
64,
463
16,5
2885
+ ye
ars
59.5
040
.58,
738
05,
948
14,6
86

10
3 Vitamin D Status of Older Adults in Ireland in Winter
Table 4. Prevalence of vitamin D supplement use (winter) in TILDA (Wave 1) by province extrapolated to CSO population estimate data from 2016
Winter time TILDA (%, Wave 1) CSO (n, 2016)
Age group Yes No Yes No Total
Total
55+ years 9.4 90.6 107,773 1,038,752 1,146,525
70+ years 11.5 88.5 49,028 377,303 426,331
55-59 years 5.6 94.4 15,126 254,976 270,102
60-64 years 9.6 90.4 22,930 215,926 238,856
65-69 years 9.6 90.4 20,279 190,957 211,236
70-74 years 11.5 88.5 18,661 143,611 162,272
75-79 years 13.9 86.1 16,050 99,417 115,467
80-84 years 7.6 92.4 6,159 74,878 81,037
85+ years 13.5 86.5 9,120 58,435 67,555
Male
55+ years 3.8 96.2 20,877 528,516 549,393
70+ years 4.8 95.2 9,188 182,238 191,426
55-59 years 2.2 97.8 2,945 130,913 133,858
60-64 years 4.1 95.9 4,867 113,831 118,698
65-69 years 3.6 96.4 3,779 101,182 104,961
70-74 years 5.4 94.6 4,269 74,782 79,051
75-79 years 5 95 2,706 51,411 54,117
80-84 years 4.6 95.4 1,619 33,577 35,196
85+ years 5.6 94.4 1,291 21,771 23,062
Female
55+ years 14.6 85.4 87,181 509,951 597,132
70+ years 16.7 83.3 39,151 195,284 234,435
55-59 years 9.3 90.7 12,671 123,573 136,244
60-64 years 15.1 84.9 18,144 102,014 120,158
65-69 years 15.3 84.7 16,260 90,015 106,275
70-74 years 17.8 82.2 14,733 68,038 82,771
75-79 years 21.8 78.2 13,374 47,976 61,350
80-84 years 9.2 90.8 4,217 41,624 45,841
85+ years 17.7 82.3 7,875 36,618 44,493

11
During the summer period (optimum period for making vitamin D from sunlight), 8.4% (96,308) of adults aged >55 years were vitamin D deficient (Figure 3; Table 5) while for those aged 70+, the rate of deficiency was 12.1% (51,586). The highest rates of deficiency were observed for those aged 85+ years (30.7%; 20,739). Similar age defined rates were observed for both men and women though with women having slightly higher deficiency rates overall.
Similar rates of deficiency were observed when examined by province of residence (Figure 4; Table 6). Again, those aged >85 years had the highest rates of deficiency regardless of province. However, those aged 85+ in the Connacht & Ulster area had the highest deficiency rate (48.3%; 7,093) followed by Munster area (41.1%; 7,826) and then Leinster (20.7%; 7,002). Overall, Leinster again had the lowest rate of deficiency (6.8%; 40,033) compared to those residing in either Munster (9.5%; 31,397) or Connacht & Ulster (10.0%; 22,731). For those aged 70+, those residing in Munster had a deficiency rate of 15.9% (19,705) vs 10.3% (22,252) in Leinster.
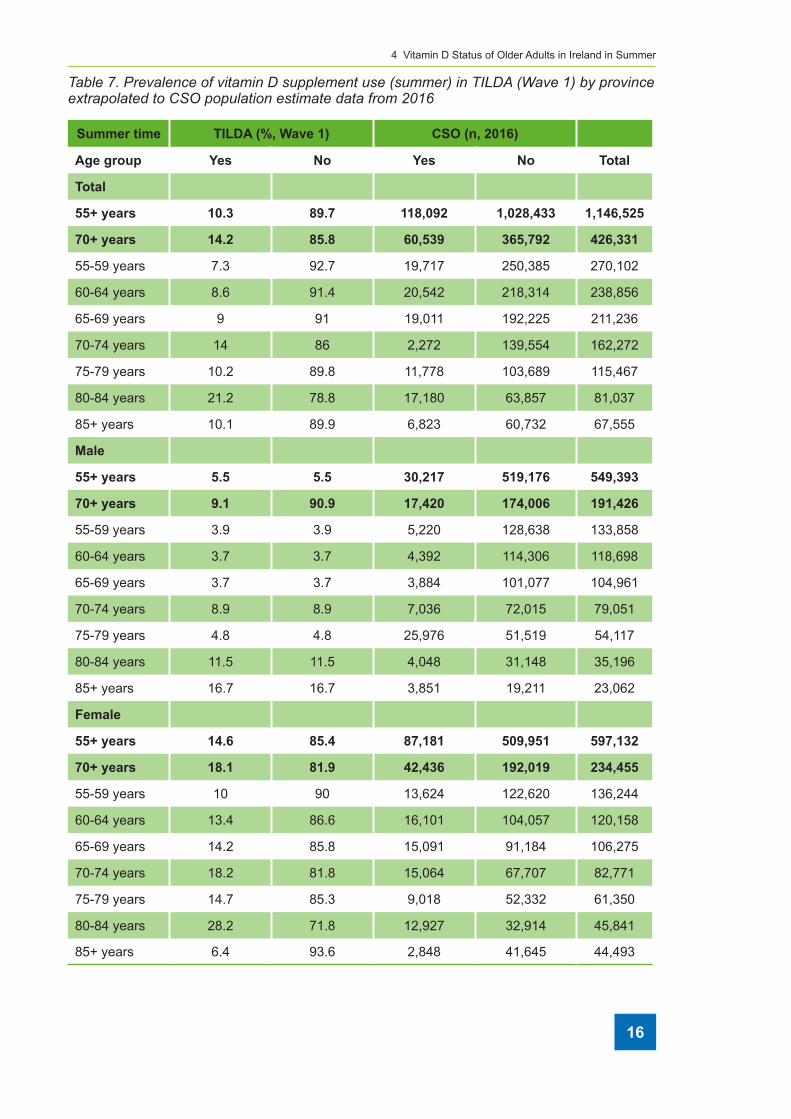
In summer, 10.3% (118,092) of those aged 55+ reported taking a vitamin D supplement (Table 7). Again, a much higher proportion of women (14.6%; 87,181) compared to men (5.5%; 30,217) took a supplement. For those aged 70+, only 14.2% (60,539) took a vitamin D supplement.
4.1 Risk factors for deficiency
The risk factors for vitamin D deficiency are displayed in Figure 5. The largest negative predictors included smoking, geographic location (living in the North and West compared to the East of the country), winter season, physically inactivity, and older age. The largest positive predictor of vitamin D was vitamin D supplement use followed by being female.
4. Vitamin D Status of Older Adults in Ireland in Summer

12
4 Vitamin D Status of Older Adults in Ireland in Summer
Figu
re 3
. Sum
mer
vita
min
D d
efici
ency
rate
s in
old
er a
dults
in Ir
elan
d by
age
and
gen
der

13
Vitamin D deficiency in Ireland – implications for COVID-19. Results from the Irish Longitudinal Study on Ageing (TILDA)
Tabl
e 5.
Per
cent
pre
vale
nce
of v
itam
in D
sta
tus
(sum
mer
) in
TILD
A (W
ave
1) e
xtra
pola
ted
to C
SO
pop
ulat
ion
estim
ate
data
from
201
6
Sum
mer
tim
eTI
LDA
(%, W
ave
1)C
SO (n
, 201
6)A
ge g
roup
Defi
cien
tIn
suffi
cien
t Su
ffici
ent
Defi
cien
tIn
suffi
cien
t Su
ffici
ent
Tota
lTo
tal
55+
year
s8.
427
64.6
96,3
0830
9,56
274
0,65
51,
146,
525
70+
year
s12
.131
.956
51,5
8613
6,00
023
8,74
542
6,33
155
-59
year
s5.
324
70.7
14,3
1564
,824
190,
962
270,
102
60-6
4 ye
ars
7.4
23.8
68.8
17,6
7556
,848
164,
333
238,
856
65-6
9 ye
ars
6.7
26.9
66.4
14,1
5356
,822
140,
261
211,
236
70-7
4 ye
ars
7.5
28.3
64.2
12,1
7045
,923
104,
179
162,
272
75-7
9 ye
ars
829
.762
.39,
237
34,2
9471
,936
115,
467
80-8
4 ye
ars
12.5
36.4
51.1
10,1
3029
,497
41,4
1081
,037
85+
year
s30
.741
.827
.520
,739
28,2
3818
,578
67,5
55M
ale
55
+ ye
ars
6.4
26.4
67.2
35,1
6114
5,04
036
9,19
254
9,39
370
+ ye
ars
9.6
33.6
56.8
18,3
7764
,319
108,
730
191,
426
55-5
9 ye
ars
519
.775
.36,
693
26,3
7010
0,79
513
3,85
860
-64
year
s4
25.7
70.3
4,74
830
,505
83,4
4511
8,69
865
-69
year
s5.
924
.269
.96,
193
25,4
0173
,368
104,
961
70-7
4 ye
ars
5.2
38.2
56.6
4,11
130
,197
44,7
4379
,051
75-7
9 ye
ars
2.6
34.8
62.6
1,40
718
,833
33,8
7754
,117
80-8
4 ye
ars
20.6
35.6
43.8
7,25
012
,530
15,4
1635
,196
85+
year
s12
.456
.631
2,86
013
,053
7,14
923
,062
Fem
ale
55+
year
s10
27.4
62.6
59,7
1316
3,61
437
3,80
559
7,13
270
+ ye
ars
13.9
30.6
55.5
32,5
8971
,743
130,
123
234,
455
55-5
9 ye
ars
519
.775
.36,
812
26,8
4010
2,59
213
6,24
460
-64
year
s10
.821
.667
.612
,977
25,9
5481
,227
120,
158
65-6
9 ye
ars
7.2
29.1
63.7
7,65
230
,926
67,6
9710
6,27
570
-74
year
s9.
729
.860
.58,
029
24,6
6650
,076
82,7
7175
-79
year
s12
.325
.362
.47,
546
15,5
2238
,282
61,3
5080
-84
year
s6.
537
.556
2,98
017
,190
25,6
7145
,841
85+
year
s42
.333
.124
.618
,821
14,7
2710
,945
44,4
93

14
4 Vitamin D Status of Older Adults in Ireland in Summer
Figu
re 4
. Sum
mer
vita
min
D d
efici
ency
rate
s by
age
and
pro
vinc
e in
old
er a
dults
in Ir
elan
d

15
Vitamin D deficiency in Ireland – implications for COVID-19. Results from the Irish Longitudinal Study on Ageing (TILDA)
Tabl
e 6.
Per
cent
pre
vale
nce
of v
itam
in D
sta
tus
(sum
mer
) in
TILD
A (W
ave
1) b
y pr
ovin
ce e
xtra
pola
ted
to C
SO
pop
ulat
ion
estim
ate
data
fro
m 2
016
Sum
mer
tim
eTI
LDA
(%, W
ave
1)C
SO (n
, 201
6)A
ge g
roup
Defi
cien
tIn
suffi
cien
t Su
ffici
ent
Defi
cien
tIn
suffi
cien
t Su
ffici
ent
Tota
lLe
inst
er
55
+ ye
ars
6.8
22.4
70.8
40,0
3313
1,87
441
6,81
758
8,72
470
+ ye
ars
10.3
27.1
62.6
22,2
5258
,545
135,
238
216,
035
55-5
9 ye
ars
3.6
19.2
77.2
5,12
727
,342
109,
939
142,
408
60-6
4 ye
ars
6.4
17.5
76.1
7,87
821
,541
93,6
7112
3,08
965
-69
year
s4.
325
.670
.14,
609
27,4
4175
,142
107,
192
70-7
4 ye
ars
9.6
26.1
64.3
7,91
321
,513
52,9
9982
,424
75-7
9 ye
ars
5.2
2074
.83,
067
11,7
9844
,125
58,9
9080
-84
year
s11
.328
60.7
4,61
011
,422
24,7
6140
,793
85+
year
s20
.746
.432
.97,
002
15,6
9611
,129
33,8
28M
unst
er
55
+ ye
ars
9.5
30.5
6031
,397
100,
800
198,
296
330,
493
70+
year
s 15
.935
.648
.519
,705
44,1
1960
,106
123,
930
55-5
9 ye
ars
5.3
25.8
68.9
4,03
919
,661
52,5
0576
,205
60-6
4 ye
ars
6.1
32.1
61.8
4,18
322
,011
42,3
7668
,569
65-6
9 ye
ars
926
.764
.35,
561
16,4
9839
,730
61,7
8970
-74
year
s8.
728
63.3
4,13
913
,321
30,1
1547
,575
75-7
9 ye
ars
15.4
36.4
48.2
5,17
412
,230
16,1
9433
,598
80-8
4 ye
ars
1544
.440
.63,
557
10,5
309,
629
23,7
1685
+ ye
ars
41.1
34.9
247,
826
6,64
54,
570
19,0
41C
onna
cht &
Uls
ter
55+
year
s10
34.3
55.7
22,7
3177
,967
126,
611
227,
308
70+
year
s 10
.339
.150
.68,
896
33,7
6943
,701
86,3
6655
-59
year
s10
.330
.359
.45,
303
15,6
0130
,584
51,4
8960
-64
year
s11
.432
.755
.95,
381
15,4
3426
,384
47,1
9865
-69
year
s8.
531
.759
.83,
592
13,3
9525
,268
42,2
5570
-74
year
s0
34.2
65.8
011
,037
21,2
3632
,273
75-7
9 ye
ars
3.9
40.7
55.4
892
9,31
212
,675
22,8
7980
-84
year
s11
.842
.146
.11,
950
6,95
87,
619
16,5
2885
+ ye
ars
48.3
34.4
17.3
7,09
35,
052
2,54
114
,686
16
4 Vitamin D Status of Older Adults in Ireland in Summer
Table 7. Prevalence of vitamin D supplement use (summer) in TILDA (Wave 1) by province extrapolated to CSO population estimate data from 2016
Summer time TILDA (%, Wave 1) CSO (n, 2016)
Age group Yes No Yes No Total
Total
55+ years 10.3 89.7 118,092 1,028,433 1,146,525
70+ years 14.2 85.8 60,539 365,792 426,331
55-59 years 7.3 92.7 19,717 250,385 270,102
60-64 years 8.6 91.4 20,542 218,314 238,856
65-69 years 9 91 19,011 192,225 211,236
70-74 years 14 86 2,272 139,554 162,272
75-79 years 10.2 89.8 11,778 103,689 115,467
80-84 years 21.2 78.8 17,180 63,857 81,037
85+ years 10.1 89.9 6,823 60,732 67,555
Male
55+ years 5.5 5.5 30,217 519,176 549,393
70+ years 9.1 90.9 17,420 174,006 191,426
55-59 years 3.9 3.9 5,220 128,638 133,858
60-64 years 3.7 3.7 4,392 114,306 118,698
65-69 years 3.7 3.7 3,884 101,077 104,961
70-74 years 8.9 8.9 7,036 72,015 79,051
75-79 years 4.8 4.8 25,976 51,519 54,117
80-84 years 11.5 11.5 4,048 31,148 35,196
85+ years 16.7 16.7 3,851 19,211 23,062
Female
55+ years 14.6 85.4 87,181 509,951 597,132
70+ years 18.1 81.9 42,436 192,019 234,455
55-59 years 10 90 13,624 122,620 136,244
60-64 years 13.4 86.6 16,101 104,057 120,158
65-69 years 14.2 85.8 15,091 91,184 106,275
70-74 years 18.2 81.8 15,064 67,707 82,771
75-79 years 14.7 85.3 9,018 52,332 61,350
80-84 years 28.2 71.8 12,927 32,914 45,841
85+ years 6.4 93.6 2,848 41,645 44,493

17
Vitamin D deficiency in Ireland – implications for COVID-19. Results from the Irish Longitudinal Study on Ageing (TILDA)
Figure 5. Factors which can influence blood vitamin D levels in older Irish adults

18
Overall, obese older adults had much higher rates of vitamin D deficiency both in winter and summer (Figures 6-7). During winter, rates of vitamin D deficiency in the obese were 27.3% for those aged 55+ and 35.3% for those aged 70+ compared to 20.8% and 27.0% respectively for those not obese. Similar trends were also observed during summer.
In those reporting chronic lung disease (such as chronic bronchitis or emphysema), the prevalence of vitamin D deficiency was significantly higher than those not reporting disease across the age groups both in winter and summer (Figures 8-9). For instance in those aged >55 years, the prevalence in winter of deficiency was 33.8% in those with lung conditions vs 22.7% with no conditions. Similar trends were observed in 70+ age group where rates were 32 vs 29.9% in winter and 16.9 vs 12.3% in summer
5.Vitamin D status by obesity and respiratory lung conditions

19
Vitamin D deficiency in Ireland – implications for COVID-19. Results from the Irish Longitudinal Study on Ageing (TILDA)
Figu
re 6
. Vita
min
D d
efici
ency
in o
lder
adu
lts in
Irel
and
with
obe
sity
by
age
(win
ter)
Figu
re 7
. Vita
min
D d
efici
ency
in o
lder
adu
lts in
Irel
and
with
obe
sity
by
age
(sum
mer
)

20
4 Vitamin D Status of Older Adults in Ireland in Summer
Figu
re 7
. Vita
min
D d
efici
ency
in o
lder
adu
lts in
Irel
and
with
lung
con
ditio
ns (w
inte
r) b
y ag
e
Figu
re 7
. Vita
min
D d
efici
ency
in o
lder
adu
lts in
Irel
and
with
lung
con
ditio
ns (s
umm
er) b
y ag
e

21
This report demonstrates that of those aged 55+ years in Rep. of Ireland, 1 in 5 are vitamin D deficient during the winter and 1 in 12 during the summer. Of particular concern is that nearly 30% of those aged 70+ and 47% of those aged 85+ are deficient in vitamin D. These are the age groups who are considered to be ‘extremely medically vulnerable’ to the adverse health outcomes of COVID-19 and have been advised to participate in ‘cocooning’ during the COVID-19 public health emergency. Of extra concern is the fact that only 10.5% of those aged 70+ actually report taking a vitamin D supplement – because of ‘cocooning’ many may now lack the opportunity for sun exposure and given the low use of supplements, many of this vulnerable group could be at very high risk of deficiency. This of key importance given the usefulness of vitamin D for immune function particularly at this time.
Of particular concern we have observed very high levels of vitamin D deficiency in those who are obese and those with pre-existing lung conditions both of which have been observed to make individuals particularly vulnerable to COVID-19 and complications from the virus (15,16).
Ireland does not have any formal vitamin D food policy – we practice a voluntary but not mandatory food fortification policy where food manufacturers can decide to fortify (or not) their food products with vitamin D. The vitamin D status of those in Ireland is lower than either the United States or Canada who have systematic (mass) vitamin D food fortification. However, vitamin D deficiency is not inevitable in older adults in Ireland and the ability to have sufficient vitamin D status year round is an achievable goal that many countries meet. For example, another European country - Finland (which is at a much higher latitude and therefore receives less sunshine than Ireland) has virtually eliminated vitamin D deficiency in its population with rates <1% (17). This is due in part to a successful food fortification and vitamin D supplement policy and educating the public and medical practitioners on the importance of vitamin D. This vitamin D success story demonstrates what could be achieved in Ireland.
6. Discussion

22
4 Vitamin D Status of Older Adults in Ireland in Summer
Here we outline the main sources of vitamin D and what are the intake recommendations
Vitamin D sources
There are three main sources of vitamin D – sunlight, food and supplements. Due to Ireland’s far latitude geographic location, vitamin D synthesis by sunlight is only during the months of late March to late September. This is 10-15 minutes exposure to sunlight (before application with sun-protection at a time period between 12-4 pm). However, even during the summer, the amount of vitamin D that can be made is affected by cloud cover, use of skin creams, clothing, obesity and age (18). Foods rich in this micronutrient include oily fish (tinned or fresh salmon, mackerel etc.), egg yolks, liver and vitamin D fortified foods such as cereals and dairy products (Appendix 1). Regular consumption of vitamin D rich foods is recommended to help prevent deficiency, particularly in the winter months and those not exposed to sunshine in the summer time.
Vitamin D Intake recommendations
During the winter-period at least 10 ug/day (400 IU) from the diet is required (due to the lack of sunlight for vitamin D synthesis). Recent data has shown that the average intakes from diet are significantly below this level and therefore a 10 ug (400 IU) vitamin D supplement maybe be required during the winter. For those who are housebound (due to illness or quarantine for an extended period) an upper supplement of 15-20 ug/day (600-800 IU) maybe required due to the lack of sunshine exposure. In persons over 70 years, 20-25 ug/day (800-100IU) is recommended.
6.1 Conclusion
Our people aged 70 and over are the fabric of our society (19) and we must use all available tools to facilitate the reduction and transmission of COVD-19. Vitamin D is a potent immune modifying micronutrient and if vitamin D status is sufficient, it could benefit vulnerable adults in particular those 70+ years and older who are ‘cocooning’ during the COVID-19 outbreak.

23
7. References
1. Guidance on cocooning to protect people over 70 years and those extremely medically vulnerable from COVID-19. Health Service Executive (HSE), Republic of Ireland. 27 March 2020. https://www.hpsc.ie/az/respiratory/coronavirus/novelcoronavirus/guidance/vulnerablegroupsguidance/COVID-19%20Guidance%20for%20extremely%20medically%20vulnerable%20V1.pdf
2. Committee to Review Dietary Reference Intakes for Vitamin D and Calcium, Institute of Medicine. Dietary Reference Intakes for Calcium and Vitamin D. Washington, DC: The National Academies Press; 2011.
3. Vanherwegen AS, Gysemans C, Mathieu. Regulation of immune function by vitamin D and its use in diseases of immunity. Endocrinol Metab Clin. 2017;46:1061-1094.
4. Ferrucci L, Fabbri E. Inflammageing: chronic inflammation in ageing, cardiovascular disease, and frailty. Nat Rev Cardiol. 2018; 15(9):505-522.
5. Di Rosa M, Malaguarnera M, Nicoletti F, Malaguarnera L. Vitamin D3: a helpful immuno-modulator. Immunology. 2011;134:123-139.
6. Laird E, McNulty H, Ward M, Hoey L, McSorley E, Wallace JM, et al. Vitamin D deficiency is associated with inflammation in older Irish adults. J Clin Endocrinol Metab. 2014;99(5):1807-1815.
7. Sloka S, Silva C, Wang J, Yong VW. Predominance of Th2 polarization by vitamin D through a STAT6-dependent mechanism. J Neuroinflammation. 2011;8(1):56.
8. Huang C, Wang Y, Li X, Ren L, Zhao J, Hu Y, et al. Clinical features of patients infected with 2019 novel coronavirus in Wuhan, China. The Lancet. 2020;395(10223):497-506
9. Xu Z, Shi L, Wang Y, Zhang J, Huang L, Zhang C, et al. Pathological findings of COVID-19 associated with acute respiratory distress syndrome. The Lancet respiratory medicine. 2020 Feb 18.
24
4 Vitamin D Status of Older Adults in Ireland in Summer
10. Ginde AA, Mansbach JM, Camargo CA. Association between serum 25-hydroxyvitamin D level and upper respiratory tract infection in the Third National Health and Nutrition Examination Survey. Arch Intern Med. 2009;169:384–390.
11. Jolliffe DA, Griffiths CJ, Martineau AR. Vitamin D in the prevention of acute respiratory infection: Systematic review of clinical studies. J Steroid Biochem Mol Biol. 2013;136:321-329.
12. Bergman P, Norlin AC, Hansen S, Rekha RS, Agerberth B, Björkhem-Bergman L, et al. Vitamin D3 supplementation in patients with frequent respiratory tract infections: a randomised and double-blind intervention study. BMJ Open. 2012;2(6):e001663.
13. Martineau AR, Jolliffe DA, Hooper RL, Greenberg L, Aloia JF, Bergman P, et al. Vitamin D supplementation to prevent acute respiratory tract infections: systematic review and meta-analysis of individual participant data. BMJ. 2017;356:i6583.
14. Zhou YF, Luo BA, Qin LL. The association between vitamin D deficiency and community-acquired pneumonia: A meta-analysis of observational studies. Medicine (Baltimore). 2019;98:e17252.
15. Jia X, Yin C, Lu S, Chen Y, Liu Q, Bai J, Lu Y. Two Things about COVID-19 Might Need Attention. Preprints. 2020, 2020020315 (doi: 10.20944/preprints202002.0315.v1)
16. Thornton J. Don’t forget chronic lung and immune conditions during covid-19, says WHO. BMJ. 2020;368:m1192
17. Jääskeläinen T, Itkonen ST, Lundqvist A, Erkkola M, Koskela T, Lakkala K, et l. The positive impact of general vitamin D food fortification policy on vitamin D status in a representative adult Finnish population: evidence from an 11-y follow-up based on standardized 25-hydroxyvitamin D data. AJCN. 2017;105(6):1512-20
18. Laird E, Ward M, McSorley E, Strain JJ, Wallace J. Vitamin D and bone health; Potential mechanisms. Nutrients. 2010;2(7):693-724.
19. McGarrigle CA, Ward M, Scarlett S, Kenny RA. (2020) THE CONTRIBUTIONS OF THE OVER 70S TO IRISH SOCIETY: RESULTS FROM WAVE 5 OF THE IRISH LONGITUDINAL STUDY ON AGEING. https://www.doi.org/10.38018/TildaRe.2020-01

25
Appendix Table 1. Common dietary sources of vitamin D
Dietary source Quantity Vitamin D (µg)* Vitamin D (IU)
Egg 1 egg 1.6 64
Liver (lamb) 100g 0.9 36
Kidney (Lamb) 100g 0.6 24
Salmon 140g 10.2 408
Mackerel 140g 11.9 476
Sardines (canned in oil) 100g 5 200
Fortified milks 200ml (glass) 4 160
Fortified cereals 35g 2.94 117.6
*10ug or 400 IU per day suggested requirements
Appendix Table 2. Factors that can influence vitamin D status
Reason Notes
1 Geographic location Far latitude countries most at risk
2 Season (Winter vs Summer) Majority of vitamin D is made in Summer
3 Low sun exposure Due to sun-cream, clothing or skin pigmentation
4 Age Older age, infants and pregnant women at risk
5 Obesity BMI >25 kg/m2 at risk
6 Smoking Sustainably increased risk of deficiency
7 Poverty Can result in low sun exposure (holidays) or poor diet
8 Poor diet Low intakes of oily fish, eggs, fortified foods
9 Malabsorption syndromes This can include Coeliac, Crohn’s etc.
10 Genetic conditions Can result in lower blood vitamin D
7. Appendix