2020 Poll: August 2018 - millwardbrown.com · The Economic Boom doesn’t disguise fears of...
27
2020 Poll: August 2018 for Publication on 19th August 2018 Paul Moran 19 th August 2018 41111511
Transcript of 2020 Poll: August 2018 - millwardbrown.com · The Economic Boom doesn’t disguise fears of...

2020 Poll: August 2018
for Publication on 19th August 2018
Paul Moran
19th August 2018
41111511

2
Introduction
The survey results presented here are derived from The Independent Newspaper Group/
Kantar Millward Brown Consumer Sentiment Poll. The poll was conducted among a sample of
875 adults representative of the approximate 3.57 million adults aged 18 and over - interviewed
on a face-to-face basis in-home at 64 sampling points throughout the Republic of Ireland. The
margin of error for this opinion poll is +/- 3.3%
The 875 interviews on the poll were carried out between 23rd July – 6th August 2018.
The poll was conducted in accordance with the guidelines set by ESOMAR and AIMRO (European and Irish Market and
Opinion Research governing bodies). Extracts from the report may be quoted or published on condition that due
acknowledgement is given to Kantar Millward Brown and The Sunday Independent.
© Kantar Millward Brown & The Sunday Independent 2018.
POLL

3
Introduction
This Kantar Millward Brown
Consumer Sentiment Opinion Poll was
conducted on behalf of The Sunday
Independent to be published on 19th
August and 26th August 2018.
The topics covered in this report include –
Consumer Sentiment, Personal Financial
Circumstances, how we feel about
ourselves,personal spending patterns and
attitudes towards perceived levels of
service and value received in Ireland
today.
Interviews were conducted face-to-face, in-home, with those aged 18+.
Quota controls were set on gender, age, social class and region to
mirror the 18+ population profile.
875 interviews were conducted at 64 sampling points nationwide.
Interviews were carried out between 23rd July – 6th August 2018.
Data was weighted to reflect the adult population aged 18+.
The margin of error for this opinion poll is +/- 3.3%.

The Results

5
The Economic Boom doesn’t disguise fears of Downturn
It is rather apt that today marks the zenith of a fantastic season of the showcase that is hurling. When it ends, we will all feel a little bit
deflated, as we look into the impending autumnal months, not with trepidation, but rather with a sense of looking back to what we
have seen. It is, in some respects, parallel to what we have found in our latest findings in the Sunday Independent/Kantar Millward
Brown Consumer Sentiment Opinion Poll.
As a nation, we appreciate how the economy is going, but we are beginning to have some reservations. We are becoming a little bit
more cautious in our outlook towards the future. This poll also illuminates the stark regional divide between the Haves and the Have
Nots.
First off, the headline figures. Over one in three of us (36pc) feel that we are better off than we were a year ago, compared to one in
five feeling more negatively. No change there so, compared to the last comparable poll in April 2017. Similarly, 35pc of us feel that we
will be better off this time next year. Again, no real change. Of course context is key. When we last asked this question, there was an
exuberance within the psyche of the nation. Now it has stalled, albeit still at impressively positive heights.
However, there is an undercurrent of cautiousness beneath the waves – there seems to be a nagging sense of doubt abound.
There are notable demographic rifts on this small island. Dubliners and younger people are notably more optimistic about the next
twelve months – Metropolitans are hugely more cheerful about their financial heartiness in the year ahead (over half, 52pc feel they
will be better off), with those under the age of 45 also buoyant in their outlook. Bear in mind however, that this poll seeks to
understand a feeling of financial well-being, but not quantify the value of it.

6
The Economic Boom doesn’t disguise fears of Downturn (Cont’d)
Of course, one only has to look around the capital where every available footprint of land now seems to have a crane towering over it
to understand this enthusiasm. Those in Leinster are also relatively positive (three in ten feel the future is bright). Once you step
outside the pale the feeling, whilst positive, is more muted. This regional imbalance will vex rural legislators, but more importantly,
their constituents.
In terms of where do we think we are going, two in three of us feel that the country is going in the right direction (significantly up from
52pc to 66pc), versus just one in five feeling we are on the wrong track (compared to 29pc last year). Again it is Dubliners and those
from the professional classes (ABs) who are most expectant.
In judging the mood of the nation, from a battery of five positive and five negative words, we are generally upbeat – 26pc feel they are
happy, and 23pc feel optimistic. The net effect is that three in four of us express positive sentiments.
So why the doubts? It is instructive to note that the proportion of those who think the economy will improve over the next 12 months
is down significantly from 38pc to 30pc. It could be argued that this is a simply pragmatic vista, and that things can’t continue to rise
forever.
As such, we are not being overly flaithúlach. We feel that we are receiving worse value for money in some sectors of the economy,
notably the hospitality industry (Hotels and restaurants), although service levels are holding up. In light of the ongoing debate over
VAT rates in this sector, it is a timely reminder to all sides of the debate.
We are becoming more prudent in our discretionary spending – Just one in seven (14pc) say they are spending more on smaller
treats, compared to 19pc eighteen months ago. Instead, we are tending to hold the line; over half (52pc) remain unchanged in their
behaviour (up eight points from 44pc).

7
The Economic Boom doesn’t disguise fears of Downturn (Cont’d)
The most pertinent indicator of our financial wariness is when we ask about the future spending intentions. Across the board, the
public is retrenching in terms of their future spending habits. Most are intending not to change their outgoings over the next twelve
months, be it on bigger ticket expenditures such as household renovations, foreign and domestic holidays, or more fleeting/impulse
buys, such as restaurants, confectionary, pubs etc. Similarly, the proportion of those not intending (or able) to invest more in Savings
or Investments has increased sharply.
It paints a picture of a nation what recognises that these are relatively good times, but also are paying heed to the more negative
mood music – Mortgage rates being among the highest in the EU (at a time of record low levels from the ECB), rents at all-time highs,
homelessness and a faltering public service (health service in particular). When economically things turn sour, which they invariably
will at some stage, we seem to have learned some mistakes from the past; we are unwillingly to push the boat out too far.
It seems as if we are trudging along, neither happy or unhappy with our lot, but rather just getting on with it. We appreciate the status
quo, and the relative state of our financial platform, but are unwilling or fearful to over-indulge. It may well also be the case that the
continuing chattering about the rude health of the nation’s economic well-being is an alien place to many; between increased taxation,
and minimal pay rises for some, there is a disconnect.
From a political point of view, this will have implications. If the electorate has doubts in the middle of a “boom”, there is much to
ponder in terms of electoral strategy if things start going south. Between Brexit, Trump and other external shocks, this should weigh
heavily on the mind of all. In essence, as Fine Gael learnt at the last election, the economy is not necessarily a saviour – any
campaign could be fought on different terms; back to the ground hurling as it were.

2020 Poll:The Economy and our Personal
Financial Situation

9
Q. Taking everything into consideration would you say you are personally better off, worse off or in the
same situation as you were THIS TIME LAST YEAR?
Q. This time NEXT YEAR, do you think that you personally will be better off, worse off or in the same
situation as you are now?
Our Personal Financial Situation: Consumer sentiment towards the future remains firmly in positive
territory, although there has been some softening of future optimism compared to last year
Base: All Aged 18+ (875)
( ) = April 2017 Results
36 35
4441
2018
* 5
Comparedto last year
%
This timenext year?
%
Aug2017
(+16) (+17)
*= Better off minus worse off
Aug2019
Better off(36)
Same(43)
Don’t know(2)
Net difference(+16)
Worse off(20)
Worse off(15)
Better off(36)
Same(41)
Don’t know(8)
Net difference(+21)

10
Historical Picture: Personal Situation Compared To This Time Last Year. Trended over time
17
2724
27
11
5 6 710
4 47 6 8 8
12 13 1116 16 16 17 16
23
36 36
49
59 60
46
4329
34 33 3227
3329 31 32
2731
4340 39
48 4853 52 54
43 44
34
15 16
27
46
66
59 6057
68
61 63 6459
64
57
41 43
4035 33
28 30
21
20 20
0
10
20
30
40
50
60
70
80
90
100
Pre CelticTiger '92
Mid CelticTiger '97
Post 9/11'02
Sep '08 Jan '09 Apr '09 Sep '09 Mar '10 Sep '10 Jan '11 Mar '11 Sep '11 Jan '12 Jul'12 Mar '13 Oct '13 Jul '14 Dec '14 July '15 Oct/Nov'15
Feb '16 Jun '16 Oct '16 Feb '17 Apr '17 Aug '18
Better Off Same Worse Off
Compared To Last Year
NET DIFFERENCE -17 +12 +8 +0 -35 -61 -53 -53 -47 -64 -57 -56 -58 -51 -56 -45 -28 -32 -24 -19 -17 -11 -14 +2 +16 +16
Base: All Aged 18+ (875)
Q. This time next year, do you think that you personally will be better off, worse off or in the same
situation as you are now?

11
Historical Picture: Personal Situation This Time Next Year. Trended over time
Q. This time next year, do you think that you personally will be better off, worse off or in the same
situation as you are now?
36
28 2622
2529 29 30
3329 31
26
32
16 1518 17 17
11 13 12 1013
10 1114
17 1815
19 2023 22 20
27
36 35
54
62 6468 68
63 6259 58
6158
63
45
3833 35
44
37
31
39
33 32 34
28 30
36
50
4144
4146
4348 49 49
41 41
10
9 8
8 7 7 9 11 9 10 11 11
23
46
52
41
3440
52
39
50 5247
5954
45
27
33 31 29
2217
22
2314 15
18
0
10
20
30
40
50
60
70
80
90
100
89 90 91 Pre CelticTiger '92
93 94 95 96 Mid CelticTiger '97
98 00 Post 9/11'02
Sept '08 Jan '09 Apr '09 Set '09 Mar '10 Sept '10 Jan '11 Mar '11 Sept '11 Jan '12 Jul'12 Dec'12 Mar '13 Oct '13 Dec '13 Jul '14 Dec '14 July '15 Oct/Nov'15
Feb '16 Jun '16 Oct '16 Feb '17 Apr '17 Aug '18
Better off Same Worse off
THIS TIME NEXT YEAR?
NET DIFFERENCE +26 +19 +18 +14 +18 +22 +20 +19 +24 +19 +20 +15 +9 -30 -37 -23 -17 -23 -41 -26 -38 -42 -34 -49 -43 -31 -10 -15 -16 -10 -2 +6 0 -3 +13 +21 +17
Base: All Aged 18+ (875)

12
Financial Situation vs. Last Year X Demographics: there are clear demographic
differences, showing that the recovery has been an uneven affair
41%
31%
44%
38%
48%
41%
29%
16%
17%
22%
12%
22%
16%
18%
18%
28%
Base: All Aged 18+ (875) Better off
Worse offGender
Male
Female
Age
18-24
25-34
35-44
45-54
55-64
65+
41%
42%
49%
20%
29%
62%
23%
27%
25%
12%
13%
13%
32%
29%
2%
25%
30%
25%
Social Class
AB
C1
C2
DE
F
Region
Dublin
Leinster
Munster
Conn/Ulster
+24
+9
+32
+16
+32
+23
No
Change
-12
+29
+29
+36
-12
No Change
+60
-2
-3
+3
Net Difference
Net Difference
Vs.Aug2017
3918
3321
3523
5216
4715
3618
2626
1524
Apr ‘17
5111
4517
4816
1827
1425
5418
3518
2321
2623
Apr ‘17

13
Financial Situation vs. Next Year X Demographics: over the next twelve months,
certain cohorts in Irish society (Under 45s and Dubliners) expect to benefit more from the buoyant economy
38%
33%
45%
45%
43%
42%
23%
15%
15%
21%
12%
18%
13%
16%
21%
26%
Base: All Aged 18+ (875) Better off
Worse offGender
Male
Female
Age
18-24
25-34
35-44
45-54
55-64
65+
35%
42%
44%
24%
32%
52%
30%
28%
28%
10%
10%
15%
28%
29%
6%
20%
25%
23%
Social Class
AB
C1
C2
DE
FRegion
Dublin
Leinster
Munster
Conn/Ulster
+23
+12
+33
+27
+30
+26
+12
-11
+25
+32
+29
-4
+3
+46
+10
+3
+5
Net Difference
Net Difference
3814
3416
4415
4710
4510
3320
2719
1619
Apr ‘18
488
4313
4613
2121
1416
5517
3613
2113
2420
Apr ‘18
Vs.Aug2019

14Q. Do you think that the present Economic Situation of the country is likely to improve, remain the
same or get worse over the next 12 months
How will the Economic Situation fare over the next twelve months? Three in ten believe the economic
situation will improve more over the next twelve months – significantly down compared to last year, but arguably a more
pragmatic viewpointBase: All Aged 18+ (875)
30%
6%17%
46%
Improve(38%)
Don’t know(6%)
Higher Among %
ABs 46
18-24 36
45-54 year olds 34
Munster 37
Higher Among %
Males 50
35-44 57
C2s 56
Dublin 64
Higher Among %
65+ 28
DEs 27
Farming Community 25
Conn/Ulster 25
Leinster 25
Get worse(19%)
Remainthe same
(37%)
( ) = April 2017 Results

15Q. And do you think that the present economic situation of the country is likely to IMPROVE,
REMAIN THE SAME or GET WORSE over the NEXT 12 MONTHS?
Economic Situation: Negativity towards the future is at a 20 year low
Base: All Aged 18+ (875)
30
46
17
0
20
40
60
80
100
1989 1990 1991 1992 1993 1994 1995 1996 1997 1998 2000 2002 Jan '09 Apr '09 Sept '09 Mar '10 Sept '10 Jan '11 Mar '11 Sept '11 Jan '12 Jul'12 Apr '17 Aug '18
Improve Same Get Worse
+33 +6 -12 -27 +4 +10 +19 +14 +33 +10 +1 24 -73 -56 -32 -21 -35 -42 -21 -37 -53 -32 +19 +13Net
Difference
Height ofCeltic Tiger
BankingCrash
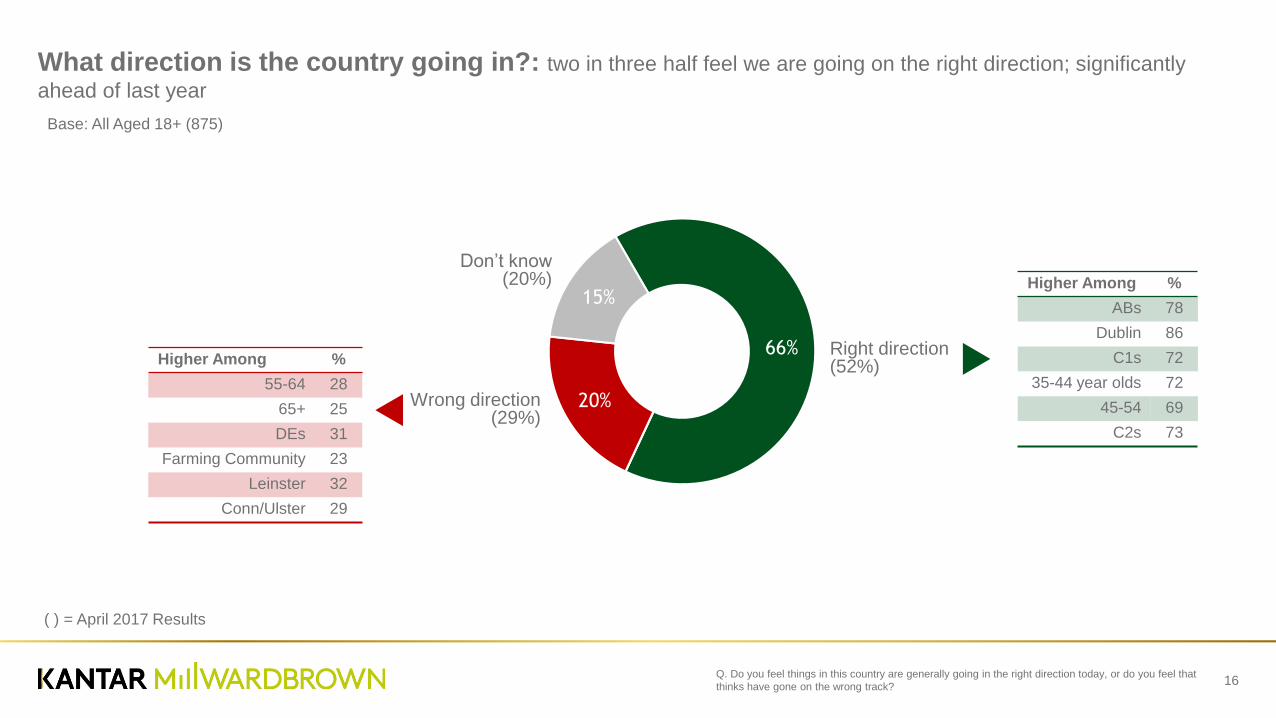
16Q. Do you feel things in this country are generally going in the right direction today, or do you feel that
thinks have gone on the wrong track?
What direction is the country going in?: two in three half feel we are going on the right direction; significantly
ahead of last year
Base: All Aged 18+ (875)
66%
20%
15%
Right direction(52%)
Don’t know(20%) Higher Among %
ABs 78
Dublin 86
C1s 72
35-44 year olds 72
45-54 69
C2s 73
Higher Among %
55-64 28
65+ 25
DEs 31
Farming Community 23
Leinster 32
Conn/Ulster 29
Wrong direction(29%)
( ) = April 2017 Results

17Q. Do you feel things in this country are generally going in the right direction today, or do you feel that
things have gone on the wrong track?
Where do we think the country is going? A focus on how our fears: how times have changed. Just one
in five believe we are on the wrong track – down from a record high of 84%
Base: All Aged 18+ (875)
66% now say that as a country are on the RIGHT TRACK
37%
34%
84%
74%
39%
55%
29%20%
0
20
40
60
80
100
2002 2005 Jan '09 Apr '09 Sept '09 Mar '10 Sept '10 Jan '11 Mar '11 Sept '11 Dec '11 Jul '12 Apr '17 Aug '18

18Q. Which ONE of the following words best describes your own personal mood about living in Ireland
nowadays?
Personal Mood 2018 versus 2017 – we are hugely more positive than were five years ago; over
three in four express upbeat sentiments
26% 23% 8% 10% 9%OptimisticHappy CalmRelaxedCheerful
PessimisticUnhappy AngryAnxiousDepressed
3% 5% 3% 11% 2%
(30%)
(3%)
(20%)
(6%)
(9%)
(4%)
(11%)
(8%)
(7%)
(3%)
25%
Negative
()=April 2017 Results
76%
Positive
(77%)
(24%)

41111511/PM
So where are we going?

A focus on Value for Money
and Perceived Service
Levels Received

21
Which sectors offer better value for money? Retail is generally holding steady, but hospitality continues to slip
back further into the bad old times – consumers feel they are getting less bang for their buck
1117
2931
1019
2522
1523
3335
1932
2931
263728
3137
504844
6343
2121
6042
3034
5034
2322
4329
2729
4234
3733
161012
15
Better value for money
%
Worse value for money
%
The same value for money
%
Grocery Shopping
Clothes Shopping
Alcohol bought to drinkat home/someone else’s home
Alcohol bought inPubs/clubs etc
Hotel Accommodation
Eating out in restaurants
Don’t Know%
16
25
29
32
18
25
30
34
28
34
33
36
35
34
37
36
29
24
28
32
33
27
26
29
Base: All Aged 18+ (875)
Q. In general, in which of these sectors do you think you are getting better or worse
value for money than you did five years ago?
May 2012
Oct 2013
April 2017
August 201810
15
21
16
12
14
15
10
7
9
11
6
4
5
6
4
3
5
7
5
14
14
15
12

22
The level of service experienced: Levels of service are holding relatively steady across most retail and hospitality
sectors
Grocery retail outlets shops
Clothes retail outlets shops
Pubs/clubs
Hotels
Restaurants
Q. And in general, in which of these sectors do you think you are getting better or worse
service than you did five years ago?
8
15
9
11
11
14
9
11
13
17
10
9
12
19
10
8
14
18
9
12
44
33
27
30
38
32
30
32
33
26
36
33
31
26
30
32
21
17
23
26
Better Service%
Worse Service%
The same level of Service
%
Don’t Know%
38
40
49
49
45
47
51
52
52
53
49
56
52
51
54
57
51
53
53
54
Base: All Aged 18+ (875) May 2012
Oct 2013
April 2017
August 201810
12
15
9
6
7
9
5
2
3
5
2
4
3
6
3
14
12
14
9

How our Discretionary
Spending behaviour is
changing

24Q. Which ONE of these statements BEST describes your behaviour regarding the purchase of smaller
treat items such as take-away coffees, lottery tickets, confectionery, magazines, cosmetics etc.?
Discretionary Spending compared to the two years ago – just over half are holding their discretionary
spending steady – one in seven are spending more
Base: All Aged 18+ (875)
Higher Among %
18-24 59
65+ year olds 59
Dublin Residents 57
Farming Community 60
“Which ONE of these statements BEST describes your behaviour regarding the purchase of smaller treat items such as take-away
coffees, lottery tickets, confectionery, magazines, cosmetics etc?”
%
JULY2012
%
APR2017
%
AUG2018
719
14
30
44 52
62
2829
29 5
More
No change
Less
Don’t know
Higher Among %
18-24 year olds 19
25-34 year olds 20
35-44 year olds 18
ABs 24
Leinster Residents 19
Higher Among %
Females 32
55-64 38
DEs 33
Dublin 57

25
Projected Spending over the next twelve months (I): Again there is evidence that many are adopting a
cautious approach to the future, and are consolidating what they have
ForeignHolidays
49
15 14
50
1611
37
12 9
56
19 17
39
14 12
58
19 17
55
20 18
40
5973
40
59 70
49
66 70
36
5968
53
6665
39
6361
39
60 68
7
19
10 5
1714
1216 16
4
1510
5
14 19
2
14 19
3
139
5 6 4 5 7 6 2 5 4 4 7 4 3 6 4 1 5 3 3 6 5
House decorations/renovations
WeeklyGrocery shopping
Clothesshopping
Savings orInvestmentaccounts
Entertainingat home
Weekendbreaks in
Ireland
Q. Over the next 12 months do you think you will reduce, increase or not change the amount you
spend on each of the following?
Base: All aged 18+ (n=875)
Will reduce
Will not change
Will increase
Don’t know
Apr ’17%
Jul ’12%
Apr ’18%
Apr ’17%
Jul ’12%
Apr ’18%
Apr ’17%
Jul ’12%
Apr ’18%
Apr ’17%
Jul ’12%
Apr ’18%
Apr ’17%
Jul ’12%
Apr ’18%
Apr ’17%
Jul ’12%
Apr ’18%
Apr ’17%
Jul ’12%
Apr ’18%

26
Going to restaurants
Mobiletelephone
bills
Impulse purchase of sweets and
soft drinksGoing to
pubs Alcohol
Q. Over the next 12 months do you think you will reduce, increase or not change the amount you
spend on each of the following?
Projected Spending over the next twelve months (II): Impulse purchases also see signs of this cautious approach.
We are not intending to become too flaithúlach
57
21 19
44
15 17
57
32 25
55
24 22
45
2519
39
62 66
52
71 68
39
55 62
39
63 66
47
6470
2
1213
3
9 12
2
169
17 8
24 7
2 6 3 27 3 2 5 4 5 6 4 3 7 5
Will reduce
Will not change
Will increaseDon’t know
Apr ’17%
Jul ’12%
Apr ’18%
Apr ’17%
Jul ’12%
Apr ’18%
Apr ’17%
Jul ’12%
Apr ’18%
Apr ’17%
Jul ’12%
Apr ’18%
Apr ’17%
Jul ’12%
Apr ’18%
Base: All aged 18+ (n=875)

Thank you…
For Further details contact
Kantar Millward Brown | 6 Ely Place, Dublin 2 | T. +353 (1) 297 4500
Paul [email protected]
087 286 0773